1. Introduction
Transparent conductive materials are essential components of advanced optical and electronic devices [
1,
2,
3,
4,
5,
6,
7,
8,
9,
10]. Fluorine- or indium-doped tin oxide films are the most commonly used transparent conducting materials, but they have low flexibility and are brittle [
11,
12,
13,
14]. Noble metal nanoparticles (NPs) have attracted attention as alternative materials. For example, flexible transparent conductive films have been fabricated by arranging NPs in grid-like patterns on appropriate substrates [
3,
4,
15,
16,
17,
18]. However, post-processing surfaces of NPs is essential to removing insulating organic compounds to make the grids conductive [
4,
17,
18,
19,
20]. Despite the requirement for post-processing, this method remains appealing for fabricating transparent conductive films due to the availability of various synthesis protocols for desired sizes of metal NPs.
In previous papers, we have demonstrated that UV irradiation of non-conductive AuNP monolayers at the air-water interface can be converted into flexible, transparent, conductive Au nanosheets [
21,
22]. In this process, the key to conversion by UV irradiation is photodecomposition of capping molecules covering AuNPs to form an unstable, bare Au surface, and aggregation and fusion phenomena at those surfaces. Here, fusion of AuNPs depends on their size. Small particles fuse easily, but the fusion process is less likely to proceed with larger particles. Actually, in a previous study we demonstrated that UV irradiation of monolayers of AuNPs with 30 nm in diameter created connections among them, but they did not fuse sufficiently, resulting in nanosheets that retain the shapes of the particles [
22]. On the other hand, AuNPs with diameters 15 nm or less gave rise to flat nanosheets of uniform thickness, indicating that fusion between AuNPs was sufficient. Accordingly, this UV irradiation technique appears to be inapplicable for larger AuNPs. Nanosheets made from these larger particles exhibit high mechanical strength and conductivity, although their conductivity and mechanical strength is inversely related to their transparency.
To further develop this UV irradiation technique, a strategy is needed to produce nanosheets with various thicknesses and compositions from a single type of metal nanoparticle monolayer. In this study, we propose a UV irradiation technique for preparing thick Au nanosheets from a single type of AuNP by replacing the water subphase with aqueous solutions of HAuCl4. Furthermore, we demonstrate that using AgNO3 and CH3COOAg gives rise to Au-Ag nanosheets with high conductivity and transparency and we show that their morphologies depend on the electrolytes chosen. Au-Ag nanosheets prepared from AgNO3 have homogeneous flat structures, while those from CH3COOAg have the structure of AuNPs embedded in an Ag thin film.
2. Materials and Methods
2.1. Materials
Silver acetate (CH3COOAg), silver nitrate (AgNO3), sodium borohydride (NaBH4), and chloroform were obtained from Kanto Chemical Co., Inc. Gold (III) chloride trihydrate (HAuCl4·3H2O), tetraoctylammonium bromide (TOAB), and dodecanethiol (DDT) were purchased from Nacalai Tesque Inc., Tokyo Chemical Industry Co., Ltd. and Sigma-Aldrich, respectively. All chemicals were used as received, without further purification.
2.2. Preparation of Au nanoparticles (AuNPs)
AuNPs capped with DDT were prepared using a modified Brust-Schiffrin method [
23]. A 0.384 mmol HAuCl
4 aqueous solution (7.91 mL) was added to a 0.362 mmol phase-transfer reagent, TOAB, dissolved in toluene (7.91 mL), and the mixture was stirred for 15 min or until the aqueous phase was clear. The toluene phase, containing phase-transferred gold, was subsequently collected and a 0.066 mmol DDT solution in toluene (1.51 mL) was added. After the solution was stirred for 1 h, a freshly prepared 4.22 mM solution of NaBH
4 in water (2 mL) was quickly added with high stirring to reduce the Au ions. The reaction mixture was vigorously stirred for 12 h to allow formation of AuNPs and the organic phase was isolated. As-prepared AuNPs were then dispersed in DDT (2.54 mL), and the dispersion was refluxed at 80 °C for 22 h. In order to remove excess DDT, AuNPs in DDT were washed thoroughly several times with acetone through centrifugal separation. Purified AuNPs were dispersed in chloroform. AuNPs had a spherical shape and an average diameter of 4.7 ± 0.5 nm.
2.3. Preparation of Au and Au-Ag nanosheets
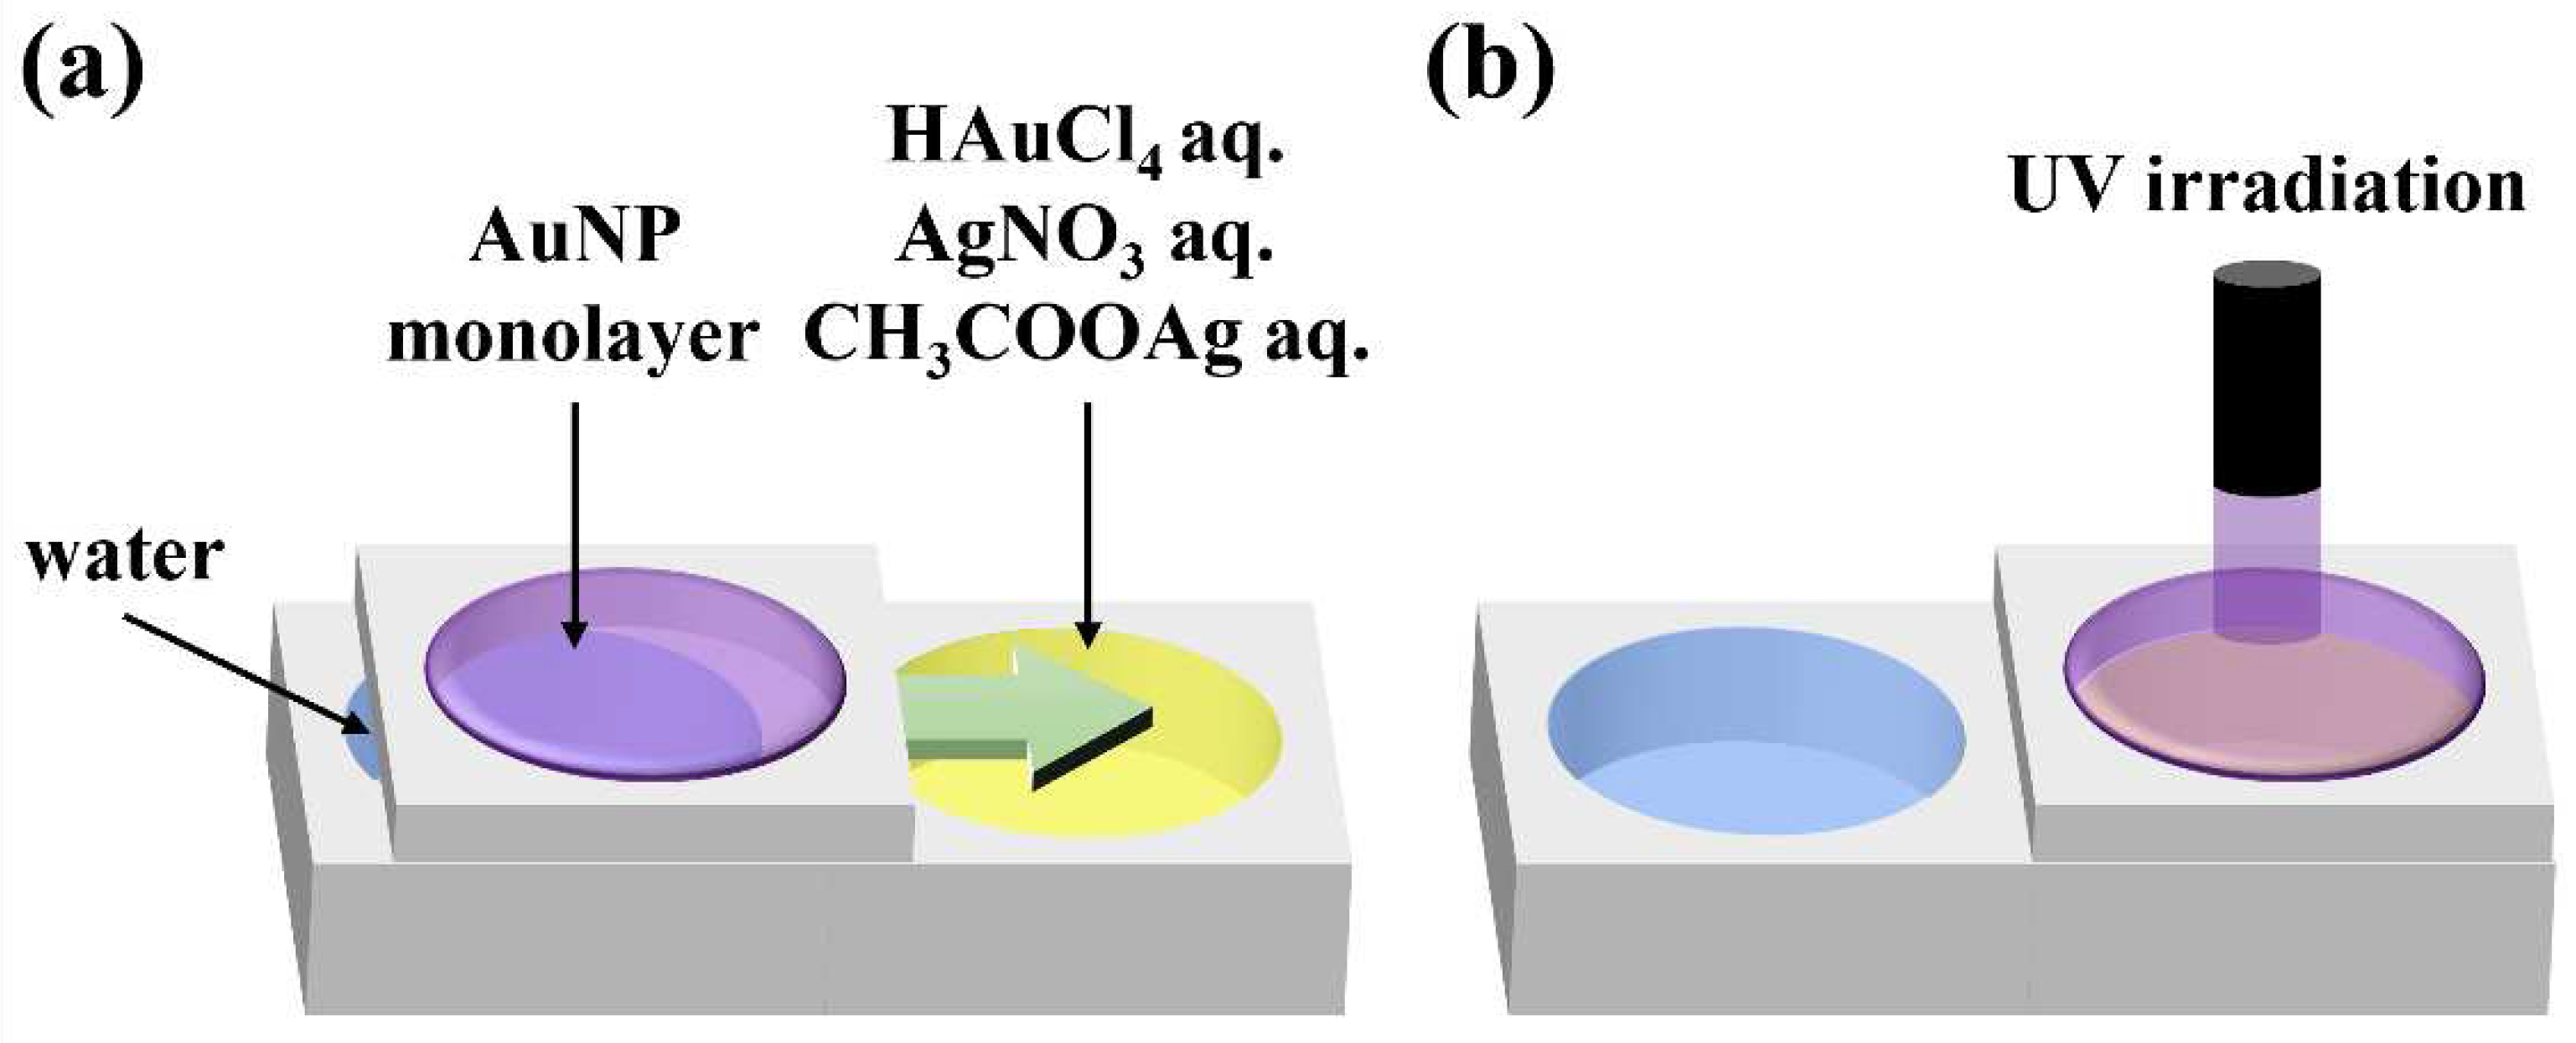
A suspension of purified AuNPs in chloroform was spread on water and compressed using a Teflon barrier until AuNPs were organized into a close-packed structure. The AuNP monolayer was moved onto an aqueous solution of HAuCl
4, AgNO
3 or CH
3COOAg, and the AuNP monolayer was irradiated with UV light through an optical fiber (
Figure 1). Au nanosheets were prepared by UV irradiation of a close-packed AuNP monolayer prepared on water without transferring it to another aqueous solution. UV light from a 250 W mercury lamp (REX-250, Asahi Spectra Co., Ltd.) was passed through a narrow band optical filter to obtain 248-nm UV light. Samples were irradiated with 248-nm UV light at an intensity of ≈60 mW cm
−2.
2.4. Characterization
To characterize Au nanosheets, as-prepared Au or Au-Ag nanosheets on aqueous solutions were transferred from the water surface to various solid substrates using the surface lowering method: (i) copper grids coated with an elastic carbon film for transmission electron microscopy (TEM), (ii) glass slides for scanning electron microscopy (SEM), X-ray diffraction measurements (XRD) and electrical resistivity measurements, (iii) quartz plates for UV-vis analysis, and (iv) quartz crystal chips for quartz crystal microbalance (QCM) measurements.
TEM images were taken using a JEOL JEM-1101 microscope operated at 100 kV. Energy dispersive x-ray spectroscopy (EDS) mapping images and scanning TEM images were captured using a JEOL JEM-2100 microscope operated at 200 kV. SEM images were obtained on a Carl Zeiss JEM-2100 microscope operating at 8 kV. UV-visible spectra were acquired on a JASCO V-780 UV-vis spectrophotometer. X-ray diffraction (XRD) measurements were performed using a diffractometer (Rigaku, Ultima IV). Electrical resistivity of nanosheets deposited on the glass substrates was measured using a four-probe method with a digital multimeter (NF Corporation, DM2561A) and four-point probe (Astellatech, Inc.), where the spacing between adjacent probes was 1 mm.
Masses of Au and Au-Ag nanosheets transferred onto 9 MHz AT-cut chips (SEIKO EG&G, QA-A9M-AU) were monitored using the QCM SYSTEM (SEIKO EG&G, QCM922). Masses of nanosheets were evaluated using the following Sauerbrey equation [
24,
25]:
where is the measured frequency change (Hz), is the fundamental frequency, is the mass change (g), is the electrode area (cm2), is the density of quartz (2.65 g cm-3), and is the shear modulus of quartz (2.95×10¹¹ g cm-1 s-2).
3. Results
3.1. Preparation of thick Au nanosheets
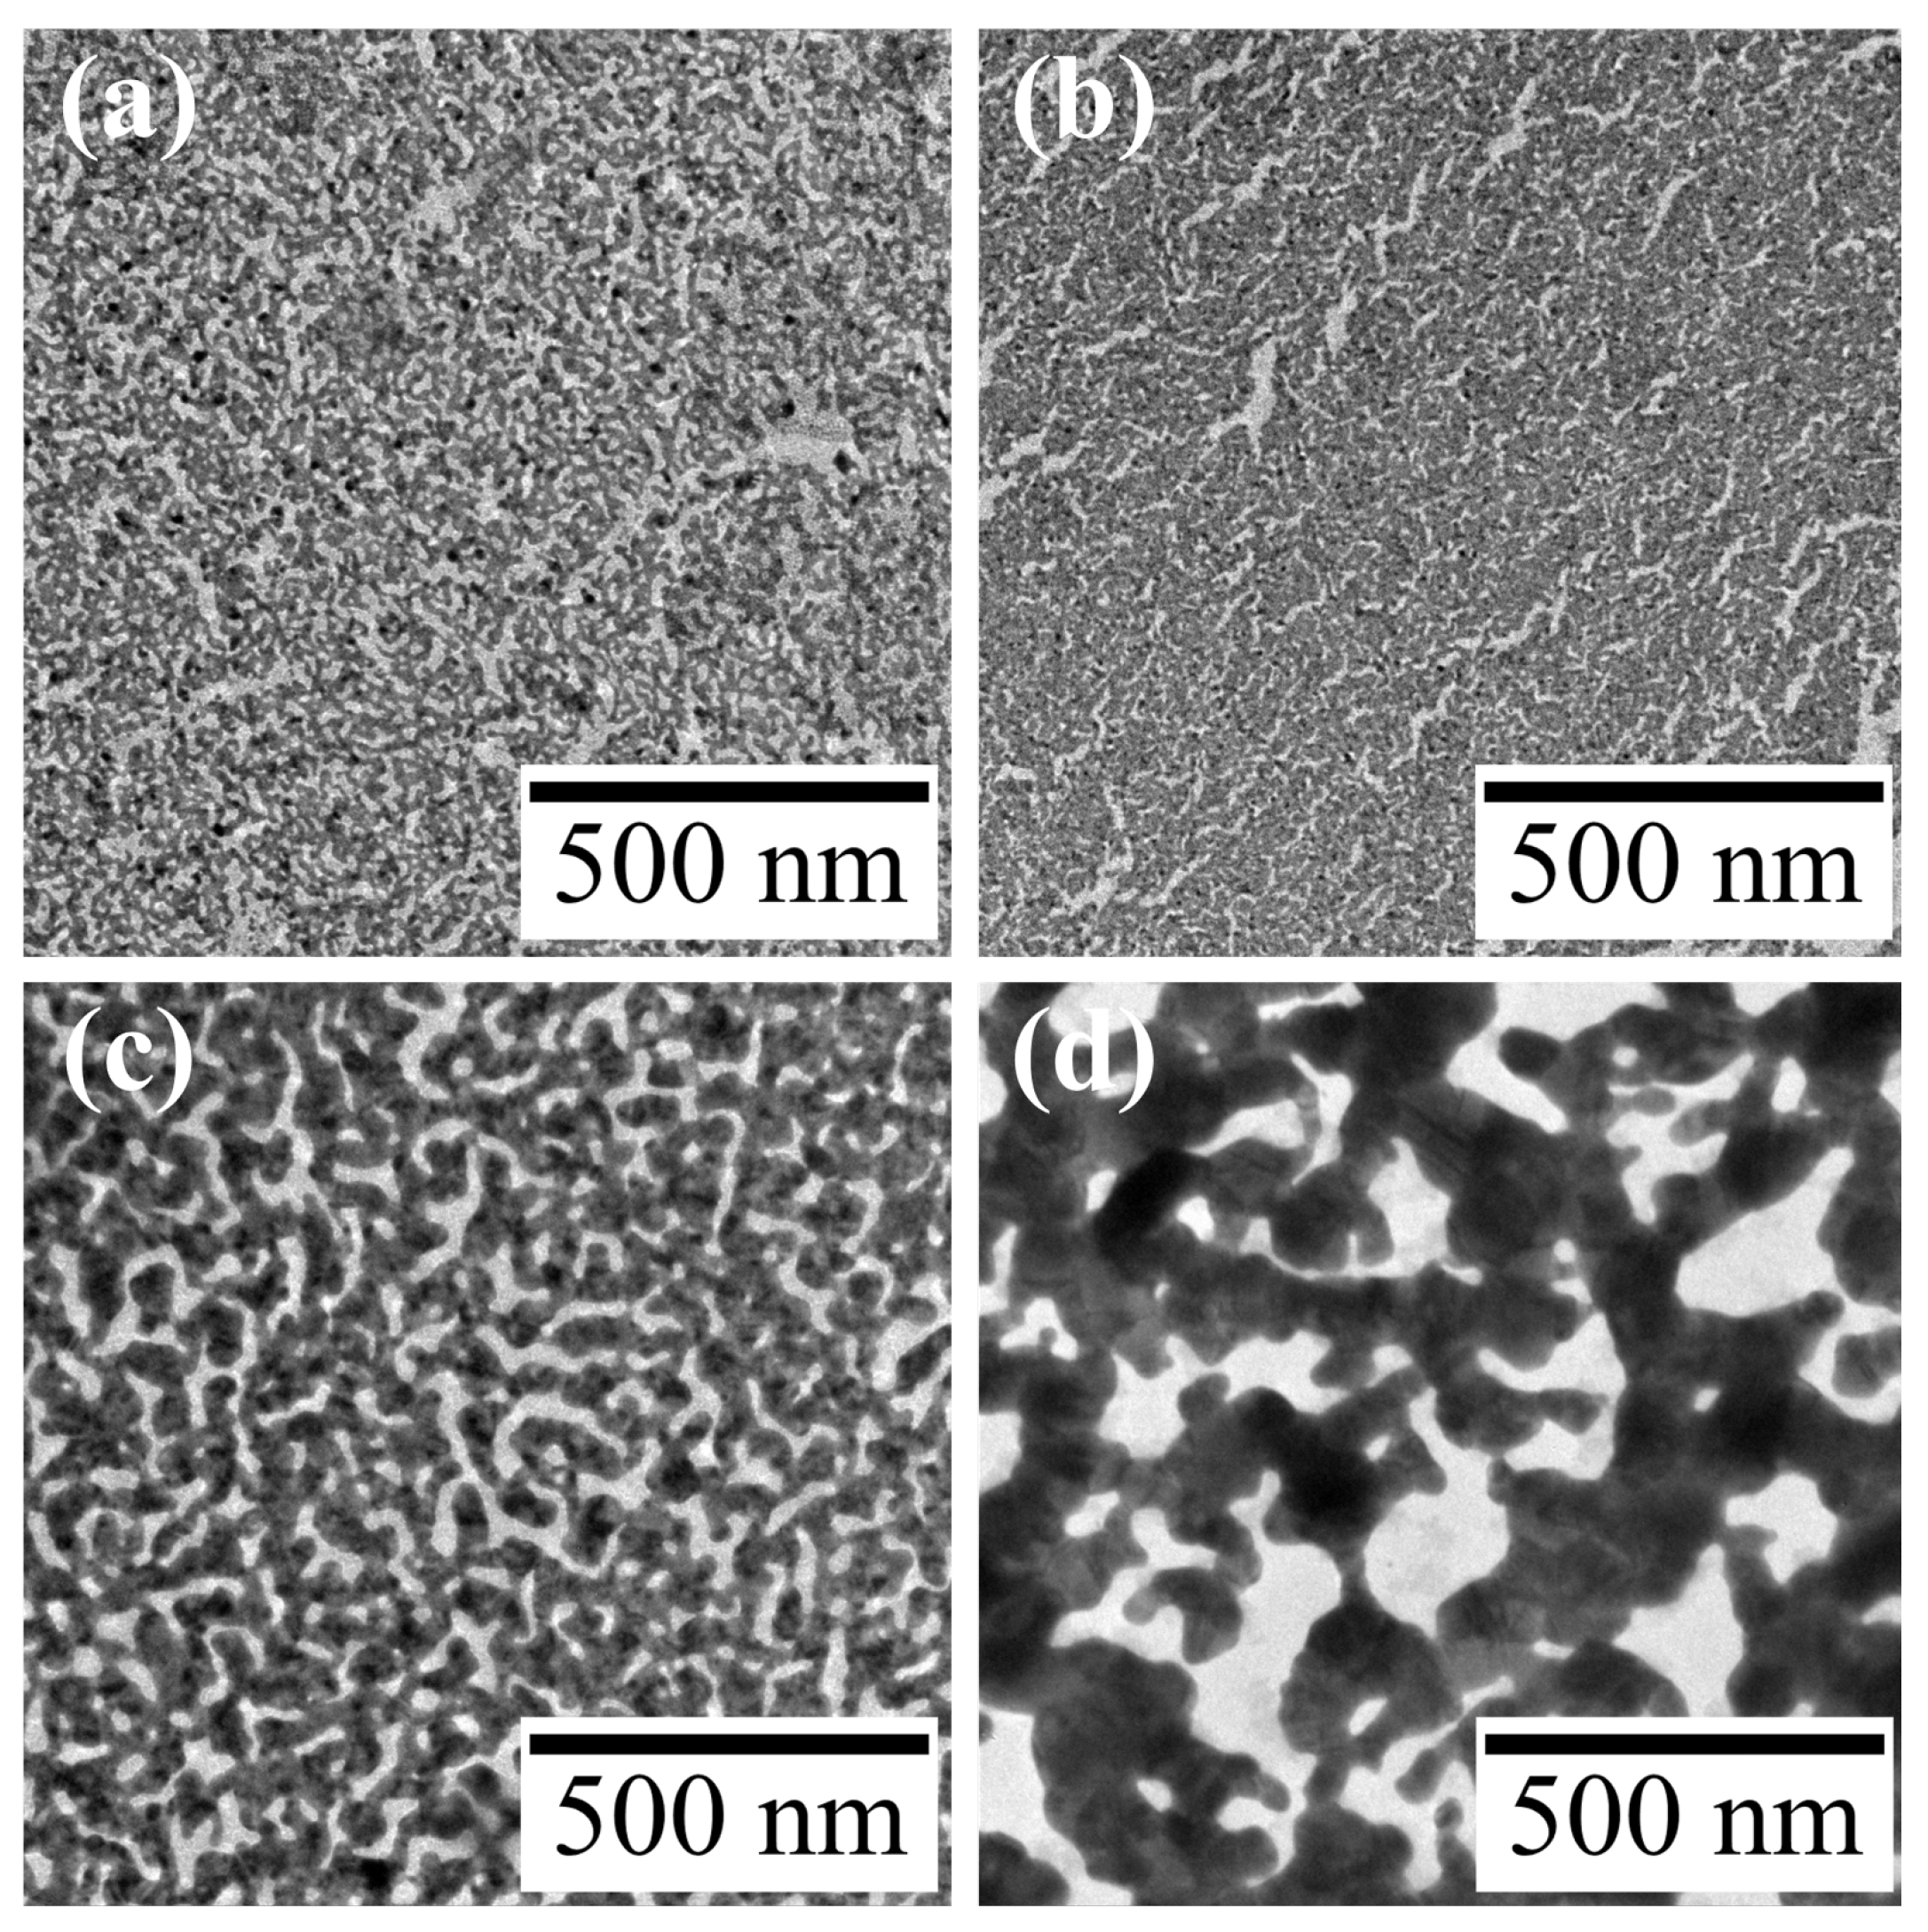
AuNP monolayers were prepared by spreading a chloroform dispersion of DDT-capped AuNPs (4.7 ± 0.5 nm) on water, and the monolayer was irradiated with UV light for 60 min. AuNPs in the monolayer were transformed into a mesh-like Au nanosheet (
Figure 2a), as reported previously [
21]. To investigate effects of metal species in water on formation of Au nanosheets, after preparing an AuNP monolayer on water, the monolayer was moved onto an aqueous HAuCl
4 solution and then the monolayer was irradiated with UV light.
Figures 2b-d show TEM images of resultant Au nanosheets prepared on 4.8, 48 and 480 µM aqueous HAuCl
4 solutions. All AuNP monolayers were transformed into mesh-like Au nanosheets upon UV irradiation. However, the mesh size varied significantly with the concentration of HAuCl
4. The width of the mesh prepared on water was 9.5 ± 2.8 nm, whereas those on 48 and 480 µM HAuCl
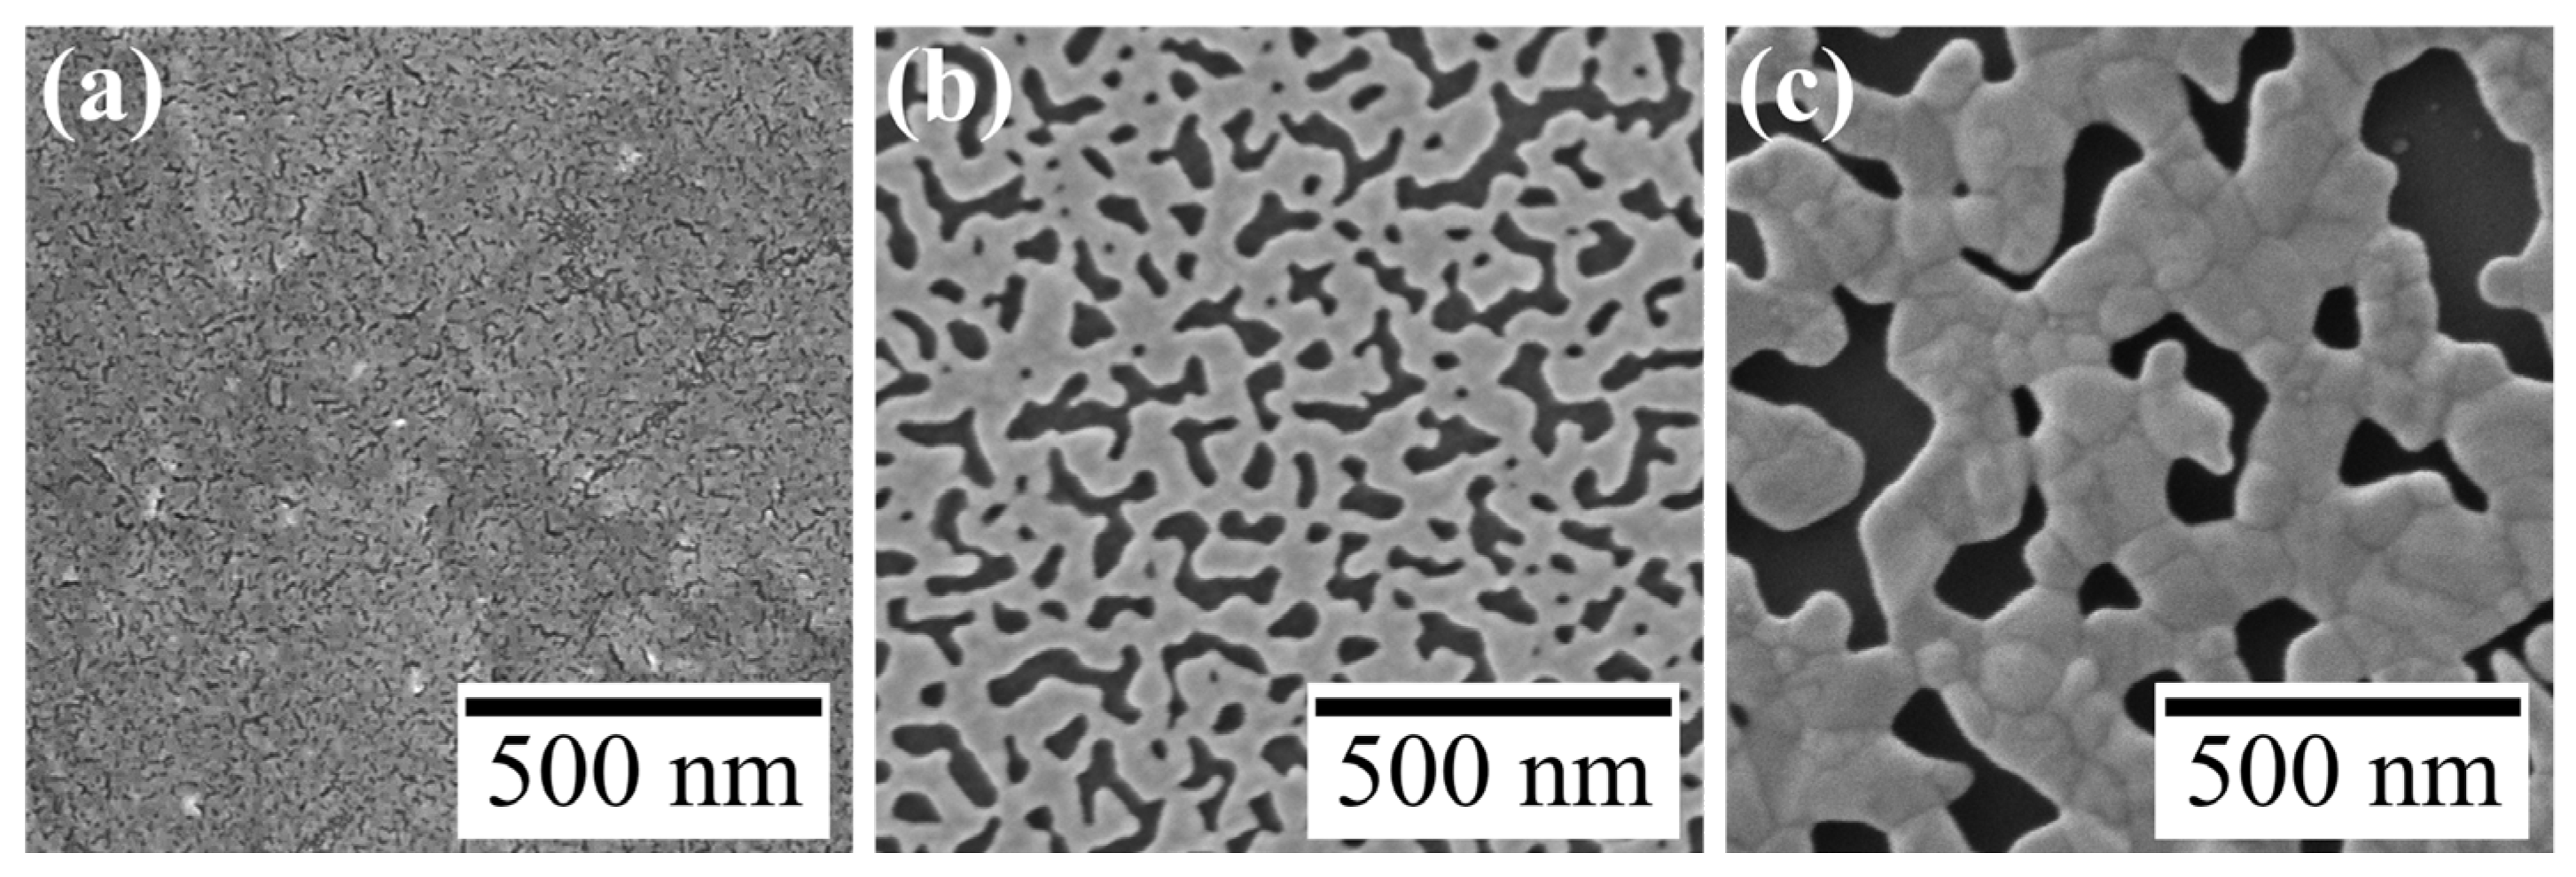
4 solutions were 25.8 ± 7.8 and 81.9 ± 29.5 nm, respectively. This increase in mesh size was also apparent in SEM images (
Figure 3).
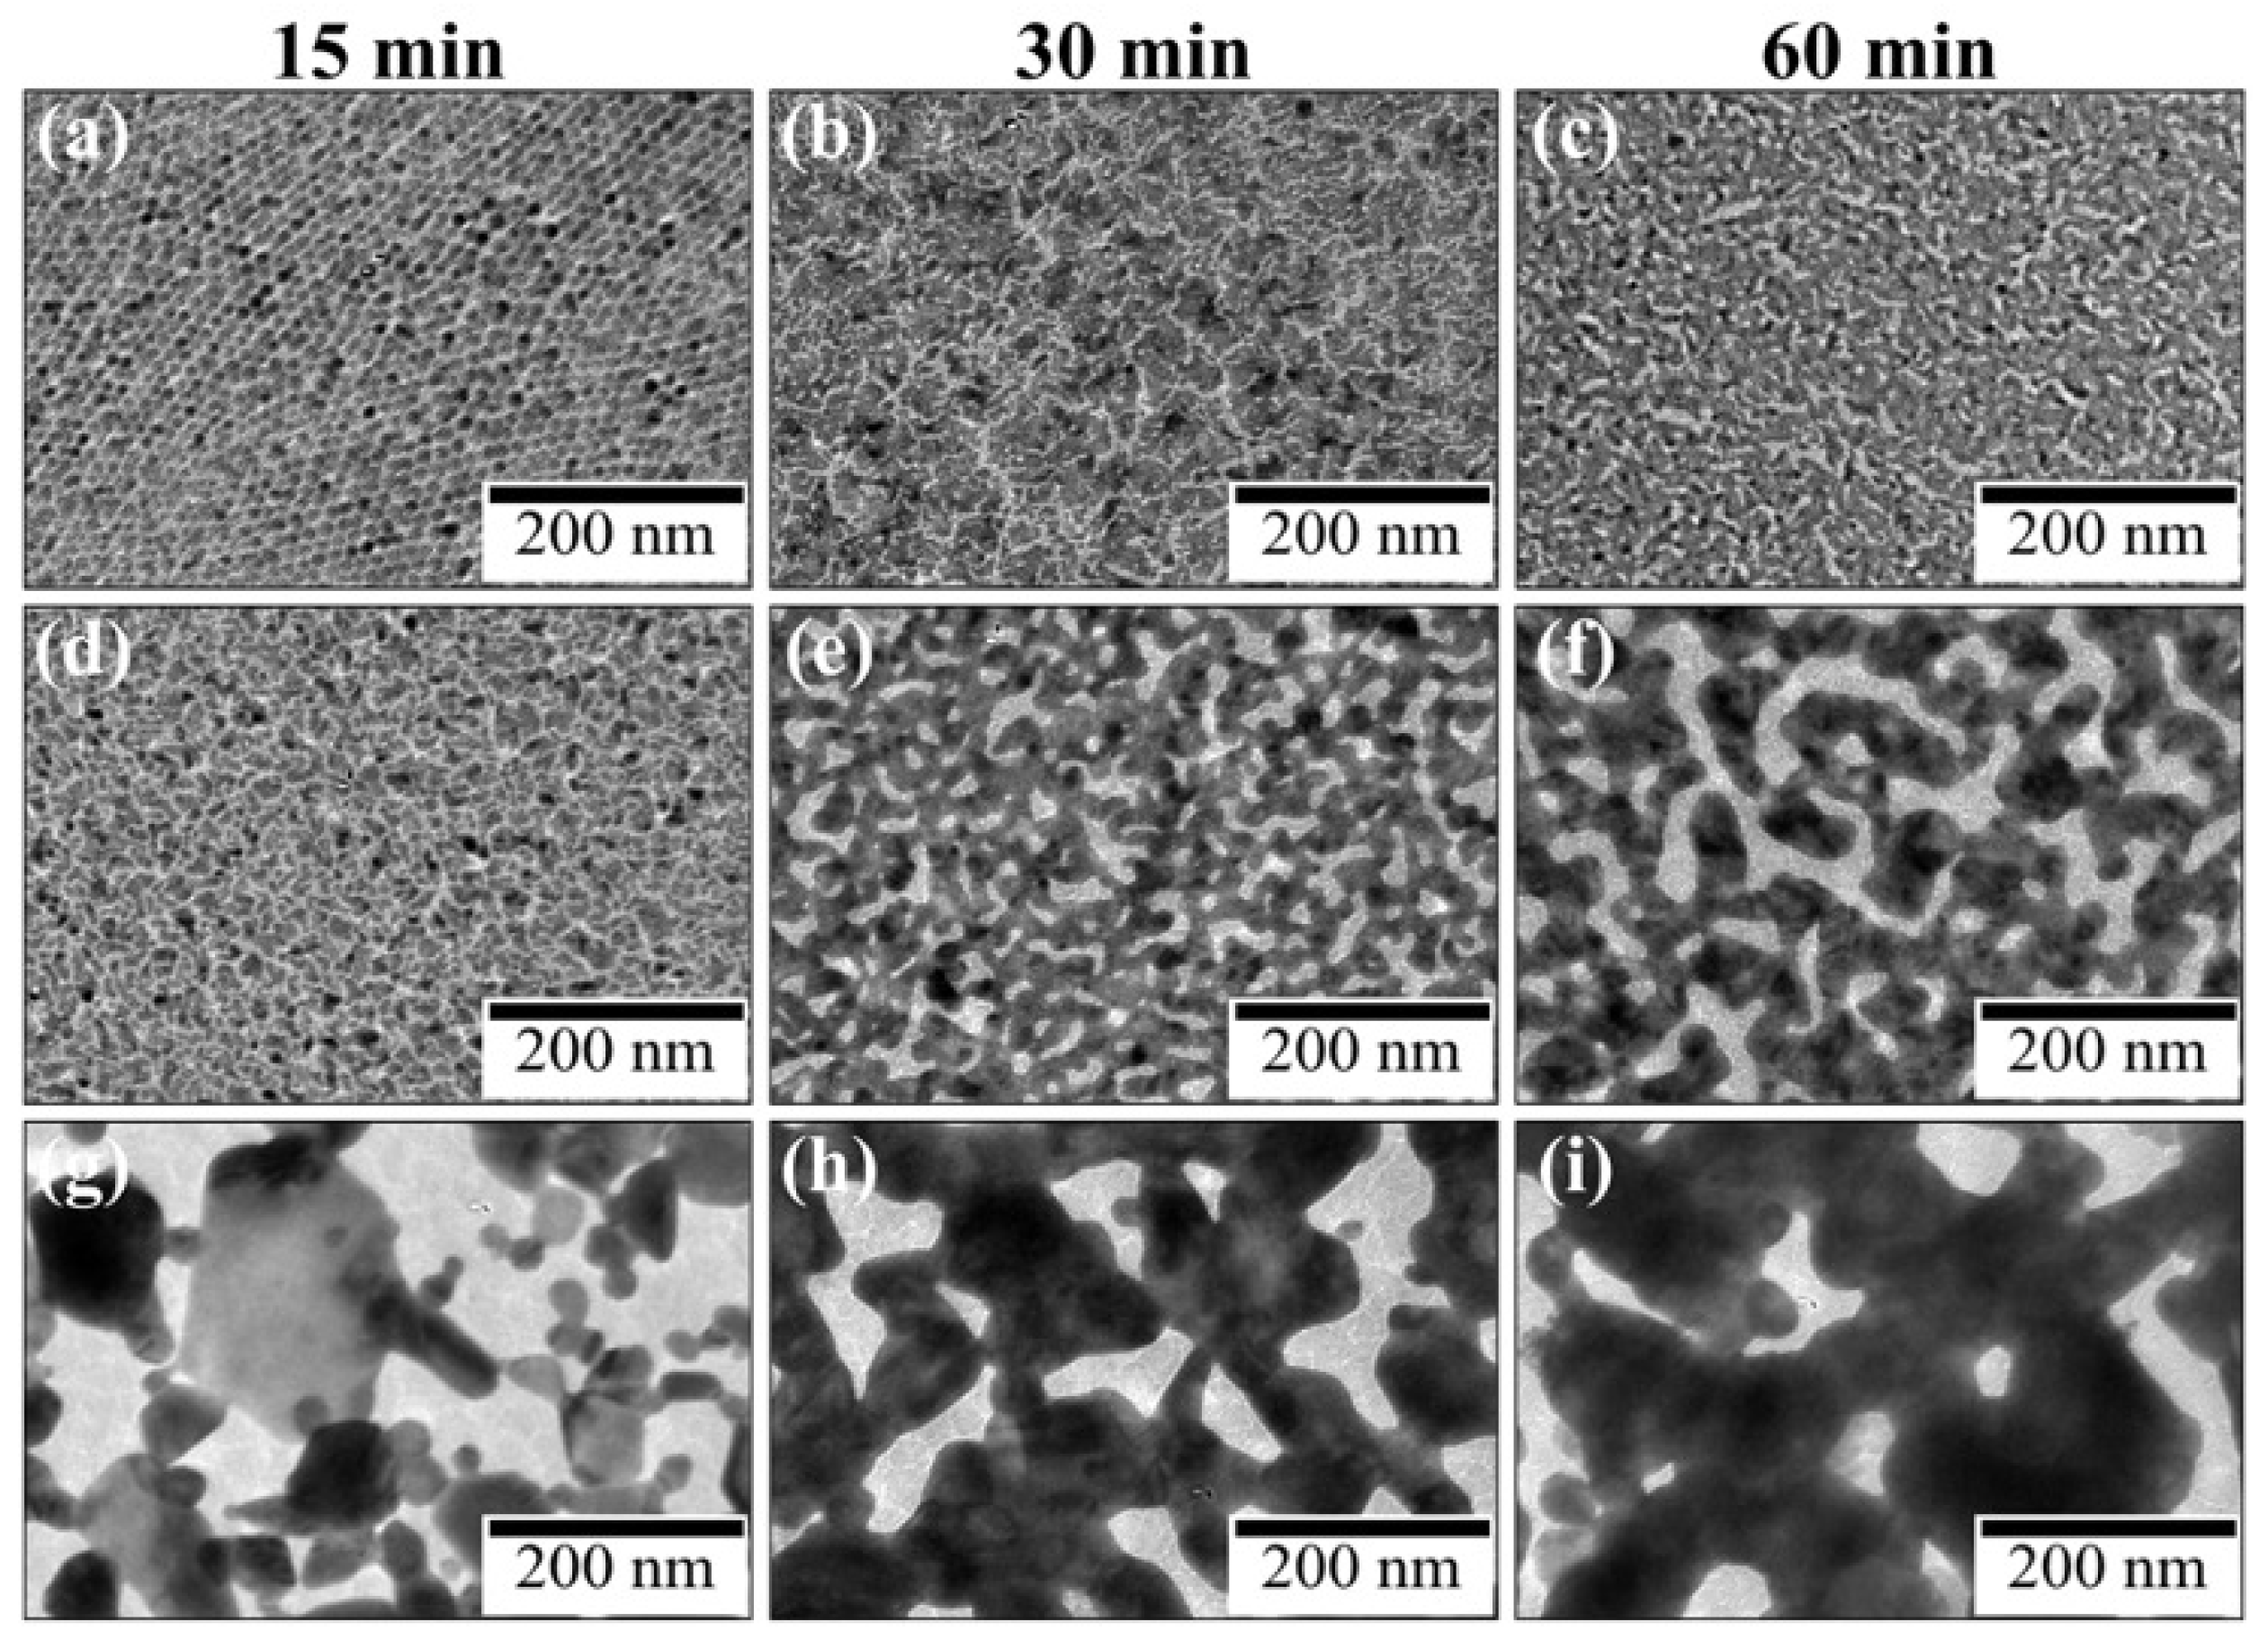
Figure 4 shows TEM images of UV irradiated AuNP monolayers on water and aqueous HAuCl
4 solutions as a function of time. After 15 min of UV irradiation, AuNPs on water remained almost unchanged, but those on HAuCl
4 solutions transformed completely into larger aggregates. In particular, on 480-µM HAuCl
4 solution, the morphological change of AuNPs was remarkable. Hence, HAuCl
4 promotes morphological transformation of AuNPs to nanosheets.
To characterize Au nanosheets, XRD, electrical resistance and transmittance in the visible region were measured.
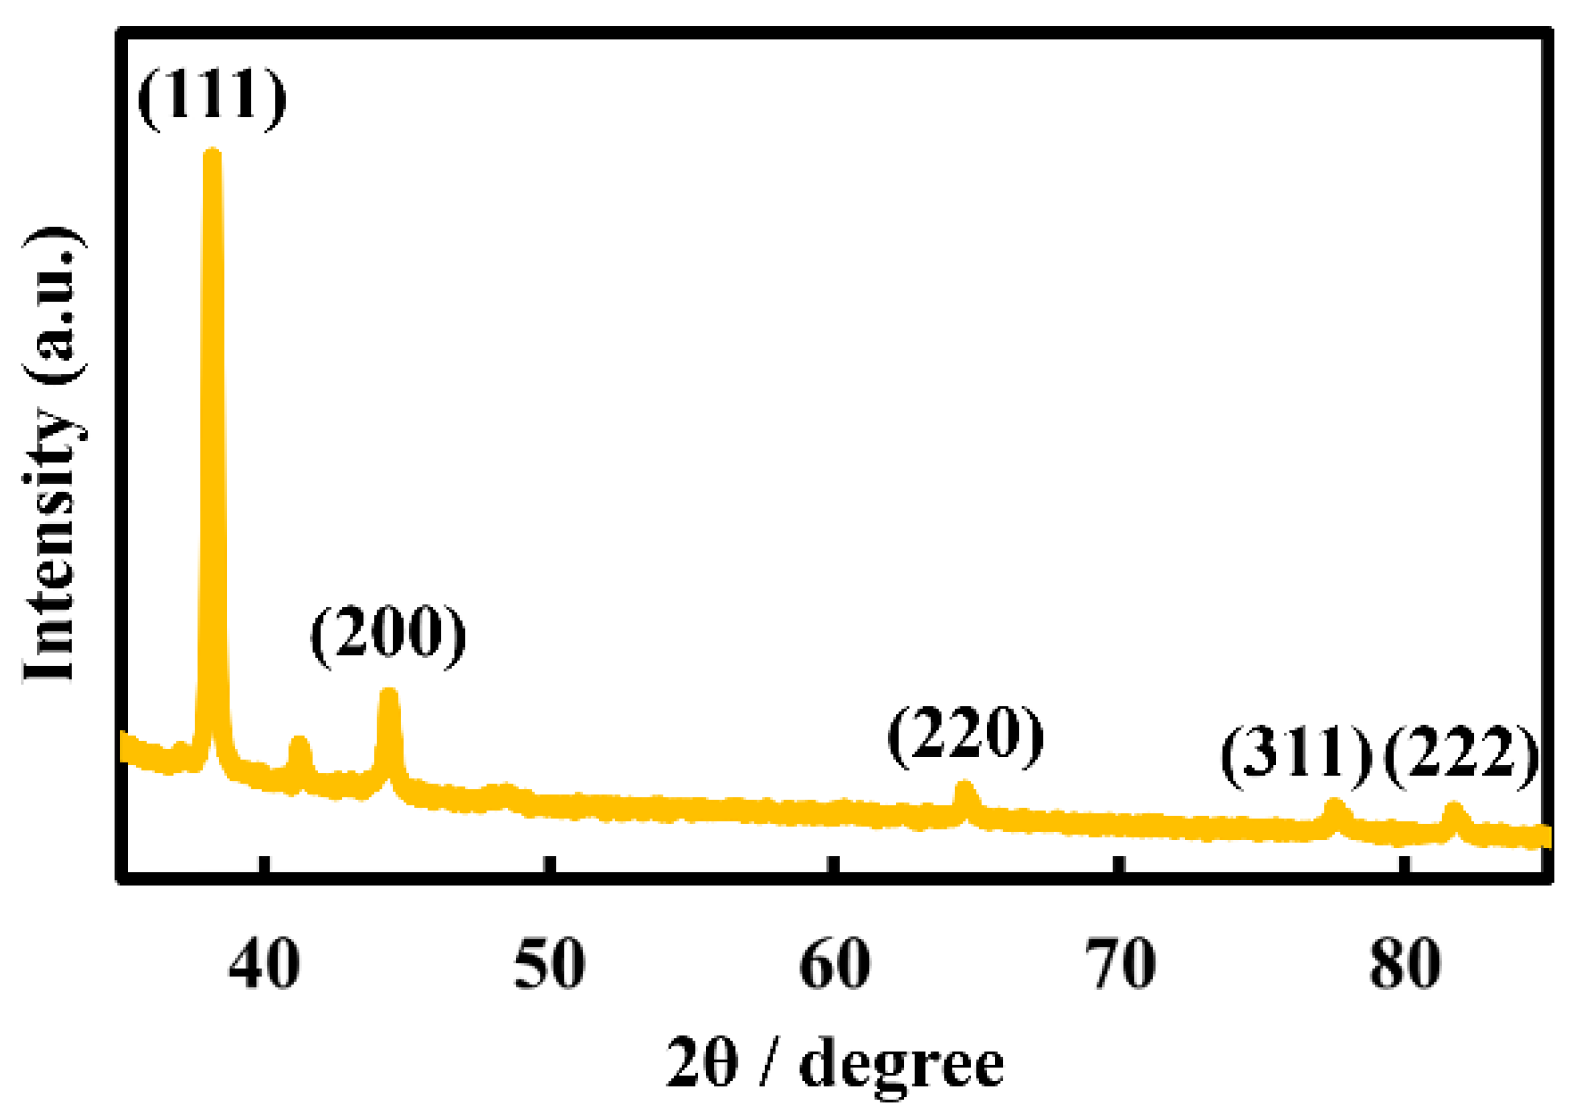
Figure 5 shows the XRD pattern of a nanosheet prepared on a 480-µM HAuCl
4 solution. The nanosheet was confirmed as crystalline gold, based on reflection peaks at 38.2°, 44.3°, 64.5°, 77.5° and 81.7°, which were assigned to the (111), (200), (220), (311) and (222) crystal facets of Au, respectively, with a face-centered cubic structure [
26,
27]. Electrical resistances of Au nanosheets prepared on water, 48 µM and 480 µM HAuCl
4 solutions were 2600 Ω/sq, 6.5 Ω/sq and 4.1 Ω/sq, respectively. Electrical resistances of Au nanosheets prepared on HAuCl
4 solutions were considerably smaller, which can be explained by the increase in film thickness, as evaluated by QCM measurements. Hence, we demonstrated that Au nanosheets with high electrical conductivity can be prepared using a single type of AuNP, avoiding the necessity of synthesizing new AuNPs with different diameters.
Electrical resistance and transparency are inversely related, and both properties depend strongly on the thickness of Au nanosheets. Thick Au nanosheets possess high electrical conductivity, but low transparency, and vice versa [
28,
29]. Thus, as a natural consequence, Au nanosheets prepared on HAuCl
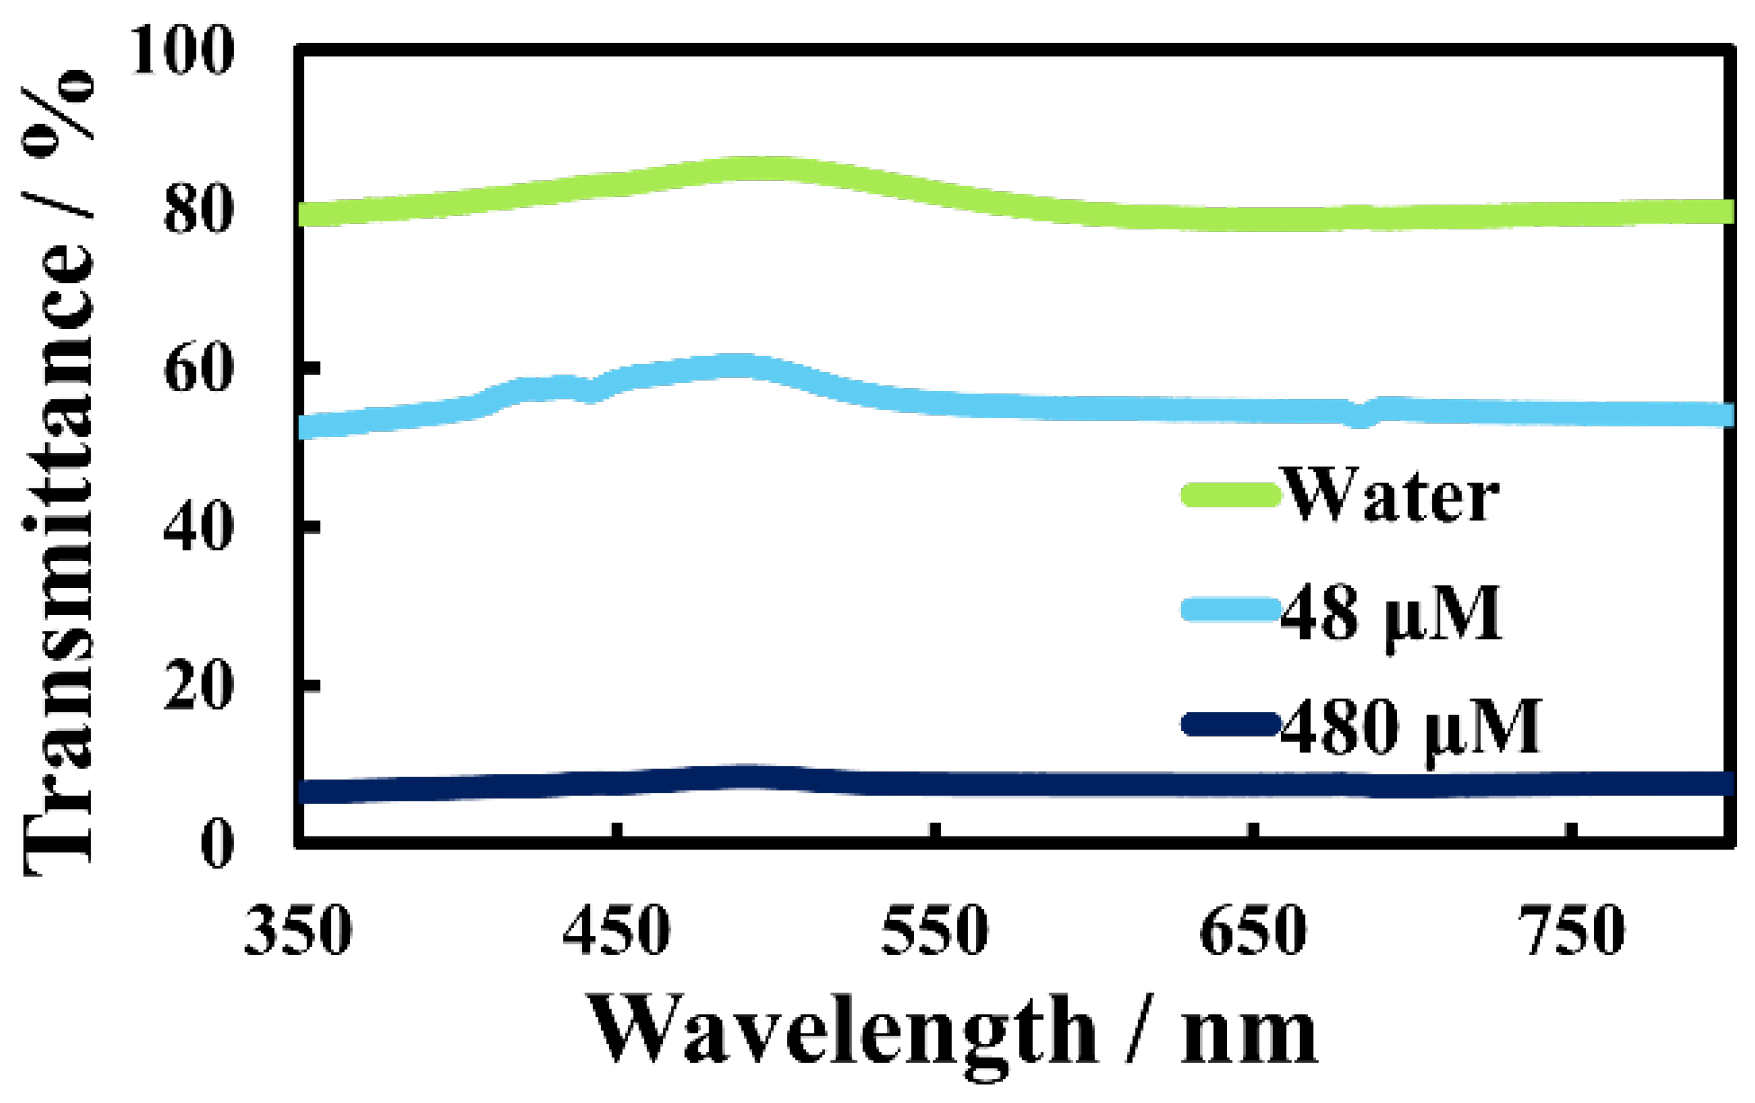
4 solutions are likely to have low transparency in the visible and UV region. Actually, Au nanosheets prepared on 48-µM and 480-µM HAuCl
4 solutions had optical transparencies of 55% and 8%, respectively (
Figure 6), whereas the Au nanosheet prepared on water had a transparency of ~80%.
3.2. Preparation of Au-Ag hybrid nanosheets
3.2.1. Effect of AgNO3 and CH3COOAg
Employing HACl
4 solutions as a subphase was useful to modify Au nanosheets prepared by irradiating AuNP monolayers with UV light. This suggested that other metal ions might also be useful for modifying Au nanosheets. We then attempted to prepare Au-Ag nanosheets by irradiating AuNP monolayers on aqueous AgNO
3 and CH
3COOAg solutions, using the same method as described above.
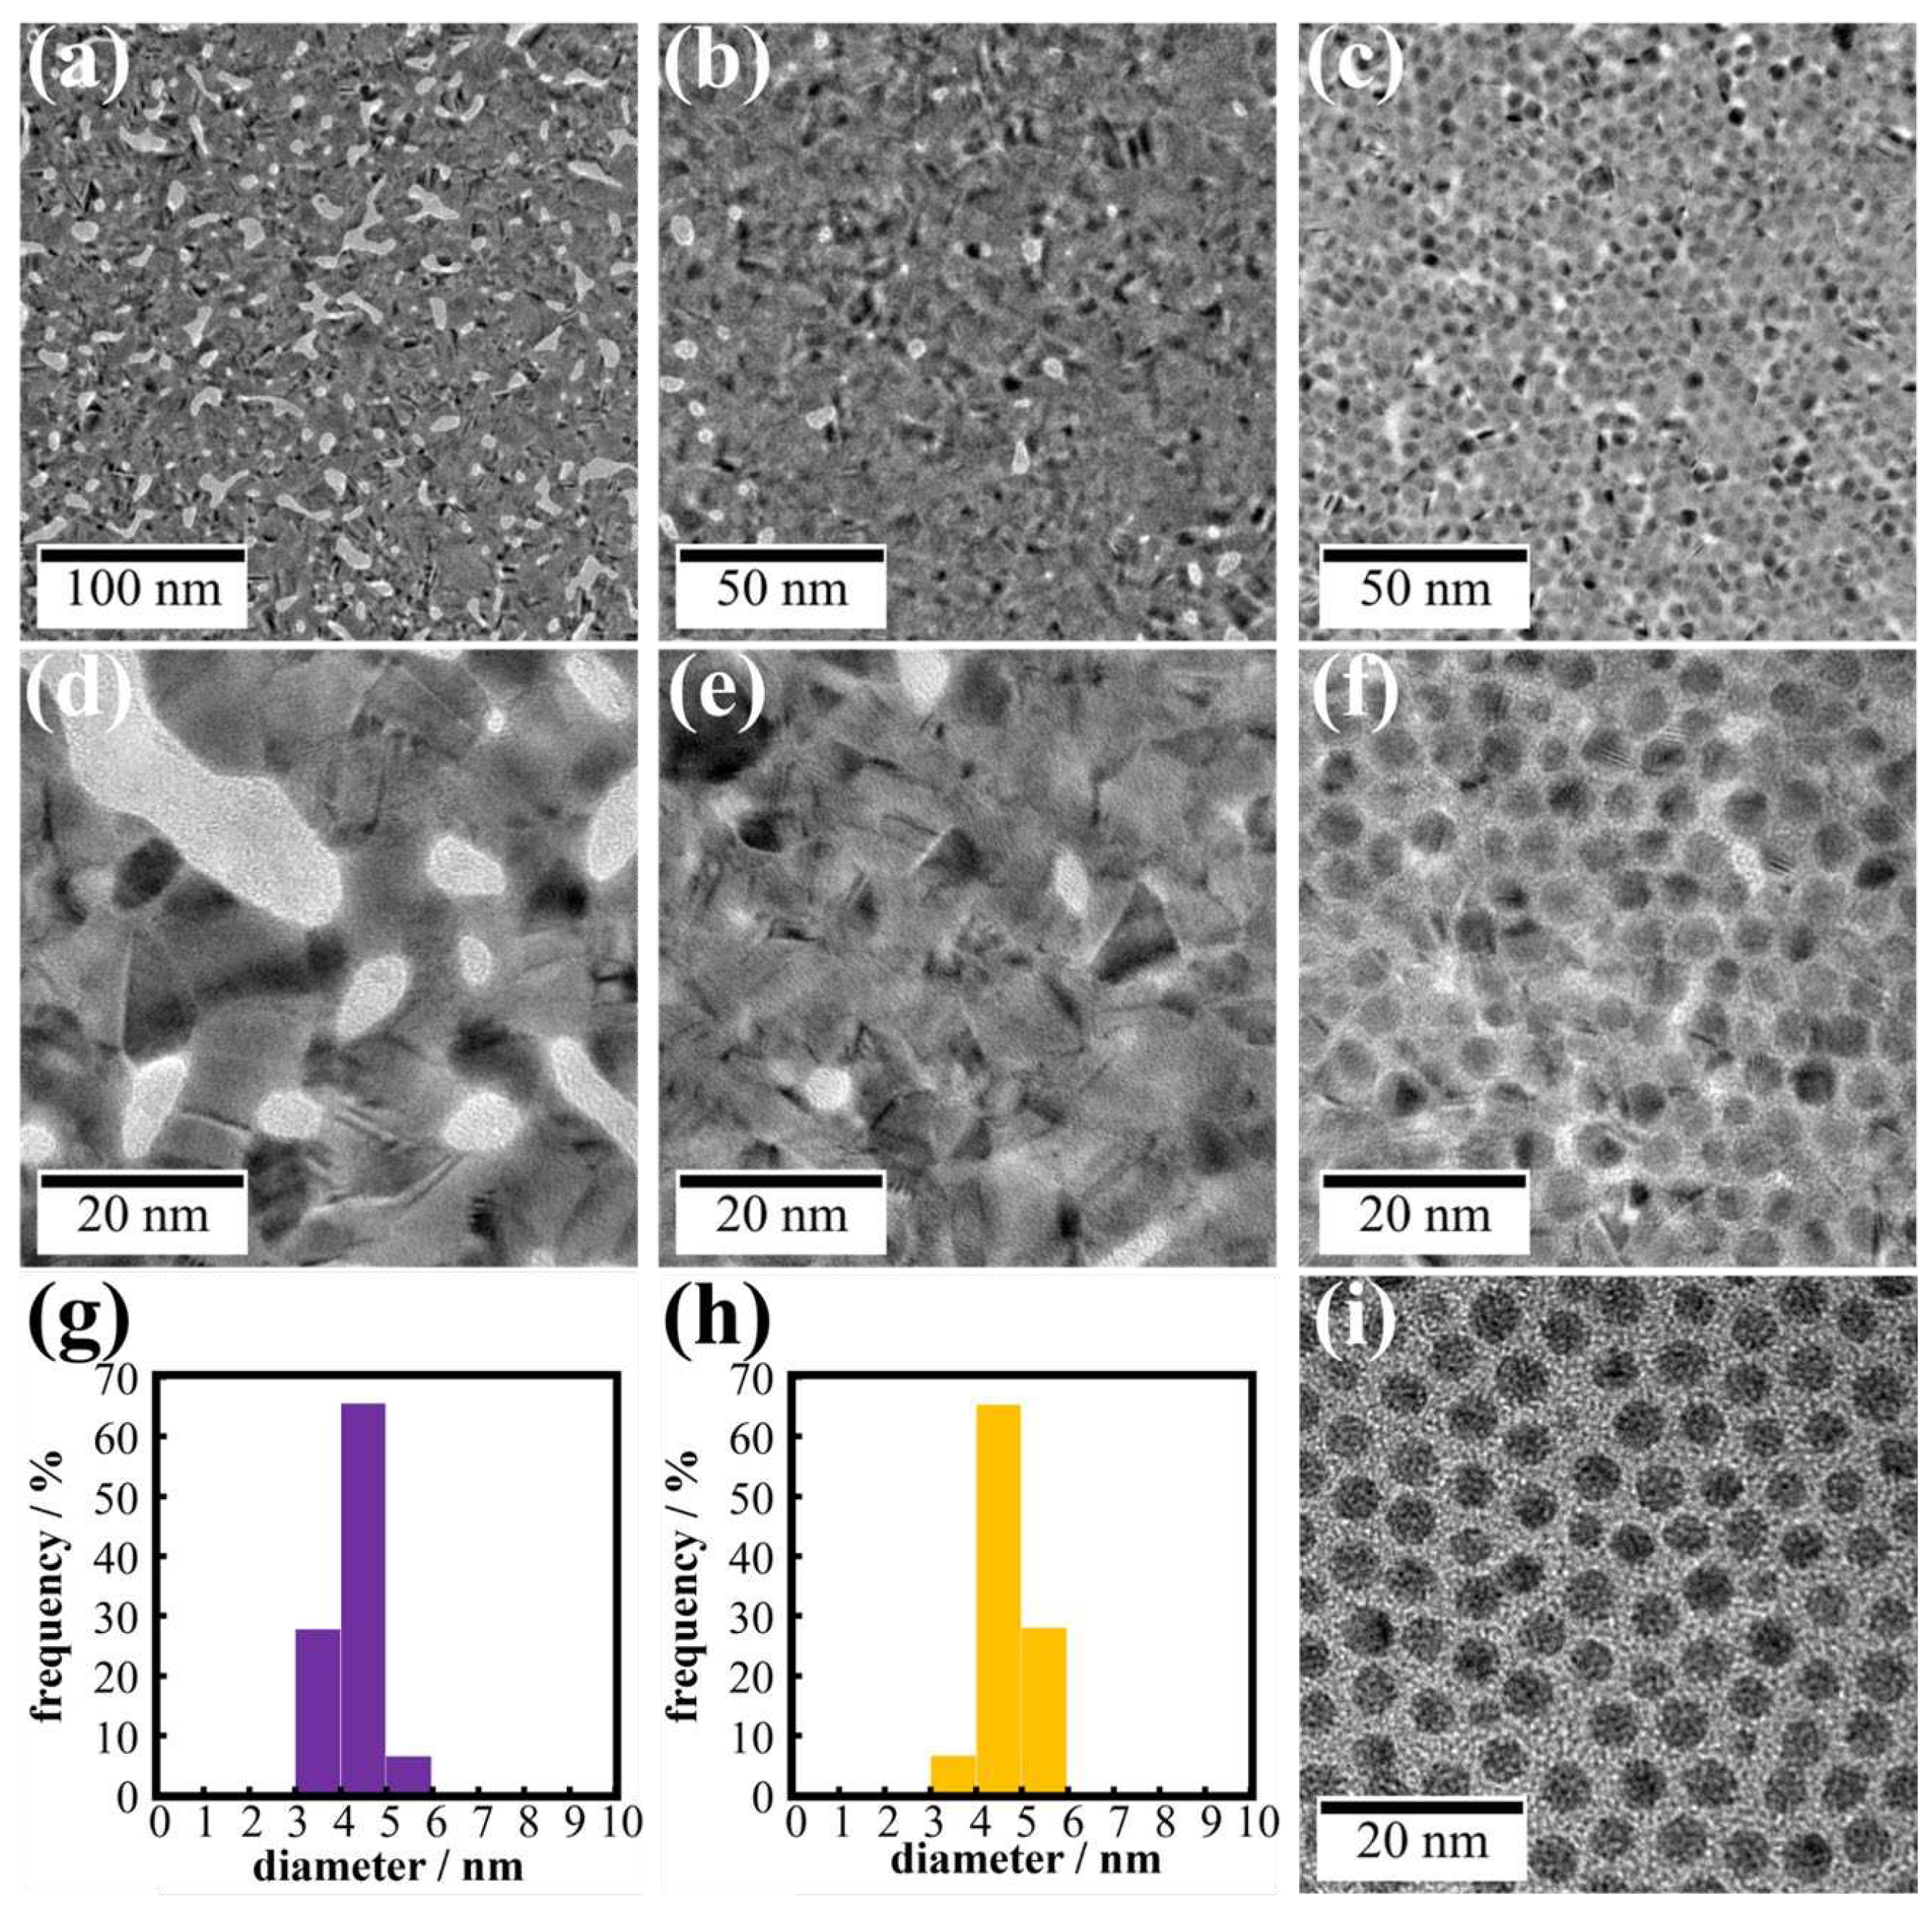
Figure 7 shows TEM images of UV-irradiated AuNPs on water, aqueous 500 µM AgNO
3 and CH
3COOAg solutions. For water and AgNO
3 systems (
Figure 7a, b, d, e), UV irradiation resulted in complete fusion of AuNPs, yielding flat nanosheets with gaps in which no metal is present, although the gap size and density of the AgNO
3 nanosheet were smaller than those on water.
Reducing the size and density may be attributed to depositing Ag atoms generated by photoredution of Ag
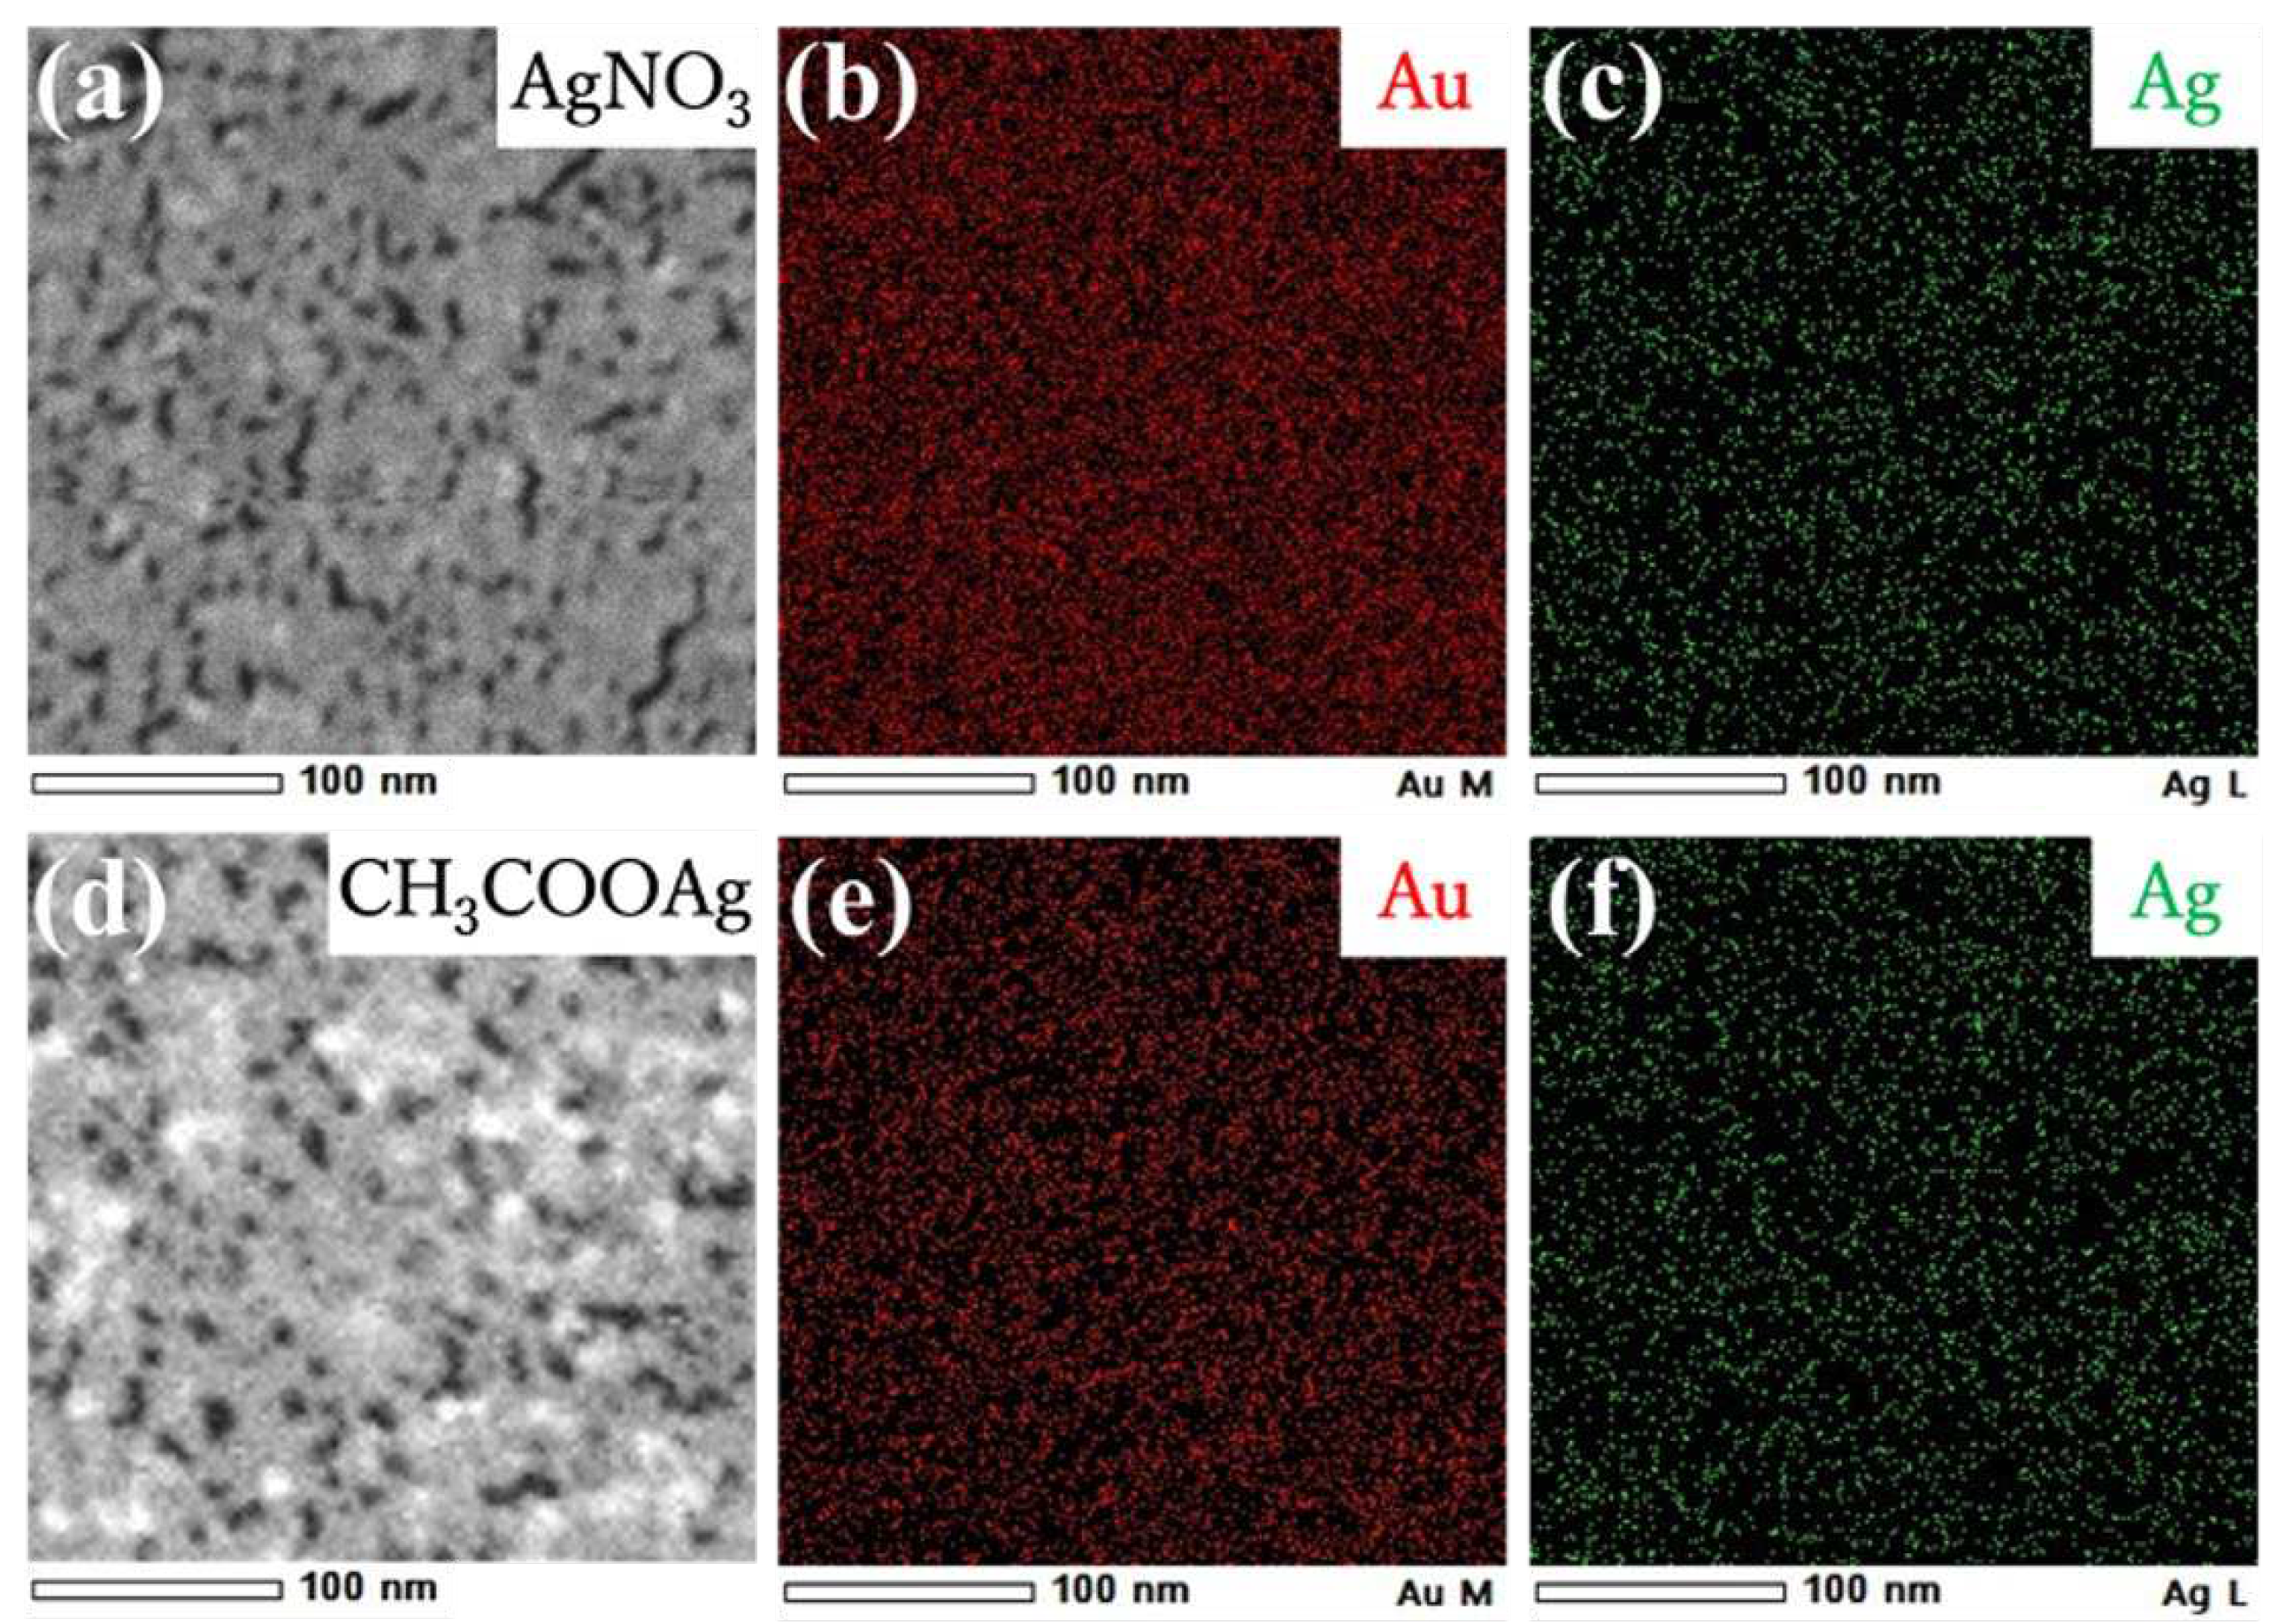
+ ions. Deposition of Ag atoms was confirmed by TEM-EDS (energy dispersive X-ray spectroscopy) mapping.
Figure 8a-c show that a nanosheet prepared on aqueous 500 µM AgNO
3 is composed of both Ag and Au, and these metals are homogeneously distributed throughout the nanosheet. The molar ratio of Ag to Au in the nanosheet was Ag/Au = 20/80 from TEM-EDS analysis. Further, we measured the XRD pattern of the hybrid nanosheet to determine whether silver is oxidized or whether AgNO
3 deposits directly on the nanosheet, although distinguishing between metallic Au and Ag from XRD diffraction is difficult because these metals have nearly identical lattice constants [
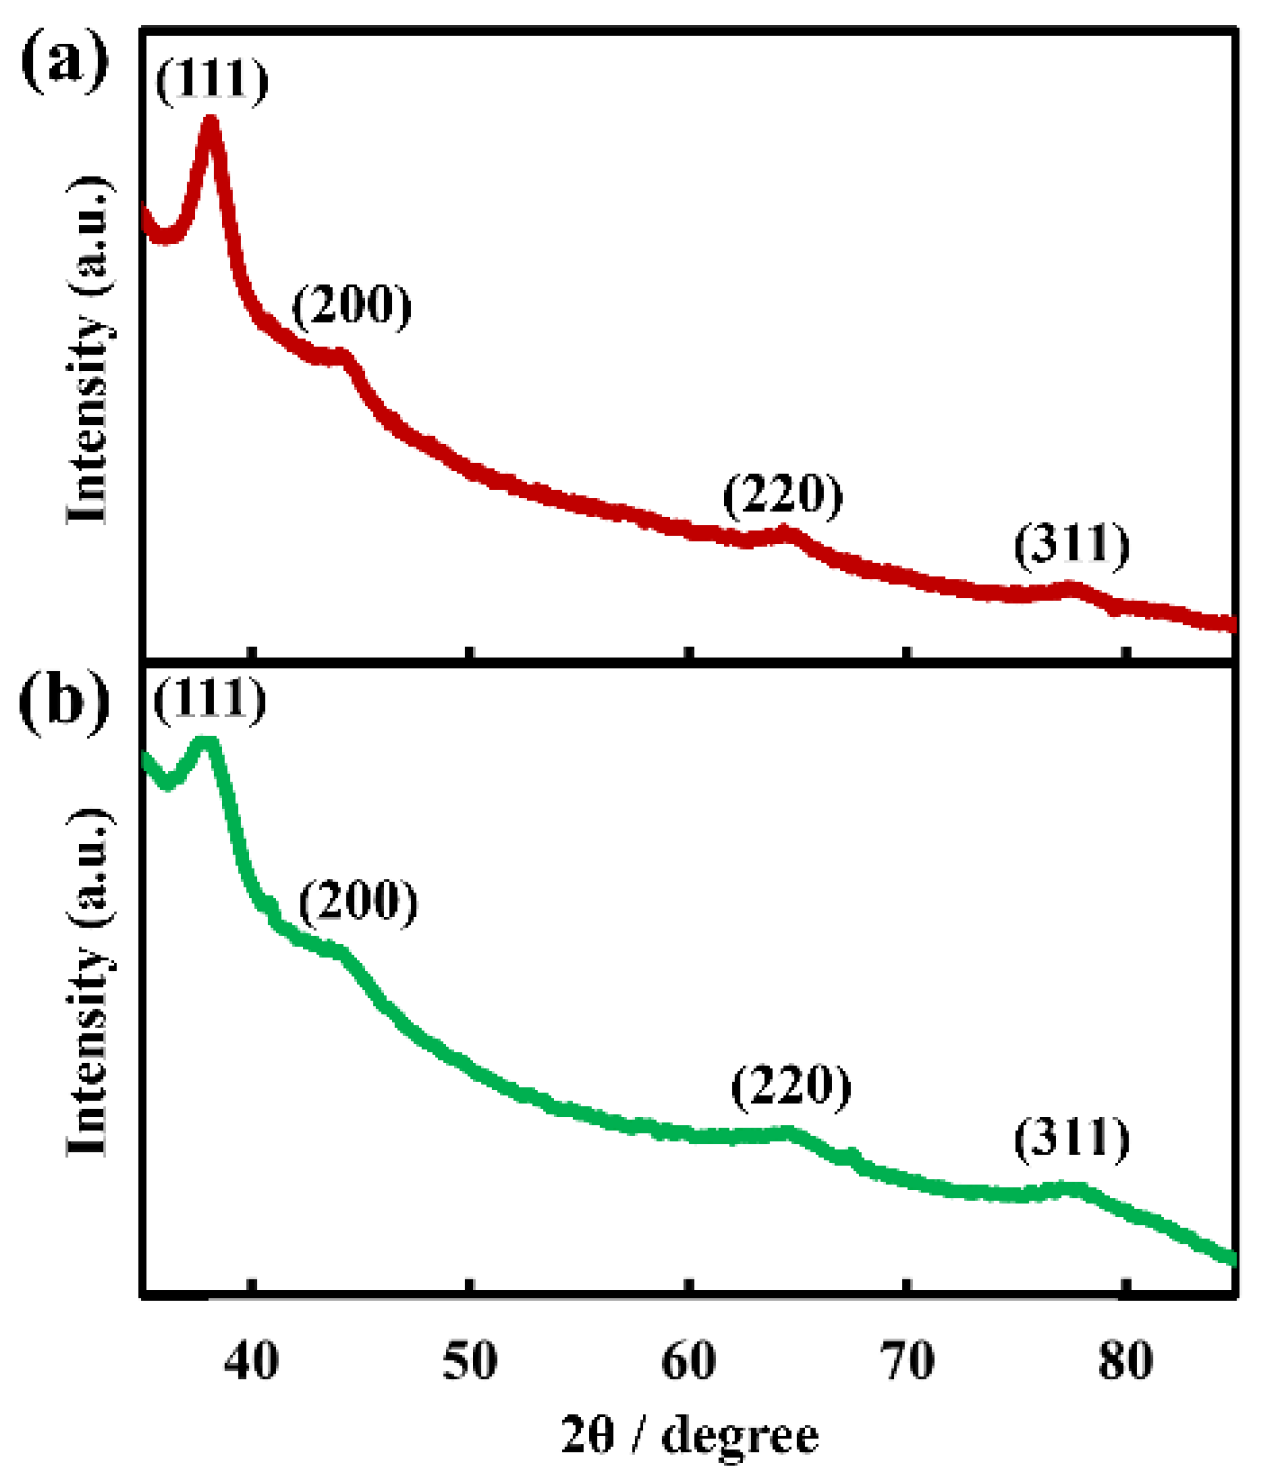
30]. The XRD pattern in
Figure 9a showed reflection peaks at 38.2°, 44.0°, 64.3° and 77.3°, assigned to the (111), (200), (220) and (311) crystal facets of metallic Ag and/or Au, respectively [
26,
27,
31,
32]. The absence of silver oxide and AgNO
3 peaks suggested that the hybrid nanosheet was composed of metallic Ag and Au [
33,
34]. Accordingly, the nanosheet prepared on AgNO
3 aqueous solutions is formed by Ag atoms supplied from the aqueous phase, as well as fusion of AuNPs, leading to fewer and smaller gaps.
With regard to the CH
3COOAg system in
Figures 7c f, the nanosheet morphology differed significantly from that of the AgNO
3 system. Outlines of AuNPs were clearly visible in TEM images of the nanosheet, and AuNPs still remained even after UV irradiation for 60 min. There was no product between AuNPs before UV irradiation (
Figure 7i). However, observing TEM images of AuNPs after UV irradiation (
Figure 7f), we noticed that AuNPs were connected by a thin film. TEM-EDS mapping (
Figure 8b) showed that elemental Ag is present throughout the nanosheet, and TEM-EDS analysis estimated the composition of the hybrid nanosheet as Ag/Au = 40/60. Further, the XRD pattern of the hybrid nanosheets (
Figure 9b) showed no peak for silver oxide or CH
3COOAg, and all peaks were assigned to metallic Ag and/or Au. Hence, these TEM-EDS observations and the XRD analysis suggest that metallic silver deposits as a thin film on the entire AuNP monolayer. This assessment is also consistent with the fact that the average diameter of AuNPs remained almost remained unchanged after UV irradiation (
Figure 7g, h).
3.2.2. Effect of CH3COOAg concentration
We demonstrated that UV irradiation of AuNP monolayers on a CH
3COOAg aqueous solution yields a hybrid nanosheet consisting of an AuNP monolayer covered with an Ag thin film, whereas a flat Au nanosheet was obtained on water without CH
3COOAg. Thus, the morphology of these nanosheets is expected to be highly dependent on the CH
3COOAg concentration. The appearance of nanosheets prepared on 5 µM CH
3COOAg was uniform and similar to that prepared on water, (
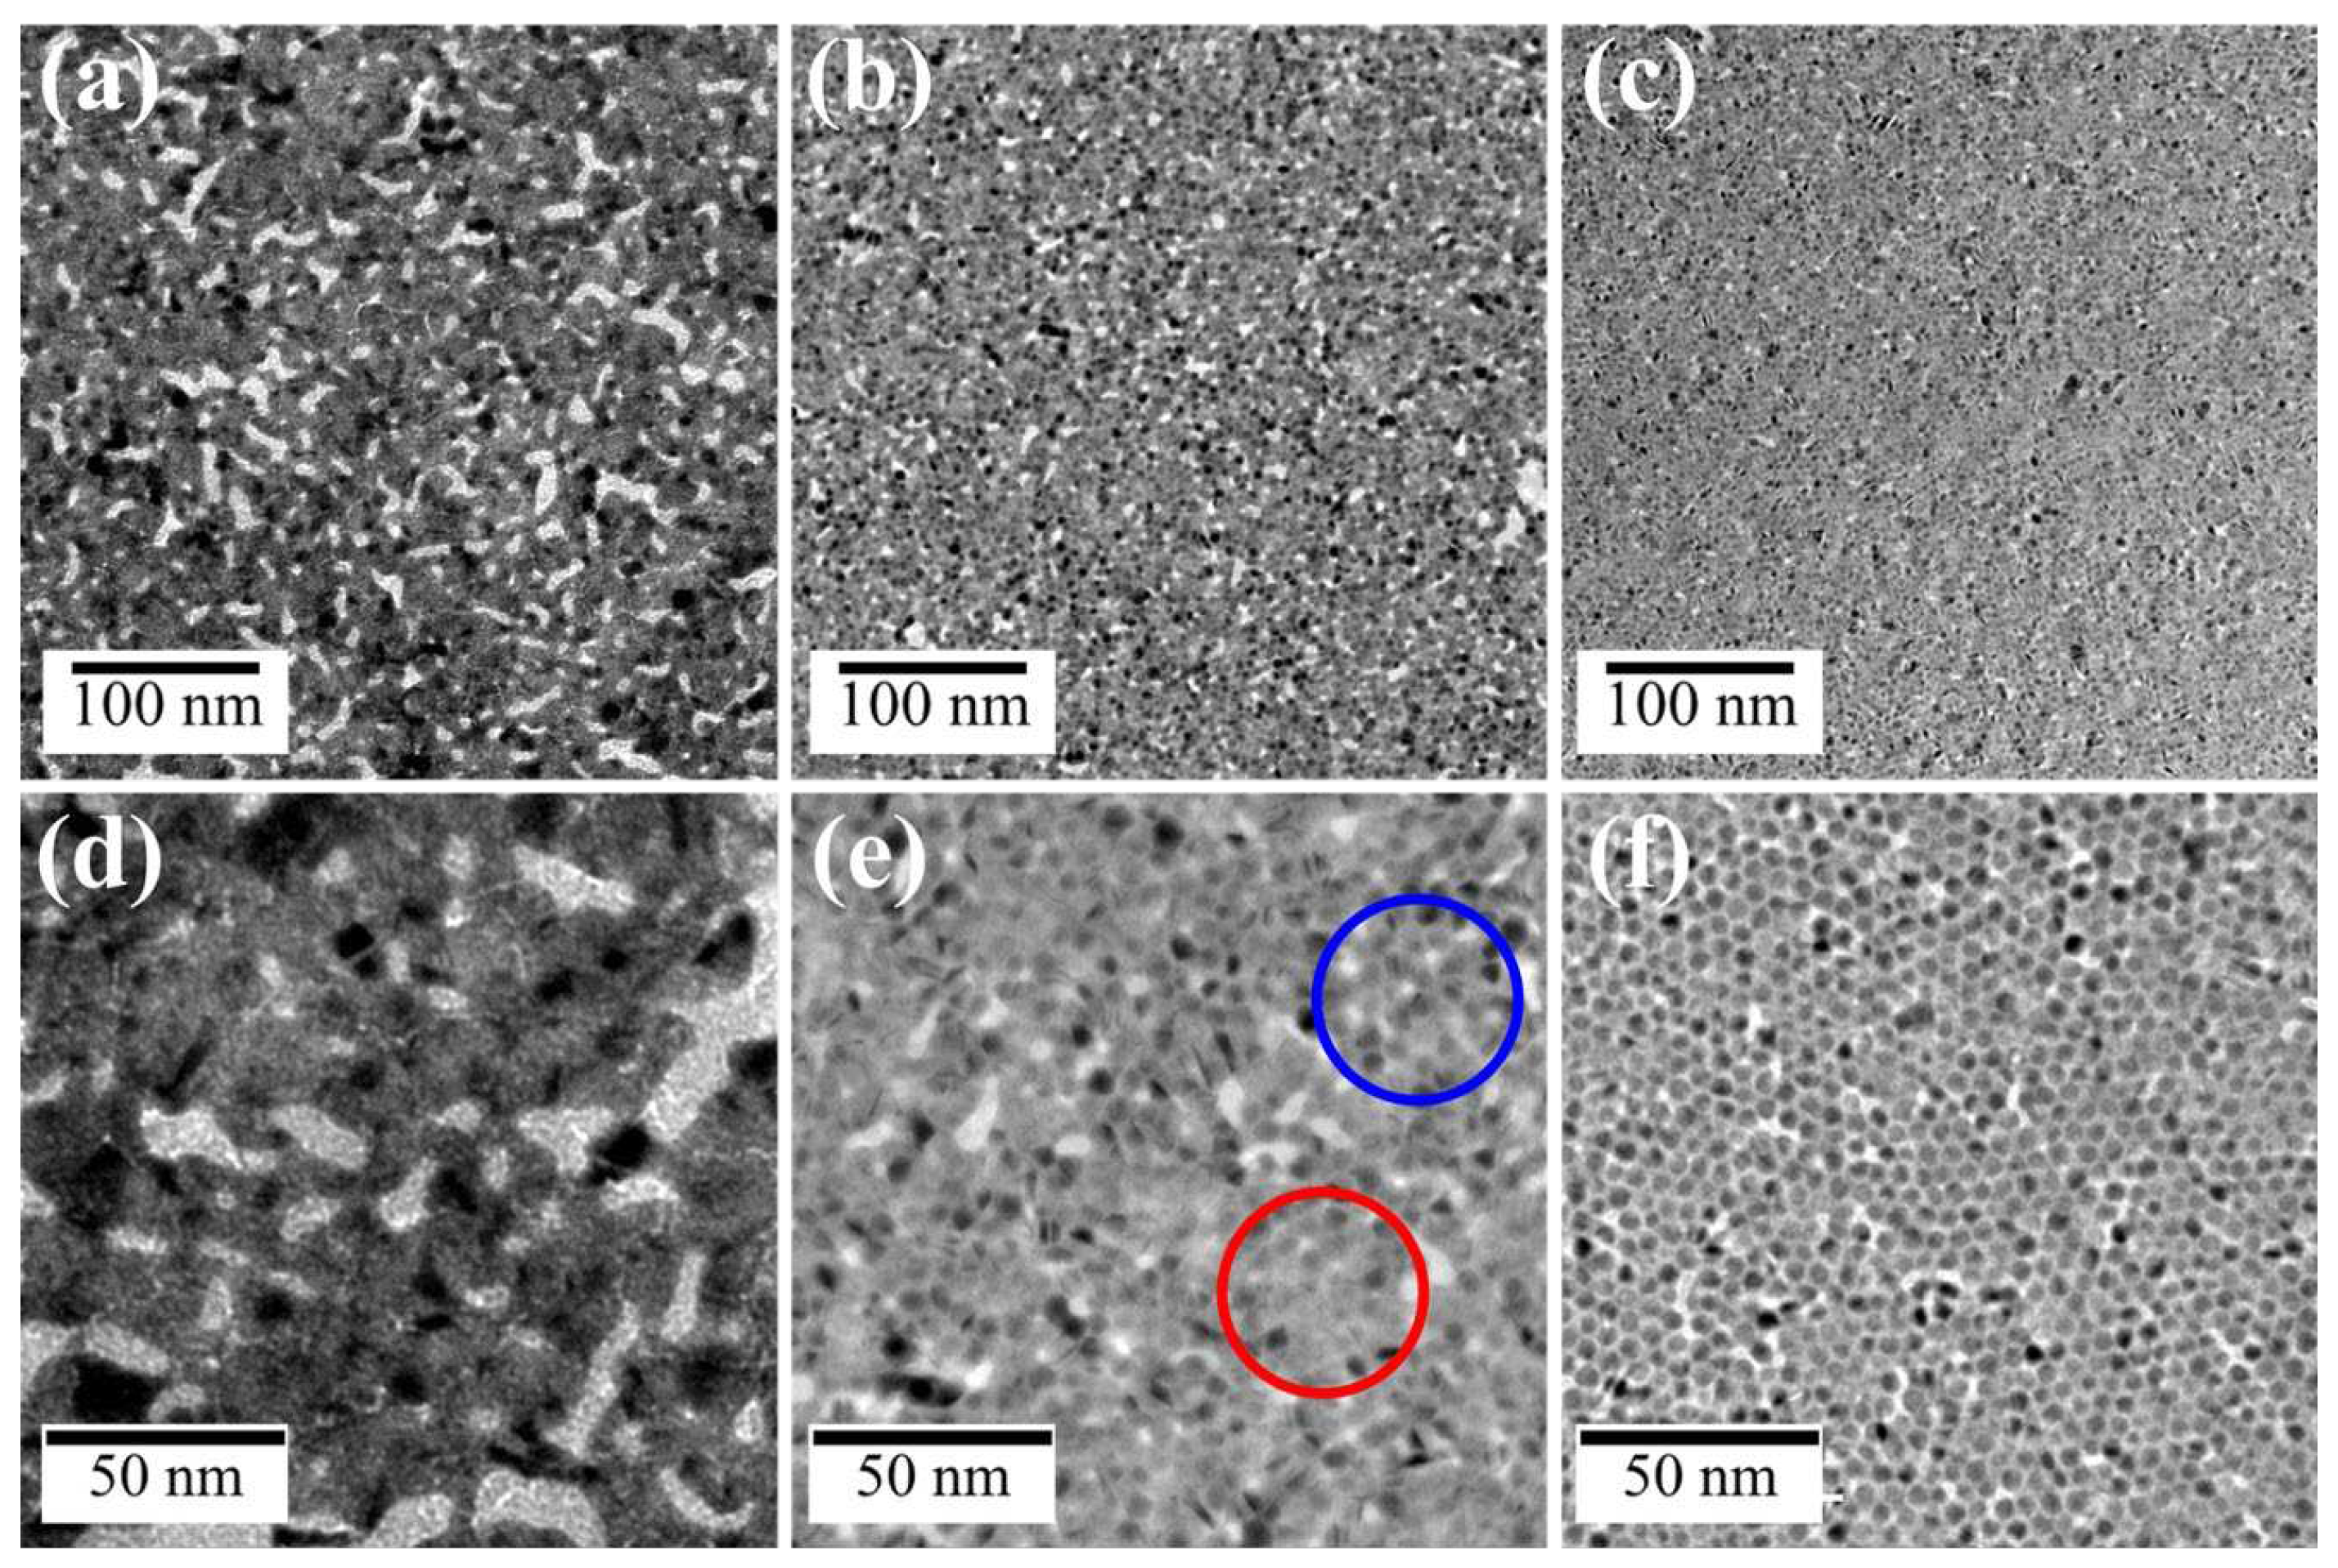
Figure 10a, d). On the other hand, the morphology at 50 µM CH
3COOAg (
Figure 10b, e) was not uniform and consisted of two domains. One domain comprised fused AuNPs (red circle in
Figure 10e) and the other is AuNPs covered with an Ag thin film (blue circle), similar to that of the 500-µM CH
3COOAg nanosheet (
Figure 10c, f). The content of Ag in the hybrid nanosheets was Ag/Au = 19/81 for 5 µM, 35/65 for 50 µM and 40/60 for 500 µM. At low concentrations of CH
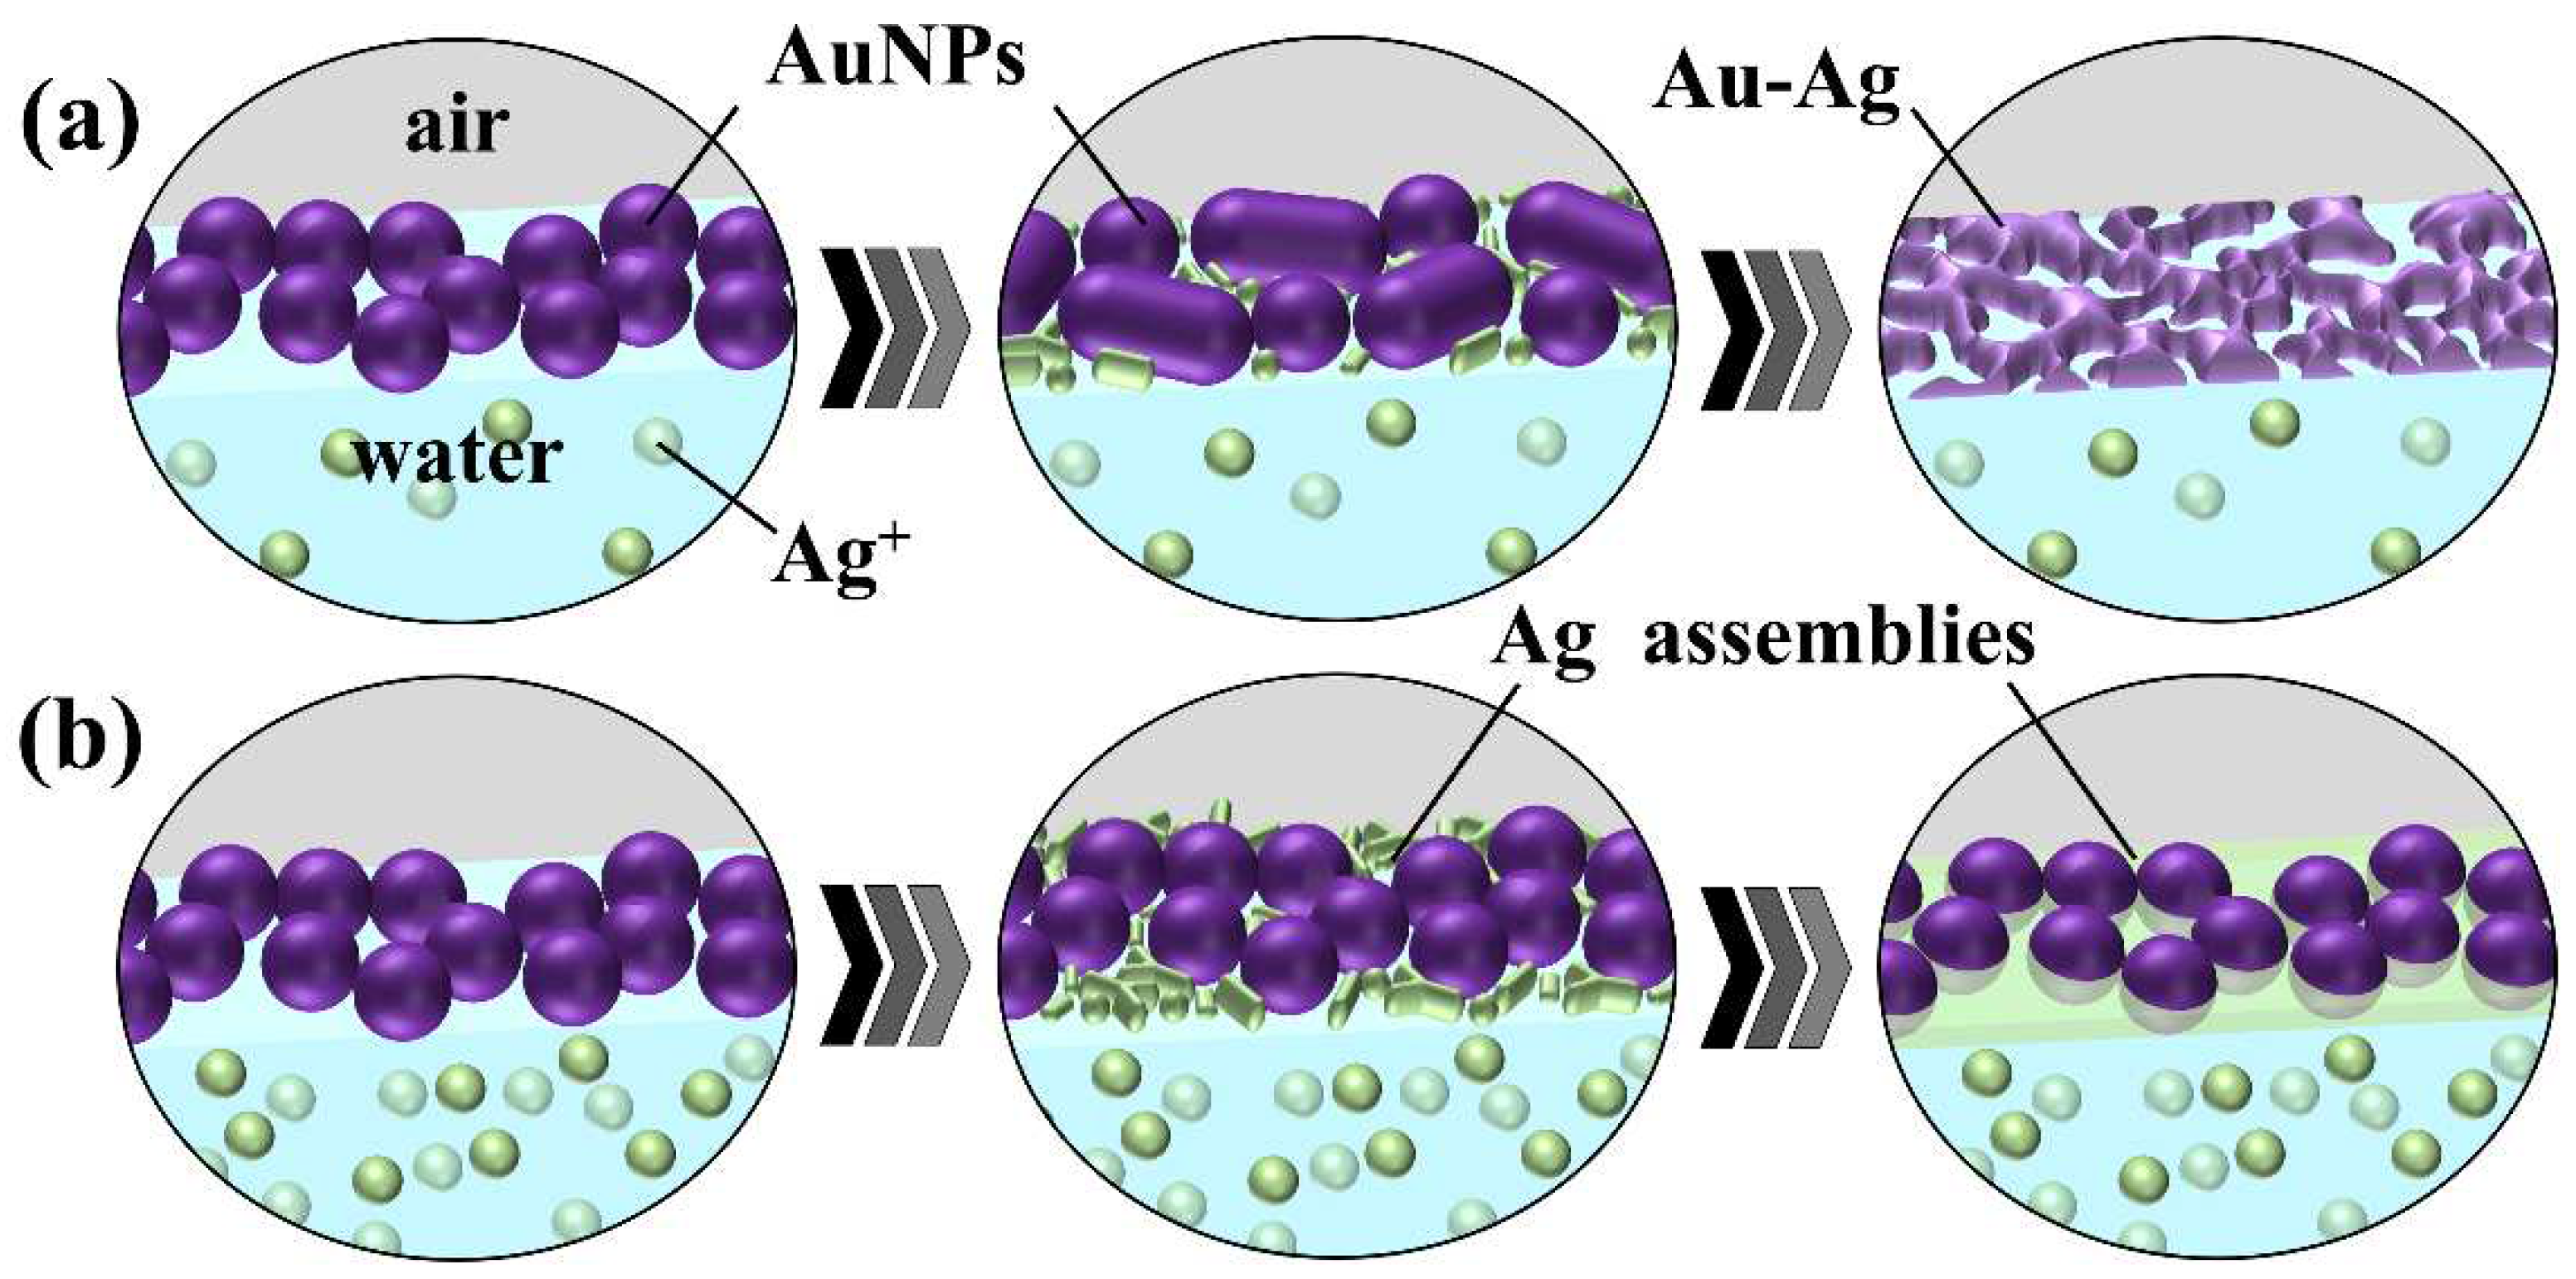
3COOAg, formation of uniform nanosheets is probably attributable to preferential fusion between AuNPs, rather than to supplying Ag atoms generated by photoreduction of Ag ions, as shown in
Figure 11a. On the contrary, at high concentrations (
Figure 10b), since many photoreduced Ag atoms are supplied, prior to fusion of AuNPs, Ag atoms preferentially deposit on AuNPs, which probably inhibits AuNP fusion. Thus, the domain structure at the middle concentration of 50 µM is thought to be driven by competition between Ag deposition on AuNPs and fusion of AuNPs.
We demonstrated that Au-Ag hybrid nanosheets can be prepared on aqueous solutions of AgNO
3 and CH
3COOAg, but their morphology differed significantly. As the Ag/Au ratio was 40/60 for the 500-µM CH
3COOAg system and 20/80 for the 500-µM AgNO
3 system, this silver content difference probably causes the morphology difference. This is because larger amounts of Ag atoms can cover AuNPs, leading to AuNPs embedded in an Ag film. Why is the supply of Ag atoms in the CH
3COOAg system greater than in the AgNO
3 system? According to previous reports [
35,
36], UV irradiation of aqueous organic molecules, such as alcohols and carboxylic acids, promotes photoreduction of metal ions, because these organic molecules photo-generate radical species that have the potential to reduce metal ions, including Ag. Hence, the larger quantity of reduced Ag in the CH
3COOAg system is because CH
3COO
– ions generate radical species that can reduce Ag ions. Thus, more silver ions are reduced in the CH
3COOAg system than in the AgNO
3 system.
3.3. Conductivity and transparency of Au-Ag hybrid nanosheets
The electrical resistance and optical transmittance of Au-Ag nanosheets were evaluated. Electrical resistances of nanosheets prepared on 500-µM AgNO
3 and CH
3COOAg solutions were 1600 Ω/sq and 83 Ω/sq, respectively, smaller than that of the original Au nanosheet (2600 Ω/sq). In particular, the nanosheet prepared on 500-µM CH
3COOAg solution, which has an Ag thin film covering the AuNP monolayer (
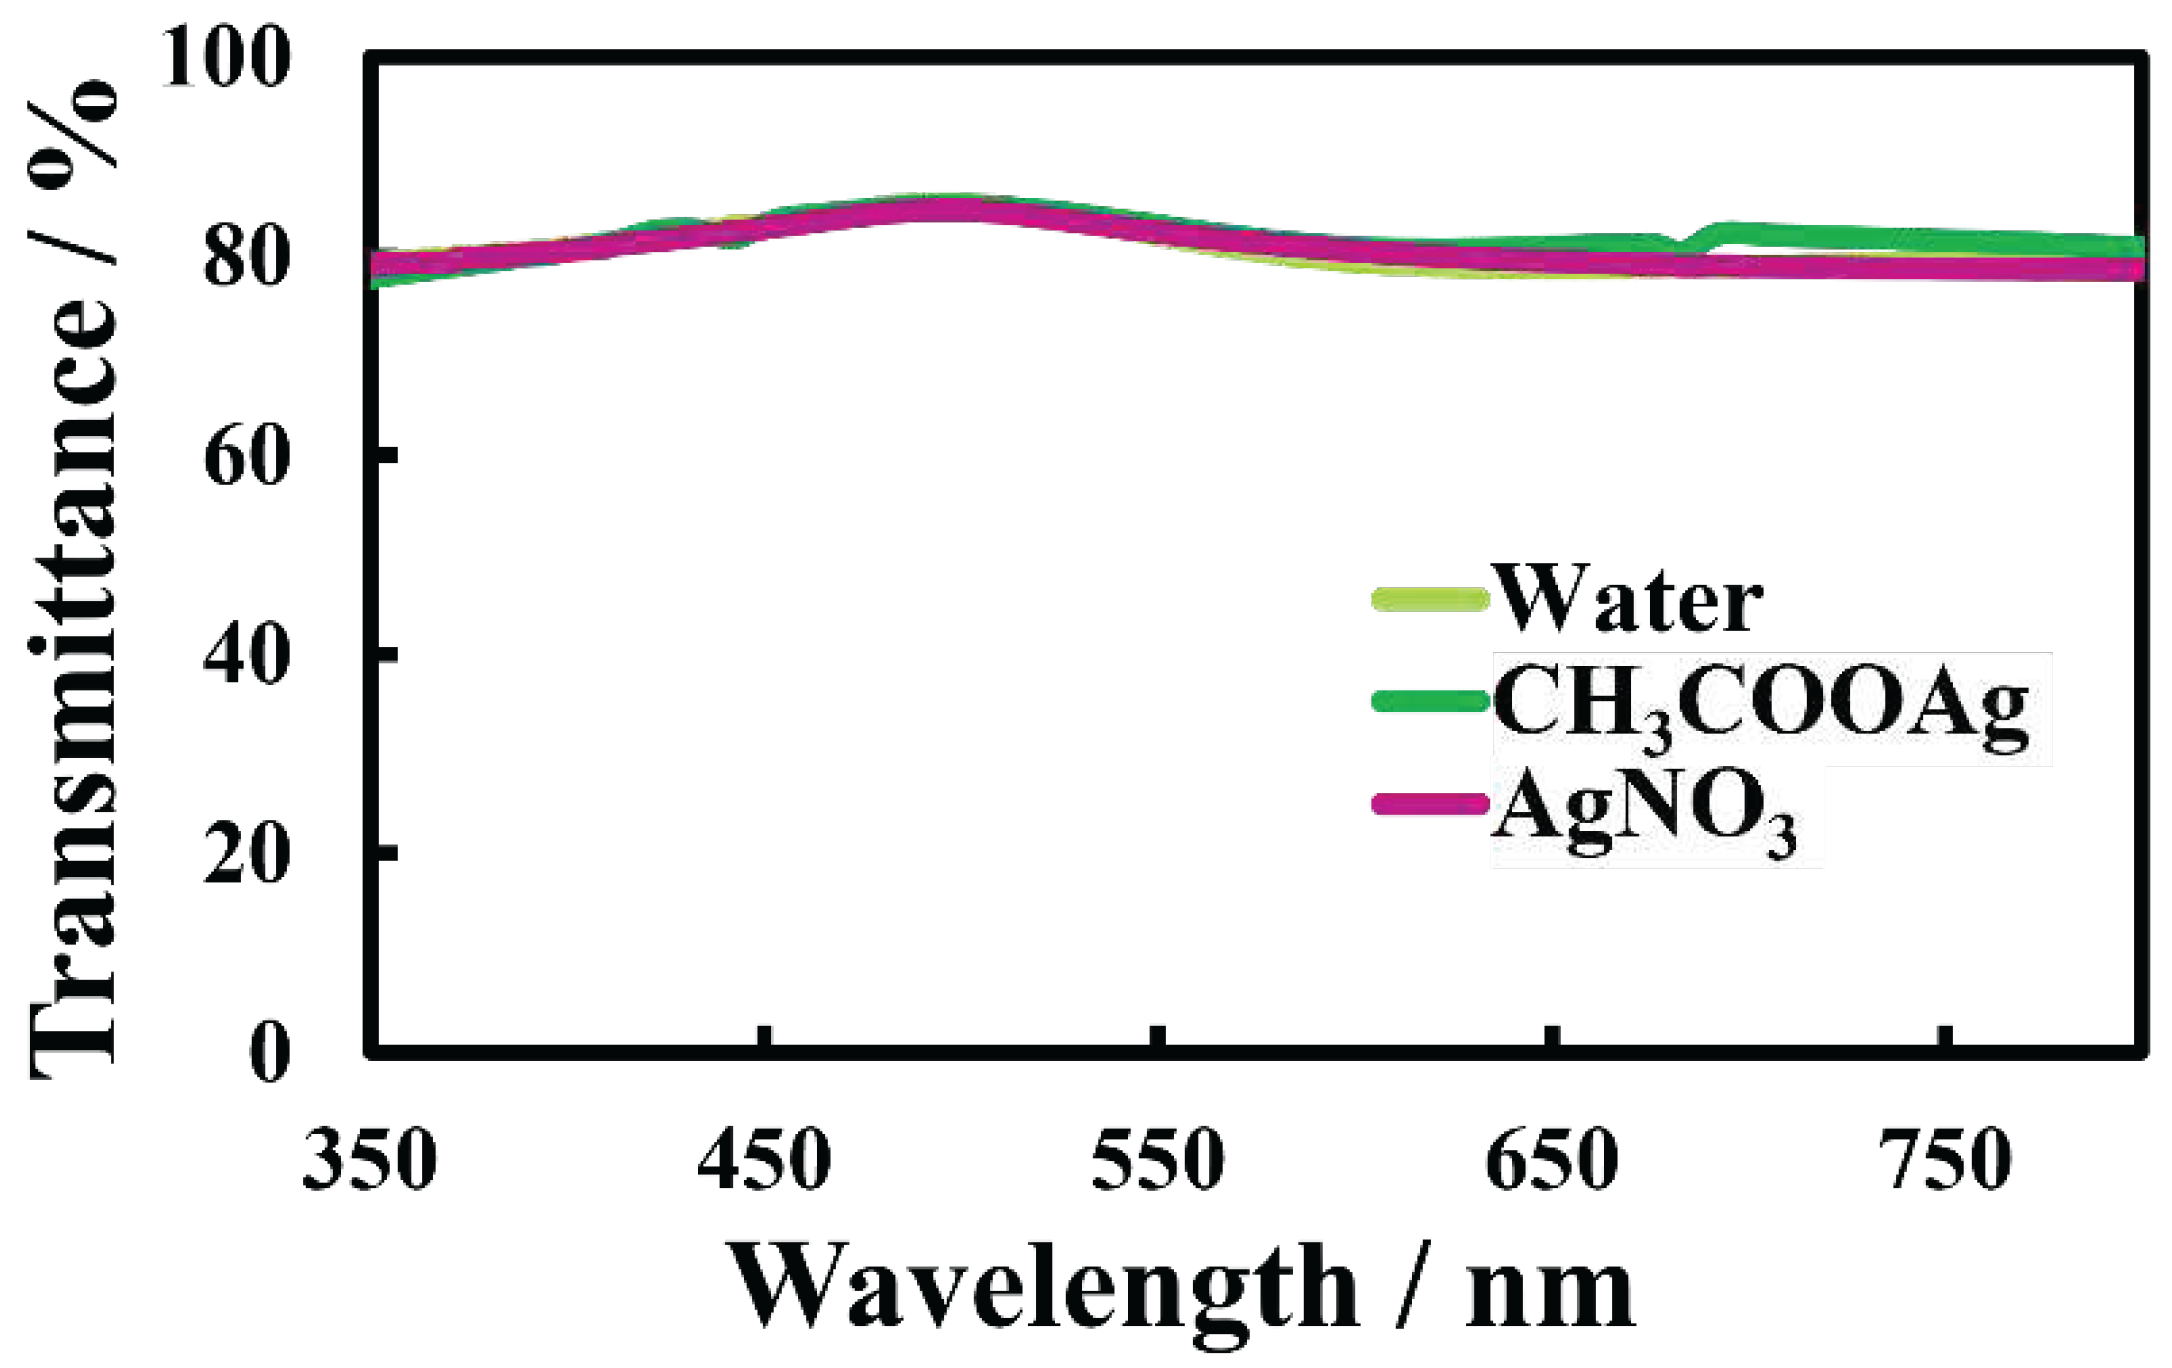
Figure 7f), had low electrical resistance. On the other hand, transmittances in the UV and visible regions of Au-Ag nanosheets (
Figure 12) were almost identical to that of the original Au nanosheet. Hence, covering AuNP monolayers with an Ag thin film improved the conductivity considerably without degrading the transparency. Accordingly, in the process of fabricating transparent conductive films with AuNP monolayers, deposition and coating with silver under UV irradiation proved to be remarkably useful in improving their properties.
4. Conclusions
We demonstrated that the versatility of a UV irradiation technique for preparing metal nanosheets from metal NP monolayers can be enhanced using subphases containing metal ions. With a single type of AuNP monolayer, using aqueous HAuCl4, AgNO3 and CH3COOAg solutions as alternative subphases, morphology and composition of Au nanosheets can be changed. Without synthesizing AuNPs of different diameters, one type of AuNP can be used to prepare Au nanosheets with high conductivity, but low transparency using aqueous HAuCl4 solutions. Using aqueous AgNO3 and CH3COOAg solutions, Au-Ag nanosheets with high conductivity and transparency can be prepared from the same AuNPs. Further, Au-Ag nanosheets prepared from AgNO3 have a homogeneous flat structure, while those from CH3COOAg have the structure of AuNPs embedded in an Ag thin film.
Author Contributions
Conceptualization, TK; methodology, MT and HK; investigation, MT, HK and TK; data curation, MT and HK; writing—original draft preparation, MT and TK; writing—review and editing, TK; supervision, TK All authors have read and agreed to the published version of the manuscript.
Funding
This work was supported by JSPS KAKENHI Grant Numbers 19H02538 and 22H01892.
Informed Consent Statement
Not applicable.
Data Availability Statement
Data presented in this study are available on request from the corresponding author, but they are not publicly available because they pertain to an on-going project.
Conflicts of Interest
The authors declare that they have no competing financial interests or personal relationships that could have influenced this work.
References
- Valasma, R.; Bozo, E.; Pitkänen, O.; Järvinen, T.; Dombovari, A.; Mohl, M.; Lorite, G. S.; Kiss, J.; Konya, Z.; Kordas, K. Grid-Type Transparent Conductive Thin Films of Carbon Nanotubes as Capacitive Touch Sensors. Nanotechnology 2020, 31, 305303. [Google Scholar] [CrossRef]
- Nam, V. B.; Shin, J.; Yoon, Y.; Giang, T. T.; Kwon, J.; Suh, Y. D.; Yeo, J.; Hong, S.; Ko, S. H.; Lee, D. Highly Stable Ni-Based Flexible Transparent Conducting Panels Fabricated by Laser Digital Patterning. Adv. Funct. Mater. 2019, 29, 1806895. [Google Scholar] [CrossRef]
- Cho, S.; Kang, S.; Pandya, A.; Shanker, R.; Khan, Z.; Lee, Y.; Park, J.; Craig, S. L.; Ko, H. Large-Area Cross-Aligned Silver Nanowire Electrodes for Flexible, Transparent, and Force-Sensitive Mechanochromic Touch Screens. ACS Nano 2017, 11, 4346–4357. [Google Scholar] [CrossRef]
- Gong, S.; Zhao, Y.; Yap, L. W.; Shi, Q.; Wang, Y.; Bay, J. A. P. B.; Lai, D. T. H.; Uddin, H.; Cheng, W. Fabrication of Highly Transparent and Flexible NanoMesh Electrode via Self-assembly of Ultrathin Gold Nanowires. Adv. Electron. Mater. 2016, 2, 1600121. [Google Scholar] [CrossRef]
- Lian, L.; Xi, X.; Dong, D.; He, G. Highly conductive silver nanowire transparent electrode by selective welding for organic light emitting diode. Org. Electron 2018, 60, 9–15. [Google Scholar] [CrossRef]
- Park, Y.; Bormann, L.; Müller-Meskamp, L.; Vandewal, K.; Leo, K. Efficient Flexible Organic Photovoltaics Using Silver Nanowires and Polymer Based Transparent Electrodes. Org. Electron 2016, 36, 68–72. [Google Scholar] [CrossRef]
- Lee, S.; Jang, J.; Park, T.; Park, Y. M.; Park, J. S.; Kim, Y.-K.; Lee, H.-K.; Jeon, E.-C.; Lee, D.-K.; Ahn, B.; Chung, C.-H. Electrodeposited silver nanowire transparent conducting electrodes for thin-film solar cells. ACS Appl. Mater. Interfaces 2020, 12, 6169–6175. [Google Scholar] [CrossRef] [PubMed]
- Khaligh, H.H.; Liew, K.; Han, Y.; Abukhdeir, N.M.; Goldthorpe, I.A. Silver nanowire transparent electrodes for liquid crystal-based smart windows. Sol. Energy Mater. Sol. Cells 2015, 132, 337–341. [Google Scholar] [CrossRef]
- Wang, B.; Facchetti, A. Mechanically flexible conductors for stretchable and wearable e-skin and e-textile devices. Adv. Mater. 2019, 31, 1901408. [Google Scholar] [CrossRef] [PubMed]
- Lee, H.; Hong, S.; Lee, J.; Suh, Y. D.; Kwon, J.; Moon, H.; Kim, H.; Yeo, J.; Ko, S. H. Highly stretchable and transparent supercapacitor by Ag–Au core–shell nanowire network with high electrochemical stability. ACS Appl. Mater. Interfaces 2016, 8, 15449–15458. [Google Scholar] [CrossRef] [PubMed]
- Kim, C.; Park, J.-W.; Kim, J.; Hong, S.-J.; Lee, M. J. A Highly Efficient Indium Tin Oxide Nanoparticles (ITO-NPs) Transparent Heater Based on Solution-Process Optimized with Oxygen Vacancy Control. J. Alloys Compd. 2017, 726, 712–719. [Google Scholar] [CrossRef]
- Kumar, A.; Zhou, C. The Race to Replace Tin-Doped Indium Oxide: Which Material Will Win? ACS Nano 2010, 4, 11–14. [Google Scholar] [CrossRef]
- Tran, D.-P.; Lu, H.-I.; Lin, C.-K. Conductive Characteristics of Indium Tin Oxide Thin Film on Polymeric Substrate under Long-Term Static Deformation. Coatings 2018, 8, 212. [Google Scholar] [CrossRef]
- Chen, Z.; Li, W.; Li, R.; Zhang, Y.; Xu, G.; Cheng, H. Fabrication of Highly Transparent and Conductive Indium–Tin Oxide Thin Films with a High Figure of Merit via Solution Processing. Langmuir 2013, 29, 13836–13842. [Google Scholar] [CrossRef] [PubMed]
- He, T.; Xie, A.; Reneker, D.H.; Zhu, Y. A Tough and High-Performance Transparent Electrode from a Scalable and Transfer-Free Method. ACS Nano 2014, 8, 4782–4789. [Google Scholar] [CrossRef] [PubMed]
- Higashitani, K.; Mcnamee, C. E.; Nakayama, M. Formation of Large-Scale Flexible Transparent Conductive Films Using Evaporative Migration Characteristics of Au Nanoparticles. Langmuir 2011, 27, 2080–2083. [Google Scholar] [CrossRef] [PubMed]
- Kister, T.; Maurer, J. H. M.; González-García, L.; Kraus, T. Ligand-Dependent Nanoparticle Assembly and Its Impact on the Printing of Transparent Electrodes. ACS Appl. Mater. Interfaces 2018, 10, 6079–6083. [Google Scholar] [CrossRef]
- Maurer, J. H. M.; González-García, L.; Reiser, B.; Kanelidis, I.; Kraus, T. Templated Self-Assembly of Ultrathin Gold Nanowires by Nanoimprinting for Transparent Flexible Electronics. Nano Lett. 2016, 16, 2921–2925. [Google Scholar] [CrossRef]
- Morag, A.; Philosof-Mazor, L.; Volinsky, R.; Mentovich, E.; Richter, S.; Jelinek, R. Self-Assembled Transparent Conductive Electrodes from Au Nanoparticles in Surfactant Monolayer Templates. Adv. Mater. 2011, 23, 4327–4331. [Google Scholar] [CrossRef]
- He, Y.; Chen, Y.; Xu, Q.; Xu, J.; Weng, J. Assembly of Ultrathin Gold Nanowires into Honeycomb Macroporous Pattern Films with High Transparency and Conductivity. ACS Appl. Mater. Interfaces 2017, 9, 7826–7833. [Google Scholar] [CrossRef]
- Nishimura, T.; Ito, N.; Kinoshita, K.; Matsukawa, M.; Imura, Y.; Kawai, T. Fabrication of Flexible and Transparent Conductive Nanosheets by the UV–Irradiation of Gold Nanoparticle Monolayers. Small 2020, 16, 1903365. [Google Scholar] [CrossRef]
- Matsukawa, M.; Wang, K.-H.; Imura, Y.; Kawai, T. Au Nanoparticle Monolayer Nanosheets as Flexible Transparent Conductive Electrodes. ACS Appl. Nano Mater. 2021, 4, 10845–10851. [Google Scholar] [CrossRef]
- Brust, M.; Walker, M.; Bethell, D.; Schiffrin, D. J.; Whyman, R. Synthesis of Thiol-Derivatized Gold Nanoparticles in a two-phase Liquid-Liquid system. Chem. Commun. 1994, 7, 801–802. [Google Scholar] [CrossRef]
- Baba, A.; Kaneko, F.; Advincula, R. C. Polyelectrolyte adsorption processes characterized in situ using the quartz crystal microbalance technique: alternate adsorption properties in ultrathin polymer films. Colloids Surf., A 2000, 173, 39–49. [Google Scholar] [CrossRef]
- Vogt, B.D.; Lin, E.K.; Wu, W.-I.; White, C.C. Effect of Film Thickness on the Validity of the Sauerbrey Equation for Hydrated Polyelectrolyte Films. J. Phys. Chem. B 2004, 108, 12685–12690. [Google Scholar] [CrossRef]
- Imura, Y.; Maniwa, M.; Iida, K.; Saito, H.; Morita-Imura, C.; Kawai, T. Preparing Alumina-Supported Gold Nanowires for Alcohol Oxidation. ACS Omega 2021, 6, 16043–16048. [Google Scholar] [CrossRef]
- Feng, H.; Yang, Y.; You, Y.; Li, G.; Guo, J.; Yu, T.; Shen, Z.; Wu, T.; Xing, B. Simple and rapid synthesis of ultrathin gold nanowires, their self-assembly and application in surface-enhanced Raman scattering. Chem. Commun. 2009, 15, 1984–1986. [Google Scholar] [CrossRef] [PubMed]
- Kwon, J. H.; Jeon, Y.; Choi, K. C. Robust Transparent and Conductive Gas Diffusion Multibarrier Based on Mg- and Al-Doped ZnO as Indium Tin Oxide-Free Electrodes for Organic Electronics. ACS Appl. Mater. Interfaces 2018, 10, 32387–32396. [Google Scholar] [CrossRef]
- Sun, K.; Li, P.; Xia, Y.; Chang, J.; Ouyang, J. Transparent conductive oxide-free perovskite solar cells with PEDOT:PSS as transparent electrode. ACS Appl. Mater. Interfaces 2015, 7, 15314–15320. [Google Scholar] [CrossRef]
- Chen, D.; Li, C.; Liu, H.; Ye, F.; Yang, J. Core-shell Au@Pd Nanoparticles with Enhanced Catalytic Activity for Oxygen Reduction Reaction via Core-Shell Au@Ag/Pd Constructions. Sci. Rep. 2015, 5, 11949. [Google Scholar] [CrossRef] [PubMed]
- Jiang, H.; Moon, K.-S.; Li, Y.; Wong, C. P. Surface Functionalized Silver Nanoparticles for Ultrahigh Conductive Polymer Composites. Chem. Mater. 2006, 18, 2969–2973. [Google Scholar] [CrossRef]
- Kulkarni, A. A.; Bhanage, B. M. Ag@ AgCl nanomaterial synthesis using sugar cane juice and its application in degradation of azo dyes. ACS Sustainable Chem. Eng. 2014, 2, 1007–1013. [Google Scholar] [CrossRef]
- Runa, X.; Zhou, S.; Yin, C.; Bai, J.; Zhang, X.; Khan, A.; Xu, A.; Li, X. Insight into the catalytic performance of silver oxides towards peroxymonosulfate activation for pollutants degradation: efficiency, mechanism and stability. Colloids Surf. A 2022, 642, 128674. [Google Scholar] [CrossRef]
- Gankhuyag, G.; Bae, D. S.; Lee, K.; Lee, S. One-Pot Synthesis of SiO2@Ag Mesoporous Nanoparticle Coating for Inhibition of Escherichia coli Bacteria on Various Surfaces. Nanomaterials 2021, 11, 549. [Google Scholar] [CrossRef] [PubMed]
- Chen, Z.; Lu, S.; Zhang, Z.; Huang, X.; Zhao, H.; Wei, J.; Li, F.; Yuan, K.; Su, L.; Xiong, Y. Green photoreduction synthesis of dispersible gold nanoparticles and their direct in situ assembling in multidimensional substrates for SERS detection. Mikrochim. Acta 2022, 189, 275. [Google Scholar] [CrossRef] [PubMed]
- Rahman, A.; Kumar, S.; Bafana, A.; Lin, J.; Dahoumane, S.A.; Jeffryes, C. A mechanistic view of the light-induced synthesis of silver nanoparticles using extracellular polymeric substances of Chlamydomonas reinhardtii. Molecules 2019, 24, 3506. [Google Scholar] [CrossRef] [PubMed]
Figure 1.
Schematic illustration of the experimental procedure. (a) AuNP monolayers are prepared by spreading a chloroform dispersion of AuNPs on water. The AuNP monolayer is then transferred onto an aqueous solution of HAuCl4, AgNO3 or CH3COOAg, and (b) irradiated with UV light.
Figure 1.
Schematic illustration of the experimental procedure. (a) AuNP monolayers are prepared by spreading a chloroform dispersion of AuNPs on water. The AuNP monolayer is then transferred onto an aqueous solution of HAuCl4, AgNO3 or CH3COOAg, and (b) irradiated with UV light.
Figure 2.
TEM images of Au nanosheets prepared on (a) water, (b) 4.8-, (c) 48- and (d) 480-μM HAuCl4 aqueous solutions.
Figure 2.
TEM images of Au nanosheets prepared on (a) water, (b) 4.8-, (c) 48- and (d) 480-μM HAuCl4 aqueous solutions.
Figure 3.
SEM images of Au nanosheets prepared on (a) 4.8-, (b) 48- and (c) 480-μM HAuCl4 aqueous solutions.
Figure 3.
SEM images of Au nanosheets prepared on (a) 4.8-, (b) 48- and (c) 480-μM HAuCl4 aqueous solutions.
Figure 4.
TEM images of Au nanosheets prepared on (a-c) water, (d-f) 48- and (g-i) 480-μM HAuCl4 aqueous solutions at irradiation times of (a,d,g) 15, (b,e,h) 30, and (c,f,i) 60 min.
Figure 4.
TEM images of Au nanosheets prepared on (a-c) water, (d-f) 48- and (g-i) 480-μM HAuCl4 aqueous solutions at irradiation times of (a,d,g) 15, (b,e,h) 30, and (c,f,i) 60 min.
Figure 5.
XRD pattern of Au nanosheets prepared on a 480-µM HAuCl4 aqueous solution.
Figure 5.
XRD pattern of Au nanosheets prepared on a 480-µM HAuCl4 aqueous solution.
Figure 6.
UV-vis spectra of Au nanosheets prepared at various concentrations of HAuCl4 aqueous solution.
Figure 6.
UV-vis spectra of Au nanosheets prepared at various concentrations of HAuCl4 aqueous solution.
Figure 7.
TEM images of Au nanosheets prepared on (a,d) water, (b,e) AgNO3 and (c,f) CH3COOAg aqueous solutions. Particle size distribution histograms of (g) AuNPs before UV irradiation and (h) AuNPs in a nanosheet prepared on CH3COOAg aqueous solution. (i) TEM image of AuNPs before UV irradiation.
Figure 7.
TEM images of Au nanosheets prepared on (a,d) water, (b,e) AgNO3 and (c,f) CH3COOAg aqueous solutions. Particle size distribution histograms of (g) AuNPs before UV irradiation and (h) AuNPs in a nanosheet prepared on CH3COOAg aqueous solution. (i) TEM image of AuNPs before UV irradiation.
Figure 8.
STEM images (a, d) and EDS elemental mapping images (b, c, e, f) of Au-Ag nanosheets prepared on (a-c) AgNO3 and (d-f) CH3COOAg aqueous solutions.
Figure 8.
STEM images (a, d) and EDS elemental mapping images (b, c, e, f) of Au-Ag nanosheets prepared on (a-c) AgNO3 and (d-f) CH3COOAg aqueous solutions.
Figure 9.
XRD patterns of Au-Ag nanosheets prepared on (a) AgNO3 and (b) CH3COOAg aqueous solutions.
Figure 9.
XRD patterns of Au-Ag nanosheets prepared on (a) AgNO3 and (b) CH3COOAg aqueous solutions.
Figure 10.
TEM images of Au-Ag nanosheets prepared on (a,d) 5-, (b,e) 50- and (c,f) 500-μM CH3COOAg aqueous solutions.
Figure 10.
TEM images of Au-Ag nanosheets prepared on (a,d) 5-, (b,e) 50- and (c,f) 500-μM CH3COOAg aqueous solutions.
Figure 11.
Schematic illustration of proposed growth mechanism of Au-Ag hybrid nanosheets at (a) a low concentration and (b) a high concentration of CH3COOAg aqueous solutions.
Figure 11.
Schematic illustration of proposed growth mechanism of Au-Ag hybrid nanosheets at (a) a low concentration and (b) a high concentration of CH3COOAg aqueous solutions.
Figure 12.
UV-vis spectra of Au-Ag nanosheets prepared on AgNO3 and CH3COOAg aqueous solutions.
Figure 12.
UV-vis spectra of Au-Ag nanosheets prepared on AgNO3 and CH3COOAg aqueous solutions.
|
Disclaimer/Publisher’s Note: The statements, opinions and data contained in all publications are solely those of the individual author(s) and contributor(s) and not of MDPI and/or the editor(s). MDPI and/or the editor(s) disclaim responsibility for any injury to people or property resulting from any ideas, methods, instructions or products referred to in the content. |
© 2023 by the authors. Licensee MDPI, Basel, Switzerland. This article is an open access article distributed under the terms and conditions of the Creative Commons Attribution (CC BY) license (http://creativecommons.org/licenses/by/4.0/).
