1. Introduction
Precision measurement with multiple degrees of freedom (DOF) can be used to accurately detect the position and presence of objects in planar or three-dimensional space, which have been widely used in machining positioning and motion driving in ultra-precision machining processes [
1,
2,
3]. The measured degrees of freedom typically include linear parameters (e.g., displacement in three linear axes) and angular parameters (e.g., roll angle, yaw angle and pitch angle) [
4,
5]. In past decades, several optical methods have been reported for multiple-DOF measurement, including laser interferometry, autocollimation and grating diffraction interferometry [
6,
7,
8]. Among these methods, the grating-based approach shows high resolution and stability for compact machining systems [
9,
10]. Generally, multiple-DOF measurement based on optical gratings can be demonstrated by either using multiple linear displacement sensors or combining the optical interference and the autocollimation [
11,
12,
13]. Considering the recent compelling need for developing ultracompact components for high-precision machining systems such as lithography machines [
14]. In 2013, X. Li
et al. present a multi-axis surface encoder to measure 6-DOF translational displacement motions and angular motions of a planar motion stage. The measurement resolutions of the displacement and angle are about 1nm and 0.1’’ [
15]. In 2022, S. Wang
et al. proposed a grating encoder which can provide absolute 4-DOF position and pose monitoring with sub-arcsecond and sub-micron accuracy [
16]. In the case, plenty of optical components including reflectors, polarizers, wave plates are required for synchronously measuring the linear and the angular parameters, resulting in a low compactness and significant degradation of accuracy caused by large Abbe error and cross-talk error [
17,
18].
The self-imaging effect reveals a phenomenon that, when a periodic structure (e.g., optical grating) is irradiated by a plane wave, the intensity distribution of the optical field at certain distances behind the structure shows a same period [
19]. Benefitting from a simple optical path and high compactness, either linear or angular measurement has been demonstrated in past years based on the self-imaging effect of optical gratings. For linear displacement measurement, in 2014, P. Rodriguez-Montero
et al. present a device for measuring displacement based on the self-imaging and the nonsteady photo-electromotive force effects, demonstrating an estimated resolution better than 10μm within a dynamic range of 1.5mm [
20]. In 2015, S. Agarwal
et al. reported an in-plane displacement measurement by using a circular grating Talbot interferometer [
21]. By analyzing the shift of self-imaging interferometric fringe patterns, a resolution at micrometer level was reported. In 2022, C. Xin
et al. improved the resolution to be 0.73nm within a range up to mm level by using a two-quadrant detector [
22]. For angular measurement, in 1999, Q. Liu
et al. found the Moire fringes changing with different parallelism between two optical gratings [
23]. In 2006, A. Wang
et al. reported a sensor that used the self-imaging effect to detect the local intensity and incident angle of light [
24]. In 2022, Z. Yang
et al. reported an ultracompact angular displacement sensor using a double-grating structure with a sensitivity of 0.19mV/arcsec within a range of ± 396arcsec [
25]. Since both the linear and angular displacement synchronously changing the amplitude of the output signal or the patterns of the self-imaging images in the cases mentioned above, the linear and angular displacement is hard to be distinguished from each other. By using different parameters (e.g., amplitude and phase respectively) of the output signals, the self-imaging effect can be in principle used in developing multiple-DOF measuring with high compactness and accuracy.
In this paper, an ultra-compact composite displacement and angle sensor based on the self-imaging effect of optical microgratings is demonstrated. By detecting the change in the phase and the amplitude of optical transmission behind two gratings, the linear displacement and angle can be measured synchronously. The simulated results obtained by a finite-difference time-domain (FDTD) method show that, the transmission changes sinusoidally with a relative linear displacement between two gratings. The phase of the sinusoidal signal is related to the input linear displacement (e.g., a phase of 2π corresponding to a linear displacement equal to one single period of the grating). And the amplitude of the sinusoidal signal attenuates with an increasing pitch angle for the upper grating. A resolution of 4nm for linear displacement and 3.85arcsec within a range of ±1° for angle measurement have been demonstrated experimentally, indicating the ability for synchronous multiple-DOF measurement. Benefitting from a simple coaxial optical path without using much optical components such as reflectors and polarizers, this sensor shows ultrahigh compactness for multi-DOF measurement without significant degradation of accuracy compared to traditional one-dimension measurement [
22], showing the great potential in applications ranging from integrable high-precision machining to manufacturing.
2. Principle
The measuring principle of the proposed sensor can be explained by a plane wave interference theory. A double-layer structure consisting of two optical microgratings with a same period is used. When a monochromatic plane wave is vertically incident on an optical grating, the amplitude transmission behind the grating can be expressed as [
26]
where
Cn is the Fourier coefficient and d is the grating period.
Assuming that the lower grating (G2) is located behind the upper grating (G1) with a certain distance of N
ZT, (N=0,1,2...), where
is the period of the self-imaging images in the direction perpendicular to the plane of grating [
27].
Assuming that G1 rotates along the y axis with an angle of θ synchronously, the two gratings were no longer parallel to each other. Using a projective simplification, G1 can be projected into a parallel plane after being rotated. In this case, the modified grating period (d) can be given by dcosθ, and self-imaging positions is defined by Z=ZT’=2d2cos2θ/λ.
Assuming that the distance between G1 and G2 is
Z, the complex amplitude distribution of the light field at lower surface of G2 can be expressed as
Assuming that G1 and G2 have a relative displacement, the complex amplitude distribution behind G2 can be given [
25]
where
ΔL is the relative linear displacement between G1 and G2.
The Eq. (4) indicates that,
U’(x,z,ΔL) changes sinusoidally with an input linear displacement. Since the system can be regarded as a low-pass filter in which the components whose spatial frequency is higher than that of the gratings are cut off, the phase of the sinusoidally curve is related to the displacement by a factor of 1/
dcos
θ, which means that each change of 2π in phase corresponding to a linear displacement of
dcos
θ [
23]. Meanwhile, the amplitude of the curve is related to the input angle with a factor of 1/cos
θ. As a result, it is possible in principle to measure the linear and angular displacement at same time by detecting the phase and the amplitude respectively.
3. Simulation
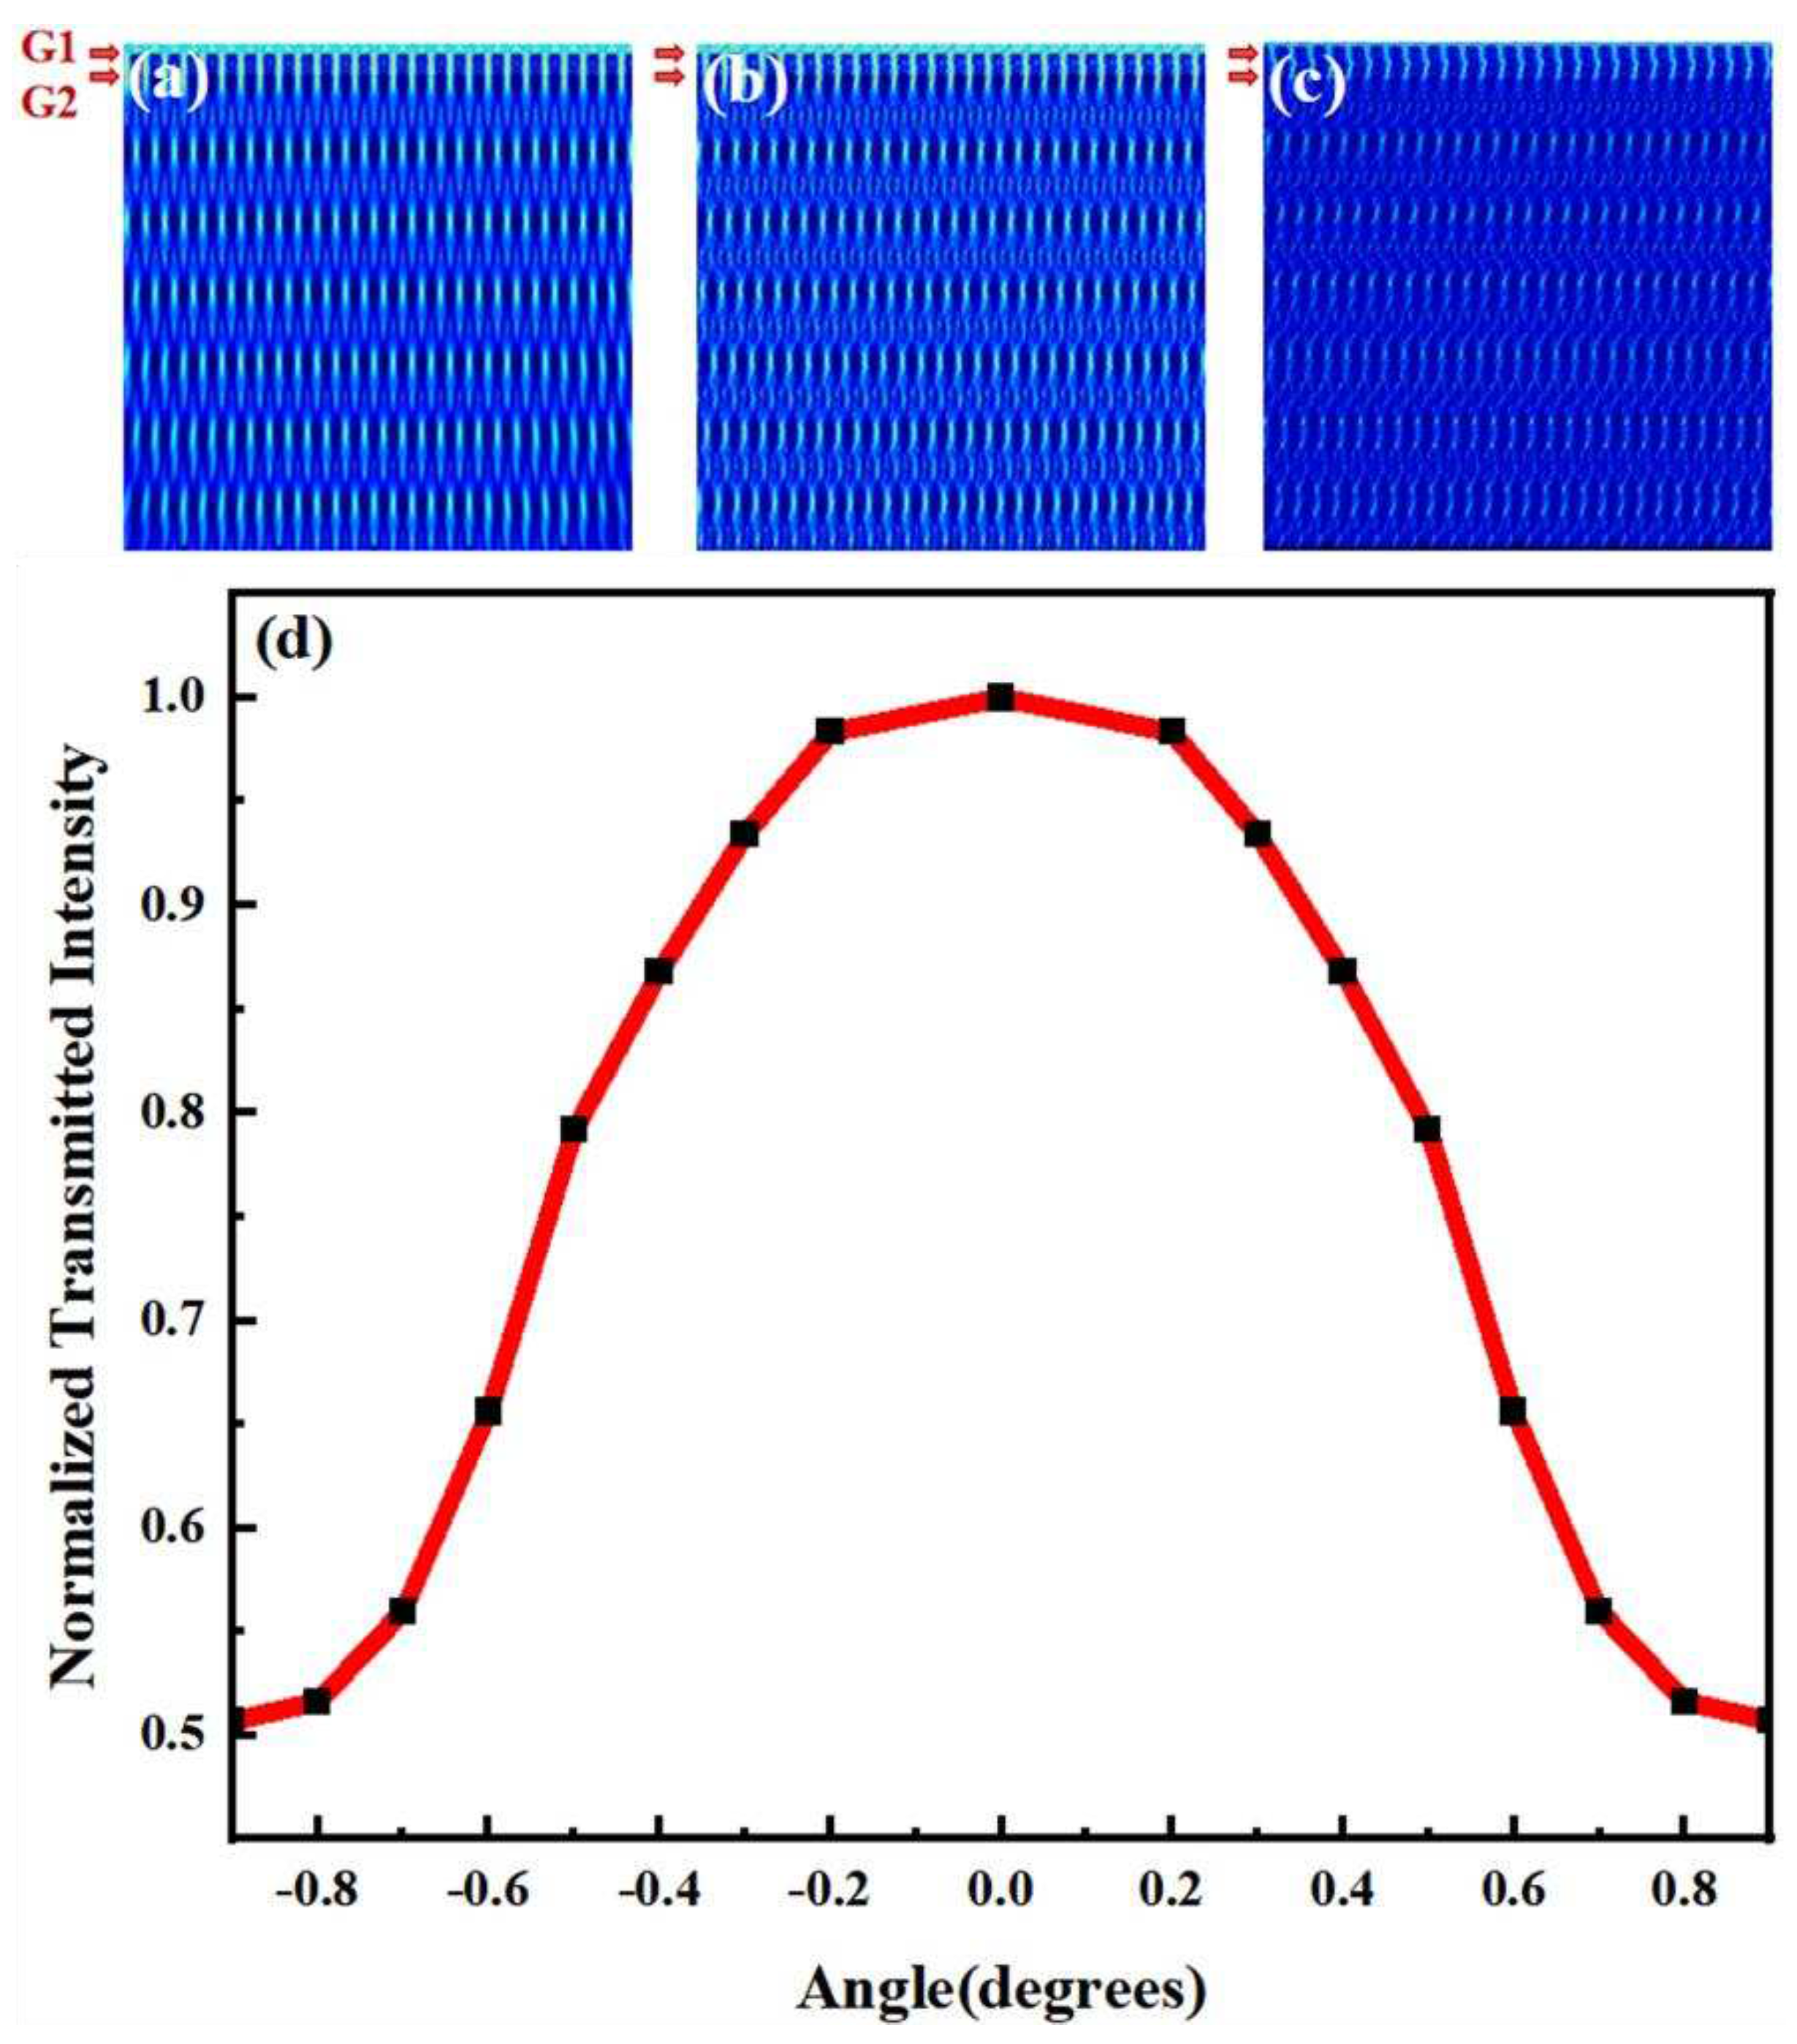
The optical transmitted properties of a double-grating structure are investigated by a FDTD method. The material of the gratings is aluminum. The period of the gratings is of 4μm. And the wavelength of the input beam is 635nm. The simulated optical transmission with different
θ is shown in
Figure 1(a)(b)(c). As
θ increasing from 0° to 2° gradually, the transmission decreases meanwhile, agreeing with theoretical analysis. The normalized simulated transmitted intensity with different
θ is shown in
Figure 1(d). A maximum normalized intensity of 1 is obtained as
θ=0°. As |
θ| increases, the normalized intensity decreases as well (e.g., down to 0.51 as |
θ|=0.9°).
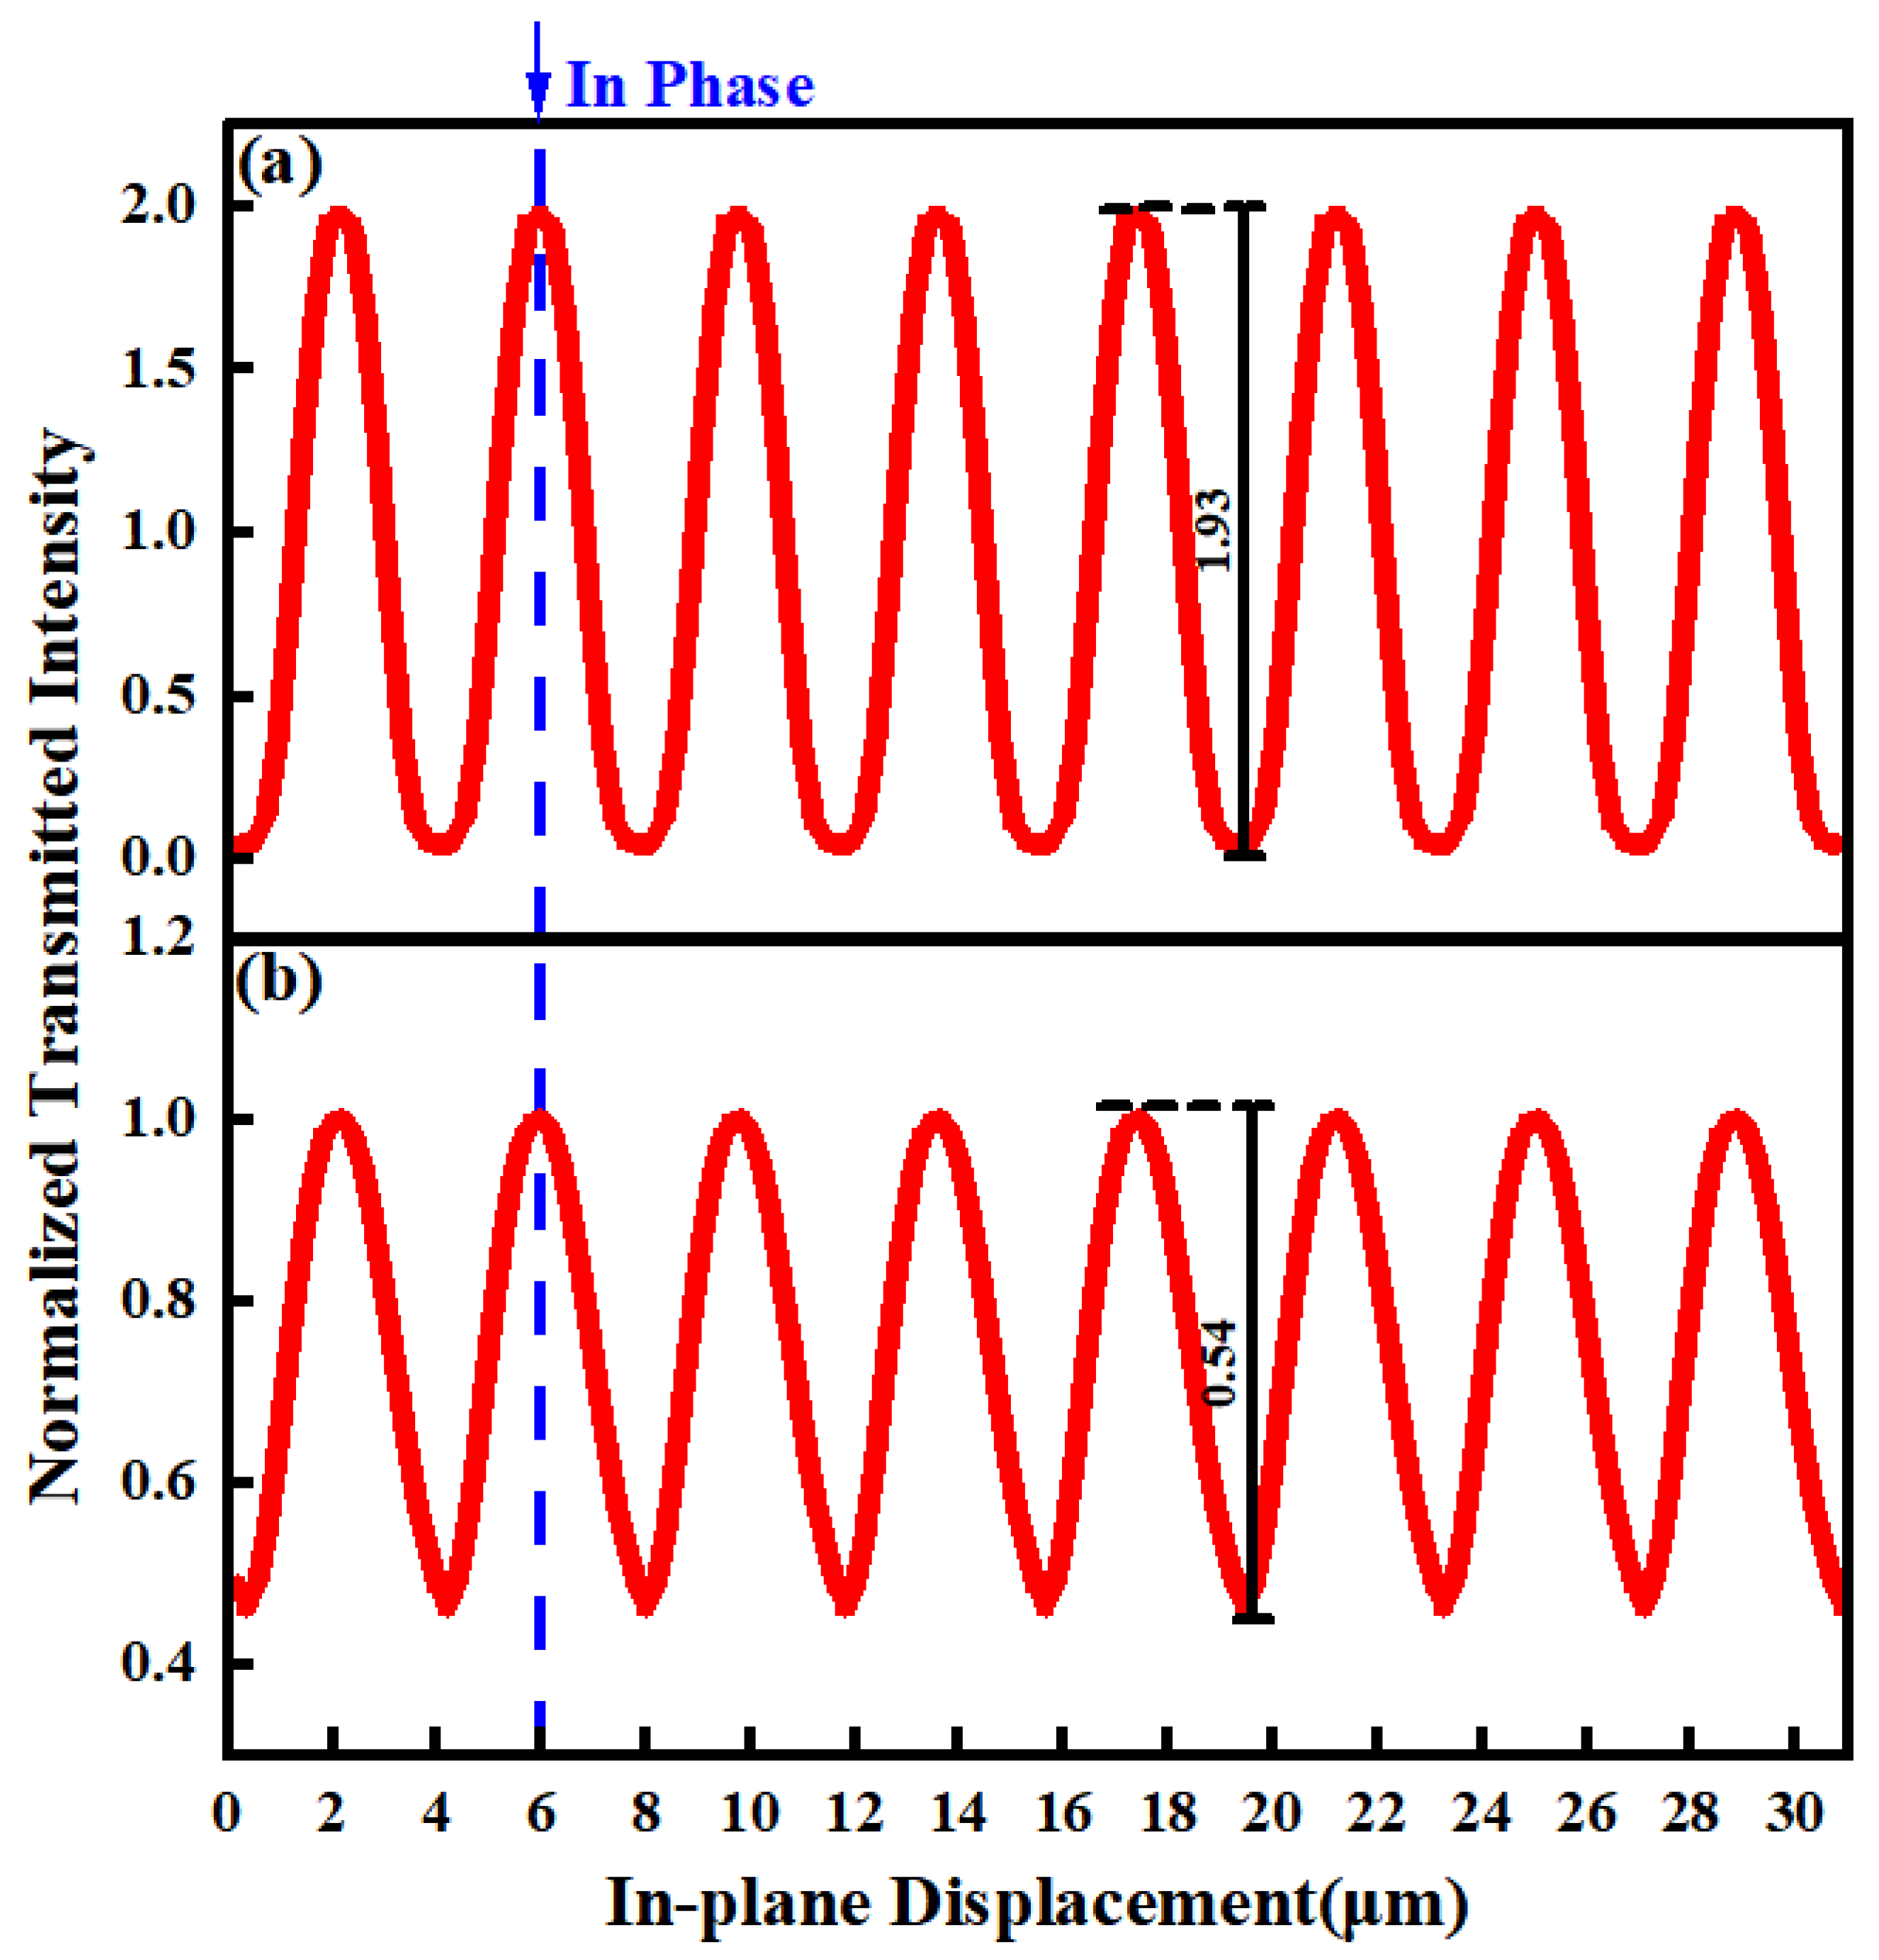
The transmitted intensity with different
θ of 0° and 1° respectively as there is an input linear displacement is shown in
Figure 2. With a relative linear displacement between G1 and G2 along the in-plane direction perpendicular to the grating lines, the transmitted intensity changes sinusoidally with the input displacement in both cases. However, the change of
θ results in a different amplitude. The amplitude of the sinusoidal signal decreases from 1.93 to 0.54 as
θ changing from 0° to 1°. It is worth to mention that, despite the different amplitudes, the sinusoidal signals in the two cases approximatively remains in a same phase with a small rotated angle, which means that the input linear displacement and angle can be distinguished by the phase and amplitude respectively.
4. Experimental
4.1. Self-imaging effect of one single optical grating
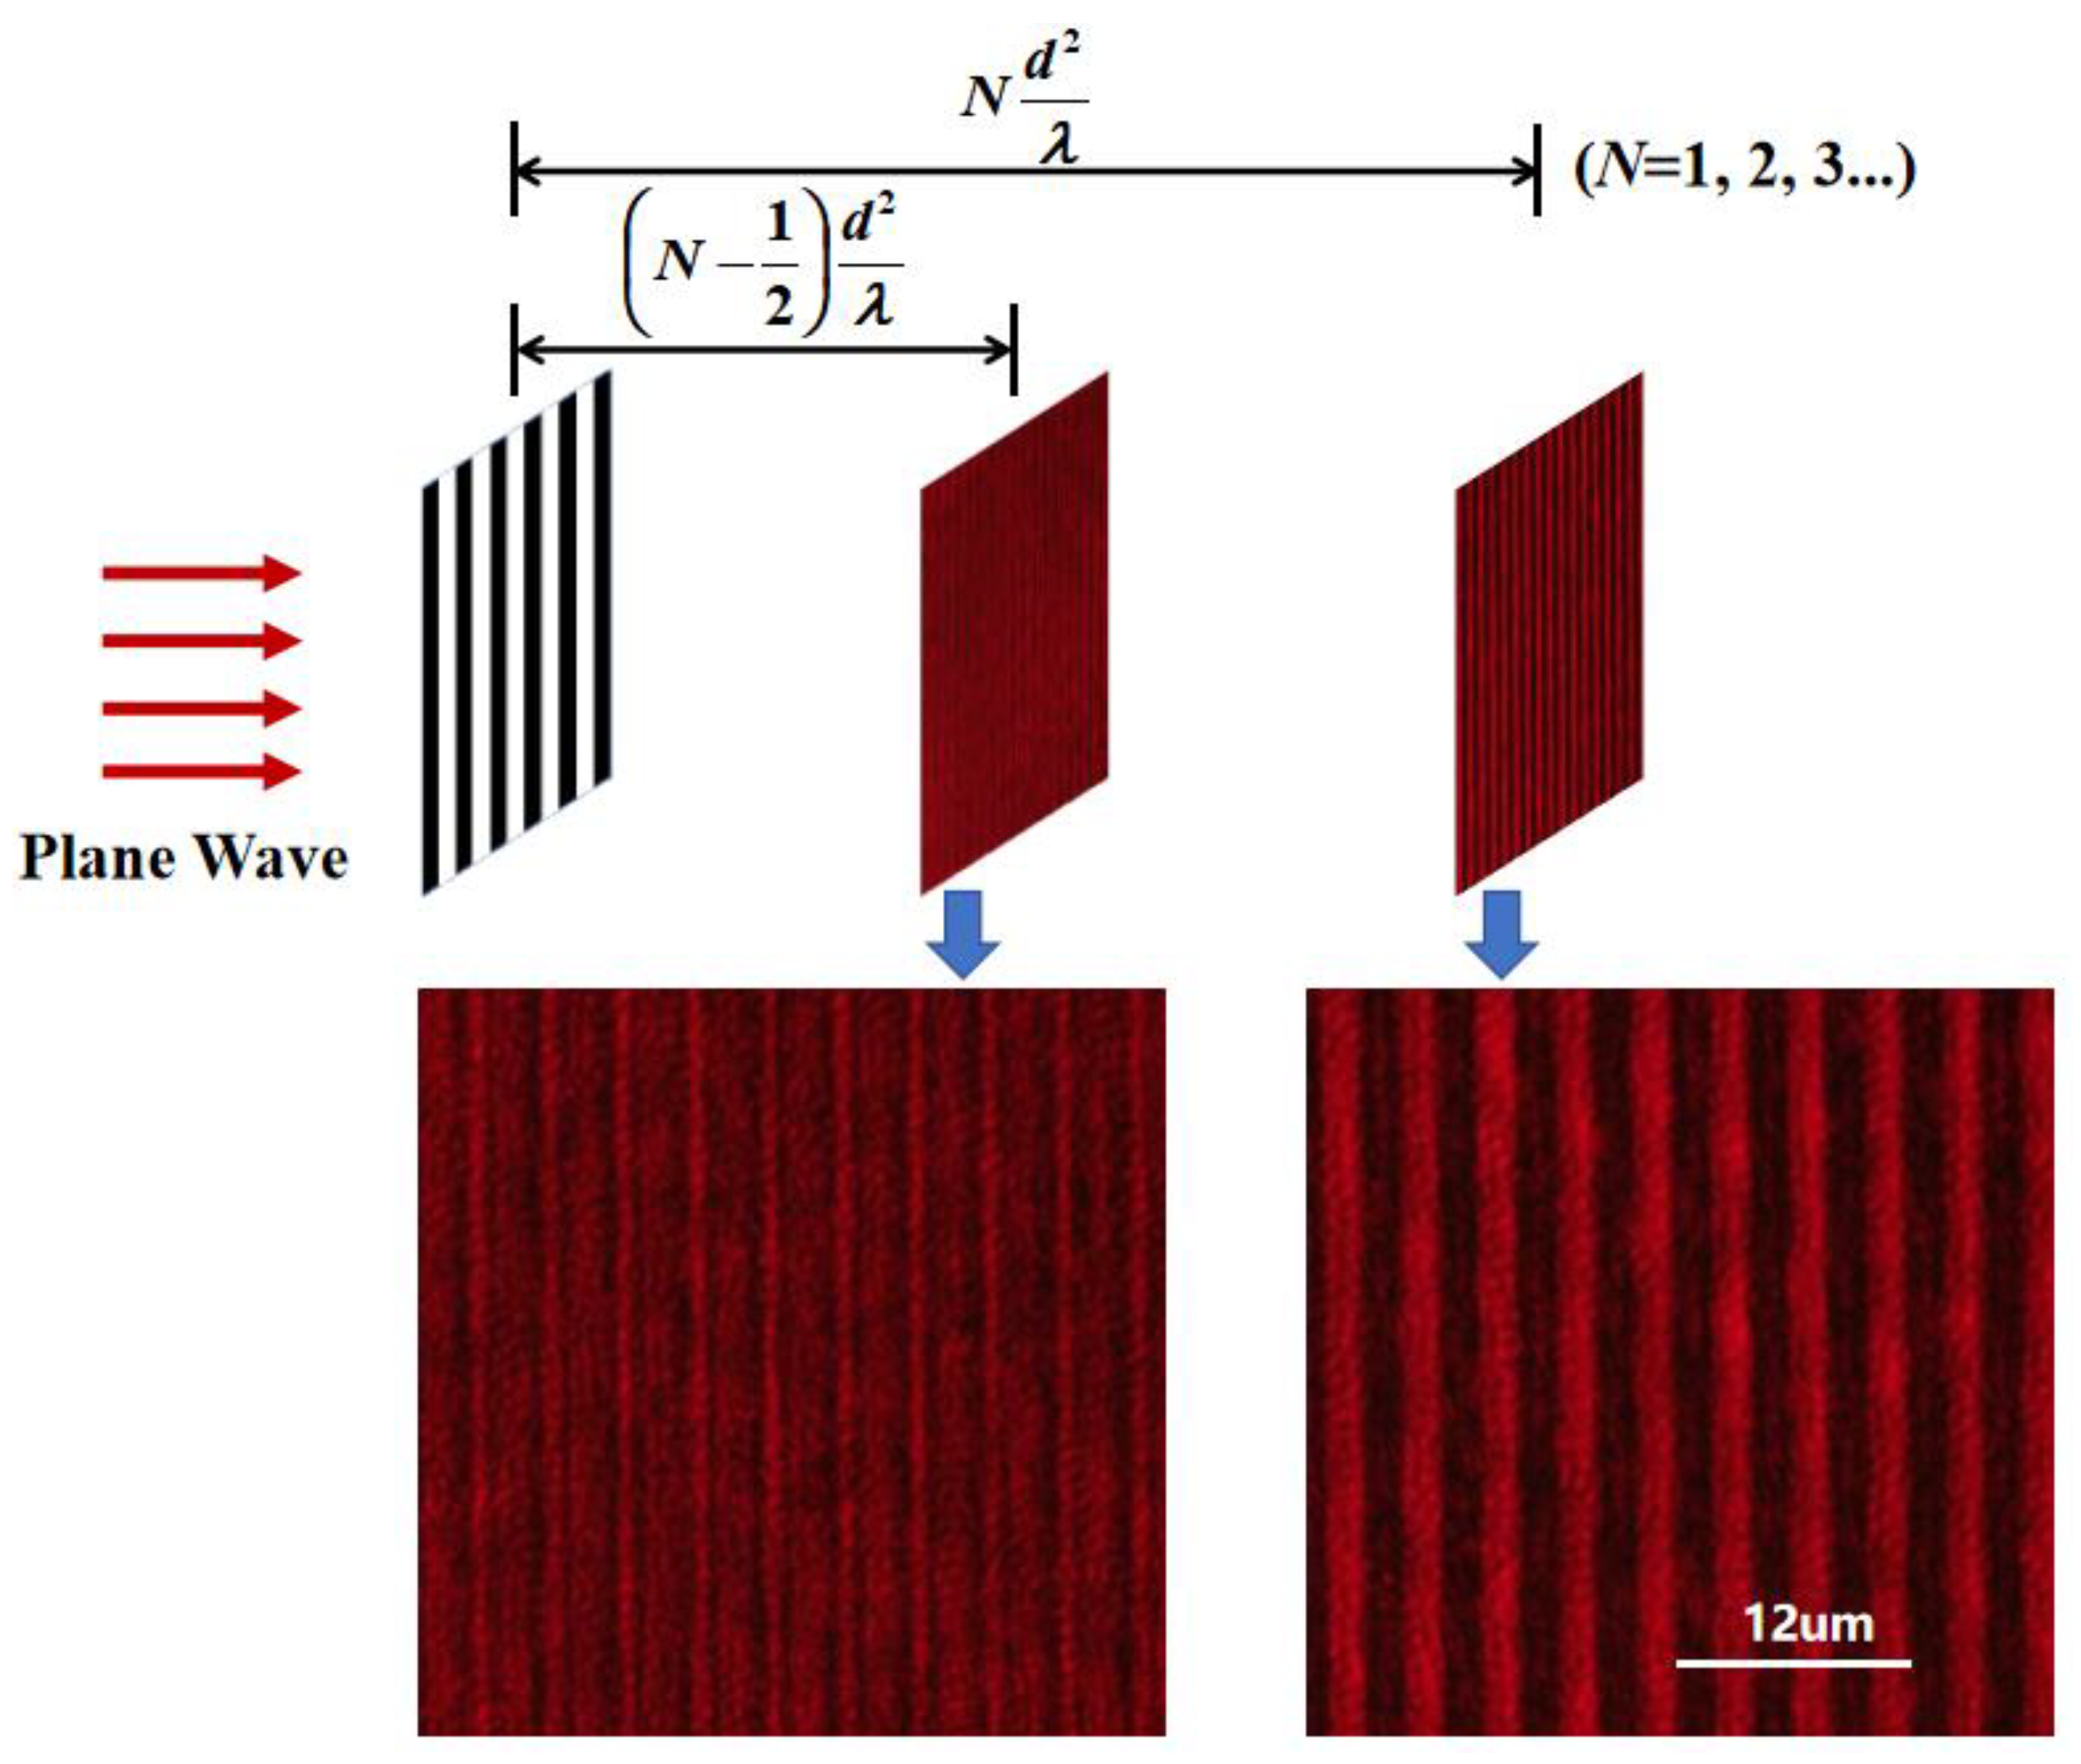
The self-imaging patterns behind a 4μm-period grating is shown in
Figure 3. The wavelength of the input plane wave is 635nm. A microscope system consisted of a 40× object lens and a CCD (M830, Murzider) is located behind the grating. As microscope system moving along the optical axis, the self-imaging patterns as different locations behind the grating can be obtained. Subdivided patterns and self-imaging patterns with period of 2μm and 4μm are obtained at positions of (
N-½)
d2/
λ and
Nd2/
λ (N=1,2,3...) respectively, agreeing with the theoretical analysis of the self-imaging effects [
28].
4.2. Combined displacement and angle measurement with double gratings
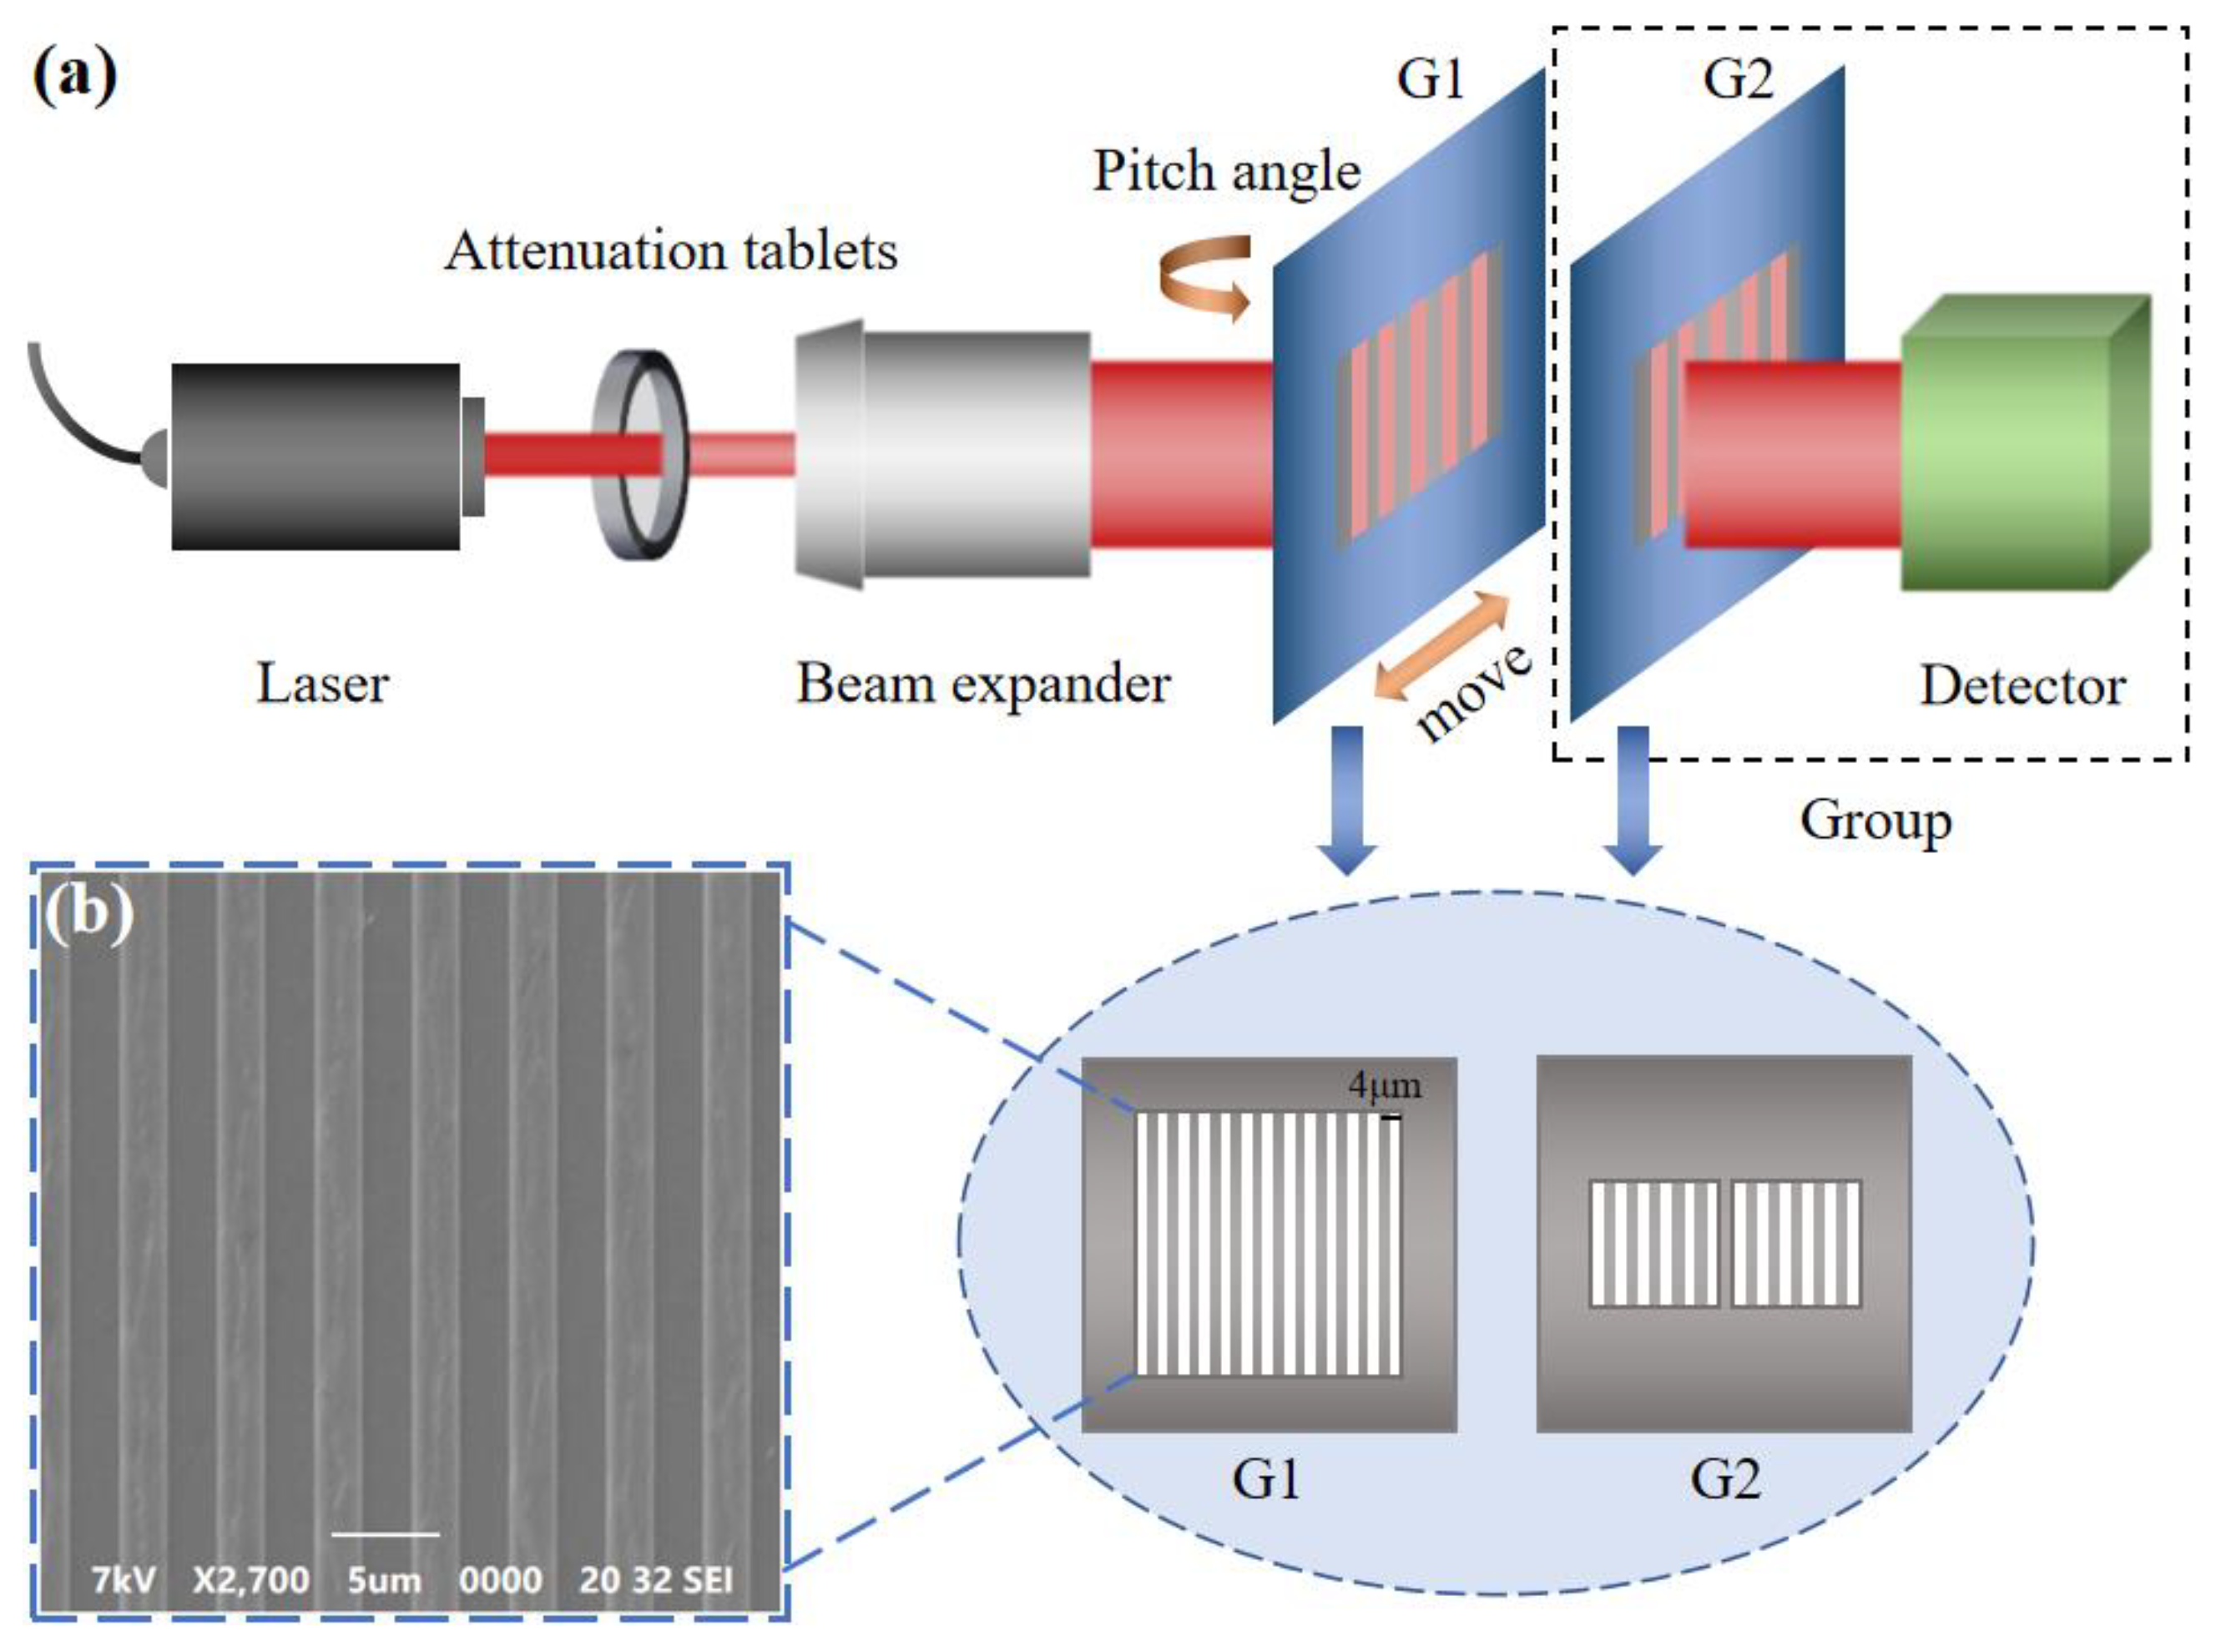
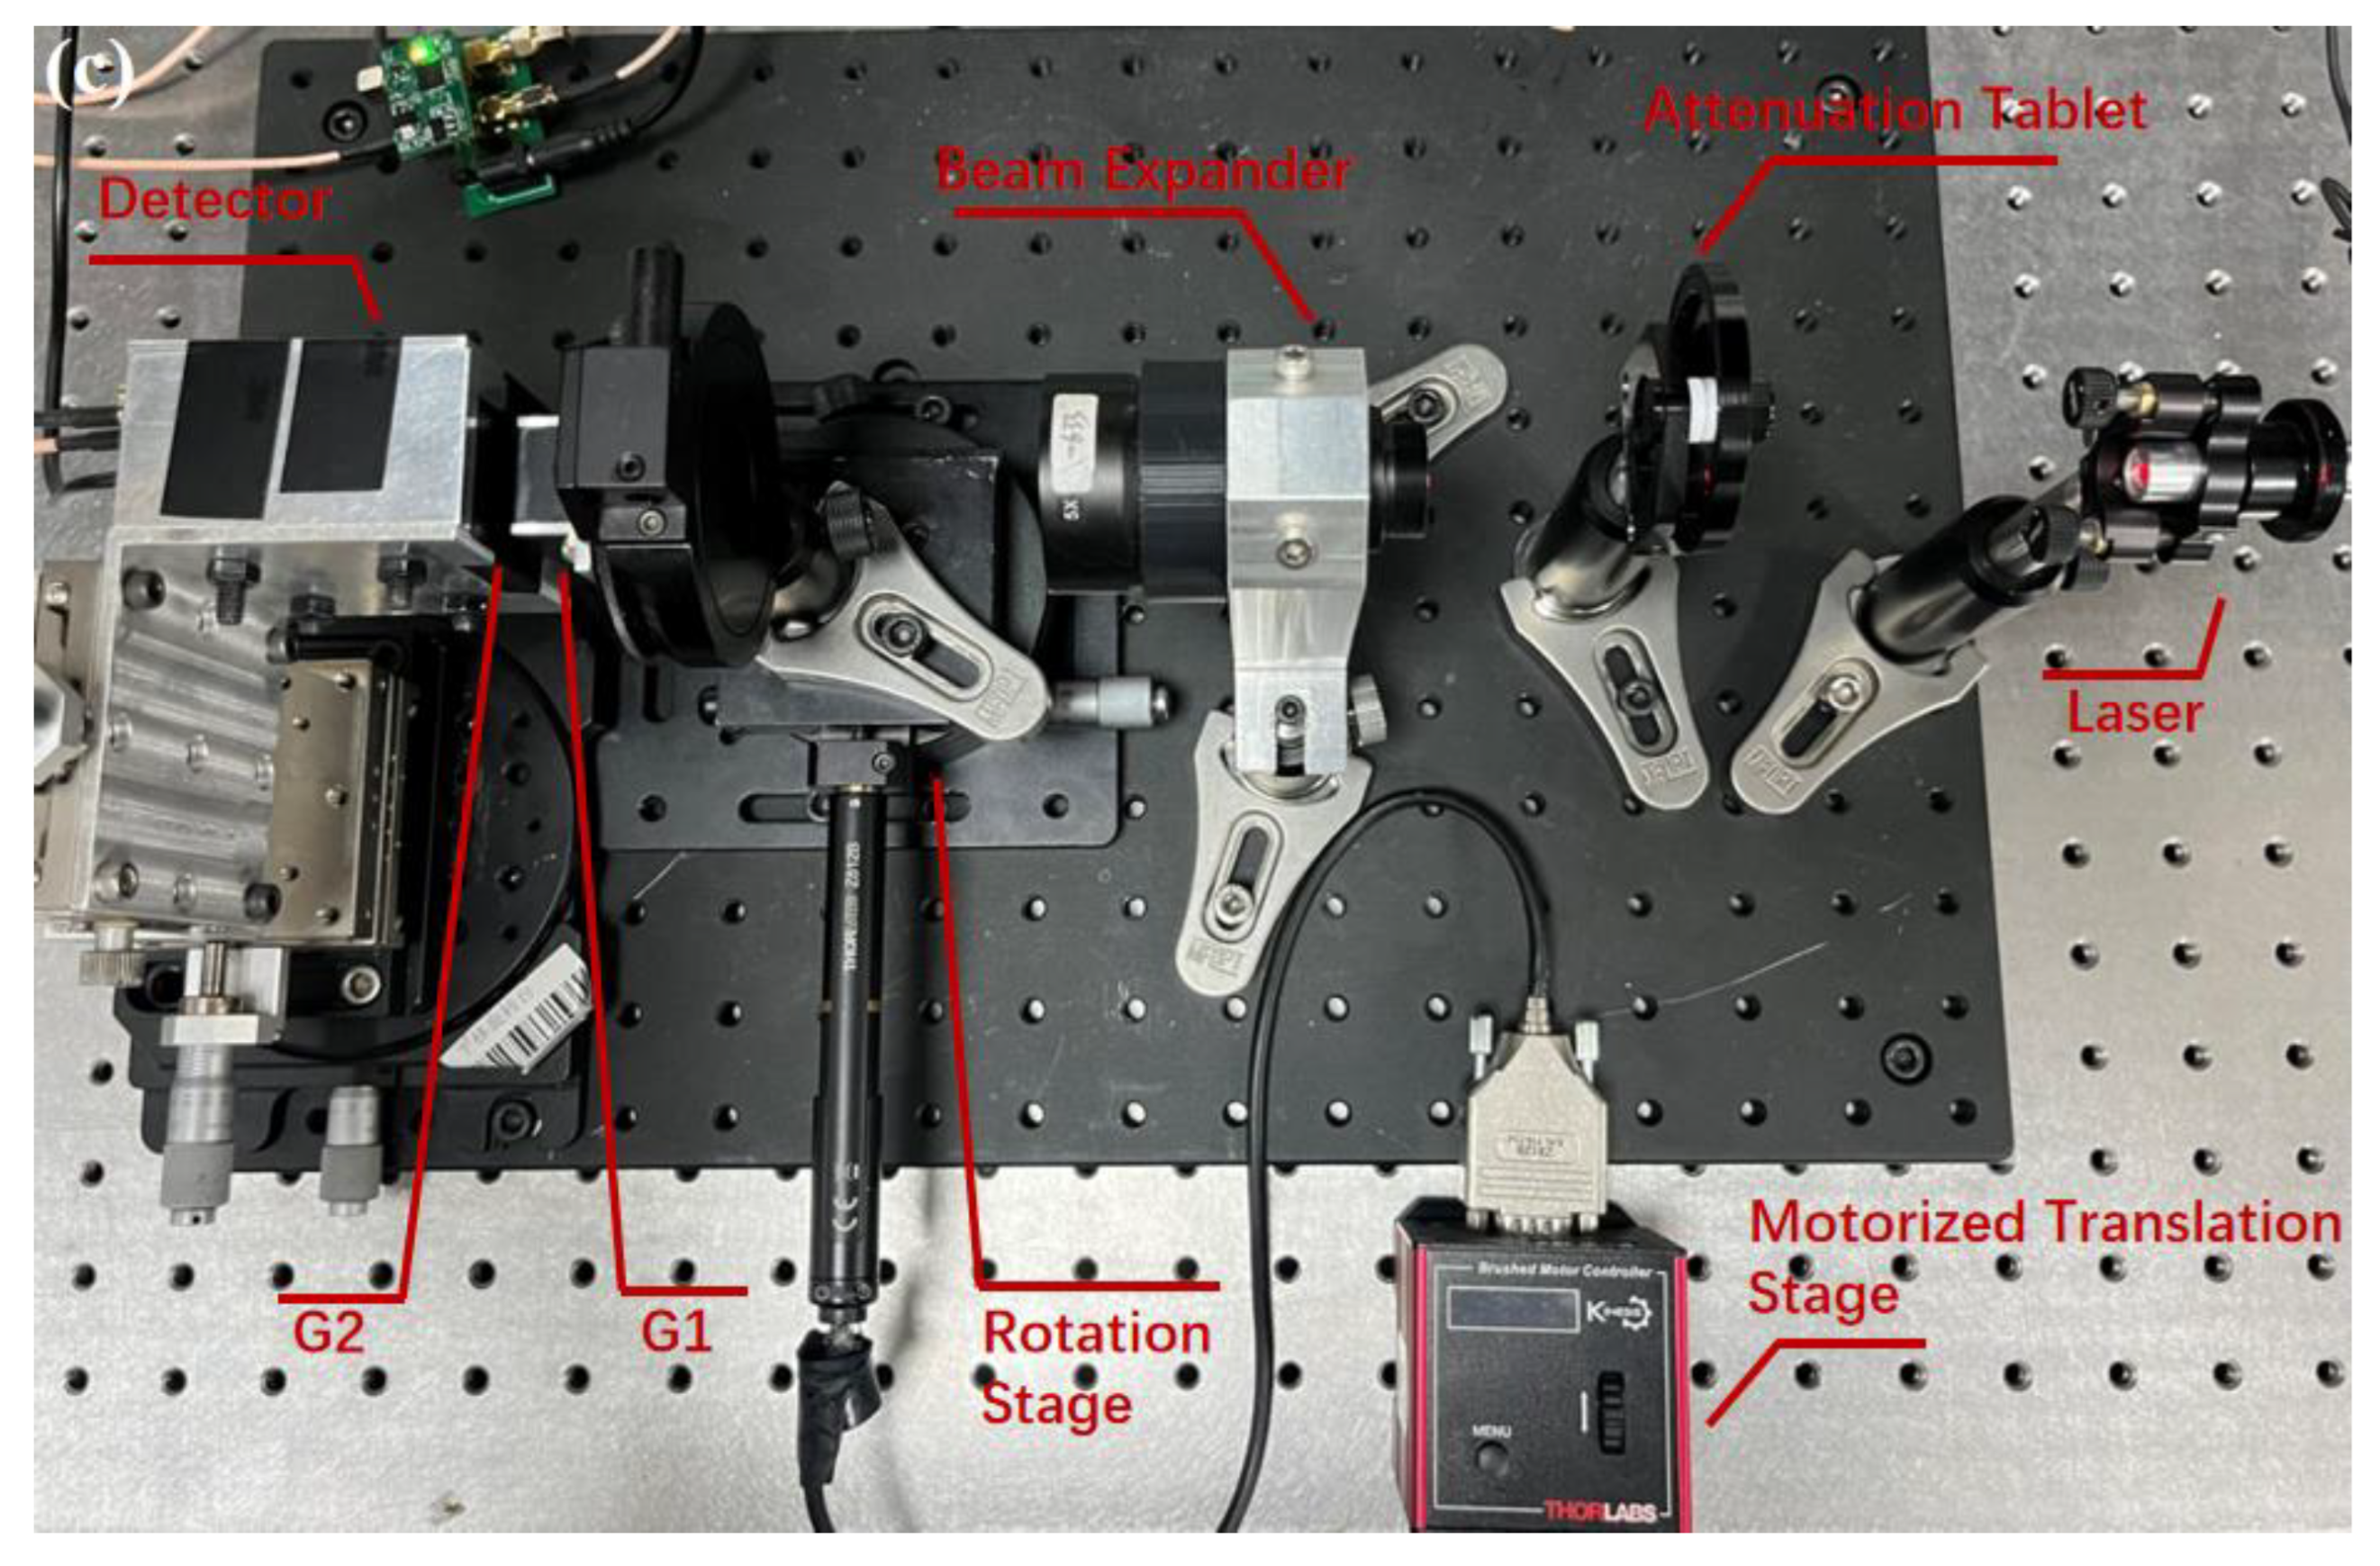
The schematic diagram of the experiment is shown in
Figure 4. The beam with a wavelength of 635nm from the laser (CPS635R, Thorlabs) irradiate onto two gratings. G2 is fabricated in a two-quadrant structure to obtain two sinusoidal signals with a phase difference of 90° [
22]. The gratings are prepared by etching aluminum film with a thickness of 150nm, which is located on a silicon dioxide substrate with a thickness of 500μm. The structure of the grating and the image under electron microscope are shown in
Figure 4(b), scanning electron microscopy image demonstrates a grating period of 4µm and duty ratio is 0.5. A multi-quadrant detector (OSQ100-IC, OTRON) is placed behind G2 to measure the transmitted intensity.
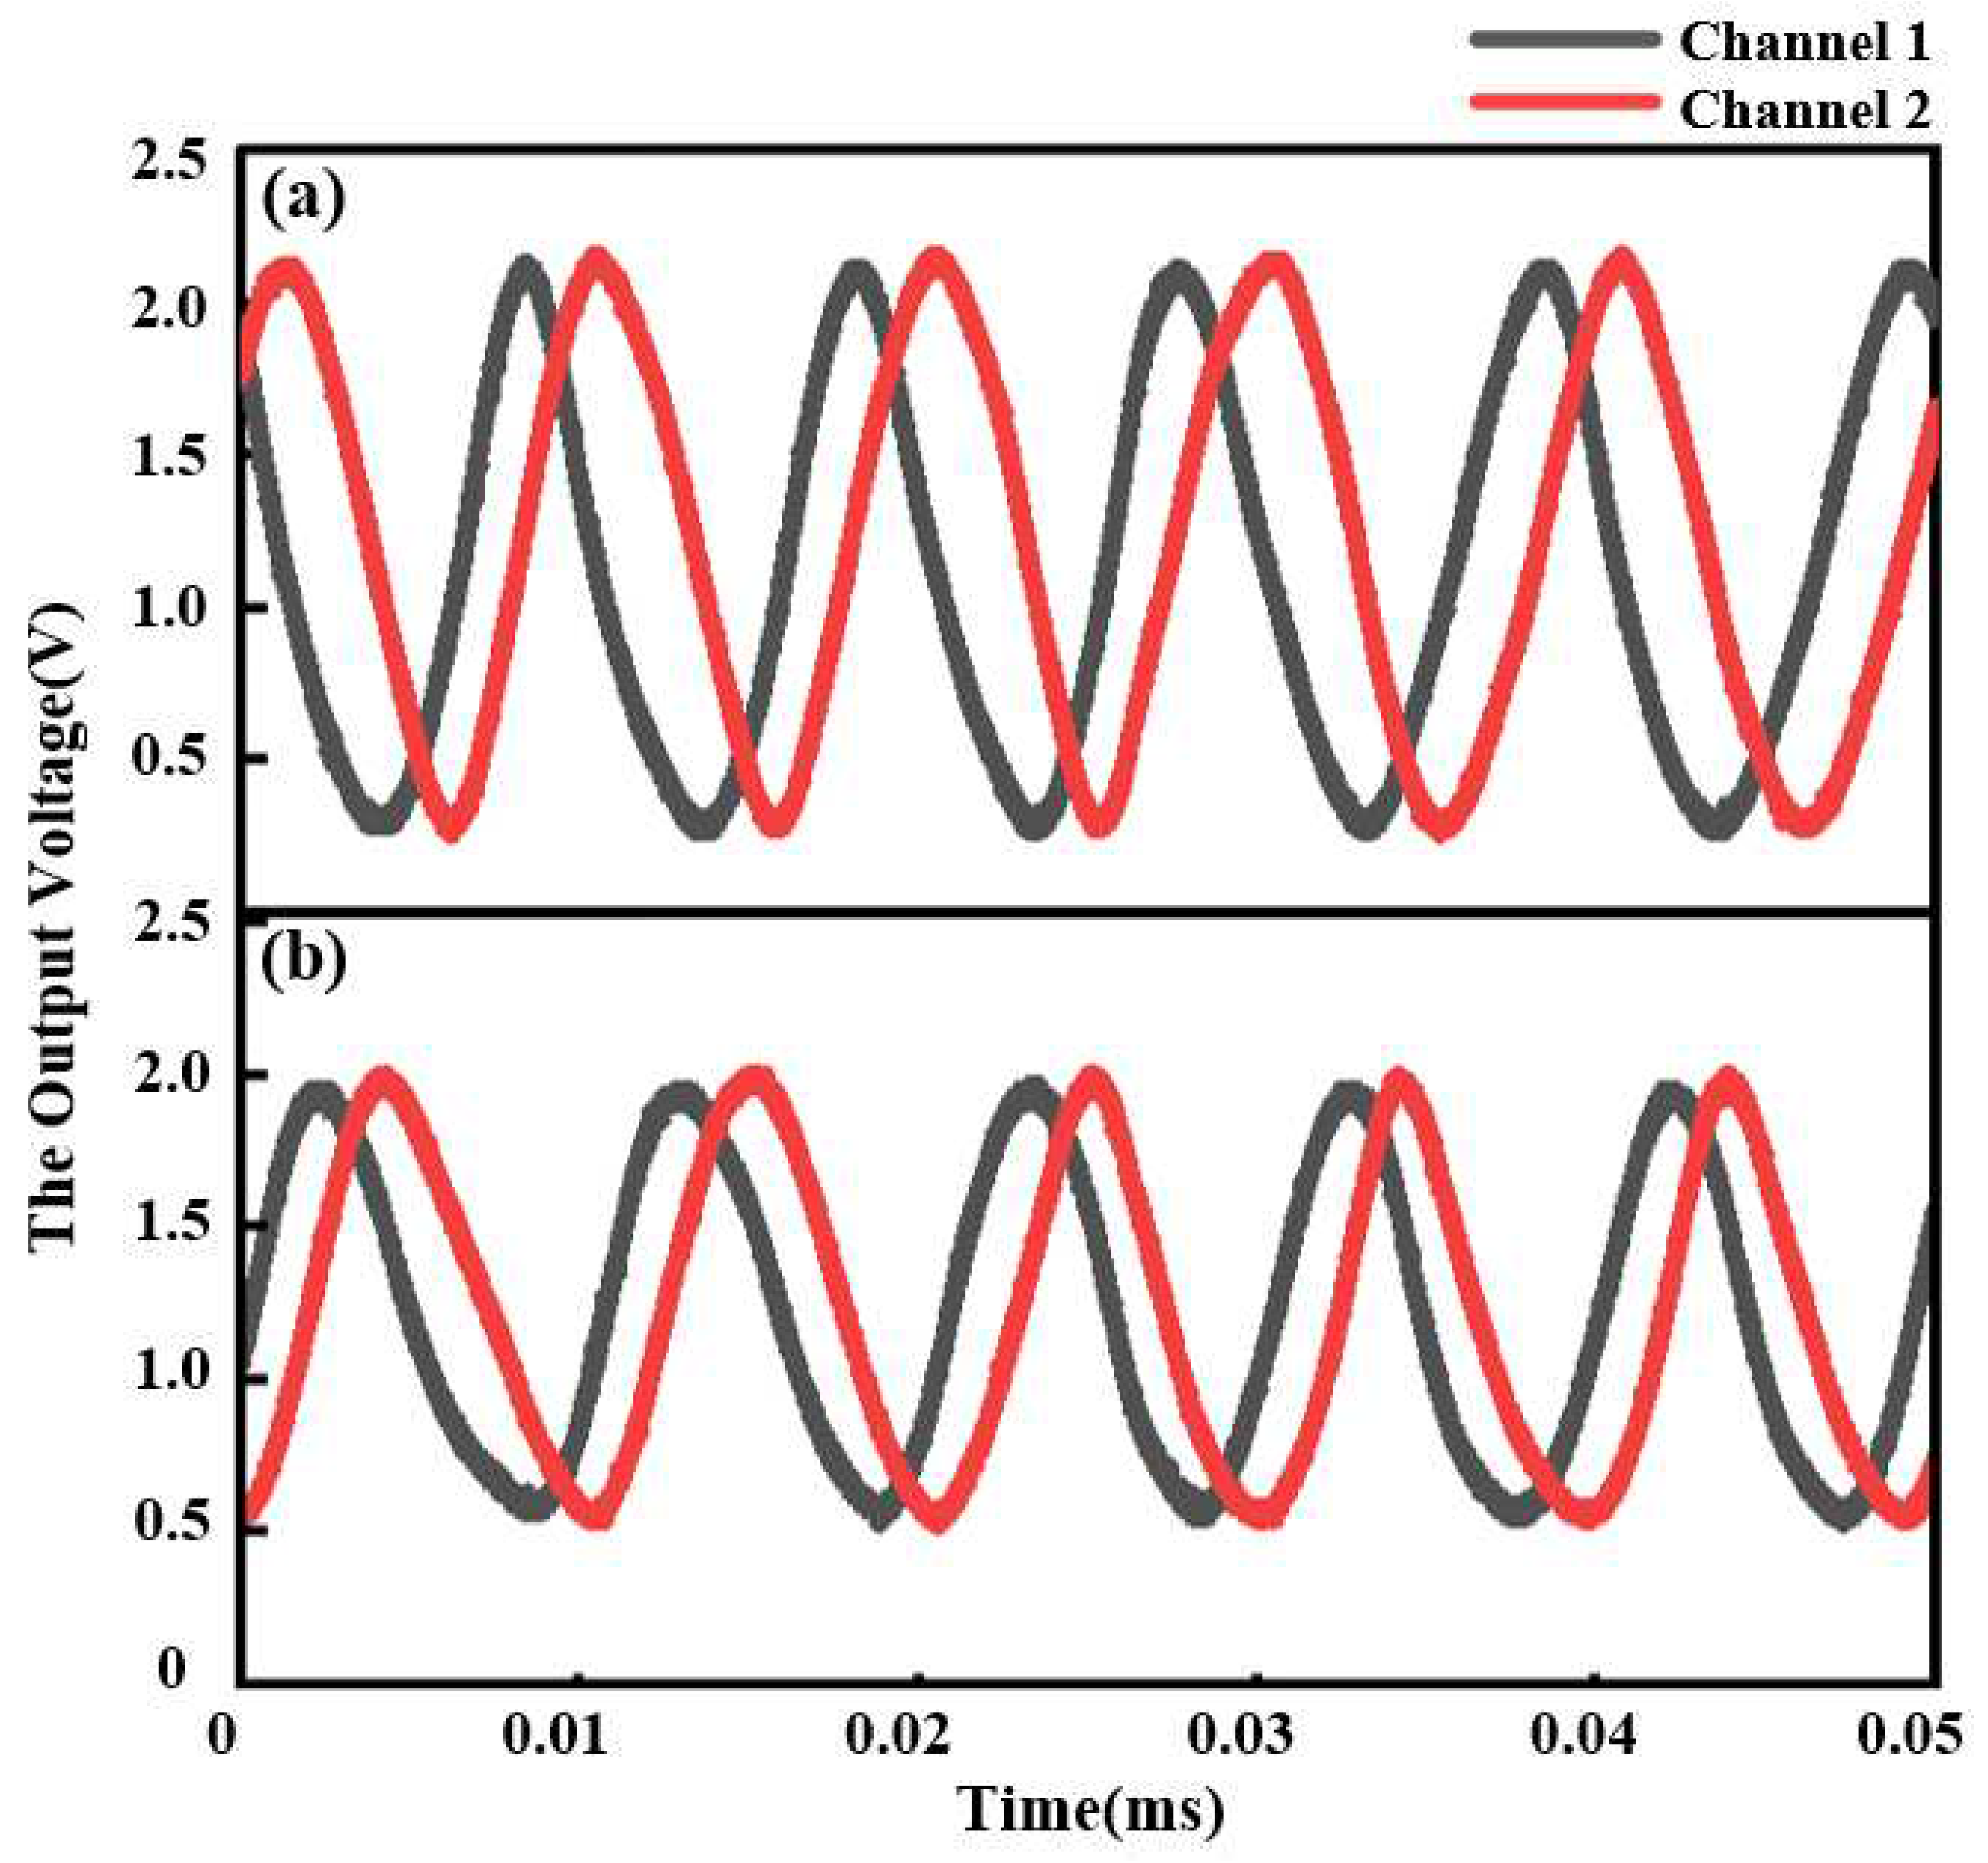
The sinusoidal signals obtained from the multi-quadrant detector with different
θ is shown in
Figure 5. Corresponding to the simulated results mentioned above, the amplitude of the output signals decreases from 1.88V to 1.4V as
θ changing from 0° to 1°. And with a uniform-rate input linear displacement, the phase of the signals changes meanwhile.
Associated with an interpolation circuits with a subdivision factor of 1000, the displacement can be measured by counting the output square signals [
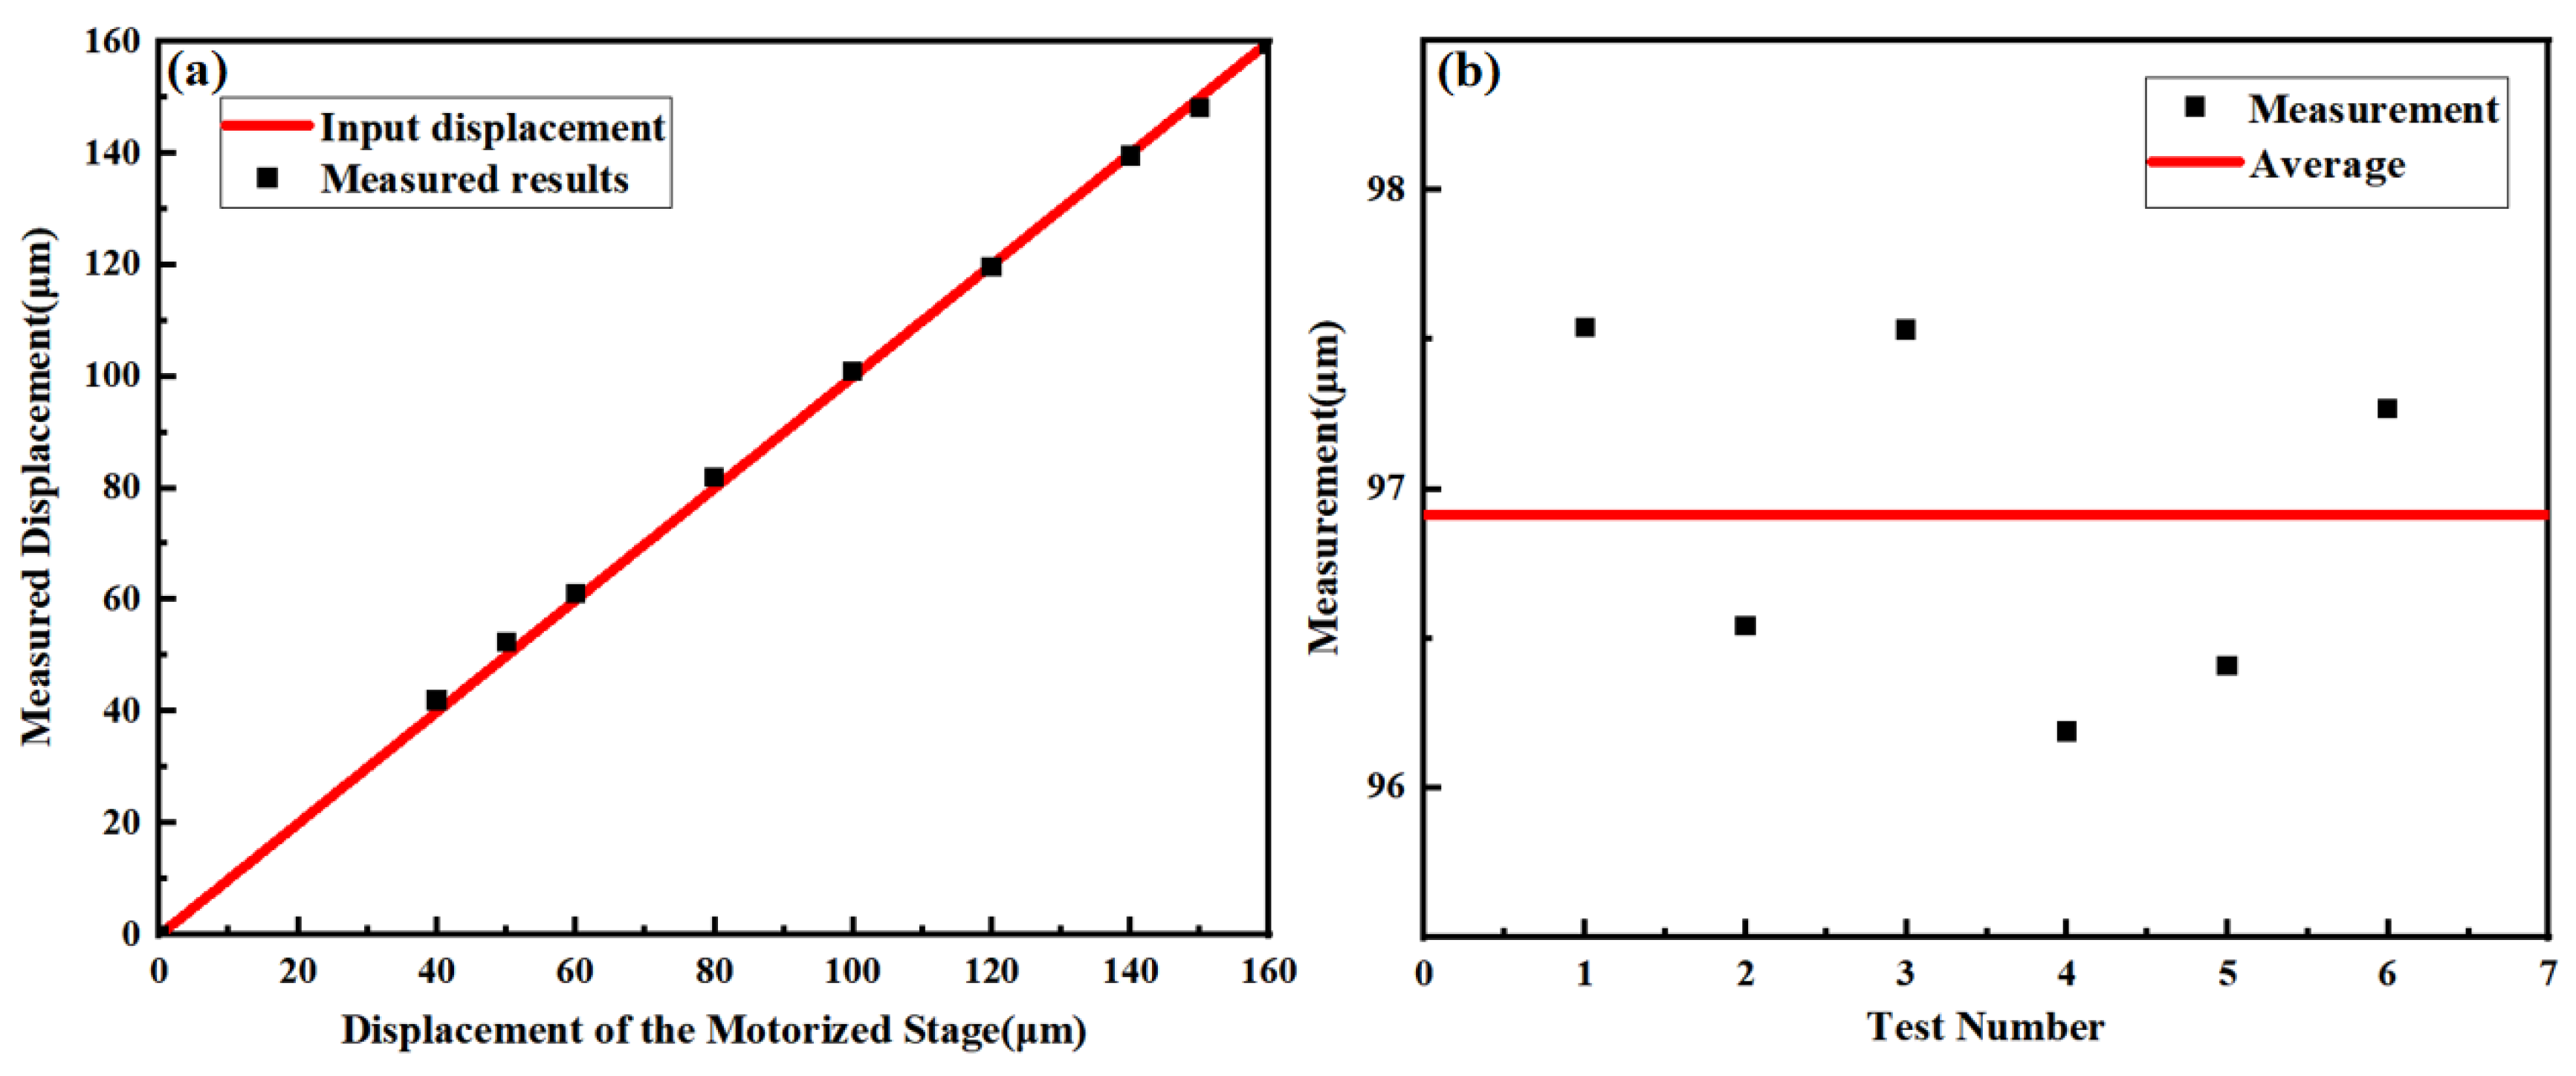
22]. The experimental measured results for linear displacement within a range of 160μm are shown in
Figure 6(a). A motorized translation stage (MT1/M-Z8, Thorlabs) is used to provide a linear displacement. The results show well agreement between the measured results and the input displacement with a maximum error of 2.4μm, which may result from the Abbe error and the environmental vibration. Multiple measurement results shown in
Figure 6(b) indicate an accuracy within ±1μm. Considering the positional repeatability of ±0.7μm for the translation stage used in the experiment, the results show a high accuracy.
According to Eq. (4), the resolution (S) of the displacement measurement can be given by [
22]
where
C is the subdivision factor of the interpolation circuit. As
θ is small, the resolution of the linear displacement is calculated to be around 4µm/1000=4nm.
The relationship between the rotated angle of G1 and the amplitude of the output signal from the detector is shown in
Figure 7. The single-axis rotary table (RSM82-1A, Zolix) used in the experiment enables a rotation with a resolution of 2' within a range of 360°.The results show a downtrend, which agrees with the simulated results. A maximum slope of 0.92V/degree is obtained by a fitting curve with a R2 of 0.98969, resulting in a maximum sensitivity up to 0.26mV/arcsec. Considering the resolution of the voltage detecting of 1mV for the oscilloscope (TBS2204B, Tektronix) used in the experiment, a maximum total resolution of the proposed sensor for angular measurement is calculated to be ~3.85arcsec.
5. Conclusions
In this paper, we proposed a combined sensor for measuring displacement and angle synchronously based on the self-imaging effect of optical microgratings. Using a double-grating structure, the linear displacement and angle can be measured by detecting the change of the phase and amplitude of output sinusoidal signals respectively. Both the simulated and the experimental results show that, the transmitted intensity changes sinusoidally with an input linear displacement. And the amplitude of sinusoidal signals decreases with an increasing rotated angle. Associated with an interpolation circuit with a subdivision factor of 1000, linear displacement and angle measurement with a resolution of 4nm and 3.85arcsec respectively is demonstrated experimentally, which is comparable to methods such as grating diffraction interferometry and photoelectric autocollimation [
29]. Since the measurement of displacement and angle is operated within one single structure, the proposed sensor shows an ultracompact structure. It is worth to mention that, benefitting from the one-single common optical path, there is no significant degradation of accuracy observed in the experiment. By using interpolation circuits with higher subdividing factor and optimizing the location of G2, a better resolution of both the linear displacement and angle measurement may be obtained. The results show the great potential of this sensor for integrated high-precision multi-DOF measurement in applications ranging from lithography machine to precision machine tools.
Author Contributions
Conceptualization, C.X. and M.Z.; methodology, C.X.; software, M.Z.; validation, H.Y. and Q.N.; formal analysis, X.Z. and J.Y.; investigation, B.J.; resources, M.L.; data curation, M.Z.; writing—original draft preparation, M.Z.; writing—review and editing, M.Z.; visualization, C.F.; supervision, C.X.; project administration, C.X. All authors have read and agreed to the published version of the manuscript.
Funding
This research was funded by National Natural Science Foundation of China (no.62375247).
Institutional Review Board Statement
Not applicable.
Informed Consent Statement
Not applicable.
Data Availability Statement
Not applicable.
Acknowledgments
The authors thank Zhiyong Yang for his helpful discussion in the experiment preparation and simulation.
Conflicts of Interest
The authors declare no conflict of interest.
References
- Gao, W.; Kim, S.W.; Bosse, H.; Haitjema, H.; Chena, Y.L.; Lu, X.D.; Knapp, W.; Weckenmann, A.; Estler, W.T.; Kunzmann, H. Measurement technologies for precision positioning. CIRP. Ann. Manuf. Technol. 2015, 64, 773–796. [Google Scholar] [CrossRef]
- Kimura, A.; Gao, W.; Kim, W.; Hosono, K.; Shimizu, Y.; Shi, L.; Zeng, L.J. A sub-nanometric three-axis surface encoder with short-period planar gratings for stage motion measurement. Precis. Eng. 2012, 36, 576–585. [Google Scholar] [CrossRef]
- Zheng, F.; Feng, Q.; Zhang, B.; Li, J. A Method for Simultaneously Measuring 6DOF Geometric Motion Errors of Linear and Rotary Axes Using Lasers. Sensors 2019, 19, 1764. [Google Scholar] [CrossRef] [PubMed]
- Sun, C.; Cai, S.; Liu, Y.; Qiao, Y. Compact Laser Collimation System for Simultaneous Measurement of Five-Degree-of-Freedom Motion Errors. Appl. Sci. 2020, 10, 5057. [Google Scholar] [CrossRef]
- Chang, D.; Xing, X.; Hu, P.; Wang, J.; Tan, J. Double-Diffracted Spatially Separated Heterodyne Grating Interferometer and Analysis on its Alignment Tolerance. Appl. Sci. 2019, 9, 263. [Google Scholar] [CrossRef]
- Zhang, J.; Menq, C.-H. A linear/angular interferometer capable of measuring large angular mation. Meas. Sci. Technol. 1999, 10, 1247–1253. [Google Scholar] [CrossRef]
- Shimizu, S.; Lee, H.-S.; Imai, N. Simultaneous measuring method of table motion errors in 6 degrees of freedom. Int. J. Jpn. S. Prec. Eng. 1994, 28, 273–274. [Google Scholar]
- Kim, J.-A.; Kim, K.-C.; Bae, E.W.; Kim, S.Y.K. Kwak, Six-degree-of-freedom displacement measurement system using a diffraction grating. Rev. Sci. Instrum. 2000, 71, 3214–3219. [Google Scholar] [CrossRef]
- Yin, Y.; Liu, L.; Bai, Y.; Jirigalantu; Yu, H.; Bayanheshig; Liu, Z.; Li, W. Littrow 3D measurement based on 2D grating dual-channel equal-optical path interference. Opt. Express 2022, 30, 41671–41684. [Google Scholar] [CrossRef]
- Hu, P.; Chang, D.; Tan, J.; Yang, R.; Yang, H.; Fu, H. Displacement measuring grating interferometer: a review. Front. Inf. Technol. Electron. Eng. 2019, 20, 631–654. [Google Scholar] [CrossRef]
- Lee, C.B.; Kim, G.-H.; Lee, S.-K. Uncertainty Investigation of Grating Interferometry in Six Degree-of-freedom Motion Error Measurements. Int. J. Precis. Eng. Manuf. 2012, 13, 1509–1515. [Google Scholar] [CrossRef]
- Liu, C.-H.; Cheng, C.-H. Development of a grating based multi-degree-of-freedom laser linear encoder using diffracted light. Sens. Actuat. A-Phys. 2012, 181, 87–93. [Google Scholar] [CrossRef]
- Hsieh, H.-L.; Pan, S.-W. Development of a grating-based interferometer for six-degree-of-freedom displacement and angle measurements. Opt. Express 2015, 23, 2451–2465. [Google Scholar] [CrossRef] [PubMed]
- Yu, H.; Chen, X.; Liu, C.; Cai, G.; Wang, W. A survey on the grating based optical position encoder. Opt. Laser Technol. 2021, 143. [Google Scholar] [CrossRef]
- Li, X.; Gao, W.; Muto, H.; Shimizu, Y.; Ito, S.; Dian, S. A six-degree-of-freedom surface encoder for precision positioning of a planar motion stage. Precis. Eng. 2013, 37, 771–781. [Google Scholar] [CrossRef]
- Wang, S.; Luo, L.; Zhu, J.; Shi, N.; Li, X. An Ultra-Precision Absolute-Type Multi-Degree-of-Freedom Grating Encoder. Sensors 2022, 22, 9047. [Google Scholar] [CrossRef] [PubMed]
- Yu, K.; Zhu, J.; Yuan, W.; Zhou, Q.; Xue, G.; Wu, G.; Wang, X.; Li, X. Two-channel six degrees of freedom grating-encoder for precision-positioning of sub-components in synthetic-aperture optics. Opt. Express 2021, 29, 21113–21128. [Google Scholar] [CrossRef] [PubMed]
- Matsukuma, H.; Ishizuka, R.; Furuta, M.; Li, X.; Shimizu, Y.; Gao, W. Reduction in Cross-Talk Errors in a Six-Degree-of-Freedom Surface Encoder. Nanomanuf. Metrol. 2019, 2, 111–123. [Google Scholar] [CrossRef]
- Goloborodko, A.A. Effect of random grating pit displacements on the Talbot image. J. Opt. Soc. AM. B. 2022, 39, 1021–1026. [Google Scholar] [CrossRef]
- Rodriguez-Montero, P.; Sanchez-de-La-Llave, D.; Mansurova, S. Electro-optical processor for measuring displacement employing the Talbot and the nonsteady-state photo-electromotive force effects. Opt. Lett. 2014, 39, 104–107. [Google Scholar] [CrossRef]
- Agarwal, S.; Shakher, C. In-plane displacement measurement by using circular grating Talbot interferometer. Opt. Lasers Eng. 2015, 75, 63–71. [Google Scholar] [CrossRef]
- Xin, C.; Yang, Z.; Qi, J.; Niu, Q.; Ma, X.; Fan, C.; Li, M. Ultra-compact displacement and vibration sensor with a sub-nanometric resolution based on Talbot effect of optical microgratings. Opt. Express 2022, 30, 40009–40017. [Google Scholar] [CrossRef] [PubMed]
- Liu, Q.; Ohba, R. Effects of unparallel grating planes in Talbot interferometry. Appl. Opt. 1999, 38, 4111–4116. [Google Scholar] [CrossRef] [PubMed]
- Wang, A.; Gill, P.; Molnar, A. Light field image sensors based on the Talbot effect. Appl. Opt. 2009, 48, 5897–5905. [Google Scholar] [CrossRef] [PubMed]
- Yang, Z.; Ma, X.; Yu, D.; Cao, B.; Niu, Q.; Li, M.; Xin, C. An Ultracompact Angular Displacement Sensor Based on the Talbot Effect of Optical Microgratings. Sensors 2023, 23, 1091. [Google Scholar] [CrossRef] [PubMed]
- Wronkowski, L. Diffraction model of an optoelectronic displacement measuring transducer. Opt. Laser Technol. 1995, 27, 81–88. [Google Scholar] [CrossRef]
- Zhang, Z.; Lei, B.; Zhao, G.; Ban, Y.; Da, Z.; Wang, Y.; Ye, G.; Chen, J.; Liu, H. Distance and depth modulation of Talbot imaging via specified design of the grating structure. Opt. Express 2022, 30, 10239–10250. [Google Scholar] [CrossRef] [PubMed]
- Teng, S.; Tan, Y.; Cheng, C. Quasi-Talbot effect of the high-density grating in near field. J. Opt. Soc. Am. A. Opt. Image. Sci. Vis. 2008, 25, 2945–2951. [Google Scholar] [CrossRef]
- Zhang, C.; Duan, F.; Fu, X.; Liu, C.; Liu, W.; Su, Y. Dual-axis optoelectronic level based on laser auto-collimation and liquid surface reflection. Opt. Laser Technol. 2019, 113, 357–364. [Google Scholar] [CrossRef]
|
Disclaimer/Publisher’s Note: The statements, opinions and data contained in all publications are solely those of the individual author(s) and contributor(s) and not of MDPI and/or the editor(s). MDPI and/or the editor(s) disclaim responsibility for any injury to people or property resulting from any ideas, methods, instructions or products referred to in the content. |
© 2023 by the authors. Licensee MDPI, Basel, Switzerland. This article is an open access article distributed under the terms and conditions of the Creative Commons Attribution (CC BY) license (http://creativecommons.org/licenses/by/4.0/).


