1. Introduction
Plastic debris has been dumped into the ocean and spread, resulting in microplastic (MP) pollution [
1,
2,
3,
4,
5]. Reflecting commercial plastic production volume, MP consists mainly of polyethylene (PE), polypropylene (PP) and polystyrene (PS) particles. There is concern that the presence of large quantities of MP poses a risk to marine ecosystems. Of particular concern are the various additives contained in plastics [
6,
7,
8,
9]. Recently Z. Tian et al. reported that tire rubber–derived N-(1,3-dimethylbutyl)-N′-phenyl-p-phenylenediamine (6PPD) induced acute mortality in coho salmon [
10]. In studying the ecological impact of MPs, how much of the additives they contain are leached out during MP formation? How are the chemical structures of additives changed? Also, how does the additive behavior of different plastics differ during MP formation? These questions need to be addressed.
The primary location of MP formation is considerably complicated. One group was formed on land and another in the sea. In addition, the mechanisms of MP formation on land and sea were different [
11]. Delamination was observed on the surface of MPs retrieved from the seashore. On the other hand, no delamination marks but abrasion patch structure occurred on MP surface retrieved from riverside [
11]. The delamination part becomes a much smaller MP, which is released into the sea. Although the MPs are formed both of on land and in the sea, it is considered that they are primarily produced in the sea and its surroundings. The reference sample formed in the sea would be more suitable than that formed on land for studying the behavior of UVA leaching and alteration during MP formation. The delamination has been performed in water by exposure to visible and/or UV light to obtain MP reference samples by many researchers [
12,
13,
14]. Similarly, in our previous study, a photodegradation test of PP film was performed in water with a specific photocatalyst under visible light irradiation, and MP reference samples were obtained by planar delamination [
15]. MP formation has been certainly associated with autoxidation and water. However, these rates of MP production by light irradiation were very slow even with the photocatalyst. To study the comparison of additive behavior on different plastics during MP formation, it was necessary to develop an accelerated MP production method [
16,
17]. In our previous study [
18], PP degradation was performed in seawater using sulfate ion radical (SO
4•
−), where SO
4•
− acts as a highly efficient initiator for the degradation of the plastic. The combination of seawater and the SO
4•
− initiator resulted in the excellent acceleration of the degradation process under pH control. This combination is also effective against accelerated degradation of other C-C bonded polymers such as PE and PS, which share the same degradation mechanism (autoxidation).
In this study, the quality-changed behavior of UVA (UV-326) in PP, HDPE, LDPE, PLA and PS over time during degradation was studied with a novel degradation method (EDM) using sulfate ion radical in seawater. The UVA concentration in these polymers was measured by pyrolysis gas chromatography/mass spectrometry (Py-GC/MS). The UVA structural changes were confirmed by FT-IR measurements.
2. Materials and Methods
2.1. Materials
PP was supplied by Prime Polymer Co., Ltd. (product name: J-700GP). The Melt Flow Rate (MFR) and density were 8 g/10min and 0.9 g/cm3. PLA was supplied by Mitsui Chemicals, Inc. (production name: Gread H-100). The weight-average molecular weight (Mw) and molecular weight distribution (Mw/Mn) were 1.2×10⁵ and 1.1, respectively. PS was purchased from Sigma-Aldrich Co. LLC. The weight-average molecular weight (MW) and molecular weight distribution (Mw/Mn) were 3.5×10⁵ and 2.1, respectively. HDPE and LDPE were purchased from Sigma-Aldrich Co. LLC. The melt index (190°C/2.16kg) values of HDPE and LDPE were 10 g/10 min and 25 g/10 min, respectively. Bumetrizole (UVA: UV-326) and potassium persulfate (K2S2O8) were purchased from Wako Pure Chemical Industries. Sea water was prepared with Gex artificial saltwater purchased from Amazon.co.jp.
2.2. Preparation of polymer samples containing ultraviolet light absorber (UVA)
The polymer and UVA blend was prepared by an Imoto Seisakusyo IMC-1884 melting mixer. The polymer pellets (ca. 5 mm) and bumetrizole fine particles (ca. 0.01×0.1 mm) were employed as polymer and UVA, respectively. The 2 g-powdery of polymer sample and 0.1 g-UVA were put into a 50 ml glass vessel and then were premixed. The mixture was put into the melting mixer, and melt mixing was performed at 180 °C at 50 rpm for 6 min. The obtained sample was molded into the film (ca. 50×50×0.075 mm) by compression molding at 180 °C under 10 MPa for 5 min. The film was cut into 5×5×0.075 mm and was employed as polymer film containing 5-phr UVA. For PS samples, 10-phr UVA-containing films were also prepared.
2.3. Enhanced degradation method
The degradation was performed in seawater using sulfate ion radical. The procedure was according to reports 15, 26. 1) Five pieces of each film were put into a 100 ml glass vessel containing with a 20 ml of seawater solution with 0.54 g K2S2O8 at ca. 65 °C for 12 h under stirring with a stirrer tip speed of ca. 100 rpm. 2) The equal amount of K2S2O8 seawater solution was added to compensate for the consumption of oxidant, and its degradation was carried out for 12 h under the same conditions. 3) The five pieces of the film were then transferred to a new 100 ml glass vessel containing 20 ml of seawater solution with 0.54 g K2S2O8, and the degradations were started again under the same conditions. The enhanced degradation method was carried out for a predetermined number of 15 days using 1) to 3) as one set (Total 15 sets). The pH value of the solution was changed from 8.2 to 3 during each set.
2.4. Fourier Transform Infrared (FT-IR) analysis
The IR spectra 16 scans were measured with an FT-IR spectrometer (Jasco FT-IR 660 plus) at a resolution of 4 cm−1 over the full mid-IR range (400-4000 cm−1). The carbonyl index (CI) of PP was calculated as the band intensity ratio of carbonyl group (ca. 1715 cm−1)/scissoring CH2 group (ca. 1450 cm−1), and that of PS was done using the carbonyl group (ca. 1715 cm−1) / symmetric CH2 stretching group (ca. 2850 cm−1) band intensity ratio.
2.5. Pyrolysis Gas Chromatography/Mass (Py-GC/MS) spectroscopy measurement and creation of calibration curve
Multi-functional pyrolyzer (Frontier Labs., EGA/PY-3030D) is attached to a GC/MS spectroscopy (SHIMADZU, GCMS-QP2010 PLUS). The measurement was employed with 100 g sample. The pyrolysis was performed at 550 °C. Helium was used as the carrier gas for the capillary column with a flow-rate of 1.0 mL/min. The MS system was operated under electron ionization mode at 70 eV.
The UVA (UV-326) concentration in various polymers were measured by the Py-GC/MS. As shown in
Figure S1, the UVA peak appears at a retention time of 23.5 to 24.5 min. The area ratio calculated by dividing the peak area by the total area was plotted against known UVA concentrations to create a calibration curve (see
Figure S2). The UVA concentrations in various polymers at the time of degradation were calculated using this calibration curve based on area ratios obtained from the py-GC/MS measurements.
2.6. Scanning electron microscope (SEM) with energy dispersive X-ray spectroscopy analysis
The SEM / EDX analysis was carried out with a JSM-7500FAM (JEOL) with 5.0 kV. The working distance was about 3×4 mm. Samples were placed in dried oven maintained at 27 °C for 30 min and were sputter-coated with gold before SEM imaging.
3. Results and Discussion
3.1. Homogeneous degradation behavior
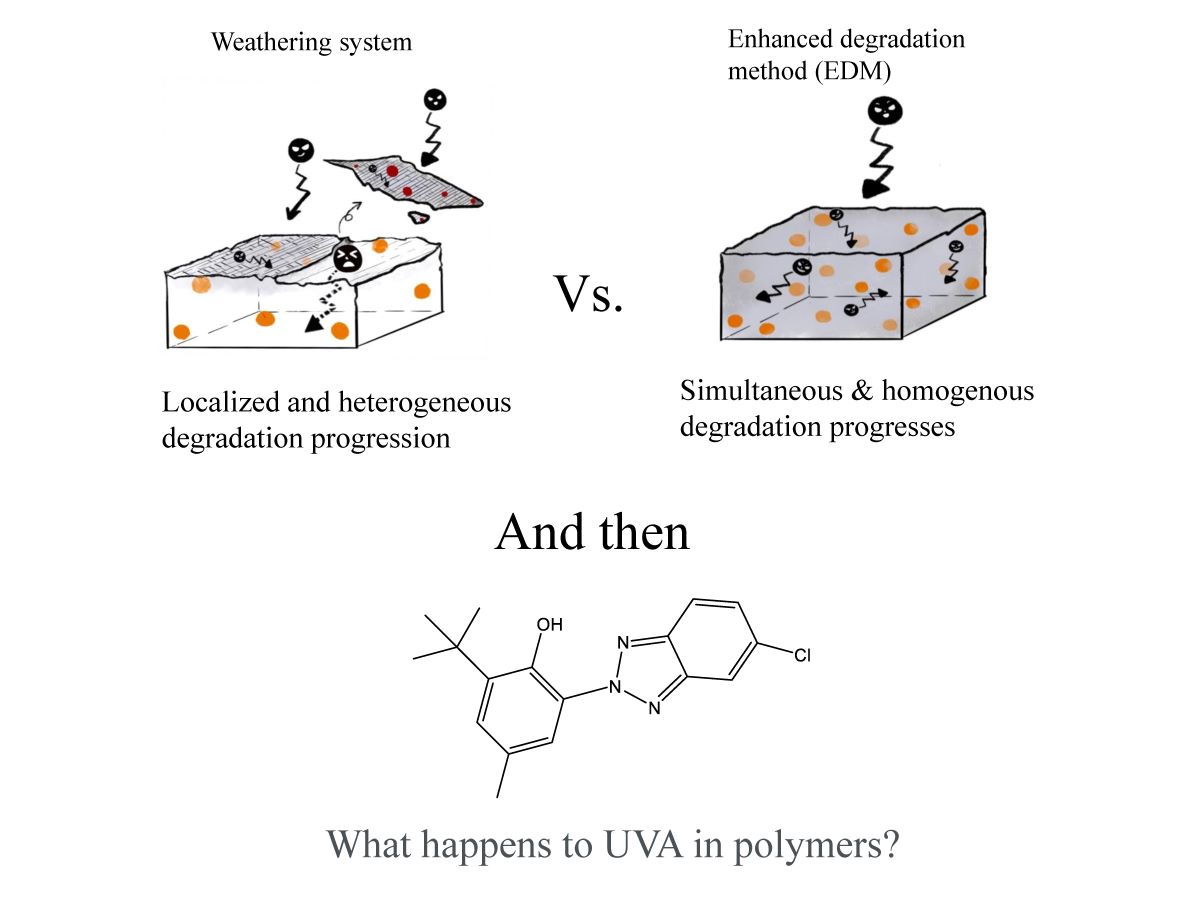
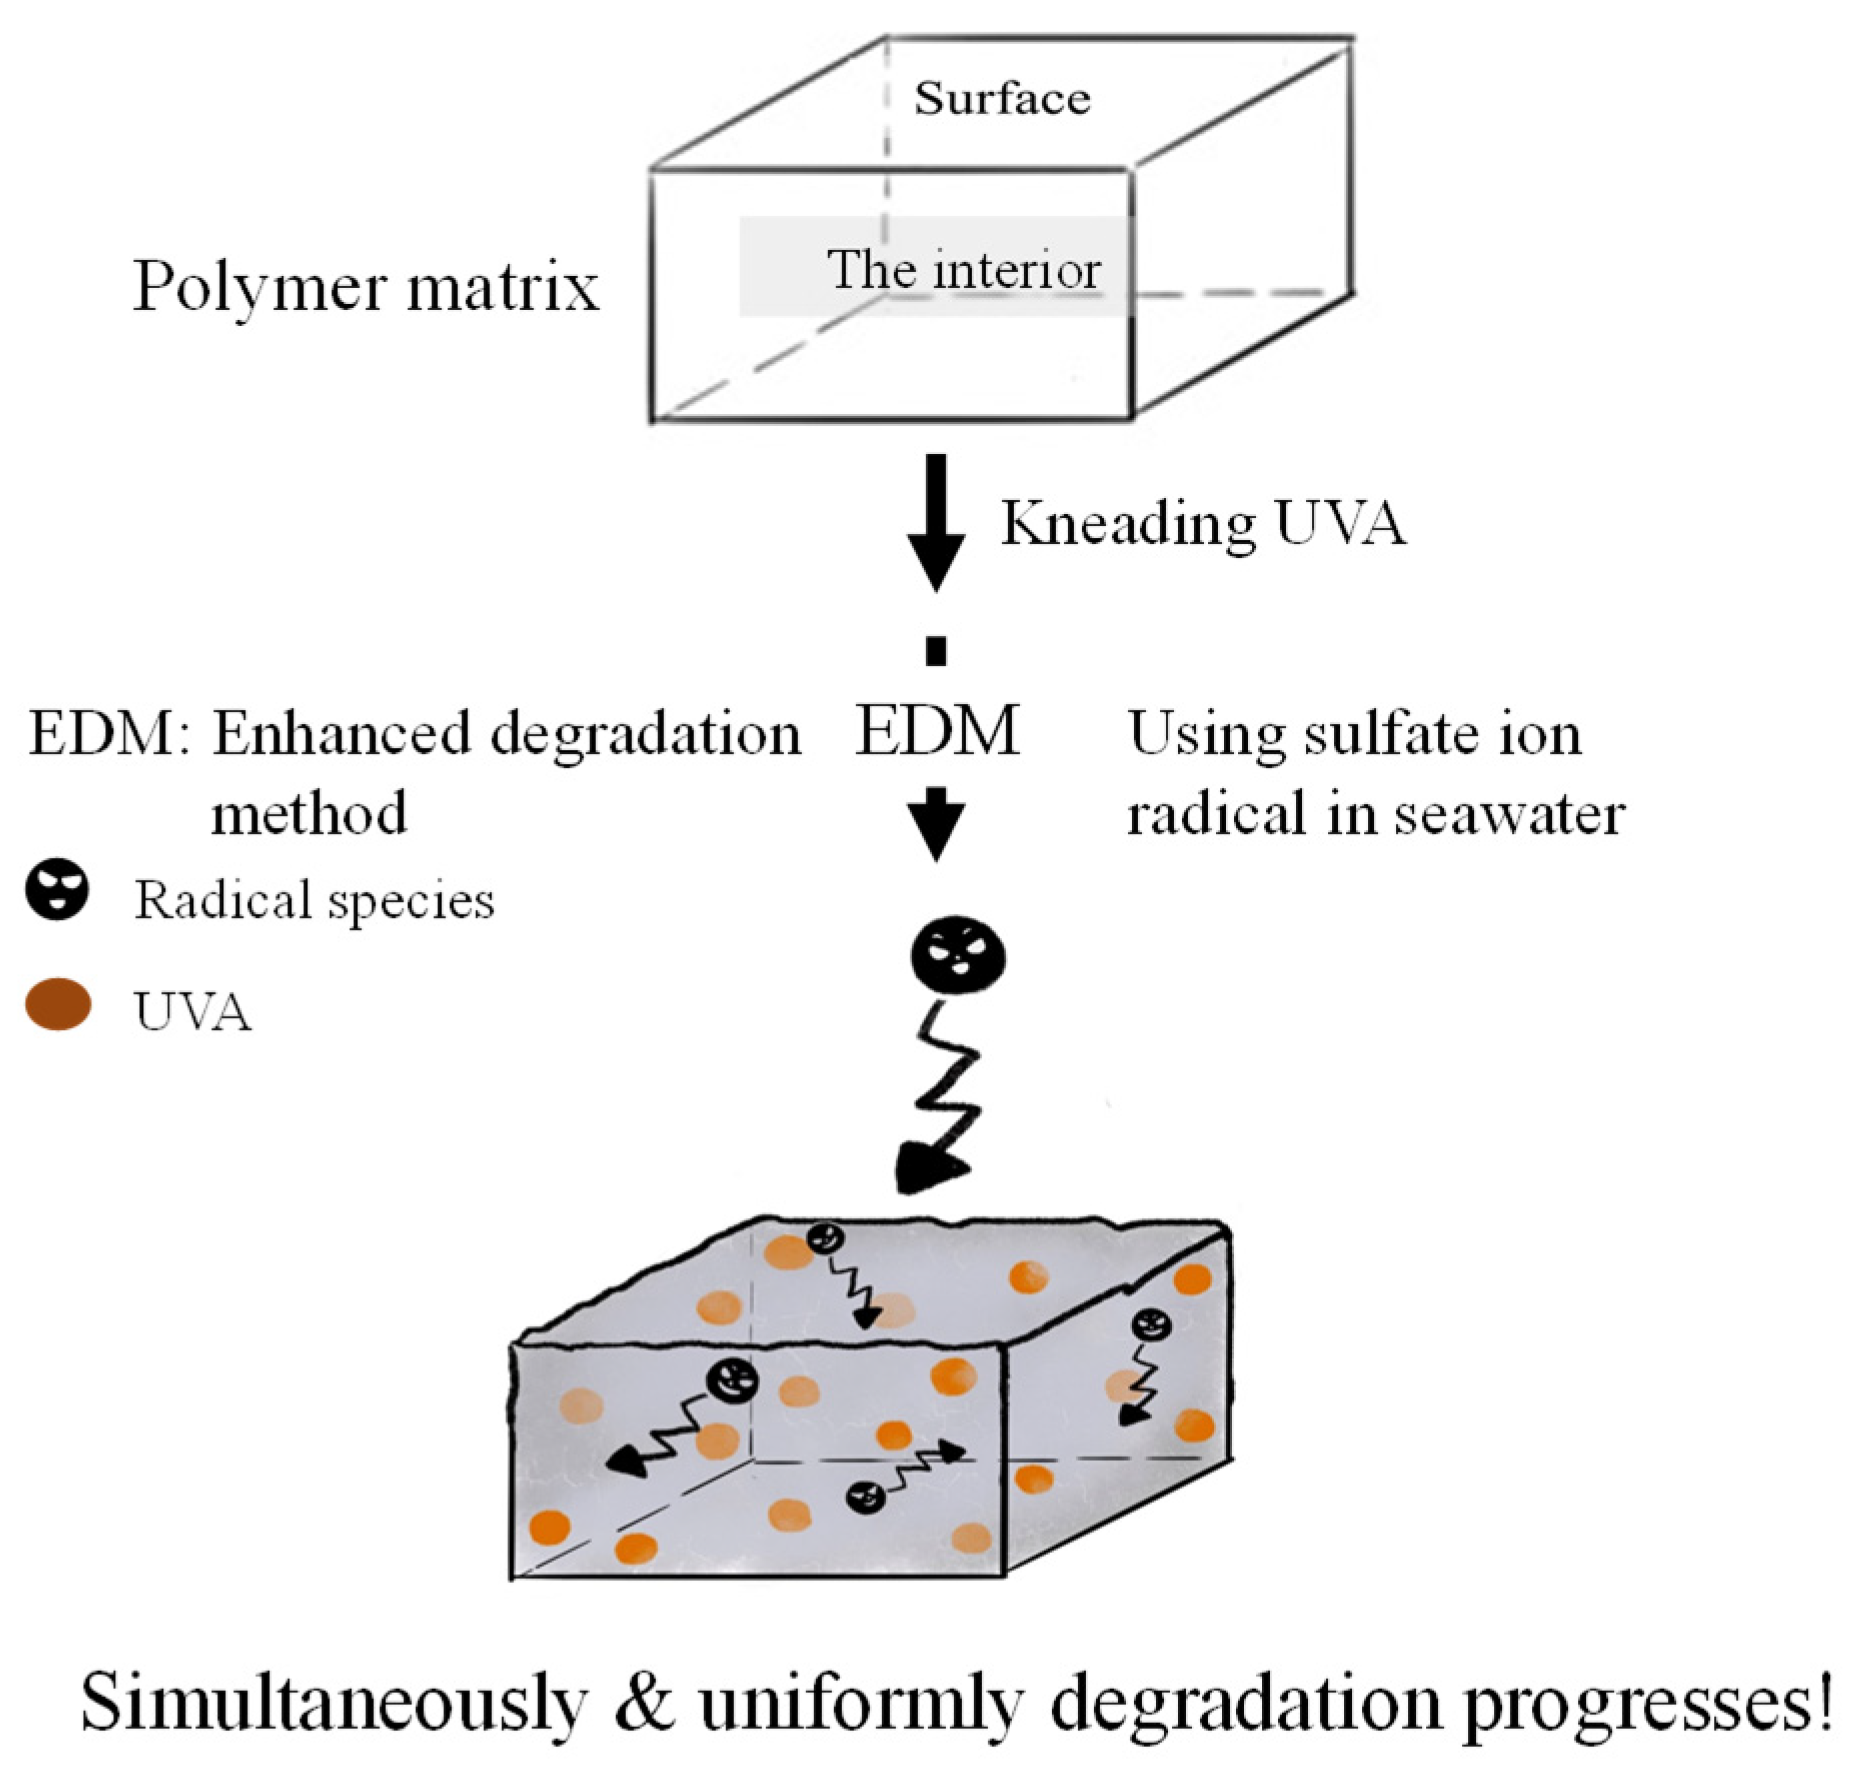
Weathering degradation is limited to surface of polymer matrix, resulting that it takes a long time for degradation to progress into the interior. Therefore, it is difficult to analyze the quality change of an encapsulated UVA additive in the polymer in a short period of time. In order to easily detect the change in quality of the UVA over time during degradation, it was necessary to use a method that would allow the degradation to start simultaneously on the surface and inside the polymer matrix and to proceed uniformly. Therefore, we used a novel "enhanced degradation method (EDM)" by using sulfate ion radicals in seawater to homogeneously degrade the entire sample containing a UVA (UV-326). EDM can homogeneously degrade polymers such as polypropylene in a short time [
18].
Figure 1 shows the schematic scheme of simultaneous and uniform degradation progression in the polymer matrix using EDM. The behavior of UVA in each polymer during degradation has been studied in detail using this EDM.
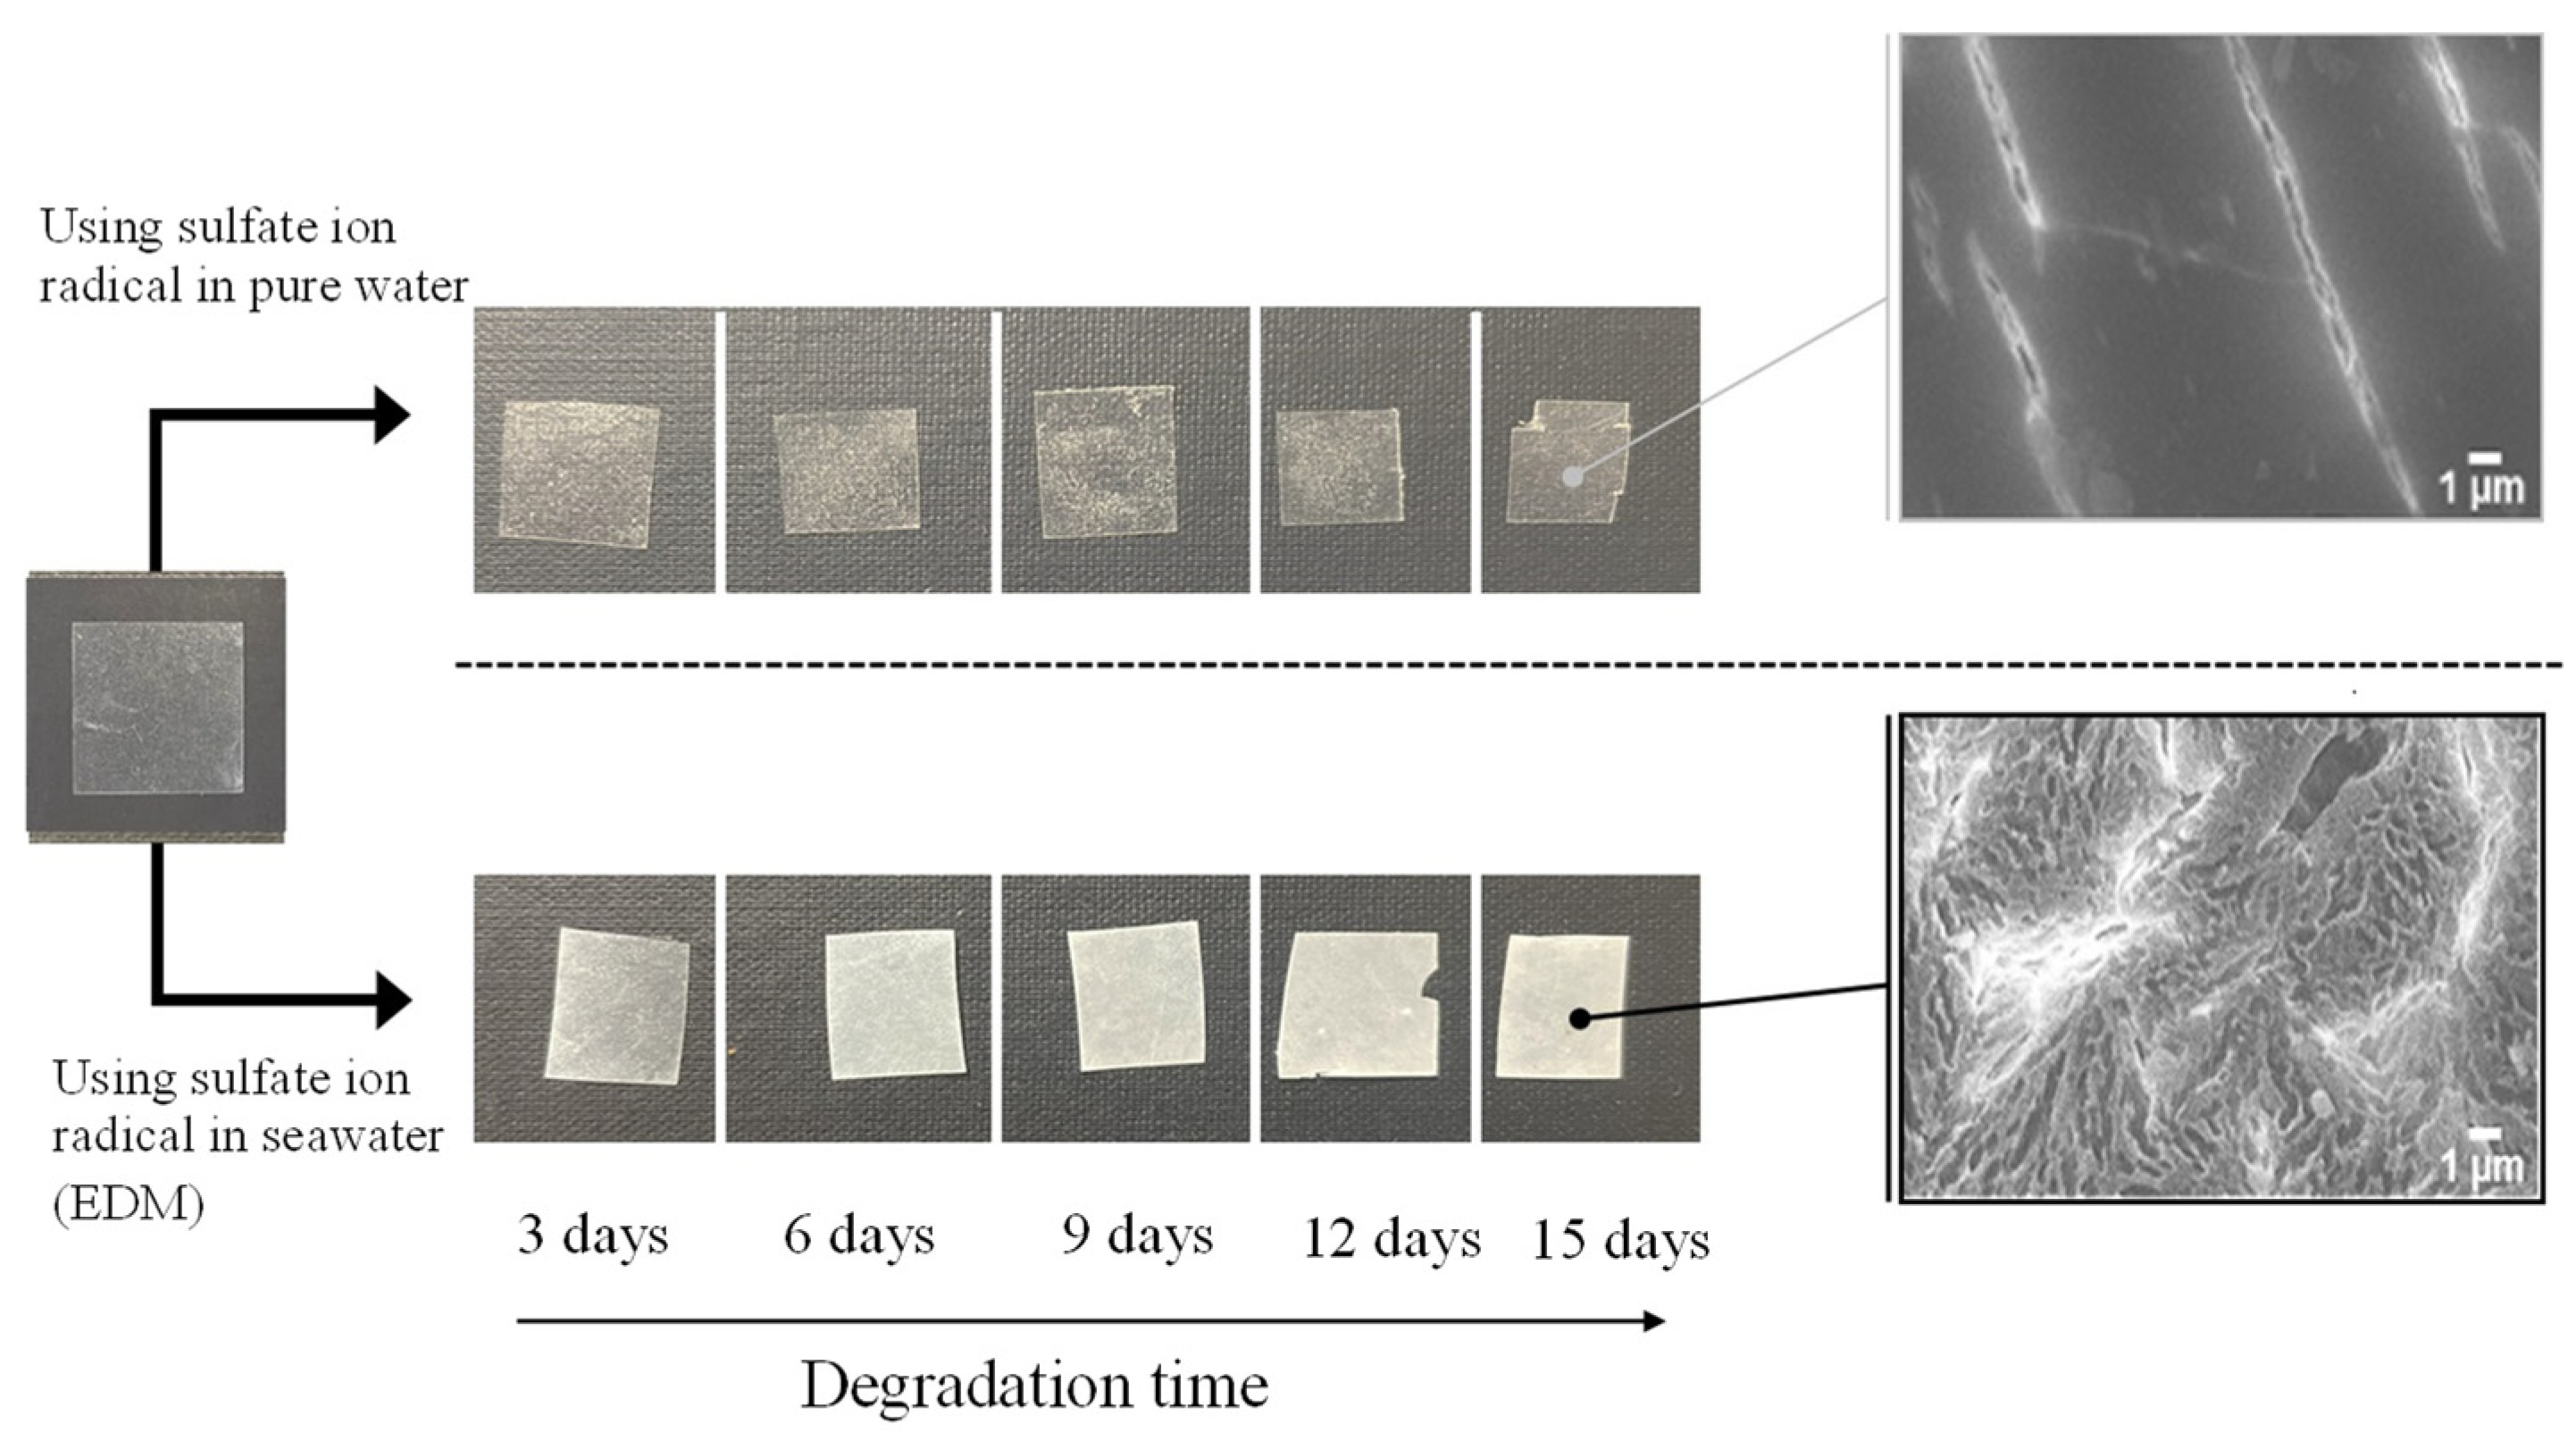
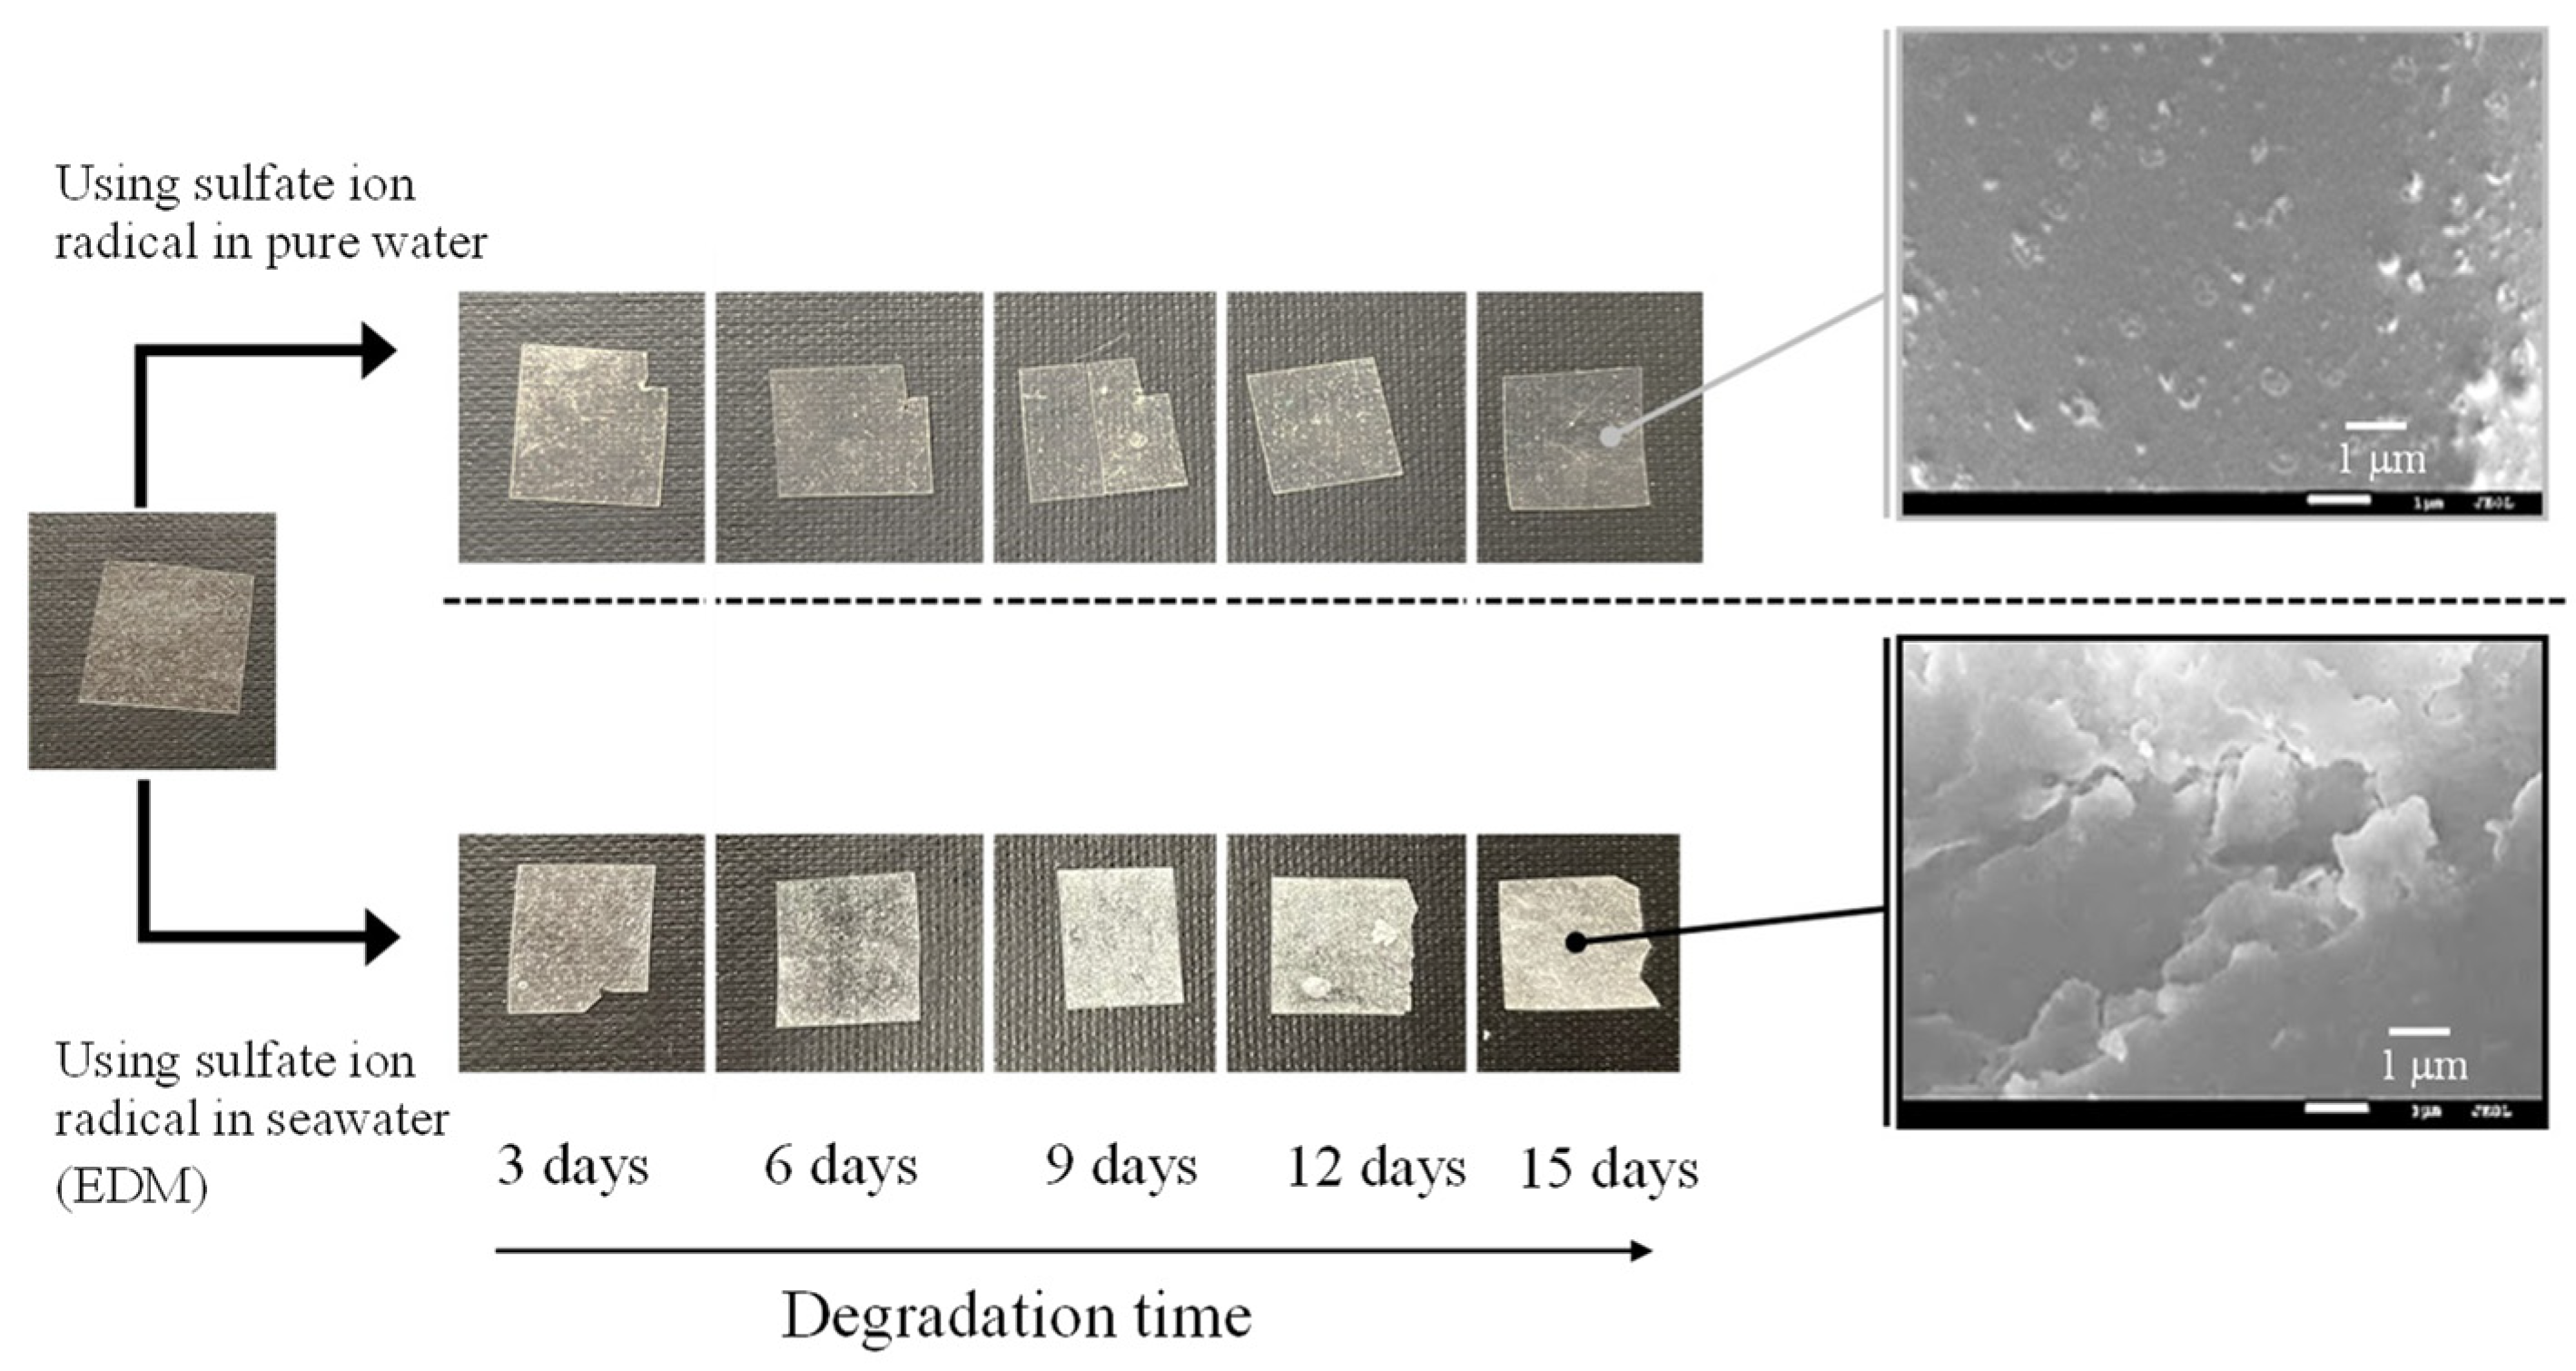
Figure 2 and
Figure 3 show the color changes of PP and PS samples containing 5-phr UVA film using EDM, respectively. Both samples degraded with EDM showed more severe whitening than those degraded with a degradation initiator combining sulphate radicals and pure water. The SEM images of both after 15 days of EDM degradation showed numerous grooves or crushed particles. In pure water, the radical species cannot diffuse into the interior of the polymer, so degradation is limited to the surface as in weathering degradation. In addition, the small surface changes indicate that the degradation rate is also much slower than that of the EDM. It appears that the difference between the PP and PS is whitening rate in the EDM degradation. Chemi-crystallization of semi-crystalline polymer such as PP occurs when its polymer chain is broken due to degradation [
19]. The crystallization causes volume shrinkage, which generates the grooves observed in the PP SEM photograph. The higher whitening rate of the PP sample due to degradation is caused by chemi-crystallization. On the other hand, the amorphous PS does not undergo such chemical crystallization, resulting in a slower whitening rate.
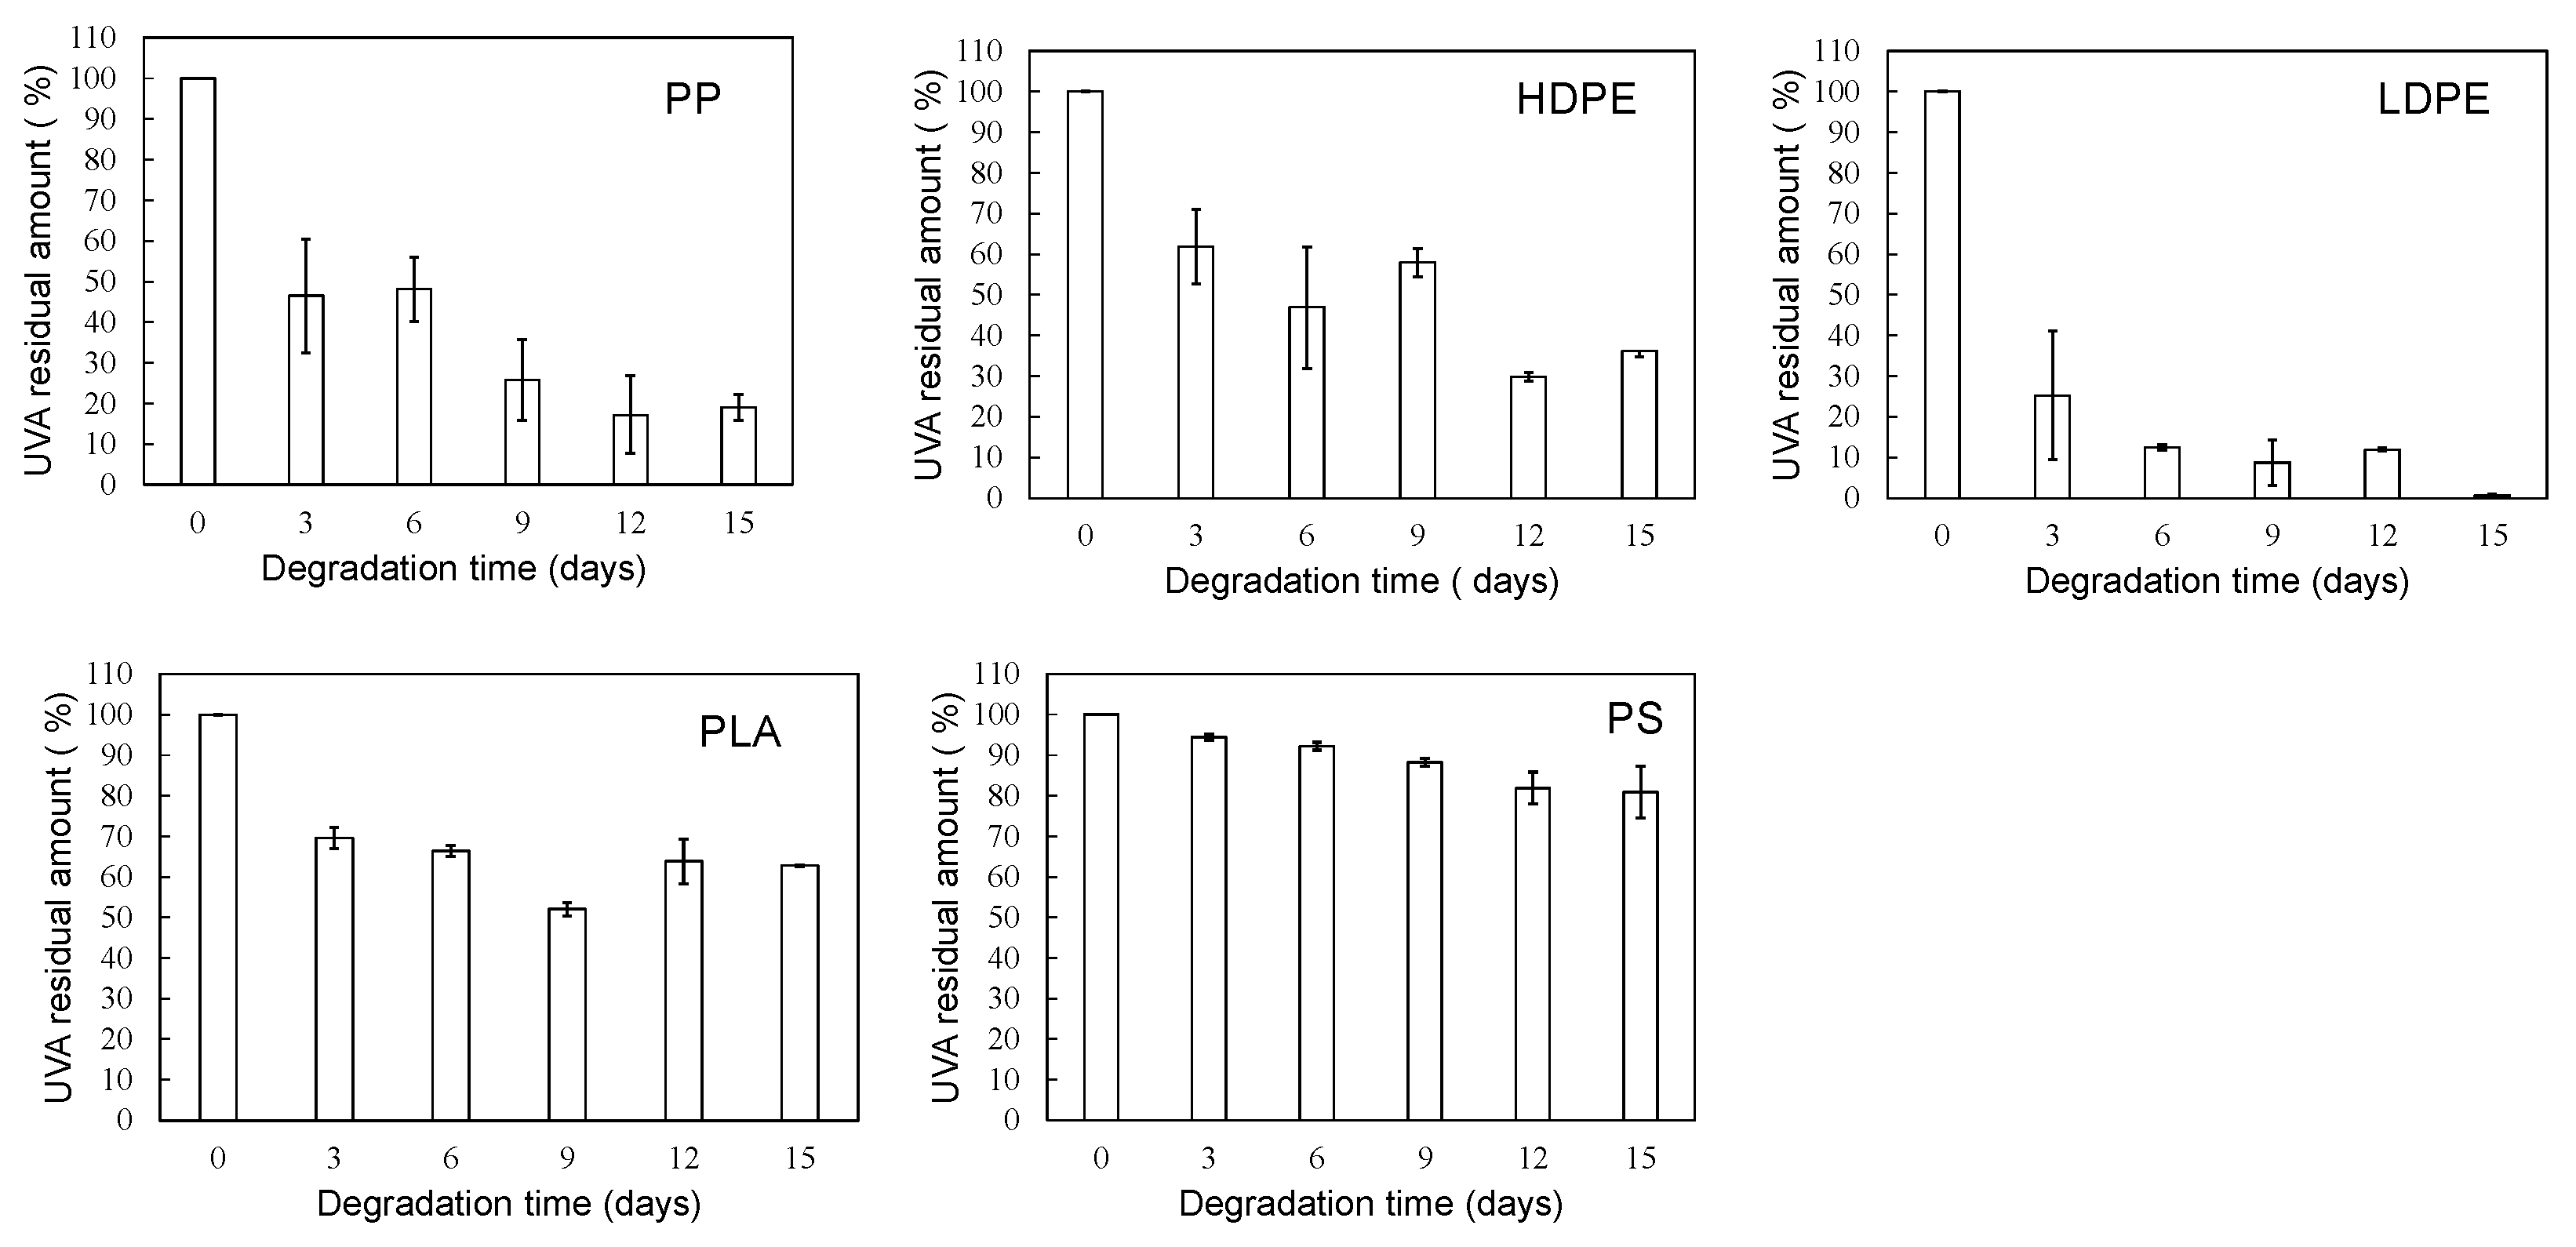
Figure 4 shows the degradation time dependence of UVA residual amount in various polymer samples using the sulfate ion radical in pure water. The order in the amount of residual UVA in each polymer with increasing degradation time is as follows: PS > PLA > HDPE> PP > LDPE. This order seems to be related to glass transition temperature (Tg) except for PP and HDPE [
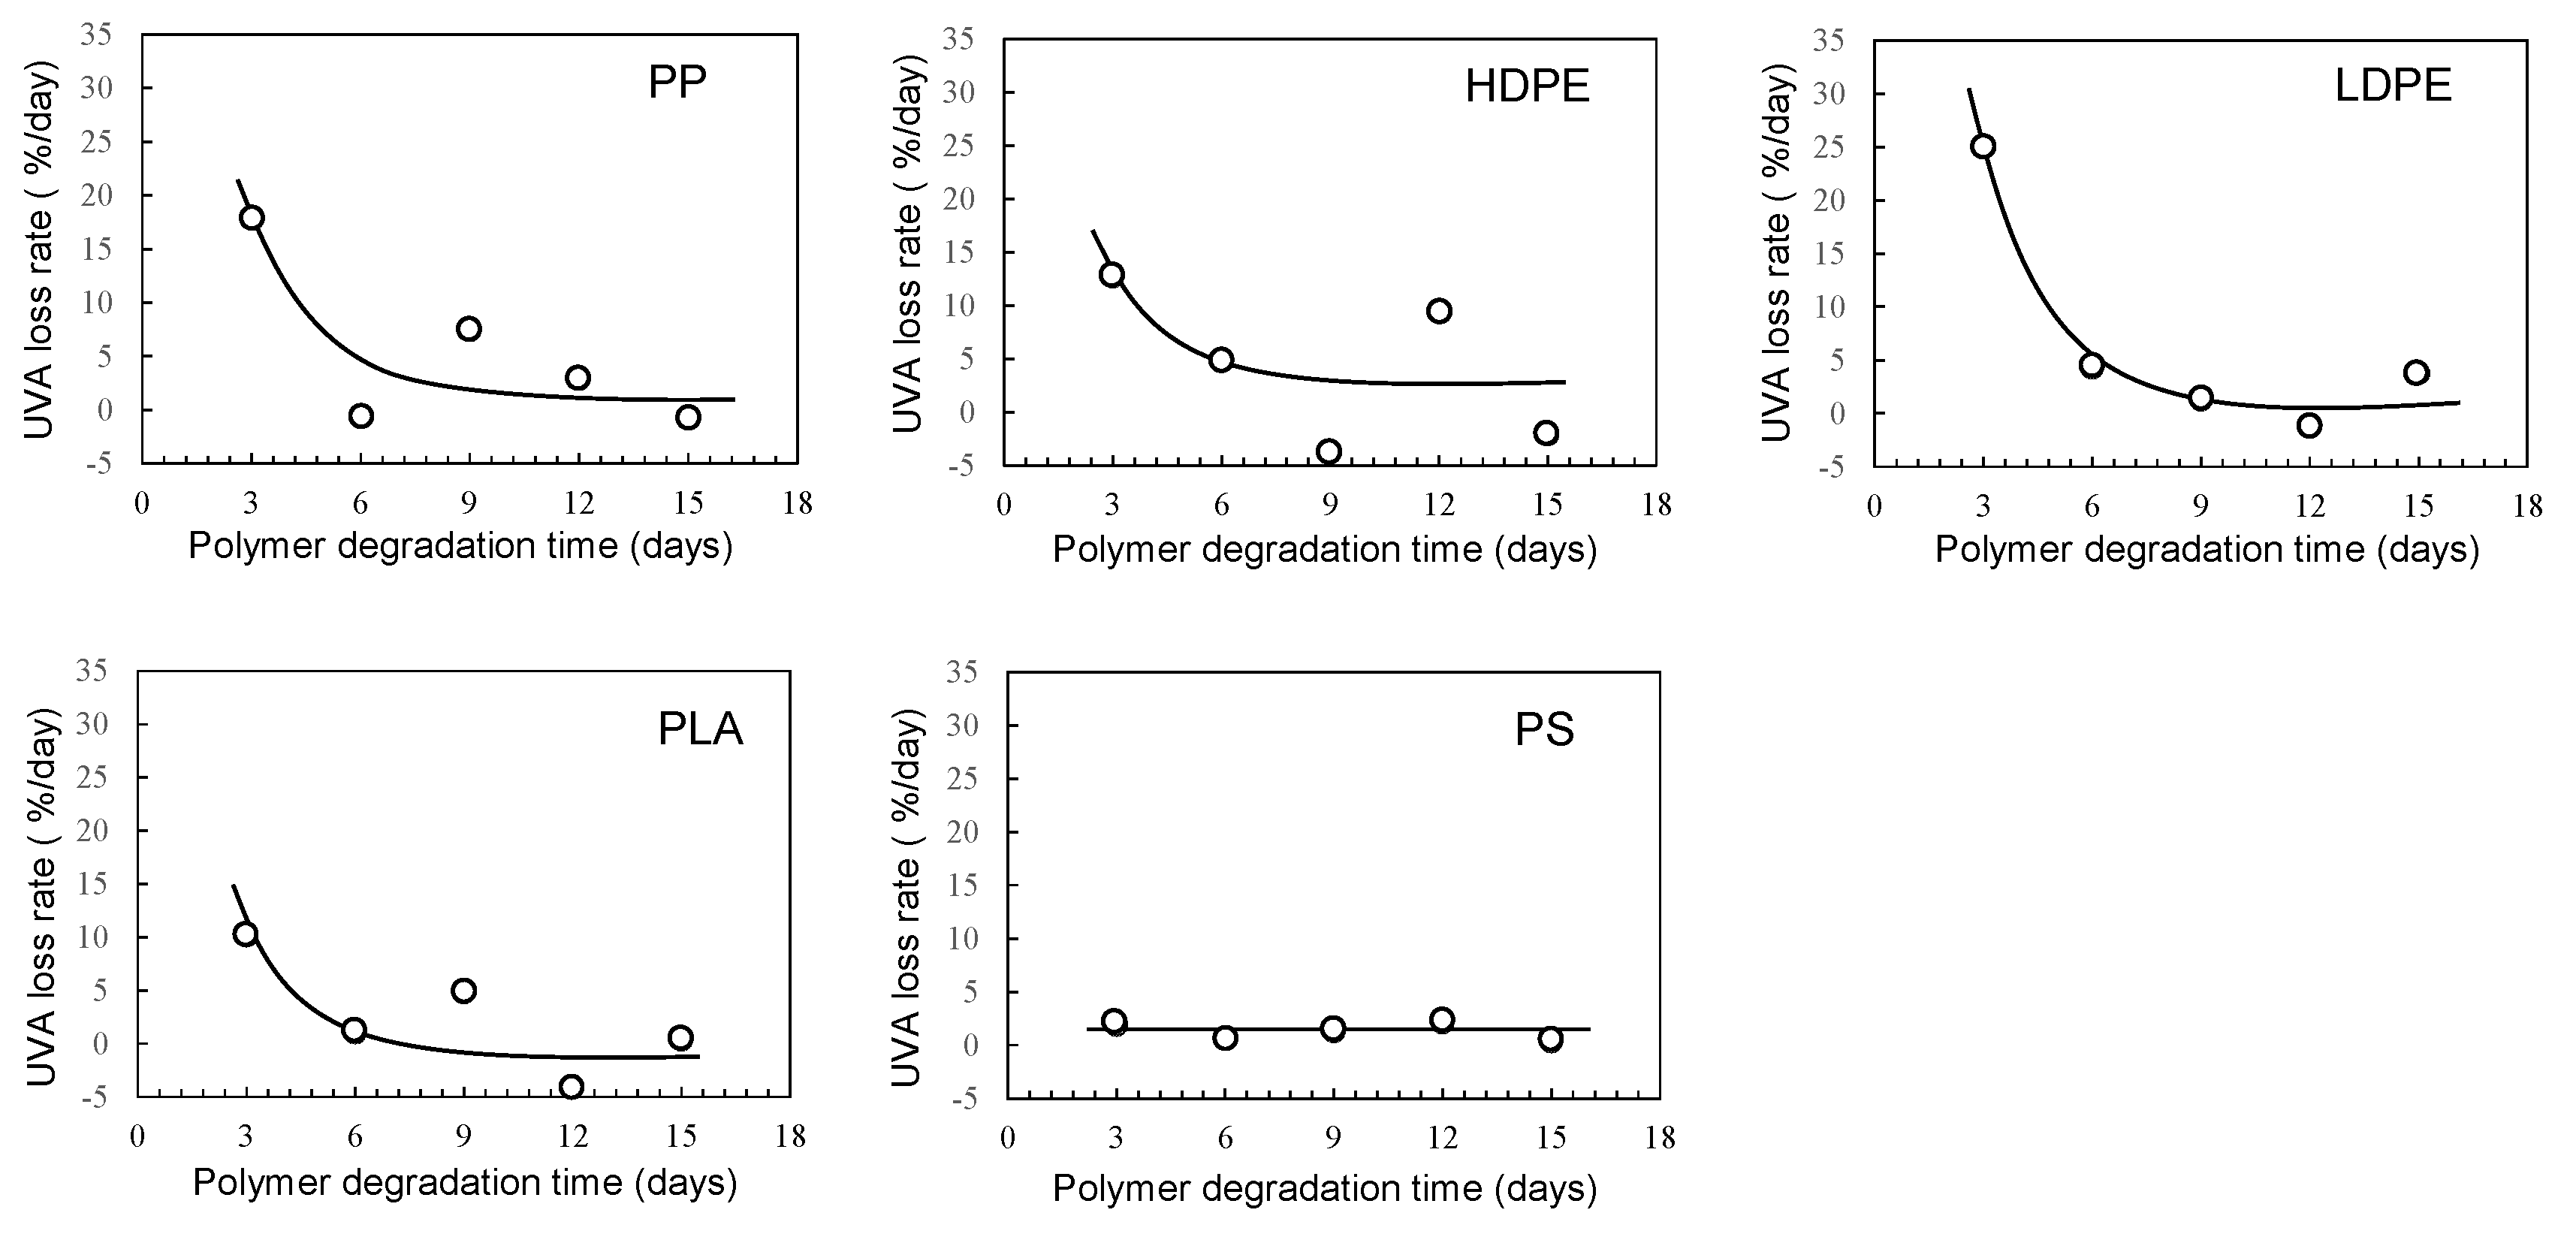
20]. For each polymer, the UVA loss rate was calculated by differentiating the residual amount against degradation time. The results are summarized in
Figure 5. The UVA loss rate of PS, which has the highest Tg among these polymers, is close to zero with no dependence on degradation time. The other polymers are considerably similar to each other in the behavior of the change in the UVA loss rate with respect to degradation time. The rate reaches a maximum in the first 3 days of degradation, and after 6 days, the rate drops sharply to close to zero, although there is some scatter. The degree of scattering seems to be related to the degree of crystallinity because it is much lower for PS and LDPE with no or low crystallinity. The behavior of UVA loss with progressive degradation would be closely associated with mobility of polymer chain. The higher the mobility of the polymer chain, the easier it is for the polymer chain to escape from the glassy state, resulting in a lower Tg. The presence of crystalline part inhibits the propagation of degradation and the movement of polymer chains. Therefore, if the influence of the crystalline part can be suppressed, the correlation between the UVA loss rate and Tg, in other words, the mobility of the polymer chain, becomes clearer.
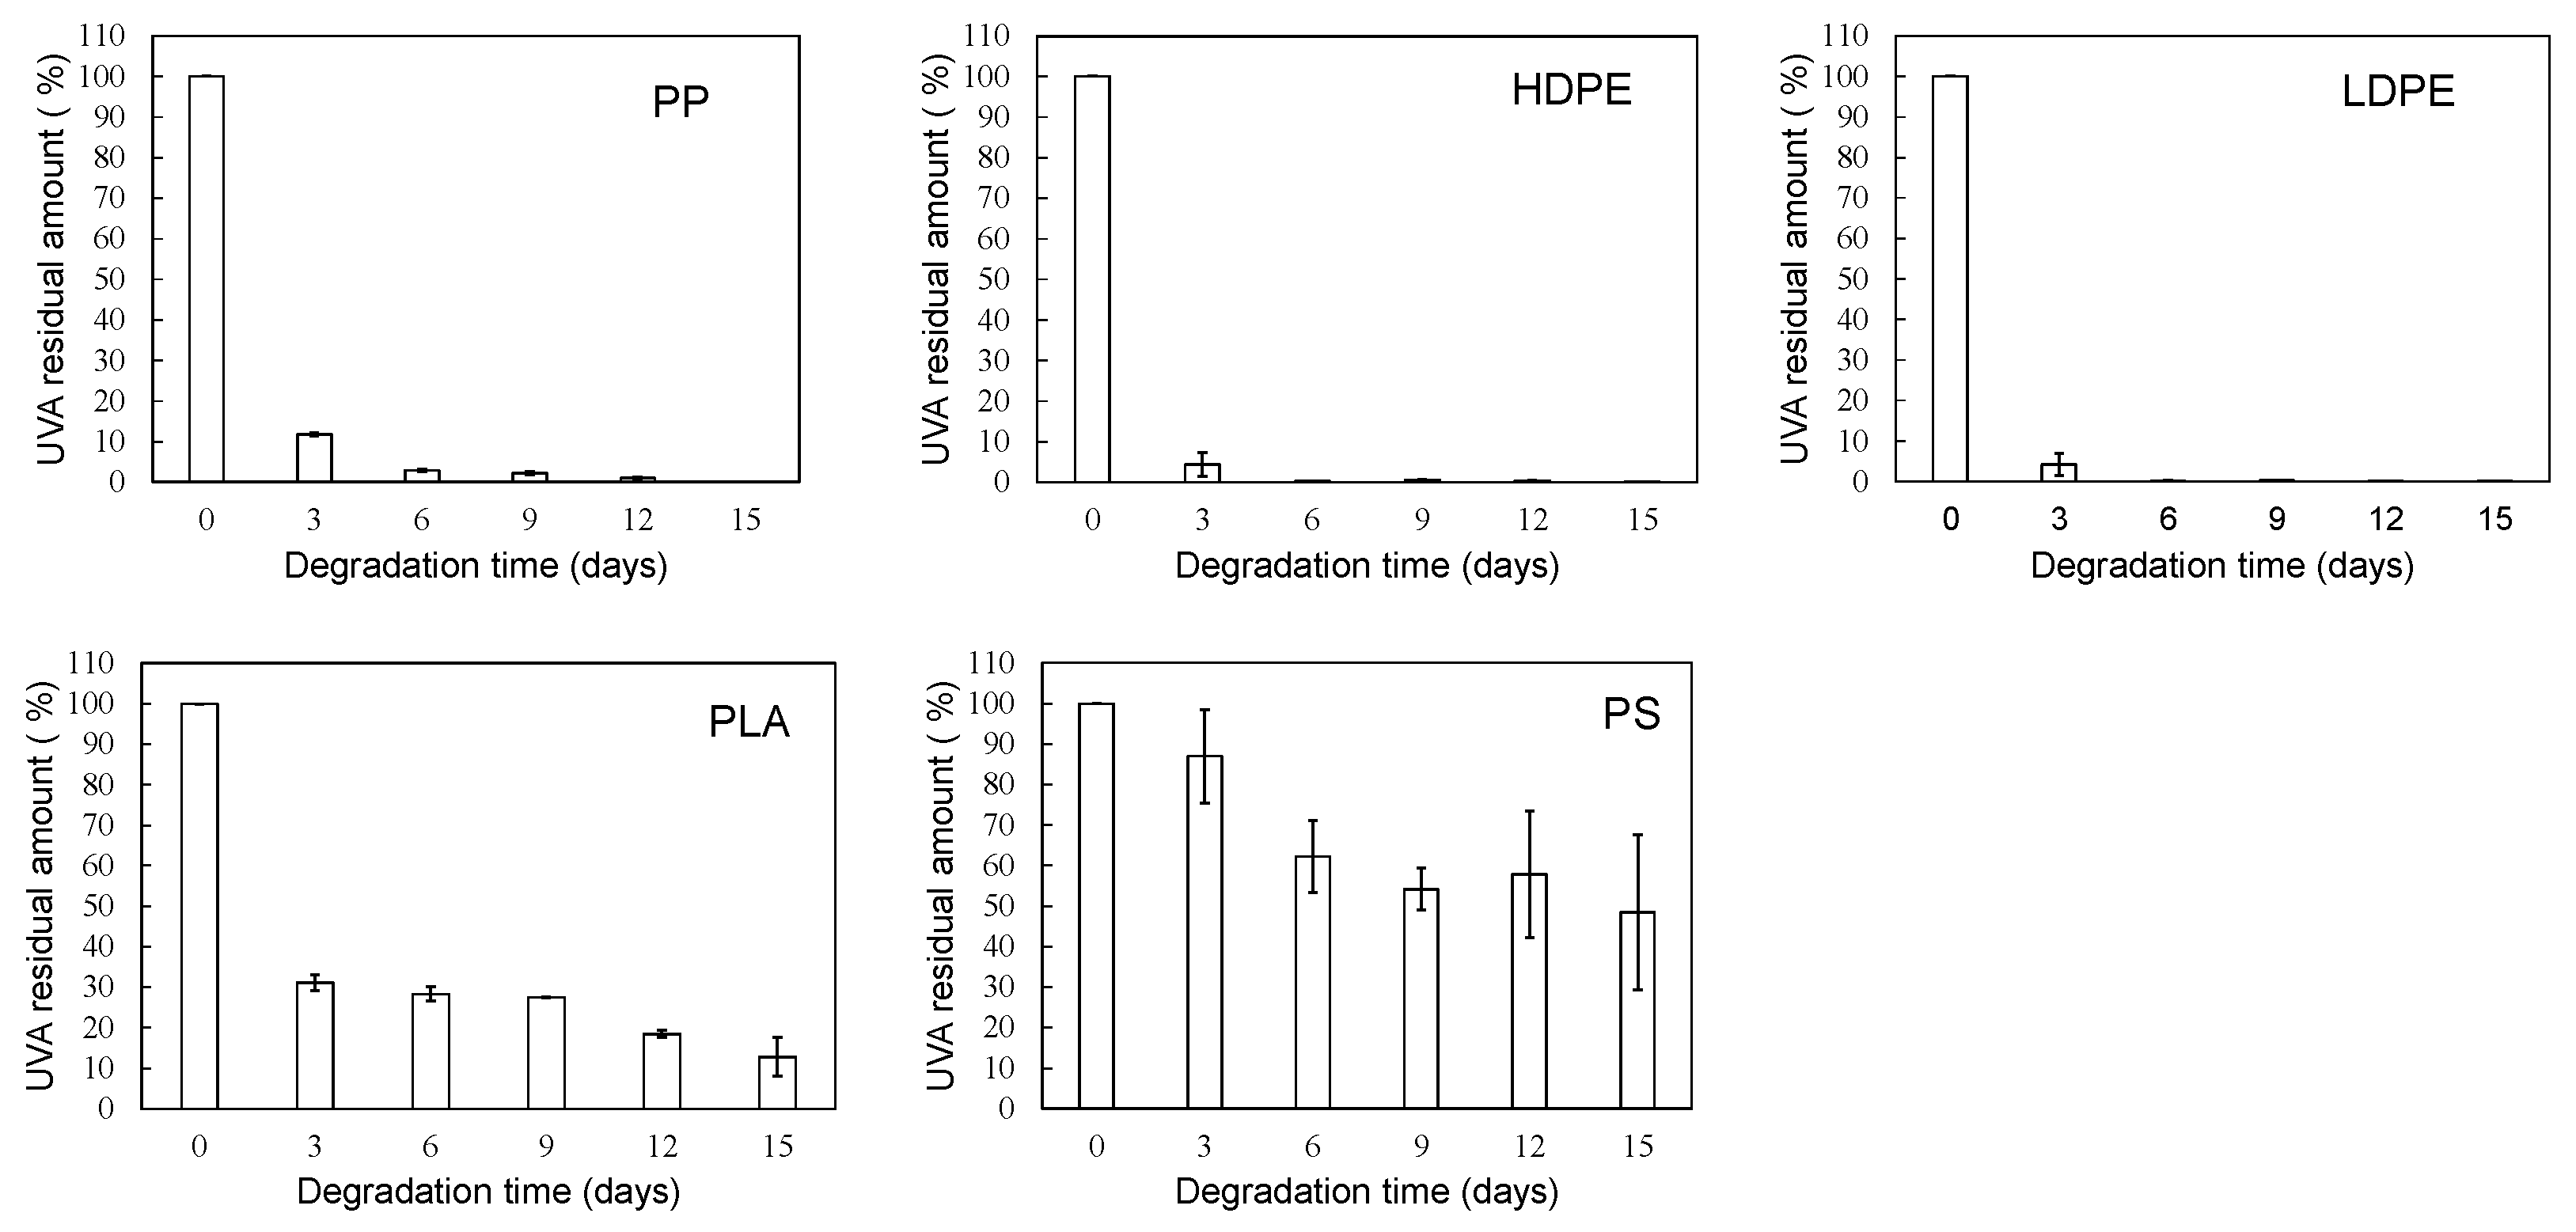
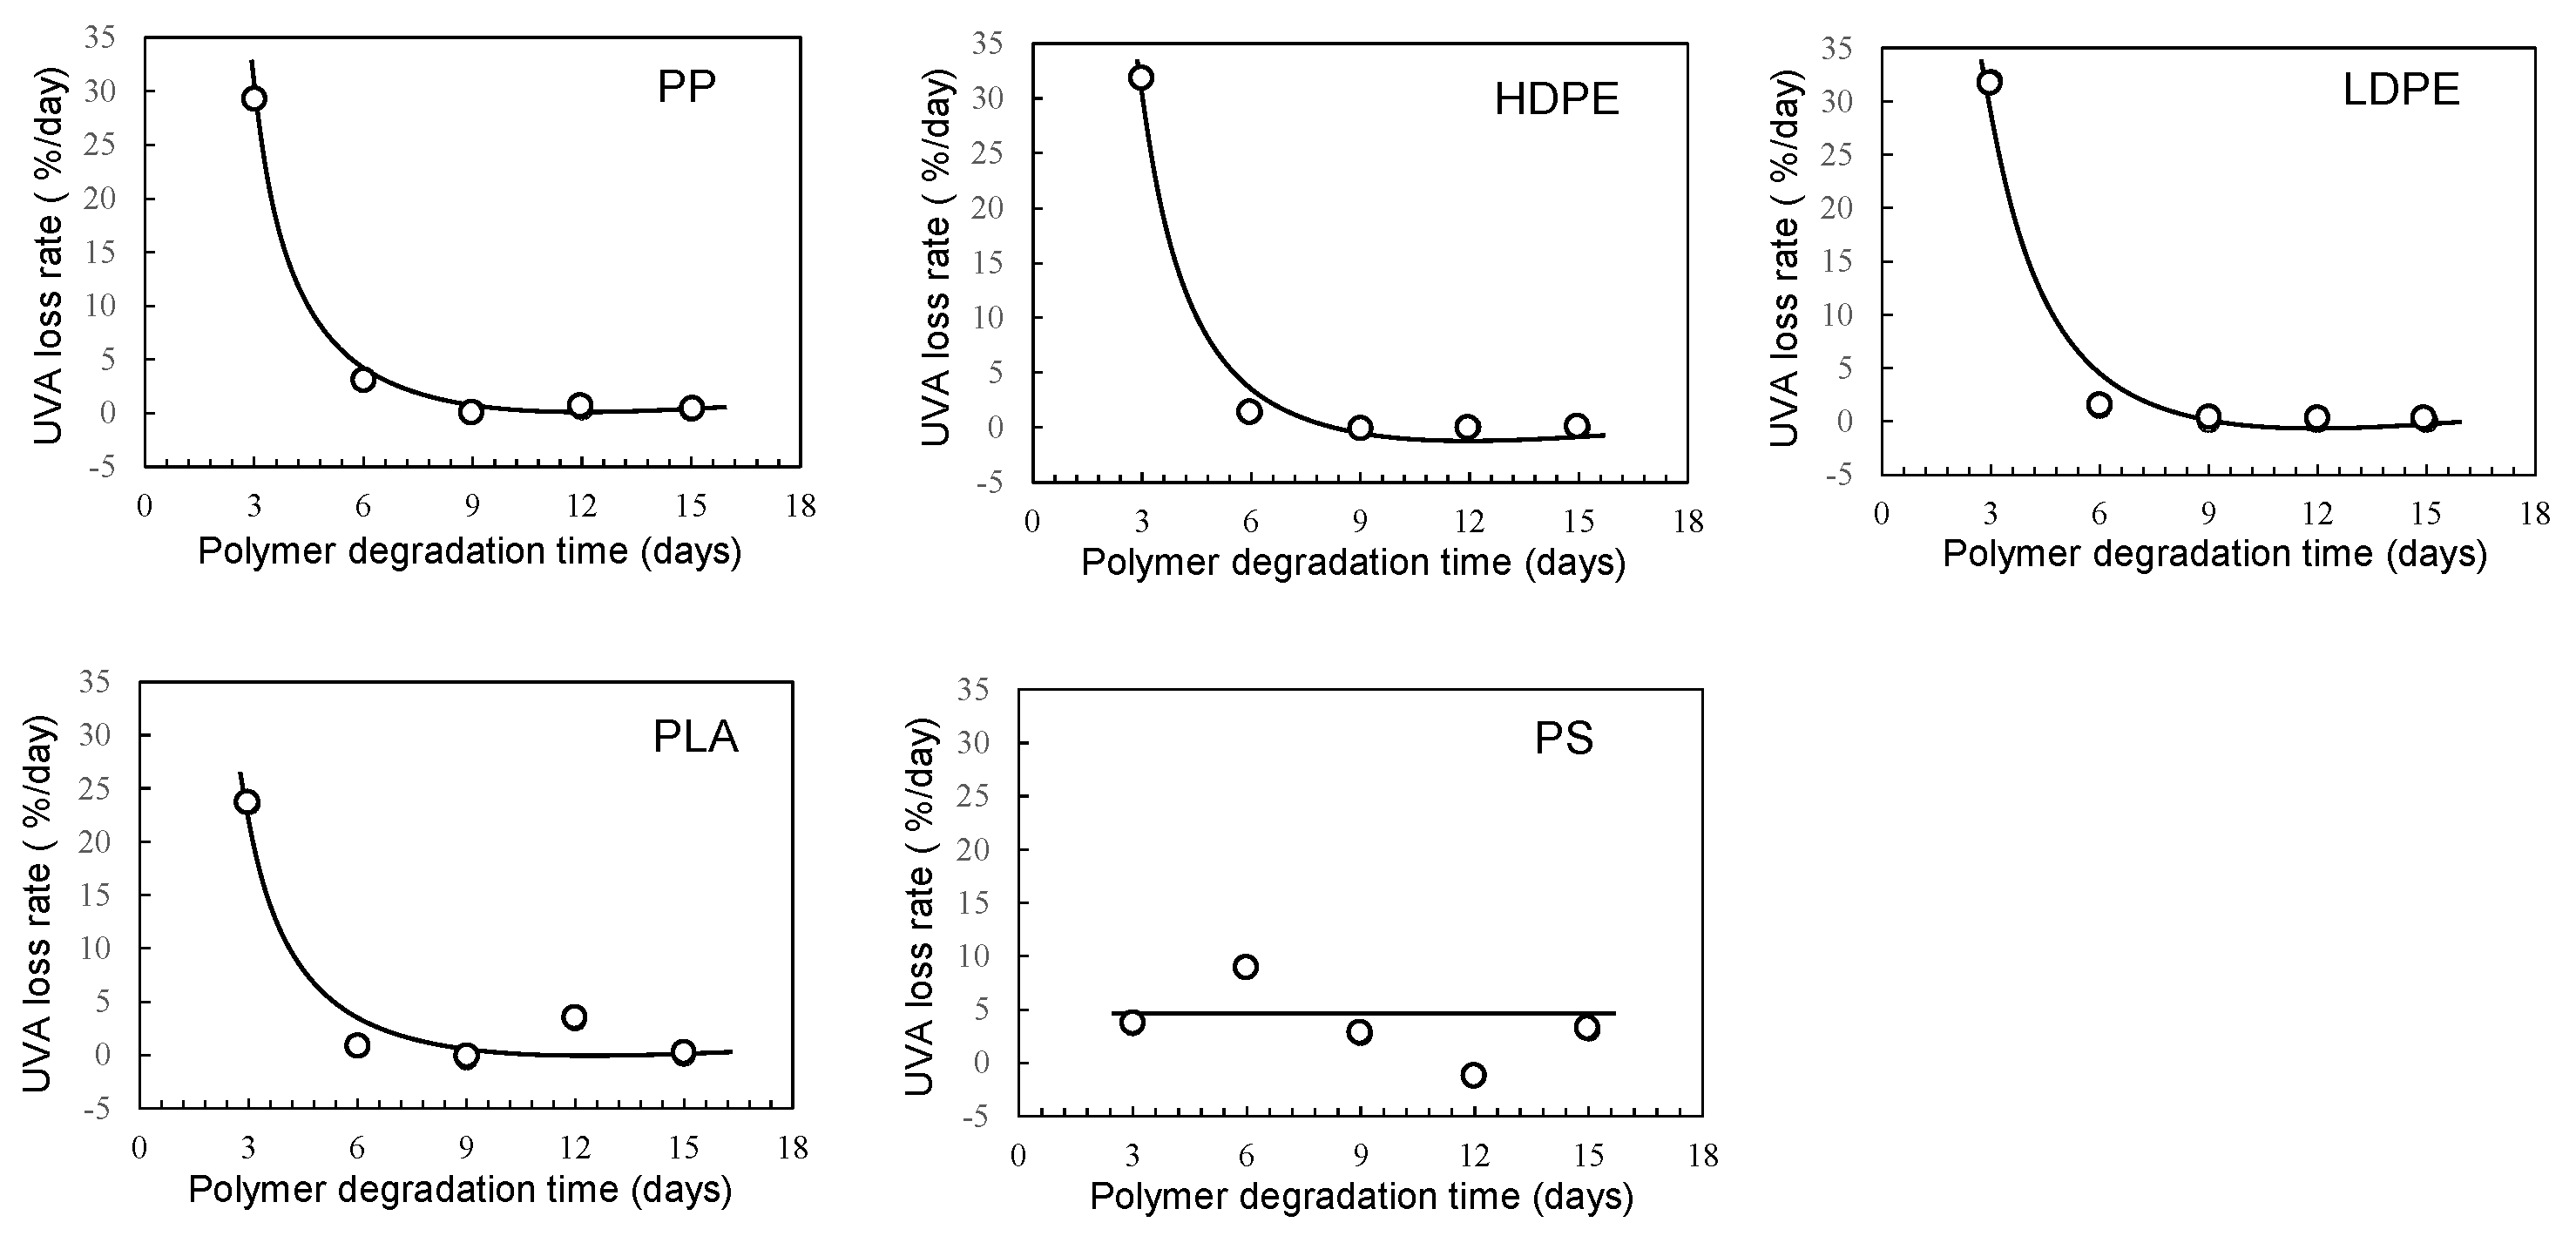
Figure 6 and
Figure 7 show the degradation time dependence of UVA residual amount and loss rates in various polymer samples using EDM. Although crystalline polymer degradation is commonly limited to the amorphous part, EDM can also degrade the crystalline it [
18]. As shown in
Figure S3 (b), the molecular weight curves of the PP samples shifted toward the lower molecular weight side with increasing degradation time while maintaining almost the same shape. This behavior suggests that the degradation caused by EDM proceeds uniformly with almost no difference between the crystalline and amorphous parts. In fact, for the crystalline polymers PP, HDPE, LDPE and PLA, the variation in UVA residuals at each degradation time was significantly improved (see
Figure 6). As shown in
Figure 7, the degradation time dependence of UVA loss rate in these crystalline polymers is very similar to each other.
Figure S4 shows the comparisons of degradation time dependence of UVA residual in PP samples in pure water and using sulfate ion radical in pure water or EDM. If there is no degradation of UVA due to degradation, the equilibrium of bleaching of it from the polymer matrix can be explained by physicochemical model. Bleaching behavior of several UV stabilizers, including UV-326, from various polymer matrices has already been studied by Do et al.[
21]. According to their report, the leaching behavior of UV stabilizers including UV-326 from LDPE showed a positive deviation from Raoult’s law in an acrylic nitrile/water mixture, and that from PS did a negative one. Since PP is an aliphatic hydrocarbon polymer as well as LDPE, its UVA deviation value can be regarded as nearly equal to those of LDPE. The positive deviation means that there is no intermolecular interaction between the PP and UVA, while the negative value for PS does that there is one between them. The significant increase in the initial loss rate observed during the degradation by EDM seen with the crystalline polymers of PP, HDPE, LDPE and PLA is due to homogeneous and faster fragmentation of the polymer matrix, i.e., increased surface area due to microplasticization [
18]. A similar increase in microplasticization rate occurs with the PS, but the intermolecular interaction between UVA and PS does not result in as pronounced its increase in loss rate as with other polymers.
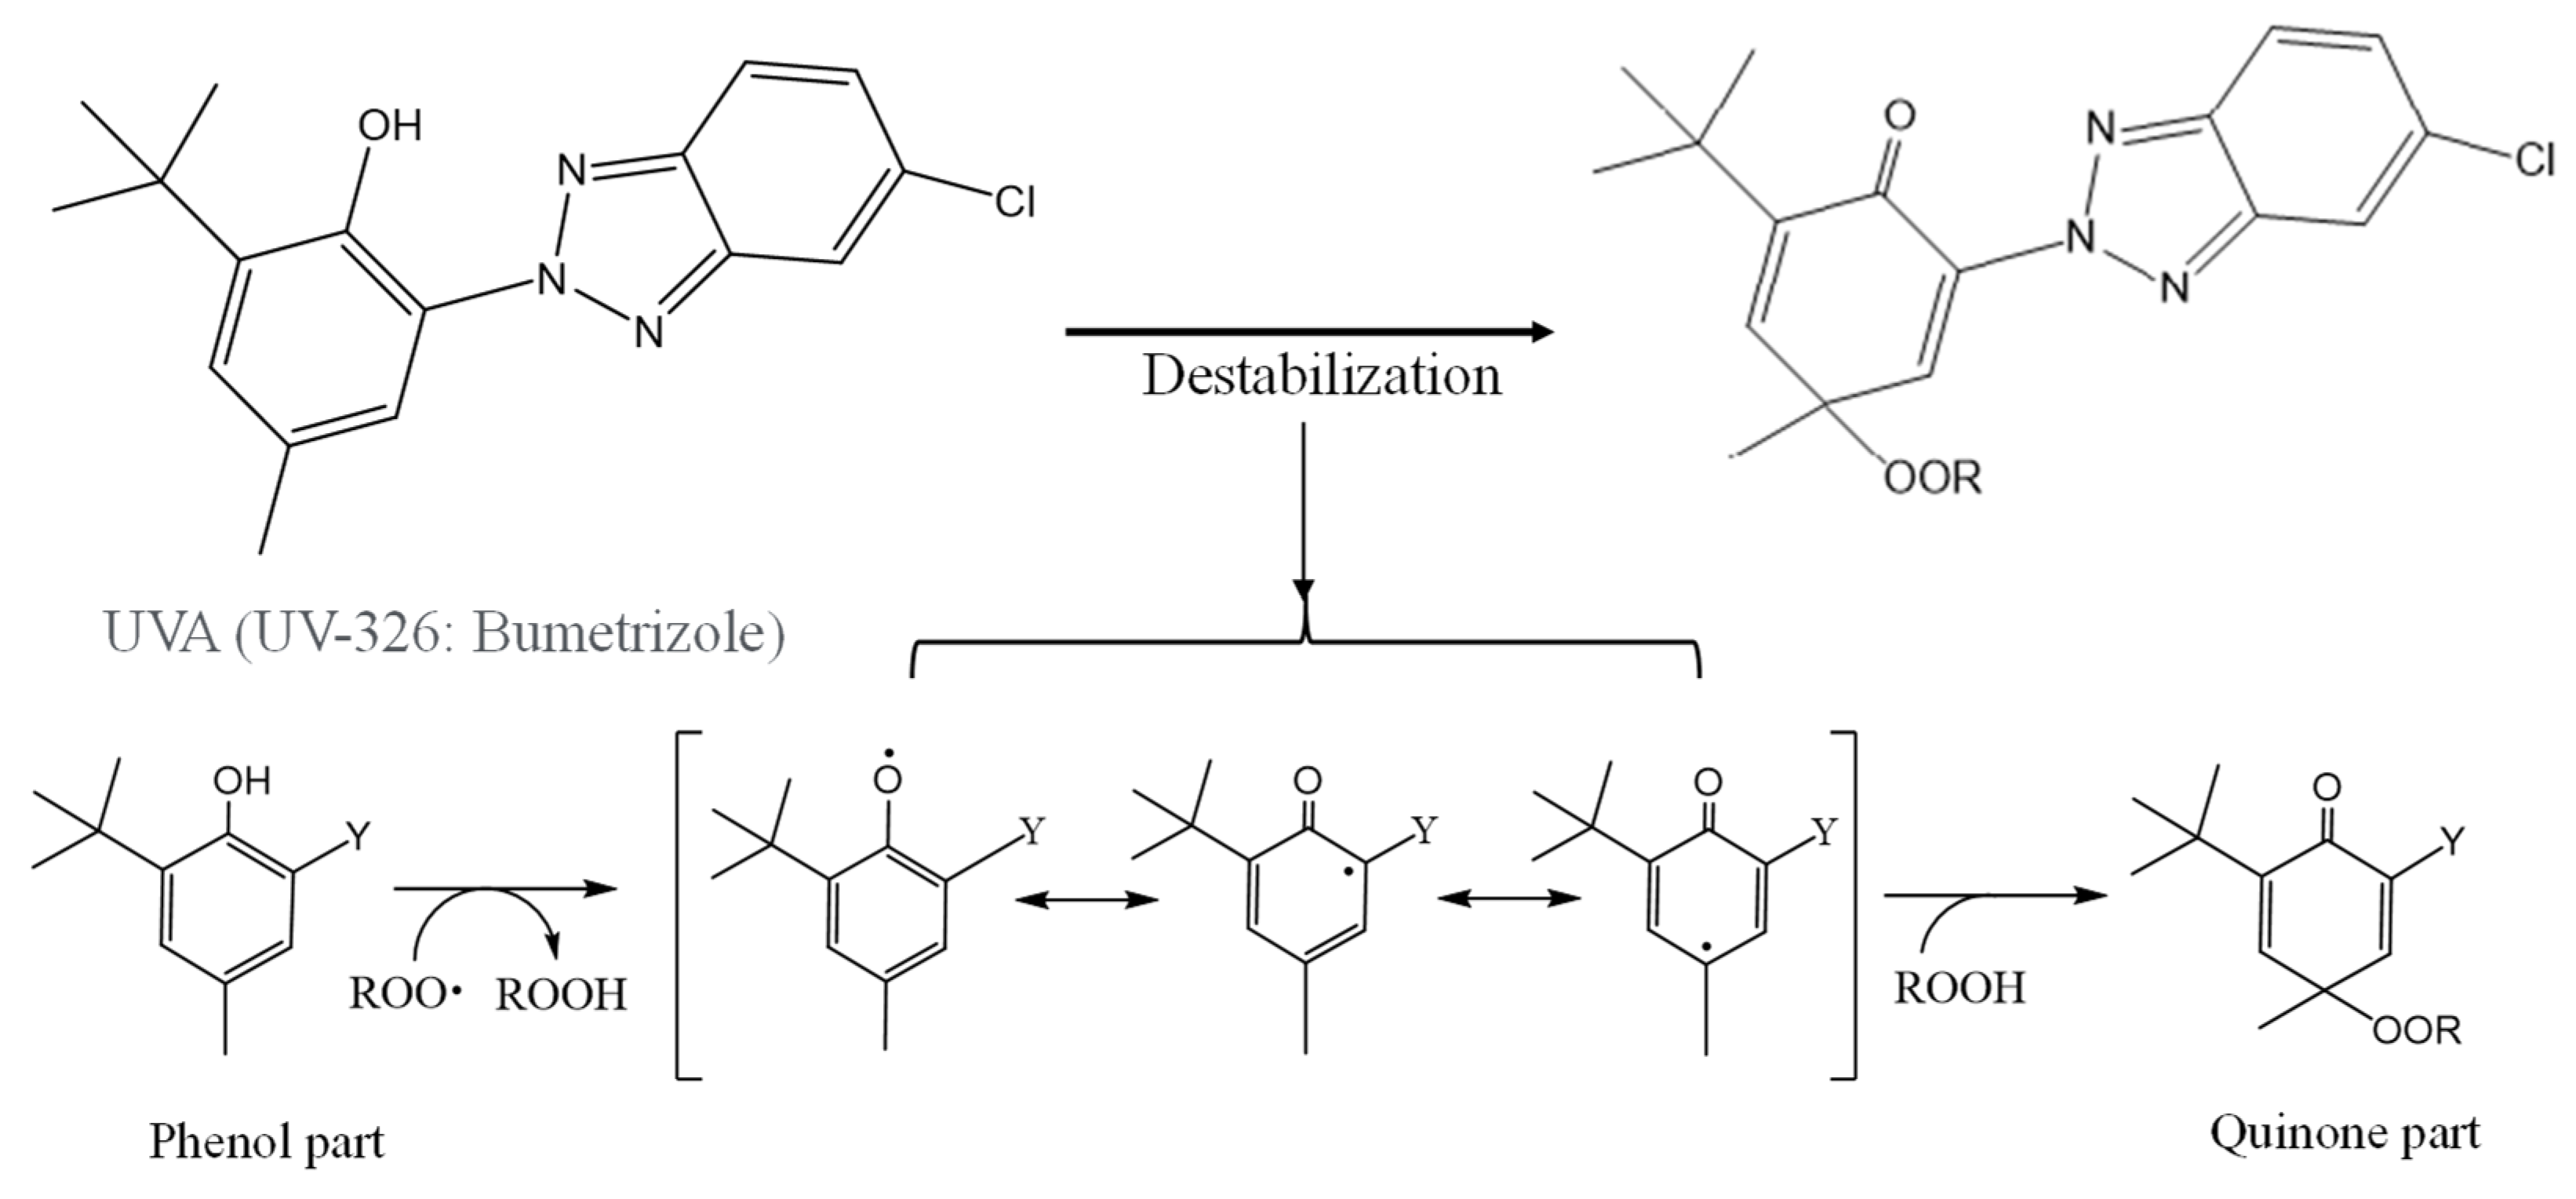
Figure 8 shows the scheme of UVA (UV-326) destabilization by autoxidation. The hindered phenol part of UVA-326 acts as an antioxidant [
22,
23]. Polymers with aliphatic main chains, such as PP and PS, cause degradation by autoxidation [
24,
25], resulting in the generation of peroxide radical (ROO•) from the aliphatic polymer main chains. As shown in
Figure 8, the phenol part in the UVA reacts with the ROO•, and hydrogen transfer occurs from the phenol to the peroxide radical [
23]. The transformation product, quinone, is formed by reaction with hydroperoxide via the intermediate phenoxyl radical as shown in
Figure 8. The quinone part is an unstable compound and causes further alteration. As a result, the UVA is decomposed. The decomposition process requires a contact with the peroxide radical, which is influenced by the polymer chain mobility. UV-326 has an aromatic ring, which interacts with the benzene ring of PS by π-π stacking. If some of the aromatic rings are converted to unstable quinone rings by autoxidation of UVA, as shown in
Figure 8, the interaction would decrease and the UVA bleaching rate would increase.
Figures S4 and S5 show the IR spectra changes of PP containing 5-phr UVA and PS containing 10-phr UVA films, respectively, using EDM. The quinone group in benzophenones has a vibrational mode in the spectral region of 1650-1680 cm
-1 in FT-IR measurements [
26,
27]. New peaks assigned to the quinone groups could be not observed in the relevant spectral region after 15 days of degradation of PP containing 5-phr of UVA with EDM (see
Figure 4S). This result supports the assumption mentioned above that the loss of UVA additive was not due to quinone deterioration of it, but to increased solutes from outside the system due to the increased surface area resulting from matrix degradation-induced fragmentation. HDPE, LDPE, and PLA, which are crystalline and do not interact with the UVA, are similar to PP in that the UVA loss by the degradation using EDM is not due to deterioration but to an increased leaching rate associated with fragmentation. Even when the degradation of EDM was performed by increasing the UVA dosage in the PS, which has a slow UVA bleaching rate, no quinone group peaks appeared until the 24 days degradation, as shown in
Figure 5S. These results indicate that UVA (UV-326) deterioration in the polymers does not occur or rarely does with degradation, and that leaching out of the system is primarily responsible for the loss.
4. Conclusions
To reveal the quality-changed behavior of the UVA over time during degradation, EDM was employed to homogeneously degrade the entire polymer sample containing it. The PP and PS samples containing 5-phr UVA films rapidly whitened, and their SEM photographs after 15 days of EDM degradation showed numerous grooves or crushed particles. There was the difference of whitening rate between the PP and PS in the EDM degradation. Chemi-crystallization of semi-crystalline polymer such as PP occurred during the degradation and caused the volume shrinkage to the grooves generation. The higher whitening rate of the PP sample due to degradation was caused by chemi-crystallization. The UVA loss rate of PS with the higher Tg was much slower compared to the crystalline polymers of PP, HDPE, LDPE and PLA. The crystalline polymers, with the exception of PS, were similar in the behavior of the change in UVA loss rate with respect to degradation time. The significant increase in initial loss rate observed during EDM degradation of the crystalline polymers was due to homogeneous and faster fragmentation of the polymer matrix, i.e. increased surface area due to microplasticization. A similar increase in microplasticization rate occurred with the PS, but the intermolecular interaction between UVA and PS did not result in as pronounced its increase in loss rate as with other polymers. The UVA (UV-326) had one aromatic ring, which interacted with the benzene ring of PS by π-π stacking. The interaction caused the decrease in the UVA bleaching rate. The phenolic part of the UVA was able to react with the degraded polymer, likely resulting in the formation of quinone compound. As a result, the UVA would be degraded, possibly leading to a decrease in residual amounts, a factor other than leaching. However, no quinone group peaks were observed in either FT-IR measurement of EDM degradation of PP and PS containing the UVA. These results indicated that the UVA was not altered or was less done in the polymers. The study concluded that leaching from the system was the primary cause of the loss.
Supplementary Materials
The following supporting information can be downloaded at the website of this paper posted on Preprints.org. Figure S1: Pyrolysis gas chromatography (Py-GC/MS) charts of PP samples containing various UVA concentration; Figure S2: Relationship between UVA concentration in various polymers and area ratio obtained from pyrolysis gas chromatography (Py-GC/MS) measurements: Number of measurements = 3 times; Figure S3: Molecular weight curve changes of PP samples during degradation time : (a) by sulfate ion radical in pure water. (b) by sulfate ion radical in seawater (EDM); Figure S4: Comparisons of degradation time dependence of UVA residual amount in PP samples in pure water and using sulfate ion radical in pure water or seawater (EDM): All degradation temp. = 65 ˚C; Figure S5: IR spectra changes of PP containing 5-phr UVA film using EDM; Figure S6: IR spectra changes of PS containing 10-phr UVA film using EDM.
Author Contributions
Methodology, H.N.; Formal analysis, H.N., T.U., S.M., A.T.N.D., H.J.K., M.Y. and Y.K. Investigation, H.N. and T.U., Writing—original draft, H.N.; Writing—review & editing, preparation and editing, A.T.N.D., H.J.K., M.Y. and Y.K.; Supervision, H.N. All authors have read and agreed to the published version of the manuscript.
Funding
This work was funded by the Environment Research and Technology Development Fund No. 1MF-2204 of the Environmental Restoration and Conservation Agency provided by Ministry of the Environment of Japan, by the Grant-in-Aid for Scientific Research No. 23K04822 from Japan Society for the Promotion of Science, by Taihei Environmental Science Center Co., Ltd. and by financial supports of Nagasaki University organization for marine science and technology and for function enhancement program of research.
Institutional Review Board Statement
Not applicable.
Data Availability Statement
Data are contained within the article.
Conflicts of Interest
The authors declare no conflict of interest.
References
- Barnes, D.K.A.; Galgani, F.; Thompson, RC.; Barlaz, M. Accumulation and Fragmentation of Plastic Debris in Global Environments. Phil. Trans. R. Soc. B 2009, 364, 1985–1998. [Google Scholar] [CrossRef] [PubMed]
- Andrady, A.L. Microplastics in the Marine Environment. Mar. Pollut. Bull. 2011, 62, 1596–1605. [Google Scholar] [CrossRef] [PubMed]
- Jambeck, J.R.; Geyer, R.; Wilcox, C.; Siegler, T.R.; Perryman, M.; Andrady, A.; Narayan, R.; Law, K.L. Plastic Waste Inputs from Land into the Ocean. Science 2015, 347, 768–771. [Google Scholar] [CrossRef]
- Halle, A.T.; Ladirat, L.; Gendre, X.; Goudouneche, D.; Pusineri, C.; Routaboul, C.; Tenailleau, C.; Duployer, B.; Perez, E. Understanding the Fragmentation Pattern of Marine Plastic Debris. Environ. Sci. Technol. 2016, 50, 5668–5675. [Google Scholar] [CrossRef] [PubMed]
- Rummel, C.D.; Jahnke, A.; Gorokhova, E.; Kűhnel, D.; Schmitt-Jansen, M. Impacts of Biofilm Formation on the Fate and Potential Effects of Microplastic in the Aquatic Environment. Environ. Sci. Technol. Lett. 2017, 4, 258–267. [Google Scholar] [CrossRef]
- Gensler, R.; Plummer, C.J.G.; Kausch, H.H.; Kramer, E.; Pauquet, J.R.; Zweifel, H. Thermo-oxidative Degradation of Isotactic Polypropylene at High Temperatures: Phenolic Antioxidants versus HAS. Polym. Degrad. Stab. 2000, 67, 195–208. [Google Scholar] [CrossRef]
- Taguchi, Y. Ishida, Y.; Tsuge, S.; Ohtani, H.; Kimura, K.; Yoshikawa, T.; Matsubara, H. Structural Change of a Polymeric Hindered Amine Light Stabilizer in Polypropylene during UV-irradiation Studied by Reactive Thermal Desorption-gas Chromatography. Polym. Degrad. Stab. 2004, 83, 221–227. [Google Scholar] [CrossRef]
- Fauser, P.; Vorkamp, K.; Strand, J. Residual Additives in Marine Microplastics and Their Risk Assessment – A critical review. Mar. Pollut. Bull. 2022, 177, 113467. [Google Scholar] [CrossRef] [PubMed]
- Tarafdar, A.; Lim, J.Y.; Kwon, J.H. UV Stabilizers can FosterEarly Development of Biofilms on Freshwater Microplastics. Environ. Pollut. 2022, 315, 120444. [Google Scholar] [CrossRef]
- Tian, Z.; et al. A Ubiquitous Tire Rubber–derived Chemical Induces Acute Mortality in Coho Salmon. Science, 2021; 371.6525, 185–189. [Google Scholar]
- Nakatani, H.; Muraoka, T.; Ohshima, Y.; Motokucho, S. Difference in Polypropylene Fragmentation Mechanism between marine and Terrestrial Regions. SN Appl. Sci. 2021, 3, 773. [Google Scholar] [CrossRef]
- Nakatani, H.; Muraoka, T.; Ohshima, Y.; Motokucho, S. Difference in Polypropylene Fragmentation Mechanism between marine and Terrestrial Regions. SN Appl. Sci. 2021, 3, 773. [Google Scholar] [CrossRef]
- Lambert, S.; Wagner, M. Formation of Microscopic Particles during The Degradation of Different Polymers. Chemosphere 2016, 161, 510–517. [Google Scholar] [CrossRef] [PubMed]
- Julienne, F.; Delorme, N.; Lagarde, F. From Macroplastics to Microplastics: Role of Water in The Fragmentation of Polyethylene. Chemosphere 2019, 236, 124409. [Google Scholar] [CrossRef] [PubMed]
- Julienne, F.; Lagarde, F.; Delorme, N. Influence of The Crystalline Structure on The Fragmentation of Weathered Polyolefines. Polym. Degrad. Stab. 2019, 170, 109012. [Google Scholar] [CrossRef]
- Nakatani, H.; Kyan, T.; Muraoka, T. An Effect of Water Presence on Surface Exfoliation of Polypropylene Film Initiated by Photodegradation. J. Polym. Environ. 2020, 28, 2219–2226. [Google Scholar] [CrossRef]
- Nakatani, H.; Ohshima, Y.; Uchiyama, T.; Motokucho, S. Degradation and Fragmentation Behavior of Polypropylene and Polystyrene in Water. Sci. Rep. 2022, 12, 18501. [Google Scholar] [CrossRef]
- Mikdam, A., Colina, X., Minard, G., Billon. N., Maurin, R. A kinetic model for predicting the oxidative degradation of additive free polyethylene in bleach desinfected water. Polym. Degrad. Stab. 2017; 146, 76–94.
- Nakatani, H.; Ohshima, Y.; Uchiyama, T.; Motokucho, S.; Dao, A.T.N.; Kim, H.J.; Yagi, M.; Kyozuka, Y. Rapid Oxidative Fragmentation of Polypropylene with pH Control in Seawater for Preparation of Realistic Reference Microplastics. Sci. Rep. 2023, 13, 4247. [Google Scholar] [CrossRef] [PubMed]
- Craig, I.H.; White, J.R.; Kin, P.C. Crystallization and Chemi-crystallization of Recycled Photo-degraded Polypropylene. Polymer 2005, 46, 505–512. [Google Scholar] [CrossRef]
- Brandrup, J.; Immergut, E.H.; Grulke, E.A.; Abe, A.; Bloch, D.R. Polymer handbook, 4th ed.;. New York: Wiley, 1999. Volume 89.
- Do, A.T.N.; Ha, Y.; Kang, H.J.; Kim, J.M.; Kwon, J.H. J. Hazard. Mater. 2022, 427, 128144.
- Klemchuk, P.P.; Horng, P.L. Transformation Products of Hindered Phenolic Antioxidants and Colour Development in Polyolefins. Polym. Degrad. Stab. 1991, 1-3, 333–346. [Google Scholar] [CrossRef]
- Turkovic, V.; Engmann, S.; Tsierkezos, N.; Hoppe, H.; Ritter, U.; Gobsch, G. Long-Term Stabilization of Organic Solar Cells Using Hindered Phenols as Additives. ACS Appl. Mater. Interfaces 2014, 6, 18525–18537. [Google Scholar] [CrossRef] [PubMed]
- Billingham, N.C. Localization of Oxidation in Polypropylene. Makromol. Chem. Macromol. Symp. 1989, 28, 145–163. [Google Scholar] [CrossRef]
- Audouin, L.; Gueguen, V.; Tcharkhtchi, A.; Verdu, J. “Close loop” Mechanistic Schemes for Hydrocarbon Polymer Oxidation. J. Polym. Sci. 1995, A 33, 921–927. [Google Scholar] [CrossRef]
- Cyran, J.D.; Nite, J.M.; Krummel, A.T. Characterizing Anharmonic Vibrational Modes of Quinones with Two-Dimensional Infrared Spectroscopy. J. Phys. Chem. B 2015, 119, 8917–8925. [Google Scholar] [CrossRef]
- Hellwig, P. Infrared Spectroscopic Markers of Quinones in Proteins from the Respiratory Chain. Biochim. Biophys. Acta Bioenerg., 2015, 1847, 126–133. [Google Scholar] [CrossRef] [PubMed]
|
Disclaimer/Publisher’s Note: The statements, opinions and data contained in all publications are solely those of the individual author(s) and contributor(s) and not of MDPI and/or the editor(s). MDPI and/or the editor(s) disclaim responsibility for any injury to people or property resulting from any ideas, methods, instructions or products referred to in the content. |
© 2023 by the authors. Licensee MDPI, Basel, Switzerland. This article is an open access article distributed under the terms and conditions of the Creative Commons Attribution (CC BY) license (http://creativecommons.org/licenses/by/4.0/).
