Introduction
Natural ecosystems have been degraded at alarming rates in recent decades, leading to numerous direct and indirect consequences at different scales (UJVARI, 2004; WU et. al., 2016; ZAHOULI et al., 2017). In tropical regions, deforestation and forest degradation are mainly caused by the expansion of agricultural activities, such as cattle raising and monocultures in large areas (VIERO et al., 2013). These changes in land use and land cover negatively affect the functioning of ecosystems (VIJAY et al., 2016), reducing or eliminating the provision of important environmental services, such as pollination and the control of agricultural pests and disease vectors (BURKETT-CADENA & VITTOR, 2017).
Several studies have already demonstrated the relationship between the loss of natural habitats and the incidence of vector-borne diseases, such as dengue, malaria, leishmaniasis and Chagas disease (CHAN, 2022; HOPKINS et al., 2020; 2022; ILACQUA et. al., 2021; KOLIMENAKIS, et. al., 2021). In fact, the expansion of urbanization promotes closer contact between humans, domestic animals and wild reservoirs of viruses, protozoa, among others (GUBLER et. al., 2011). The removal of forests drastically alters local and regional climatic conditions, in addition to intensifying erosion processes and changes in the quantity and quality of water, which can affect the availability of microhabitats for the reproduction of several species of vectors, such as mosquitoes (PIGNATTI, 2003; SCHMIDT, 2007). Deforestation also affects the composition of plant and animal communities, changing the availability of resources and vector predators and pathogen reservoirs (COMBE et al., 2007; ZAHOULI et al., 2017). However, these multiple interactions are extremely complex and the effects of deforestation on disease vectors vary according to the biology of different species.
Although there is well-documented evidence of the relationship between deforestation and vector-borne diseases, this issue is still controversial, as there is often a simplification of ecosystems composed of pathogens-vectors-hosts (BORINELLI, 2011; ELLWAGNER et al., 2020; MARENGO, 2007). In addition, deforestation is strongly driven by government development policies and subjected to pressure from different national and international economic sectors (HARRERA- BASTOS et al, 1992; METCALF et al., 2017; SCHMIDT, 2007), which generates intense public debate around the evidence of the relationship between deforestation and extremely debilitating diseases such as dengue, malaria and, more recently, COVID-19 (BRANCALION et al., 2020). Finally, several socioeconomic factors interact with biological aspects in determining the occurrence of pathogenic diseases. The nexus between environmental degradation, poverty and disease is also widely studied and controversial (CHAVES et al., 2008). In fact, unplanned urban growth in deforested areas can favor the proliferation of insect vectors (LIMA-CAMARA, 2016). Low socioeconomic indicators are also associated with insufficient basic sanitation, with solid waste disposal and inadequate sewage treatment, in addition to inefficient health care systems (ELLWAGNER et al., 2020; OLIVEIRA, 1993; PIGNATTI, 2003; SCHMIDT, 2007).
Table 1.
Socioeconomic indicators (average values per municipality; n = 853) potentially related to changes in land use and the number of dengue cases in Minas Gerais state, Brazil.
Table 1.
Socioeconomic indicators (average values per municipality; n = 853) potentially related to changes in land use and the number of dengue cases in Minas Gerais state, Brazil.
| Socioeconomic indicator |
Average value (± standard deviation) |
| Per capita GDP (Brazilian Reais) |
19,993.18 ± 22,124.84 |
| Population density |
72.08 ± 339.8 |
| Total urban area (km2) |
424.83 ± 1.376.2 |
| Gini Index |
0.473 ± 0.05 |
| Human Development Index |
0.668 ± 0.05 |
| Poverty vulnerability (%) |
40.70 ± 15.69 |
| Households with running water (%) |
88.37 ± 9.88 |
| Households with garbage collection (%) |
95.55 ± 6.86 |
| Households with inadequate water supply and sewage system (%) |
3.9 ± 5.16 |
In Brazil, several studies have investigated the connections between deforestation and vector-borne diseases in different regions, such as malaria and dengue in the Amazon (CASTRO et al. 2019); dengue in Rio de Janeiro (CÂMARA et al., 2009; MICELI & FONSECA, 2017; MEDRONHO, 1995; OLIVEIRA, 1998) and leishmaniasis in São Paulo (CARDIM et al., 2016; GONTIJO & MELO, 2004); a study carried out by Silva et al. (2022) demonstrated that the increase in the degradation of the Cerrado is directly related to the increase in the incidence of dengue in the region. The study points out that if deforestation continues at the same speed until 2030, it is very likely that the Cerrado regions will have a significant increase in dengue cases.
Dengue is an acute fever disease, caused by a virus (Flavivirus), considered a serious public health problem in the world, especially in tropical countries, where the environmental conditions favor the development and proliferation of the mosquito vector Aedes aegypti (BRASIL, 2002). The vector exhibits heterogeneous, adaptable, and unpredictable population dynamics. It is believed that mosquitoes have undergone adaptations that allowed them to survive in areas with long periods of drought (POWELL, 2018), but with human influence, habitats for reproduction are provided throughout the year, ensuring large population sizes in a short period of time (BRADY & HAY, 2019).
Dengue has a seasonal pattern in Brazil, with a higher incidence of cases in the first five months of the year, when rainfall is more intense and humidity is high (FUNASA, 1999; CHURAKOV et al., 2019; MORAIS et al., 2019). Until the mid-1990s, Southeast Asia was the region of the world most affected by dengue. From then on, the countries of Central and South America began to stand out in this scenario and started to contribute with more than half of the notified cases of the disease across the globe (HALSTEAD, 2006; JETTEN & FOCKS, 1997; TEIXEIRA et al., 2008; TEIXEIRA et al., 1999). Dengue fever is considered as a reemerging endemic or pandemic disease (HALSTEAD, 2008; VIERO et al. 2013) and several outbreaks have occurred in Brazil in recent decades, often in urban areas, with prevention campaigns focused on eliminating residential water reservoirs and applying ultra-low-volume insecticides (UBV) (BRAGA & VALLE, 2007). However, a better understanding of the relationship between the incidence of dengue and deforestation is important for policies to control this disease based on a large-scale ecosystem services approach, with multiple benefits in terms of environmental health.
Thus, the objective of the present study was to analyze the relationship between land use and cover changes (LUCC) in between 2009 and 2019 and the occurrence of dengue in 2015 and 2019, using the state of Minas Gerais as a case study. Despite this regional approach, it is important to highlight the we analyzed an area of 586,528 km2, larger than France. We performed non-spatial regional regression models (KAIMOWITZ & ANGELSEN, 1998) to determine the effects of LUCC, using 853 municipalities as analytical units. Such an approach is adequate because the municipality is the basic level of decision-making in Brazil, which makes trends and patterns of LUCC in the municipality very useful for policy design. In addition, they allow the incorporation of a greater number of covariates obtained from census data that include human population, well-being indicators and economic variables.
Materials and Methods
Study area
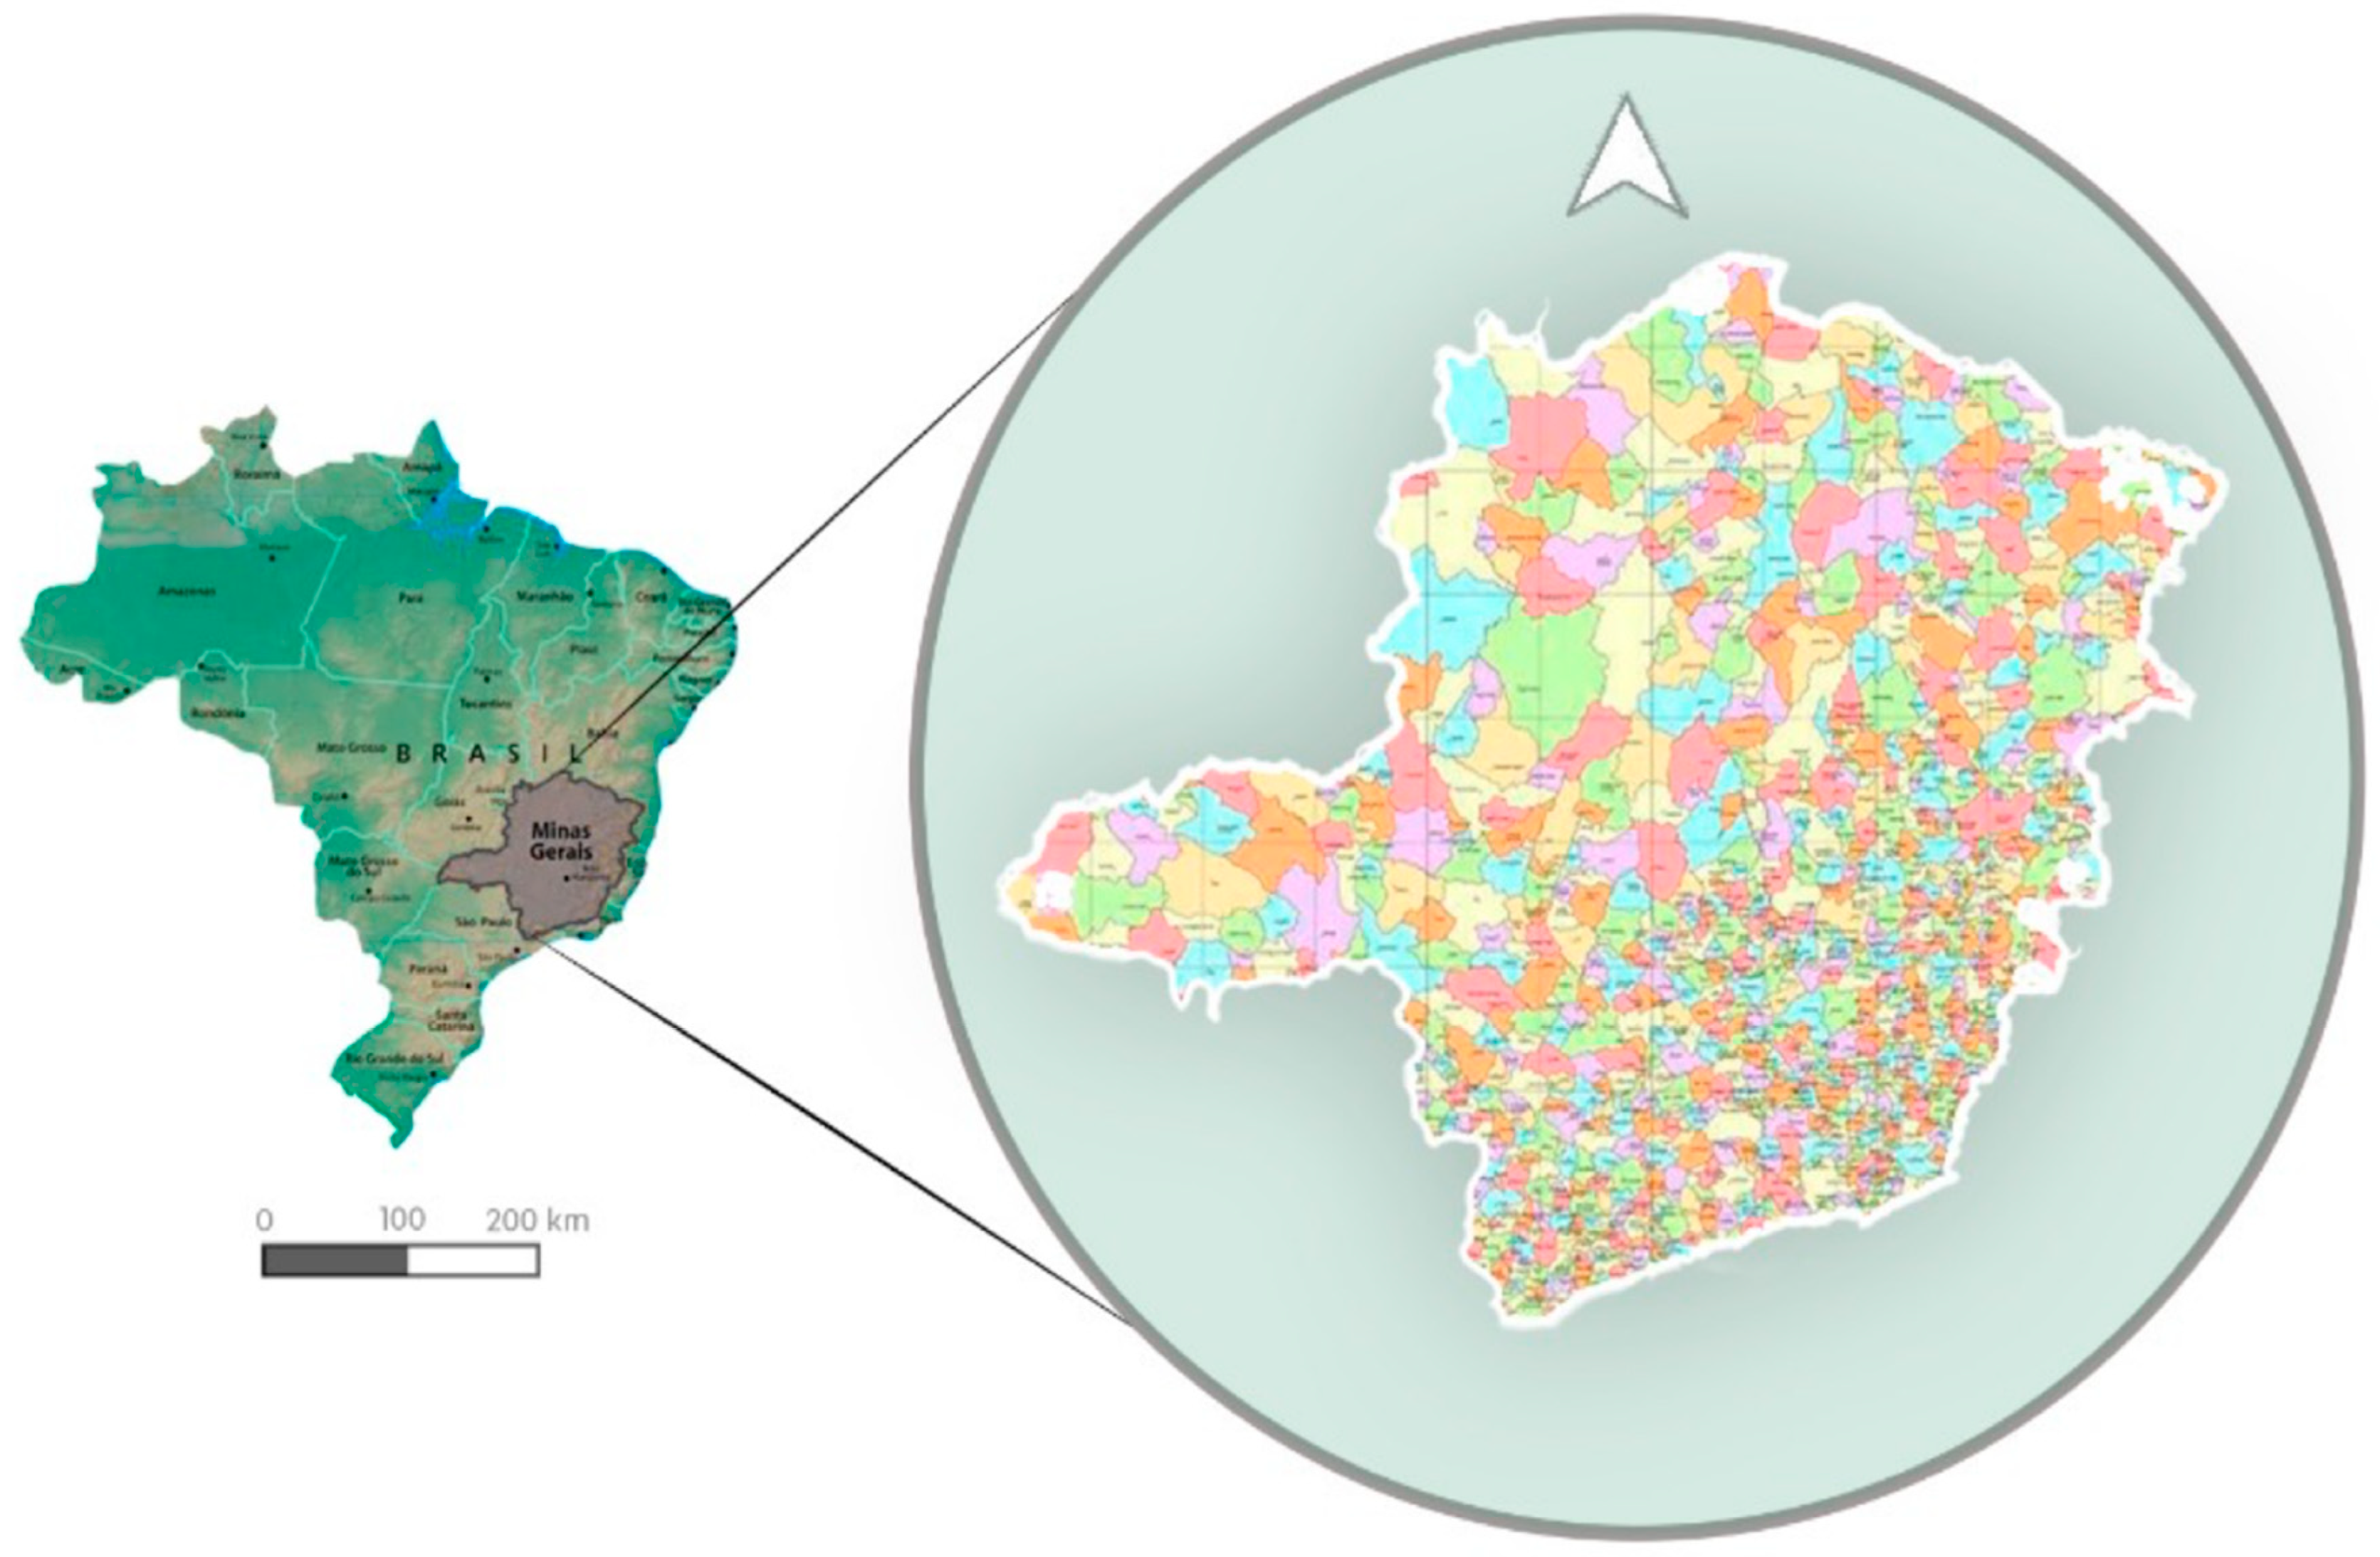
The state of Minas Gerais is located in southeastern Brazil (
Figure 1), with a population of approximately 21 million inhabitants, and is the fourth largest federative unit in territorial extension, occupying 6.9% of the Brazilian territory (IBGE, 2021). It has three predominant climate types: tropical, mountain tropical and semi-arid. The climate presents a unique variability, ranging from a Cwb according to the Köppen climate classification (temperate with cold winters and mild summers) in the south of the state to BSwh (characterized as semi-arid) in the extreme north and northeast of the state (ANTUNES, 1986; IBGE, 2013). Three Brazilian biomes occur in Minas Gerais: the Cerrado (a savannic ecosystem), the Caatinga (composed by tropical dry woodlands) and the Atlantic Rain Forest. The Cerrado has a total area of approximately 2.04 million km
2, but due to deforestation, less than 50% of the original ecosystems are still intact. The Atlantic Rain Forest is located in the southeast of the state in very fragmented areas due to the proximity to large urban centers. The Caatinga occurs in the north of the state, and about 30% to 50% has undergone anthropogenic changes (IEF, 2012).
Obtaining data
Changes in land use and cover
Land use and land cover data were obtained from the MapBiomas website, which is an initiative of the SEEG/OC (Greenhouse Gas Emissions Estimation System of the Climate Observatory) and is produced by a collaborative network of co-creators formed by NGOs, universities and technology companies. MapBiomas information is organized by biomes and cross-sectional themes (MAPBIOMAS, 2019). Data on vegetation cover and the main Brazilian vegetation formations are available on the website (
https://mapbiomas.org/), along with maps of vegetation cover, statistical data and the mosaic of Landsat images for download. The high- resolution maps (30 m pixels resolution) are based on machine-learning algorithms and Landsat satellite images are available through the Google Earth Engine platform (MAPBIOMAS, 2019).
For each municipality, natural vegetation cover (forests, savannas and other natural vegetation) was obtained in 2009 and 2019, the most recent year available at the beginning of this study. We considered that a period of 10 years is sufficient for significant changes in land use and cover in Minas Gerais (THOMAS, 2015), which could affect the occurrence of dengue between 2015 and 2019. Subsequently, the percentage of natural vegetation cover in each municipality was calculated, using the municipal area obtained from Brazilian Institute for Geography and Statistics (IBGE 2020). In addition, we calculated the percentage net change in natural vegetation cover using the formula: [(Area in 2009 – Area in 2019) / Area in 2009] x 100. Thus, negative values indicate deforestation (net loss of vegetation cover in a municipality), while positive values indicate regeneration (net gain in vegetation cover in a municipality).
Dengue occurrence
Dengue cases were obtained for each municipality in Minas Gerais from the Brazilian Ministry of Health database, available at the DataSUS website (
https://datasus.saude.gov.br/), where all data related to disease notifications (of any nature) are available through the Tabnet platform (
https://datasus.saude.gov.br/informacoes-de-saudetabnet/). These data are collected by Brazilian municipalities and sent to regional (state) health departments, from where they are sent to the Secretary of Health of each state, and finally aggregated by the Ministry of Health to be made available for consultation. Dengue cases were obtained for the five most recent years available at the beginning of the study (2015 to 2019), in order to account for the variations that occurred during outbreaks of this disease in certain years. The number of dengue cases was summed in each municipality for the five years and divided by the size of the municipal population in 2021 (IBGE 2021), to obtain the number of cases per 1,000 inhabitants.
Socioeconomic factors
We obtained nine socioeconomic parameters that can also affect the occurrence of dengue for the 853 municipalities in the state of Minas Gerais. Data were obtained from different IBGE databases (2021). The variables used were: population density (IBGE, 2021), gross domestic product per capita (2018); Municipal Human Development Index - HDI (2018), Gini Inequality Index (2010), total urban area (2019), percentage of households with piped water (2018), percentage of households with garbage collection (2018), percentage of vulnerable to poverty (2018) and percentage of people in households with inadequate water supply and sewage system (2018).
Statistical analysis
The effect of changes in land use and coverage on the occurrence of dengue was determined using a generalized linear model (GLM), in which the number of dengue cases per capita in each municipality was used as a response variable. The percentage of net change in natural vegetation cover was used as an explanatory variable, together with the nine socioeconomic parameters described previously. The complete model was simplified stepwise by removing non-significant variables. The minimum adequate model was subjected to residual analysis to verify the adequacy of the error distribution. Model construction and analysis were conducted using R software, version 4.0.0 (R Development Core Team 2020).
Results
Occurrence of dengue in Minas Gerais state
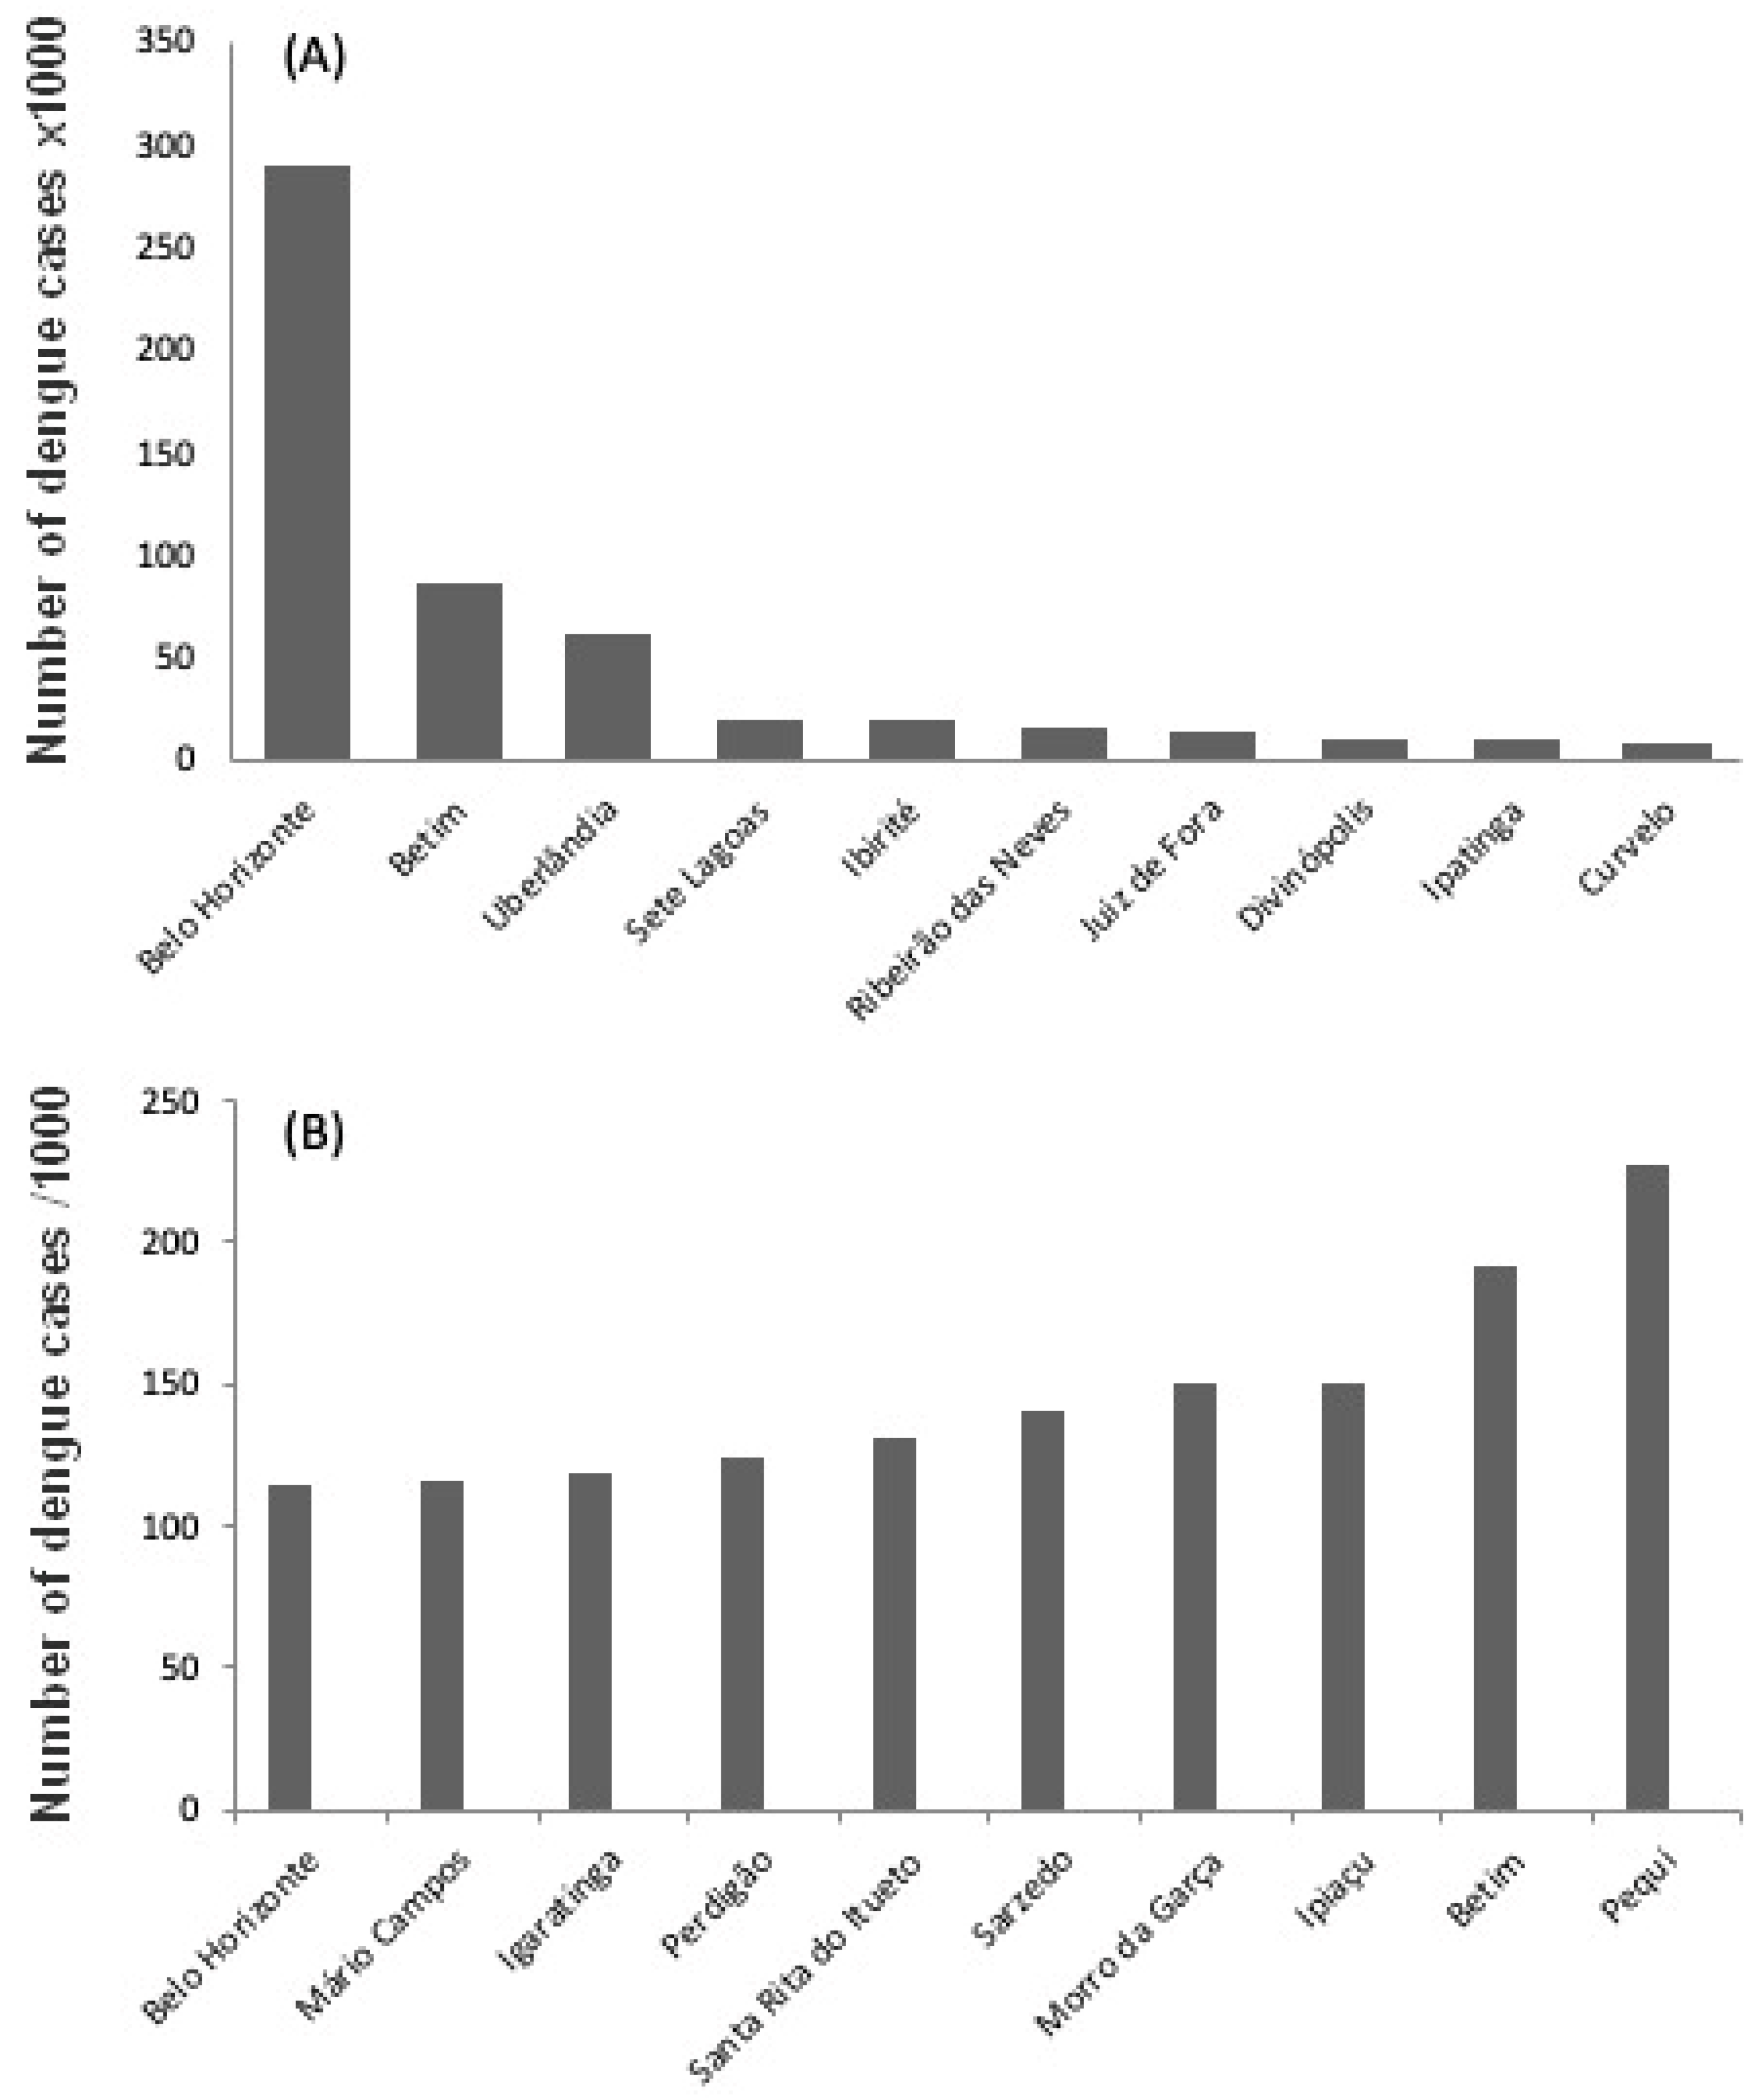
Between 2015 and 2019, 1,255,731 cases of dengue were registered throughout the state of Minas Gerais. In absolute numbers (considering the five years together), the number of cases ranged from zero (in four municipalities) to more than 10,000 (in 9 municipalities), especially in those with the largest total population (
Figure 2a). Belo Horizonte (the state capital) had the highest number of cases, with 290,336. However, the number of cases per thousand inhabitants was high in several small municipalities, ranging from zero (in five municipalities) to more than 100 (in 24 municipalities), reaching 227.51 in the municipality of Pequi, located 120 km capital of Minas Gerais (
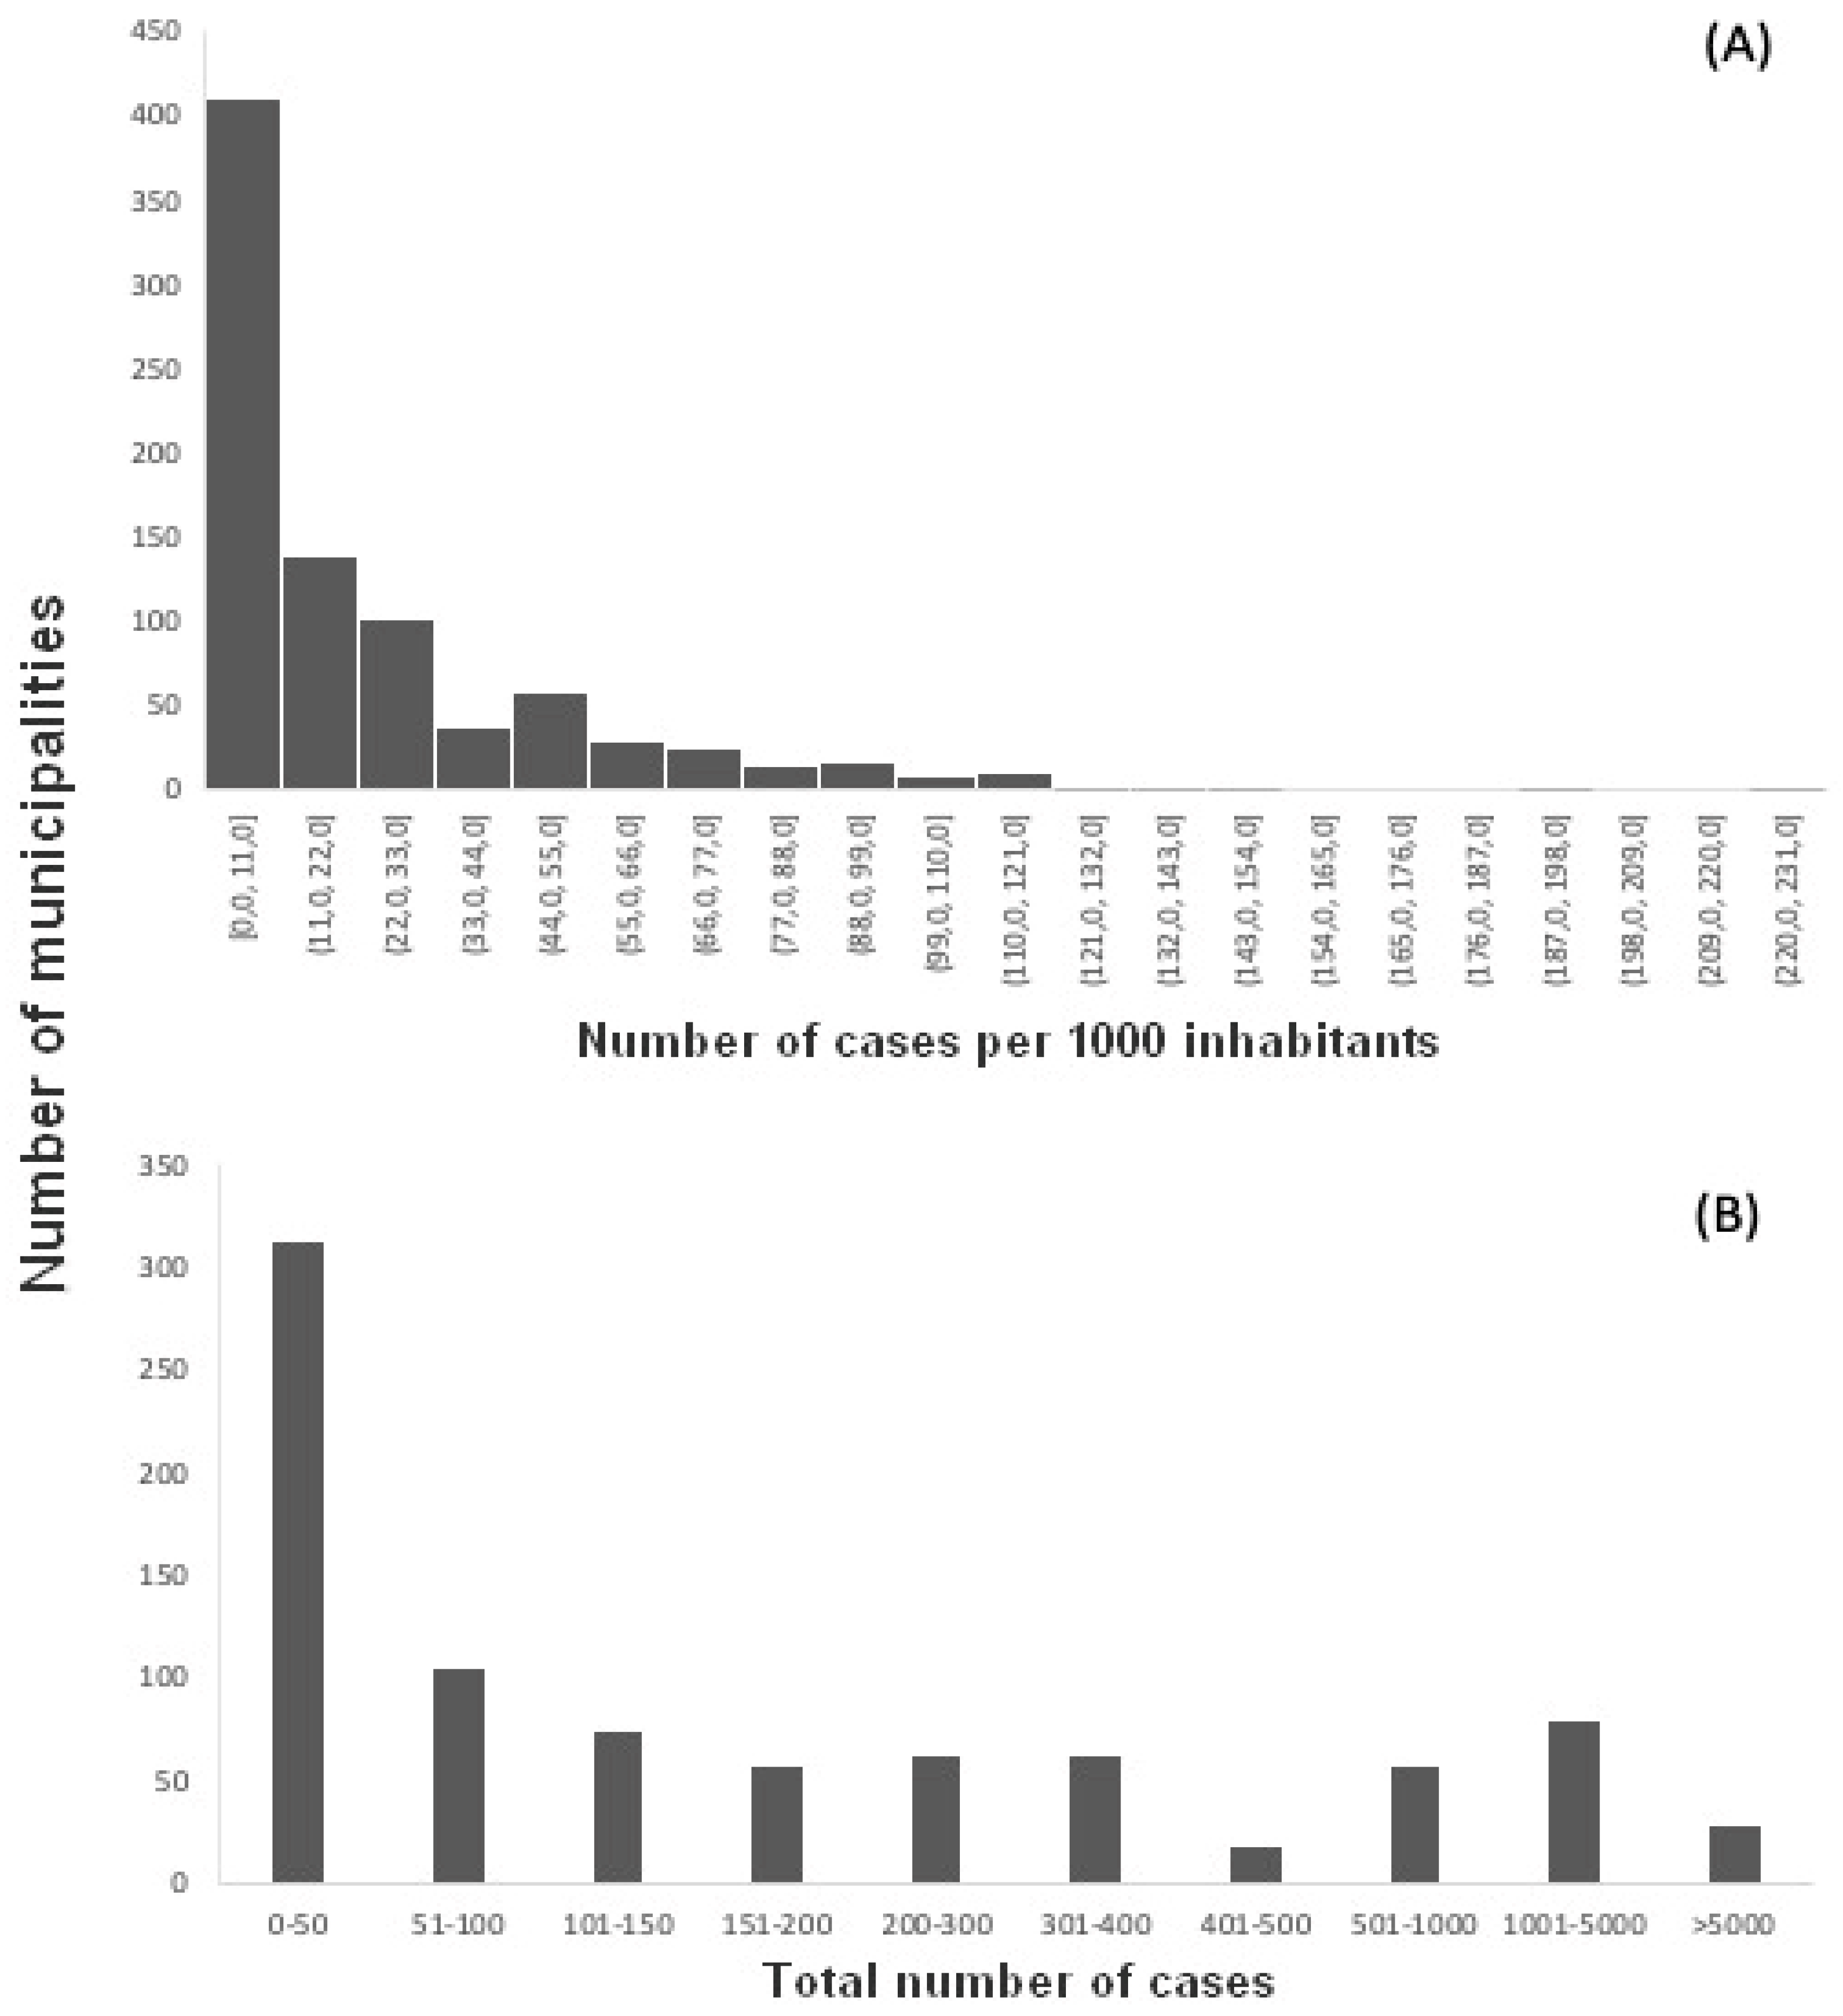
Figure 2b). The vast majority of municipalities had up to 50 cases in total and up to 11 cases per 1000 inhabitants (
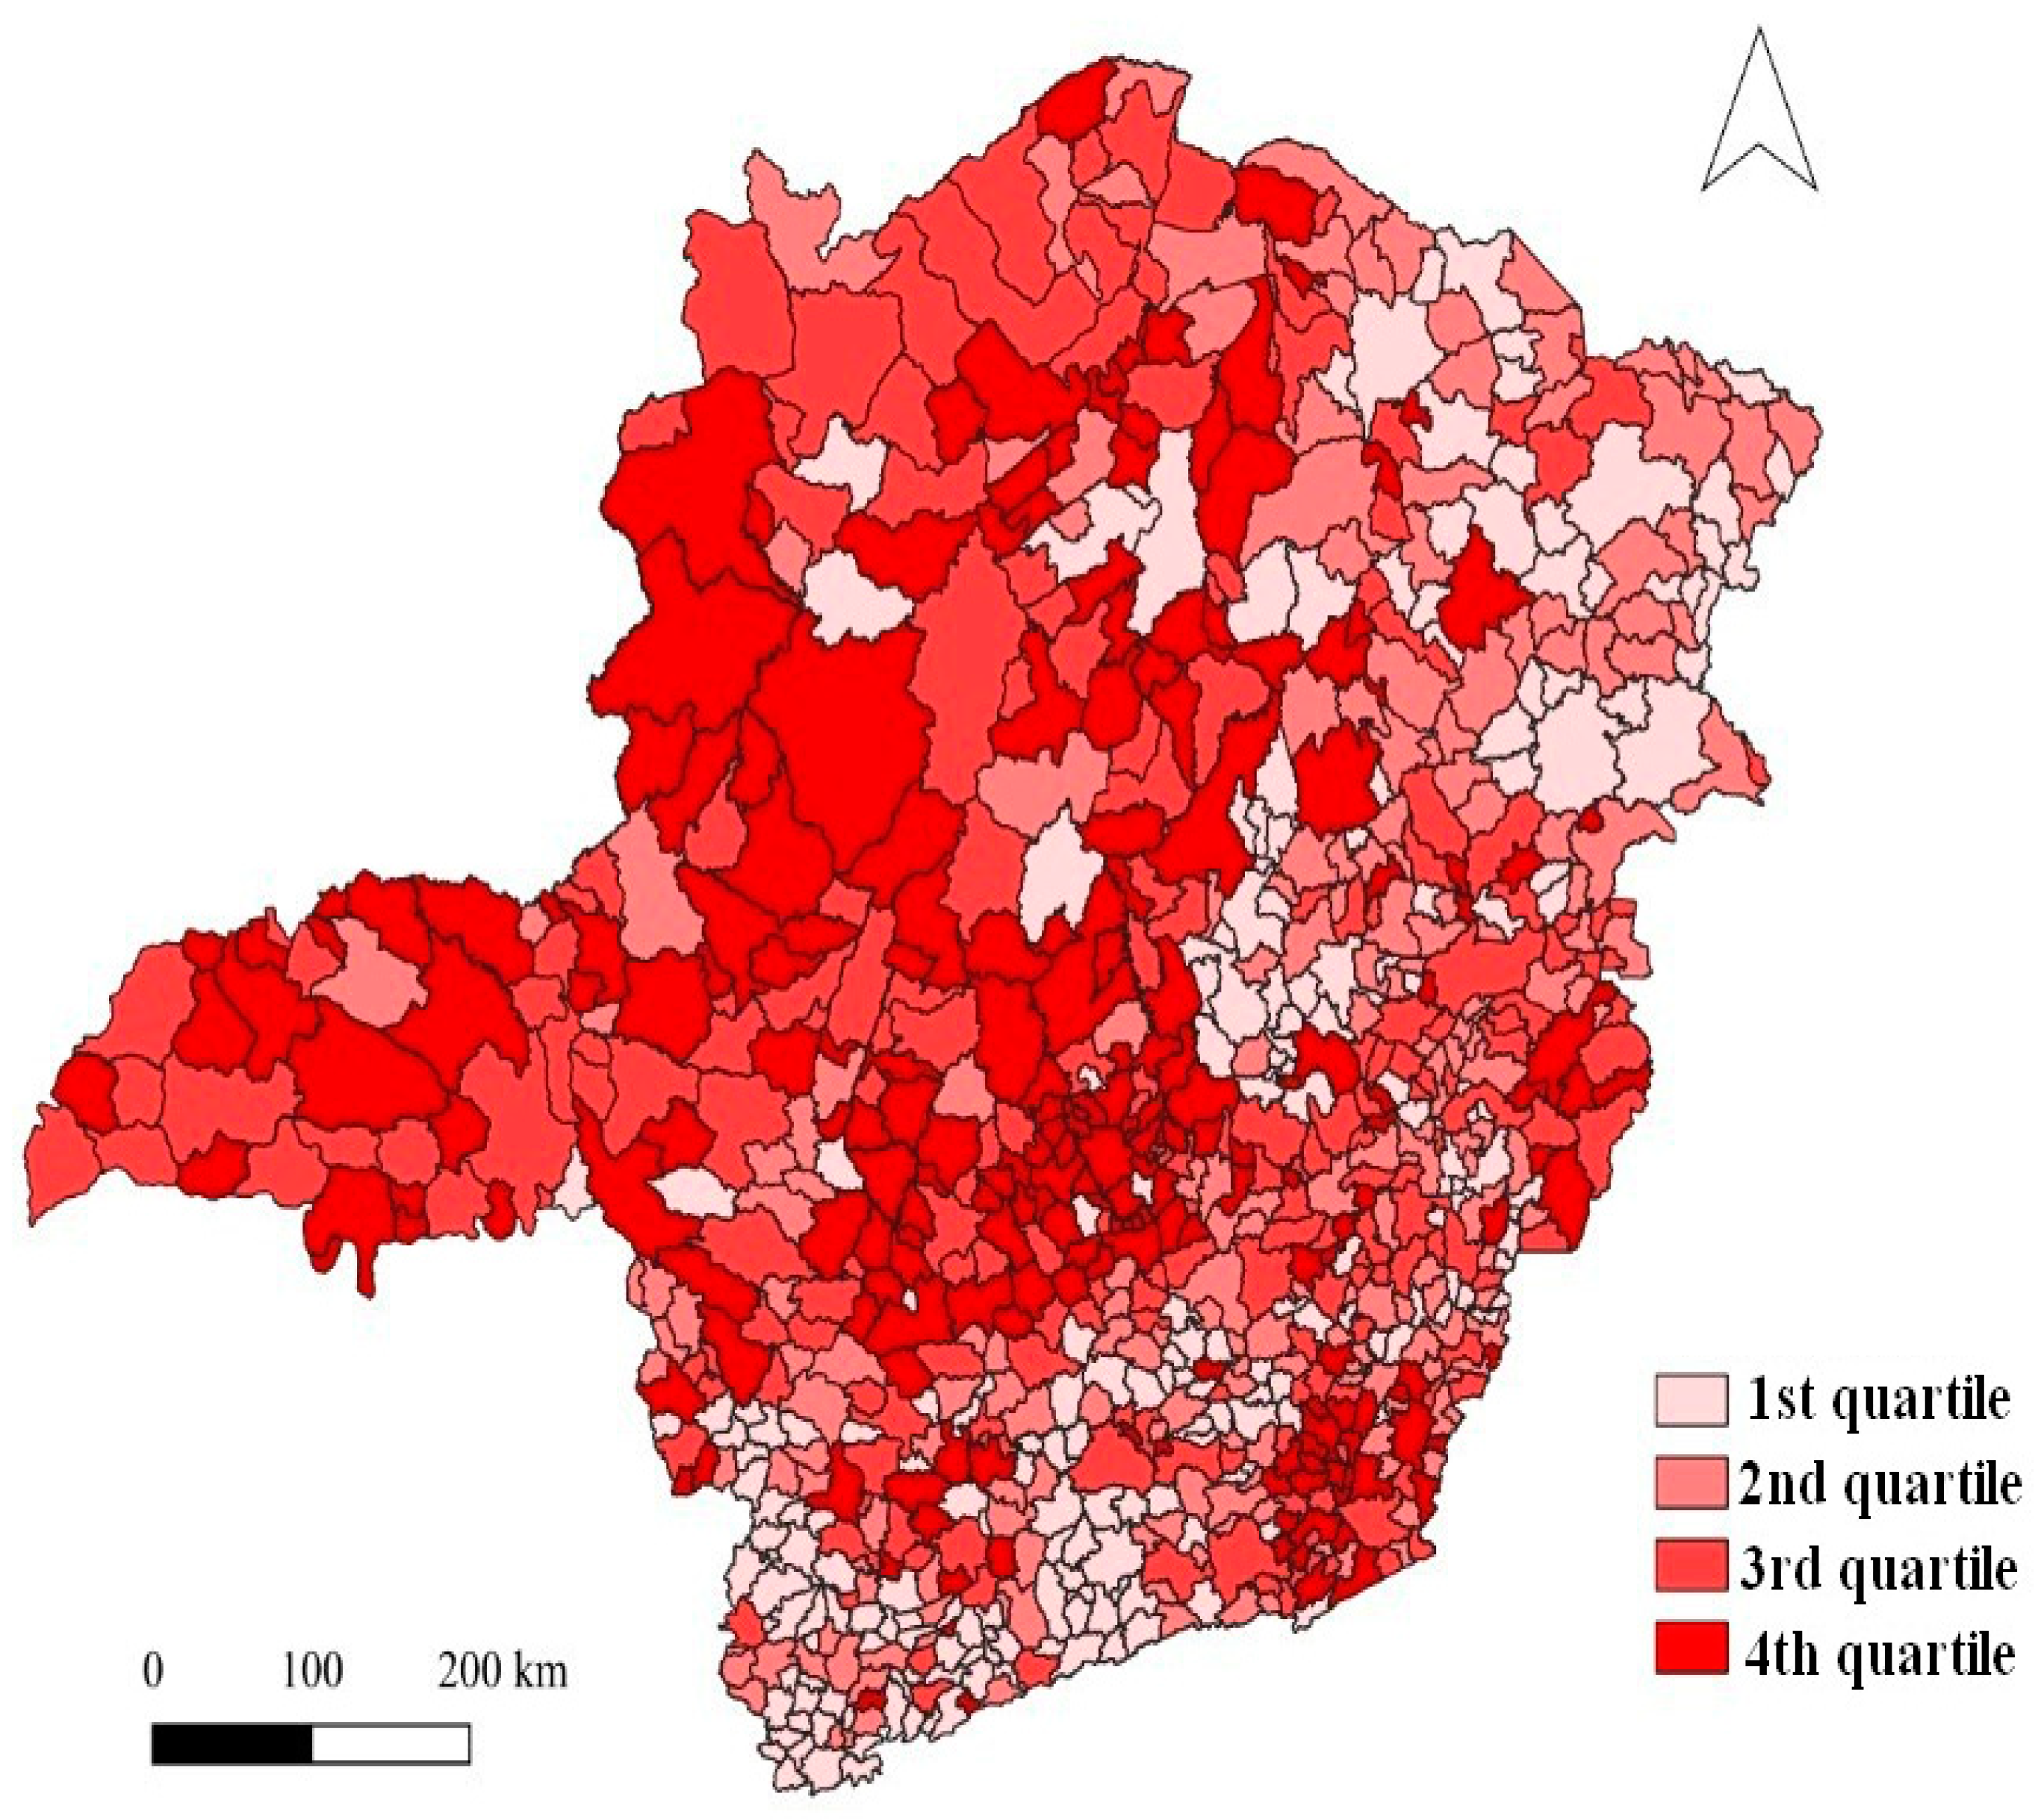
Figure 3ab) from 2015 to 2019. The occurrence of dengue was distributed across all regions of Minas Gerais, but municipalities in the south and northeast of the state had the lowest number of cases (
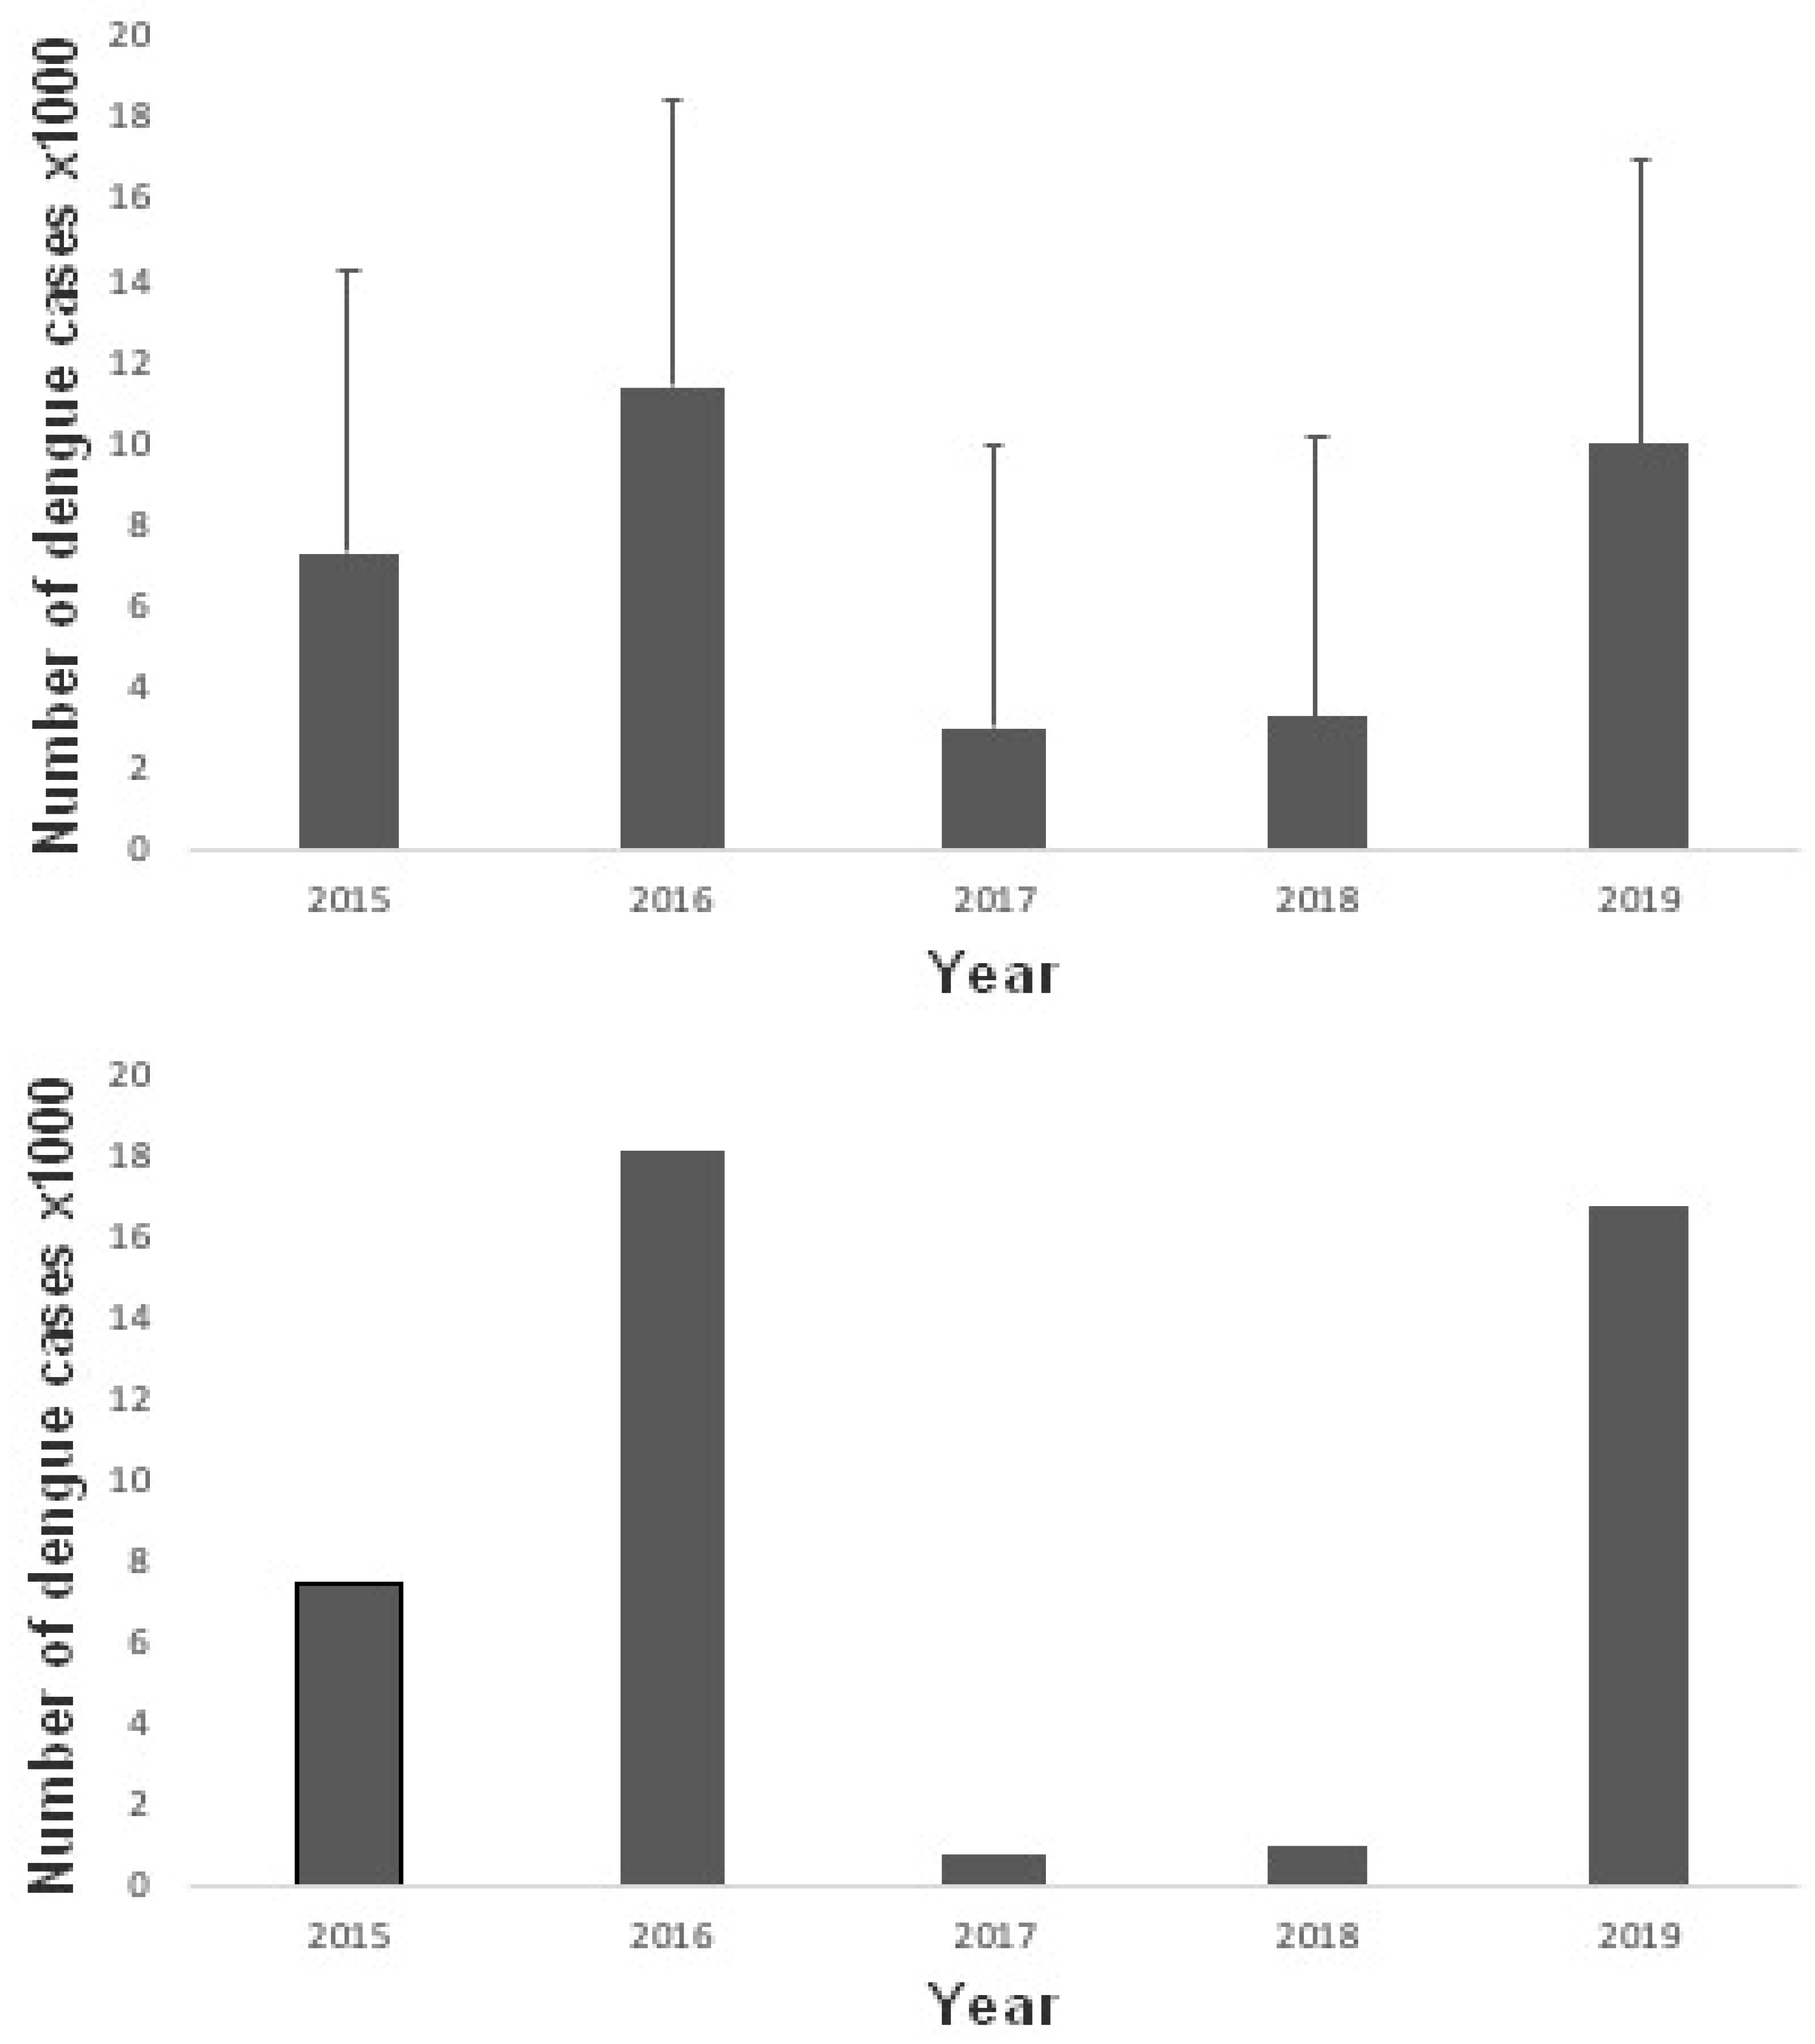
Figure 4). The temporal variation of dengue cases shows the occurrence of two outbreaks in five years, in 2016 and 2019 (
Figure 3b). The average number of cases per municipality reached 11.4 in 2016 and 9.97 in 2019 (
Figure 5a). The total number of cases per thousand inhabitants in the entire Minas Gerais state reached 18.1 in 2016 and 16.7 in 2019 (
Figure 5b).
Changes in land use and land cover
The MapBiomas data indicated that natural vegetation cover varied widely between municipalities in Minas Gerais, from 4.85 to 97.4% in 2009 and from 6.29 to 96.3% in 2019. On average, natural vegetation cover increased slightly from 34
± 20.2% in 2009 to 35.7
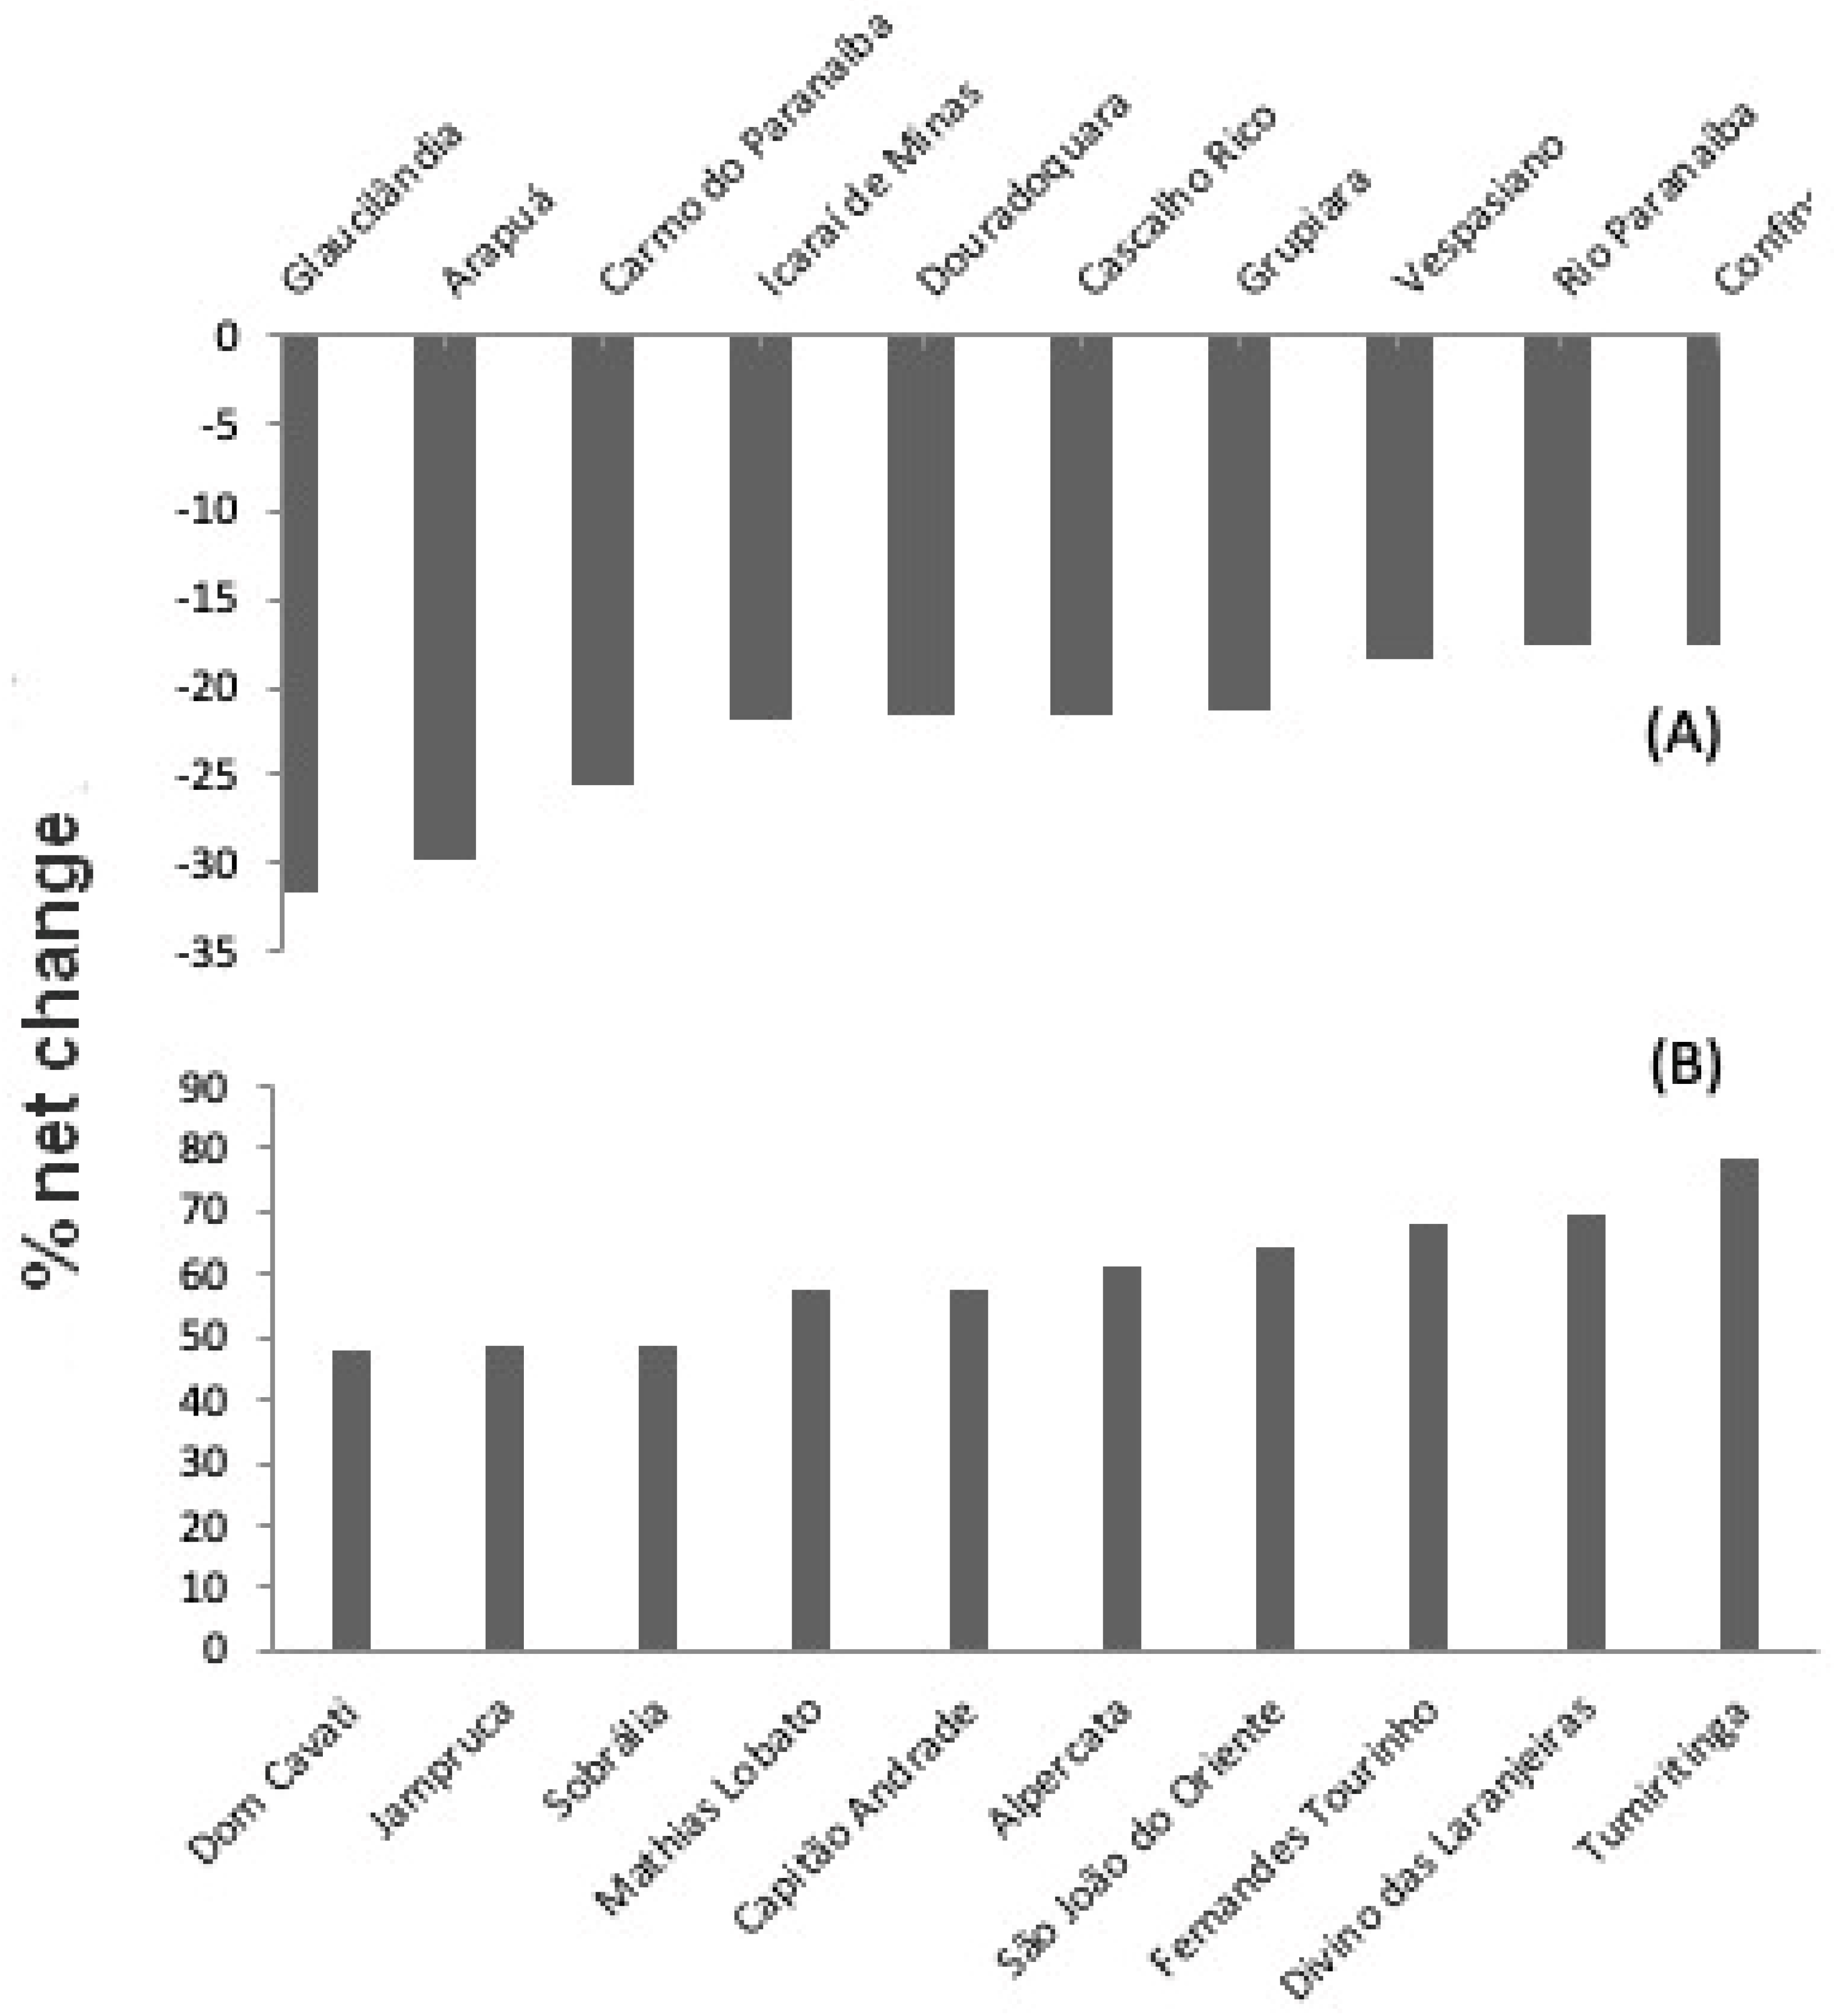
± 19.7% in 2019. Of the 853 municipalities, 341 had a net loss of natural vegetation between 2009 and 2019, with five losing more than 200 km
2 of vegetation during this period (
Figure 6a). The total net loss in 10 years in these municipalities reached -8,240.74 km2. The remaining 512 municipalities had a net gain in natural vegetation, with six of them gaining more than 100 km
2 (
Figure 6b). The total gain in vegetation cover was +6,732.57 km
2.
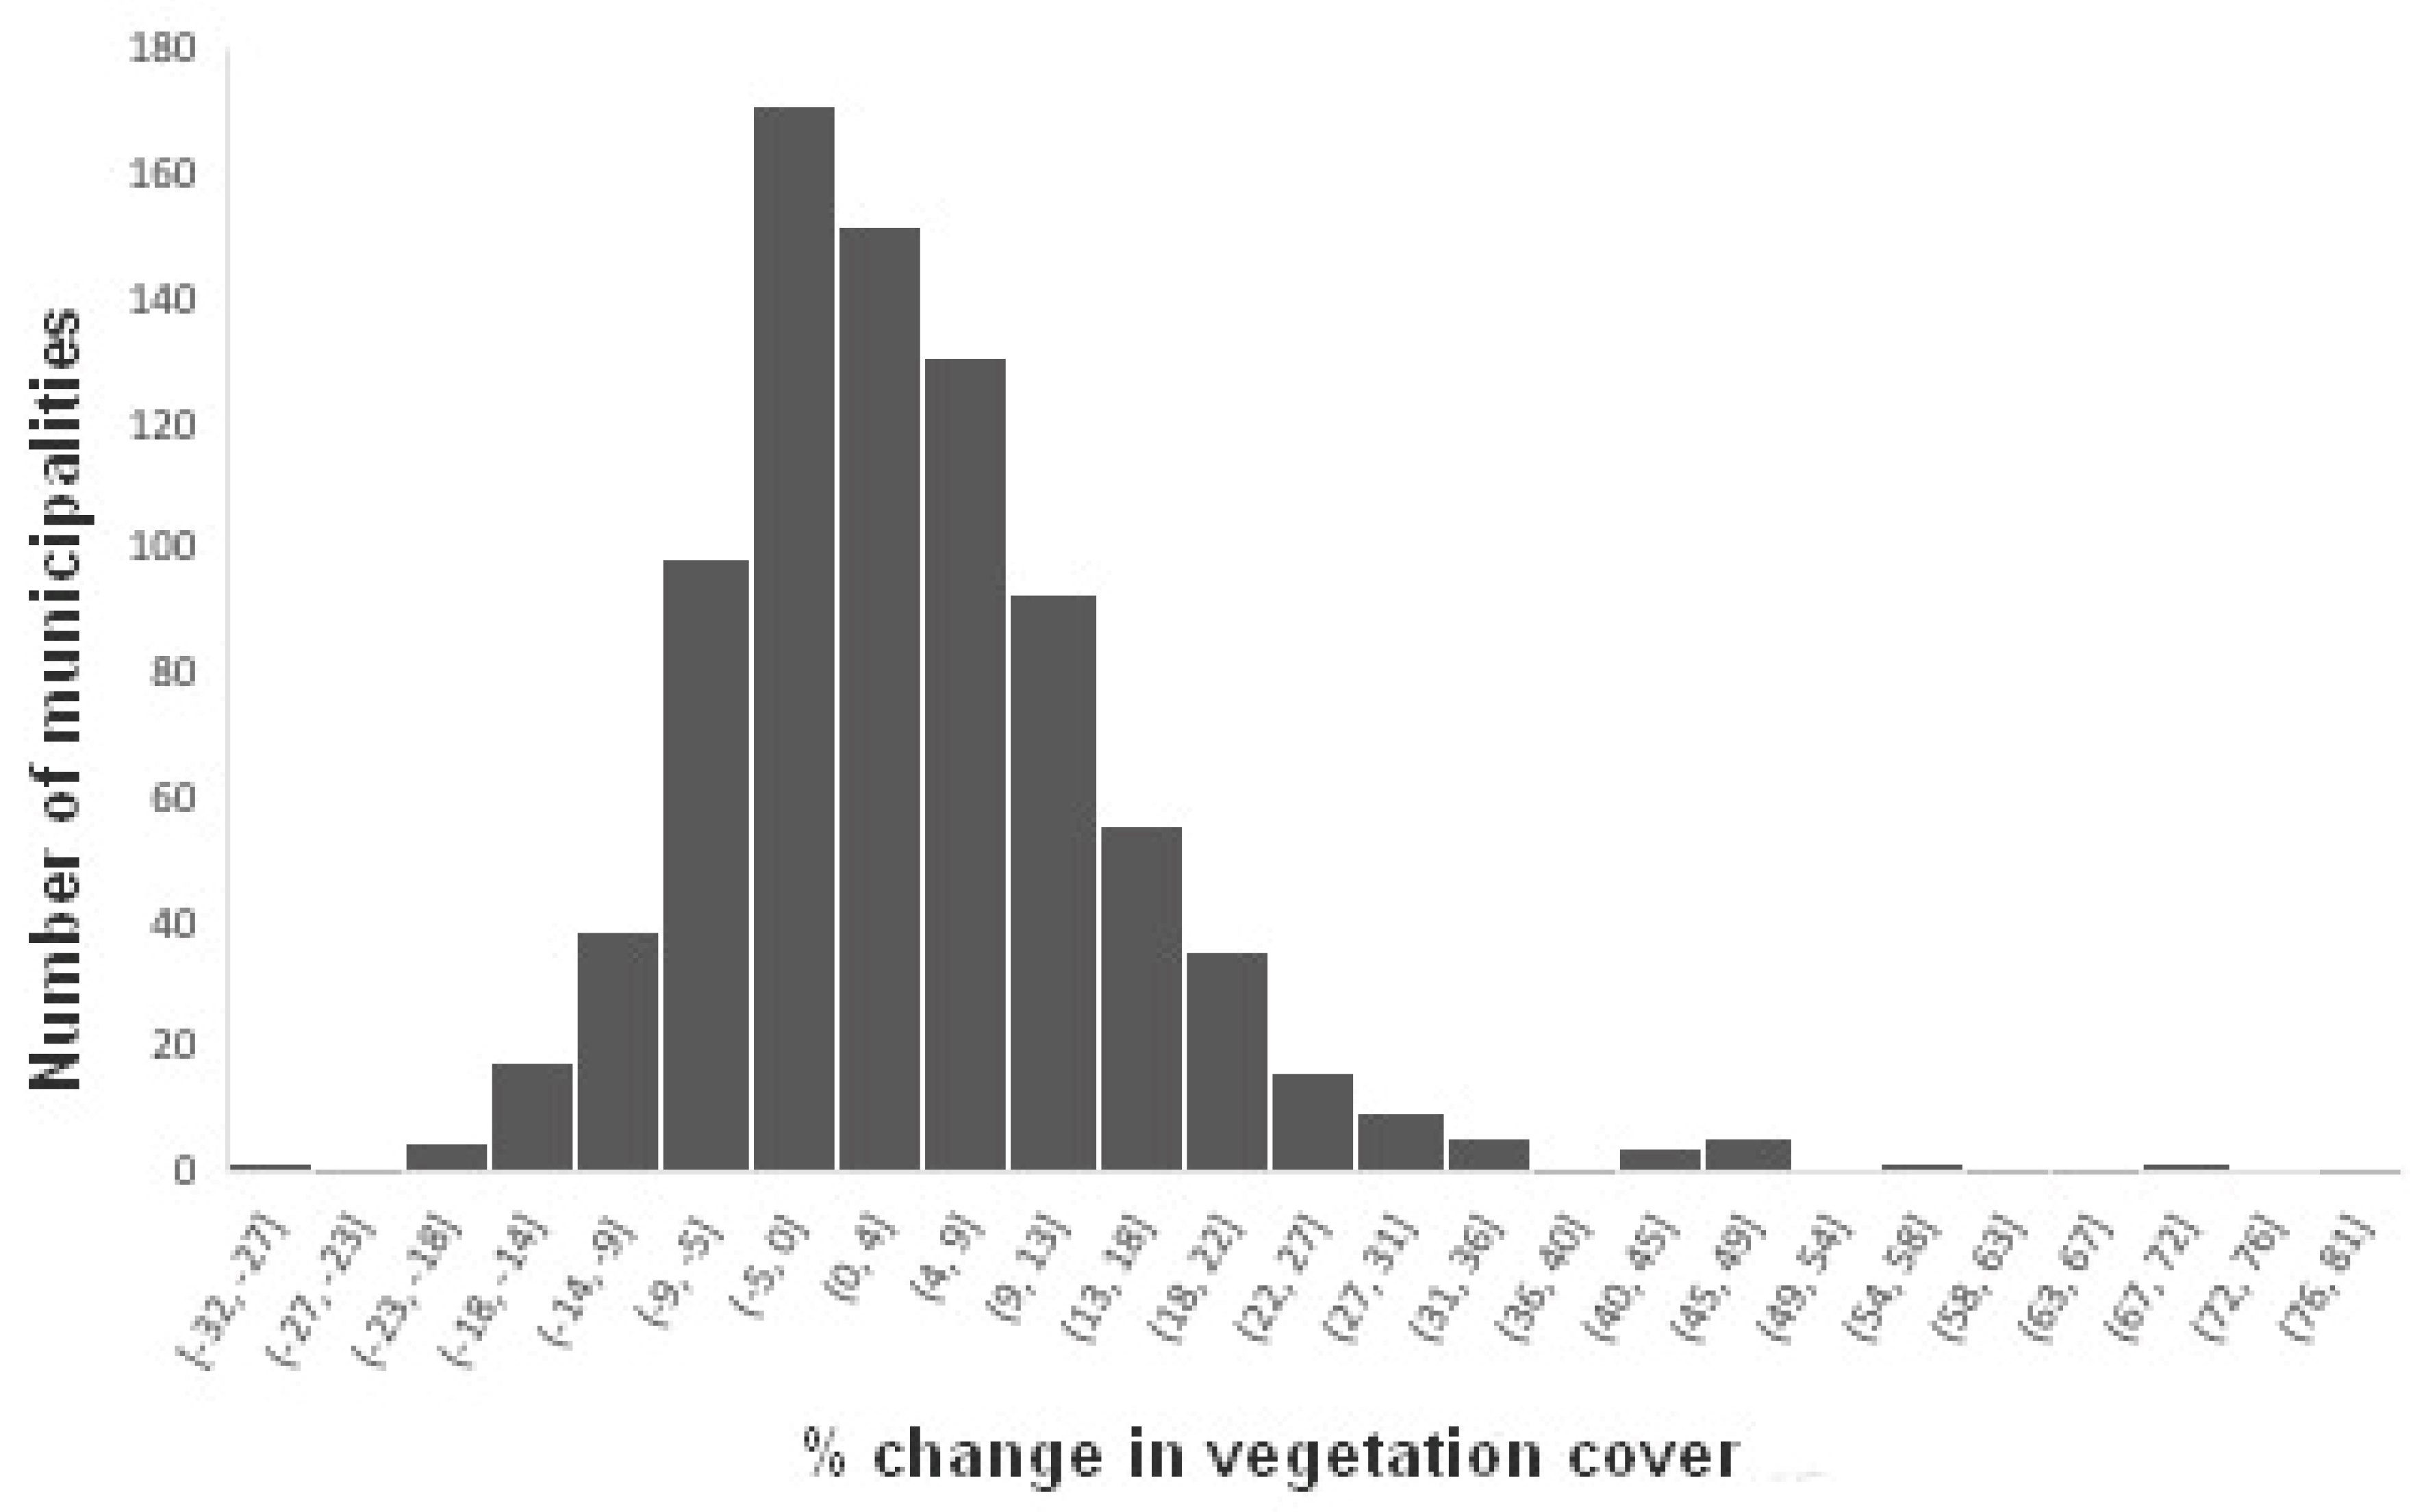
Between 2009 and 2019, most municipalities had net changes in vegetation cover ranging from -10 to +10% (
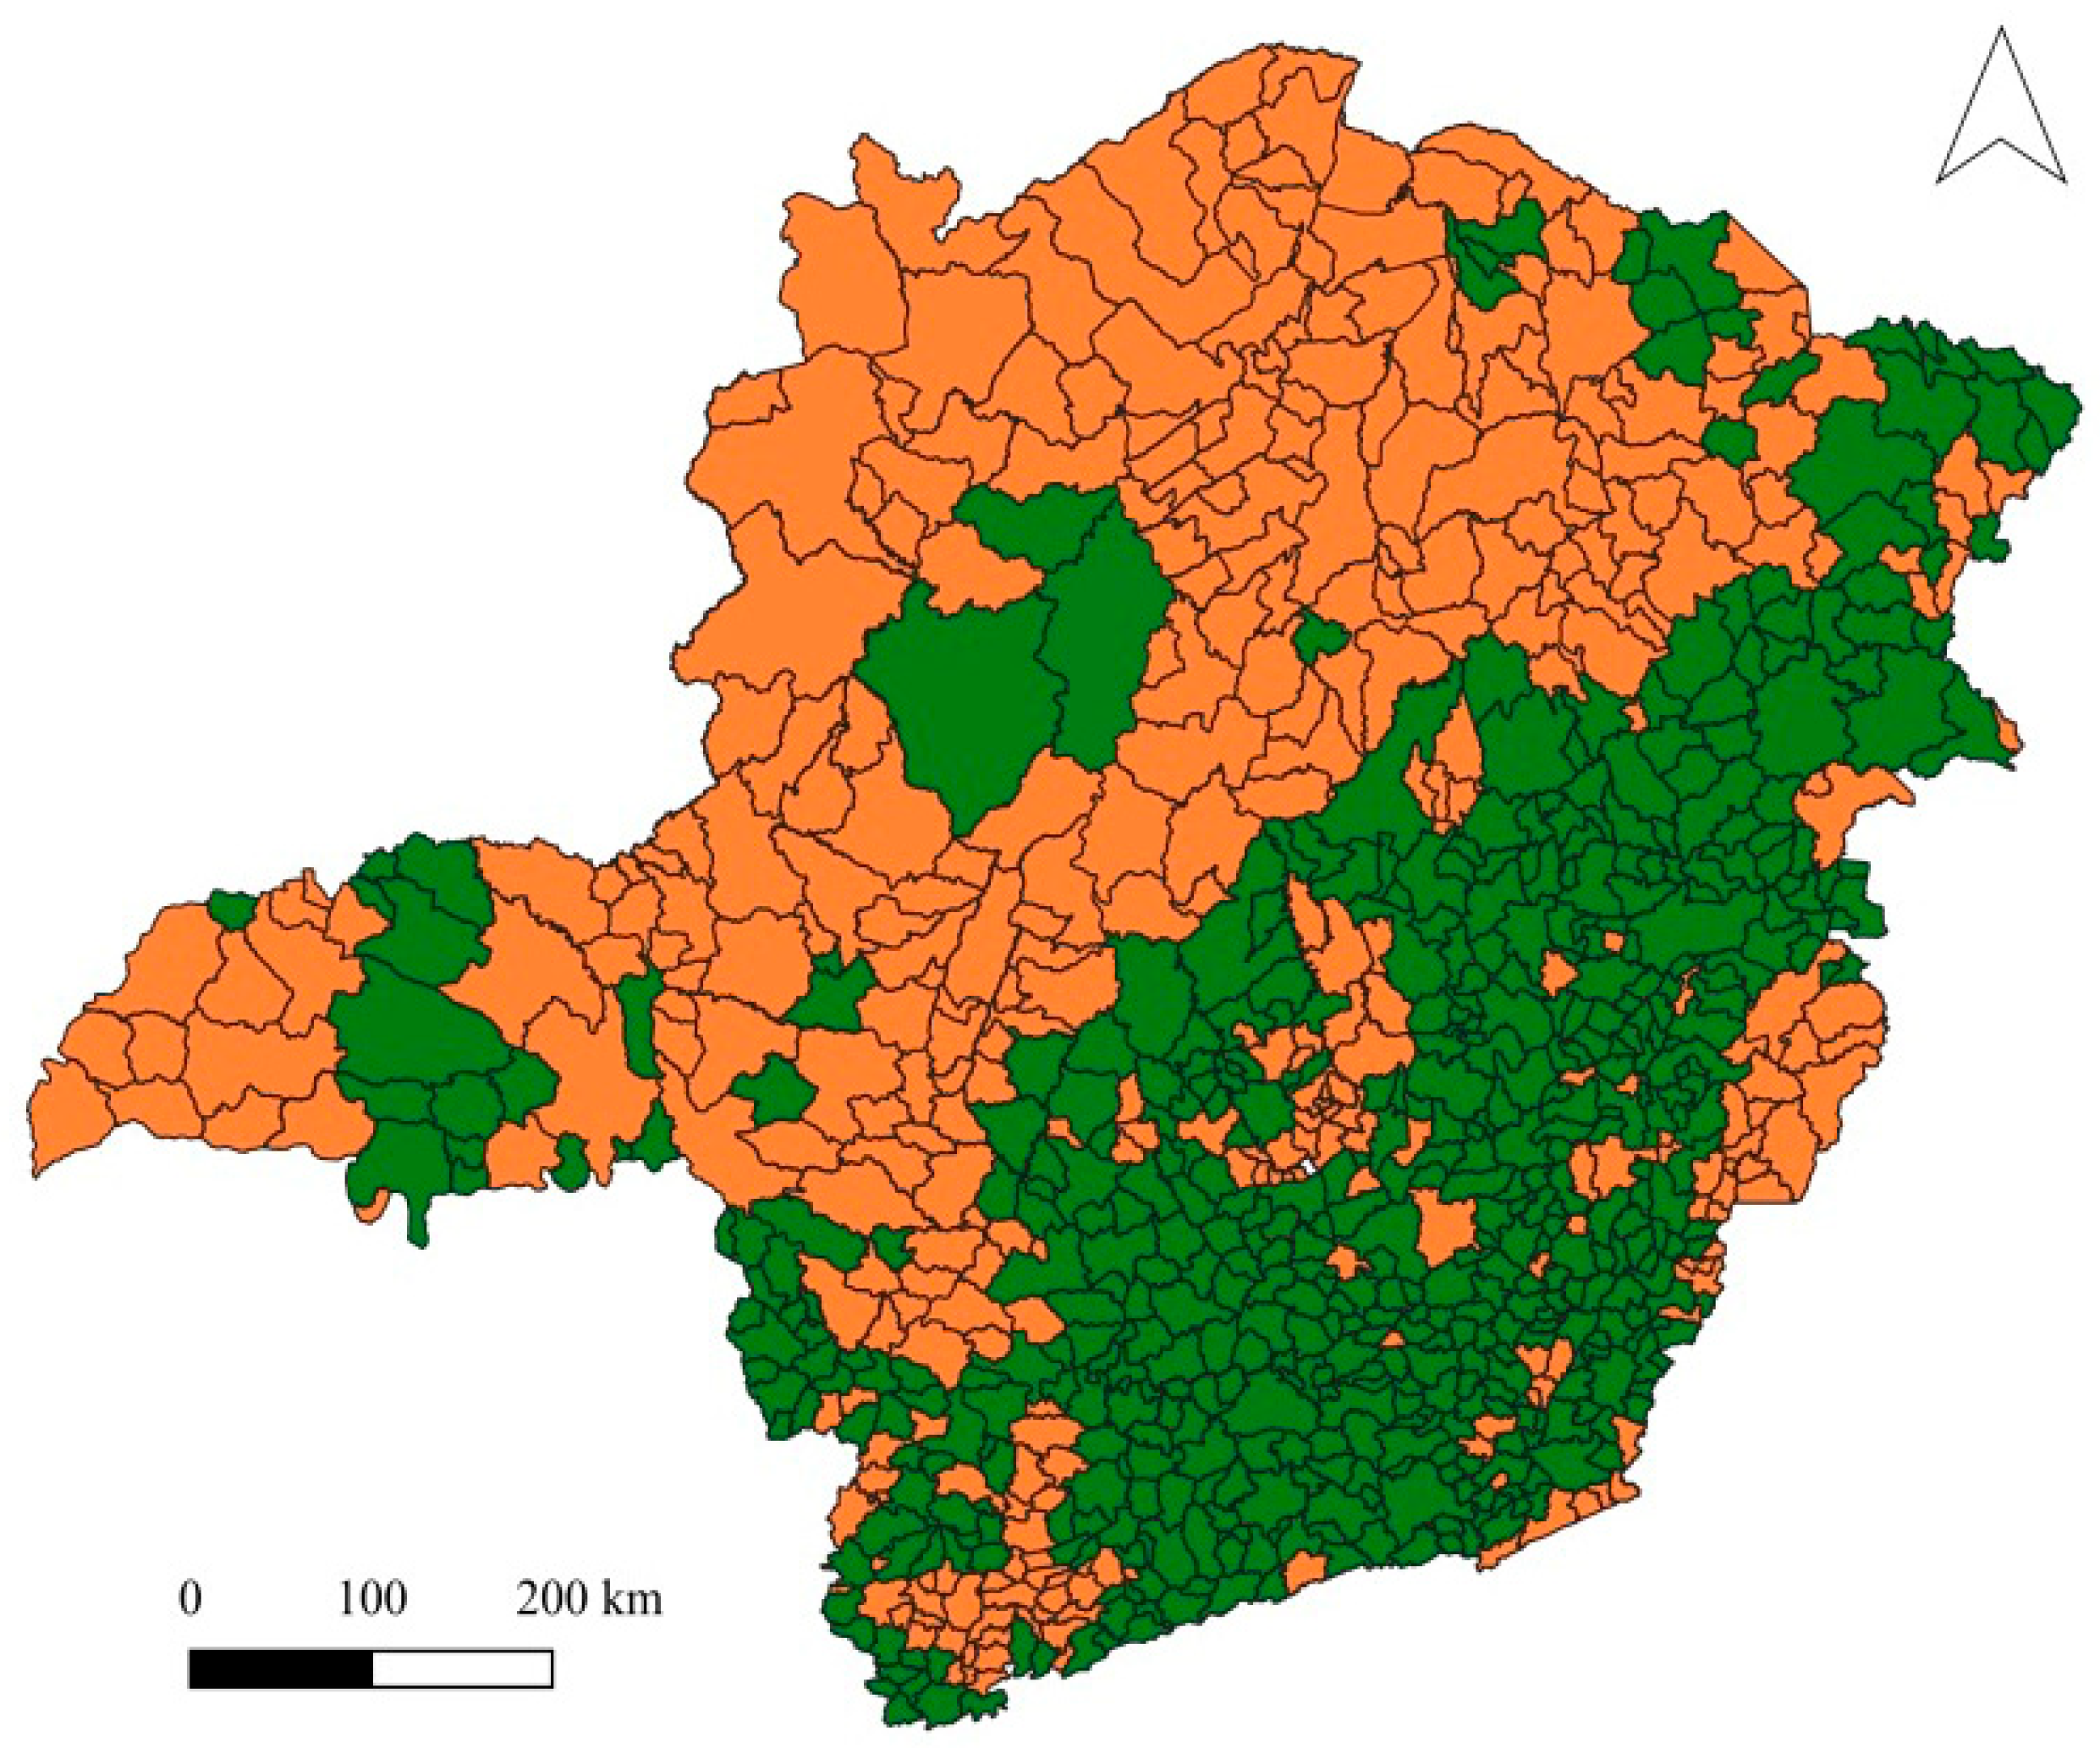
Figure 7). Few municipalities had a high percent loss of natural vegetation, as is the case of Glaucilândia (31.6%; another six municipalities had losses above 20%). A larger number of municipalities (63) had expressive percent gains in natural coverage, in some cases reaching 78%, as in Tumiritinga. Higher percentage changes were generally observed in municipalities with smaller total area. In general, it is possible to notice a clear spatial pattern of changes in vegetation cover, with greater net gain in the center, east and southeast of Minas Gerais state, which are regions predominantly covered by the Atlantic Rain Forest. In the west, north and northwest, where the Cerrado and Caatinga predominate, most municipalities had a net loss of vegetation cover (
Figure 8).
Socioeconomic factors
Basic sanitation data showed that the vast majority of municipalities have selective garbage collection (88.37%) and piped water (95.55%), and few have inadequate sanitary sewage and poor distribution of drinking water (3.39%). The average HDI per municipality was lower than the global average (0.702; UN, 2015), and than the Brazilian average (0.765; IBGE, 2010). Only two municipalities in Minas Gerais had an HDI greater than 0.8: Belo Horizonte (0.81) and Nova Lima (0.813). The vast majority of municipalities with the lowest HDI were located in the north of Minas Gerais, and São João das Missões (0.529) had the lowest HDI. The Gini Inequality Index for the Minas Gerais state was 0.473, which is lower than that observed for Brazil as a whole (0.640; FGV, 2021). Only 13 municipalities had values greater than the national average of inequality, with Jequitibá as the most unequal municipality in the state, with a Gini index of 0.78, and Córrego Fundo the least unequal, with 0.31 (see
Supplementary Materials).
Dengue occurrence and vegetation cover
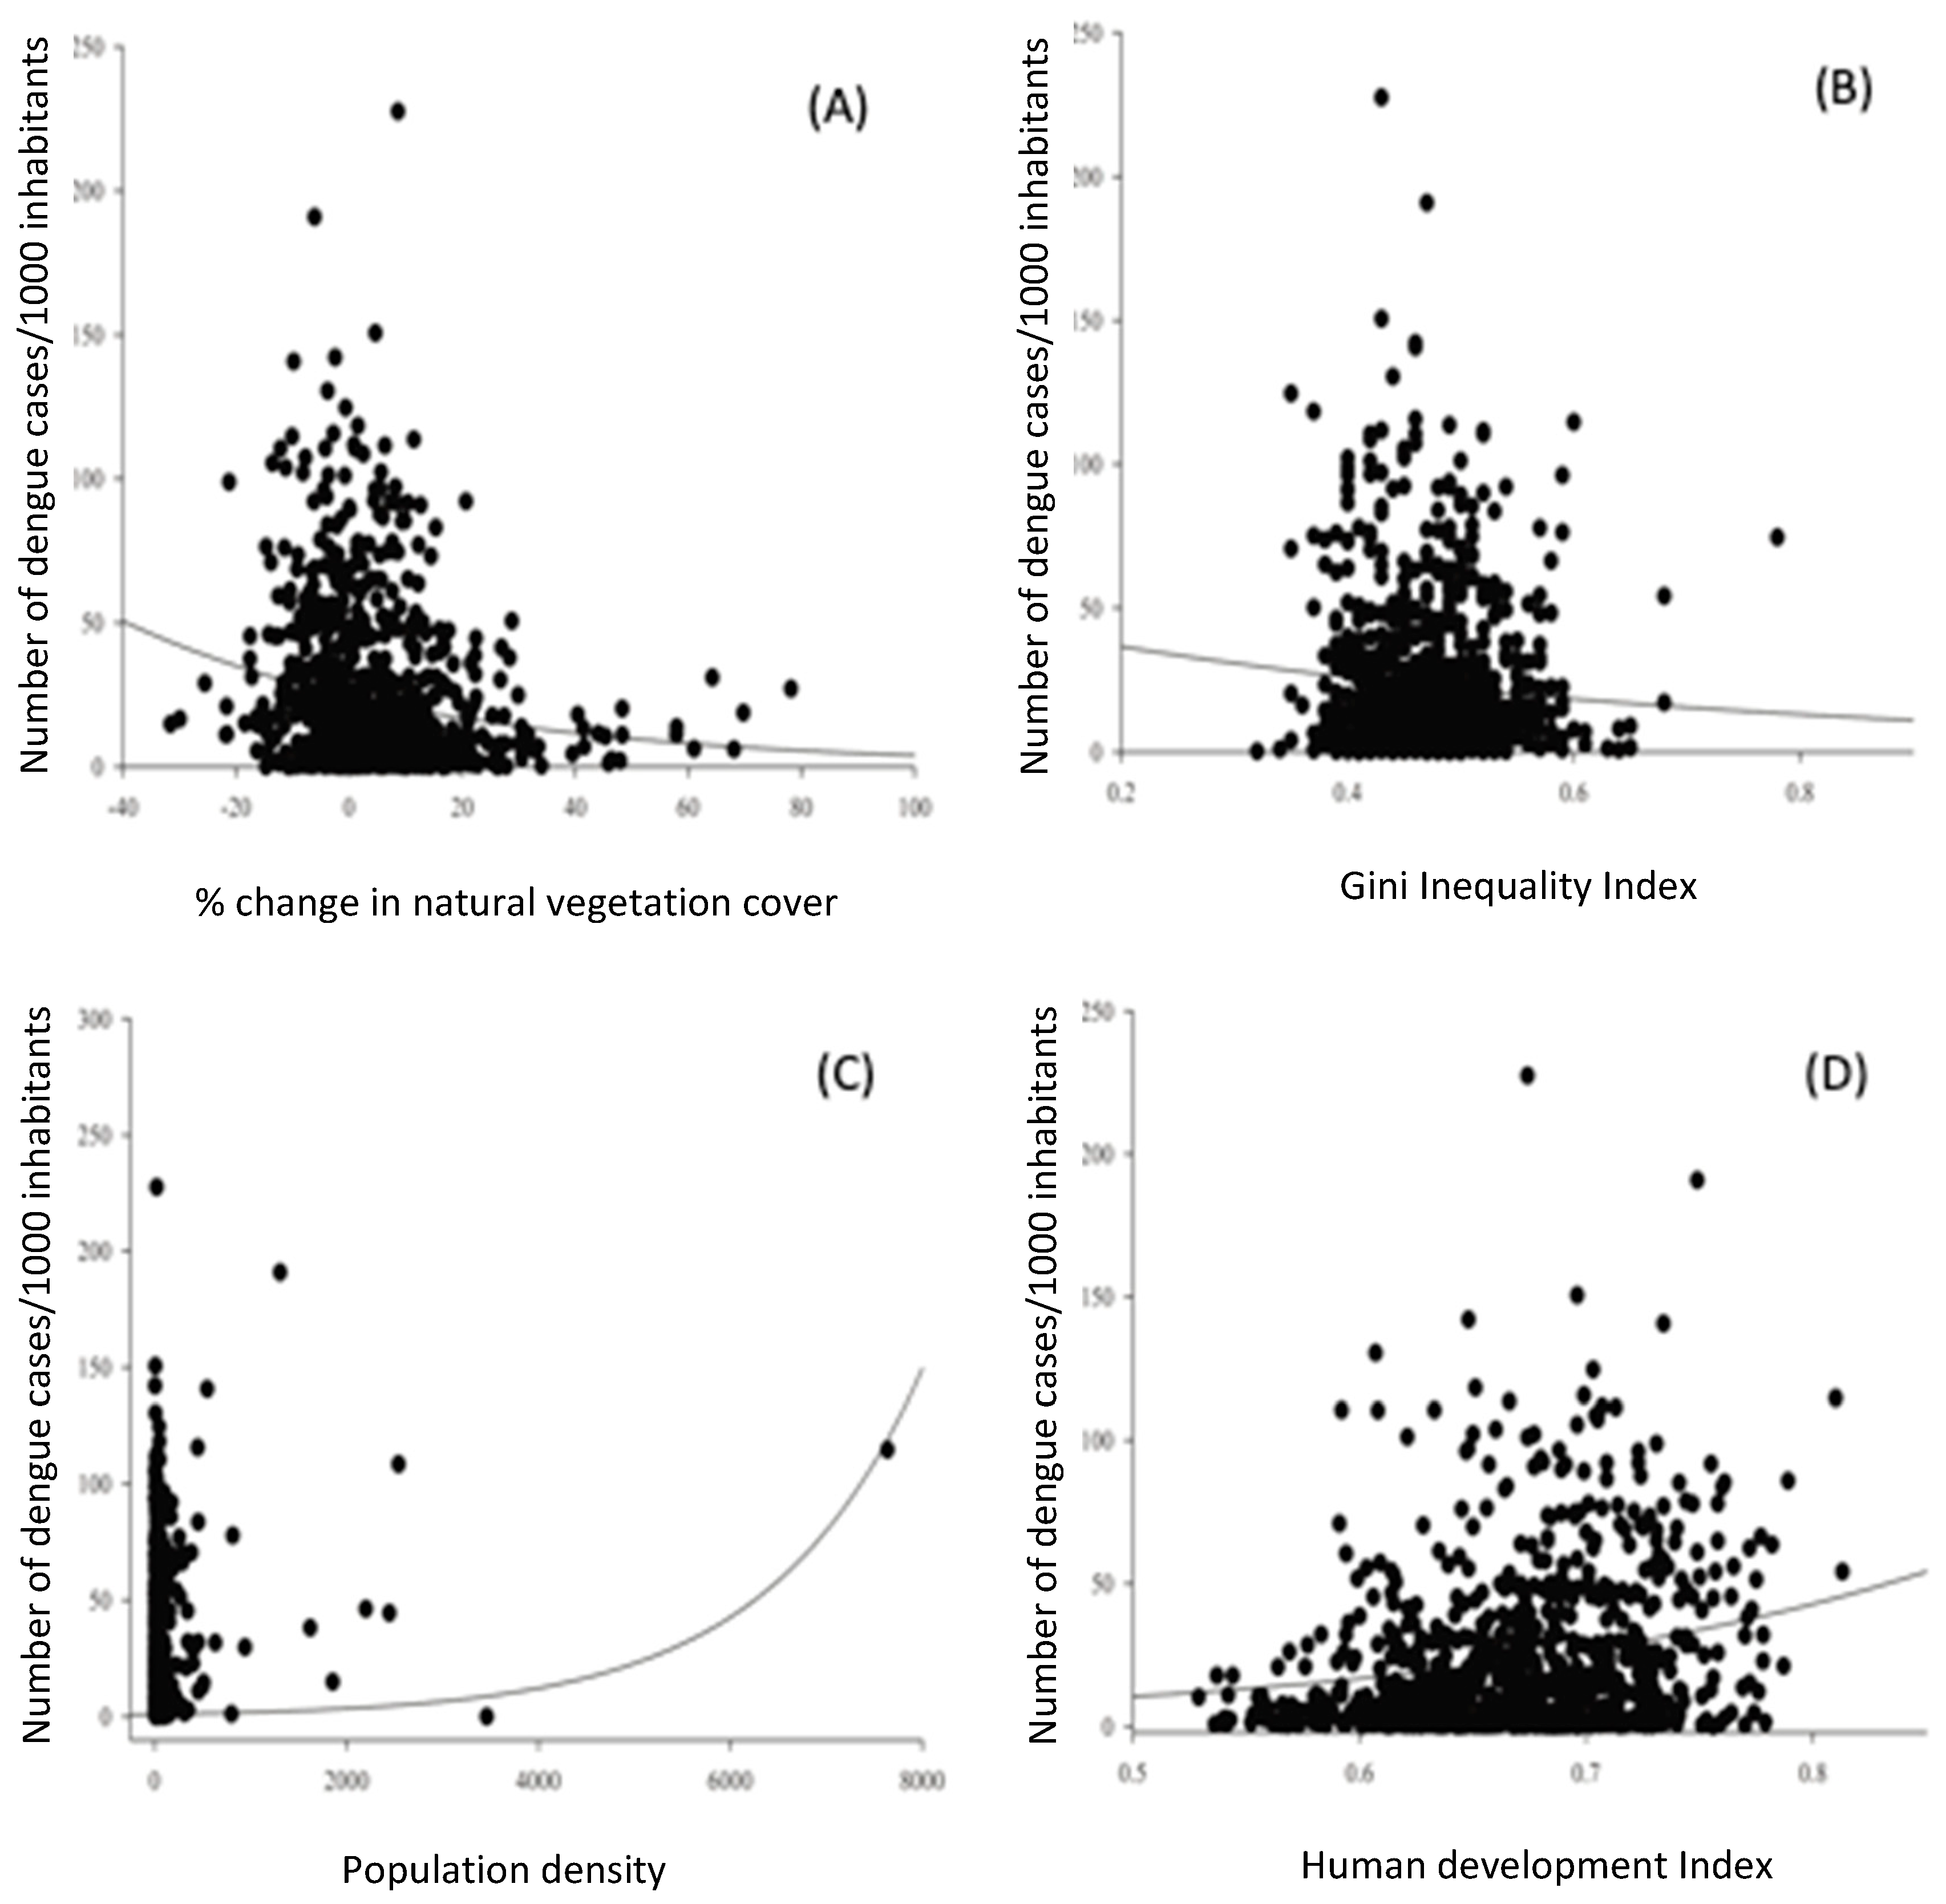
A generalized linear model analysis indicated that the percentage of net change in vegetation cover significantly affected the number of dengue cases in the municipalities of Minas Gerais (
Figure 9a). In general, municipalities with a net loss of vegetation cover between 2009 and 2019 had a greater number of dengue cases between 2015 and 2019. On the other hand, municipalities with a net gain in vegetation cover had fewer occurrences of dengue fever in the studied period. Three other socioeconomic indicators were included in the minimum adequate model (
Table 2;
Figure 9). The highest number of dengue cases occurred in municipalities with lower inequality (
Figure 9b), higher population density (
Figure 9c) and higher HDI (
Figure 9d). Contrary to expectations, indicators focused on basic sanitation did not affect the occurrence of dengue in our analysis.
Discussion
The present study, to our knowledge, is the first to analyze the relationship between dengue occurrence and deforestation simultaneously considering all municipalities in the state of Minas Gerais. Our results demonstrated a positive relationship between these two variables, suggesting that natural vegetation is, directly or indirectly, involved in the ecosystem service of dengue control. However, population density and socioeconomic factors also affected the number of dengue cases per municipality, in a complex relationship that may also involve climatic factors not evaluated in the present study. Despite this, determining the effects of deforestation on a disease with high prevalence and strong socioeconomic impacts is extremely important for the design of integrated environmental health policies throughout Brazil.
Despite a high occurrence of dengue in all mesoregions of Minas Gerais between 2015 and 2019, a lower number of cases were observed in the South and Southwest, Campo das Vertentes, Vale do Rio Doce, Vale do Mucuri and Jequitinhonha regions (see
Figure 4), which are quite diverse from a climatic and socioeconomic point of view. Such mesoregions are found mainly in the Atlantic Forest biome (see
Figure 8), as delimited by the IBGE Biome Map (IBGE, 2013; IEF, 2012) which has a special protection regime defined by the Atlantic Forest Law (Federal Law 11.428/ 2006). According to this law, deforestation is only permitted in areas in early stage of natural regeneration or in cases of public utility and social interest. This restriction on forest conversion may be related to the greater gain in vegetation in most municipalities in this biome in Minas Gerais between 2009 and 2019, being one of the factors responsible for the lower occurrence of dengue in regions of Atlantic Rain Forest.
The same climatic and socioeconomic diversity is observed for the mesoregions with the highest occurrence of dengue, such as the West, Northwest and North of Minas, Triângulo Mineiro and Alto Paranaíba and the Metropolitan region of Belo Horizonte (see
Figure 4). In these regions, the Cerrado and Caatinga biomes predominate (IBGE, 2013; IEF, 2012), in which land use is governed by the Native Vegetation Protection Law (Federal Law 12651/2012). In these cases, deforestation of up to 80% of each rural property is permitted, with only 20% being kept as a “legal reserve”. In the northern region of Minas Gerais, seasonally dry, deciduous forests are considered as part of the Atlantic Forest biome by the Decree 6660/2008, but suffer high rates of deforestation even with this protection (DUPIN et al. 2018; ESPÍRITO-SANTO et al. 2020). Several studies have already demonstrated the relationship between the incidence of arthropod-borne diseases and deforestation (BAUHOFF & BUSCH, 2020; BURKETT-CADENA & VITTOR, 2018; CASTRO et al., 2019; ELLWANGER et al., 2020; YASOUKA & LEVINS, 2007), including dengue in other regions of Brazil (AMARAL, 2015; HORTA et al. 2013; MICELI & FONSECA, 2017; OLIVEIRA, 1998; VIERO et al., 2013). MacDonald and Mardoqueu (2019) used the regionalization of areas in the Amazon to more effectively identify the relationship between malaria cases and deforestation, making clear the importance that native areas have for local public health. These researchers reported that, even in the most pessimistic scenarios, the reduction in the number of infectious disease cases in tropical regions will only happen through an extreme reduction in deforestation and the implementation of public policies aimed at mitigating, monitoring and conserving natural vegetation. Furthermore, urbanization without minimal infrastructure (for example, access to basic sanitation), associated with the change in habits and cultural costumes of the Amazonian population, created ideal conditions for
Aedes aegypti, the main vector of dengue, chikungunya, and Zika virus (CASTRO et al., 2019).
In the specific case of dengue, some studies at different spatial scales have investigated the relationship between the incidence of dengue and deforestation in Brazil, with contrasting results. Moura et al. (2014) observed that, for the state of Rio de Janeiro, the number of dengue cases between 2001 and 2007 was positively correlated with the extent of fires and the absence of basic sanitation. Silva et al. (2022), considering the entire Cerrado biome, found a positive relationship between the occurrence of dengue and deforestation between 2001 and 2019. These authors also projected, through simulation models, an increase in the number of dengue cases by 2030 for the states of Minas Gerais, São Paulo and Mato Grosso due to the increase in deforestation. However, Kalbuset al. (2021) found no relationship between the incidence of dengue and deforestation in the state of Amazonas, with the number of cases between 2007 and 2017 influenced only by access to basic health care. This lack of relationship was also found by Morais (2011) for 67 municipalities in the Atlantic Rain Forest of Minas Gerais state. These conflicting results, depending on the region and period of study, reflect the fact that the incidence of dengue is related to multiple factors that interact in a complex and non-linear way, as indicated in a recent systematic review carried out by Sousa et al. (2021). These authors analyzed 35 studies published in Brazil and concluded that several environmental, socioeconomic and climatic variables affect the number of dengue cases. There is an urgent need to expand the debate between the health relationship and environment, since the effects on human health arising from environmental changes are serious (BARATA, 1997; SILVA et al, 2015).
Our analysis also showed that the occurrence of dengue was higher in municipalities with a lower Gini Inequality Index and higher HDI, contrary to what we expected. Social factors can act as disease facilitators, including dengue (BRITTO, 2011). Dengue control is hampered by demographic growth, inadequate urban infrastructure and insufficient medical and health services. Furthermore, basic sanitation is an important factor, as it increases the number of breeding sites, favoring the proliferation of the mosquito vector (MENDONÇA, 2003; TAUIL, 2001). As in the case of deforestation, studies carried out in Brazil have not shown a consistent pattern regarding which socioeconomic factors most strongly influence the number of dengue cases. However, this disease is usually positively affected by high inequality in income distribution and low education (ALVES 2015, CARMO et al. 2020, SOUSA et al. 2021, COUTINHO et al. 2022). Despite this, Morais (2011) found a greater number of cases in municipalities with higher GDP in the Atlantic Forest of Minas Gerais, suggesting that, often, even richer municipalities do not prioritize basic sanitation and health care. In the present study, a significant part of the municipalities with good socioeconomic indicators showed high deforestation, such as Triângulo Mineiro and Alto Paranaíba and the Metropolitan region of Belo Horizonte, the opposite being observed for poorer regions such as Vale do Mucuri and Jequitinhonha. Thus, concomitant strategies for controlling deforestation and reducing social inequalities are necessary to control dengue in Minas Gerais municipalities.
Climatic factors are also frequently related to the occurrence of dengue, but were not included in our analysis due to difficulties in obtaining these variables for all municipalities in Minas Gerais (e.g., ALVES, 2015). Humidity and temperature play a fundamental role in the biological cycle of mosquito vectors, consequently exerting a great influence on the risk of dengue transmission (REITER, 2001; MCMICHAELS et al., 2003; THAI & ANDERS, 2011). In their review, Sousa et al. (2021) found that precipitation and temperature positively affected the number of dengue cases in more than half of the articles analyzed, among several climatic parameters having been evaluated. Alves (2015) demonstrated that municipalities in Minas Gerais with lower temperatures had fewer cases of dengue between 2008 and 2012, although the meteorological variables that affected the incidence of dengue differed between the years of study. In fact, it is possible to observe a lower occurrence of dengue in higher altitude regions, such as Serra da Canastra and Serra do Espinhaço, where temperatures are also lower (REBOITA et al. 2015). In this sense, deforestation can directly cause an increase in the number of dengue cases, as demonstrated by our results; and indirectly, since deforestation is one of the main causes of climate change and increase in global temperature (BLANK, 2015; SOLOMON et al., 2007). In fact, several studies carried out with climate models in the last decade in Brazil predicted an expansion of the occurrence of dengue fever to colder regions (PEDROSA et al., 2020; VECCHIA et al., 2018). This synergy between regional (deforestation) and global (climate) effects can lead to a drastic increase in dengue cases, with severe social and economic consequences for Brazil.
Conclusions
Our results demonstrated that the loss of vegetation cover is related to a greater occurrence of dengue in the municipalities of the Minas Gerais state. Despite the complex interaction between LUCC, climatic conditions and socioeconomic factors, it is possible that public policies to reduce deforestation, such as the Atlantic Forest Law, can also help reducing the incidence of vector-borne diseases. Such strategies would have a double positive effect on dengue control in the long term, as they also contribute to mitigating regional temperature warming, restricting the spread of this disease to higher altitude regions. The environmental service provided by natural vegetation in the control of infectious diseases must be complemented by continuous investment in public health policies and the reduction of social inequalities, requiring a joint effort from all sectors of society.
Supplementary Materials
The following supporting information can be downloaded at the website of this paper posted on Preprints.org.
References
- Alves, M. A. A. (2015). Relationship of dengue cases in Minas Gerais with meteorological and socioeconomic variables. Master's dissertation, Universidade Federal de Itajubá, Itabira-MG, Brasil.
- Amaral, P. M. (2015). Analysis of the influence of socio-environmental and climatic factors on the incidence of dengue, malaria, and tuberculosis. Monograph, Universidade Federal do Espirito Santo, Vitória-ES, Brasil.
- Antunes, F. Z. (1986). Climatic characterization of the state of Minas Gerais: agricultural climatology. Agricultural Report, 12, 9-13.
- Barata, R. C. B. (1997). The challenge of emerging diseases and the revaluation of descriptive epidemiology. Public Health Magazine, 31(5), 531-537. [CrossRef]
- Barreto, M. L., et al. (2011). Successes and failures in the control of infectious diseases in Brazil: social and environmental context, policies, interventions, and research needs. The Lancet, 377(9780), 1877-1889. [CrossRef]
- Bauhoff, S., & Busch, J. (2020). Does deforestation increase malaria prevalence? Evidence from satellite data and health surveys. World Development, 127, 104734. [CrossRef]
- Blank, D. M. P. (2015). The context of climate change and its victims. Mercator, 14(2), 157-172. [CrossRef]
- Braga, I. A., & Valle, D. (2007). Aedes aegypti: history of control in Brazil. Epidemiologia e Serviços de Saúde, 6(2), 113-118.
- Brady, O. J., & Hay, S. I. (2019). The global expansion of dengue: how Aedes aegypti mosquitoes enabled the first pandemic arbovirus. Annual Review of Entomology, 65, 191-208. [CrossRef]
- Brancalion, P. H. S., et al. (2020). Emerging threats linking tropical deforestation and the COVID-19 pandemic. Perspectives in Ecology and Conservation, 18(4), 243–246. [CrossRef]
- Brasil. Ministério da Saúde. (2002). Dengue: epidemiological aspects, diagnosis and treatment, n°176.
- Borinelli, B. (2011). Environmental problems and the limits of environmental policy. Serviço Social em Revista, 13(2), 63-84. [CrossRef]
- Burket-Cadena, N., & Vittor, A. Y. (2018). Deforestation and vector-borne disease: forest conversion favors important mosquito vectors of human pathogens. National Library of Medicine, 26, 101-110. [CrossRef]
- Cardin, M. F. M., et al. (2016). Visceral leishmaniasis in the state of São Paulo, Brazil: spatial and spatio-temporal analysis. Public Health Magazine, 50: 48. [CrossRef]
- Castro, M. C., et al. (2019). Development, environmental degradation, and disease spread in the Brazilian Amazon. PLoS Biology, 17(11), e3000526. [CrossRef]
- Chan, K., et al. (2022). Malaria transmission and prevalence in rice-growing versus non-rice-growing villages in Africa: a systematic review and meta-analysis. Lancet Planet Health, 6(3), 257-269. [CrossRef]
- Chaves, L. F., Cohen, J. M., Pascual, M., & Wilson, M. L. (2008). Social exclusion modifies climate and deforestation impacts on a vector-borne disease. PLoS Neglected Tropical Diseases, 2(2), e176. [CrossRef]
- Churakov, M., et al. (2019). Spatio-temporal dynamics of dengue in Brazil: seasonal traveling waves and determinants of regional synchrony. PLoS Neglected Tropical Diseases, 13(4), e0007012. [CrossRef]
- Combe, M., et al. (2017). Global and local environmental changes as drivers of Bauru ulcer emergence. Emerging Microbes & Infections, 6(4), 1-11. [CrossRef]
- Coutinho, H. S., et al. (2022). Temporal trend, space risk and factors associated with the occurrence of dengue in northeast Brazil, 2009–2018. Transactions of The Royal Society of Tropical Medicine and Hygiene, 116(9), 853-867. [CrossRef]
- Dupin, M. G. V., et al. (2018). Land use policies and deforestation in Brazilian tropical dry forests between 2000 and 2015. Environmental Research, 13(3), 035008. [CrossRef]
- Ellwanger, J. H., et al. (2020). Beyond loss of diversity and climate change: Impacts of Amazon deforestation on infectious diseases and public health. Anais da Academia Brasileira de Ciências, 92 (1): e20191375. [CrossRef]
- Espírito-Santo, M. M., et al. (2020). Biophysical and socioeconomic factors associated with deforestation and forest recovery in Brazilian tropical dry forests. Frontiers in Forests and Global Change, 3, 569184. [CrossRef]
- FGV- Fundação Getúlio Vargas. (2021). The poorest suffer the greatest impact from the pandemic. Agência Brasil.
- Funasa- Fundação Nacional de Saúde. (1999). Temporal evolution of notifiable diseases in Brazil 1980-1998. Boletim Eletrônico Epidemiológico Edição Especial.
- Gubler, D. J. (2011). Dengue, urbanization and globalization: the unholy trinity of the 21st century. Tropical Medicine Health, 39, 3–11. [CrossRef]
- Harrera-Bastos, E., et al. (1992). First reported outbreak of classical dengue fever at 1700 meters above sea level in Guerrero state, Mexico. American Journal of Tropical Medicine and Hygiene, 46(6), 649-653. [CrossRef]
- Halstead, S. B. (2006). Dengue in the Americas and southeast Asia: do they differ? Revista Panamericana Salud Publica, 20(6), 407-415. [CrossRef]
- Hopkins, S. R., et al. (2020). How to identify win–win interventions that benefit human health and conservation. Nature Sustainability, 4(4), 298–304. [CrossRef]
- Hopkins, S. R., et al. (2022). Evidence gaps and diversity among potential win–win solutions for conservation and human infectious disease control. The Lancet Planetary Health, 6(8), 694–705. [CrossRef]
- Horta, M. A. P., et al. (2013). The effects of urban growth on dengue. Revista Brasileira em Promoção de Saúde, 26(4), 539-547.
- IBGE - Instituto Brasileiro de Geografia e Estatística. (2021). Estimates of the resident population in Brazil and Federation Units with a reference date of July 1-2021.
- IEF - Instituto Estadual de Florestas. (2012). Minas Gerais: Vegetation coverage of Minas Gerais.
- Ilacqua, R. C., et al. (2021). Reemergence of yellow fever in Brazil: the role of distinct landscape fragmentation thresholds. Journal of Environmental Public Health, 7, 8230789. [CrossRef]
- Jetten, T. H., & Focks, D. A. (1997). Potential changes in the distribution of dengue transmission under climate warming. The American Journal of Tropical Medicine and Hygiene, 57(3), 285-297. [CrossRef]
- Junior, N. L. S., Mation, L. F., & Sakowshi, P. A. M. (2015). Impact of deforestation on the incidence of diseases in the Amazon. Instituto de Pesquisa Econômica Aplicada. Brasília: IPEA.
- Kalbus, A., Sampaio, V. S., Boenecke, J., & Reintjes, R. (2021). Exploring the influence of deforestation on dengue fever incidence in the Brazilian Amazonas state. PLoS One, 16(1), e0242685. [CrossRef]
- Kaimowitz, D., & Angelsen, A. (1998). Economic models of tropical deforestation: a review. Bogor: Center for International Forestry Research. [CrossRef]
- Kolimenakis, A., et al. (2021). The role of urbanization in the spread of Aedes mosquitoes and the diseases they transmit-A systematic review. PLoS Neglected Tropical Diseases, 15(9), e0009631. [CrossRef]
- Lima-Camara, T. N. (2016). Emerging arboviruses and public health challenges in Brazil. Revista de Saúde Pública, 50: 36. [CrossRef]
- MacDonald, A. J., & Mordecai, E. A. (2019). Amazon deforestation drives malaria transmission, and malaria burden reduces forest clearing. PNAS, 116(44), 22212-22218. [CrossRef]
- MapBiomas. (2022). Getting to know MapBiomas: Who we are. https://brasil.mapbiomas.org/.
- Marengo, J. A. (2007). Global climate change and its effects on biodiversity: characterization of the current climate and definition of climate change for the Brazilian territory throughout the 21st century (2nd ed.). Brasília: Ministério do Meio Ambiente.
- Medronho, R. A. (1995). Geoprocessing and health: a new approach to space in the health-disease process. Rio de Janeiro: Fiocruz - Fundação Oswaldo Cruz.
- Mendonça, F. (2003). Global warming and health: a geographic perspective – introductory notes. Revista Terra Livre, 1, 205-221.
- McMichael, A. J., Woodruff, R. E., & Hales, S. (2006). Climate change and human health: present and future risks. The Lancet, 367(9513), 859-869. [CrossRef]
- Melo, C. M. F., & Gontijo, M. N. (2004). Visceral leishmaniasis in Brazil: current status, challenges and prospects. Revista Brasileira de Epidemiologia, 7, 338-349. [CrossRef]
- Metcalf, C. J. E., et al. (2017). Identifying climate drivers of infectious disease dynamics: recent advances and challenges ahead. Proceedings of the Royal Society: Biological Sciences, 284(1860), 20170901. [CrossRef]
- Miceli, B. S., & Fonseca, A. B. A. (2017). Dengue and public health in the city of Rio de Janeiro, Brazil. Revista Sustinere, 5(2), 260-278. [CrossRef]
- Monse, S. S. (1995). Factors in the emergence of infectious diseases. Global Issues Series, 1, 7-15. [CrossRef]
- Morais, M. M. (2011). Is the proportion of Atlantic Forest remaining around urban areas related to the incidence of dengue fever? Master's dissertation, Universidade Federal de Minas Gerais, Belo Horizonte-MG, Brasil.
- Morais, B. C., et al. (2019). Seasonality in dengue notifications from Amazonian capitals and the impacts of El Niño / La Niña. Caderno de Saúde Pública, 35(9), e00123417. [CrossRef]
- Moura, P. M., Docile, T. N., Arnóbio, A., & Figueiró, R. (2014). Deforestation and disordered urban growth in the state of Rio de Janeiro: impacts on the dynamics of dengue. Caderno UniFOA, 9(24), 77-85. [CrossRef]
- Oliveira, R. M. (1998). Dengue in Rio de Janeiro: rethinking popular participation in health. Caderno de Saúde Pública, 14, 69-78.
- UNO- United Nations Organization. (2015). Human Development Report.
- Pedrosa, M. C., et al. (2020). Invasion of tropical montane cities by Aedes aegypti and Aedes albopictus (Diptera: Culicidae) depends on continuous warm winters and suitable urban biotopes. Journal of Medical Entomology, 58(1), 333-342. [CrossRef]
- Pignatti, M. (2004). Health and environment: emergent diseases in Brazil. Ambiente e Sociedade, 7(1), 133-147. [CrossRef]
- Powell Jr, G., Gloria-Soria, A., & Kotsakiozi, P. (2018). Recent history of Aedes aegypti: vector genomics and epidemiology records. Bioscience, 68(11), 854–860. [CrossRef]
- Reboita, M. S., et al. (2015). Climatic aspects of the state of Minas Gerais. Revista Brasileira de Climatologia, 17, 206-226.
- Reiter, P. (2001). Climate change and mosquito-borne disease. Environmental Health Perspectives, 109, 141–161. [CrossRef]
- Schmidt, R. A. C. (2006). Environmental issues on health promotion: a multi-professional action on emerging diseases. Scielo Public Health, 17, 373-392. [CrossRef]
- Shepard, D. S., Coudeville, L., Halasa, Y. A., Zambrano, B., & Dayan, G. H. (2011). Economic impact of dengue illness in the Americas. Journal of Tropical Medicine, 84(2), 200-207. [CrossRef]
- Silva, A. A. P., et al. (2022). The fewer, the better fare-can the loss of vegetation in the Cerrado drive the increase in dengue fever cases infection? Plos One, 1, 17(1), e0262473. [CrossRef]
- Silva, L., et al. (2015). The impact of environmental issues on health. Semioses: Rio de Janeiro, 9.
- Solomon, S., et al. (2007). Climate change 2007: the physical science basis: fourth assessment report of the Intergovernmental Panel on Climate Change Working Group I. Cambridge: Cambridge University Press, Agenda, 6(07), 333.
- Tauil, P. L. (2001). Urbanization and ecology of the dengue mosquito. Caderno de Saúde Pública, 17, 99-102.
- Teixeira, M. G., Barreto, M. L., & Guerra, Z. (1999). Dengue epidemiology and prevention measures. Informe Epidemiológico do SUS - Ministério da Saúde.
- Teixeira, M. G., Barreto, M. L., & Guerra, Z. (2008). Recent shift in age pattern of dengue hemorrhagic fever, Brazil. Emerging Infectious Diseases, 10, e1663. [CrossRef]
- Thai, K. T., & Anders, K. L. (2011). The role of climate variability and change in the transmission dynamics and geographic distribution of dengue. Experimental Biology and Medicine, 236(8), 944-954. [CrossRef]
- Thomas, G. (2015). Analysis of Experiment with single repetition using the intraclass correlation coefficient. Monograph, Universidade Federal do Rio Grande do Sul, Porto Alegre-RS, Brasil.
- Ujvari, S. C. (2003). A history and its epidemics: man’s coexistence with microorganisms. Revista Do Instituto de Medicina Tropical de São Paulo, 45(4), 212.
- Vecchia, A. D., Beltrame, V., & D’Agostini, F. M. (2018). Panorama of dengue in the southern region of Brazil from 2001 to 2017. Cogitare Enfermagem, 23(3), e53782.
- Vieiro, D., & Ignoti, V. E. (2013). The occurrence of dengue and meteorological variations in Brazil: systematic review. Revista Brasileira de Epidemiologia, 2, 240-253. [CrossRef]
- Watts, D. M., et al. (1987). Ecological evidence against vertical transmission of eastern equine encephalitis virus by mosquitoes (Diptera: Culicidae) on the Delmarva Peninsula, USA. Journal of Medical Entomology, 24(1), 1-13. [CrossRef]
- Wu, X., Lu, Y., Zhou, S., Chen, L., & Xu, B. (2016). Impact of climate change on human infectious diseases: Empirical evidence and human adaptation. Environment International, 86, 14-23. [CrossRef]
- Yasuoka, J., & Levins, R. (2007). Impact of deforestation and agricultural development on anopheline ecology and malaria epidemiology. Journal of Tropical Medicine and Hygiene, 76(3), 450-46. [CrossRef]
- Vijay, V., Pimm, S. L., Jenkins, C. N., & Smith, S. J. (2016). The impacts of oil palm on recent deforestation and biodiversity loss. PLoS ONE, 11(7), e0159668. [CrossRef]
- Zahouli, J. B. Z., Koudou, B. G., Mueller, P., Malone, D., Tano, Y., & Utzinger, J. (2017). Effect of land-use changes on the abundance, distribution, and host-seeking behavior of Aedes arbovirus vectors in oil palm-dominated landscapes, southeastern Côte d'Ivoire. PLoS ONE, 12(12), e0189082. [CrossRef]
Figure 1.
Brazilian political map, with emphasis on the state of Minas Gerais. Source: IBGE, 2022.
Figure 1.
Brazilian political map, with emphasis on the state of Minas Gerais. Source: IBGE, 2022.
Figure 2.
(a) ten municipalities with the highest absolute number of dengue fever cases in five years, from 2015 to 2019; (b) ten municipalities with the highest number of dengue cases per one thousand inhabitants in the same period.
Figure 2.
(a) ten municipalities with the highest absolute number of dengue fever cases in five years, from 2015 to 2019; (b) ten municipalities with the highest number of dengue cases per one thousand inhabitants in the same period.
Figure 3.
(a) number of municipalities in each class of number of dengue fever cases per one thousand inhabitants in the state of Minas Gerais from 2015 to 2019; (b) number of municipalities in each class of absolute number of dengue fever cases during the same period.
Figure 3.
(a) number of municipalities in each class of number of dengue fever cases per one thousand inhabitants in the state of Minas Gerais from 2015 to 2019; (b) number of municipalities in each class of absolute number of dengue fever cases during the same period.
Figure 4.
Map of the number of dengue cases per 1000 inhabitants in quartiles for the 853 municipalities of Minas Gerais from 2015 to 2019. Municipalities in the first quartile presented less than 2.9 cases; in the second quartile, municipalities with 2.9 to 11.63 cases; in the third quartile, from 11.64 to 31.23 cases; and in the fourth quartile, between 31.25 and 227.5 cases.
Figure 5.
(a) average number of dengue cases per municipality between 2015 and 2019, per one thousand inhabitants. Lines above the bars represent the standard deviation-10, for clarity; (b) number of dengue cases per thousand inhabitants considering the entire state of Minas Gerais during the same period.
Figure 6.
(a) ten municipalities with the highest net loss of natural vegetation from 2009 to 2019; (b) ten municipalities with the highest net gain in vegetation in the same period.
Figure 6.
(a) ten municipalities with the highest net loss of natural vegetation from 2009 to 2019; (b) ten municipalities with the highest net gain in vegetation in the same period.
Figure 7.
Number of municipalities in each class of net changes in natural vegetation cover from 2009 to 2019 in the Minas Gerais state (n = 853).
Figure 7.
Number of municipalities in each class of net changes in natural vegetation cover from 2009 to 2019 in the Minas Gerais state (n = 853).
Figure 8.
Changes in land use and cover in the 853 municipalities of the Minas Gerais state from 2009 to 2019. Municipalities in orange had net loss of vegetation and municipalities in green had net gain in vegetation during this period.
Figure 8.
Changes in land use and cover in the 853 municipalities of the Minas Gerais state from 2009 to 2019. Municipalities in orange had net loss of vegetation and municipalities in green had net gain in vegetation during this period.
Figure 9.
Relationship between number of dengue cases per municipality in Minas Gerais (n = 853) and (a) percentage of net change in vegetation cover, (b) Gini inequality index, (c) population density and (d) Human Development Index (HDI).
Figure 9.
Relationship between number of dengue cases per municipality in Minas Gerais (n = 853) and (a) percentage of net change in vegetation cover, (b) Gini inequality index, (c) population density and (d) Human Development Index (HDI).
Table 2.
Statistical parameters of the generalized linear model (GLM) analysis to determine the effects of net change in vegetation cover and socioeconomic variables on the number of cases of dengue per 1,000 inhabitants in 853 municipalities in Minas Gerais, Brazil.
Table 2.
Statistical parameters of the generalized linear model (GLM) analysis to determine the effects of net change in vegetation cover and socioeconomic variables on the number of cases of dengue per 1,000 inhabitants in 853 municipalities in Minas Gerais, Brazil.
| Response variable |
Socioeconomic indicators |
DF |
Deviance |
F |
P |
| Number of dengue cases |
Population density |
1, 845 |
461.16 |
14.71 |
<0.001 |
| |
Gini Index |
1, 844 |
160.15 |
5.19 |
<0.001 |
| |
Human Development Index |
1, 843 |
1677.75 |
53.52 |
<0.001 |
| |
Vulnerabilty to poverty (%) |
1, 842 |
19.61 |
625.0 |
0.43 |
| |
Households with water supply and inadequate sewage system (%) |
1, 841 |
113.82 |
3.63 |
0.57 |
| |
Total urban area (km2) |
1, 840 |
9.34 |
298.0 |
0.59 |
| |
Per capita GDP (Brazilian Reais) |
1, 839 |
0.21 |
6.0 |
0.93 |
| |
% change in
natural vegetation |
1, 838 |
411.48 |
13.12 |
<0.001 |
|
Disclaimer/Publisher’s Note: The statements, opinions and data contained in all publications are solely those of the individual author(s) and contributor(s) and not of MDPI and/or the editor(s). MDPI and/or the editor(s) disclaim responsibility for any injury to people or property resulting from any ideas, methods, instructions or products referred to in the content. |
© 2023 by the authors. Licensee MDPI, Basel, Switzerland. This article is an open access article distributed under the terms and conditions of the Creative Commons Attribution (CC BY) license (http://creativecommons.org/licenses/by/4.0/).
