
Submitted:
28 December 2023
Posted:
29 December 2023
You are already at the latest version
Abstract
Mycotoxins are secondary metabolites produced by filamentous fungi associated to a variety of acute and chronic foodborne diseases. Current toxicology studies mainly rely on monolayer cell cultures and animal models, which are undeniably affected by several limitations. To bridge the gap between the current in vitro toxicology approach and the in vivo predictivity of the data, we here investigated the cytotoxic effects induced by the mycotoxins sterigmatocystin (STE), ochratoxin A (OTA) and patulin (PAT) on different 2D and 3D cell cultures. We focused on human tumours (neuroblastoma SH-SY5Y cells, and epithelial breast cancer MDA-MB-213 cells) and healthy cells (bone marrow derived mesenchymal stem cells, BM-MSC, and umbilical vein endothelial cells, HUVECs). Cytotoxicity of STE, OTA, and PAT was determined after 24, 48 and 72 h of exposure by ATP assay in both culture models. 3D spheroids morphology was also analysed using the MATLAB-based open-source software AnaSP. Our results highlighted how each cell line and different culture models showed specific sensitivities, reinforcing the importance of using more complex models for toxicology studies and a multiple cell line approach for an improved and more comprehensive risk assessment.
Keywords:
mycotoxins
; sterigmatocystin
; ochratoxin A
; patulin
; 3D culture
; spheroid
; cytotoxicity
; in vitro models.
1. Introduction
Food contamination by toxic substances is a global safety concern, posing not only a serious threat to human and animal health, but also a massive economic impact for food industries [1]. Mycotoxins, natural toxic food and feed contaminants, are gaining increasing attention from the scientific community, due to their abundance in food products and the harmful effects associated with their exposure. Mycotoxins are produced from the secondary metabolism of various fungal species under favourable climatic conditions of humidity and temperature [2]. They can build up in many types of food and feed crops in the field and during post-harvest activities such as improper handling procedures, packaging materials, storage, and transportation [3]. Human exposure may occur through the direct consumption of mycotoxin-contaminated plant-based food or from the consumption of products derived from animals fed with contaminated feed. Furthermore, mycotoxins are stable chemical compounds and persist even after food processing, cooking, baking, roasting, or pasteurization [4]. Their presence in food and feed has been associated with various pathological disorders in consumers, ranging from acute toxicity to cancer [5]. Due to their broad range of biological activities, mycotoxins represent a central issue in food safety worldwide. As a result, the Joint FAO/WHO Expert Committee on Food Additives (JECFA) carried out risk assessments and set safety limits for many mycotoxins such as aflatoxins (AFs), deoxynivalenol, fumonisins, HT-2 and T-2 toxins, ochratoxin A (OTA), patulin (PAT) and zearalenone [6].
OTA and PAT are both mainly produced by Aspergillus spp. and Penicillium spp. fungi while PAT is predominantly found in fruits and fruit-based products [7]. OTA is considered one of the most prevalent contaminants in the food chain, occurring in cereals, grape, coffee, spices, cocoa, as well as in foods of animal origin [8,9,10,11,12]. Epidemiological evidence suggest that OTA is implicated in the pathogenesis of renal diseases including Balkan endemic nephropathy, kidney tumours occurring in endemic regions of the Balkan Peninsula, and chronic interstitial nephropathy occurring in Northern African countries and likely in other parts of the world [13,14]. Hepatotoxic, teratogenic, neurotoxic, immunotoxic, genotoxic and carcinogenic effects have also been reported [15,16]. Despite evidence of its carcinogenicity in several animal studies, there is insufficient information to establish a causal link between OTA exposure and adverse effects in humans [17]. Accordingly, OTA has been classified as possible human carcinogen (group 2B) by the International Agency for Research on Cancer (IARC) [18]. Since recent studies have raised uncertainty regarding the toxic properties of OTA, the European Food Safety Authority (EFSA) Panel on Contaminants in the Food Chain (CONTAM) established that the tolerable weekly intake (TWI) of 120 ng/kg body weight (bw) previously set in 2006 is no longer valid [19]. A recent OTA risk assessment set a new Benchmark dose lower confidence limits for an extra cancer risk of 10% (BMDL10) at 4.73 µg/kg bw and 14.5 µg/kg bw as non-neoplastic and neoplastic reference point, respectively [17].
PAT exposure has been related to neurotoxic, immunotoxic, embryotoxic and gastrointestinal effects, but the lack of strong evidence regarding carcinogenicity led to its classification as a group 3 carcinogen (unclassifiable as to carcinogenicity in humans) by IARC [20,21]. Nevertheless, the adverse effects of PAT on human and animal health led regulatory agencies to establish a provisional maximum tolerable daily intake (PMTDI) of 0.4 µg/kg bw [22] and maximum levels were set at ≤ 50 µg/kg in apple products and 10 µg/kg in baby food and infant formulae [23].
In addition to the regulated mycotoxins, there is a group of currently non-regulated ones for which no safety levels have been set due to the limited data regarding their occurrence and toxicity. The importance of establishing a better risk assessment for all these contaminants is ever increasing, especially for sterigmatocystin (STE), a mycotoxin mainly produced by Aspergillus spp. fungi and reported in grains and grain-based products, cheese, coffee, spices and beer [24,25,26,27,28,29]. STE is a biogenic precursor of the most potent carcinogenic mycotoxin known, AFB1, and shares several structural and biological properties with it, further highlighting the need for monitoring programs helping define its maximum levels in food [30]. Animal studies have shown hepatotoxic and nephrotoxic effects induced by exposure to STE, and epidemiological evidence highlights a possible association between exposure to STE and an increased risk of developing tumours in humans [31,32,33,34,35]. As a result, IARC classified STE as group 2B carcinogen [21].
Overall, there is a clear need to update the risk assessment for regulated and non-regulated mycotoxins, surpassing the limitations of current in vitro models. Risk assessment still mainly relies on cytotoxicity evaluations based on in vitro two-dimensional (2D) cell models, which undeniably provide poor predictions of in vivo conditions. Classical monolayer cultures lack both the complexity of a three-dimensional (3D) architecture and numerous biological factors that allow to reproduce cell and tissue physiology [36,37]. Scientific and technological advances can contribute reducing the distance between the current in vitro toxicology and the true in vivo cell behaviour, thus increasing the reliability of the obtained data. In this context, the aim of the present study was to develop 3D cell culture models (spheroids) to assess the cytotoxic effects induced by the individual exposure to the mycotoxins STE, OTA and PAT. For a more comprehensive risk assessment, we used different human tumour (neuroblastoma SH-SY5Y, and epithelial breast cancer MDA-MB-213 cells) and healthy cell lines (bone marrow derived mesenchymal stem cells, BM-MSC, and umbilical vein endothelial cells, HUVECs). The results obtained for 3D spheroids were compared with those obtained in conventional 2D adherent cultures.
2. Materials and Methods
2.1. Reagents
The following reagent grade chemicals and cell culture compounds were purchased from ATCC (American Type Culture Collection): DMEM high glucose culture medium with L-glutamine, fetal bovine serum (FBS), Mesenchymal Stem Cell Basal Medium for Adipose, Umbilical and Bone Marrow-derived MSCs, Mesenchymal Stem Cell Growth Kit for Bone Marrow-derived MSCs, including recombinant human Fibroblast Growth Factor-basic (rh FGF-b), recombinant human Insuline-like Growth Factor (rh IGF-1) and L-Alanyl-L-Glutamine. Endothelial Cell Growth Medium, human Epidermal Growth Factor (hEGF), Vascular Endothelial Growth Factor (VEGF), R3-Insulin-like Growth Factor-1 (R3-IGF-1), Ascorbic Acid, Hydrocortisone and human Fibroblast Growth Factor-Beta (hFGF-β) were from PromoCell (Heidelberg, Germany). Minimum essential medium nonessential amino acids (MEM NEAA) and phosphate buffer saline (PBS) were from Gibco (Paisley, UK). Penicillin, streptomycin and trypsin/EDTA solutions were from Corning (Rochester, NY). CellTiter-Glo 3D Cell Viability Assay was obtained from Promega (Madison, WI, USA). Standard of the selected mycotoxins STE (MW: 324.28 g/mol), OTA (MW: 403.81 g/mol) and PAT (MW: 154.12 g/mol), as well as Methanol (MeOH) were purchased from Sigma-Aldrich (St. Louis, MO, USA). Stock solutions of the mycotoxins were prepared in MeOH and maintained at - 20 °C for STE and PAT, and at +4 °C for OTA.
2.2. Cell culture and spheroid formation
SH-SY5Y (ATCC CRL-2266) and MDA-MB-213 (ATCC HTB-26) cells were cultured in monolayer in DMEM high glucose with L-glutamine medium supplemented with 10% FBS, 1% MEM NEAA (100X) and 1% penicillin/streptomycin. BM-MSCs cells were cultured in Mesenchymal Stem Cell Basal Medium for Adipose, Umbilical and Bone Marrow-derived MSCs supplemented with 125 pg/mL rh FGF-b, 15 ng/mL rh IGF-1, 7% FBS, 2.4 mM L-Alanyl-L-Glutamine and 0.5% penicillin/streptomycin. HUVECs cells were cultured in Endothelial Cell Growth Medium supplemented with 0.5 mL hEGF, 0.5 mL VEGF, 0.5 mL R3-IGF-1, 0.5 mL Ascorbic Acid, 0.2 mL Hydrocortisone, 2 mL hFGF-β and 2% FBS. BM-MSCs and HUVECs were used only up to passage 9. All cell lines were cultured under standard cell culture conditions at 37° C and 5% CO2 humidified atmosphere. The medium was changed every 2 - 3 days.
For spheroids generation, trypsinized single cells were suspended in the corresponding culture medium and dispensed into Ultra-Low Attachment (ULA) 96-well round bottom plates (Corning®, USA). As previously described, the addition of 7.5 μg/mL collagen to the culture medium was required to form HUVECs spheroids [38]. For both tumour lines, cells were seeded at a density of 2 × 10³ cells/spheroid, while BM-MSCs and HUVECs were seeded at 5 × 10³ cells/ spheroid and 7.5 × 10³ cells/ spheroid, respectively. Plates were centrifuged at 1200 revolution per minute (RPM) for 10 min to induce cells aggregation at the bottom of the wells. Prior to toxins exposure, BM-MSCs and HUVECs spheroids were cultured for 1 day, whereas MDA-MB-213 spheroids were cultured for 4 days and SH-SY5Y spheroids for 7 days, with a gentle 50% medium replenishment on day 4 for the latter. Seeding densities and growth times were optimized for all cell lines so that each spheroid exhibited appropriate diameter and shape parameters, according to Santo et al. [39] (Figure S1). 3D spheroids and monolayer cell cultures had the same culture media and growth conditions.
2.3. Treatment of monolayer cell cultures and spheroids
For monolayers, STE and OTA exposure was assessed in a concentration range of 1.56 to 50 µM for all cell lines. For PAT, the same concentrations were used for BM-MSCs and HUVECs cells, whereas concentrations from 0.035 to 1.12 µM and from 0.28 to 9 µM were employed for SH-SY5Y and MDA-MB-231 cells, respectively. The concentration range for STE and OTA was established considering their occurrence in food and the half maximal inhibitory concentrations (IC50) available from the literature [30,40]. Lower concentrations were selected for PAT based on our pilot studies (data not shown).
Considering the routinely lower sensitivity of 3D cultures [41,42], spheroids were exposed to higher mycotoxins concentrations. STE and OTA were used in a range from 6.25 to 100 µM for all cell lines. For PAT, the same concentrations were used for BM-MSCs and HUVECs spheroids, whereas concentrations between 3.12 and 12.5 µM and between 6.25 and 25 µM were employed for SH-SY5Y and MDA-MB-231 spheroids, respectively. Five to six serial concentrations (dilution factor = 2) of each mycotoxin were tested in both cell culture systems. The range of mycotoxins concentrations used in the study are summarized in Table S1.
Cells and spheroids were exposed to the individual mycotoxins for 24, 48 and 72 h. During the exposure time, neither the medium nor the mycotoxins were replenished. All mycotoxins were diluted to the desired concentration in the appropriate culture medium used for cell growth. Solvent controls containing the same amount of MeOH were included in each experiment.
2.4. Morphological analysis
Bright-field images of spheroids at time 0 and after 72 h of exposure to the mycotoxins were taken on an inverted light microscope Zeiss Primo Vert equipped with a Zeiss camera (Axiocam 208 color, Zeiss Microscopy, Germany). All images were analysed using the open-source software AnaSP 1.4 version run with MATLAB R2022a (Version 9.12) and Image Processing Toolbox. The following parameters were extracted: Circularity, Compactness, Solidity, Area, and Volume. Circularity (Cir) was used to calculate the Sphericity Index (SI), according to Equation (1):
2.5. Cell viability assay
CellTiter-Glo 3D Cell Viability Assay (Promega®, G968B) was performed to evaluate the effects on cell viability induced by STE, OTA, and PAT exposure in both cell modalities and according to the manufacturer’s instructions. The assay is based on the properties of a thermostable luciferase, which generates a luminescent signal proportional to the amount of adenosine triphosphate (ATP) present, a marker for metabolically active cells. Briefly, 100 µl/well of culture medium were replaced with medium containing mycotoxins at the desired concentrations (see Section 2.3 for detailed concentrations tested). After the exposure time, 100 µl/well of medium was replaced with an equal volume of CellTiter-Glo Reagent. Plates were gently shaken for 5 minutes to induce cell lysis and then incubated at room temperature for additional 25 minutes to stabilize the luminescent signal, keeping the plates in the dark. After the incubation time, 100 µl of solution from each well were transferred to an opaque-walled flat-bottom multiwell plate. Luminescence was recorded at 570 nm using Spark® Multimode Microplate Reader by Tecan (Männedorf, Switzerland).
A similar protocol was used for monolayers: 100 μl of trypsinized cell suspensions were seeded in 96-well flat bottom plates at a density of 7.5 x 10³ cells/well for HUVECs and SH-SY5Y cells, and 5 x 10³ cells/well for BM-MSCs and MDA-MB-231. Plates were then incubated and when cells reached 80% of confluence, fresh medium containing the mycotoxins at the desired concentrations was added (see Section 2.3 for detailed concentrations tested). After the exposure time, spent culture medium was removed and replaced with 50 µl/well of fresh medium and an equal volume of CellTiter-Glo® Reagent. The incubation time was reduced to 2 minutes under shaking and to 10 minutes at room temperature in static condition. The luminescence signal was recorded on 100 µl of solution transferred from each well to an opaque flat-bottom multiwell plate, as reported above. Three independent experiments for each condition were carried out. For both cell culture systems, cell viability was expressed as a percentage relative to the solvent control (MeOH). The IC50 values were calculated using Graphpad Prism version 8.0.2 (GraphPad Software, San Diego, California, USA).
2.6. Statistical analysis
Statistical analysis was carried out using GraphPad Prism version 8.0.2 (GraphPad Software, San Diego, California, USA), statistical software package. Data were expressed as mean ± SEM of different independent experiments. We also performed Student’s t-test for paired samples and differences between groups were assessed via two-way ANOVA followed by the Tukey HDS post-hoc test for multiple comparisons. We set a significance level of 0.05, such that p ≤ 0.05 was considered statistically significant.
3. Results
3.1. Cytotoxic effects of STE, OTA and PAT in monolayer cultures
Cytotoxic effects of STE, OTA and PAT were assessed by ATP assay after 24, 48 and 72 h of exposure on all cell lines cultured in 2D monolayers and the resulting concentration-response curves are shown in Figure 1. STE (column 1 in Figure 1) had a significant and stronger effect on cancer cell cultures even at the lowest concentrations tested and resulted only in moderate viability reductions for the healthy BM-MSCs and HUVECs lines, with a reduction in cell viability ranging from 2% to 26% and from 0.3% to 50%, respectively. OTA (column 2 in Figure 1) was the mycotoxin more consistently inducing concentration- and time-dependent reductions in viability across all cell lines, both cancerous and healthy, with rapid drops in HUVECs viability even at the lowest doses. Measurements following PAT exposure (column 3 in Figure 1) resulted in more complex patterns of ATP levels fluctuations, which led to the highest cell death percentages (up to 99%, 92%, 81% and 90% in BM-MSCs, HUVECs, MDA-MB-231and SH-SY5Y cells, respectively) even at the shortest 24 h exposure time. Interestingly, the toxic impacts of 72 h of exposure to PAT were similar in HUVECs, MDA-MB-231and SH-SY5Y cells, with IC50 values equal to 0.45 ± 0.18 µM, 0.42 ± 0.13 µM and 0.28 ± 0.15 µM, respectively. Table 1 summarizes all calculated IC50 values obtained by ATP assay on BM-MSCs, HUVECs, MDA-MB-231 and SH-SY5Y cells after exposure to STE, OTA and PAT at the three different time-points.
3.2. Cytotoxic effects of STE, OTA and PAT in 3D spheroids
The cytotoxic effects of STE, OTA and PAT were also investigated in BM-MSCs, HUVECs, MDA-MB-231 and SH-SY5Y spheroids by ATP assay after 24, 48 and 72 h of exposure (Figure 2). As expected, the responses measured in our 3D models differ from those obtained in conventional 2D monolayer systems. While STE exposure (column 1 in Figure 2) still significantly affected the viability of SH-SY5Y spheroids, MDA-MB-231 cells, the other tumor line we used, did not show relevant changes in ATP levels. Regarding spheroids derived from healthy cells, a significant decrease in cell viability was also obtained in BM-MSCs spheroids after 72 h of exposure, as well as in HUVECs spheroids exposed to the concentrations 25 – 100 µM during 48 and 72 h. Interestingly, in HUVECs spheroids exposed to STE for 24 h, a significant reduction in cell viability was induced only by the lowest concentration (6.25 µM). OTA (column 2 in Figure 2) had again potent and rapid toxic effects on both BM-MSCs and HUVECs, while spheroids formed from the two cancer cell lines maintained higher viabilities throughout the concentrations and exposure times tested. Finally, a significant cytotoxicity was induced by almost all concentrations tested of PAT (column 3 in Figure 2) in each cell line starting from 24 h of exposure. Noteworthy, the toxic effect of PAT seems to be no related to the time of exposure, as no relevant differences can be noticed between the different times tested. Table 2 summarizes the IC50 values obtained by ATP assay on BM-MSCs, HUVECs, MDA-MB-231 and SH-SY5Y cells after exposure to STE, OTA and PAT at the three different time-points.
3.3. Analysis of morphological parameters in 3D cultures exposed to STE, OTA and PAT
We next investigated the effects of mycotoxins’ treatment on spheroids organization and morphology. To do so, we captured brightfield images of the spheroids before and after 72 h of mycotoxins’ exposure and performed 3D image analysis (Figure 3, Figure 4, Figure 5, Figure 6, Figure 7, Figure 8, Figure 9 and Figure 10). Noteworthy, the quantitative analysis performed using AnaSP software revealed different behaviours in tumour and non-tumour spheroids over time. In particular, untreated tumour spheroids increase in size over 72 h, while those derived from the healthy BM-MSCs and HUVEC cells undergo a significant decrease in volume, and an increase in compactness. SI did not vary significantly over time for all cell lines, and solidity was comparable in spheroids at T 0h and T 72h (Figure 7, Figure 8, Figure 9 and Figure 10).
Following treatment, BM-MSCs spheroids exposed to OTA and PAT lost compactness and acquired a frayed and uneven surface appearance, in contrast to the compact smooth structure of the controls (Figure 3). The reduction in compactness led to an increase in spheroid size (area and volume), in particular in BM-MSCs spheroids exposed to the highest concentrations of PAT. Automated evaluation of the morphological parameters confirmed this visual observation (Figure 7b,c). As expected, no significant morphological alterations were observed in BM-MSCs spheroids exposed to STE for 72 h compared to control (Figure 3 and Figure 7a). Visually, HUVECs spheroids present a slight disruption on the outer layers and an accumulation of cell debris after exposure to OTA and PAT (Figure 4). These observations were however not confirmed by image analysis, which revealed only a significant increase in size after exposure to the highest concentrations of PAT (Figure 8c). Conversely, tumour MDA-MB-231 spheroids exposed to each of the three mycotoxins visually appeared disaggregated, with cells detaching from the structure (Figure 5). These observations were confirmed by measurements of significant decreases in compactness, solidity and SI at most of the concentrations tested (Figure 9). Finally, images from Neuroblastoma SH-SY5Y spheroids are presented Figure 6 and quantified in Figure 10. Mycotoxins treatment led to evident morphological alterations, but only 100 µM STE and 100 OTA µM induced significant decreases in solidity and size (area and volume) compared to the respective control, respectively (Figure 10a,b).
4. Discussion
Although great strides have been made in the risk assessment of mycotoxins through conventional toxicity testing and animal bioassays, the challenge remains for regulators to establish even more accurate safety levels for many of these natural contaminants. The need for a more comprehensive evaluation of the effects of STE, OTA and PAT mycotoxins is called for their high occurrence and/or noteworthy toxicity. As a matter of fact, in the last years many researchers have provided cytotoxicity data concerning OTA and PAT exposure, as well as an increasing awareness of the importance of establishing a better risk assessment for STE has caught on [30,40]. Interestingly, the evaluation of the effects of these mycotoxins has been mainly carried out on monolayer cells, poor indicators of the real human hazard. The modernization of food toxicology via integration of technological advances is endorsed by the Food and Drug Agency (FDA) and the EFSA, with emphasis on prioritizing advanced non-animal testing models for safety testing [43,44]. Accordingly, the new era of food toxicology is relying more and more on biorelevant in vitro systems [38]. Nonetheless, evaluations of STE, OTA and PAT toxicity using new alternative methods are still scarce [45,46,47]. In this context, the present study explored the cytotoxicity of the mycotoxins STE, OTA and PAT using two different culture models, traditional 2D cultures and 3D spheroids. Moreover, for a more comprehensive evaluation, we used a panel of cell lines which included tumour and non-tumour samples. Our results revealed a wide variability in STE, OTA and PAT cytotoxicity among the different cell lines tested. Our findings agree with literature, in which different cells have been shown to have a different sensitivity to mycotoxin exposure. In particular, IC50 values ranging from 1.86 µM and >200 µM were reported for OTA in monolayer cells, depending on experimental conditions, time of exposure and cell line used. Even more variability was obtained for PAT, with IC50 values varying from µM to mM [40]. Regarding STE, few studies investigated its cytotoxicity so far. However, based on the current literature, great variability has also been demonstrated in its cytotoxic effects, with IC50 values ranging between 3.7 µM and 286.1 µM [30]. Considering our results on monolayers cells, SH-SY5Y cells were the most sensitive to STE and PAT, with IC50 values ranging from 28.22 ± 11 µM to 2.91 ± 1.04 µM and from 0.45 ± 0.16 µM to 0.28 ± 0.15 µM, respectively. Regarding OTA, the lowest IC50 values were obtained in HUVECs, with values ranging from 13.87 ± 6.40 µM to 0.80 ± 0.06 µM. Similar results were obtained in 3D models, being SH-SY5Y spheroids the most sensitive to STE and PAT and HUVECs spheroids to OTA. However, differences up to one order of magnitude on IC50 values can be observed between the two culture models for almost all conditions tested. Based on literature evidence, spheroids are expected to show a considerable increased resistance to toxic substances compared to 2D cells, due to the pronounced intracellular junctions and a dense extracellular matrix with small pores, which influence xenobiotic transport by decreasing its penetration [41,42]. Therefore, the absence of a 3D organization in 2D systems can lead to an overestimation of cellular toxicity. Interestingly, while this agrees with what we observed in tumour cell lines, the same cannot be said for healthy non-tumour cells. In fact, if on one hand SH-SY5Y and MDA-MB-231 spheroids showed higher IC50 values compared to monolayer cells, on the other hand, quite similar results were obtained in BM-MSCs cultured as monolayer and spheroids, while HUVECs spheroids showed a lower resistance compared to monolayer in almost all conditions assayed, with the exception of 48 and 72 h of PAT exposure. Similarly, Kim et al. showed that hepatospheroids were more sensitive to fumonisin B1 than monolayer-cultured hepatocytes [48], confirming that, in some cases, the evaluation of toxicity on monolayer culture may lead to an underestimation of the effects.
From the three tested mycotoxins, PAT caused the highest toxicity in all cell models. Many animal-based studies have demonstrated the high toxic properties of PAT. However, the lack of strong evidences for its carcinogenicity has prompted its classification as a group 3 carcinogen by IARC [20,21]. Interestingly, in our study the toxic impact of OTA (a group 2B carcinogen) and PAT were similar in HUVECs. Finally, it should be noted that in cells cultured as spheroids, which better represent the in vivo-like cell behaviour, mycotoxins greatly affected non-tumour cell lines, suggesting that an evaluation of the effects of mycotoxins on cancer cells may lead to underestimating their toxicity, due to the intrinsic ability of tumour cells to survive at relevant concentrations of a toxic compound [49].
The simplicity and homogeneity that characterize 2D cultures are reflected in the linear time- and concentration-dependent decrease of cell viability following exposure to STE, OTA and PAT (Figure 1). Conversely, spheroids own an inherent complexity that represents a significant challenge in spheroid-based assays for toxicity testing [50]. To reduce variations between samples and within repeats, an accurate spheroid generation method was followed, as previously described [38]. Noteworthy, a less linear trend in cell viability decrease was observed in 2D BM-MSCs and HUVECs, as well as in MDA-MB-231 spheroids exposed to PAT. Based on our results, it could be assumed that in these cell cultures PAT induced a hormetic response, characterized by stimulation at low concentrations and inhibition at high concentrations [51]. Moreover, while in HUVECs a restoration of vitality to control levels can be observed at 24 h of exposure at the intermediate concentrations (6.25 and 12.5 µM), in 2D BM-MSCs and MDA-MB-231 spheroids a significant increase up to 141% and 146%, respectively, was measured. To explain this data, it should be considered that the assay measures the ATP molecules released by cells. If on one hand ATP is a marker for the presence of metabolically active cells, on the other, molecular mechanisms including programmed cell death and autophagy, require the production of a lot of energy and are positively correlated with cellular ATP levels [52]. Therefore, an increase in the percentage of ATP may be also due to the establishment of cellular processes that allow them to recover the biological material of the dying cells and isolate the damage. In support of this, MDA-MB-231 spheroids exposed to PAT 6.25 and 9 µM showed an increased number of dead cells compared to the control, as well as an altered morphology was observed in 2D BM-MSCs exposed to PAT 12.5 µM (Figures S2 and S3). Furthermore, it has been demonstrated that PAT is able to induce ROS-dependent autophagic cell death in human hepatoma G2 (HepG2) cells [53]. However, further investigations are required to better understand whether autophagy or other molecular mechanisms underlie the increased ATP levels we observed.
Morphological analysis of spheroids is emerging as one of the most reliable and cost-effective ways to determine the cytotoxic effects of a treatment with minimal experimental manipulation [54]. Similarly to Mittler et al. and Aguilar Cosme et al. [50,55], sphericity resulted to be rather independent from spheroid damage after treatment. On the contrary, compactness and size seem to be the main parameters corroborating the results of the viability assays. Although reduction in spheroid volume and area is one of the most striking feature in response to cytotoxic compounds [54], in our study the cytotoxic effects induced by mycotoxins exposure were related to an increase in size in non-tumour spheroids. In particular, marked morphological alterations were noted in BM-MSCs spheroids exposed to the highest concentrations of PAT, in which a larger and loosened appearance was acquired. This change can be attributed to a reduction in cell-cell interactions and the loss of adherens junctions (Figure S4), as previously reported by Celli et al. [56]. However, according to our findings, image-based analysis resulted limited in most of the conditions assayed, not showing significant morphological alterations that could be presumed from visual impressions. This may be partly due to limitations arising from working with low-resolution bright-field microscopy images. On the other hand, it should be taken into account that the morphological disruption is cell type-dependent and that the toxic response is heterogeneous and not always limited to morphological changes [57,58].
In conclusion, our study confirms the importance of performing mycotoxins cytotoxicity screening in more complex and in vivo-like culture models, as the effects found in monolayers were not reproducible in 3D, as well as differing between cell lines. Our data stressed the evidence that the toxicity of mycotoxins cannot be predicted solely based on the effects on a single cell model. The implementation of different predictive advanced models for mycotoxin toxicity is a valuable tool to estimate the true risk of harmfulness and establish regulatory standards in food and feed should discuss the results and how they can be interpreted from the perspective of previous studies and of the working hypotheses. The findings and their implications should be discussed in the broadest context possible. Future research directions may also be highlighted.
Supplementary Materials
The following supporting information can be downloaded at the website of this paper posted on Preprints.org. Table S1: Scheme of mycotoxins concentrations used in the study. Figure S1: Morphometric parameters of BM-MSCs, HUVECs, SH-SY5Y and MDA-MB-231 spheroids under optimal generation conditions; Figure S2: Representative orthogonal projection of MDA-MB-231 spheroid exposed to PAT 6.25 and 9 µM for 24 h; Figure S3: Representative images of 2D BM-MSCs exposed to PAT 12.5 µM for 24 h.
Author Contributions
Conceptualization, V.Z. and MJ.R.; methodology, V.Z. and MR.E.; investigation, V.Z. and M.Q.; writing—original draft preparation, V.Z.; writing—review and editing, MJ.R. and E.C; supervision, MJ.R. and E.C.; project administration, MR.E.; funding acquisition, V.Z., MJ.R. and E.C. All authors have read and agreed to the published version of the manuscript.
Funding
This research was funded by the Spanish Ministry of Science and Innovation, grant number PID2020-11587RB-100 MCIN/AEI/10.13039/501100011033, Generalitat Valenciana, grant number APOSTD/CIAPOS2021 and the ERC Starting Grant (759467, StG-MICRONEX, PI E Cimetta).
Data Availability Statement
Not applicable.
Conflicts of Interest
The authors declare no conflict of interest.
References
- Li, C.; Li, C.; Yu, H.; Cheng, Y.; Xie, Y.; Yao, W.; Guo, Y.; Qian, H. Chemical food contaminants during food processing: sources and control. Crit Rev Food Sci Nutr 2021, 61, 1545-1555. [CrossRef]
- Zingales, V.; Taroncher, M.; Martino, P.A.; Ruiz, M.J.; Caloni, F. Climate Change and Effects on Molds and Mycotoxins. Toxins (Basel) 2022, 14. [CrossRef]
- Marin, S.; Ramos, A.J.; Cano-Sancho, G.; Sanchis, V. Mycotoxins: occurrence, toxicology, and exposure assessment. Food Chem Toxicol 2013, 60, 218-237. [CrossRef]
- El-Sayed, R.A.; Jebur, A.B.; Kang, W.; El-Esawi, M.A.; El-Demerdash, F.M. An overview on the major mycotoxins in food products: Characteristics, toxicity, and analysis. Journal of Future Foods 2022, 2, 91-102.
- Moretti, A.; Logrieco, A.F.; Susca, A. Mycotoxins: An underhand food problem. Mycotoxigenic Fungi: Methods and Protocols 2017, 3-12.
- FAO/WHO, J. Food Standards Programme Codex Committee on Contaminants. Available online: https://www.fao.org/fao-who-codexalimentarius/sh-proxy/en/?lnk=1&url=https%253A%252F%252Fworkspace.fao.org%252Fsites%252Fcodex%252FShared%2BDocuments%252FArchive%252FMeetings%252FCCCF%252Fcccf9%252Fcf09_INF1e.pdf (accessed on February 22, 2023).
- Pattono, D.; Grosso, A.; Stocco, P.; Pazzi, M.; Zeppa, G. Survey of the presence of patulin and ochratoxin A in traditional semi-hard cheeses. Food Control 2013, 33, 54-57.
- Ainiza, W.W.; Jinap, S.; Sanny, M. Simultaneous determination of aflatoxins and ochratoxin A in single and mixed spices. Food Control 2015, 50, 913-918.
- Juan, C.; Moltó, J.; Lino, C.; Mañes, J. Determination of ochratoxin A in organic and non-organic cereals and cereal products from Spain and Portugal. Food chemistry 2008, 107, 525-530.
- Juan, C.; Pena, A.; Lino, C.; Moltó, J.; Mañes, J. Levels of ochratoxin A in wheat and maize bread from the central zone of Portugal. International journal of food microbiology 2008, 127, 284-289.
- Nielsen, K.F.; Ngemela, A.F.; Jensen, L.B.; de Medeiros, L.S.; Rasmussen, P.H. UHPLC-MS/MS determination of ochratoxin A and fumonisins in coffee using QuEChERS extraction combined with mixed-mode SPE purification. J Agric Food Chem 2015, 63, 1029-1034. [CrossRef]
- Roberts, J.; Chang-Yen, I.; Bekele, F.; Bekele, I.; Harrynanan, L. Determination of ochratoxin A in cocoa beans using immunoaffinity column cleanup with high-performance liquid chromatography. Journal of AOAC International 2014, 97, 884-888.
- Malir, F.; Ostry, V.; Pfohl-Leszkowicz, A.; Malir, J.; Toman, J. Ochratoxin A: 50 Years of Research. Toxins (Basel) 2016, 8. [CrossRef]
- Stoev, S.D. Balkan Endemic Nephropathy - Still continuing enigma, risk assessment and underestimated hazard of joint mycotoxin exposure of animals or humans. Chem Biol Interact 2017, 261, 63-79. [CrossRef]
- Koszegi, T.; Poor, M. Ochratoxin A: Molecular Interactions, Mechanisms of Toxicity and Prevention at the Molecular Level. Toxins (Basel) 2016, 8, 111. [CrossRef]
- Gupta, R.C.; Srivastava, A.; Lall, R. Ochratoxins and citrinin. In Veterinary toxicology; Elsevier: 2018; pp. 1019-1027.
- EFSA. Risk assessment of ochratoxin A in food. EFSA Journal 2020, 1-150. [CrossRef]
- IARC. Ochratoxin A. IARC Monographs on the Evaluation of Carcinogenic Risks to Humans 1993, 56, 489-521.
- EFSA. Opinion of the scientific panel on contaminants in the food chain on a request from the commission related to Ochratoxin A in food. EFSA Journal 2006, 365, 1-56.
- Ramalingam, S.; Bahuguna, A.; Kim, M. The effects of mycotoxin patulin on cells and cellular components. Trends in Food Science & Technology 2019, 83, 99-113. [CrossRef]
- IARC. IARC Monographs on the Evaluation of Carcinogenic Risks to Humans. Overall Evaluations of Carcinogenicity: An Updating of IARC Monographs Volumes 1 to 42. IARC Monographs 1987.
- JEFCA. Evaluation of Certain Food Additives and Contaminants. Forty-fourth report of the Joint FAO/WHO Expert Committee on Food Additives. WHO Technical Report Series 1995, 859, 36-38.
- 2003/598/EC. COMMISSION RECOMMENDATION of 11 August 2003 on the prevention and reduction of patulin contamination in apple juice and apple juice ingredients in other beverages. Official Journal of the European Union, 1-6.
- Bertuzzi, T.; Romani, M.; Rastelli, S.; Giorni, P. Mycotoxins and Related Fungi in Italian Paddy Rice During the Growing Season and Storage. Toxins (Basel) 2019, 11. [CrossRef]
- Garcia-Moraleja, A.; Font, G.; Manes, J.; Ferrer, E. Analysis of mycotoxins in coffee and risk assessment in Spanish adolescents and adults. Food Chem Toxicol 2015, 86, 225-233. [CrossRef]
- Versilovskis, A.; Bartkevics, V.; Mikelsone, V. Analytical method for the determination of sterigmatocystin in grains using high-performance liquid chromatography-tandem mass spectrometry with electrospray positive ionization. J Chromatogr A 2007, 1157, 467-471. [CrossRef]
- Versilovskis, A.; Bartkevics, V.; Mikelsone, V. Sterigmatocystin presence in typical Latvian grains. Food Chem 2008, 109, 243-248. [CrossRef]
- Versilovskis, A.; Van Peteghem, C.; De Saeger, S. Determination of sterigmatocystin in cheese by high-performance liquid chromatography-tandem mass spectrometry. Food Addit Contam Part A Chem Anal Control Expo Risk Assess 2009, 26, 127-133. [CrossRef]
- Yoshinari, T.; Takeuchi, H.; Kosugi, M.; Taniguchi, M.; Waki, M.; Hashiguchi, S.; Fujiyoshi, T.; Shichinohe, Y.; Nakajima, M.; Ohnishi, T.; et al. Determination of sterigmatocystin in foods in Japan: method validation and occurrence data. Food Addit Contam Part A Chem Anal Control Expo Risk Assess 2019, 36, 1404-1410. [CrossRef]
- Zingales, V.; Fernandez-Franzon, M.; Ruiz, M.J. Sterigmatocystin: Occurrence, toxicity and molecular mechanisms of action - A review. Food Chem Toxicol 2020, 146, 111802. [CrossRef]
- Cao, X.; Li, X.; Li, J.; Niu, Y.; Shi, L.; Fang, Z.; Zhang, T.; Ding, H. Quantitative determination of carcinogenic mycotoxins in human and animal biological matrices and animal-derived foods using multi-mycotoxin and analyte-specific high performance liquid chromatography-tandem mass spectrometric methods. J Chromatogr B Analyt Technol Biomed Life Sci 2018, 1073, 191-200. [CrossRef]
- Dubravka, R.; Daniela, J.; Andrea, H.T.; Domagoj, K.; Nevenka, K.; Lada, R.; Davor, Z.; Maja, P.; Maja, S.K. Sterigmatocystin moderately induces oxidative stress in male Wistar rats after short-term oral treatment. Mycotoxin Res 2019. [CrossRef]
- Hutanasu, C.; Sfarti, C.; Trifan, A.; Cojocariu, C.; Singeap, A.M.; Spac, A.; Stanciu, C. [High levels of sterigmatocystin in patients with chronic liver diseases]. Rev Med Chir Soc Med Nat Iasi 2011, 115, 33-37.
- Kovesi, B.; Pelyhe, C.; Zandoki, E.; Mezes, M.; Balogh, K. Effect of short-term sterigmatocystin exposure on lipid peroxidation and glutathione redox system and expression of glutathione redox system regulatory genes in common carp liver. Toxicon 2019, 161, 50-56. [CrossRef]
- Sivakumar, V.; Thanislass, J.; Niranjali, S.; Devaraj, H. Lipid peroxidation as a possible secondary mechanism of sterigmatocystin toxicity. Hum Exp Toxicol 2001, 20, 398-403. [CrossRef]
- Ferreira, L.P.; Gaspar, V.M.; Mano, J.F. Design of spherically structured 3D in vitro tumor models -Advances and prospects. Acta Biomater 2018, 75, 11-34. [CrossRef]
- Wrzesinski, K.; Fey, S.J. From 2D to 3D--a New Dimension for Modelling the Effect of Natural Products on Human Tissue. Curr Pharm Des 2015, 21, 5605-5616. [CrossRef]
- Zingales, V.; Esposito, M.R.; Torriero, N.; Taroncher, M.; Cimetta, E.; Ruiz, M.J. The Growing Importance of Three-Dimensional Models and Microphysiological Systems in the Assessment of Mycotoxin Toxicity. Toxins (Basel) 2023, 15. [CrossRef]
- Santo, V.E.; Estrada, M.F.; Rebelo, S.P.; Abreu, S.; Silva, I.; Pinto, C.; Veloso, S.C.; Serra, A.T.; Boghaert, E.; Alves, P.M.; et al. Adaptable stirred-tank culture strategies for large scale production of multicellular spheroid-based tumor cell models. J Biotechnol 2016, 221, 118-129. [CrossRef]
- Skrzydlewski, P.; Twaruzek, M.; Grajewski, J. Cytotoxicity of Mycotoxins and Their Combinations on Different Cell Lines: A Review. Toxins (Basel) 2022, 14. [CrossRef]
- Goodman, T.T.; Ng, C.P.; Pun, S.H. 3-D tissue culture systems for the evaluation and optimization of nanoparticle-based drug carriers. Bioconjug Chem 2008, 19, 1951-1959. [CrossRef]
- Lee, J.; Lilly, G.D.; Doty, R.C.; Podsiadlo, P.; Kotov, N.A. In vitro toxicity testing of nanoparticles in 3D cell culture. Small 2009, 5, 1213-1221. [CrossRef]
- Karmaus, A.L.; Bialk, H.; Fitzpatrick, S.; Krishan, M. State of the science on alternatives to animal testing and integration of testing strategies for food safety assessments: Workshop proceedings. Regul Toxicol Pharmacol 2020, 110, 104515. [CrossRef]
- Cattaneo, I.; Astuto, M.C.; Binaglia, M.; Devos, Y.; Dorne, J.-L.C.M.; Ana, F.A.; Fernandez, D.A.; Garcia-Vello, P.; Kass, G.E.; Lanzoni, A. Implementing New Approach Methodologies (NAMs) in food safety assessments: Strategic objectives and actions taken by the European Food Safety Authority. Trends in Food Science & Technology 2023.
- Csenki, Z.; Garai, E.; Faisal, Z.; Csepregi, R.; Garai, K.; Sipos, D.K.; Szabo, I.; Koszegi, T.; Czeh, A.; Czompoly, T.; et al. The individual and combined effects of ochratoxin A with citrinin and their metabolites (ochratoxin B, ochratoxin C, and dihydrocitrinone) on 2D/3D cell cultures, and zebrafish embryo models. Food Chem Toxicol 2021, 158, 112674. [CrossRef]
- Imaoka, T.; Yang, J.; Wang, L.; McDonald, M.G.; Afsharinejad, Z.; Bammler, T.K.; Van Ness, K.; Yeung, C.K.; Rettie, A.E.; Himmelfarb, J.; et al. Microphysiological system modeling of ochratoxin A-associated nephrotoxicity. Toxicology 2020, 444, 152582. [CrossRef]
- Zingales, V.; Torriero, N.; Zanella, L.; Fernandez-Franzon, M.; Ruiz, M.J.; Esposito, M.R.; Cimetta, E. Development of an in vitro neuroblastoma 3D model and its application for sterigmatocystin-induced cytotoxicity testing. Food Chem Toxicol 2021, 157, 112605. [CrossRef]
- Kim, B.; Ejaz, S.; Chekarova, I.; Sukura, A.; Ashraf, M.; Lim, C.W. Cytotoxicity of fumonisin B(1) in spheroid and monolayer cultures of rat hepatocytes. Drug Chem Toxicol 2008, 31, 339-352. [CrossRef]
- Housman, G.; Byler, S.; Heerboth, S.; Lapinska, K.; Longacre, M.; Snyder, N.; Sarkar, S. Drug resistance in cancer: an overview. Cancers 2014, 6, 1769-1792.
- Aguilar Cosme, J.R.; Gagui, D.C.; Bryant, H.E.; Claeyssens, F. Morphological Response in Cancer Spheroids for Screening Photodynamic Therapy Parameters. Front Mol Biosci 2021, 8, 784962. [CrossRef]
- Calabrese, E.J.; Baldwin, L.A. The hormetic dose-response model is more common than the threshold model in toxicology. Toxicol Sci 2003, 71, 246-250. [CrossRef]
- Li, F.J.; Xu, Z.S.; Soo, A.D.; Lun, Z.R.; He, C.Y. ATP-driven and AMPK-independent autophagy in an early branching eukaryotic parasite. Autophagy 2017, 13, 715-729. [CrossRef]
- Yang, G.; Bai, Y.; Wu, X.; Sun, X.; Sun, M.; Liu, X.; Yao, X.; Zhang, C.; Chu, Q.; Jiang, L.; et al. Patulin induced ROS-dependent autophagic cell death in Human Hepatoma G2 cells. Chem Biol Interact 2018, 288, 24-31. [CrossRef]
- Senrung, A.; Lalwani, S.; Janjua, D.; Tripathi, T.; Kaur, J.; Ghuratia, N.; Aggarwal, N.; Chhokar, A.; Yadav, J.; Chaudhary, A. 3D tumor spheroids: morphological alterations a yardstick to anti-cancer drug response. In vitro models 2023, 1-30.
- Mittler, F.; Obeid, P.; Rulina, A.V.; Haguet, V.; Gidrol, X.; Balakirev, M.Y. High-Content Monitoring of Drug Effects in a 3D Spheroid Model. Front Oncol 2017, 7, 293. [CrossRef]
- Celli, J.P.; Rizvi, I.; Blanden, A.R.; Massodi, I.; Glidden, M.D.; Pogue, B.W.; Hasan, T. An imaging-based platform for high-content, quantitative evaluation of therapeutic response in 3D tumour models. Sci Rep 2014, 4, 3751. [CrossRef]
- Friedrich, J.; Eder, W.; Castaneda, J.; Doss, M.; Huber, E.; Ebner, R.; Kunz-Schughart, L.A. A reliable tool to determine cell viability in complex 3-d culture: the acid phosphatase assay. J Biomol Screen 2007, 12, 925-937. [CrossRef]
- Anbil, S.; Rizvi, I.; Celli, J.P.; Alagic, N.; Pogue, B.W.; Hasan, T. Impact of treatment response metrics on photodynamic therapy planning and outcomes in a three-dimensional model of ovarian cancer. J Biomed Opt 2013, 18, 098004. [CrossRef]
Figure 1.
Cytotoxic effects of STE (column 1, a1,b1,c1,d1), OTA (column 2, a2,b2,c2,d2,) and PAT (column 3, a3,b3,c3,d3) on BM-MSCs (row a), HUVECs (row b), MDA-MB-231 (row c) and SH-SY5Y(row d) cells cultured in monolayer. Cell viability was determined by ATP assay after 24, 48 and 72 h of exposure. Data are expressed as mean ± SEM of three independent experiments (n = 3). (*) p ≤ 0.05 indicates a significant difference compared to the control.
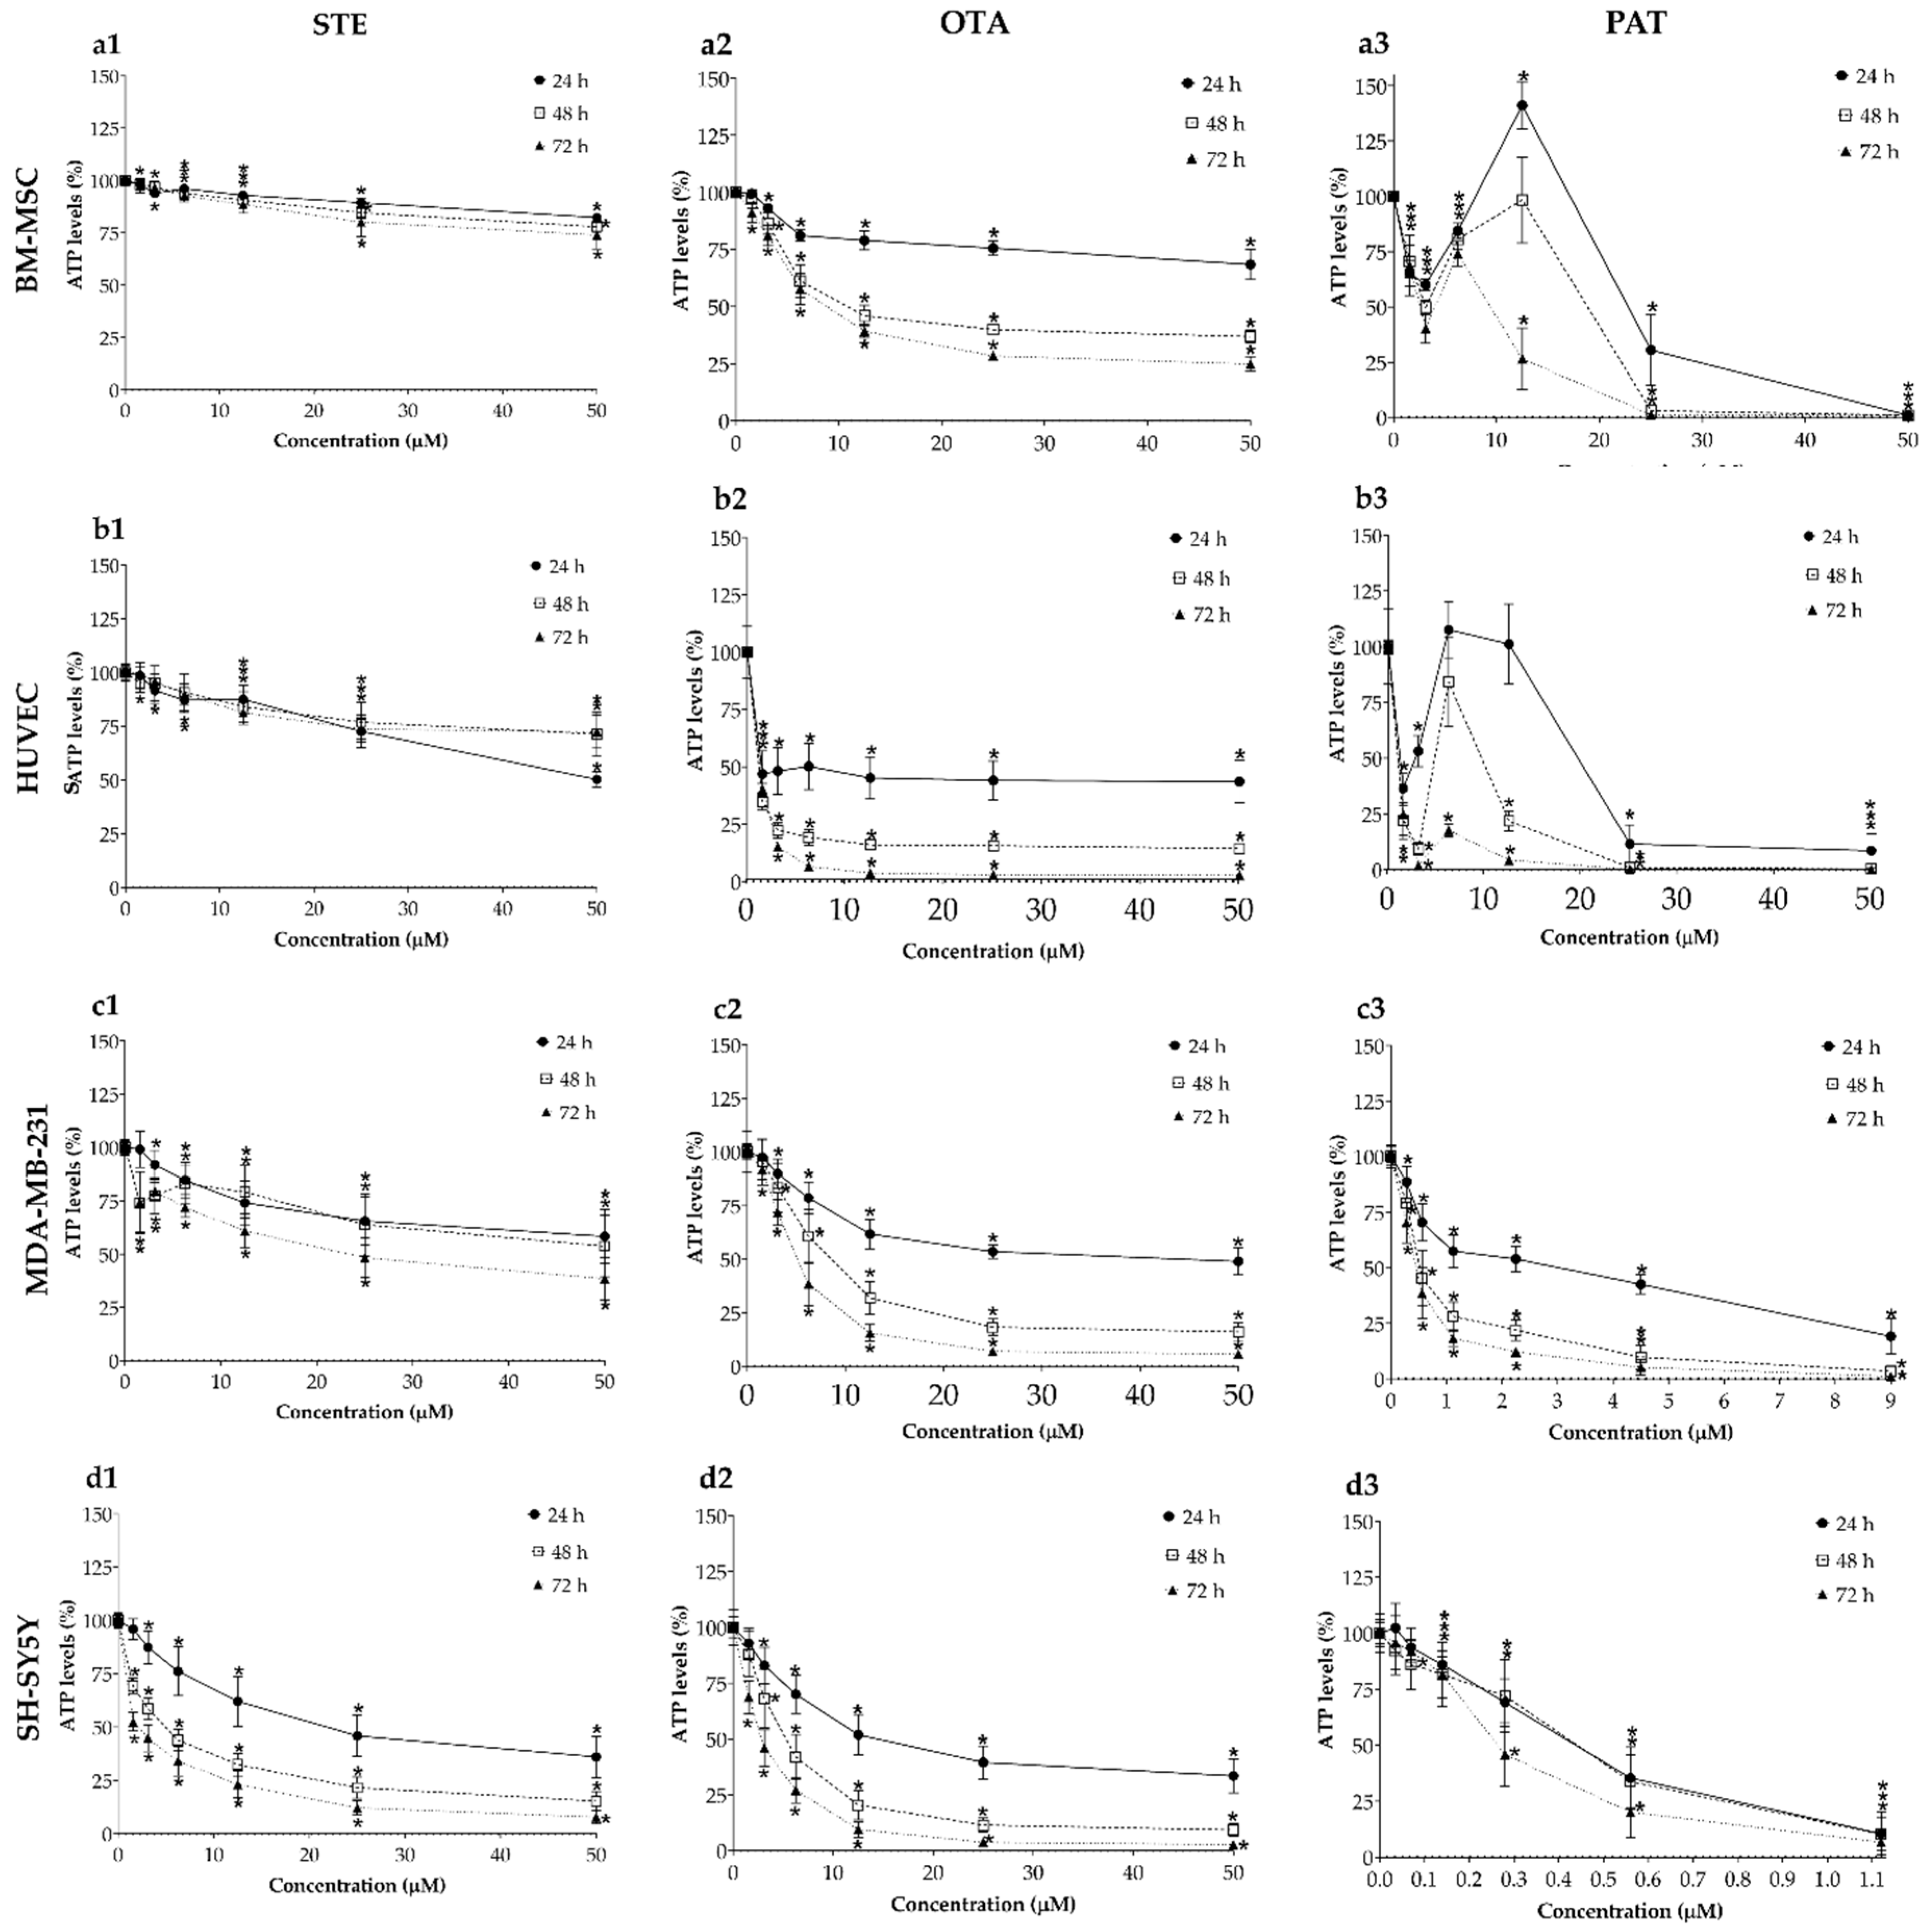
Figure 2.
Cytotoxic effects of STE (column 1, a1,b1,c1,d1), OTA (column 2, a2,b2,c2,d2,) and PAT (column 3, a3,b3,c3,d3) on BM-MSCs (row a), HUVECs (row b), MDA-MB-231 (row c) and SH-SY5Y(row d) spheroids. Cell viability was determined by ATP assay after 24, 48 and 72 h of exposure. Data are expressed as mean ± SEM of three independent experiments (n = 3). (*) p ≤ 0.05 indicates a significant difference compared to the control.
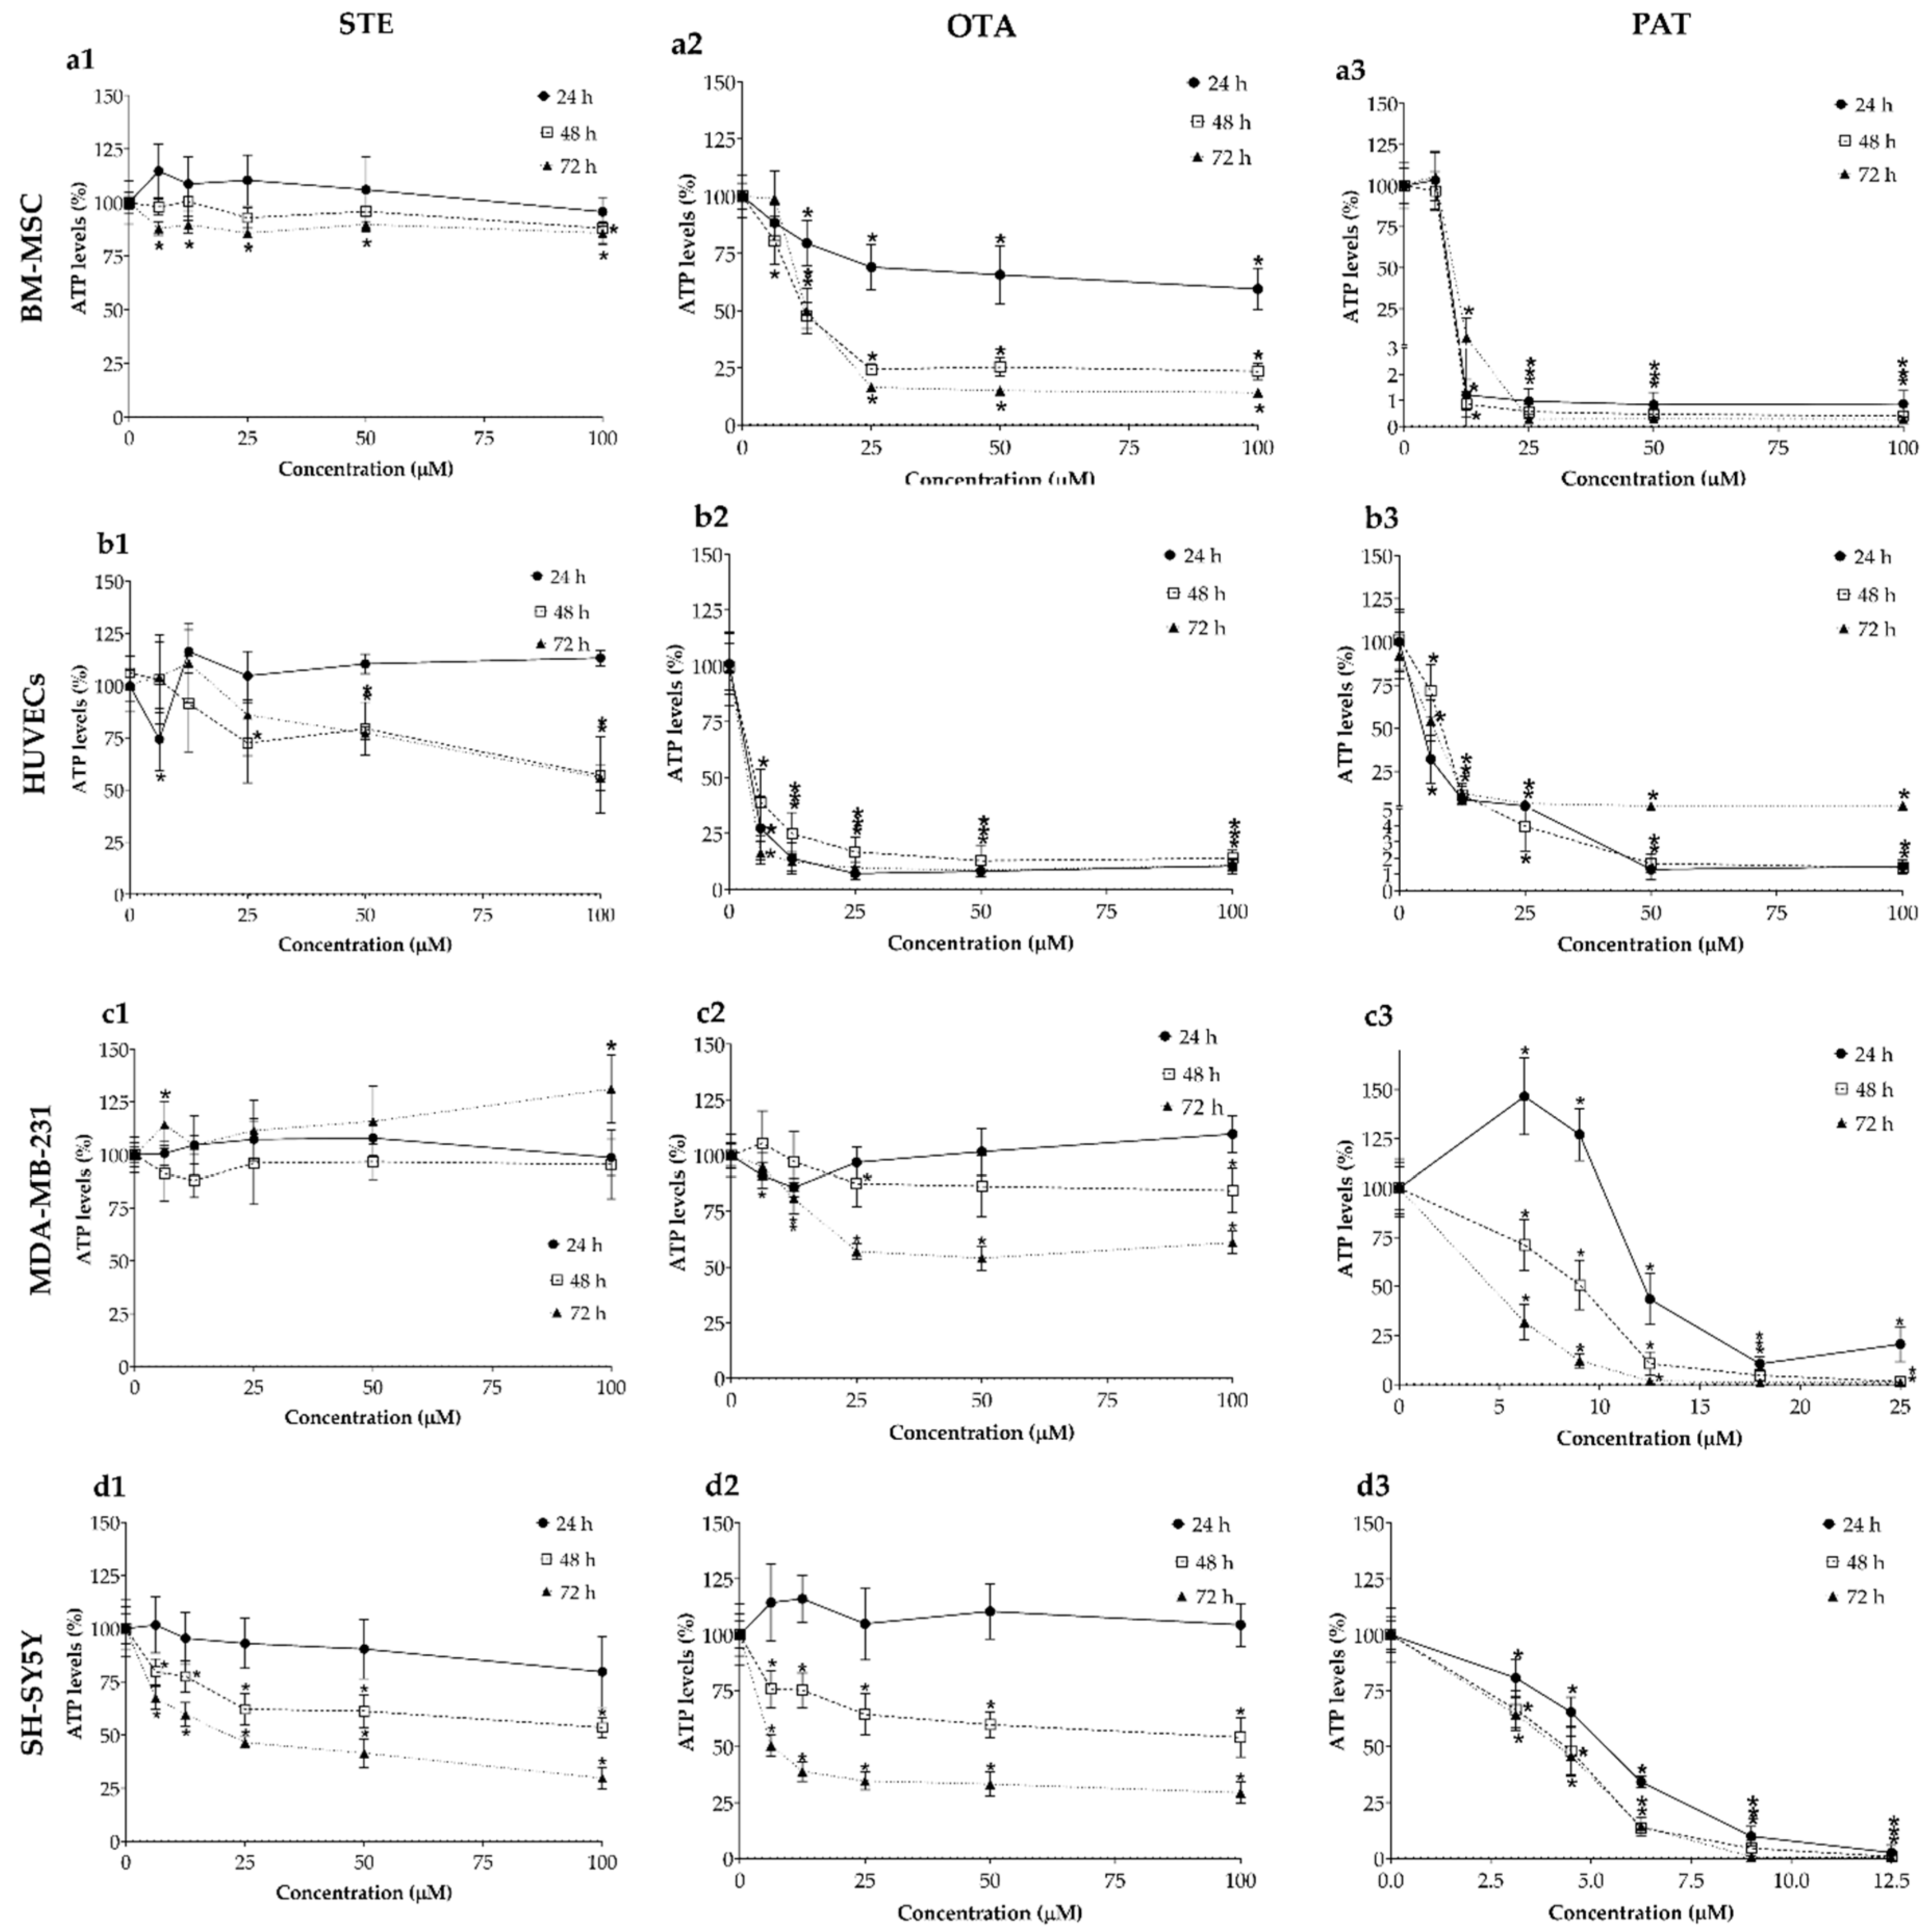
Figure 3.
Representative bright-field images of BM-MSCs spheroids after 0 and 72 h of exposure to STE, OTA and PAT. Spheroids exposed to the same amount of solvent (MeOH) were used as control. Images were obtained using the Light Microscope Zeiss Axio Observer (Zeiss Microscopy, Germany). Scale bar: 100 μm (magnification 5X).
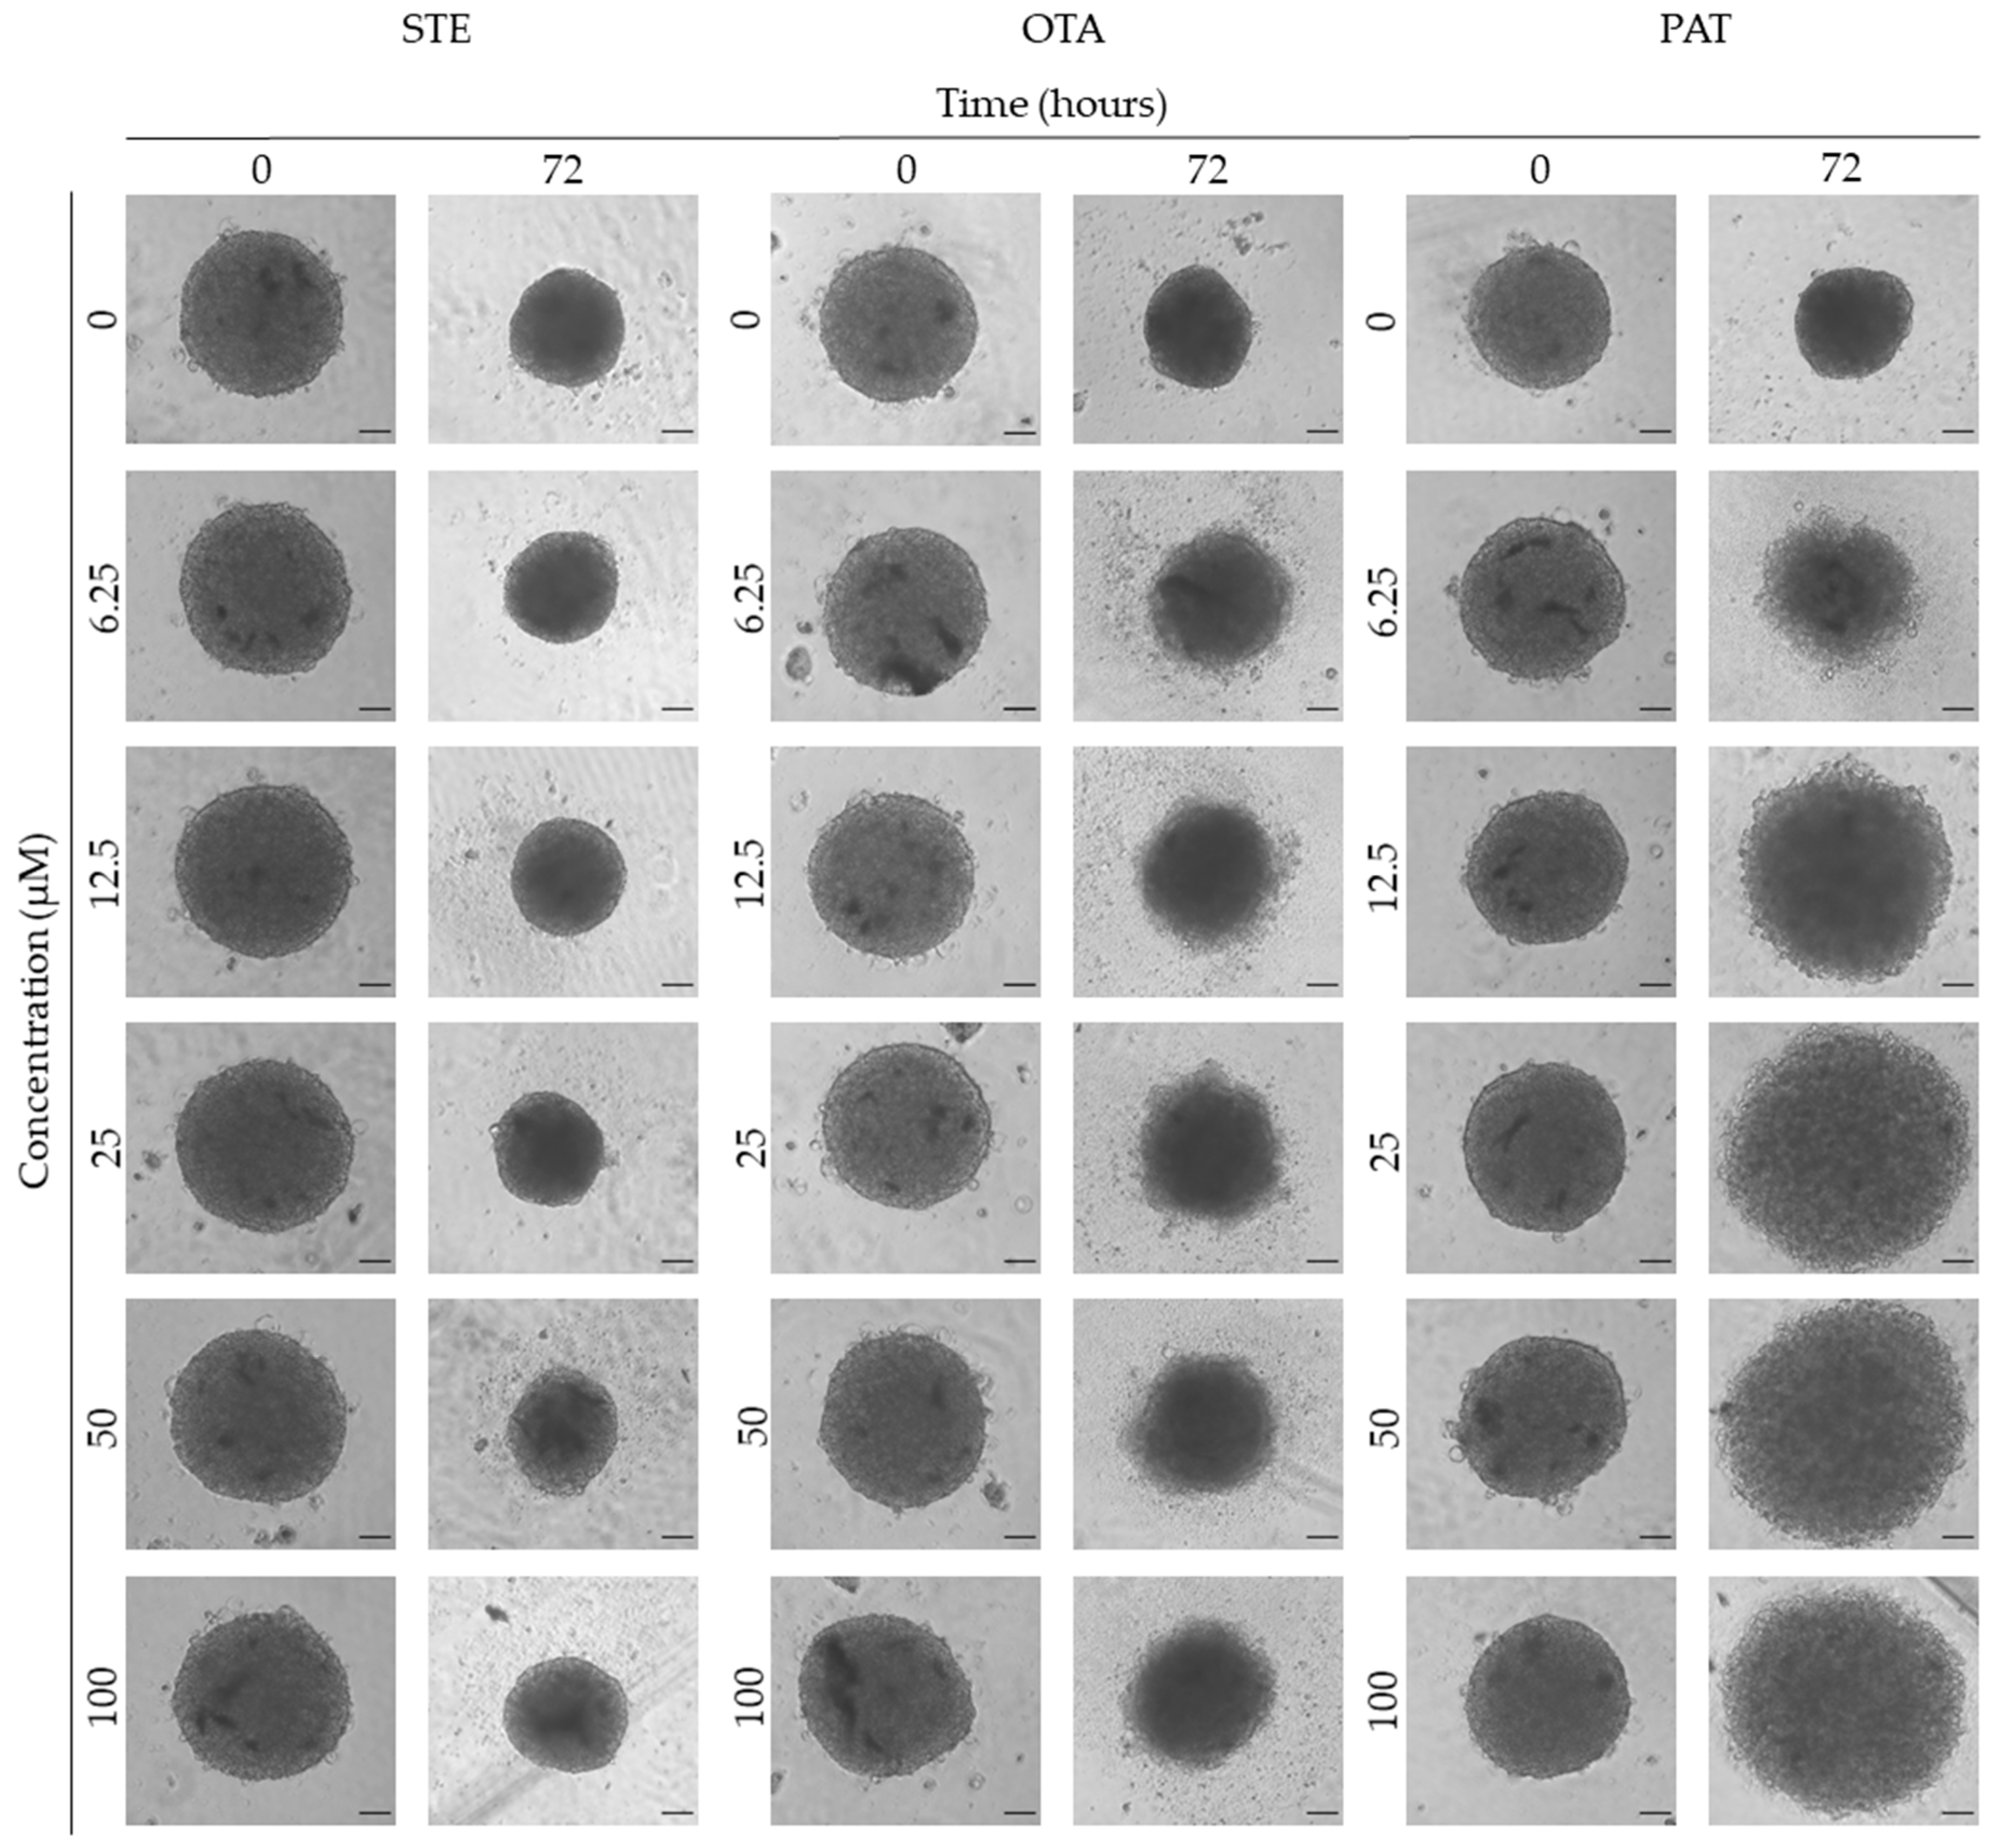
Figure 4.
Representative bright-field images of HUVECs spheroids after 0 and 72 h of exposure to STE, OTA and PAT. Spheroids exposed to the same amount of solvent (MeOH) were used as control. Images were obtained using the Light Microscope Zeiss Axio Observer (Zeiss Microscopy, Germany). Scale bar: 100 μm (magnification 5X).
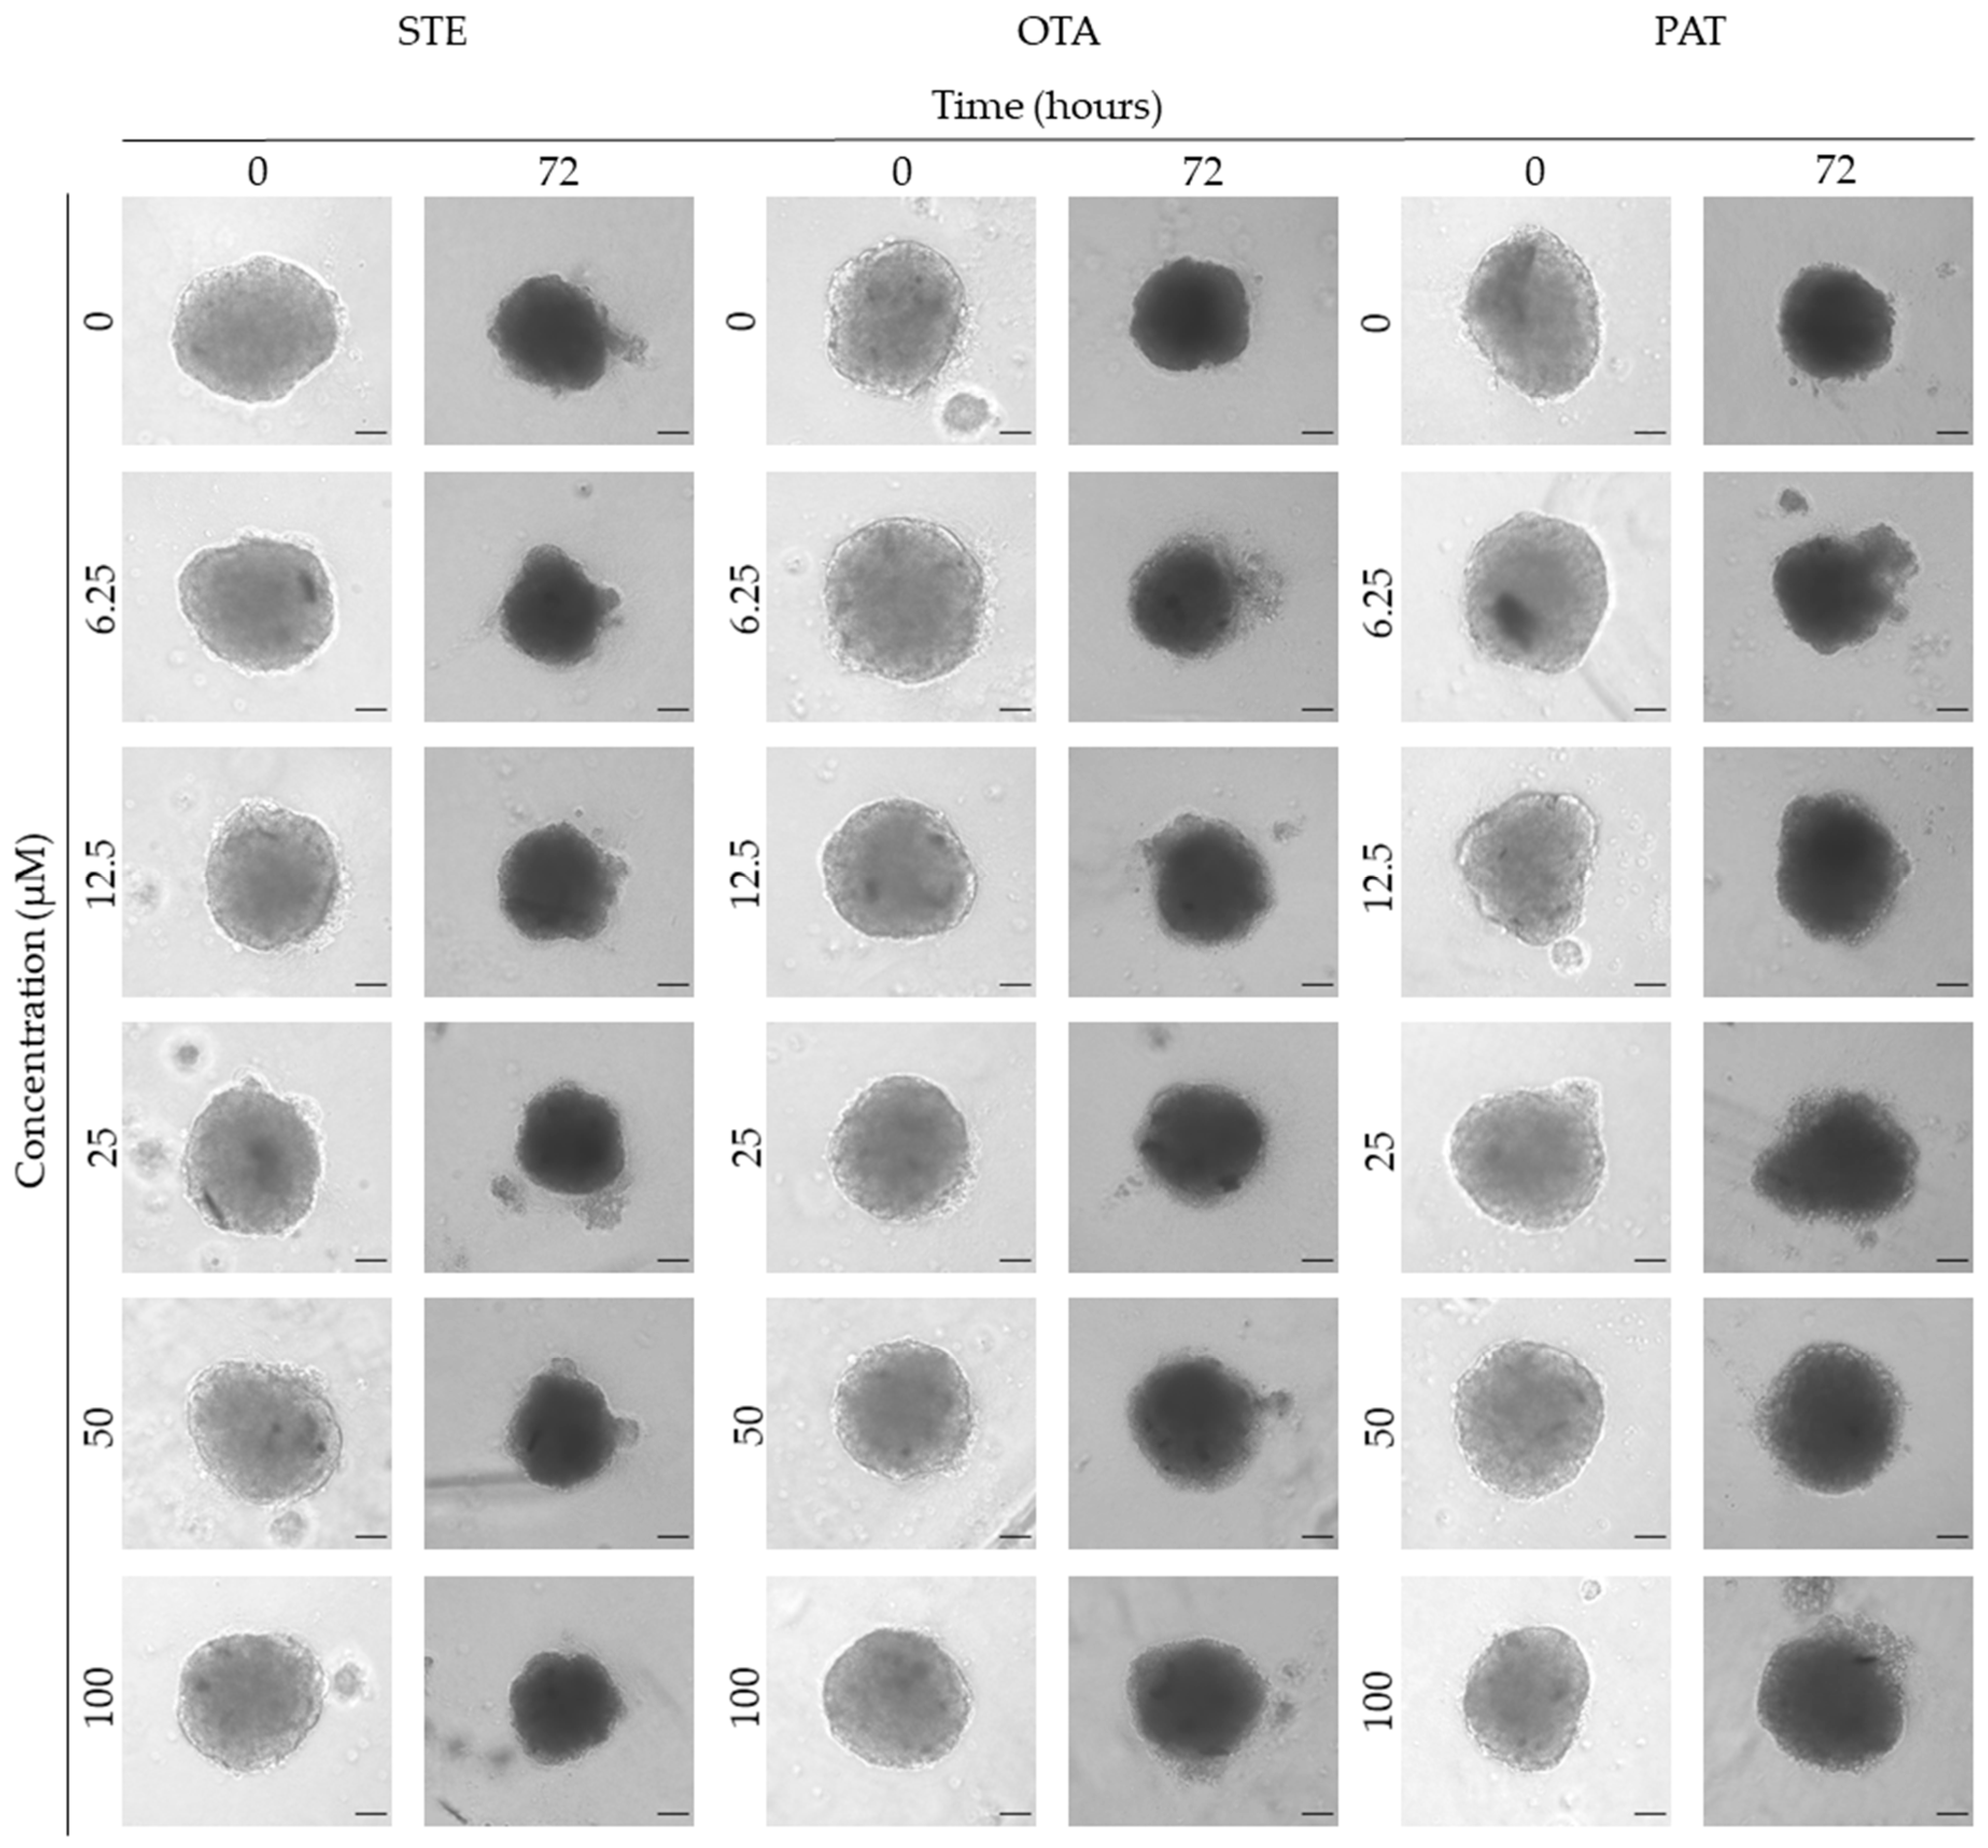
Figure 5.
Representative bright-field images of MDA-MB-231 spheroids after 0 and 72 h of exposure to STE, OTA and PAT. Spheroids exposed to the same amount of solvent (MeOH) were used as control. Images were obtained using the Light Microscope Zeiss Axio Observer (Zeiss Microscopy, Germany). Scale bar: 500 μm (magnification 2X).
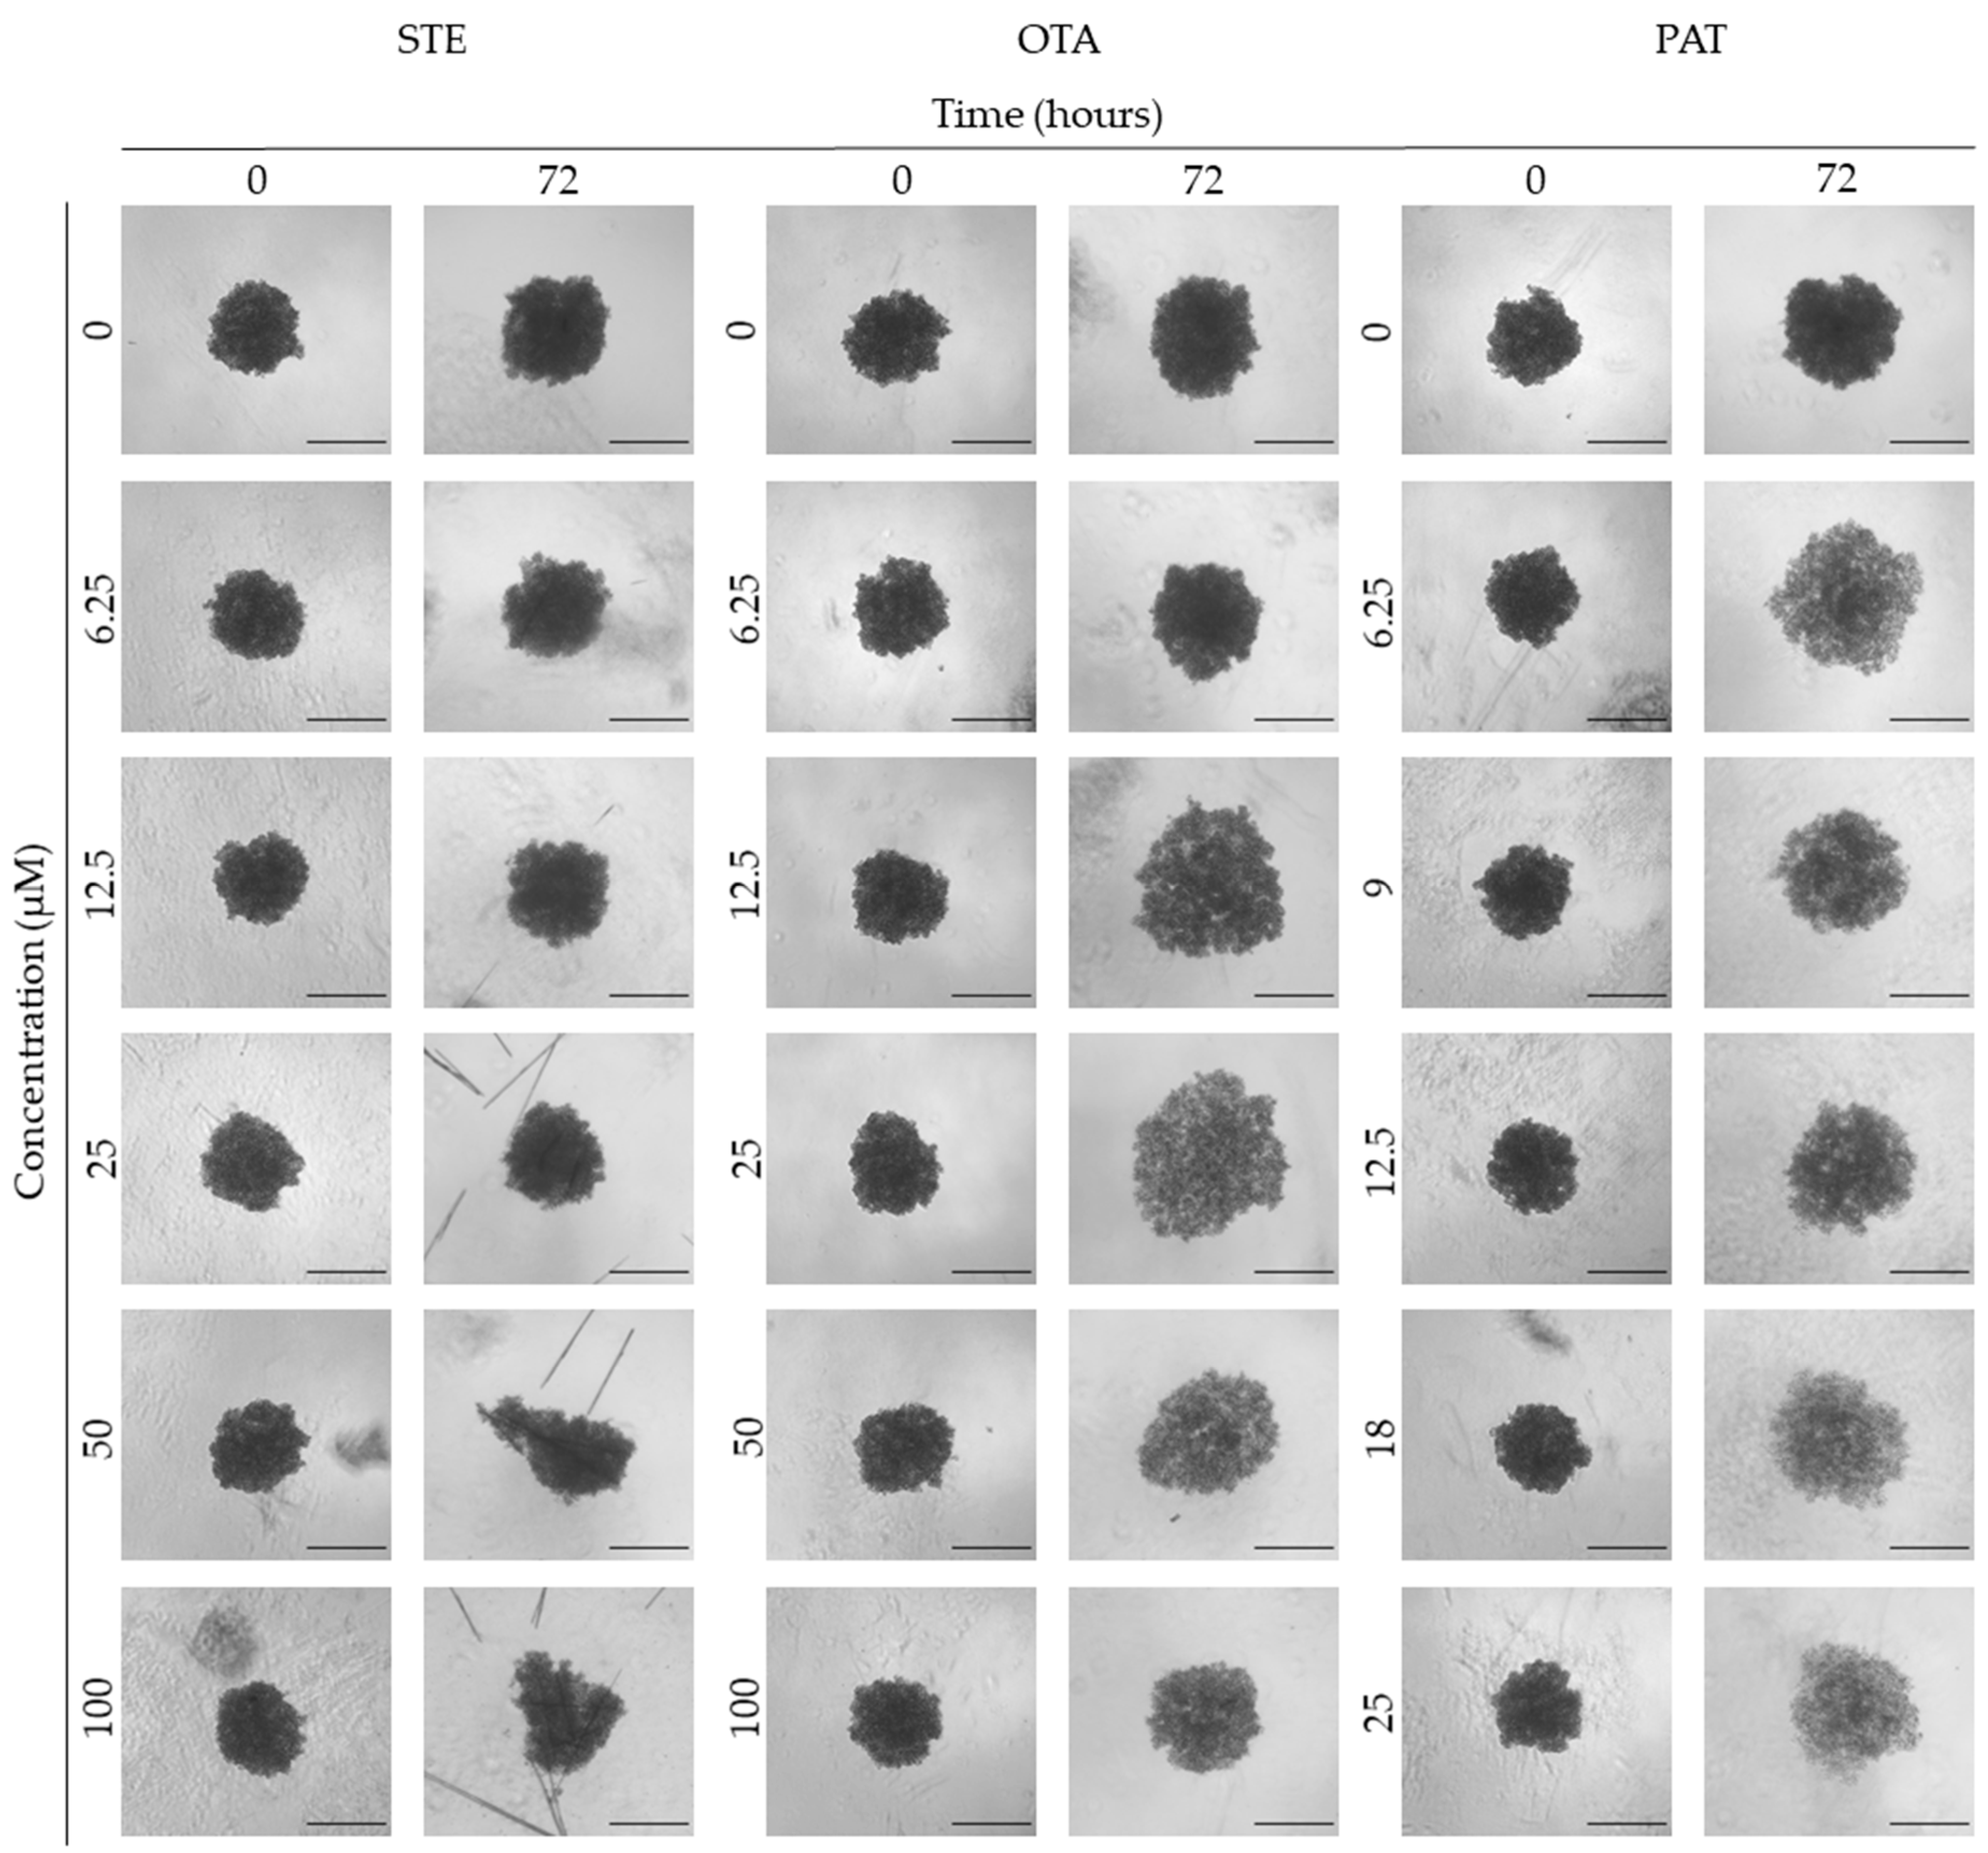
Figure 6.
Representative bright-field images of SH-SY5Y spheroids after 0 and 72 h of exposure to STE, OTA and PAT. Spheroids exposed to the same amount of solvent (MeOH) were used as control. Images were obtained using the Light Microscope Zeiss Axio Observer (Zeiss Microscopy, Germany). Scale bar: 500 μm (magnification 2X).
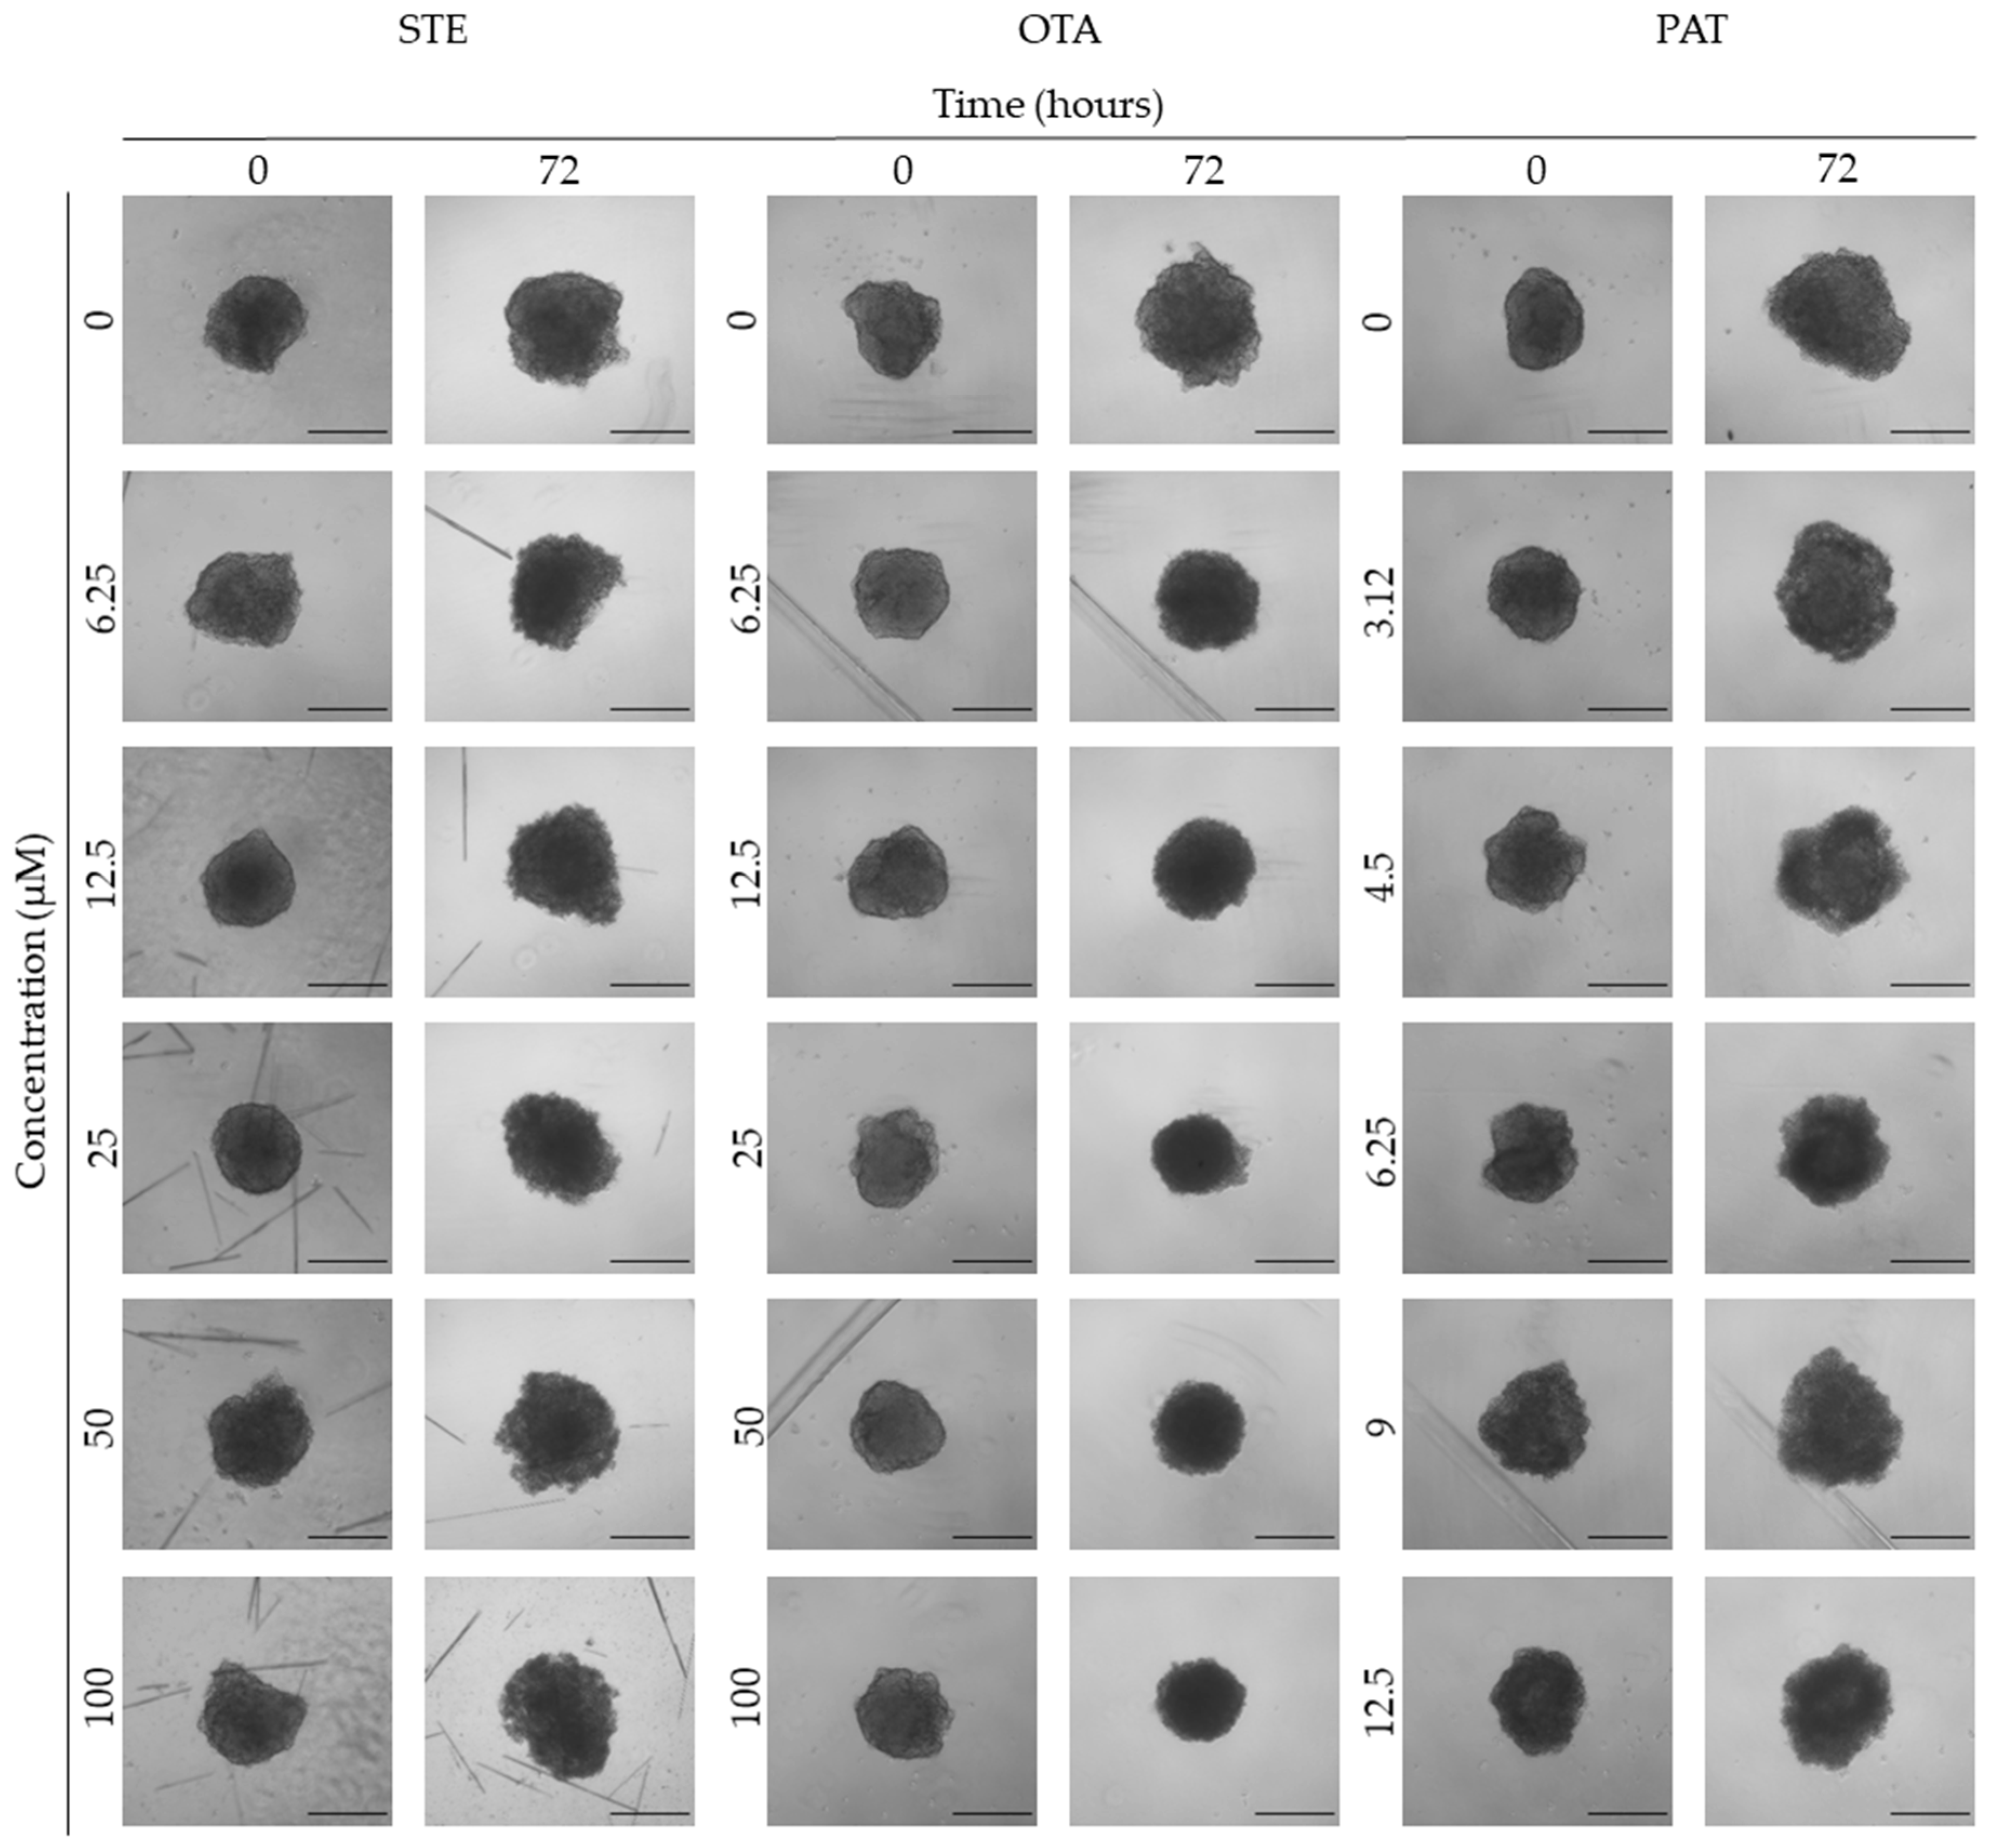
Figure 7.
Morphological parameters of BM-MSCs spheroids after 0 and 72 h of exposure to (a) STE, (b) OTA and (c) PAT. Compactness, solidity, SI, area and volume were determined after 0 and 72 h of exposure using AnaSP software. Data are expressed as mean ± SEM of three independent experiments (n = 3). (*) p ≤ 0.05 indicates a significant difference compared to the control. (#) p ≤ 0.05 indicates a significant difference compared to the respective T 0h.
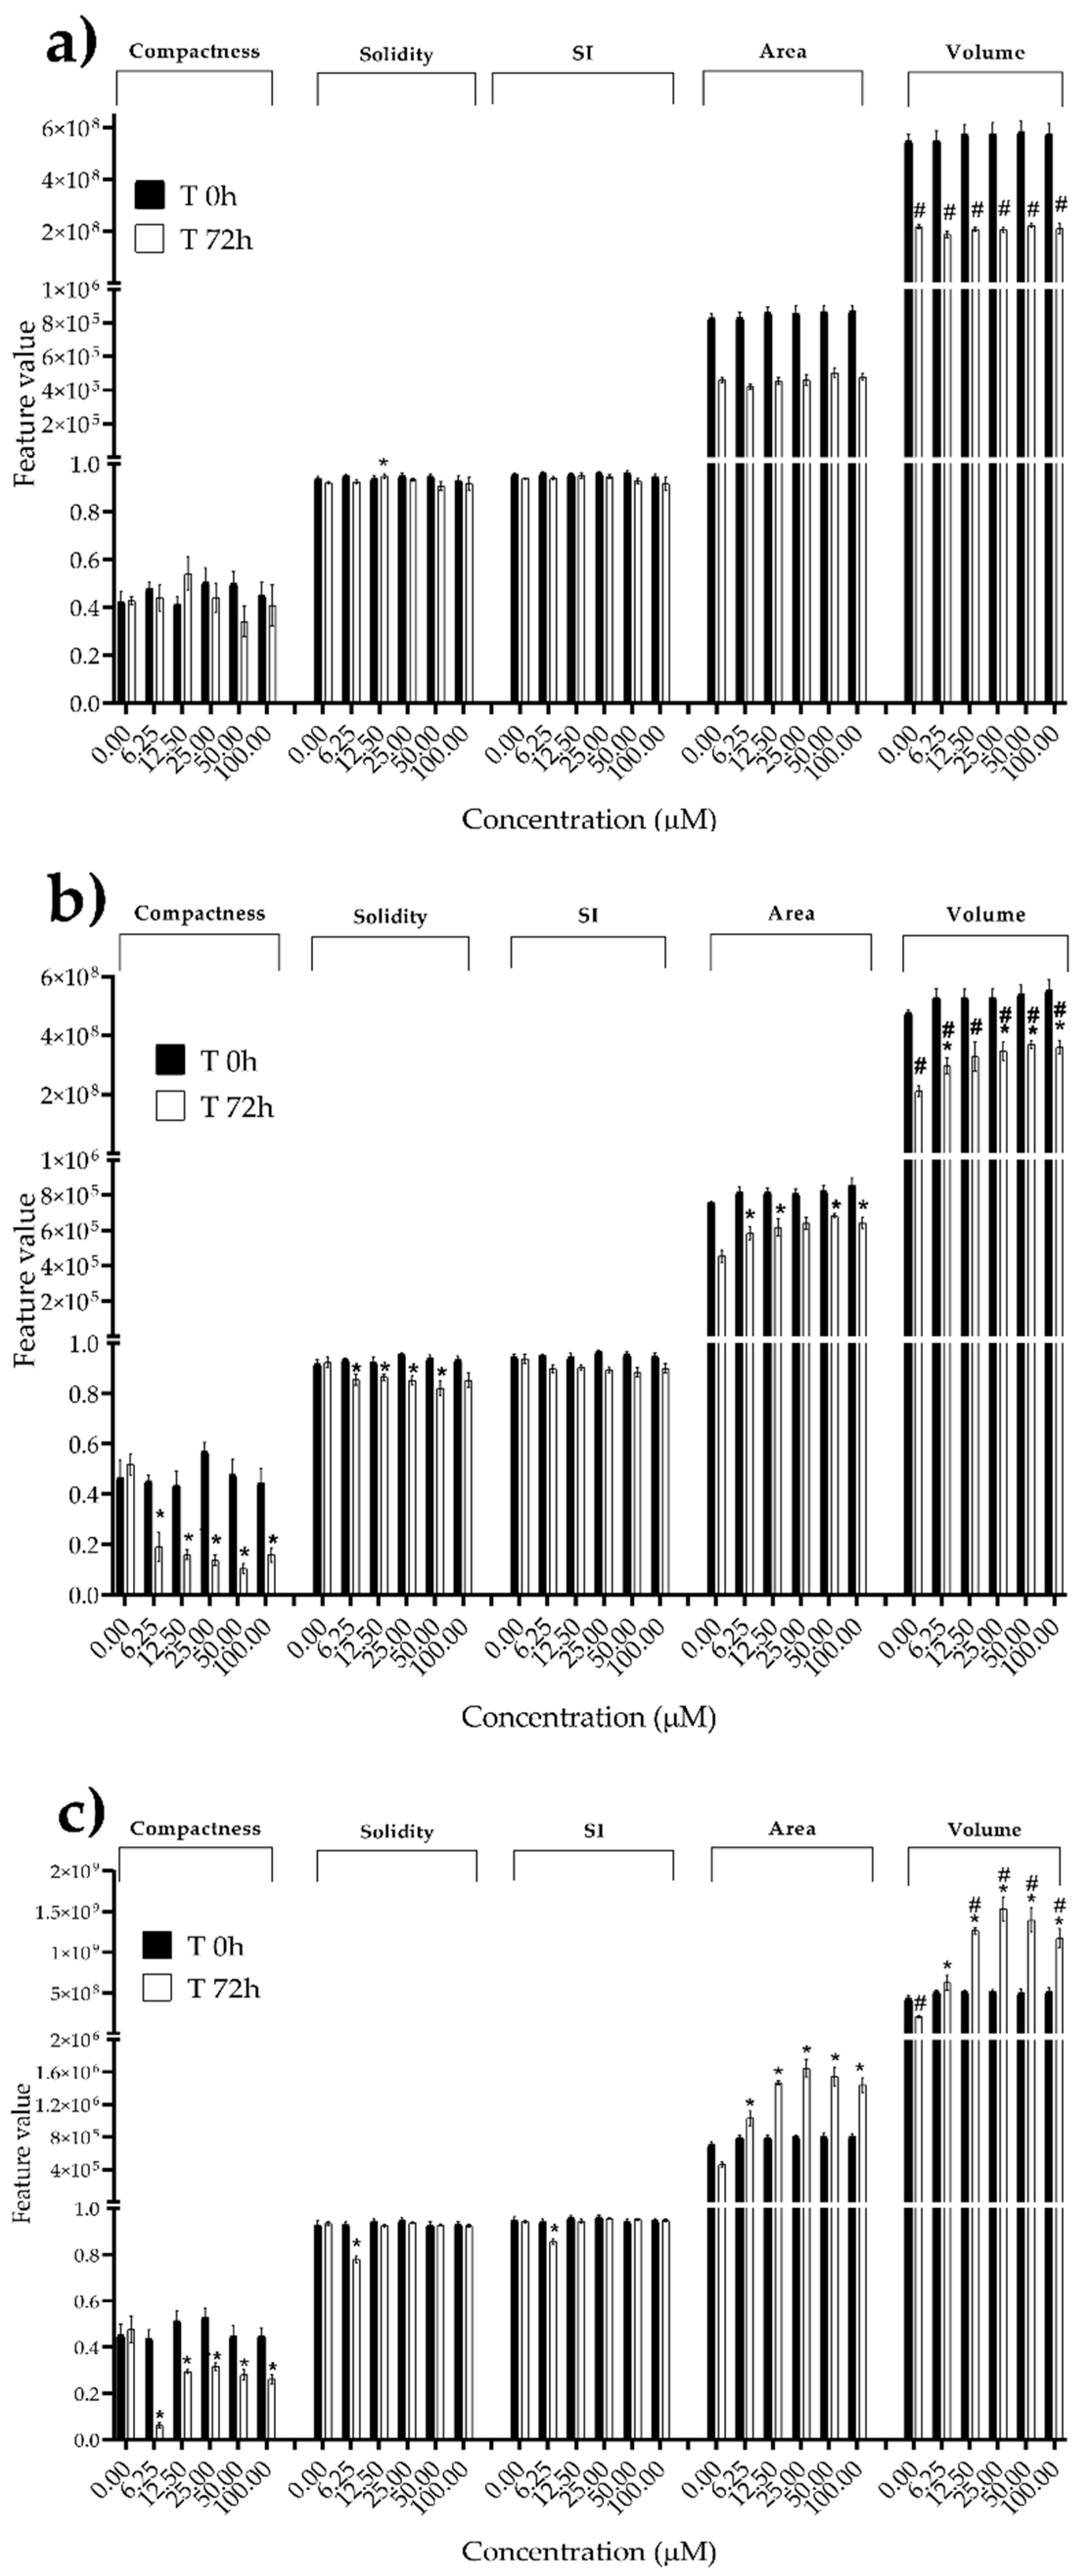
Figure 8.
Morphological parameters of HUVECs spheroids after 0 and 72 h of exposure to (a) STE, (b) OTA and (c) PAT. Compactness, solidity, SI, area and volume were determined after 0 and 72 h of exposure using AnaSP software. Data are expressed as mean ± SEM of three independent experiments (n = 3). (*) p ≤ 0.05 indicates a significant difference compared to the control. (#) p ≤ 0.05 indicates a significant difference compared to the respective T 0h.
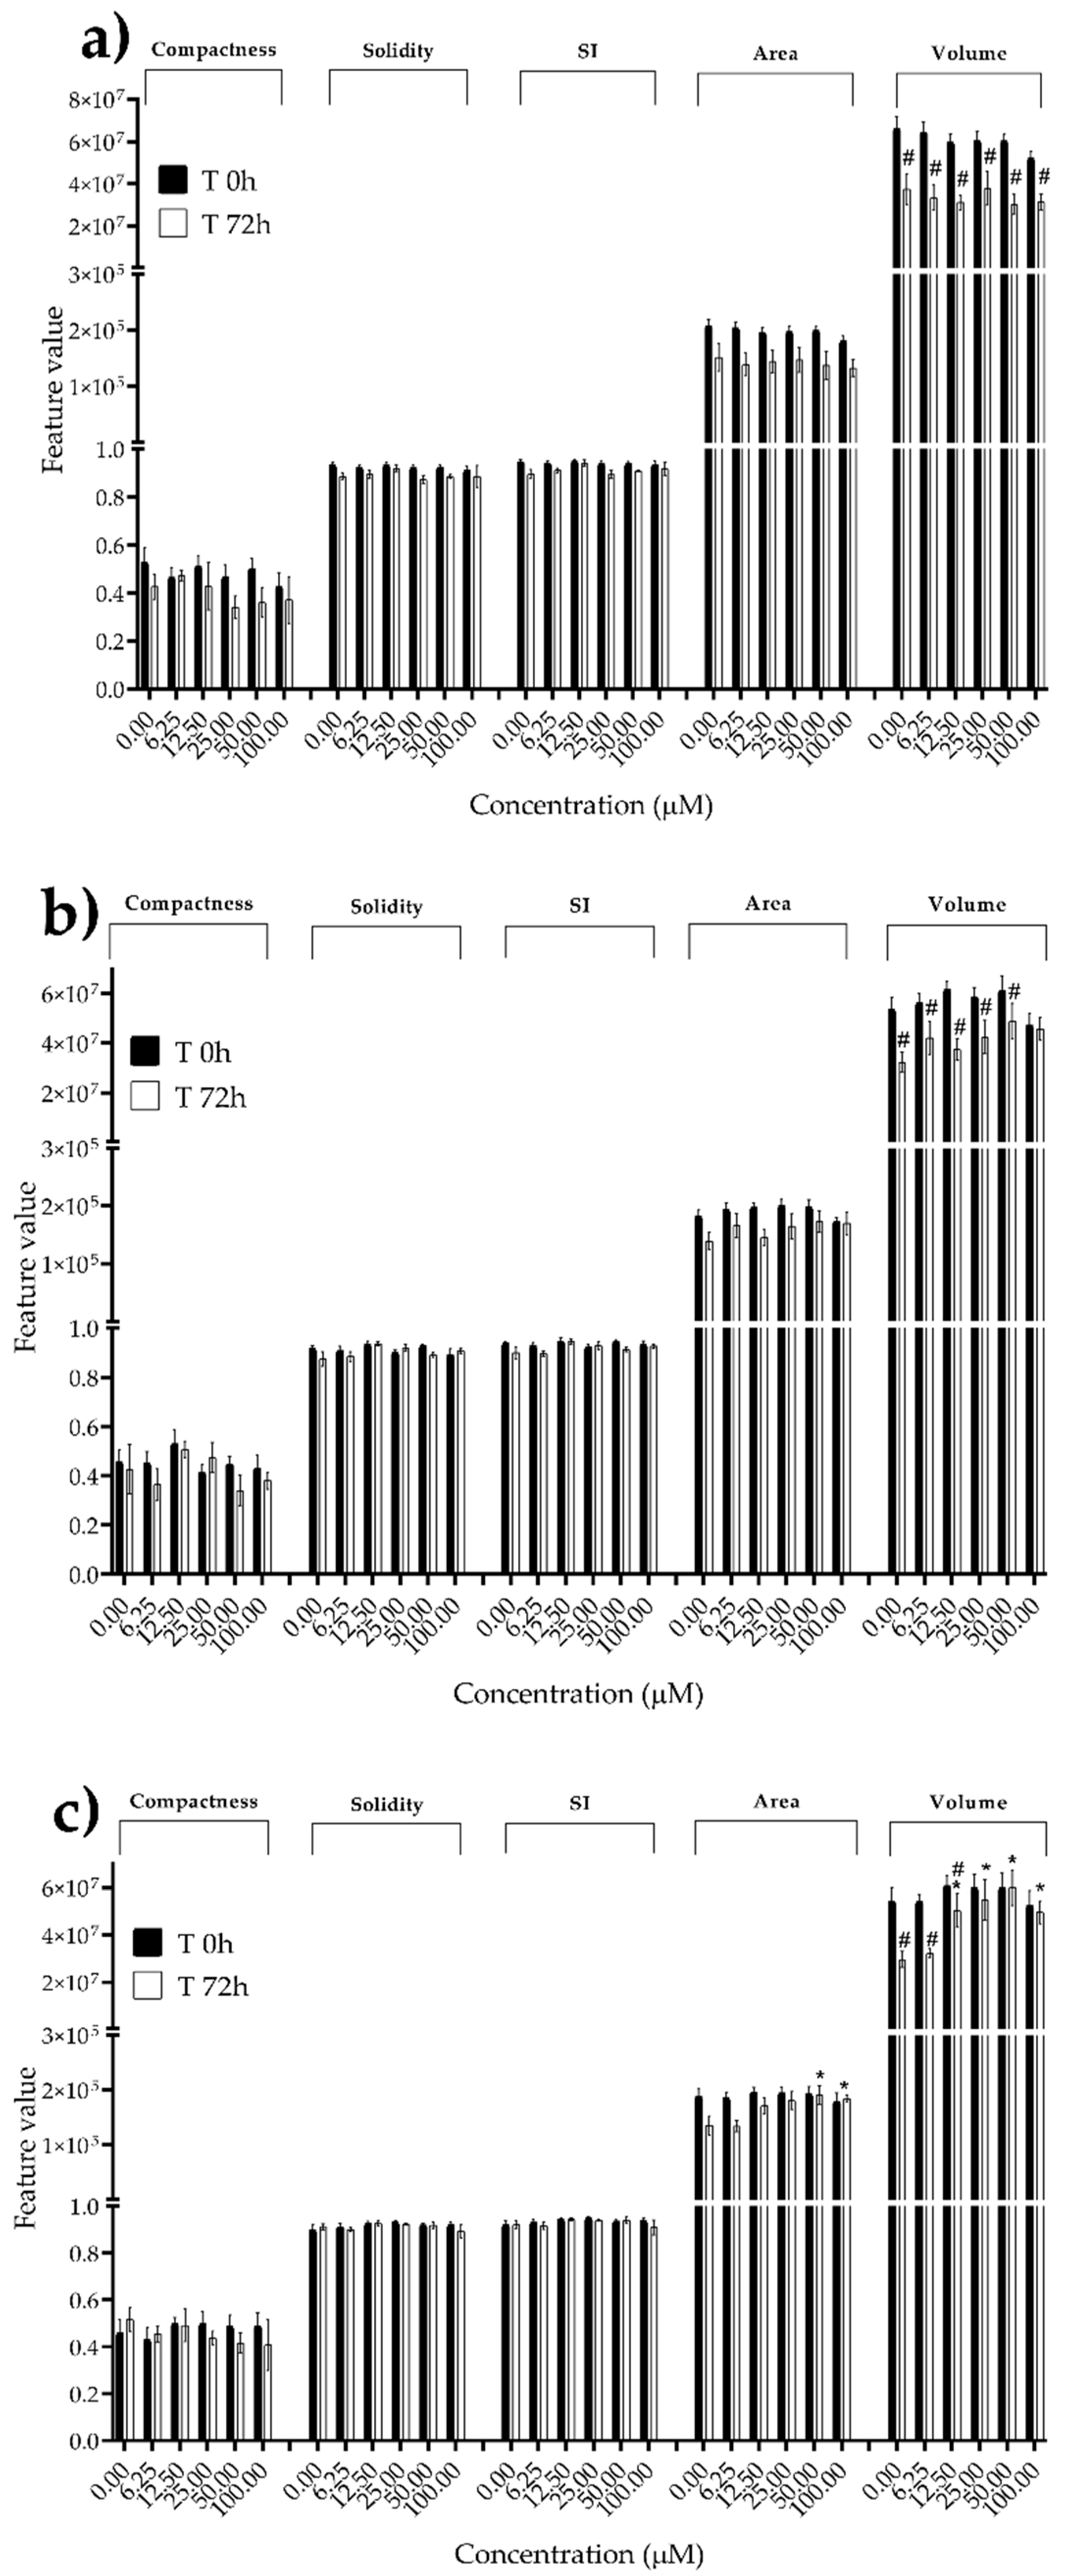
Figure 9.
Morphological parameters of MDA-MB-231 spheroids after 0 and 72 h of exposure to (a) STE, (b) OTA and (c) PAT. Compactness, solidity, SI, area and volume were determined after 0 and 72 h of exposure using AnaSP software. Data are expressed as mean ± SEM of three independent experiments (n = 3). (*) p ≤ 0.05 indicates a significant difference compared to the control. (#) p ≤ 0.05 indicates a significant difference compared to the respective T 0h.
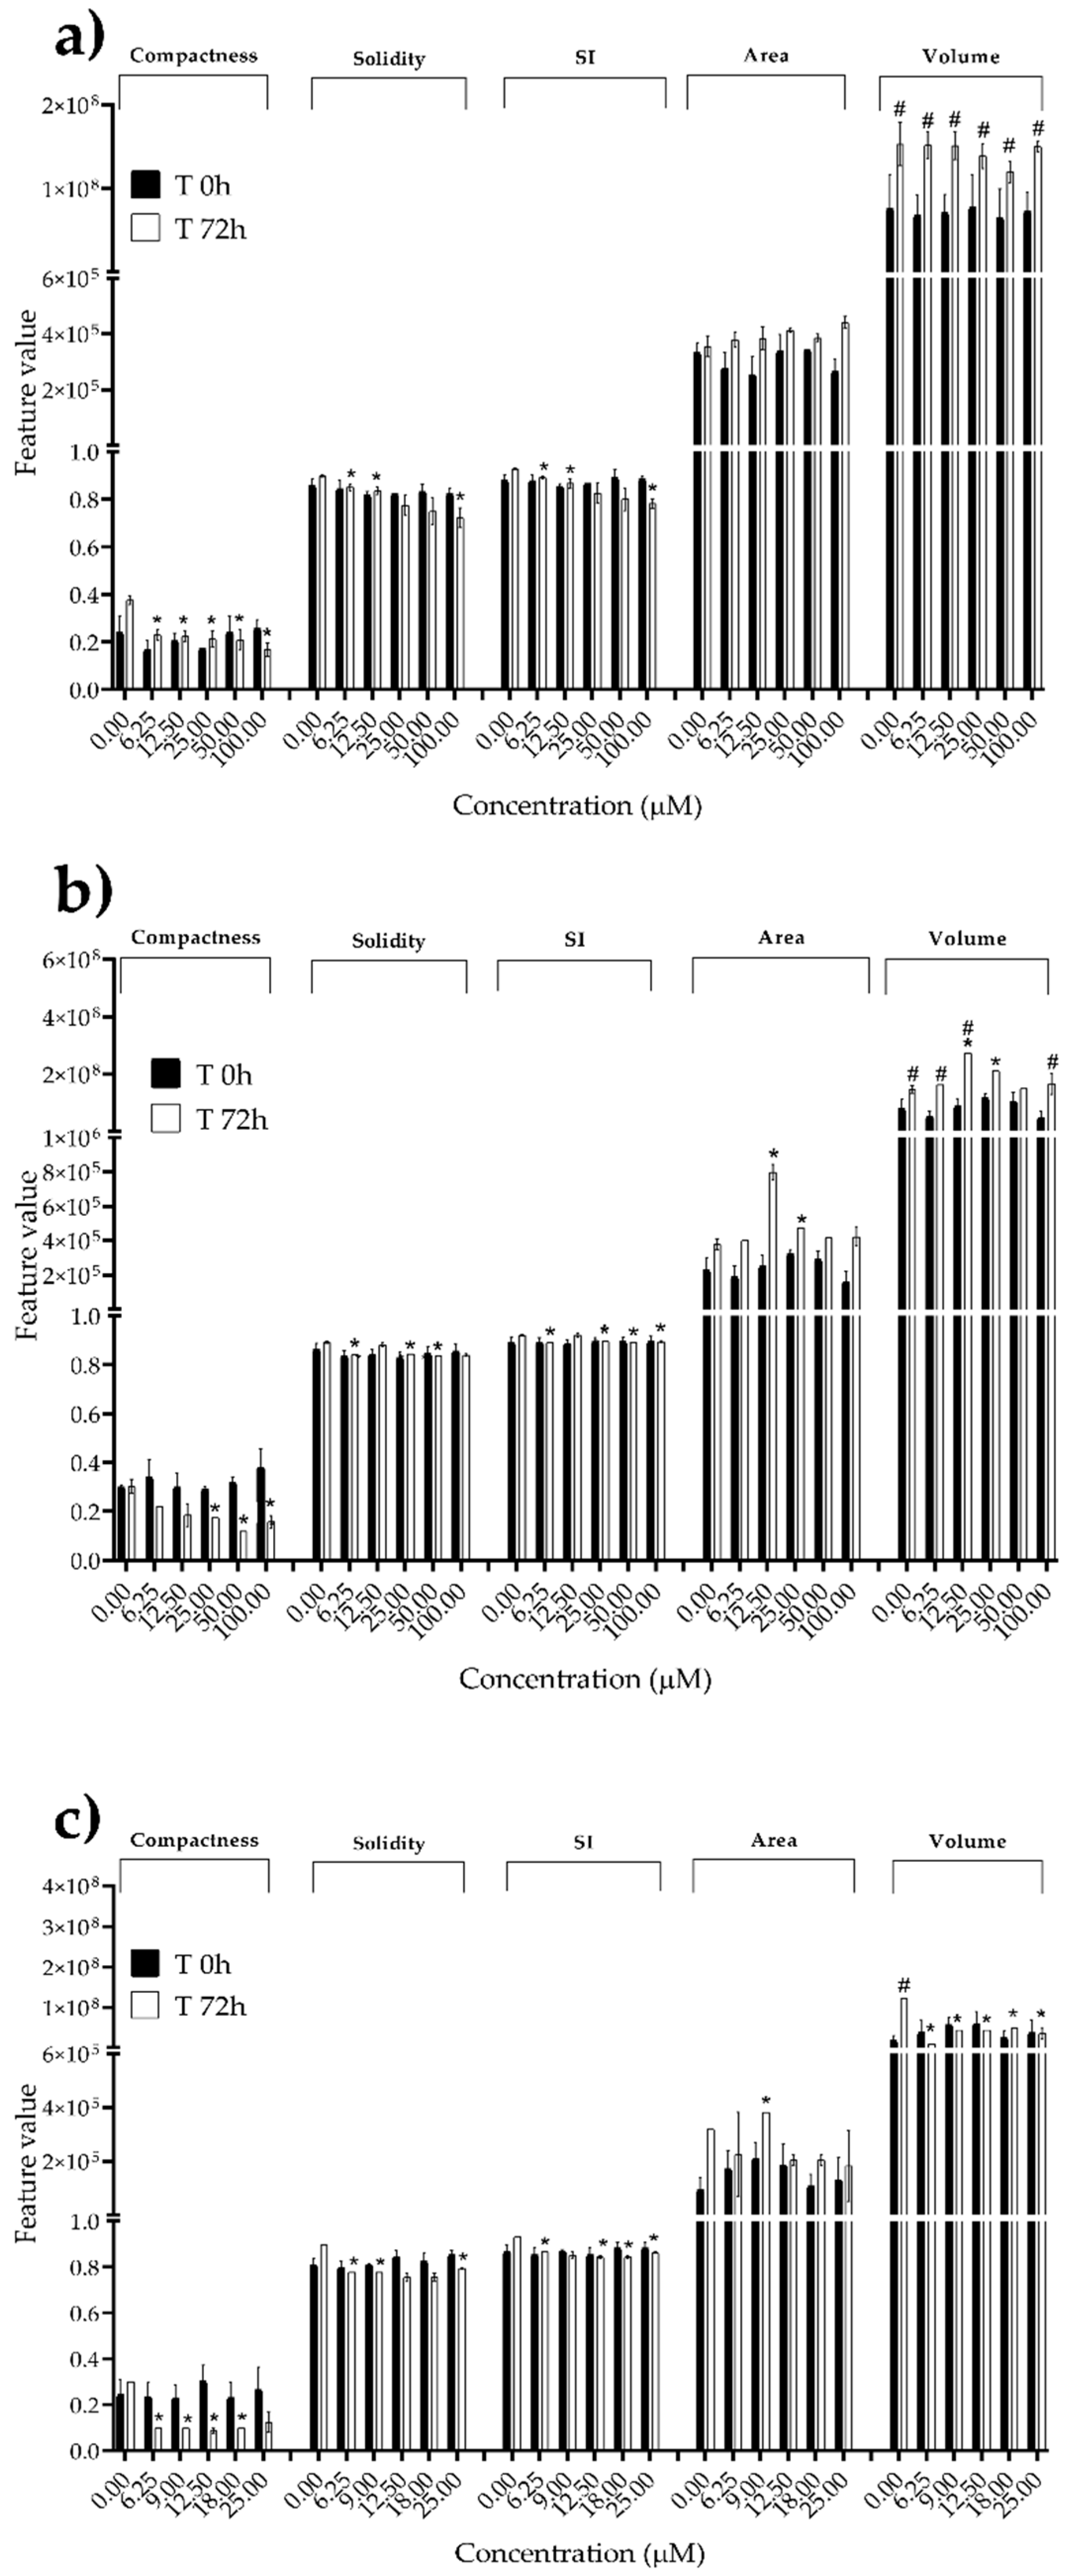
Figure 10.
Morphological parameters of SH-SY5Y spheroids after 0 and 72 h of exposure to (a) STE, (b) OTA and (c) PAT. Compactness, solidity, SI, area and volume were determined after 0 and 72 h of exposure using AnaSP software. Data are expressed as mean ± SEM of three independent experiments (n = 3). (*) p ≤ 0.05 indicates a significant difference compared to the control. (#) p ≤ 0.05 indicates a significant difference compared to the respective T 0h.
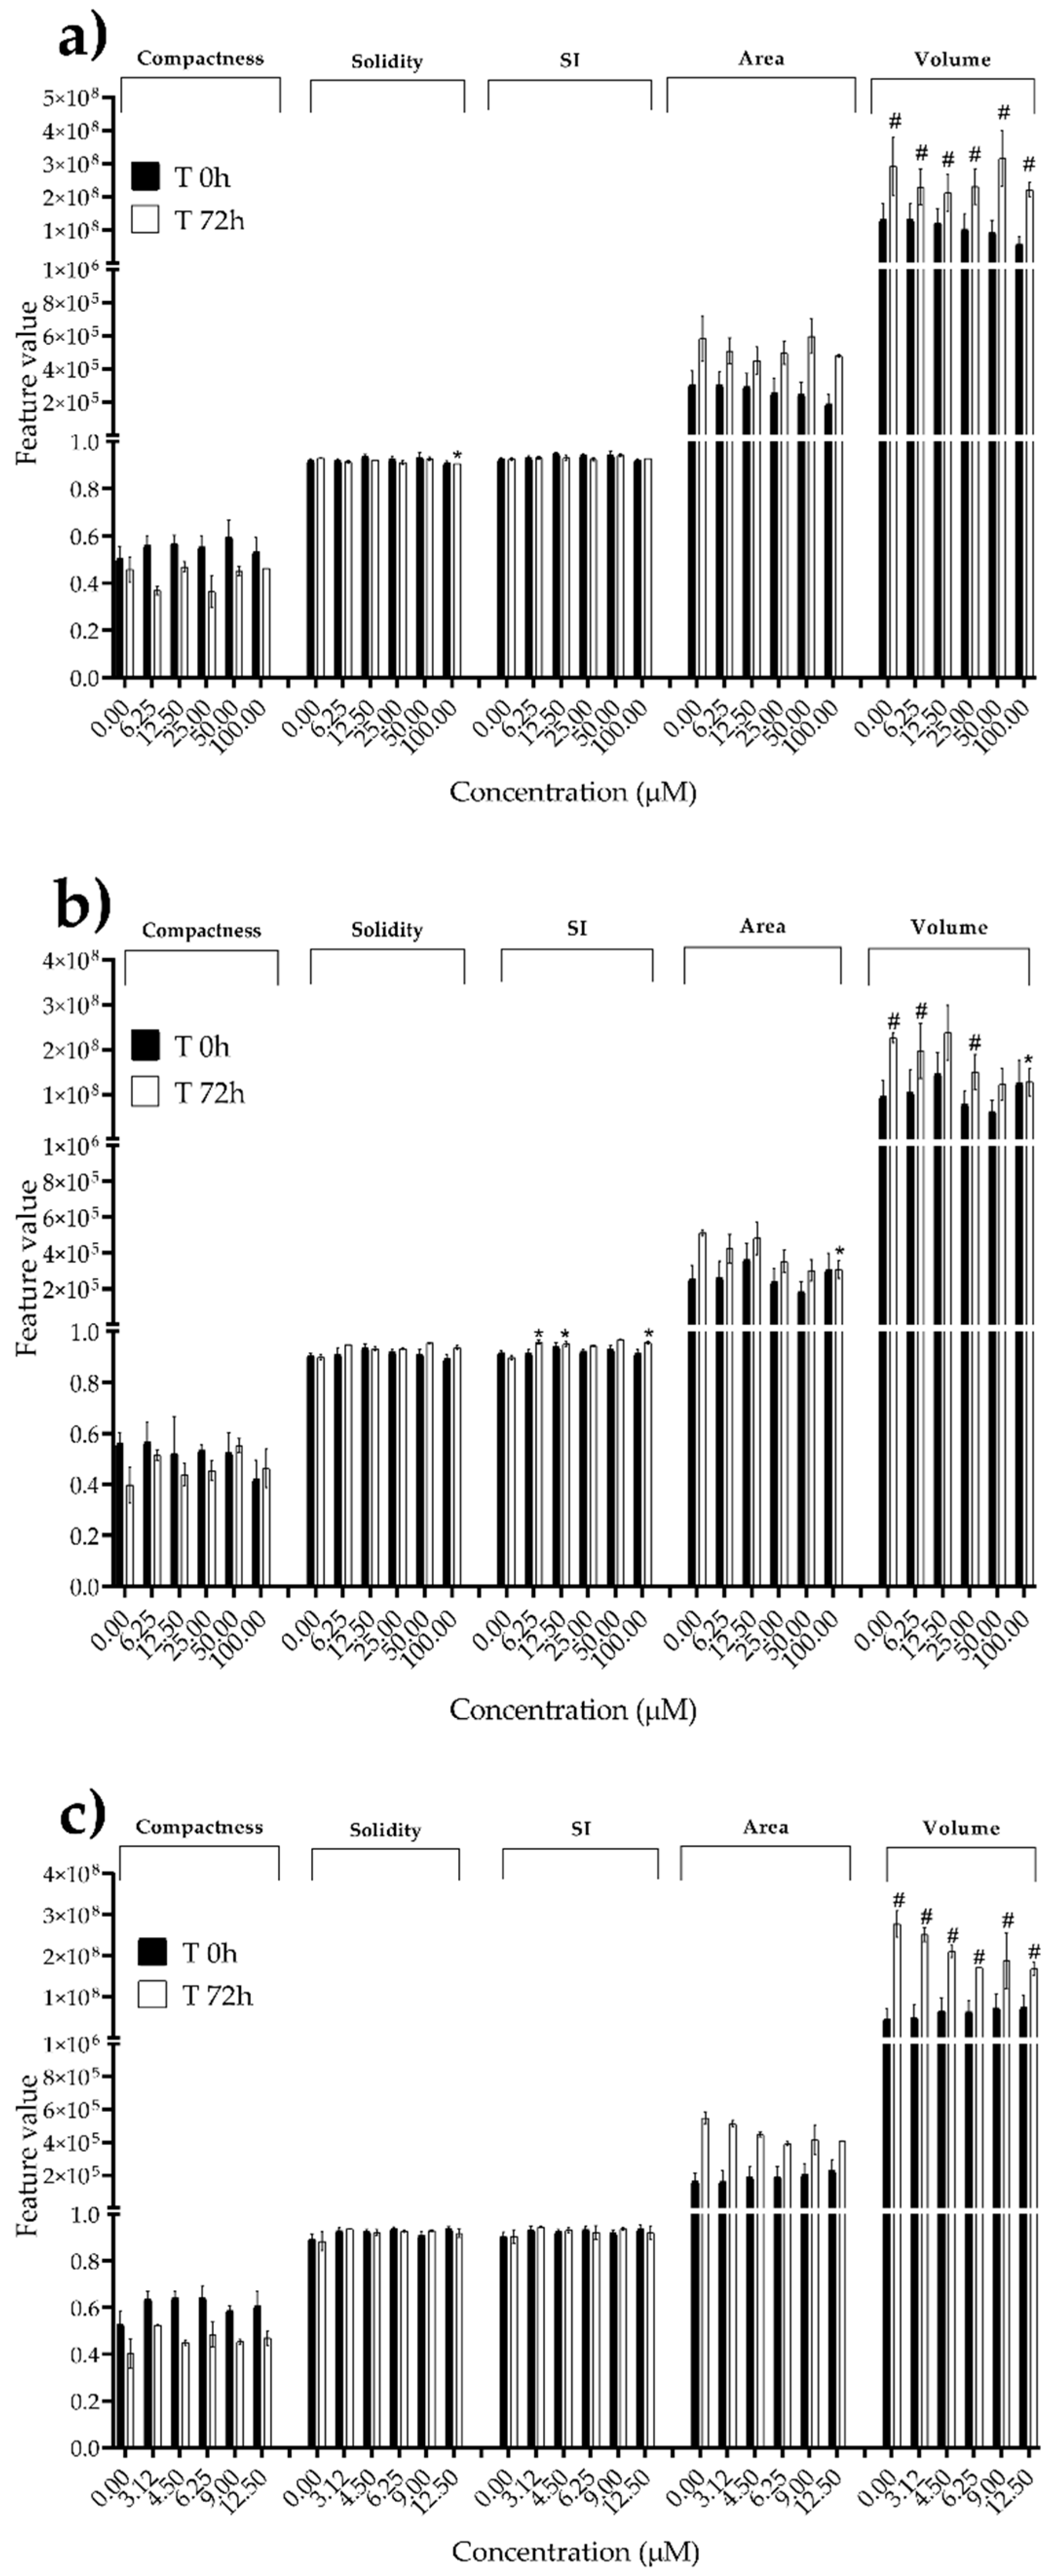

Table 1.
The half maximum inhibitory concentration (IC50) values of STE, OTA and PAT in BM-MSCs, HUVECs, MDA-MB-231 and SH-SY5Y cells cultured in monolayer. Data are expressed as mean ± SEM of three independent experiment (n = 3).
Table 1.
The half maximum inhibitory concentration (IC50) values of STE, OTA and PAT in BM-MSCs, HUVECs, MDA-MB-231 and SH-SY5Y cells cultured in monolayer. Data are expressed as mean ± SEM of three independent experiment (n = 3).
| IC50 value (µM) ± SEM | ||||
|---|---|---|---|---|
| Cell line | Mycotoxin | Time of exposure | ||
| 24 h | 48 h | 72 h | ||
| BM-MSCs | STE | > 50* | > 50* | > 50* |
| OTA | > 50* | 14.31 ± 2.36 | 10.43 ± 1.35 | |
| PAT | 29.09 ± 7.28 | 13.38 ± 3.62 | 5.43 ± 1.86 | |
| HUVECs | STE | > 50* | > 50* | > 50* |
| OTA | 13.87 ± 6.40 | 1.09 ± 0.24 | 0.80 ± 0.06 | |
| PAT | 19.99 ± 7.44 | 1.49 ± 0.25 | 0.45 ± 0.18 | |
| MDA-MB-231 | STE | > 50* | > 50* | 24.40 ± 7.28 |
| OTA | 31.19 ± 3.41 | 9.38 ± 2.27 | 5.13 ± 1.27 | |
| PAT | 2.31 ± 0.56 | 0.61 ± 0.17 | 0.42 ± 0.13 | |
| SH-SY5Y | STE | 28.22 ± 11 | 5.41 ± 1.26 | 2.91 ± 1.04 |
| OTA | 16.87 ± 5.91 | 5.80 ± 2.38 | 2.71 ± 0.87 | |
| PAT | 0.45 ± 0.16 | 0.52 ± 0.22 | 0.28 ± 0.15 | |
* Highest concentration tested.
Table 2.
The half maximum inhibitory concentration (IC50) values of STE, OTA and PAT in BM-MSCs, HUVECs, MDA-MB-231 and SH-SY5Y spheroids. Data are expressed as mean ± SEM of three independent experiment (n = 3).
Table 2.
The half maximum inhibitory concentration (IC50) values of STE, OTA and PAT in BM-MSCs, HUVECs, MDA-MB-231 and SH-SY5Y spheroids. Data are expressed as mean ± SEM of three independent experiment (n = 3).
| IC50 value (µM) ± SEM | ||||
|---|---|---|---|---|
| Cell line | Mycotoxin | Time of exposure | ||
| 24 h | 48 h | 72 h | ||
| BM-MSCs | STE | > 100* | > 100* | > 100* |
| OTA | > 100* | 15.80 ± 2.02 | 17.11 ± 2.38 | |
| PAT | 9.52 ± 1.28 | 8.40 ± 1.01 | 9.98 ± 1.88 | |
| HUVECs | STE | > 100* | > 100* | > 100* |
| OTA | 2.59 ± 1.38 | 5.14 ± 2.06 | 2.20 ± 0.71 | |
| PAT | 2.32 ± 0.60 | 5.76 ± 0.66 | 3.52 ± 0.36 | |
| MDA-MB-231 | STE | > 100* | > 100* | > 100* |
| OTA | > 100* | > 100* | 58.92 ± 19.42 | |
| PAT | > 25* | 7.30 ± 0.40 | 2.73 ± 0.21 | |
| SH-SY5Y | STE | > 100* | 48.42 ± 7.77 | 14.81 ± 3.53 |
| OTA | > 100* | 63.24 ± 21.60 | 5.66 ± 0.36 | |
| PAT | 4.93 ± 0.01 | 3.44 ± 0.56 | 2.77 ± 0.46 | |
* Highest concentration tested.
Disclaimer/Publisher’s Note: The statements, opinions and data contained in all publications are solely those of the individual author(s) and contributor(s) and not of MDPI and/or the editor(s). MDPI and/or the editor(s) disclaim responsibility for any injury to people or property resulting from any ideas, methods, instructions or products referred to in the content. |
© 2023 by the authors. Licensee MDPI, Basel, Switzerland. This article is an open access article distributed under the terms and conditions of the Creative Commons Attribution (CC BY) license (http://creativecommons.org/licenses/by/4.0/).
Copyright: This open access article is published under a Creative Commons CC BY 4.0 license, which permit the free download, distribution, and reuse, provided that the author and preprint are cited in any reuse.


