Submitted:
28 December 2023
Posted:
29 December 2023
You are already at the latest version
Abstract
Keywords:
1. Introduction
2. Materials and methods
2.1. Materials synthesis
2.2. Structural characterization
2.3. Plasma and UV-ozone treatments
3. Results and discussion
3.1. Removal of surfactant by UV-ozone treatment
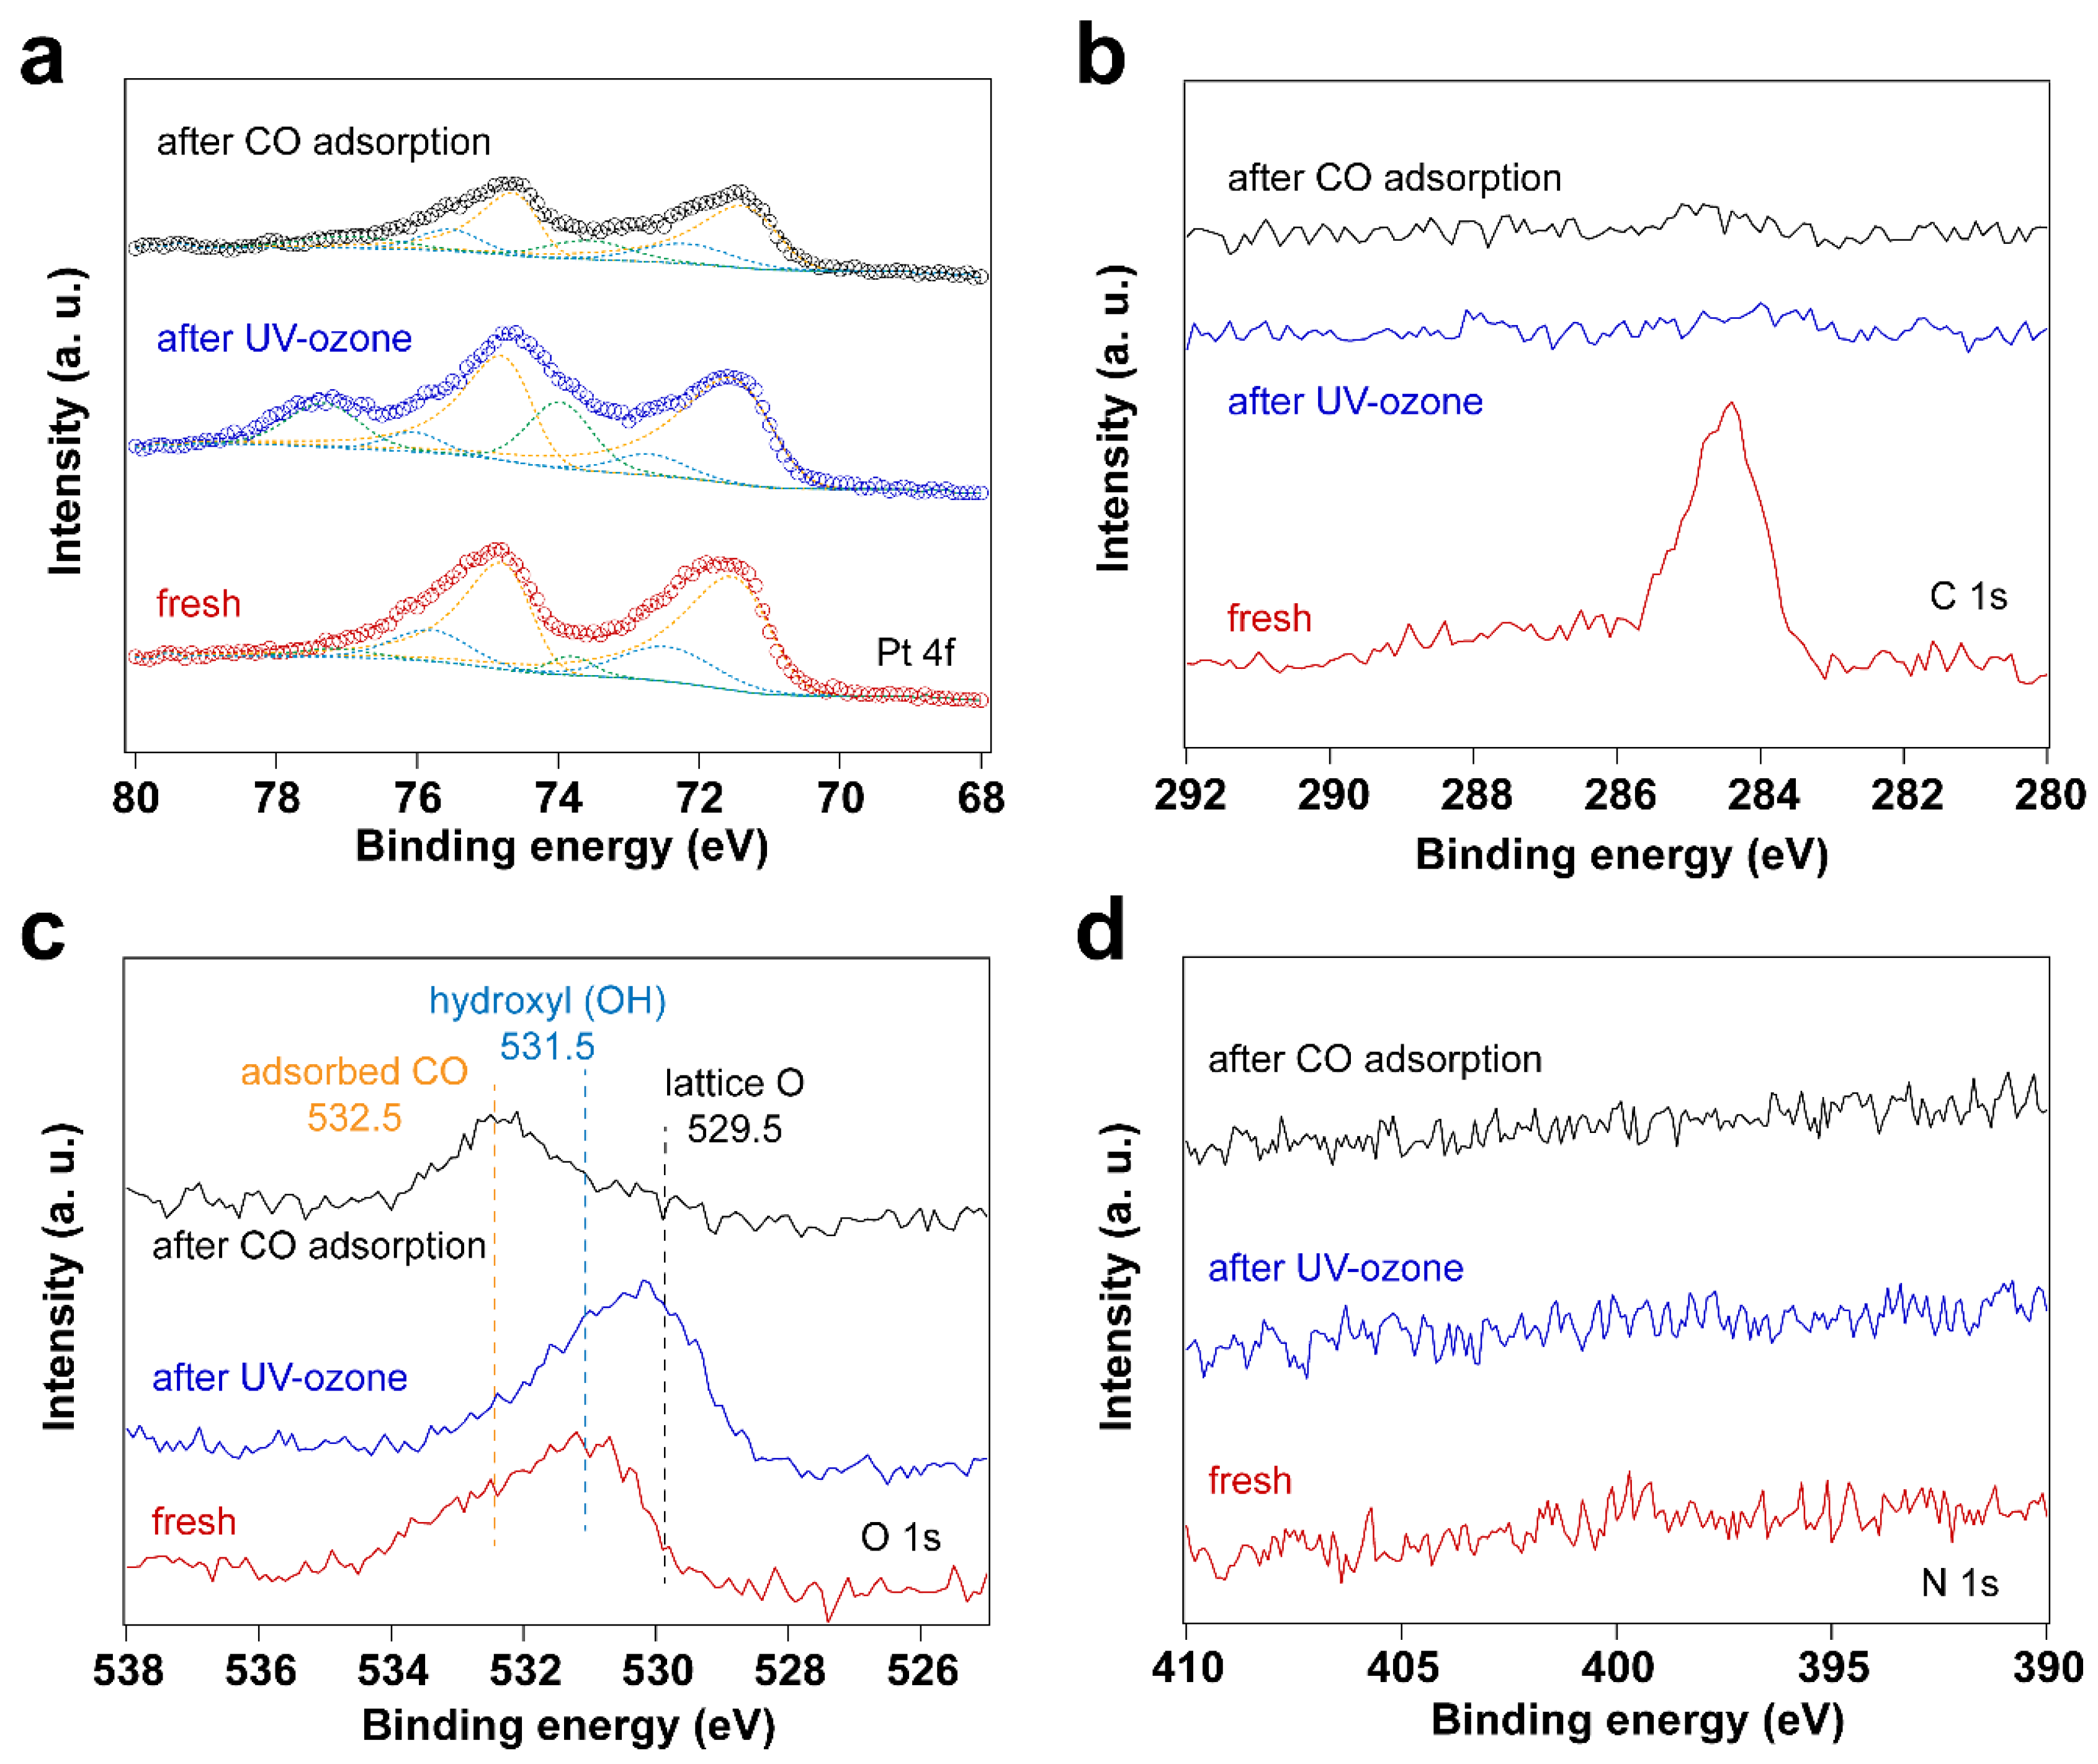
| Sample | Fresh | After UV-ozone treatment | After CO adsorption | |
|---|---|---|---|---|
|
Peak position (eV) |
Pt0 4f7/2 | 71.17 | 71.16 | 71.04 |
| Pt0 4f5/2 | 74.52 | 74.51 | 74.39 | |
| Pt–O(I) 4f7/2 | 72.45 | 72.70 | 72.18 | |
| Pt–O(I) 4f5/2 | 75.80 | 76.05 | 75.53 | |
| Pt–O(II) 4f7/2 | 73.79 | 73.98 | 73.57 | |
| Pt–O(II) 4f5/2 | 77.14 | 77.33 | 76.92 | |
| Peak area ratio | Pt–O(I)/Pt0 | 0.28 | 0.13 | 0.30 |
| Pt–O(II)/Pt0 | 0.07 | 0.37 | 0.27 | |
3.2. Removal of surfactant by O2 plasma treatment
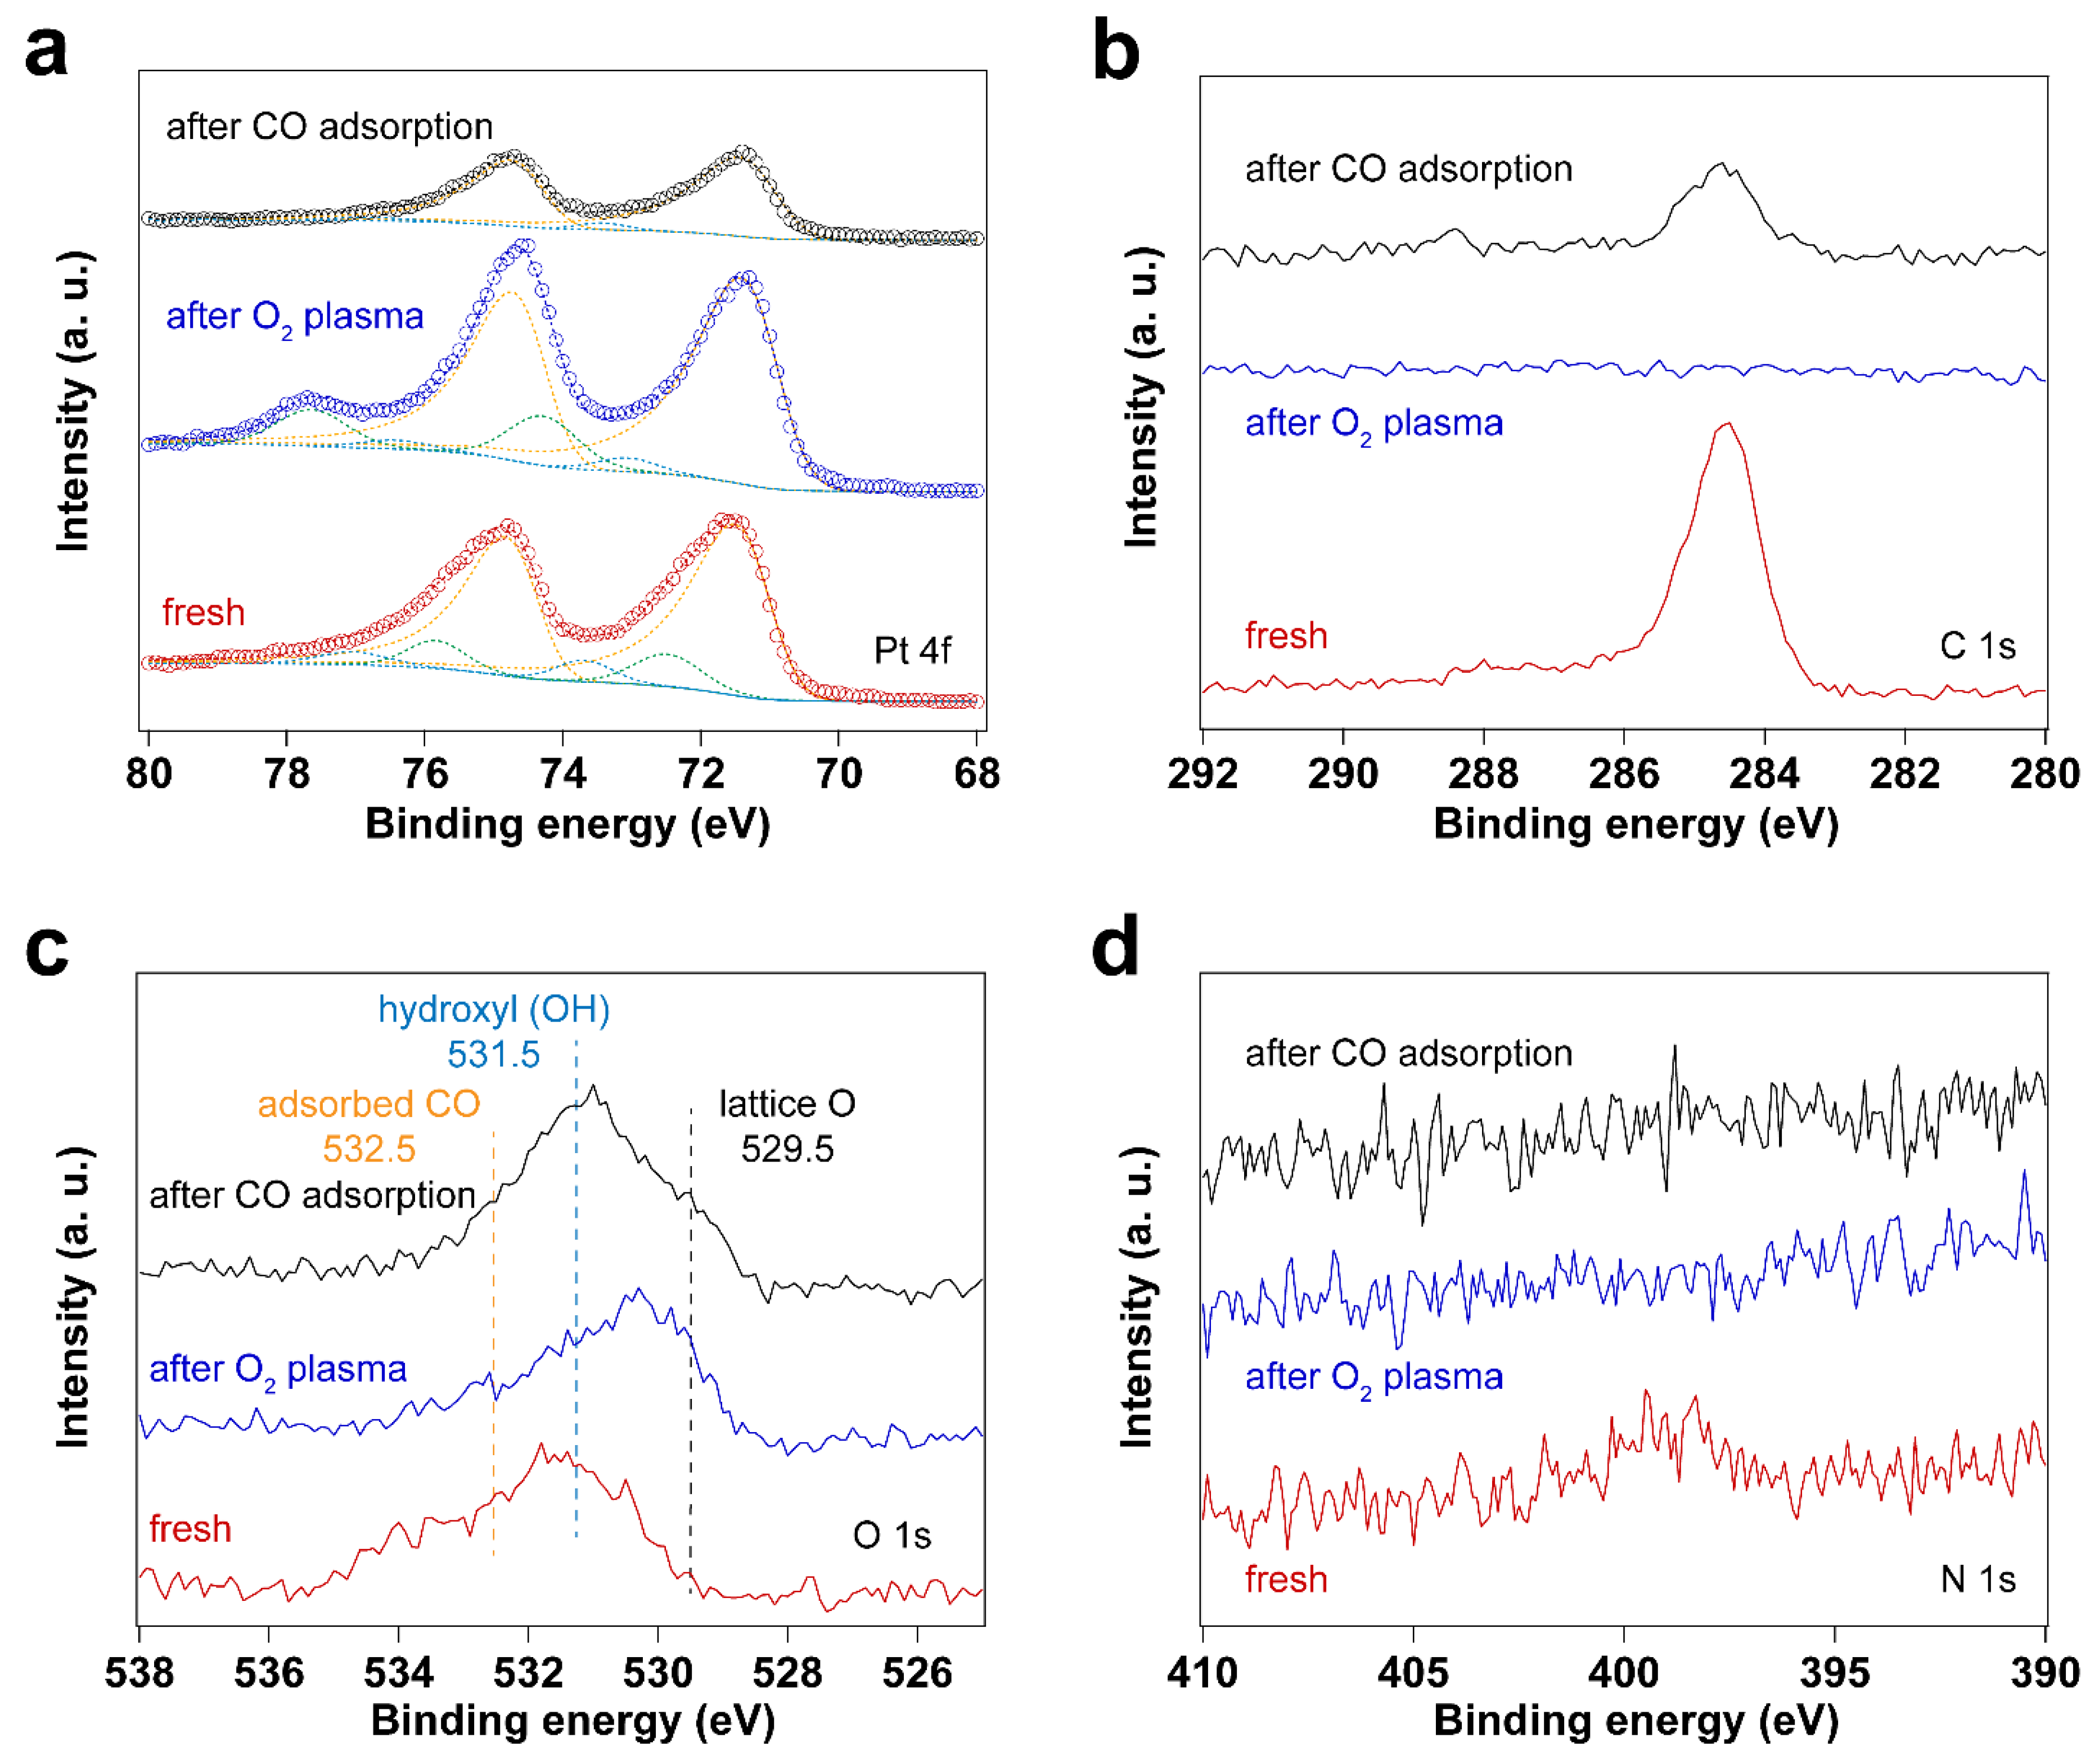
| Sample | Fresh | After O2 plasma treatment | After CO adsorption | |
|---|---|---|---|---|
|
Peak position (eV) |
Pt0 4f7/2 | 71.16 | 71.05 | 71.07 |
| Pt0 4f5/2 | 74.51 | 74.40 | 74.42 | |
| Pt–O(I) 4f7/2 | 73.69 | 73.06 | 73.43 | |
| Pt–O(I) 4f5/2 | 77.04 | 76.41 | 76.77 | |
| Pt–O(II) 4f7/2 | 72.48 | 74.29 | 74.80 | |
| Pt–O(II) 4f5/2 | 75.83 | 77.64 | 78.15 | |
| Peak area ratio | Pt–O(I)/Pt0 | 0.13 | 0.04 | 0.04 |
| Pt–O(II)/Pt0 | 0.07 | 0.17 | <0.001 | |
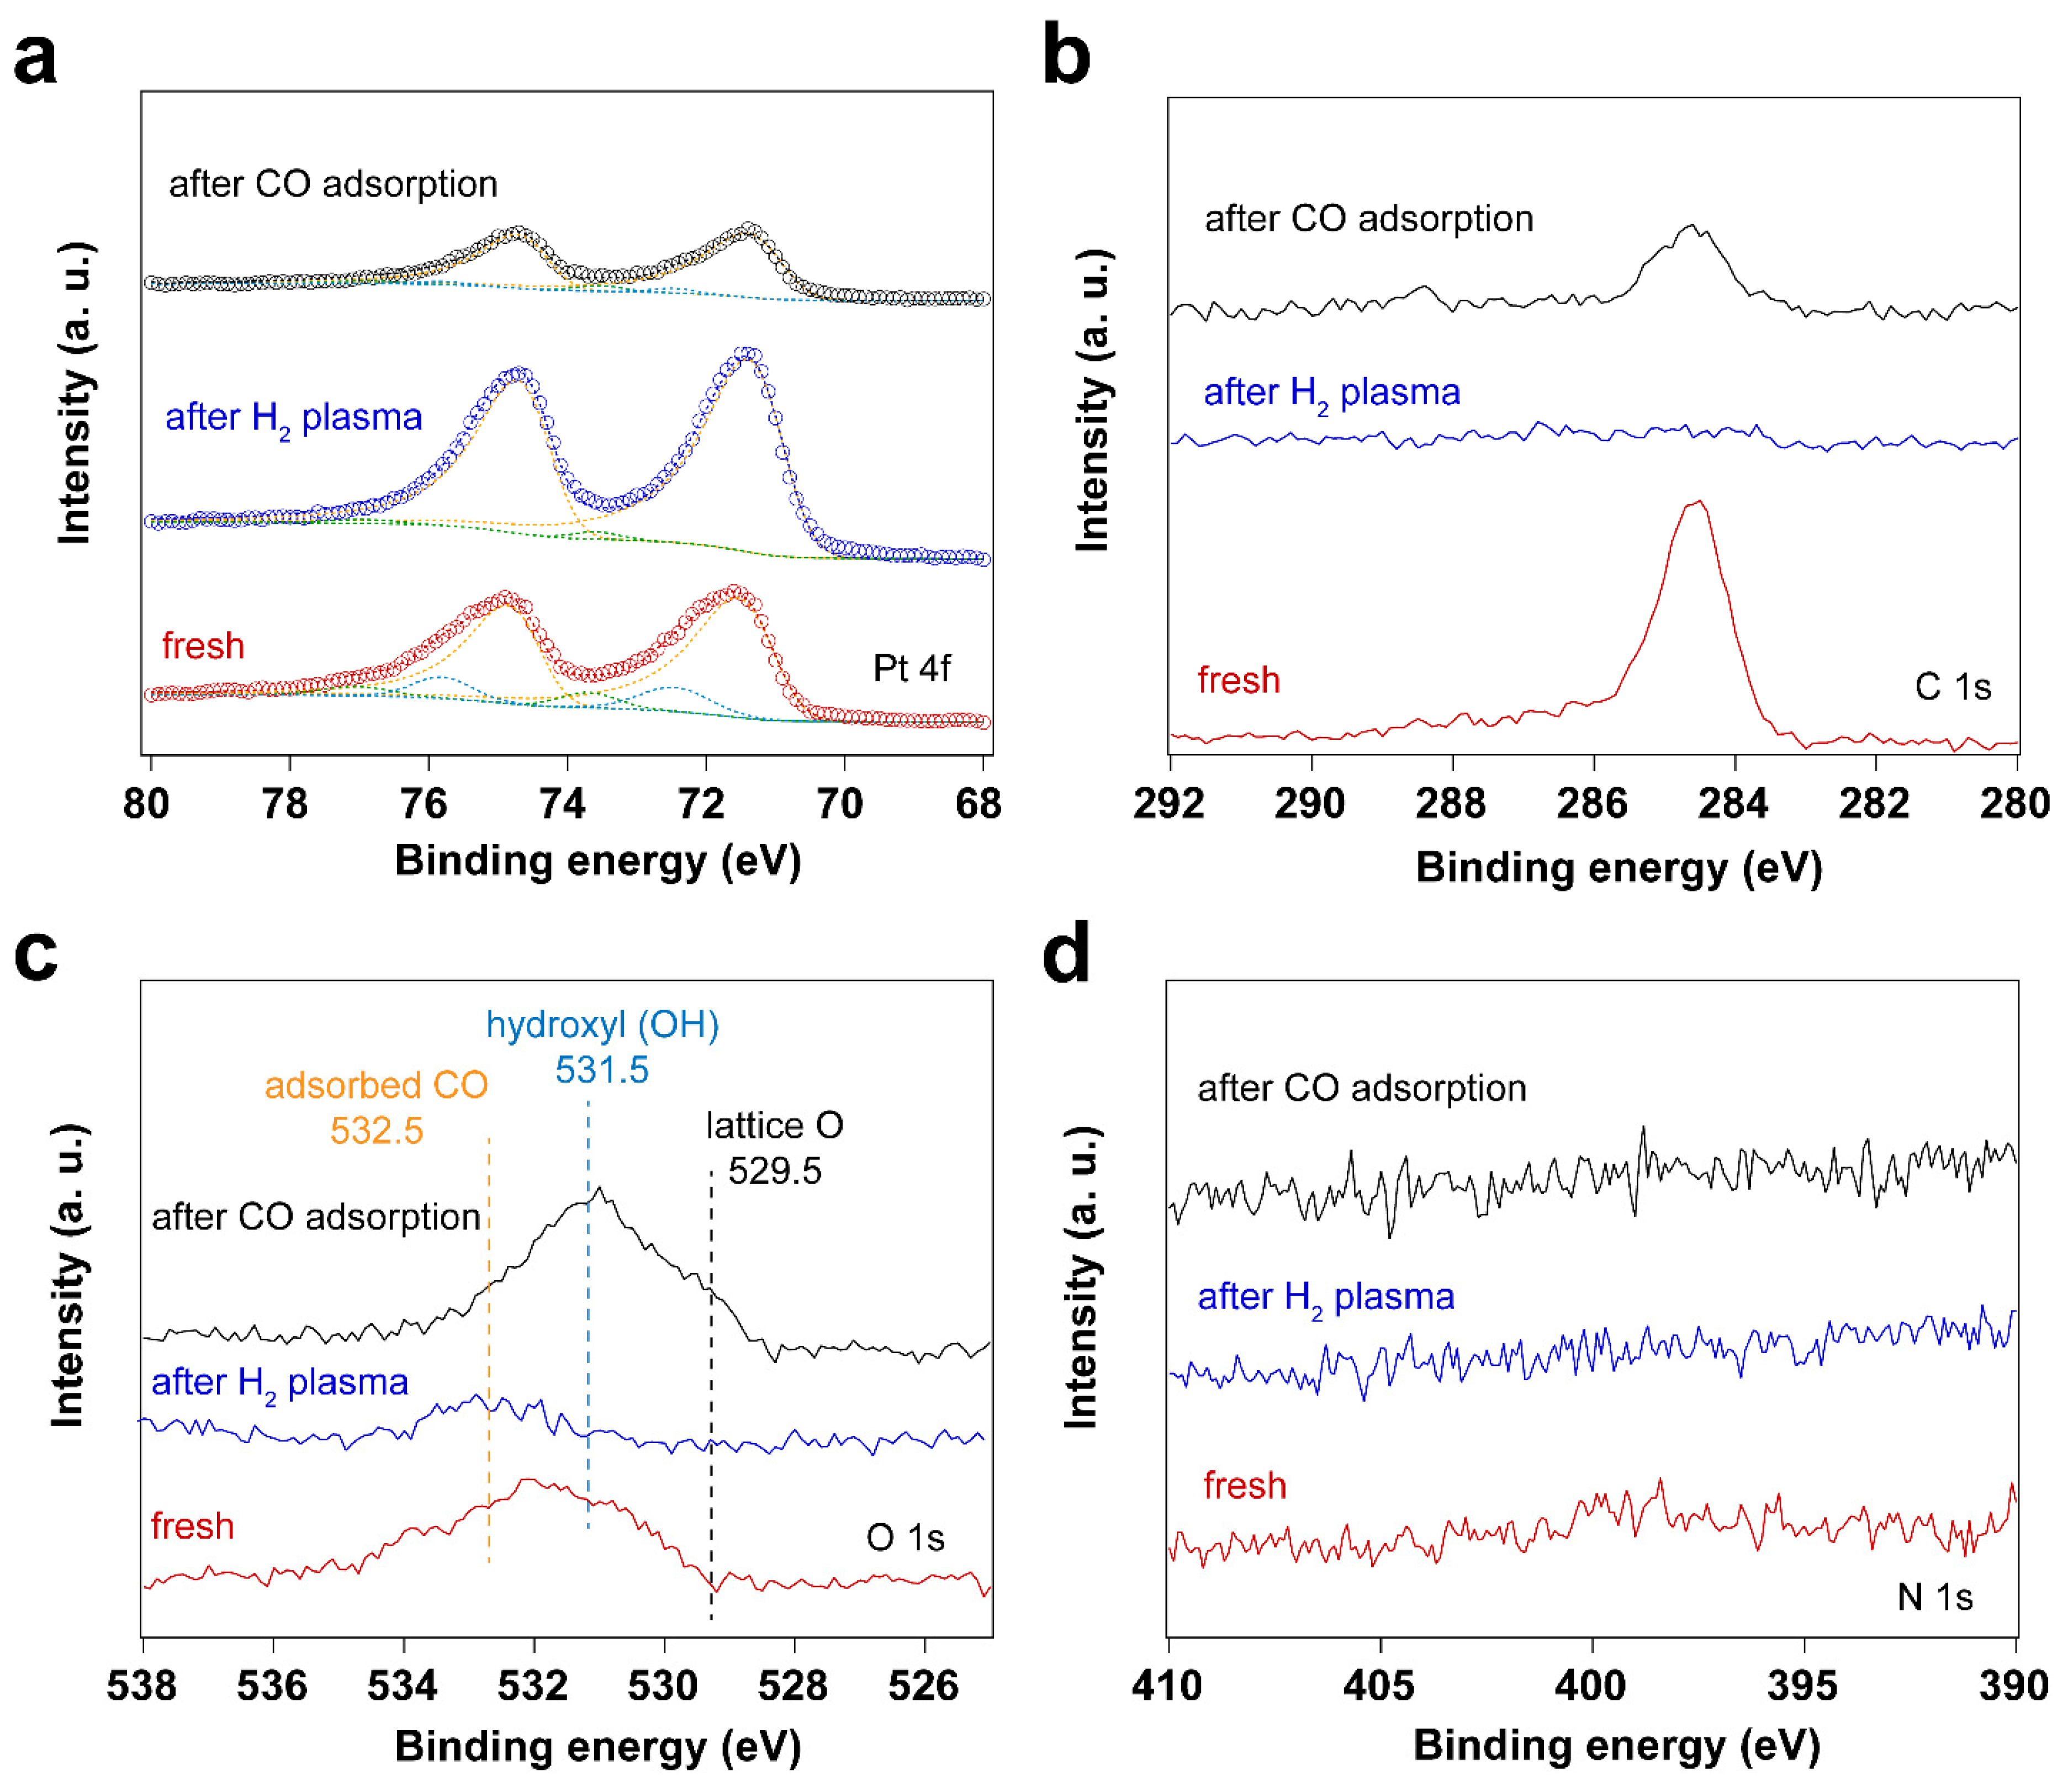
3.3. Removal of surfactant by H2 plasma treatment
| Sample | Fresh | After H2 plasma treatment | After CO adsorption | |
|---|---|---|---|---|
|
Peak position (eV) |
Pt0 4f7/2 | 71.22 | 71.05 | 71.07 |
| Pt0 4f5/2 | 74.57 | 74.40 | 74.42 | |
| Pt–O(I) 4f7/2 | 72.50 | 72.05 | 72.46 | |
| Pt–O(I) 4f5/2 | 75.85 | 75.40 | 75.81 | |
| Pt–O(II) 4f7/2 | 74.60 | 73.58 | 73.54 | |
| Pt–O(II) 4f5/2 | 77.95 | 76.93 | 76.89 | |
| Peak area ratio | Pt–O(I)/Pt0 | 0.15 | 0.03 | 0.03 |
| Pt–O(II)/Pt0 | 0.08 | 0.02 | 0.02 | |
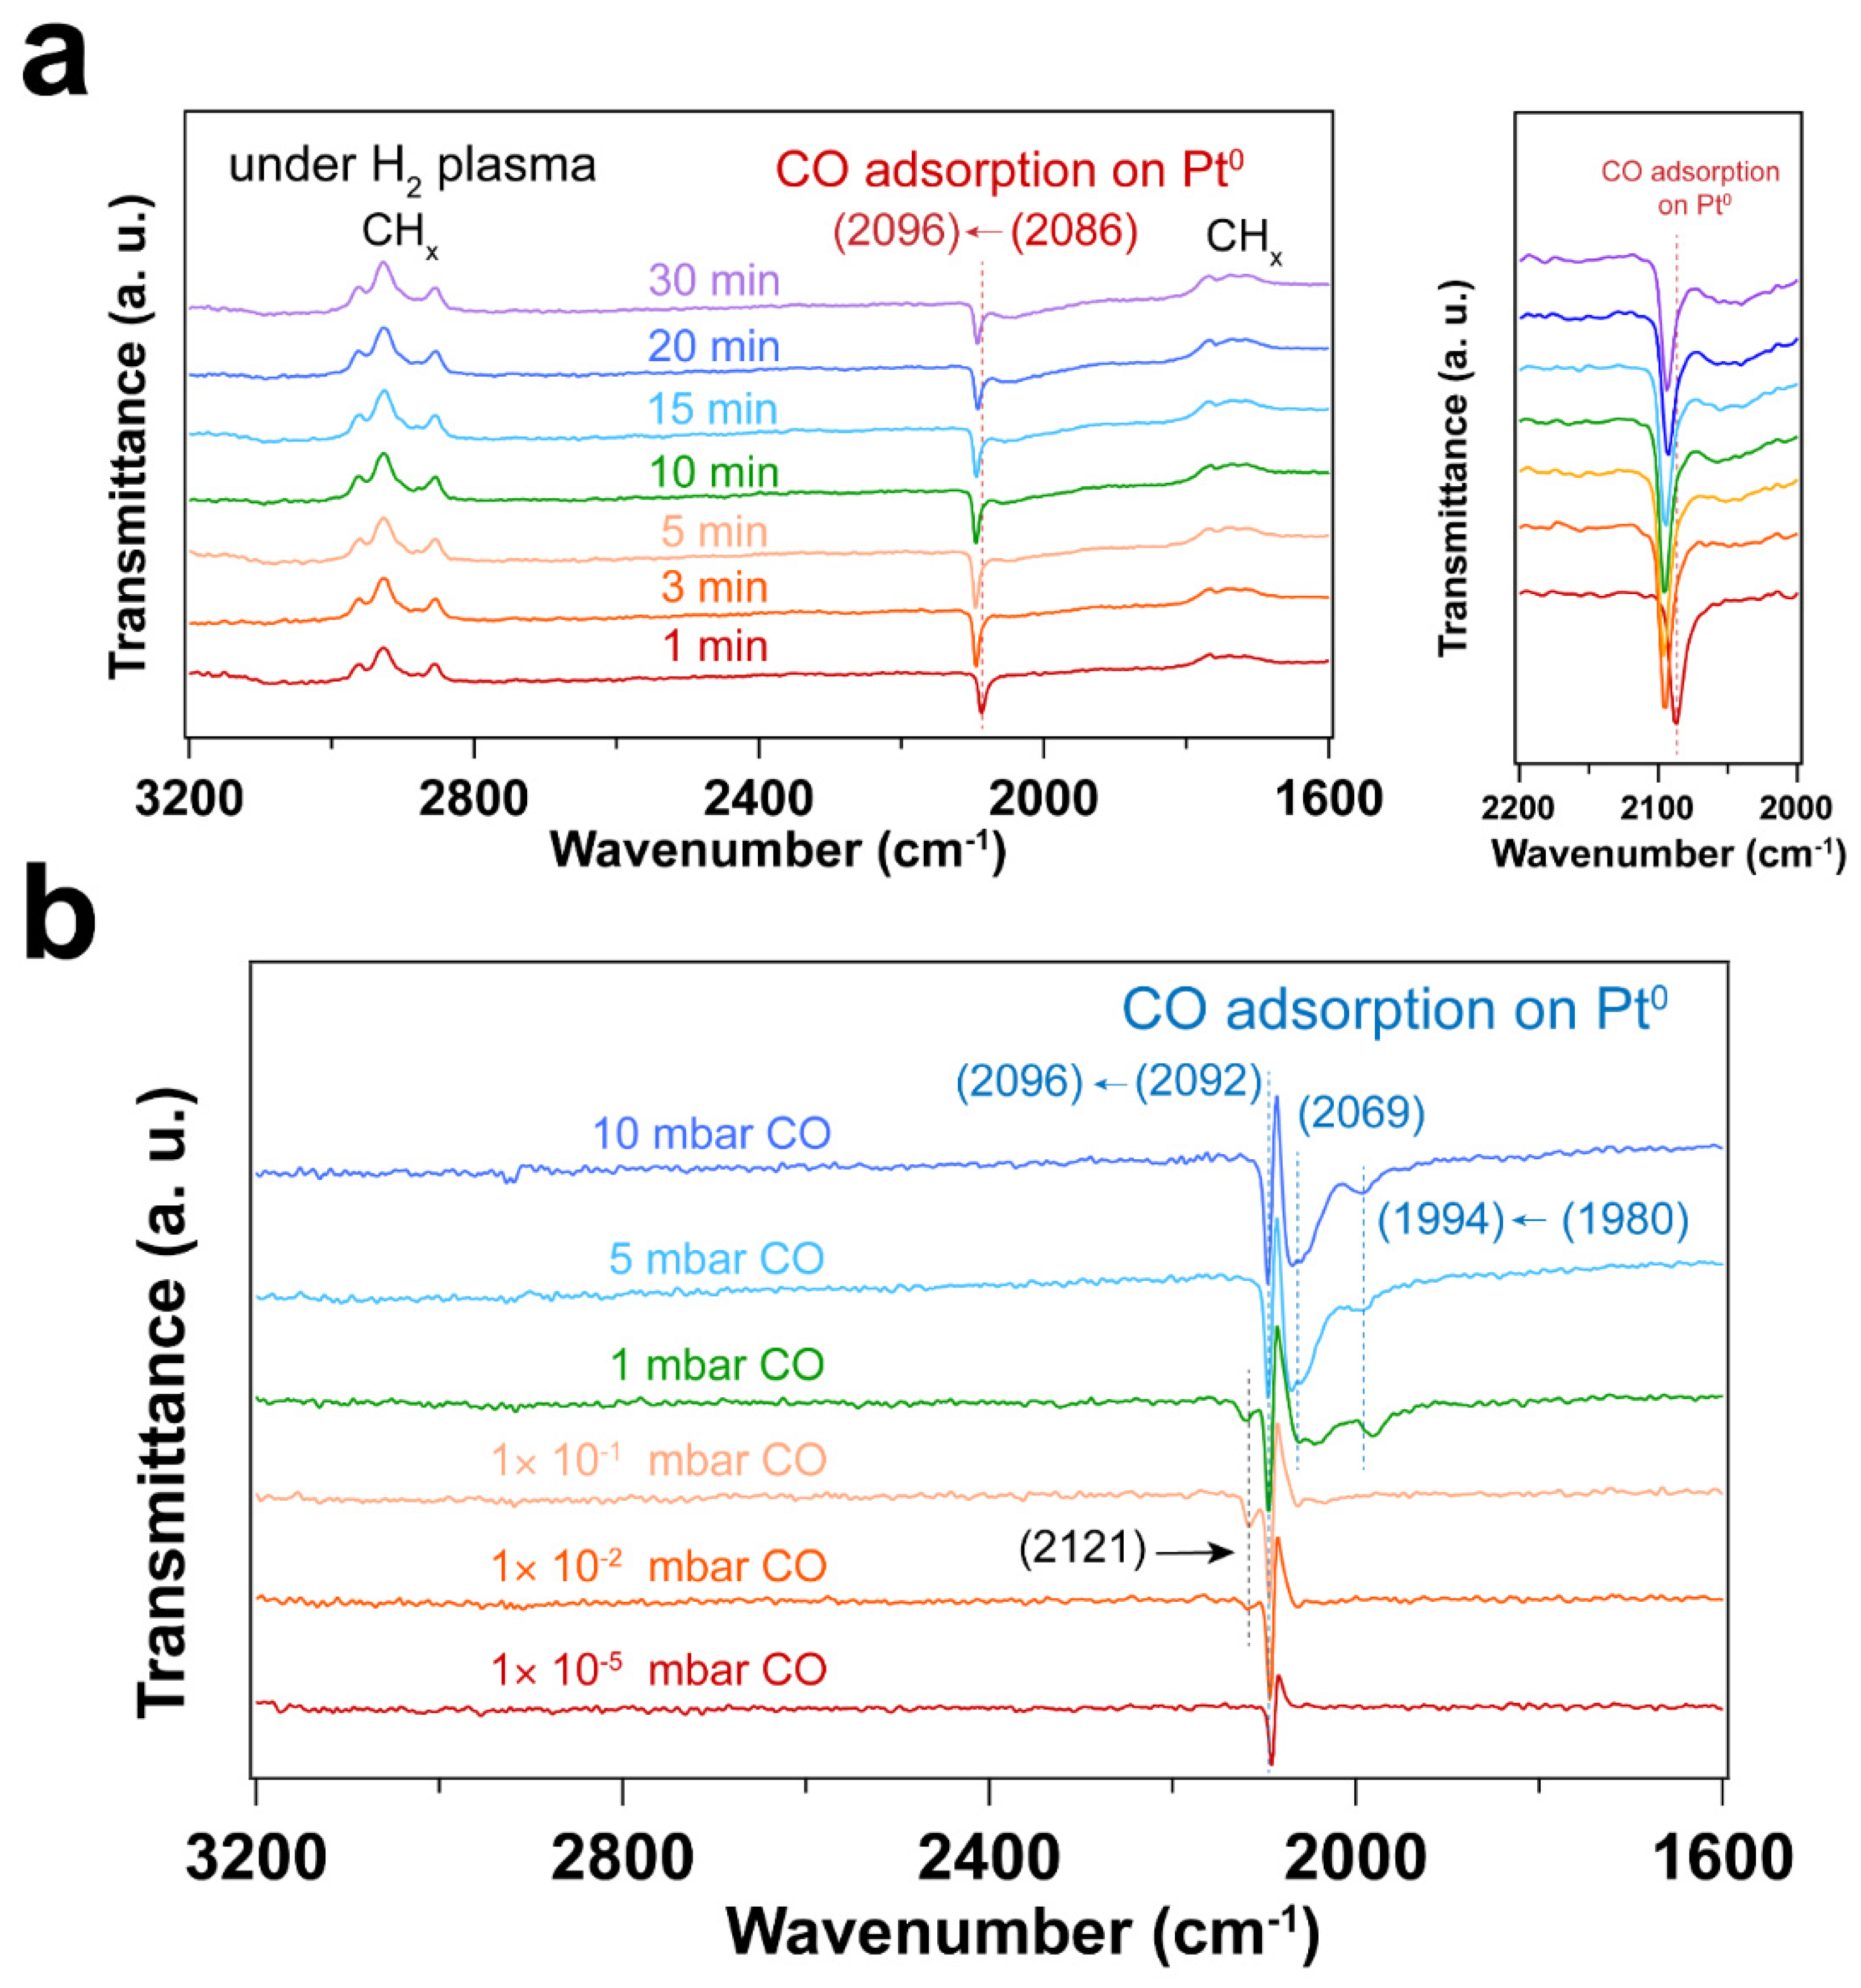
3.4. Using H2 plasma to reduce Pt nanoparticles treated by O2 sources.
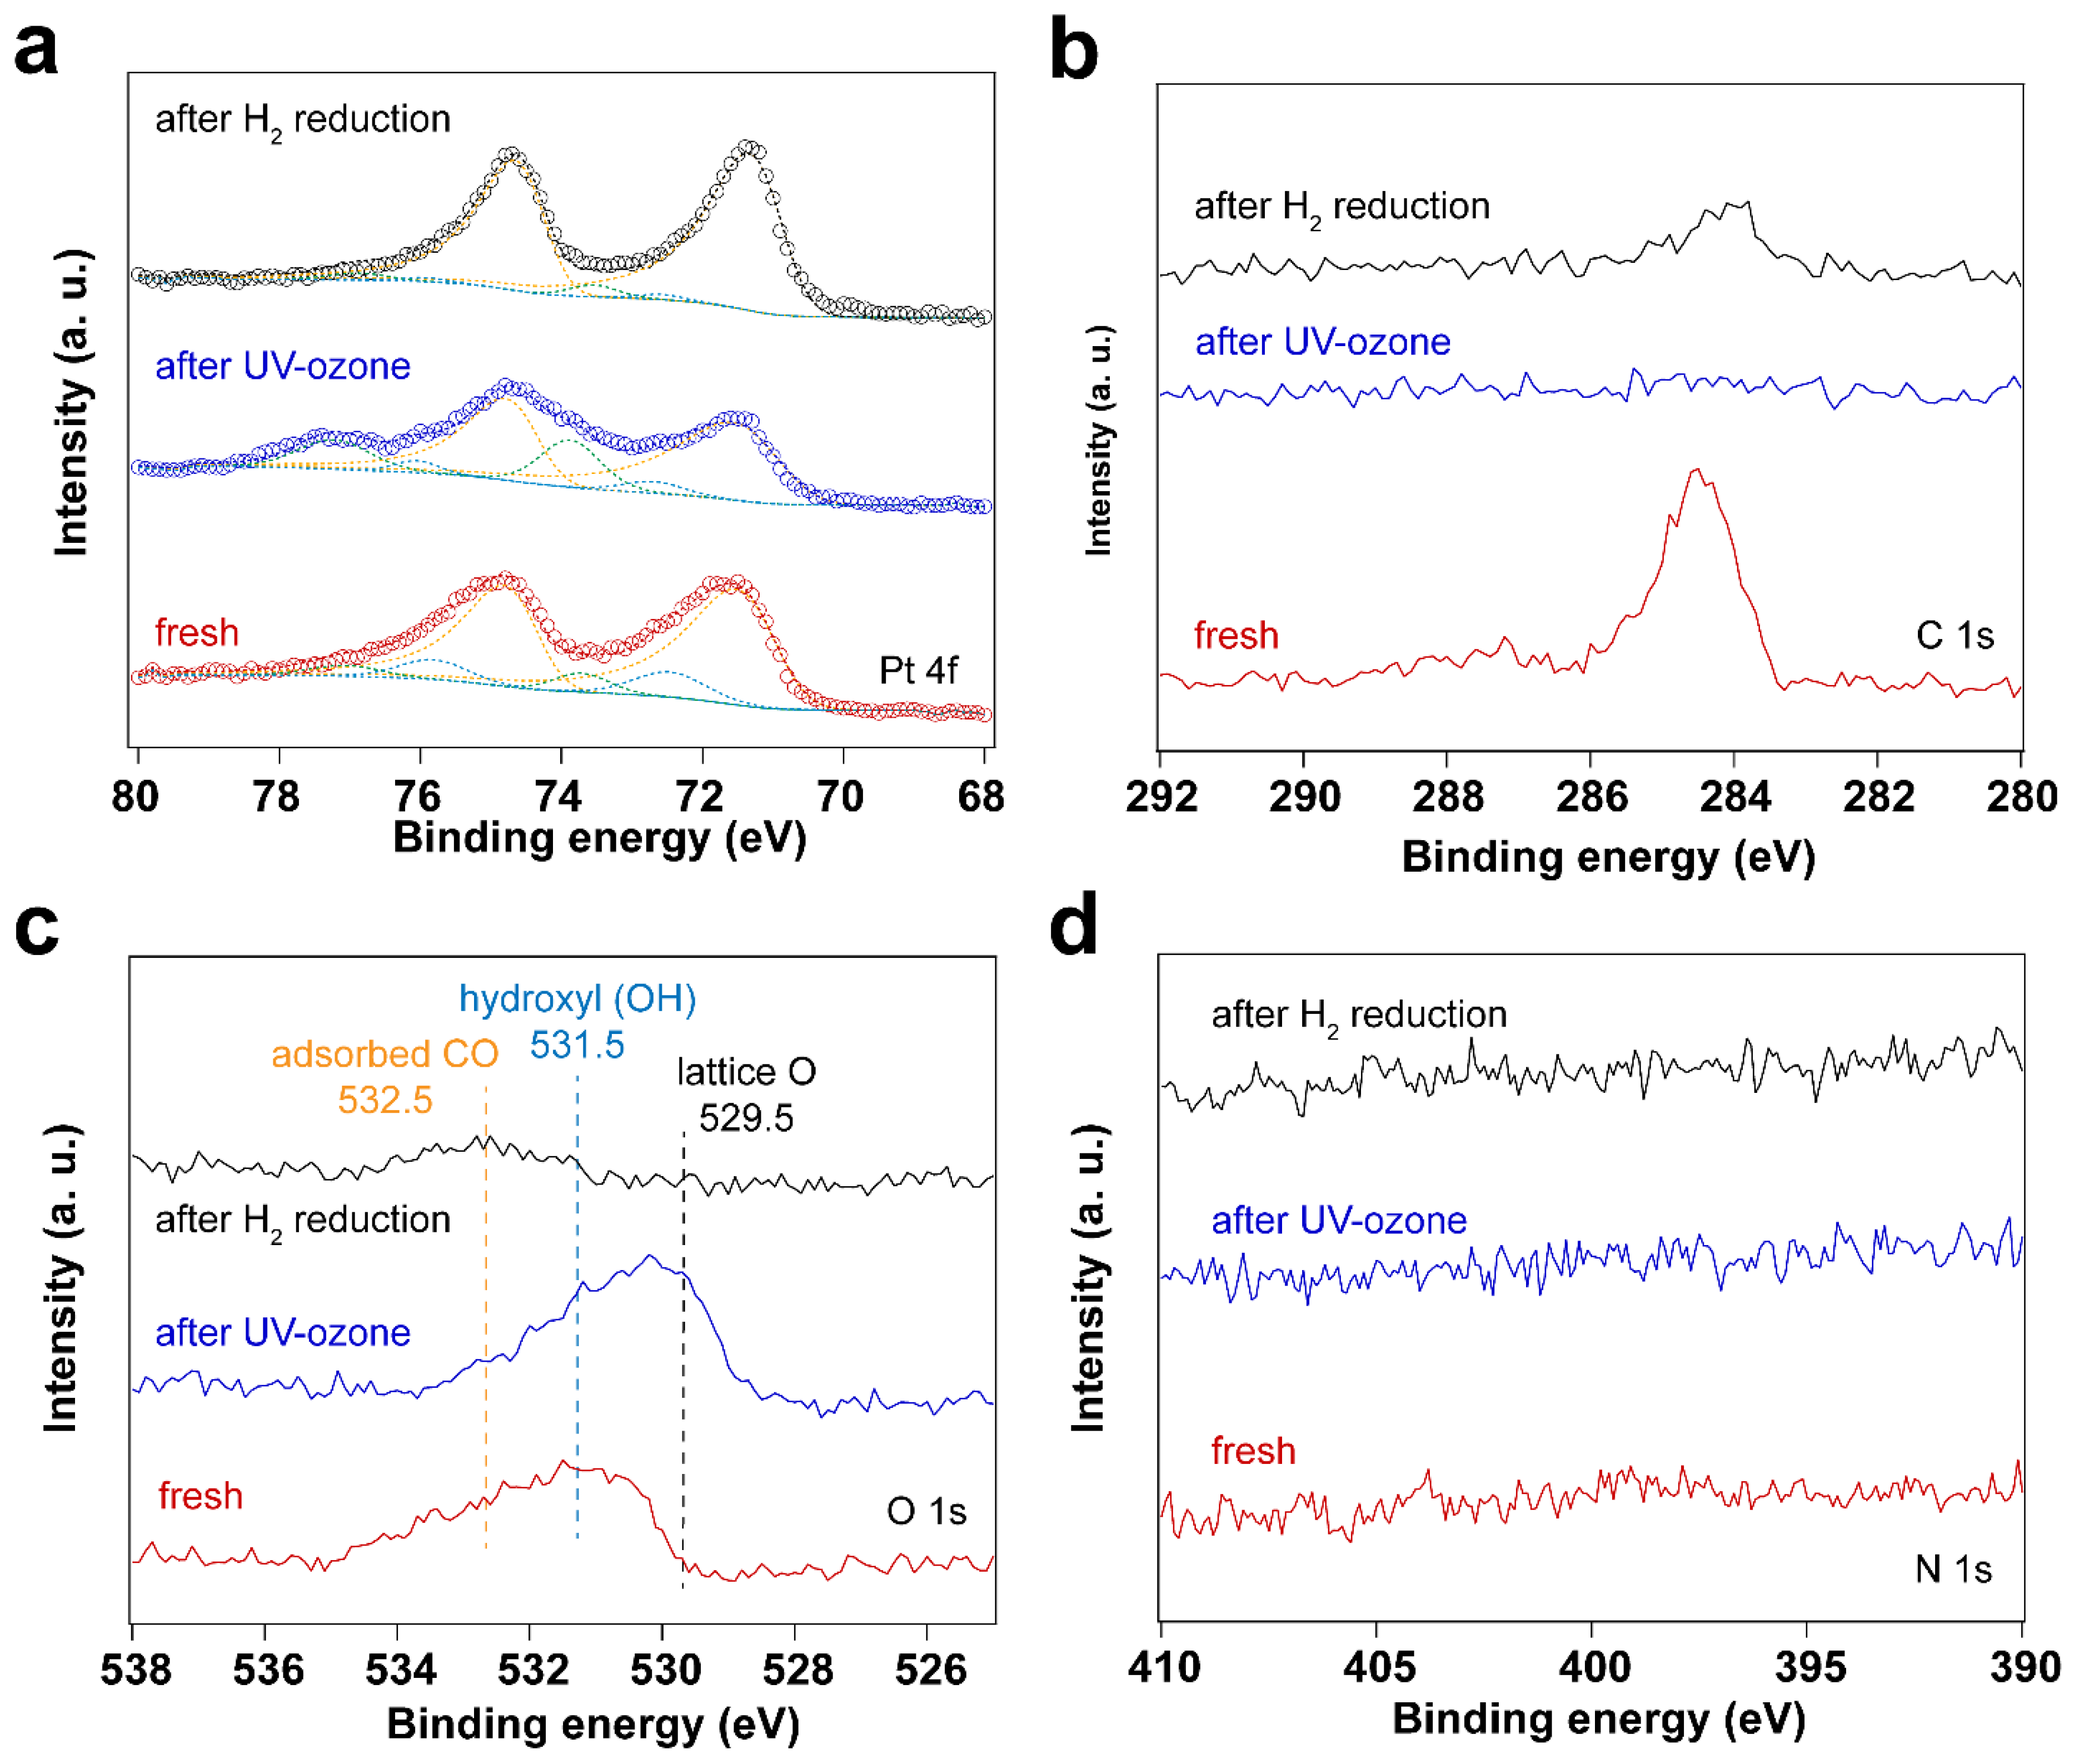
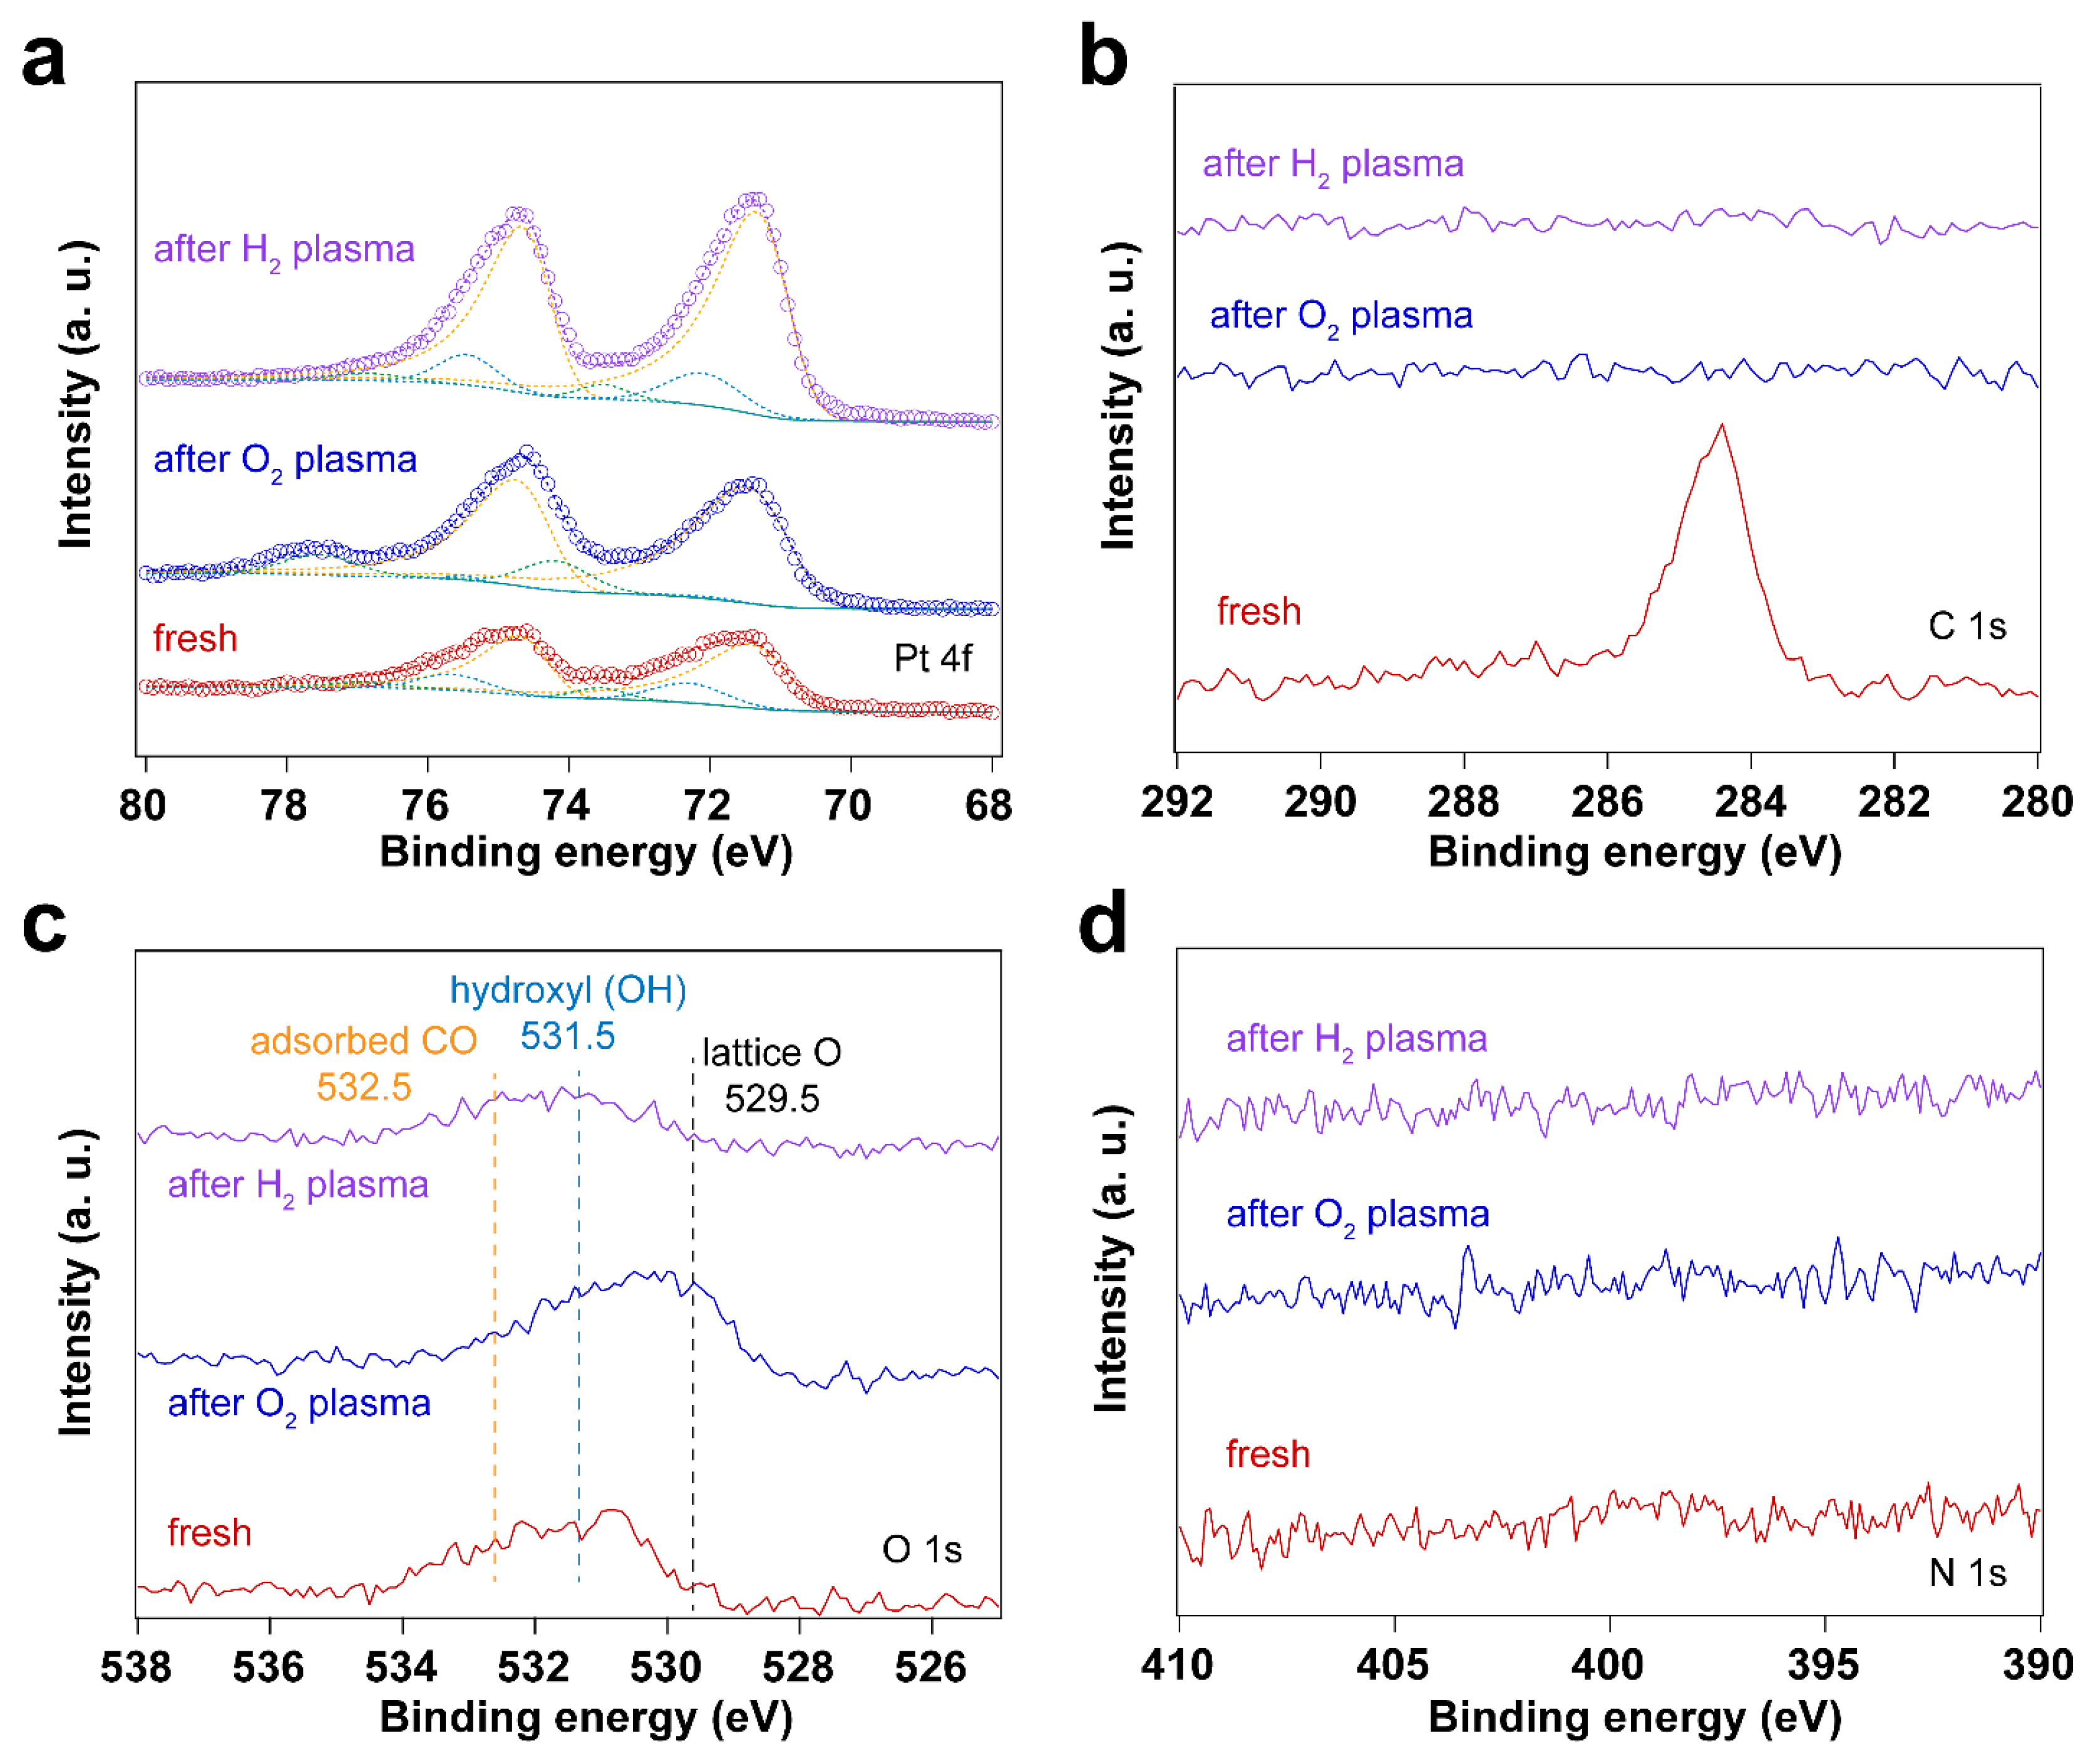
| Sample | Fresh | After UV-ozone treatment | After H2 reduction | |
|---|---|---|---|---|
|
Peak position (eV) |
Pt0 4f7/2 | 71.14 | 71.13 | 71.02 |
| Pt0 4f5/2 | 74.49 | 74.48 | 74.37 | |
| Pt–O(I) 4f7/2 | 72.47 | 72.70 | 72.58 | |
| Pt–O(I) 4f5/2 | 75.82 | 76.05 | 75.93 | |
| Pt–O(II) 4f7/2 | 73.72 | 73.88 | 73.54 | |
| Pt–O(II) 4f5/2 | 77.07 | 77.23 | 76.89 | |
| Peak area ratio | Pt–O(I)/Pt0 | 0.15 | 0.07 | 0.02 |
| Pt–O(II)/Pt0 | 0.09 | 0.30 | 0.04 | |
| Sample | Fresh | After O2 plasma treatment | After H2 plasma treatment | |
|---|---|---|---|---|
|
Peak position (eV) |
Pt0 4f7/2 | 71.07 | 71.08 | 71.03 |
| Pt0 4f5/2 | 74.42 | 74.43 | 74.38 | |
| Pt–O(I) 4f7/2 | 72.31 | 72.15 | 72.10 | |
| Pt–O(I) 4f5/2 | 75.66 | 75.50 | 75.45 | |
| Pt–O(II) 4f7/2 | 73.56 | 74.19 | 73.52 | |
| Pt–O(II) 4f5/2 | 76.91 | 77.54 | 76.87 | |
| Peak area ratio | Pt–O(I)/Pt0 | 0.22 | 0.01 | 0.13 |
| Pt–O(II)/Pt0 | 0.08 | 0.15 | 0.04 | |
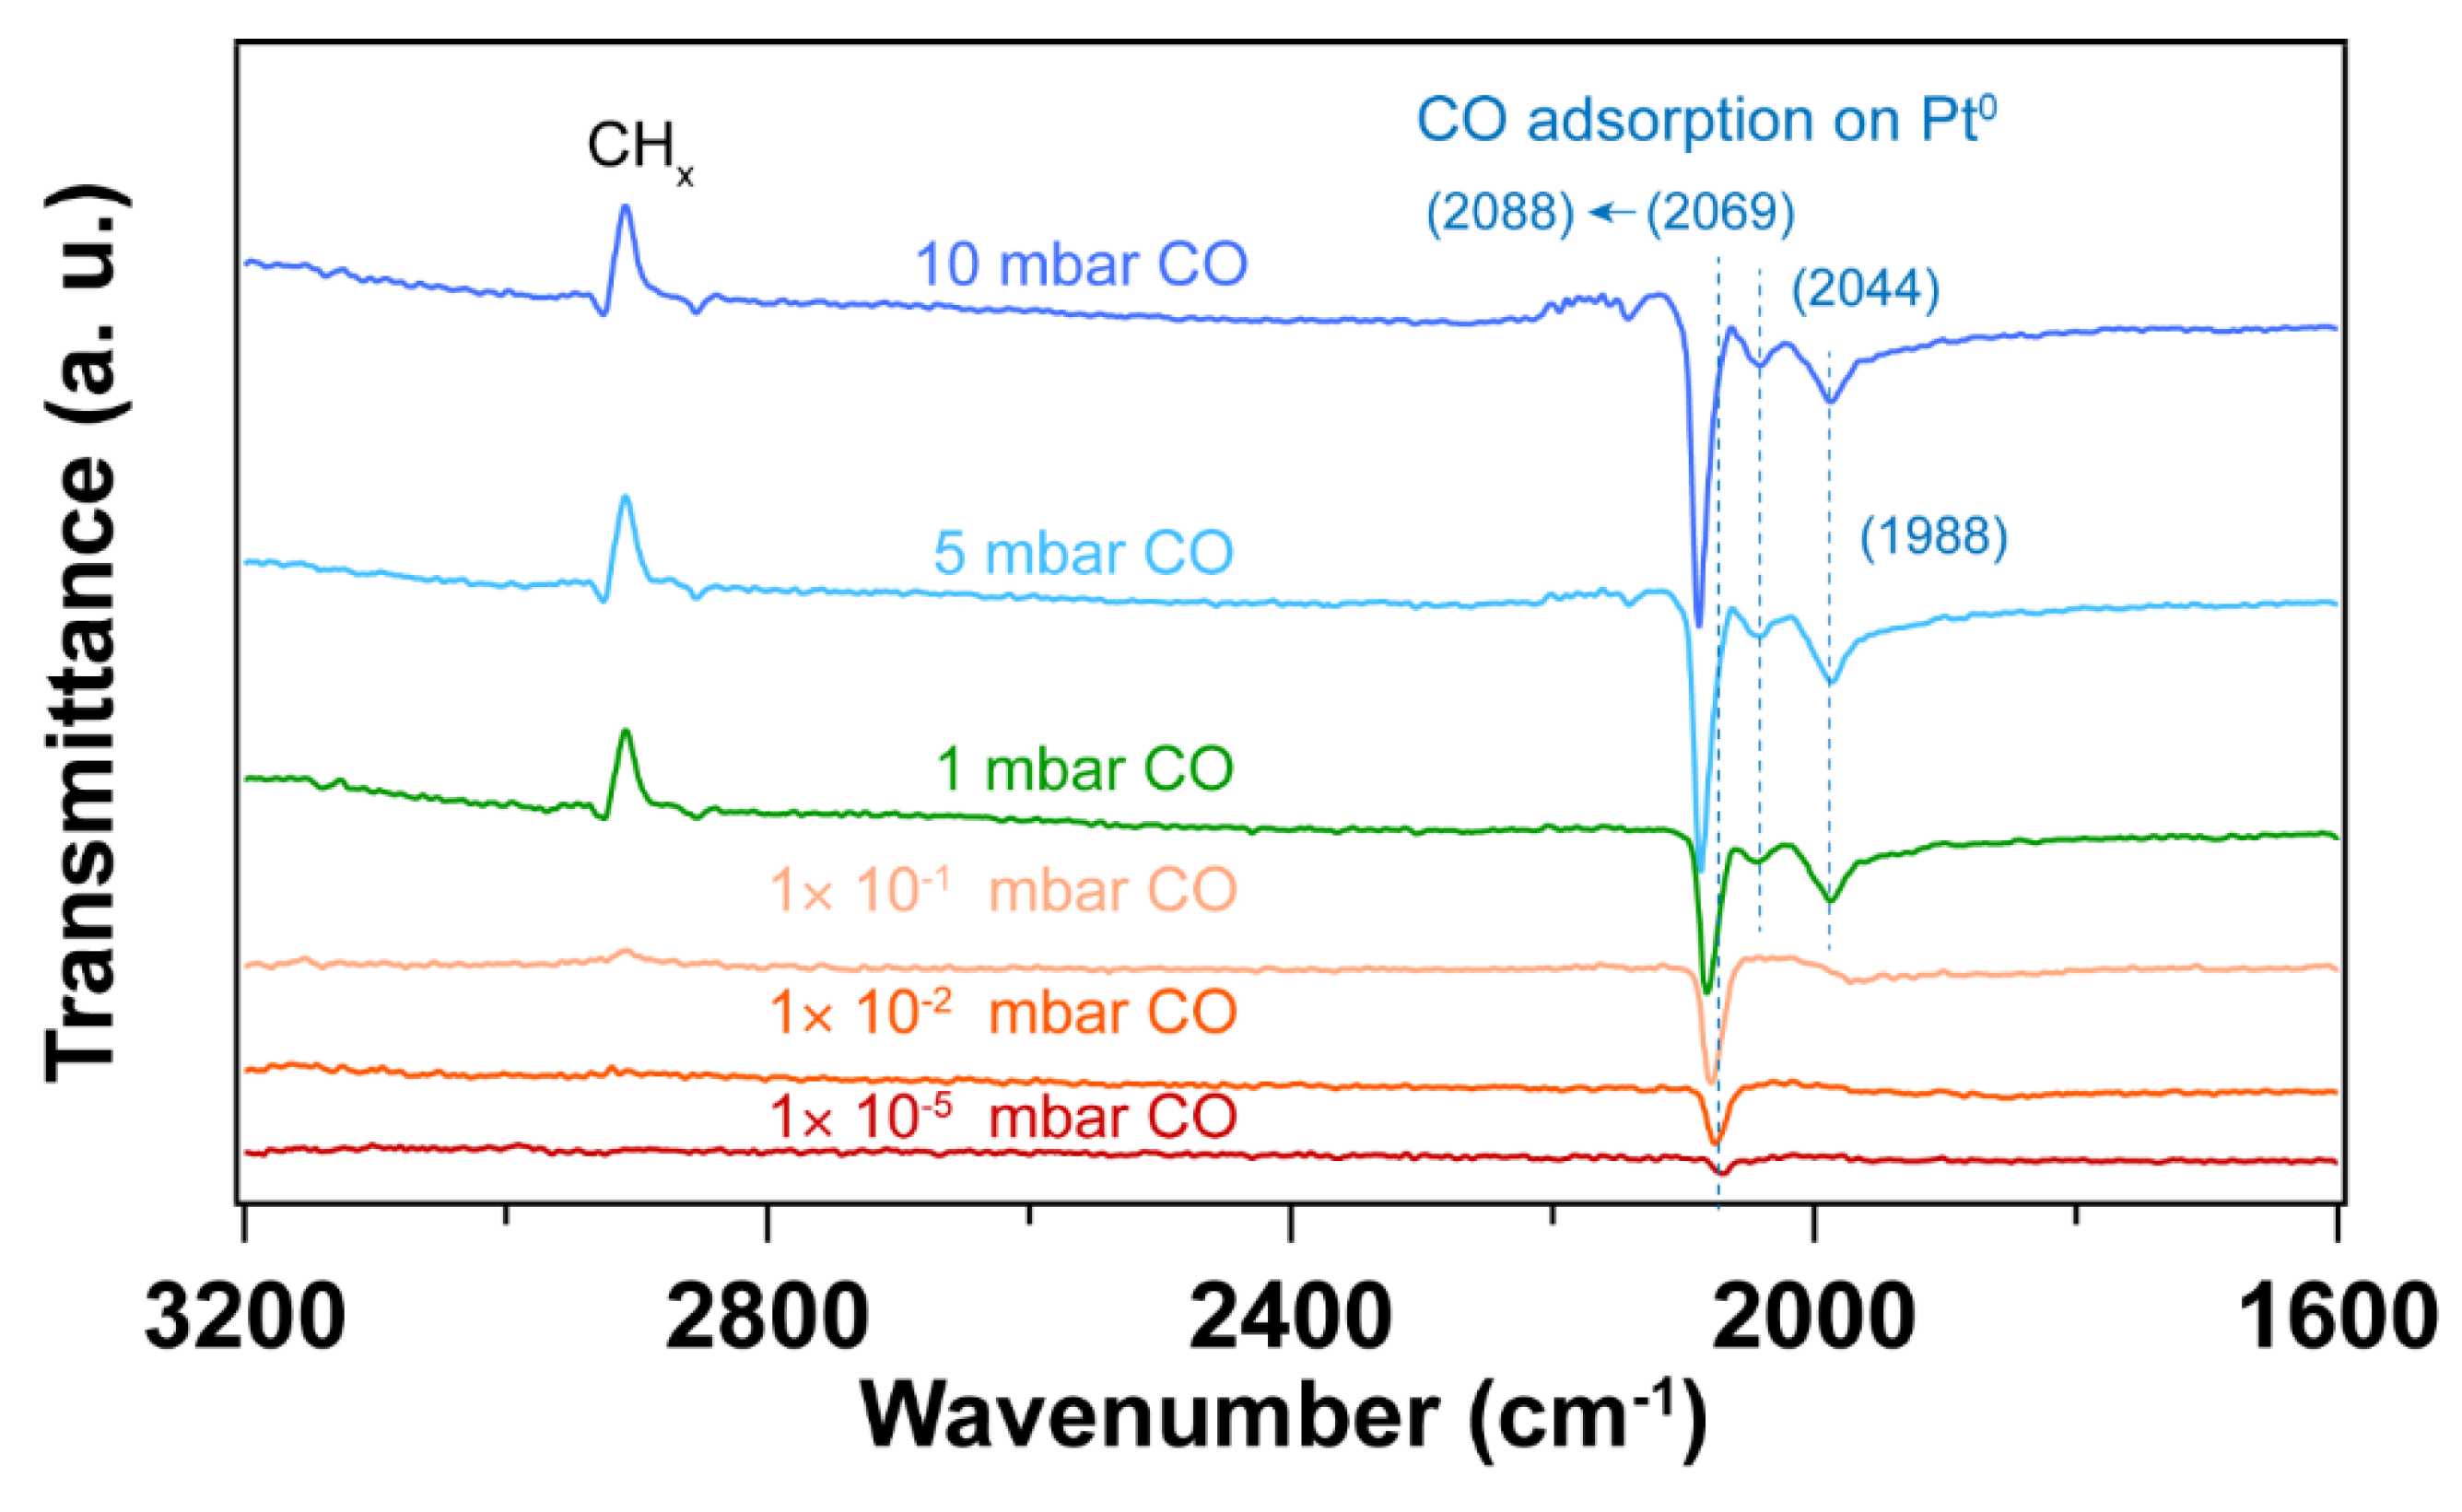
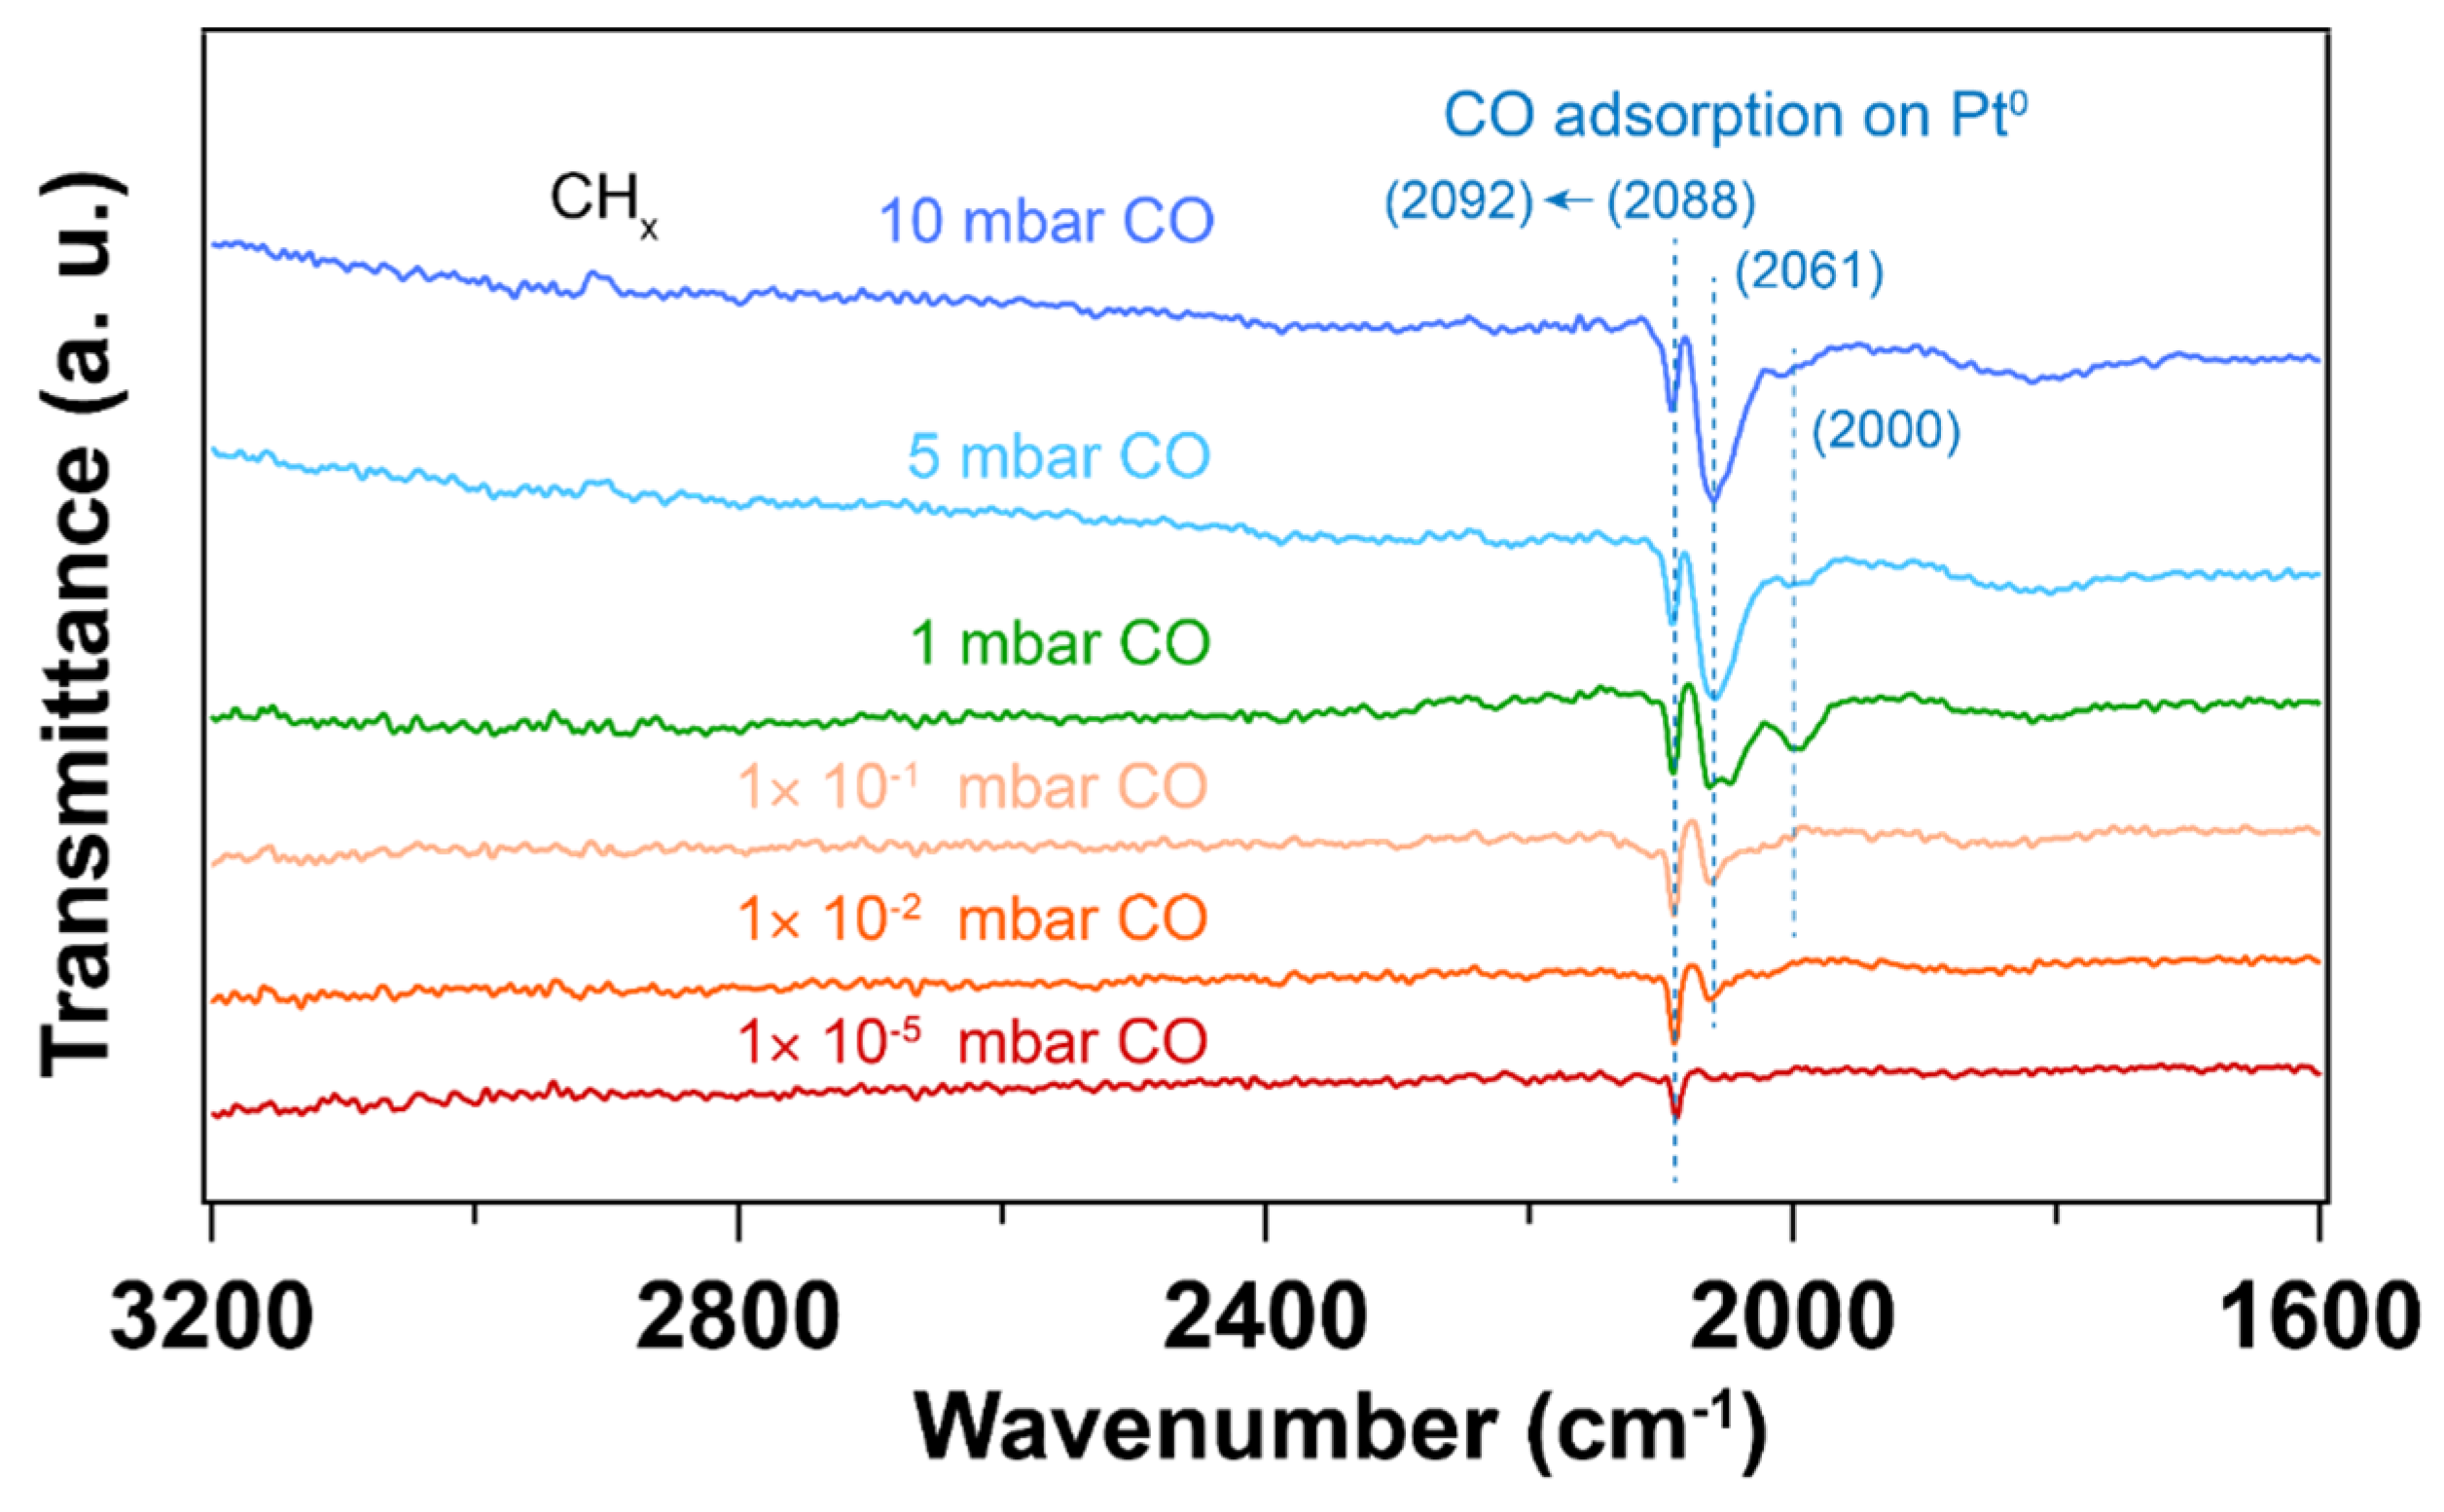
3.5. Practical applications of plasma cleaning in advanced characterization
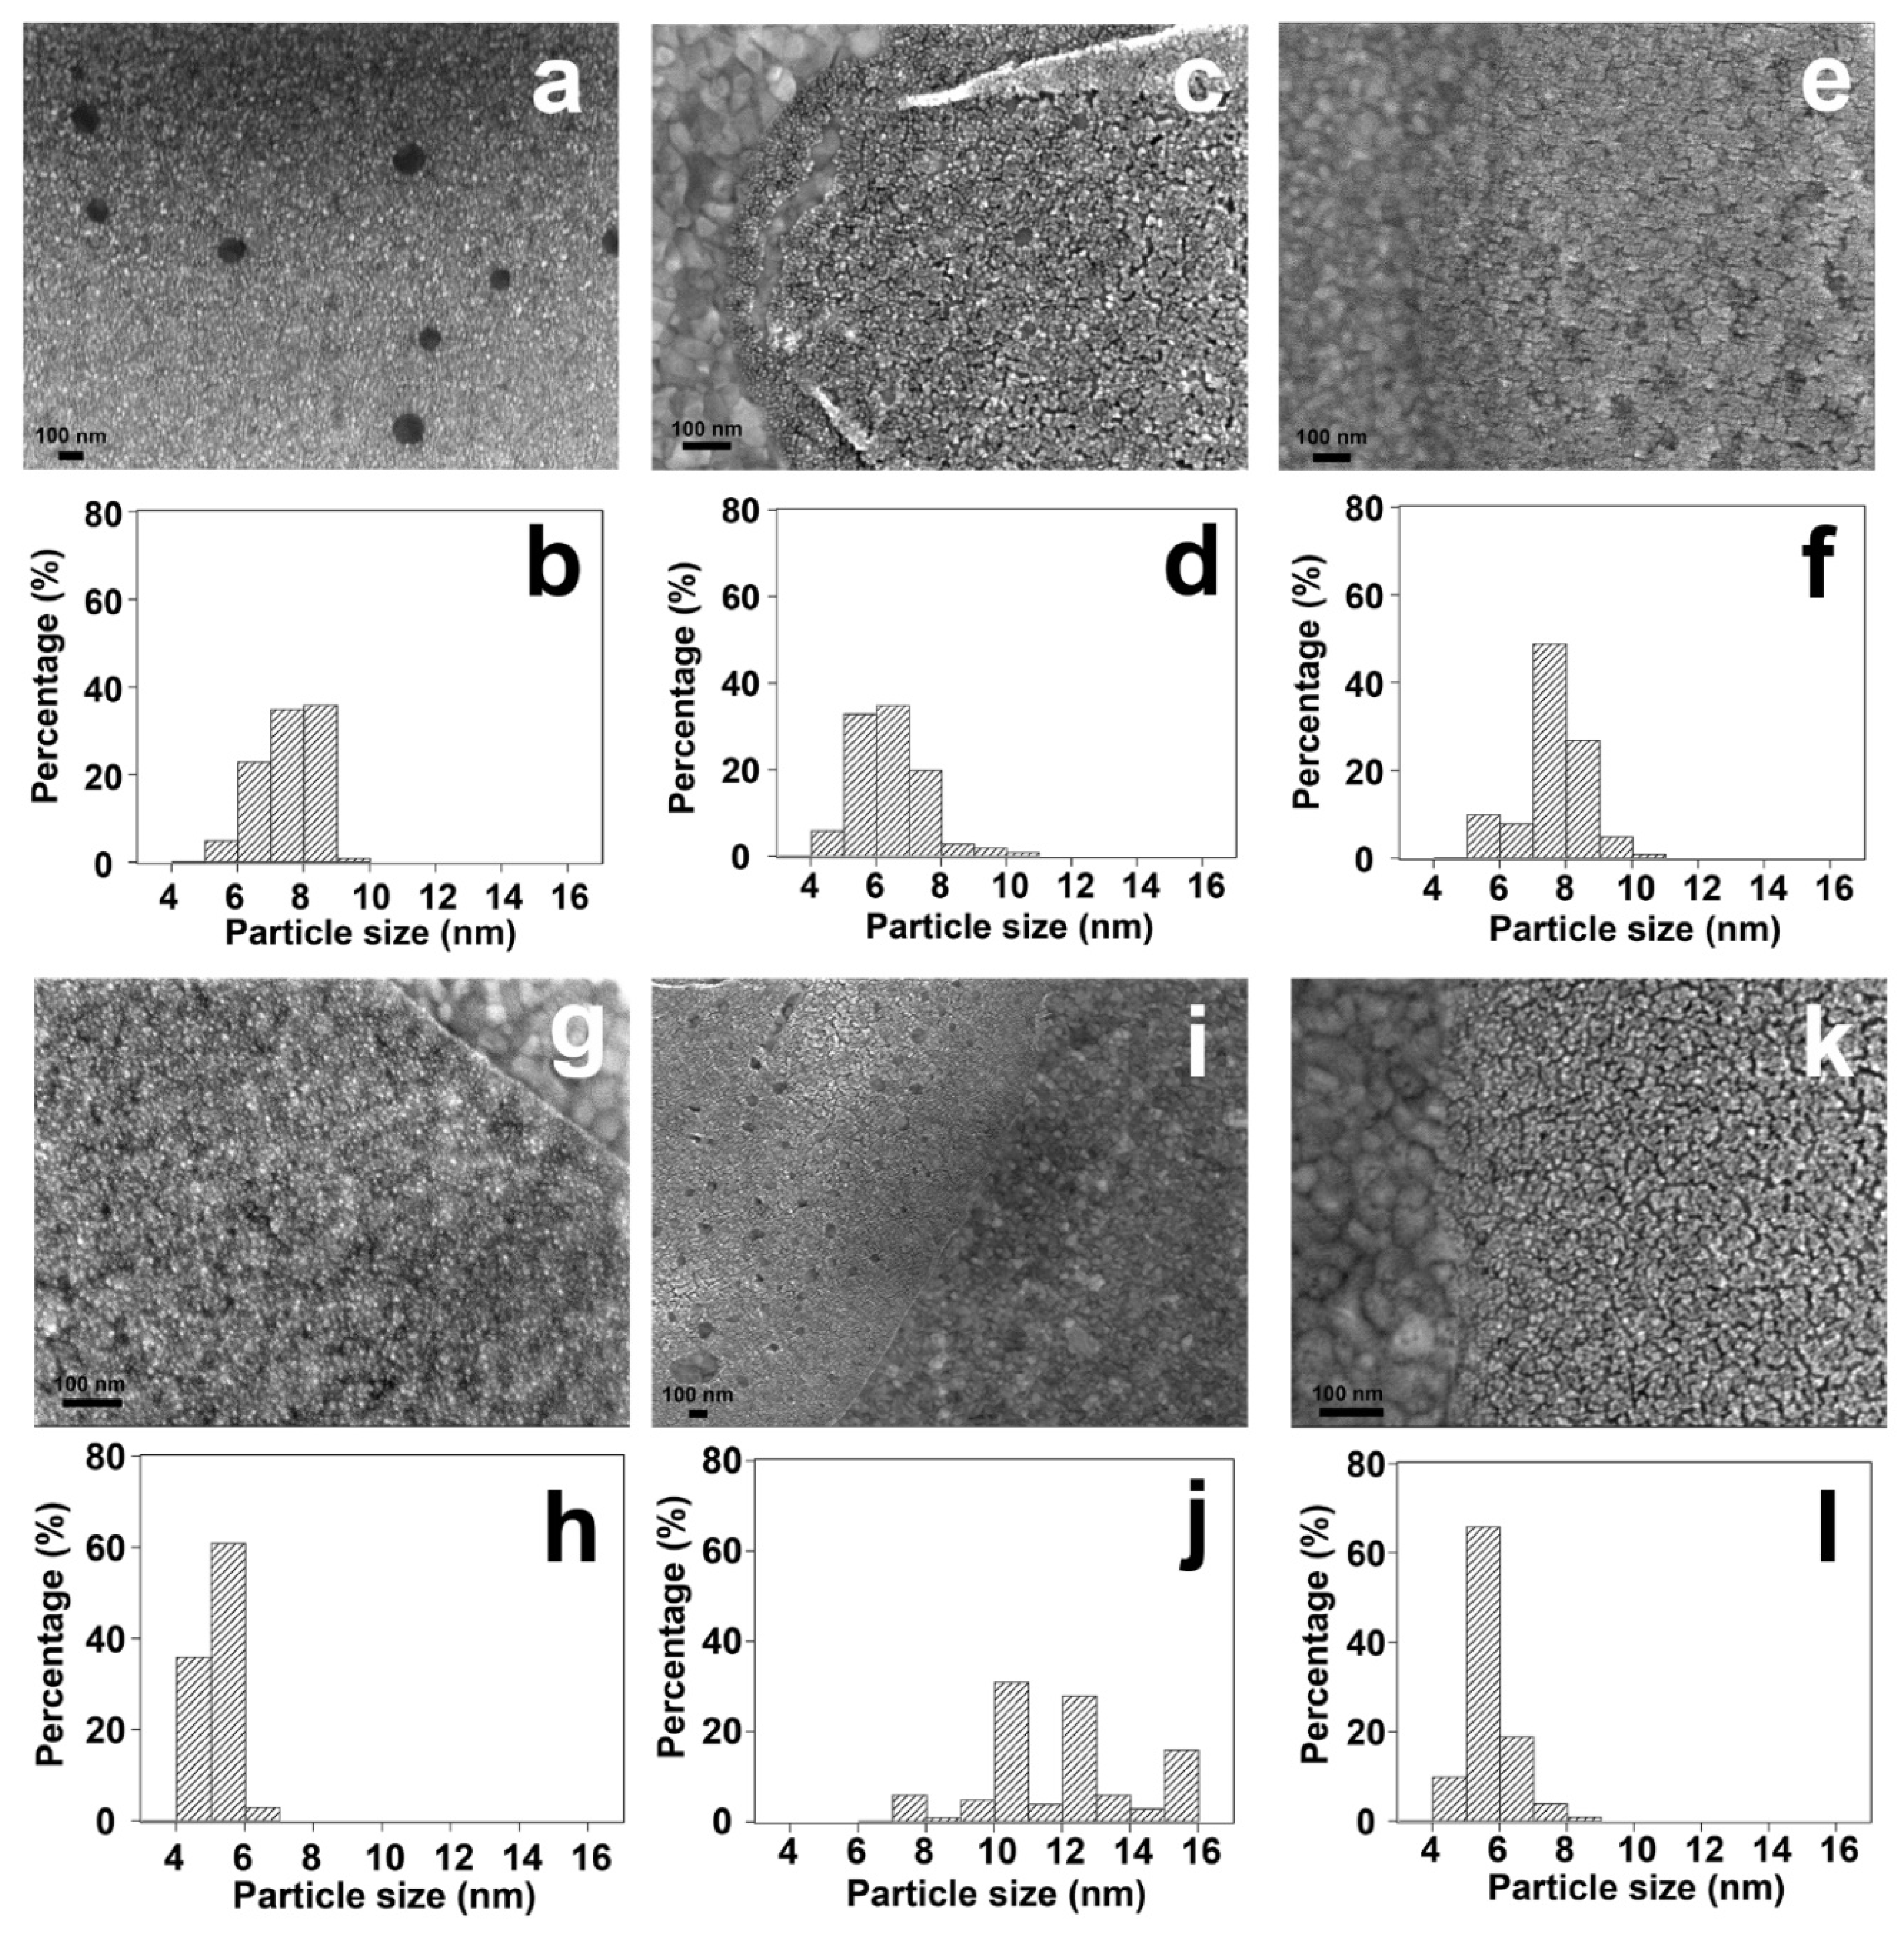
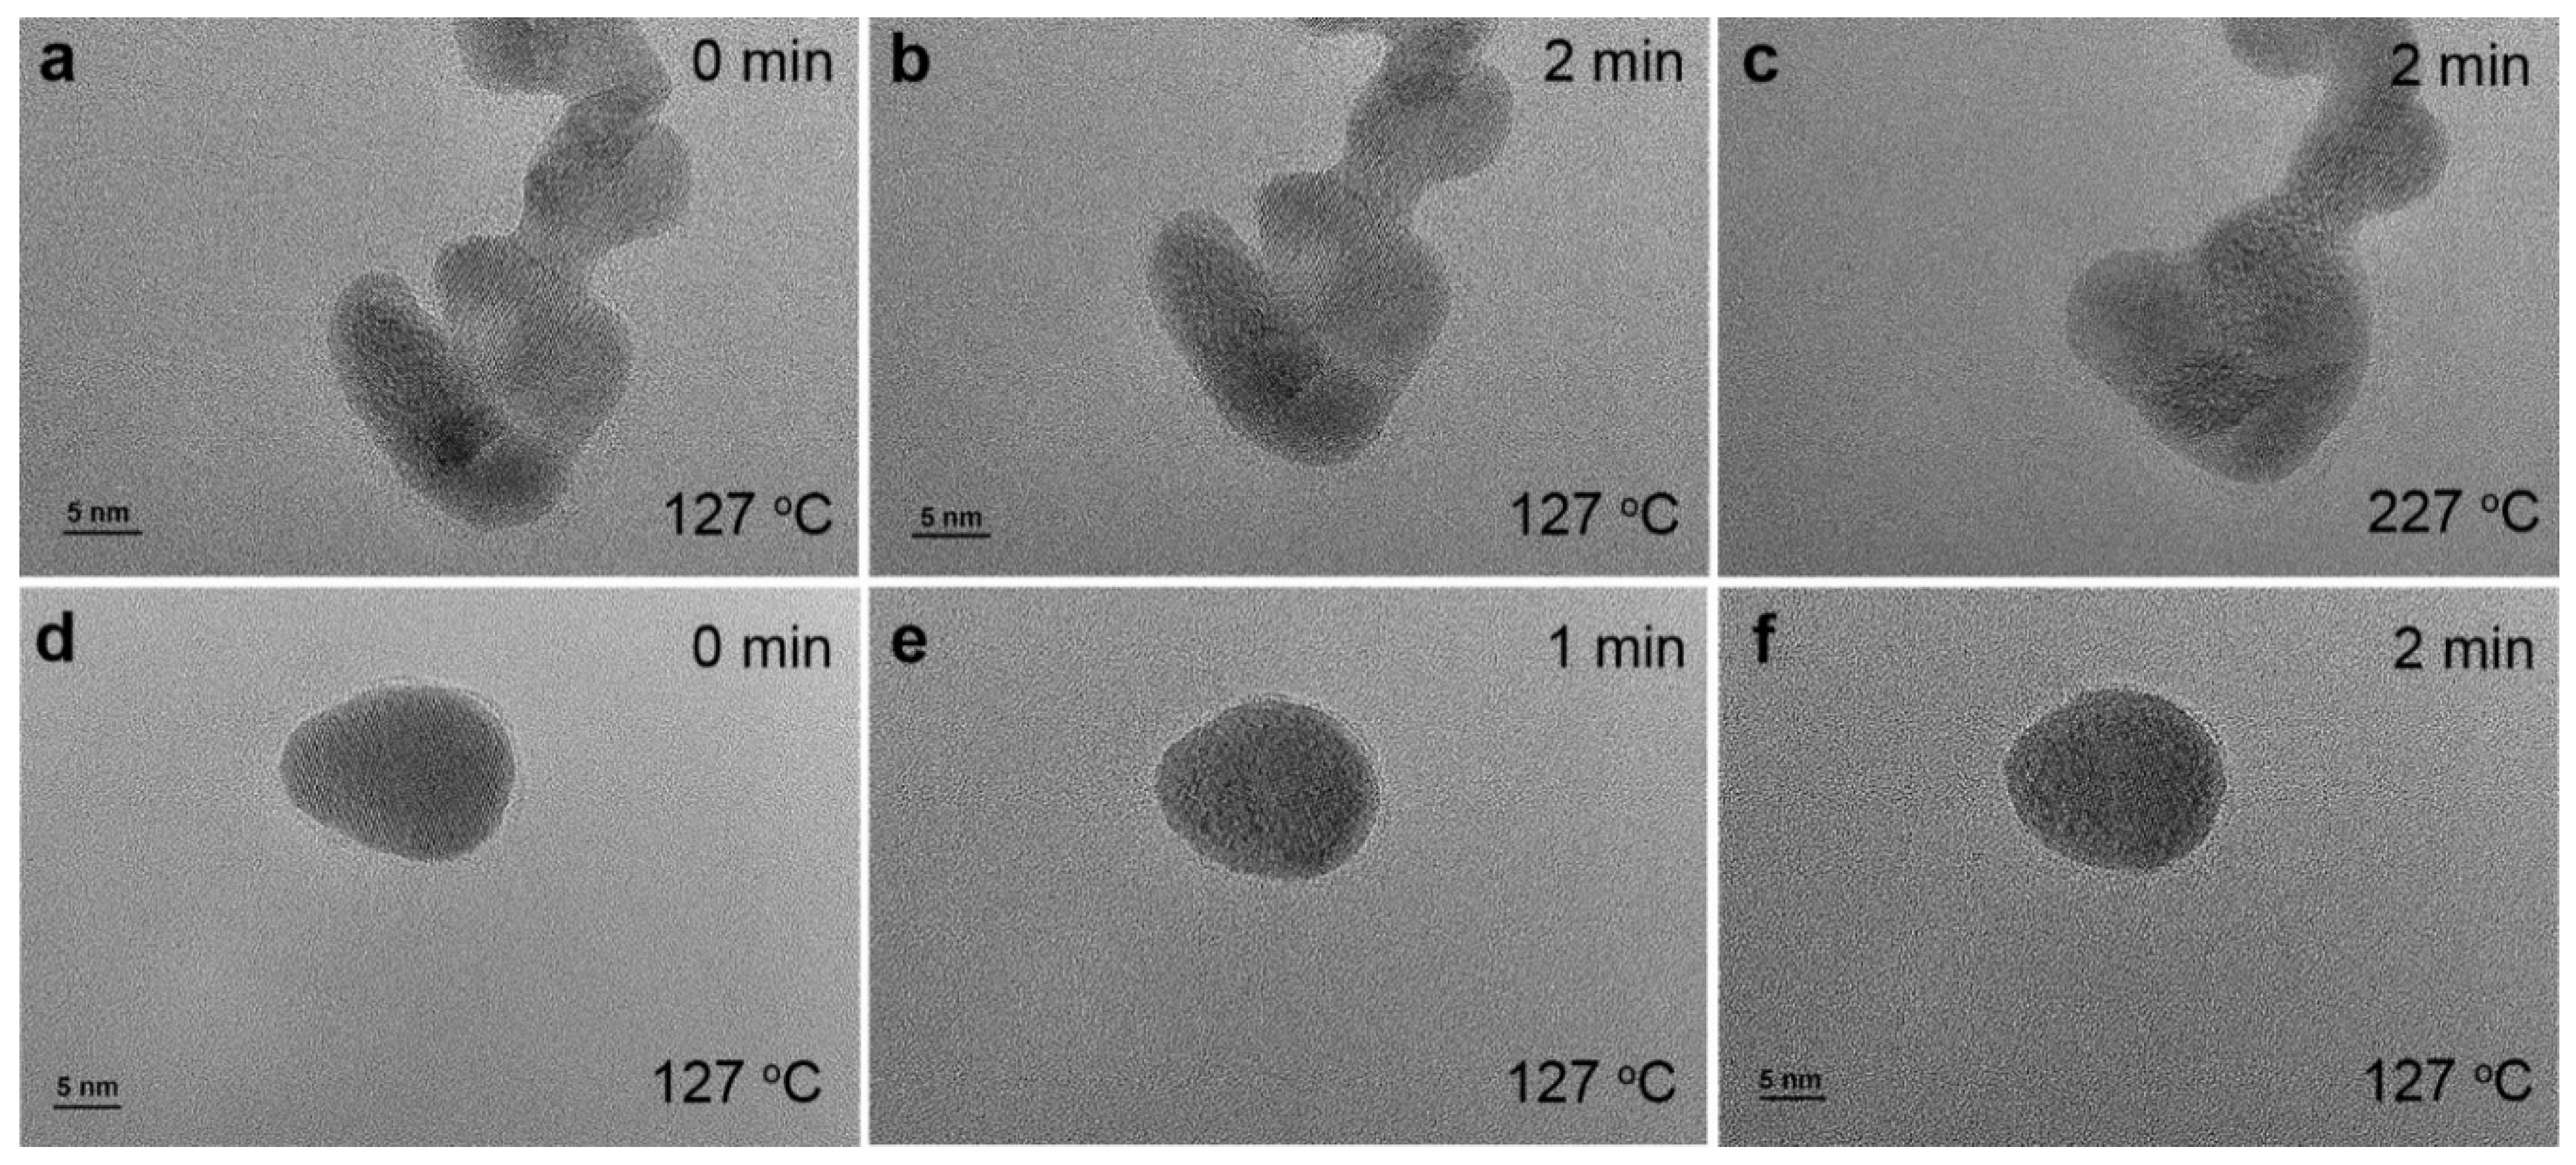
4. Conclusions
Supplementary Materials
Acknowledgments
References
- Zhang, J.; Yang, H.; Fang, J.; Zou, S. Synthesis and oxygen reduction activity of shape-controlled Pt3Ni nanopolyhedra. Nano letters 2010, 10, 638–644. [Google Scholar] [CrossRef] [PubMed]
- VPuntes, F.; Krishnan, K.M.; Alivisatos, A.P. Colloidal nanocrystal shape and size control: the case of cobalt. Science 2001, 291, 2115–2117. [Google Scholar] [CrossRef]
- Wang, C.; van der Vliet, D.; Chang, K.-C.; You, H.; Strmcnik, D.; Schlueter, J.A.; Markovic, N.M.; Stamenkovic, V.R. Monodisperse Pt3Co nanoparticles as a catalyst for the oxygen reduction reaction: Size-dependent activity. The Journal of Physical Chemistry C 2009, 113, 19365–19368. [Google Scholar] [CrossRef]
- Sun, S.; Zeng, H.; Robinson, D.B.; Raoux, S.; Rice, P.M.; Wang, S.X.; Li, G. Monodisperse mfe2o4 (m= fe, co, mn) nanoparticles. Journal of the American chemical society 2004, 126, 273–279. [Google Scholar] [CrossRef]
- Tsung, C.-K.; Kuhn, J.N.; Huang, W.; Aliaga, C.; Hung, L.-I.; Somorjai, G.A.; Yang, P. Sub-10 nm platinum nanocrystals with size and shape control: catalytic study for ethylene and pyrrole hydrogenation. Journal of the American Chemical Society 2009, 131, 5816–5822. [Google Scholar] [CrossRef] [PubMed]
- Heinz, H.; Pramanik, C.; Heinz, O.; Ding, Y.; Mishra, R.K.; Marchon, D.; Flatt, R.J.; Estrela-Lopis, I.; Llop, J.; Moya, S. Nanoparticle decoration with surfactants: molecular interactions, assembly, and applications. Surface Science Reports 2017, 72, 1–58. [Google Scholar] [CrossRef]
- Ayala-Orozco, C.; Urban, C.; Knight, M.W.; Urban, A.S.; Neumann, O.; Bishnoi, S.W.; Mukherjee, S.; Goodman, A.M.; Charron, H.; Mitchell, T. Au nanomatryoshkas as efficient near-infrared photothermal transducers for cancer treatment: benchmarking against nanoshells. ACS nano 2014, 8, 6372–6381. [Google Scholar] [CrossRef] [PubMed]
- Dreaden, E.C.; Alkilany, A.M.; Huang, X.; Murphy, C.J.; El-Sayed, M.A. The golden age: gold nanoparticles for biomedicine. Chemical Society Reviews 2012, 41, 2740–2779. [Google Scholar] [CrossRef] [PubMed]
- Bang, J.H.; Kamat, P.V. Quantum dot sensitized solar cells. A tale of two semiconductor nanocrystals: CdSe and CdTe. ACS nano 2009, 3, 1467–1476. [Google Scholar] [CrossRef]
- Jariwala, D.; Sangwan, V.K.; Lauhon, L.J.; Marks, T.J.; Hersam, M.C. Emerging device applications for semiconducting two-dimensional transition metal dichalcogenides. ACS nano 2014, 8, 1102–1120. [Google Scholar] [CrossRef]
- Radisavljevic, B.; Radenovic, A.; Brivio, J.; Giacometti, V.; Kis, A. Single-layer MoS2 transistors. Nature nanotechnology 2011, 6, 147–150. [Google Scholar] [CrossRef]
- Huang, G.; Chen, T.; Chen, W.; Wang, Z.; Chang, K.; Ma, L.; Huang, F.; Chen, D.; Lee, J.Y. Graphene-Like MoS2/Graphene Composites: Cationic Surfactant-Assisted Hydrothermal Synthesis and Electrochemical Reversible Storage of Lithium. Small 2013, 9, 3693–3703. [Google Scholar] [CrossRef]
- Wang, C.; Van Der Vliet, D.; More, K.L.; Zaluzec, N.J.; Peng, S.; Sun, S.; Daimon, H.; Wang, G.; Greeley, J.; Pearson, J. Multimetallic Au/FePt3 nanoparticles as highly durable electrocatalyst. Nano letters 2011, 11, 919–926. [Google Scholar] [CrossRef]
- Chen, W.; Kim, J.; Sun, S.; Chen, S. Electrocatalytic reduction of oxygen by FePt alloy nanoparticles. The Journal of Physical Chemistry C 2008, 112, 3891–3898. [Google Scholar] [CrossRef]
- Swafford, L.A.; Weigand, L.A.; Bowers, M.J.; McBride, J.R.; Rapaport, J.L.; Watt, T.L.; Dixit, S.K.; Feldman, L.C.; Rosenthal, S.J. Homogeneously alloyed CdS x Se1-x nanocrystals: synthesis, characterization, and composition/size-dependent band gap. Journal of the American Chemical Society 2006, 128, 12299–12306. [Google Scholar] [CrossRef]
- Sun, Y.; Xia, Y. Shape-controlled synthesis of gold and silver nanoparticles. science 2002, 298, 2176–2179. [Google Scholar] [CrossRef]
- Hrelescu, C.; Sau, T.K.; Rogach, A.L.; Jäckel, F.; Laurent, G.; Douillard, L.; Charra, F. Selective excitation of individual plasmonic hotspots at the tips of single gold nanostars. Nano Letters 2011, 11, 402–407. [Google Scholar] [CrossRef]
- Niu, W.; Zheng, S.; Wang, D.; Liu, X.; Li, H.; Han, S.; Chen, J.; Tang, Z.; Xu, G. Selective synthesis of single-crystalline rhombic dodecahedral, octahedral, and cubic gold nanocrystals. Journal of the American Chemical Society 2009, 131, 697–703. [Google Scholar] [CrossRef]
- Huang, X.; Neretina, S.; El-Sayed, M.A. Gold nanorods: from synthesis and properties to biological and biomedical applications. Advanced materials 2009, 21, 4880–4910. [Google Scholar] [CrossRef]
- Martinsson, E.; Shahjamali, M.M.; Enander, K.; Boey, F.; Xue, C.; Aili, D.; Liedberg, B. Local refractive index sensing based on edge gold-coated silver nanoprisms. The Journal of Physical Chemistry C 2013, 117, 23148–23154. [Google Scholar] [CrossRef]
- Jing, H.; Zhang, Q.; Large, N.; Yu, C.; Blom, D.A.; Nordlander, P.; Wang, H. Tunable plasmonic nanoparticles with catalytically active high-index facets. Nano letters 2014, 14, 3674–3682. [Google Scholar] [CrossRef]
- Zhang, Q.; Large, N.; Wang, H. Gold nanoparticles with tipped surface structures as substrates for single-particle surface-enhanced Raman spectroscopy: concave nanocubes, nanotrisoctahedra, and nanostars. ACS applied materials & interfaces 2014, 6, 17255–17267. [Google Scholar]
- Martinsson, E.; Shahjamali, M.M.; Large, N.; Zaraee, N.; Zhou, Y.; Schatz, G.C.; Mirkin, C.A.; Aili, D. Influence of surfactant bilayers on the refractive index sensitivity and catalytic properties of anisotropic gold nanoparticles. Small 2016, 12, 330–342. [Google Scholar] [CrossRef]
- Macfarlane, R.J.; Jones, M.R.; Lee, B.; Auyeung, E.; Mirkin, C.A. Topotactic interconversion of nanoparticle superlattices. Science 2013, 341, 1222–1225. [Google Scholar] [CrossRef]
- Alkilany, A.M.; Thompson, L.B.; Boulos, S.P.; Sisco, P.N.; Murphy, C.J. Gold nanorods: their potential for photothermal therapeutics and drug delivery, tempered by the complexity of their biological interactions. Advanced drug delivery reviews 2012, 64, 190–199. [Google Scholar] [CrossRef]
- Hauck, T.S.; Ghazani, A.A.; Chan, W.C. Assessing the effect of surface chemistry on gold nanorod uptake, toxicity, and gene expression in mammalian cells. Small 2008, 4, 153–159. [Google Scholar] [CrossRef]
- Li, D.; Wang, C.; Tripkovic, D.; Sun, S.; Markovic, N.M.; Stamenkovic, V.R. Surfactant removal for colloidal nanoparticles from solution synthesis: the effect on catalytic performance. Acs Catalysis 2012, 2, 1358–1362. [Google Scholar] [CrossRef]
- Lu, L.; Zou, S.; Fang, B. The critical impacts of ligands on heterogeneous nanocatalysis: a review. ACS Catalysis 2021, 11, 6020–6058. [Google Scholar] [CrossRef]
- Aliaga, C.; Park, J.Y.; Yamada, Y.; Lee, H.S.; Tsung, C.-K.; Yang, P.; Somorjai, G.A. Sum frequency generation and catalytic reaction studies of the removal of organic capping agents from Pt nanoparticles by UV− ozone treatment. The Journal of Physical Chemistry C 2009, 113, 6150–6155. [Google Scholar] [CrossRef]
- Kim, G.W.; Ha, J.W. Single-particle study: effects of oxygen plasma treatment on structural and spectral changes of anisotropic gold nanorods. Physical Chemistry Chemical Physics 2020, 22, 11767–11770. [Google Scholar] [CrossRef]
- Choi, K.; Ghosh, S.; Lim, J.; Lee, C. Removal efficiency of organic contaminants on Si wafer by dry cleaning using UV/O3 and ECR plasma. Applied Surface Science 2003, 206, 355–364. [Google Scholar] [CrossRef]
- Gehl, B.; Frömsdorf, A.; Aleksandrovic, V.; Schmidt, T.; Pretorius, A.; Flege, J.I.; Bernstorff, S.; Rosenauer, A.; Falta, J.; Weller, H. Structural and Chemical Effects of Plasma Treatment on Close-Packed Colloidal Nanoparticle Layers. Advanced Functional Materials 2008, 18, 2398–2410. [Google Scholar] [CrossRef]
- Nguyen, D.K.; Vargheese, V.; Liao, V.; Dimitrakellis, P.; Sourav, S.; Zheng, W.; Vlachos, D.G. Plasma-Enabled Ligand Removal for Improved Catalysis: Furfural Conversion on Pd/SiO2. ACS nano 2023. [CrossRef]
- Han, G.; Wang, K.; Elkins, K.E.; Qiu, Z.; Timmons, R.B.; Savage, C.R.; Kang, S.; Liu, J.P. Cold plasma reduction of surface carbon on SmCo5 nano-flakes prepared by surfactant-assisted ball-milling. Journal of Magnetism and Magnetic Materials 2019, 471, 250–254. [Google Scholar] [CrossRef]
- Dorneles de Mello, M.; Ahmad, M.; Lee, D.T.; Dimitrakellis, P.; Miao, Y.; Zheng, W.; Nykypanchuk, D.; Vlachos, D.G.; Tsapatsis, M.; Boscoboinik, J.A. In Situ Tracking of Nonthermal Plasma Etching of ZIF-8 Films. ACS Applied Materials & Interfaces 2022, 14, 19023–19030. [Google Scholar]
- Yamada, Y.; Tsung, C.-K.; Huang, W.; Huo, Z.; Habas, S.E.; Soejima, T.; Aliaga, C.E.; Somorjai, G.A.; Yang, P. Nanocrystal bilayer for tandem catalysis. Nature chemistry 2011, 3, 372–376. [Google Scholar] [CrossRef]
- Li, G.; Marinkovic, N.; Wang, B.; Komarneni, M.R.; Resasco, D.E. Manipulating the Microenvironment of Surfactant-Encapsulated Pt Nanoparticles to Promote Activity and Selectivity. ACS Catalysis 2022, 12, 13930–13940. [Google Scholar] [CrossRef]
- Vovk, E.I.; Kalinkin, A.V.; Smirnov, M.Y.; Klembovskii, I.O.; Bukhtiyarov, V.I. XPS study of stability and reactivity of oxidized Pt nanoparticles supported on TiO2. The Journal of Physical Chemistry C 2017, 121, 17297–17304. [Google Scholar] [CrossRef]
- Li, G.; Li, L.; Wu, B.; Li, J.; Yuan, Y.; Shi, J. Controlled one-step synthesis of Pt decorated octahedral Fe 3 O 4 and its excellent catalytic performance for CO oxidation. Nanoscale 2015, 7, 17855–17860. [Google Scholar] [CrossRef]
- Parkinson, C.; Walker, M.; McConville, C. Reaction of atomic oxygen with a Pt (111) surface: chemical and structural determination using XPS, CAICISS and LEED. Surface Science 2003, 545, 19–33. [Google Scholar] [CrossRef]
- Motin, A.M.; Haunold, T.; Bukhtiyarov, A.V.; Bera, A.; Rameshan, C.; Rupprechter, G. Surface science approach to Pt/carbon model catalysts: XPS, STM and microreactor studies. Applied Surface Science 2018, 440, 680–687. [Google Scholar] [CrossRef]
- Johansson, N.; Andersen, M.; Monya, Y.; Andersen, J.N.; Kondoh, H.; Schnadt, J.; Knudsen, J. Ambient pressure phase transitions over Ir (1 1 1): at the onset of CO oxidation. Journal of Physics: Condensed Matter 2017, 29, 444002. [Google Scholar] [CrossRef] [PubMed]
- Garcia-Martinez, F.; García-Fernández, C.; Simonovis, J.P.; Hunt, A.; Walter, A.; Waluyo, I.; Bertram, F.; Merte, L.R.; Shipilin, M.; Pfaff, S. Catalytic Oxidation of CO on a Curved Pt (111) Surface: Simultaneous Ignition at All Facets through a Transient CO-O Complex. Angewandte Chemie 2020, 132, 20212–20218. [Google Scholar] [CrossRef]
- Ding, K.; Gulec, A.; Johnson, A.M.; Schweitzer, N.M.; Stucky, G.D.; Marks, L.D.; Stair, P.C. Identification of active sites in CO oxidation and water-gas shift over supported Pt catalysts. science 2015, 350, 189–192. [Google Scholar] [CrossRef] [PubMed]
- Ivanova, E.; Mihaylov, M.; Thibault-Starzyk, F.; Daturi, M.; Hadjiivanov, K. FTIR spectroscopy study of CO and NO adsorption and co-adsorption on Pt/TiO2. Journal of Molecular Catalysis A: Chemical 2007, 274, 179–184. [Google Scholar] [CrossRef]
- Crossley, A.; King, D.A. Infrared spectra for co isotopes chemisorbed on Pt “111”: Evidence for strong absorbate coupling interactions. Surface Science 1977, 68, 528–538. [Google Scholar] [CrossRef]
- Olsen, C.; Masel, R. An infrared study of CO adsorption on Pt (111). Surface Science 1988, 201, 444–460. [Google Scholar] [CrossRef]
- Allian, A.D.; Takanabe, K.; Fujdala, K.L.; Hao, X.; Truex, T.J.; Cai, J.; Buda, C.; Neurock, M.; Iglesia, E. Chemisorption of CO and mechanism of CO oxidation on supported platinum nanoclusters. Journal of the American Chemical Society 2011, 133, 4498–4517. [Google Scholar] [CrossRef] [PubMed]
- Bordenyuk, A.N.; Weeraman, C.; Yatawara, A.; Jayathilake, H.D.; Stiopkin, I.; Liu, Y.; Benderskii, A.V. Vibrational sum frequency generation spectroscopy of dodecanethiol on metal nanoparticles. The Journal of Physical Chemistry C 2007, 111, 8925–8933. [Google Scholar] [CrossRef]
- Borodko, Y.; Habas, S.E.; Koebel, M.; Yang, P.; Frei, H.; Somorjai, G.A. Probing the Interaction of Poly (vinylpyrrolidone) with Platinum Nanocrystals by UV− Raman and FTIR. The Journal of Physical Chemistry B 2006, 110, 23052–23059. [Google Scholar] [CrossRef]
- Michalka, J.R.; Latham, A.P.; Gezelter, J.D. CO-induced restructuring on stepped Pt surfaces: a molecular dynamics study. The Journal of Physical Chemistry C 2016, 120, 18180–18190. [Google Scholar] [CrossRef]
- Zabidi, N.; Zaaba, S.; Sut, K.E.; Mohamad, C.; Masiman, R. A Brief Review on Atmospheric Air Plasma. J. Phys.Conf. Ser. 2021, 2071, 012004. [Google Scholar] [CrossRef]
Disclaimer/Publisher’s Note: The statements, opinions and data contained in all publications are solely those of the individual author(s) and contributor(s) and not of MDPI and/or the editor(s). MDPI and/or the editor(s) disclaim responsibility for any injury to people or property resulting from any ideas, methods, instructions or products referred to in the content. |
© 2023 by the authors. Licensee MDPI, Basel, Switzerland. This article is an open access article distributed under the terms and conditions of the Creative Commons Attribution (CC BY) license (http://creativecommons.org/licenses/by/4.0/).


