Submitted:
27 December 2023
Posted:
29 December 2023
You are already at the latest version
Abstract
Keywords:
1. Introduction
2. Materials and Methods
3. Results
3.1. Identification of a YAP/TAZ gene signature in metastatic melanoma cells.
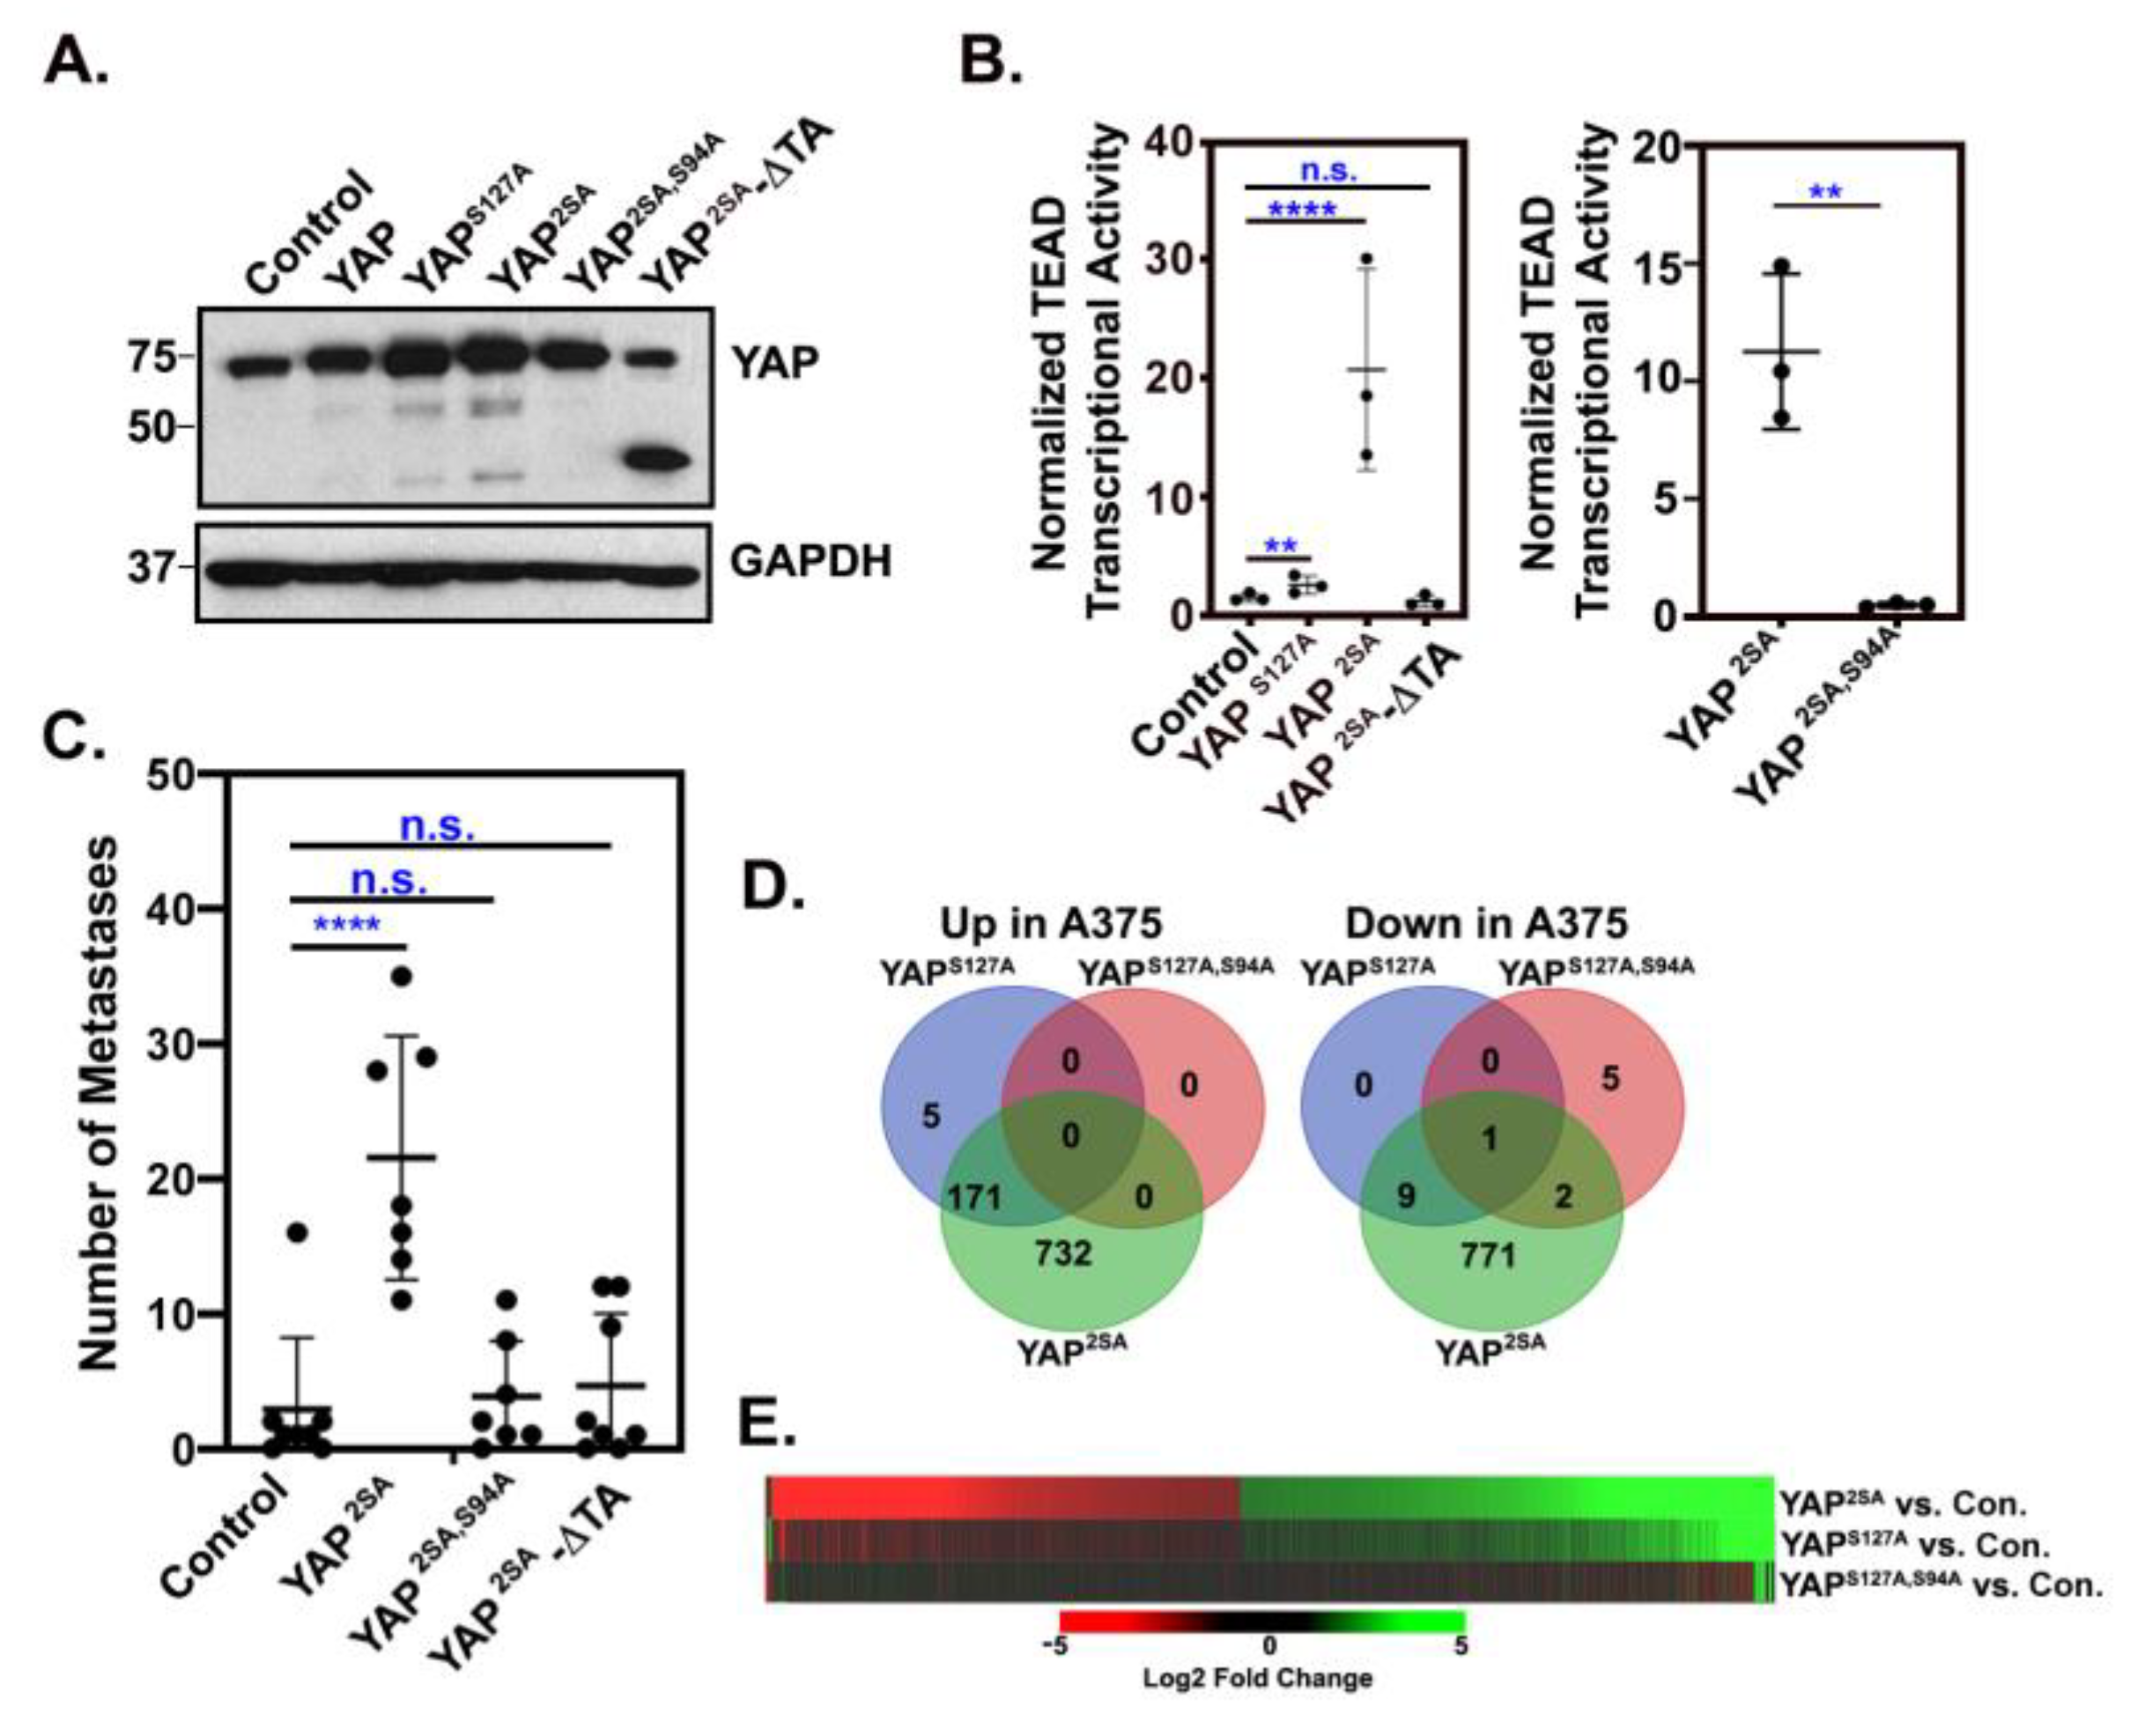
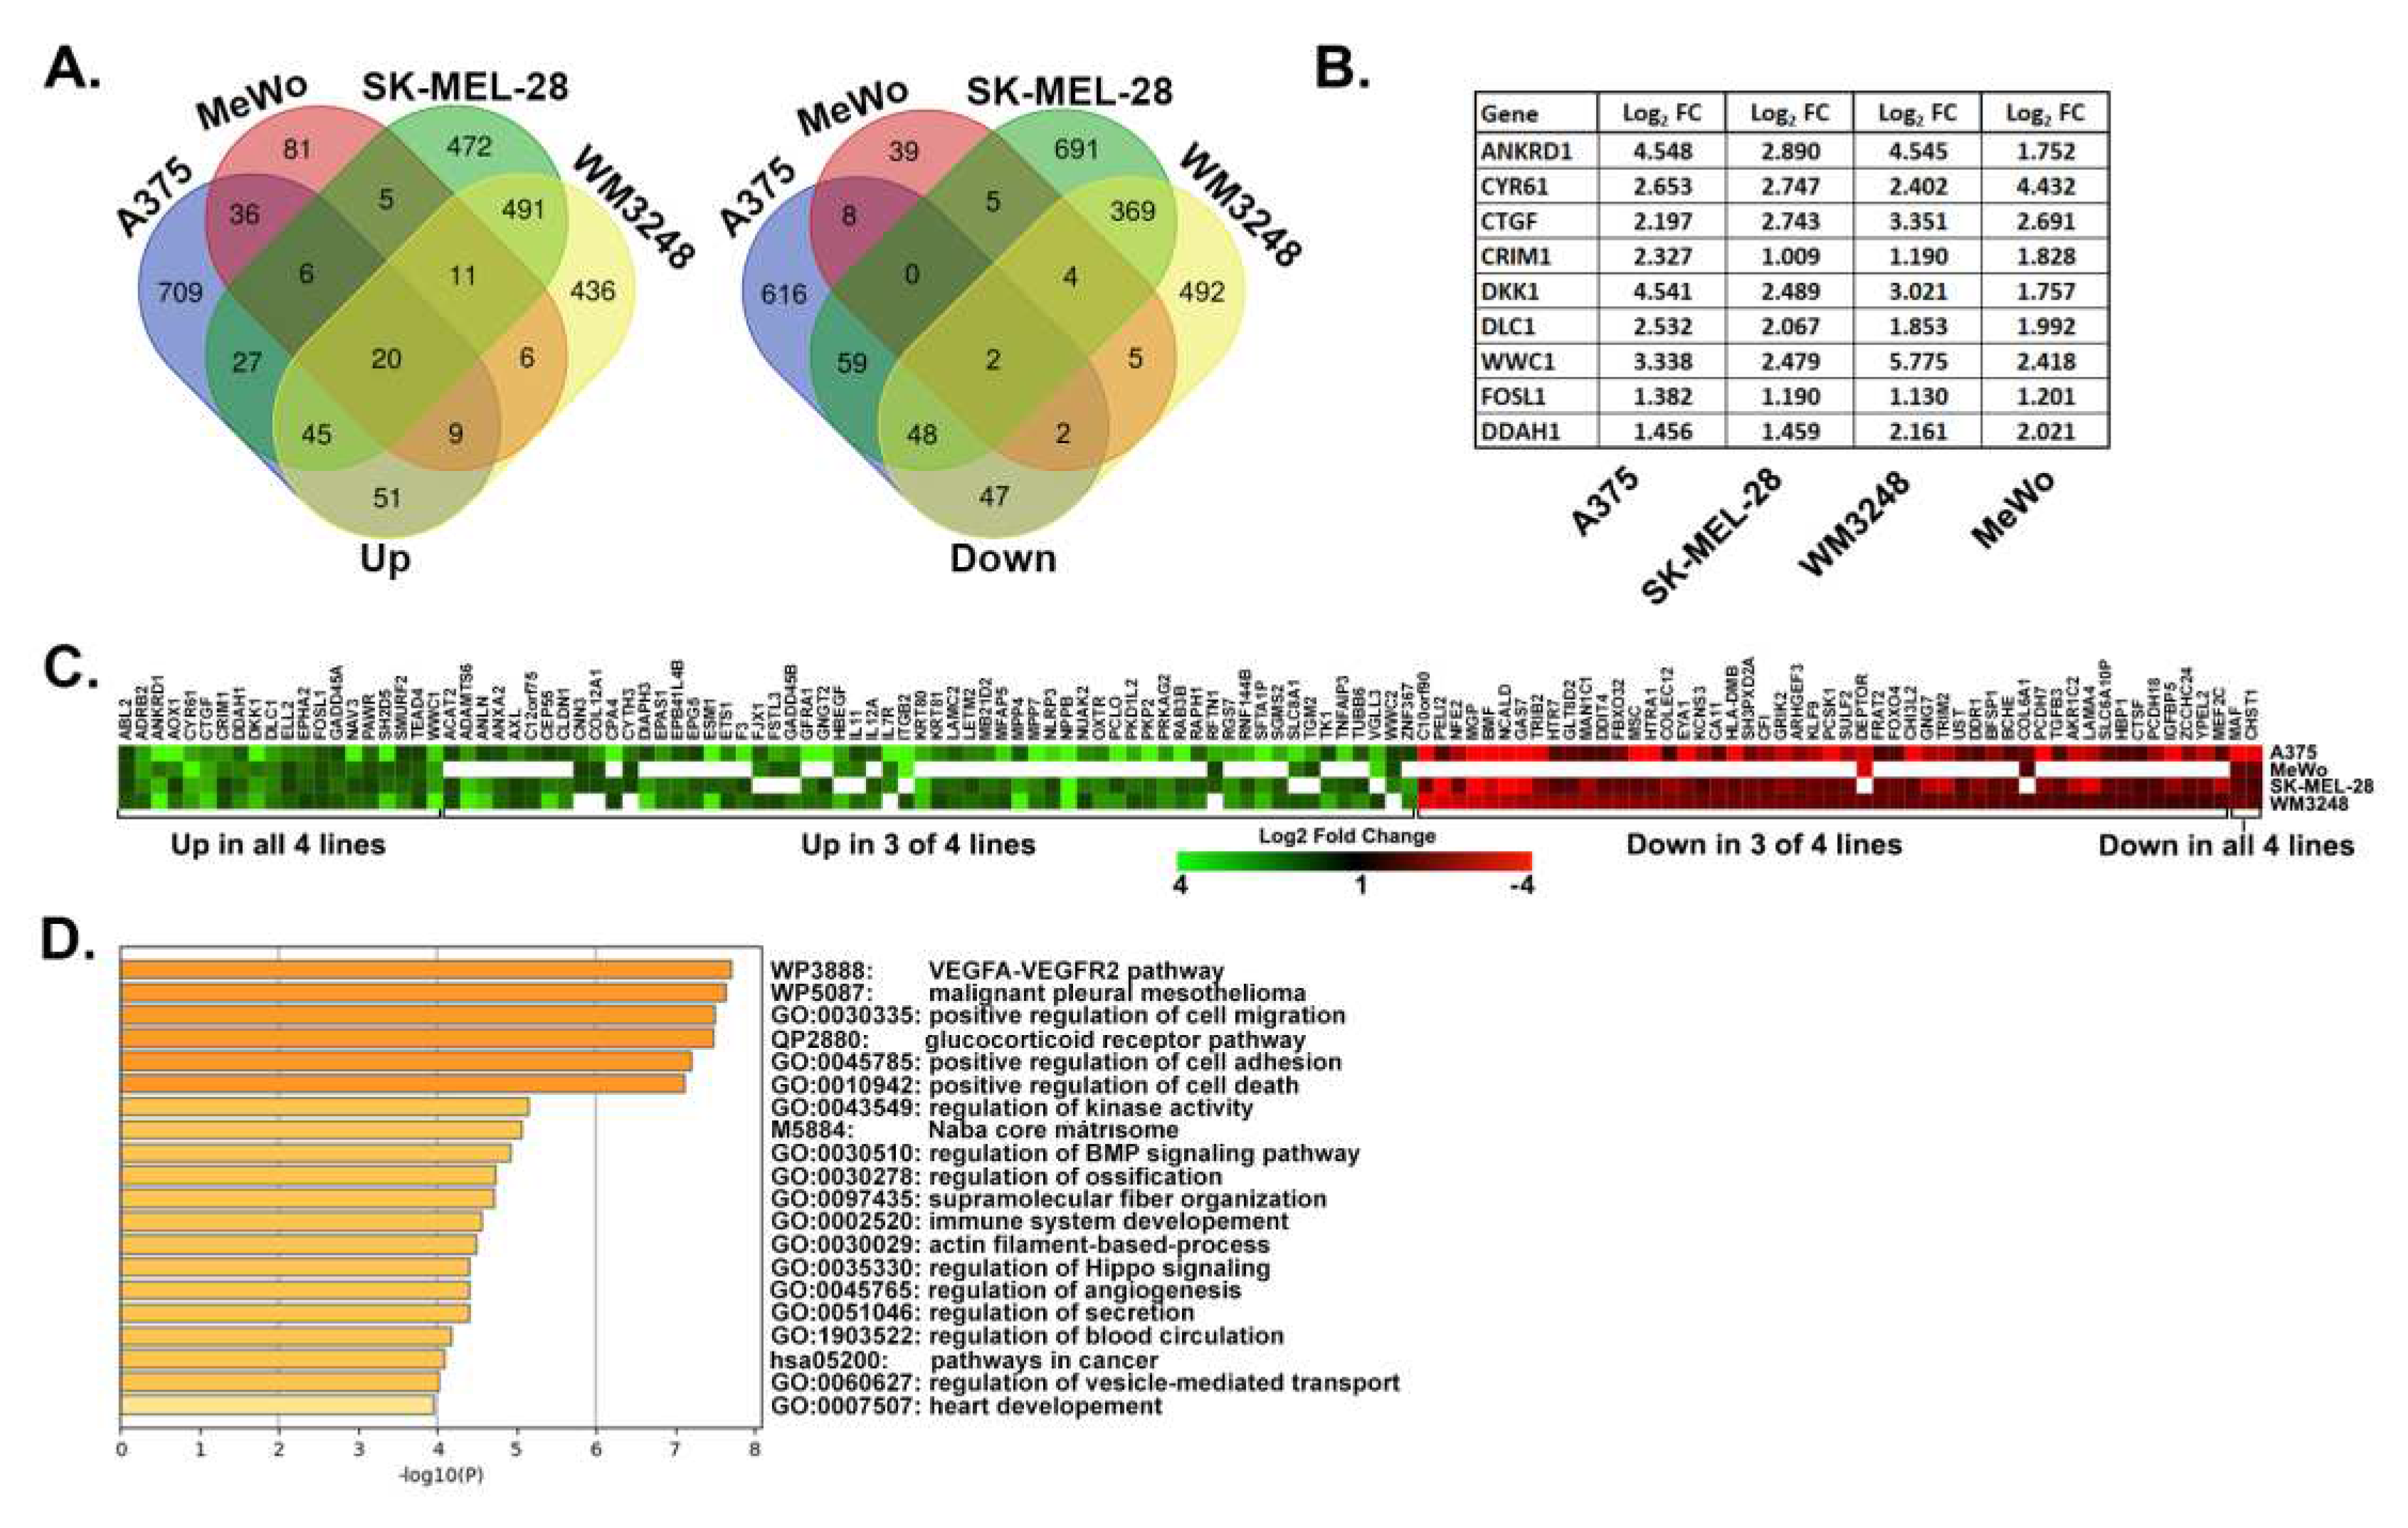
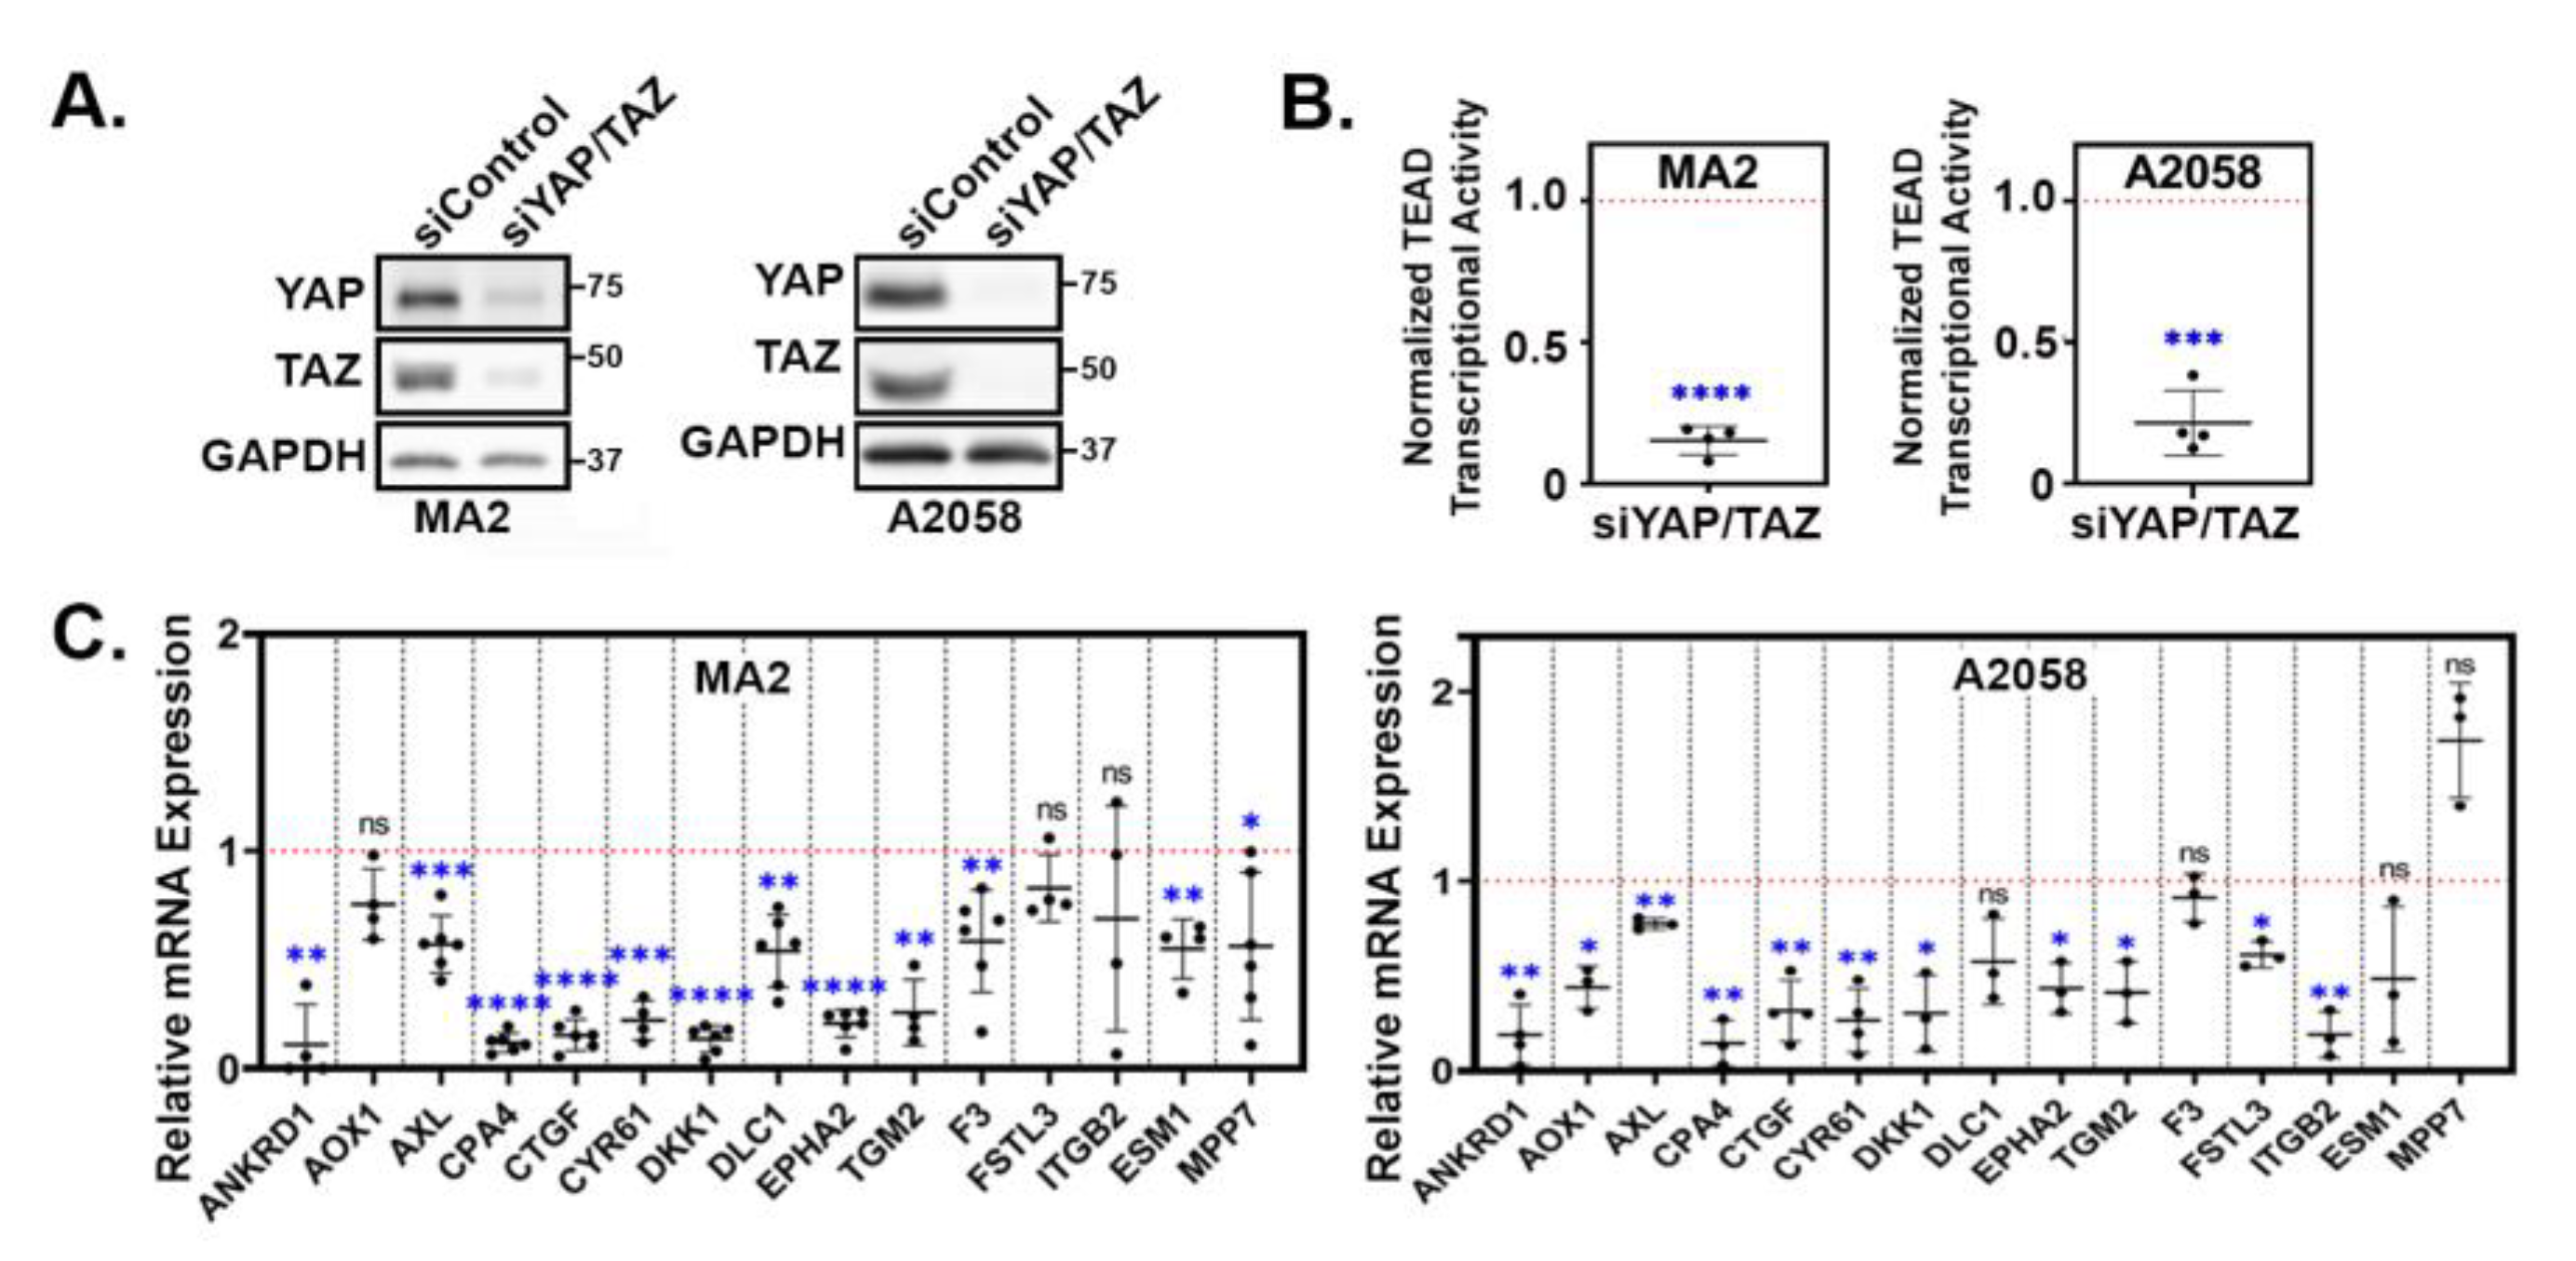
3.2. YAP/TAZ signature genes are TEAD-dependent.
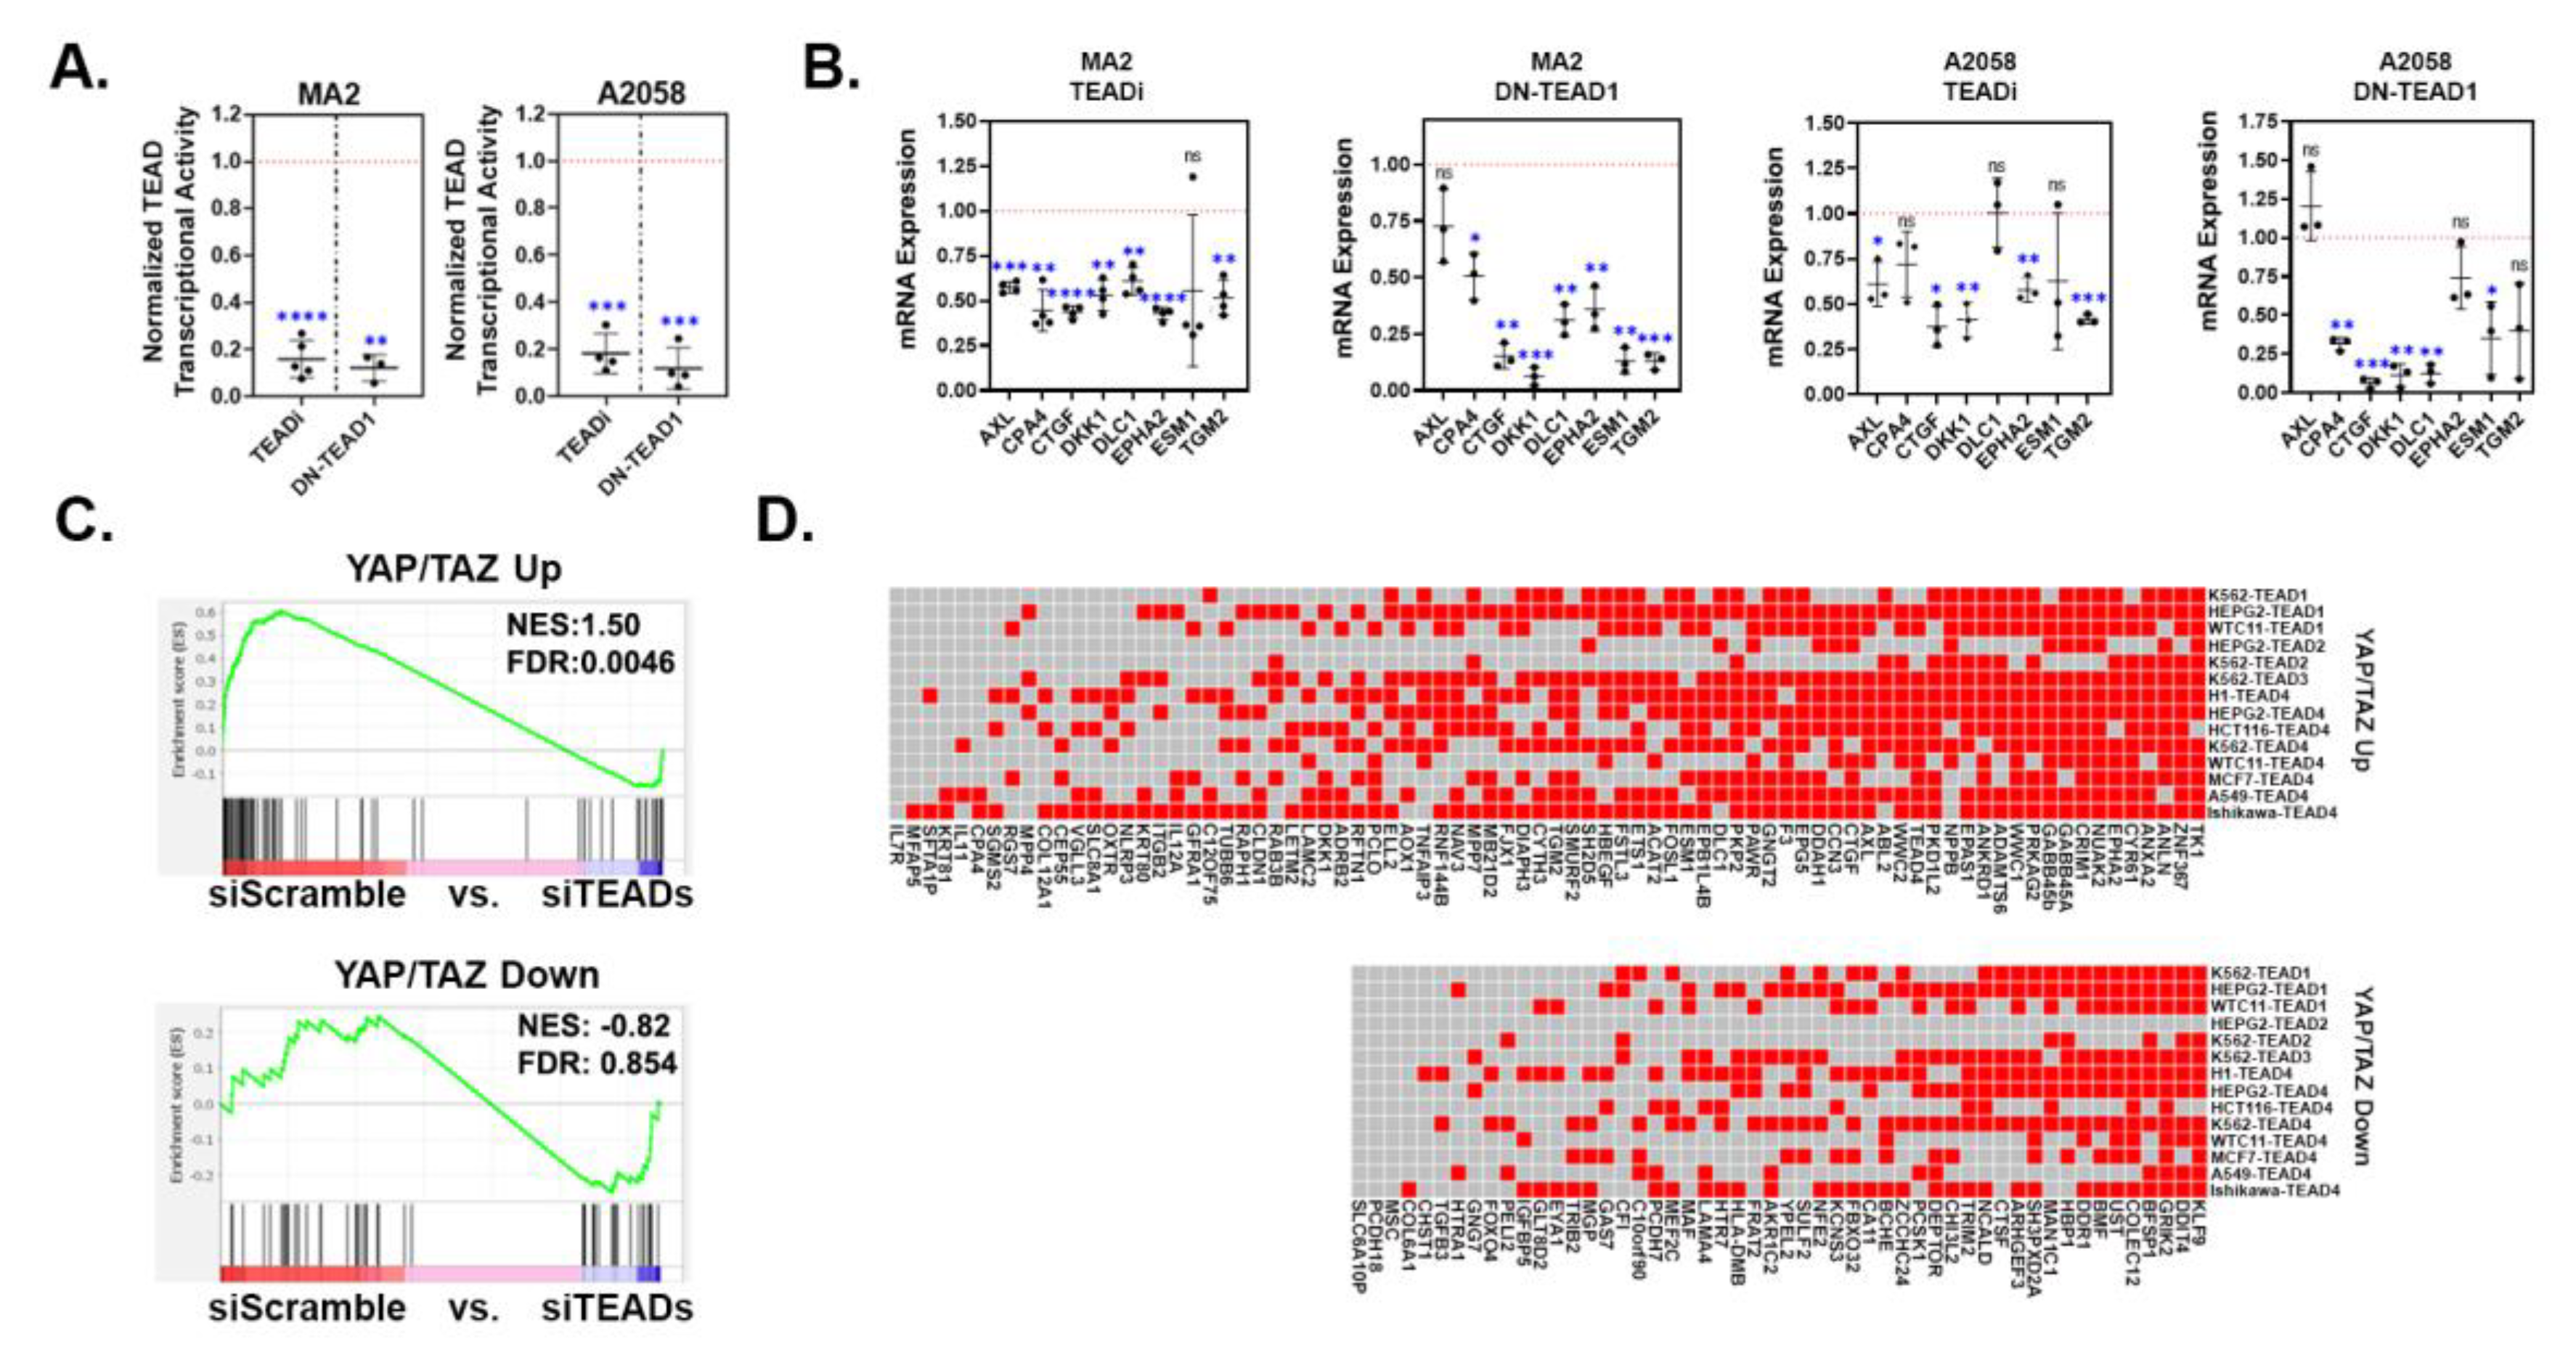
3.3. Upregulated YAP/TAZ signature genes are predictive of cancer cell dependency upon YAP/TAZ-TEAD.
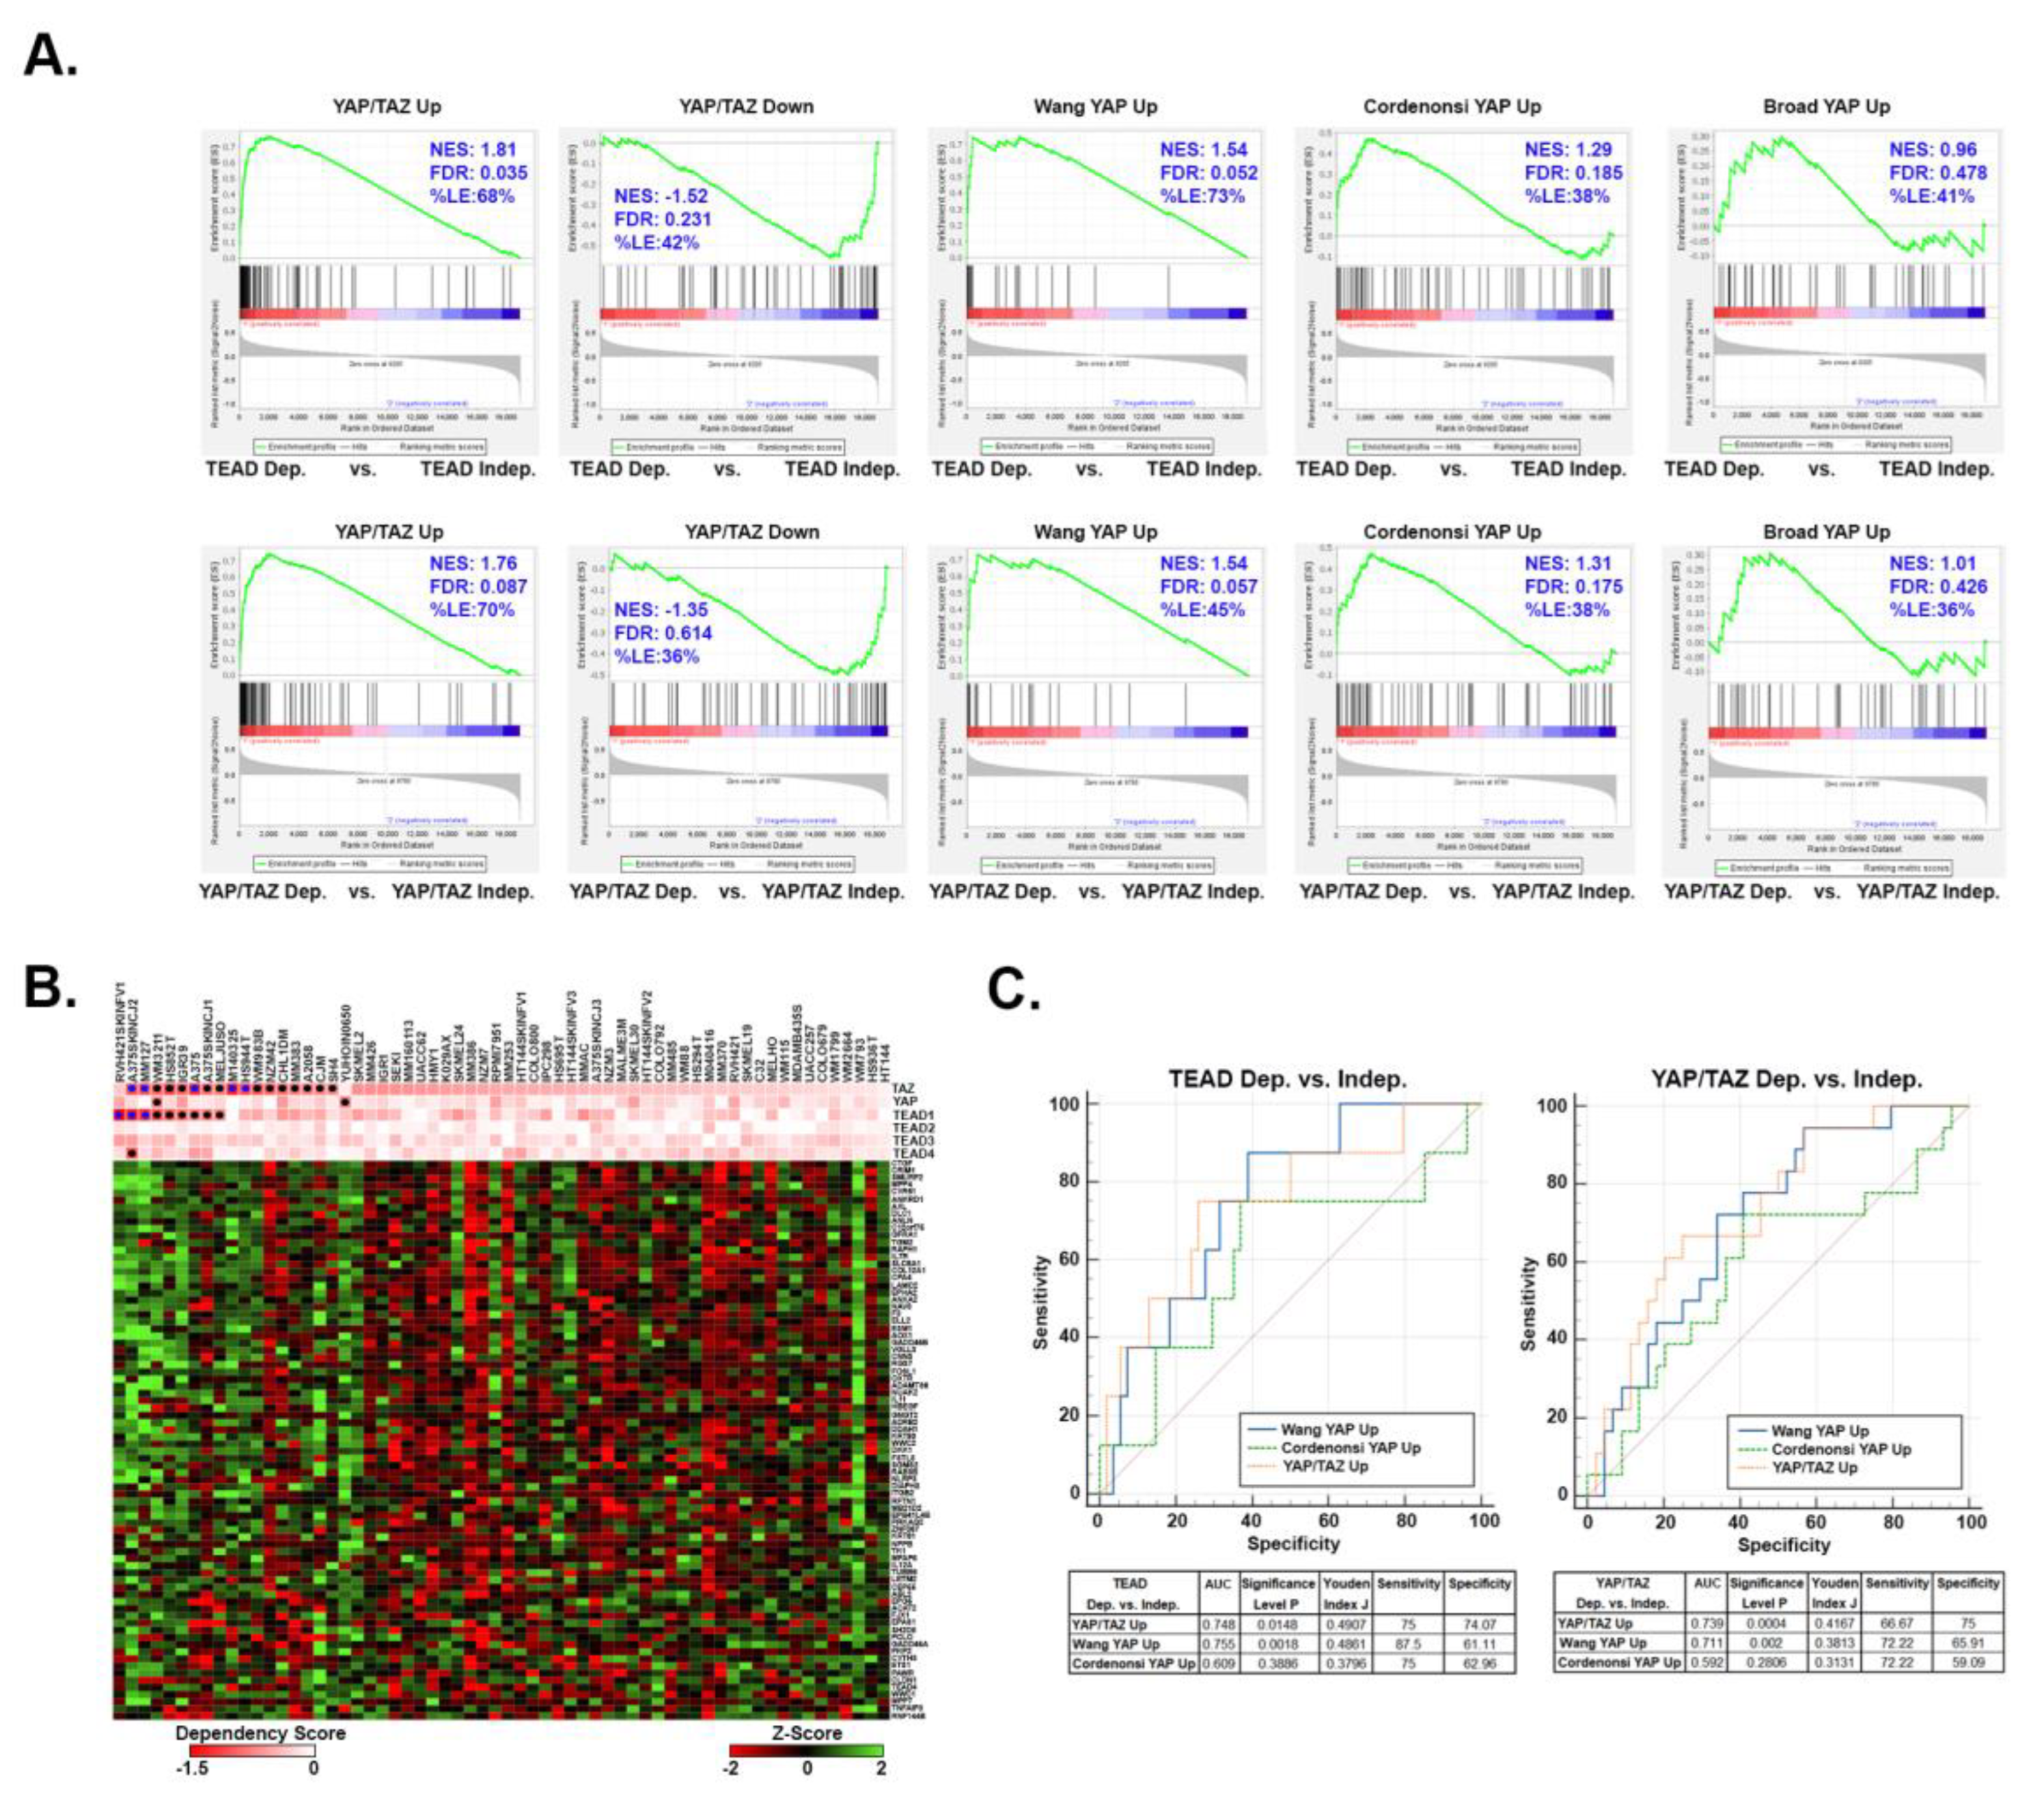
3.4. Upregulated YAP/TAZ signature genes strongly correlate with YAP/TAZ activation in human melanomas.
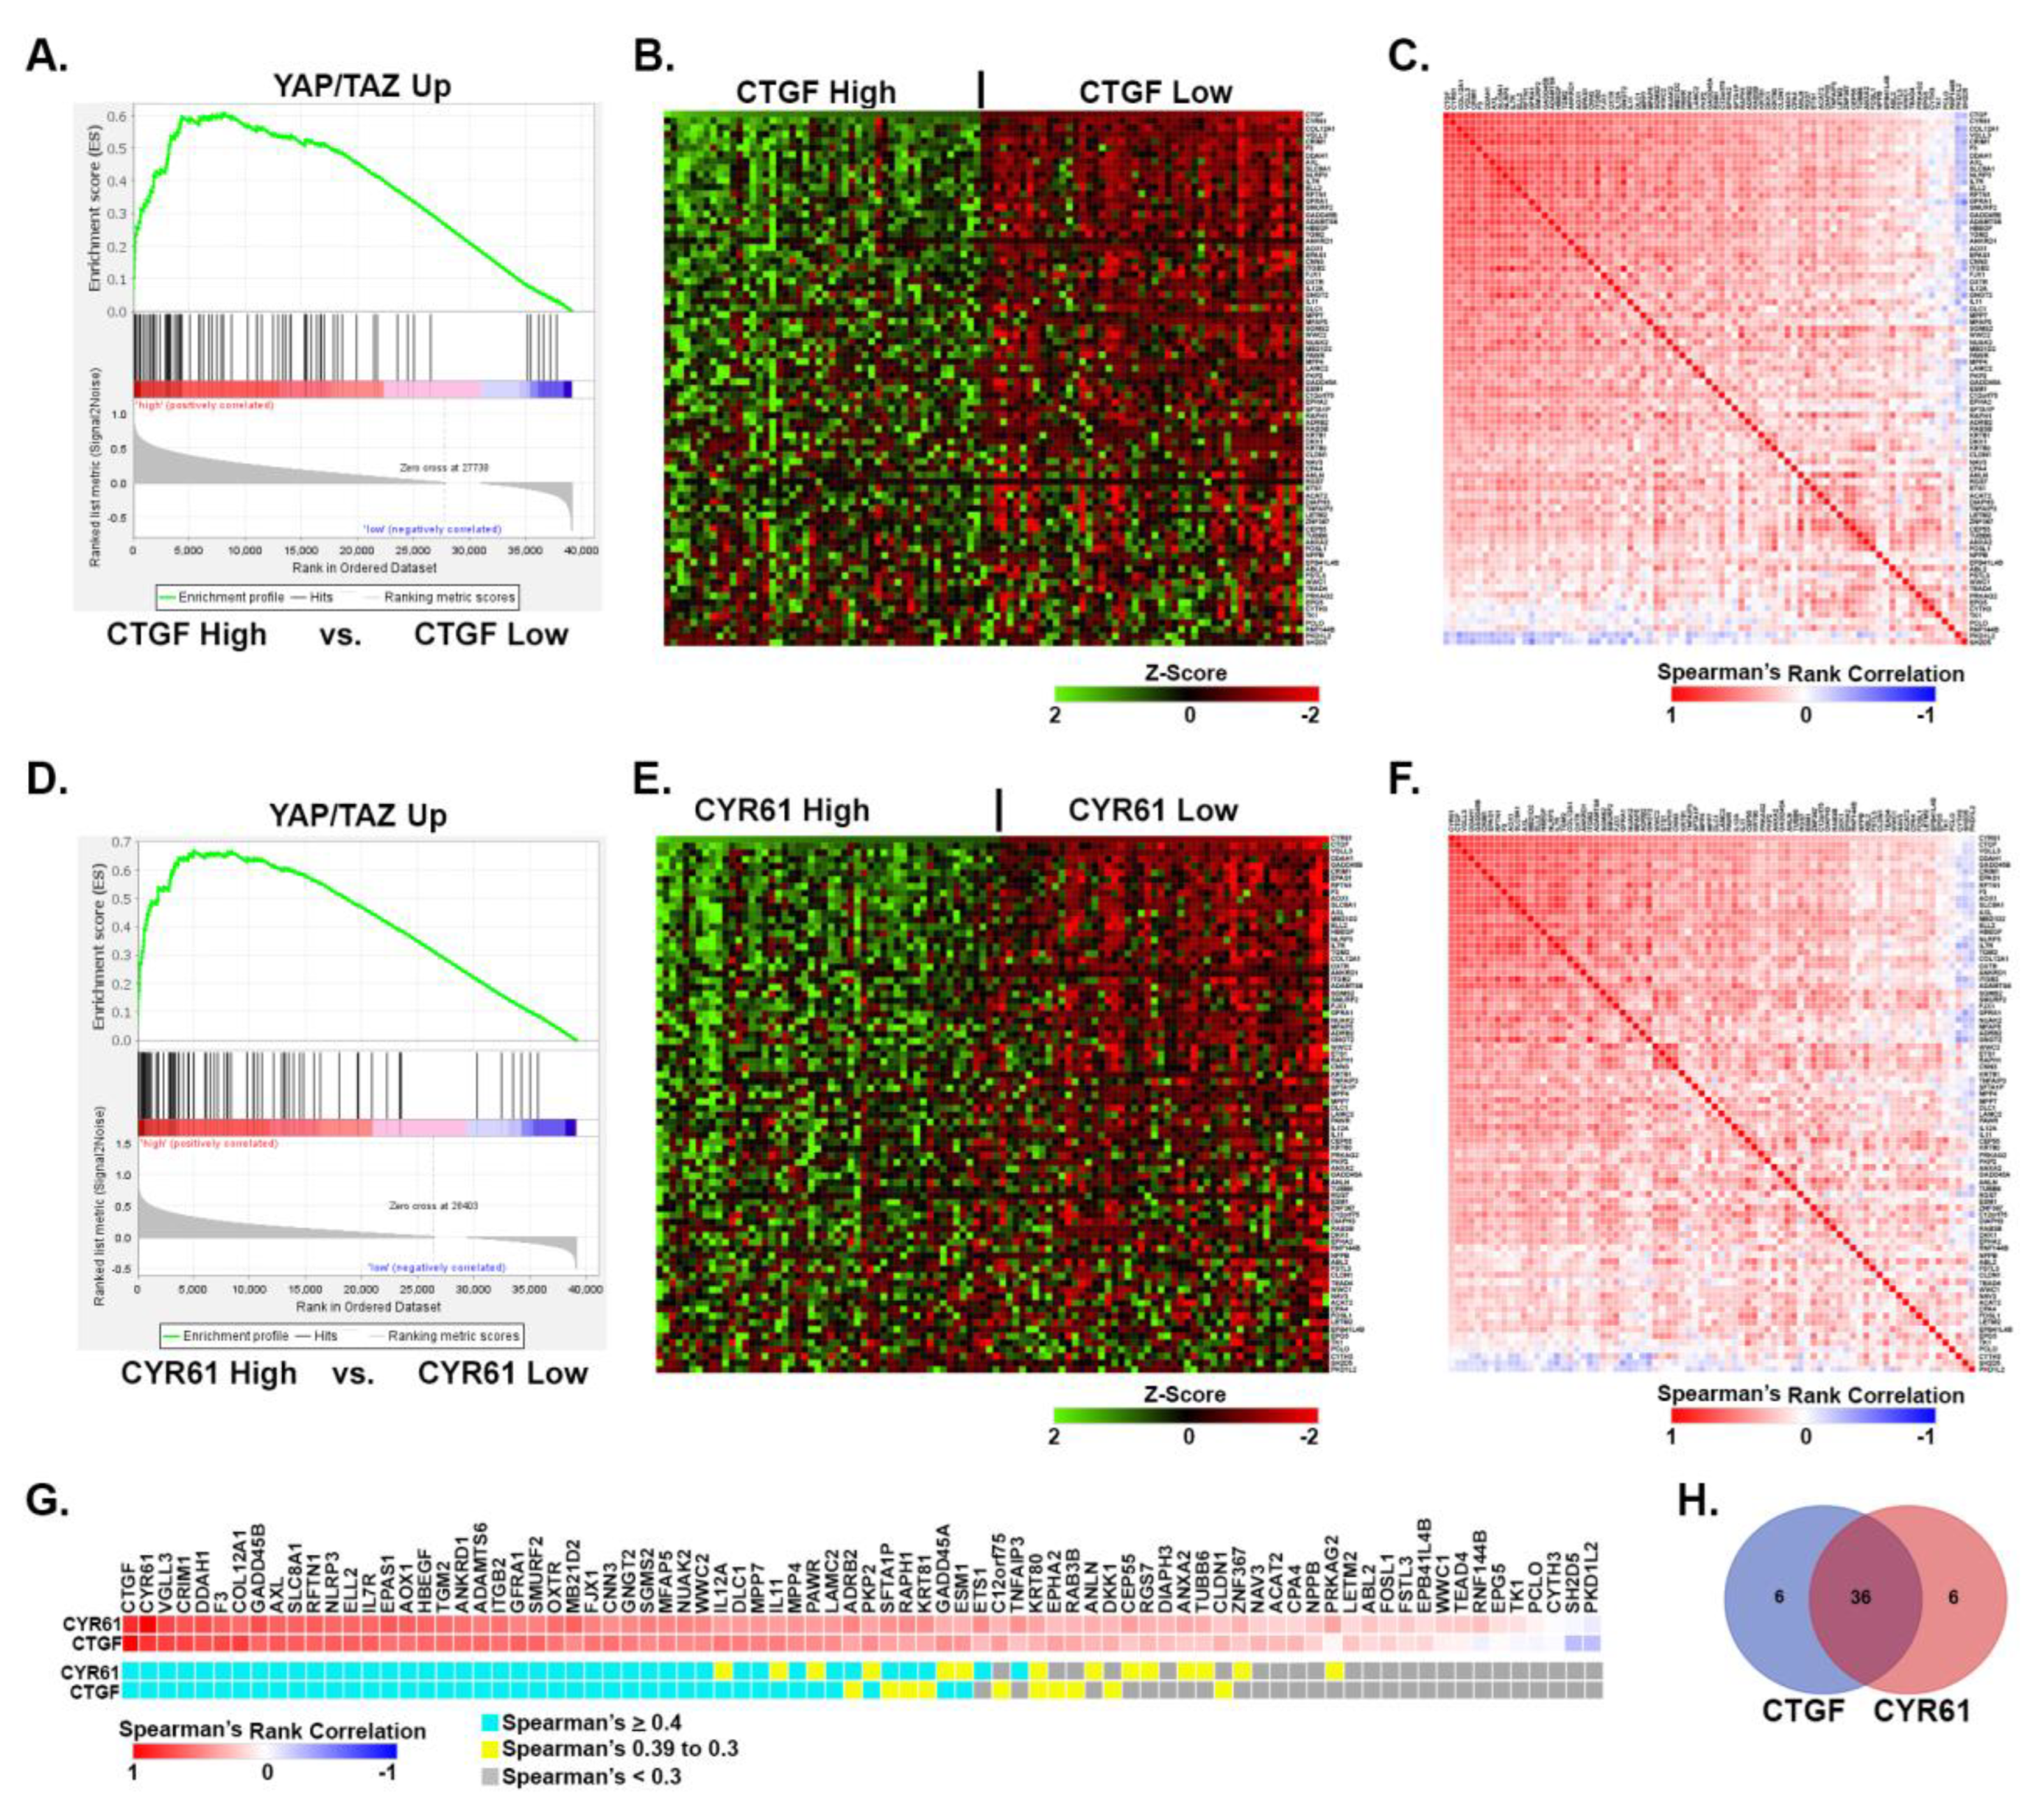
3.5. YAP/TAZ signature genes are predictive of dependence upon YAP/TAZ-TEAD in other cancer types.
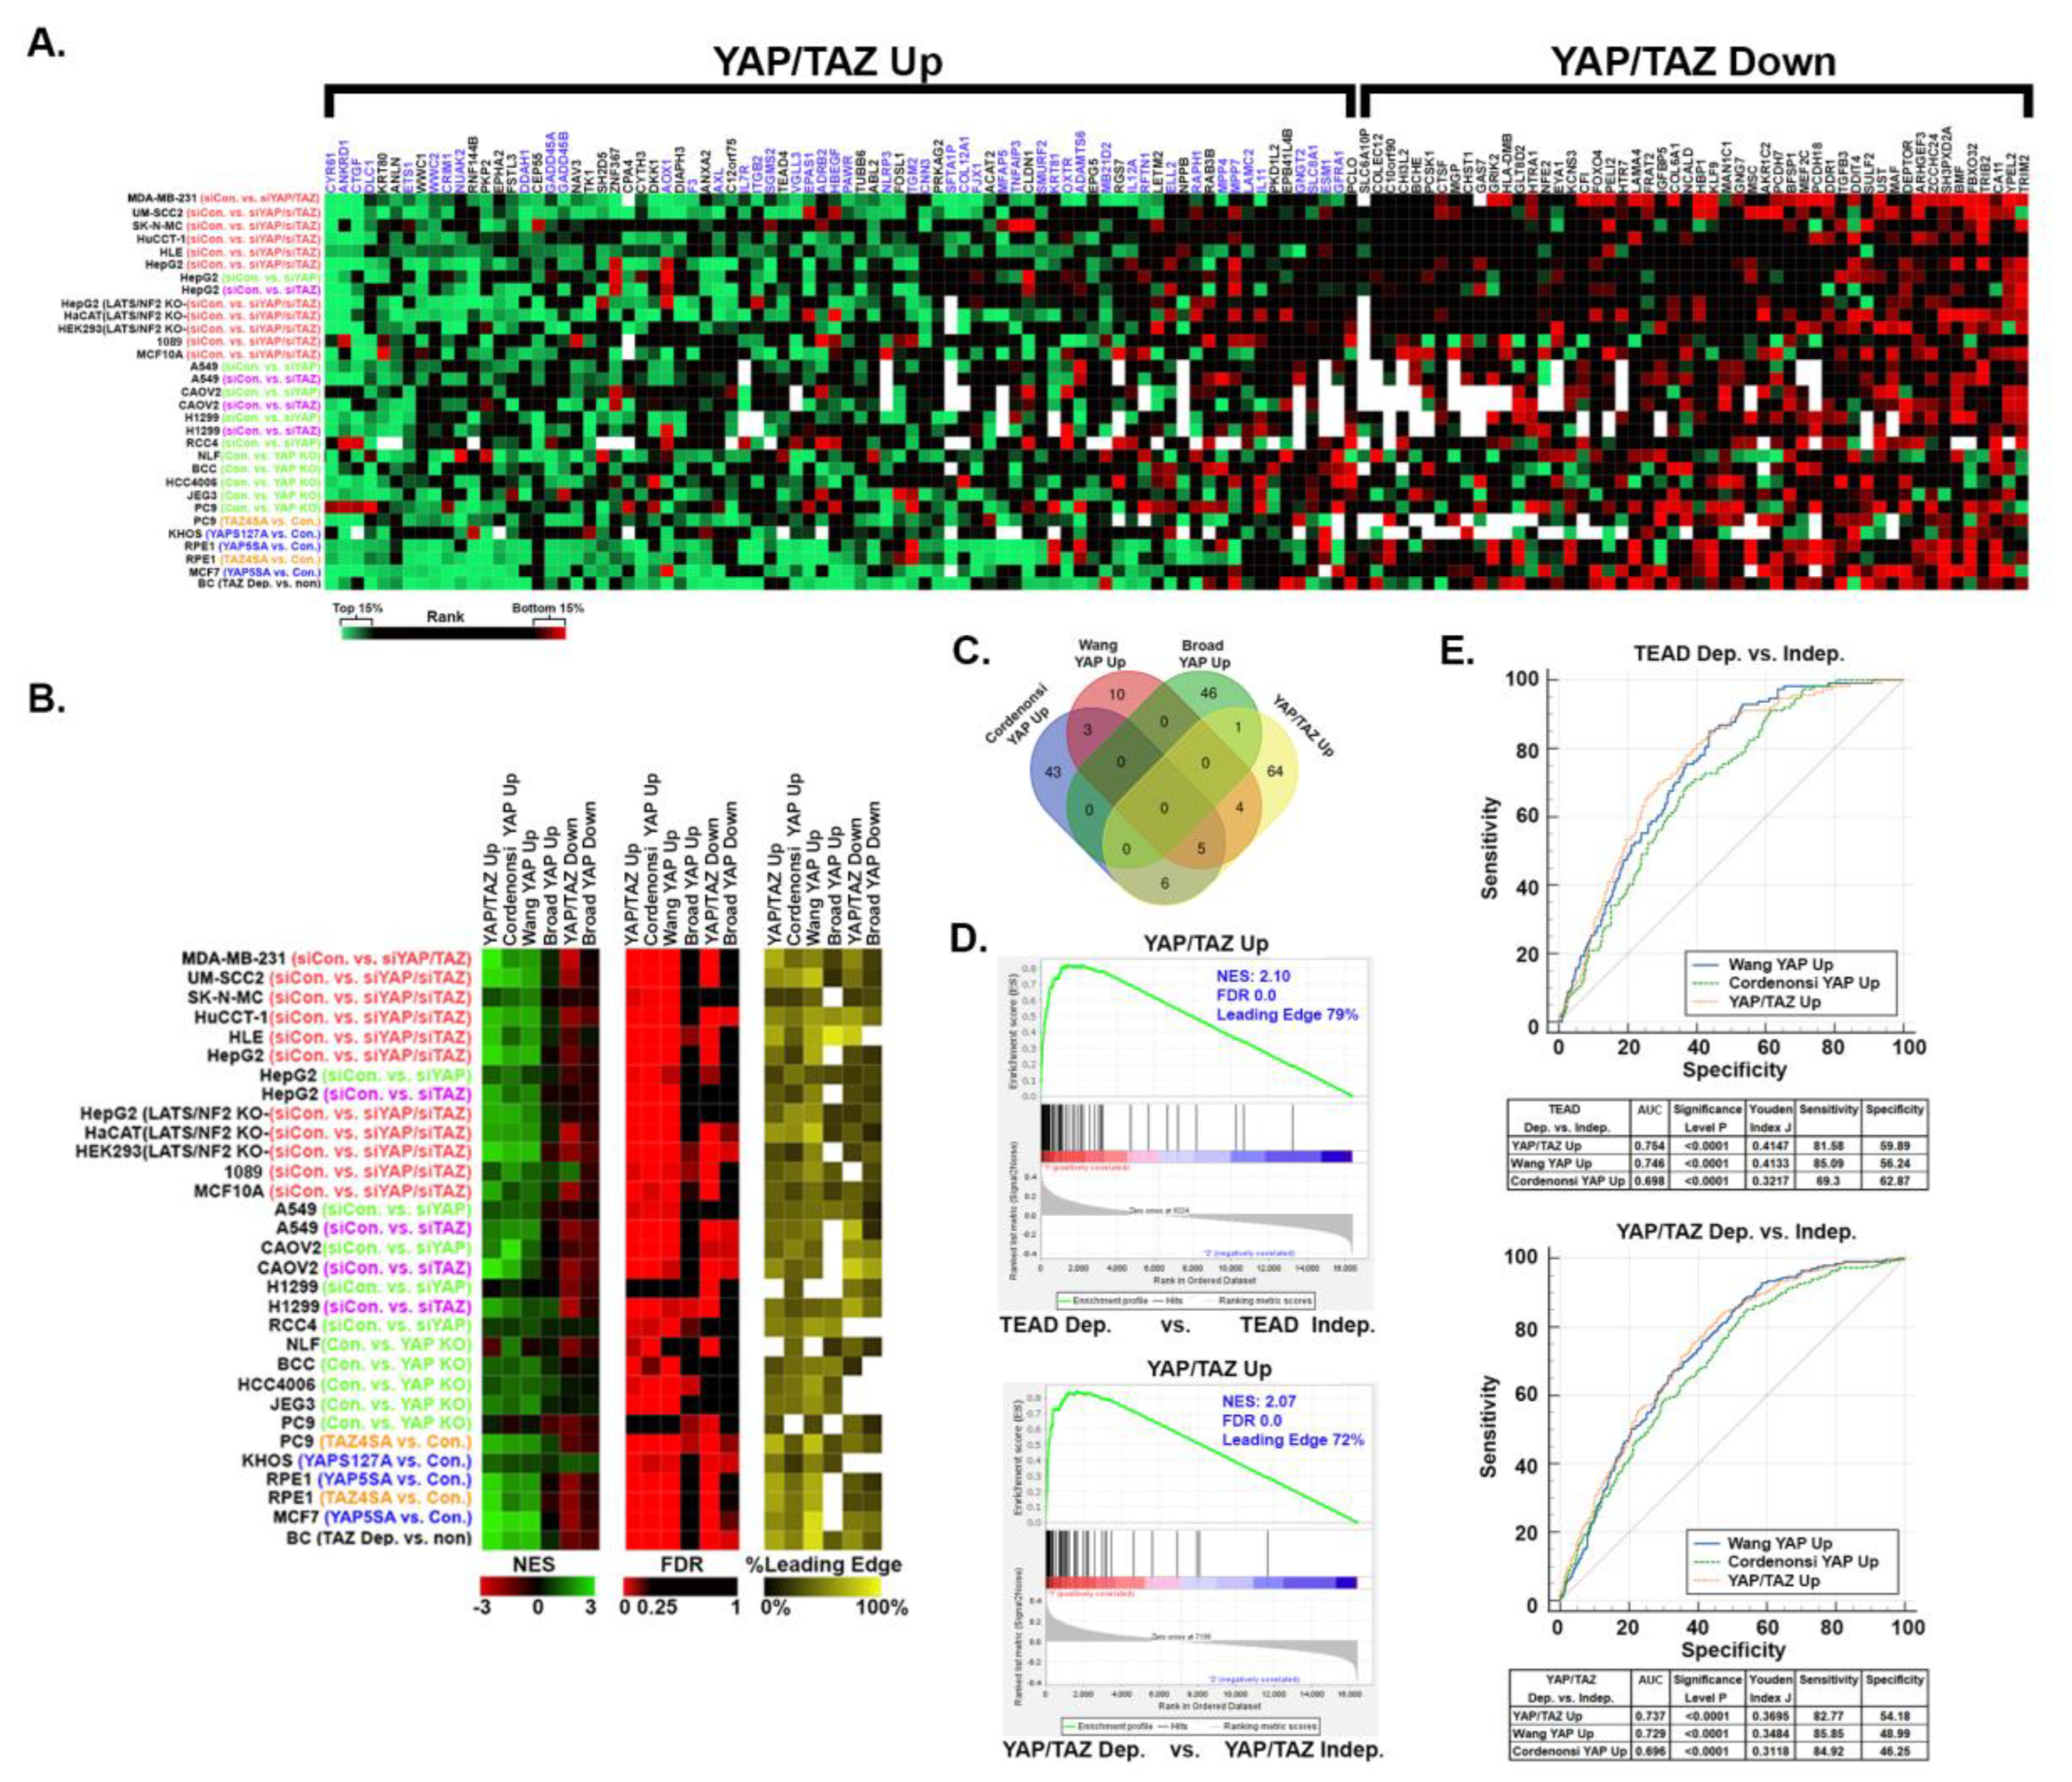
4. Discussion
4.1. A YAP/TAZ gene signature that predicts dependence upon YAP, TAZ, and TEADs
4.2. The complexity of YAP/TAZ-TEAD dependent gene expression in cancer cells
5. Conclusions
Supplementary Materials
Author Contributions
Funding
Institutional Review Board Statement
Informed Consent Statement
Data Availability Statement
Acknowledgments
Conflicts of Interest
References
- Zhang, X.; Yang, L.; Szeto, P.; Abali, G.K.; Zhang, Y.; Kulkarni, A.; Amarasinghe, K.; Li, J.; Vergara, I.A.; Molania, R.; et al. The Hippo pathway oncoprotein YAP promotes melanoma cell invasion and spontaneous metastasis. Oncogene 2020, 39, 5267–5281. [Google Scholar] [CrossRef] [PubMed]
- Zhou, Y.; Zhou, B.; Pache, L.; Chang, M.; Khodabakhshi, A.H.; Tanaseichuk, O.; Benner, C.; Chanda, S.K. Metascape provides a biologist-oriented resource for the analysis of systems-level datasets. Nat Commun 2019, 10, 1523. [Google Scholar] [CrossRef] [PubMed]
- Verfaillie, A.; Imrichova, H.; Atak, Z.K.; Dewaele, M.; Rambow, F.; Hulselmans, G.; Christiaens, V.; Svetlichnyy, D.; Luciani, F.; Van den Mooter, L.; et al. Decoding the regulatory landscape of melanoma reveals TEADS as regulators of the invasive cell state. Nat Commun 2015, 6, 6683. [Google Scholar] [CrossRef] [PubMed]
- Piccolo, S.; Panciera, T.; Contessotto, P.; Cordenonsi, M. YAP/TAZ as master regulators in cancer: modulation, function and therapeutic approaches. Nat Cancer 2023, 4, 9–26. [Google Scholar] [CrossRef] [PubMed]
- Zanconato, F.; Cordenonsi, M.; Piccolo, S. YAP/TAZ at the Roots of Cancer. Cancer cell 2016, 29, 783–803. [Google Scholar] [CrossRef] [PubMed]
- Janse van Rensburg, H.J.; Yang, X. The roles of the Hippo pathway in cancer metastasis. Cell Signal 2016, 28, 1761–1772. [Google Scholar] [CrossRef] [PubMed]
- Thompson, B.J. YAP/TAZ: Drivers of Tumor Growth, Metastasis, and Resistance to Therapy. Bioessays 2020, 42, e1900162. [Google Scholar] [CrossRef]
- Zhang, X.; Tang, J.Z.; Vergara, I.A.; Zhang, Y.; Szeto, P.; Yang, L.; Mintoff, C.; Colebatch, A.; McIntosh, L.; Mitchell, K.A.; et al. Somatic Hypermutation of the YAP Oncogene in a Human Cutaneous Melanoma. Mol Cancer Res 2019, 17, 1435–1449. [Google Scholar] [CrossRef]
- Nallet-Staub, F.; Marsaud, V.; Li, L.; Gilbert, C.; Dodier, S.; Bataille, V.; Sudol, M.; Herlyn, M.; Mauviel, A. Pro-invasive activity of the Hippo pathway effectors YAP and TAZ in cutaneous melanoma. J Invest Dermatol 2014, 134, 123–132. [Google Scholar] [CrossRef]
- Feng, Q.; Guo, P.; Kang, S.; Zhao, F. High expression of TAZ/YAP promotes the progression of malignant melanoma and affects the postoperative survival of patients. Pharmazie 2018, 73, 662–665. [Google Scholar] [CrossRef]
- Warren, J.S.A.; Xiao, Y.; Lamar, J.M. YAP/TAZ Activation as a Target for Treating Metastatic Cancer. Cancers 2018, 10, 115. [Google Scholar] [CrossRef] [PubMed]
- Calses, P.C.; Crawford, J.J.; Lill, J.R.; Dey, A. Hippo Pathway in Cancer: Aberrant Regulation and Therapeutic Opportunities. Trends Cancer 2019, 5, 297–307. [Google Scholar] [CrossRef] [PubMed]
- Zhao, B.; Wei, X.; Li, W.; Udan, R.S.; Yang, Q.; Kim, J.; Xie, J.; Ikenoue, T.; Yu, J.; Li, L.; et al. Inactivation of YAP oncoprotein by the Hippo pathway is involved in cell contact inhibition and tissue growth control. Genes Dev 2007, 21, 2747–2761. [Google Scholar] [CrossRef] [PubMed]
- Lei, Q.Y.; Zhang, H.; Zhao, B.; Zha, Z.Y.; Bai, F.; Pei, X.H.; Zhao, S.; Xiong, Y.; Guan, K.L. TAZ promotes cell proliferation and epithelial-mesenchymal transition and is inhibited by the hippo pathway. Mol Cell Biol 2008, 28, 2426–2436. [Google Scholar] [CrossRef] [PubMed]
- Liu, C.Y.; Zha, Z.Y.; Zhou, X.; Zhang, H.; Huang, W.; Zhao, D.; Li, T.; Chan, S.W.; Lim, C.J.; Hong, W.; et al. The hippo tumor pathway promotes TAZ degradation by phosphorylating a phosphodegron and recruiting the SCFbeta-TrCP E3 ligase. J Biol Chem 2010, 285, 37159–37169. [Google Scholar] [CrossRef] [PubMed]
- Zhao, B.; Li, L.; Tumaneng, K.; Wang, C.Y.; Guan, K.L. A coordinated phosphorylation by Lats and CK1 regulates YAP stability through SCF(beta-TRCP). Genes Dev 2010, 24, 72–85. [Google Scholar] [CrossRef] [PubMed]
- Manning, S.A.; Kroeger, B.; Harvey, K.F. The regulation of Yorkie, YAP and TAZ: new insights into the Hippo pathway. Development 2020, 147. [Google Scholar] [CrossRef] [PubMed]
- Zheng, Y.; Pan, D. The Hippo Signaling Pathway in Development and Disease. Dev Cell 2019, 50, 264–282. [Google Scholar] [CrossRef]
- Pocaterra, A.; Romani, P.; Dupont, S. YAP/TAZ functions and their regulation at a glance. J Cell Sci 2020, 133. [Google Scholar] [CrossRef]
- Kim, M.K.; Jang, J.W.; Bae, S.C. DNA binding partners of YAP/TAZ. BMB Rep 2018, 51, 126–133. [Google Scholar] [CrossRef]
- Holden, J.K.; Cunningham, C.N. Targeting the Hippo Pathway and Cancer through the TEAD Family of Transcription Factors. Cancers 2018, 10, 81. [Google Scholar] [CrossRef] [PubMed]
- Pobbati, A.V.; Kumar, R.; Rubin, B.P.; Hong, W. Therapeutic targeting of TEAD transcription factors in cancer. Trends Biochem Sci 2023, 48, 450–462. [Google Scholar] [CrossRef] [PubMed]
- Barry, E.R.; Simov, V.; Valtingojer, I.; Venier, O. Recent Therapeutic Approaches to Modulate the Hippo Pathway in Oncology and Regenerative Medicine. Cells 2021, 10. [Google Scholar] [CrossRef]
- Sekido, Y.; Sato, T. NF2 alteration in mesothelioma. Front Toxicol 2023, 5, 1161995. [Google Scholar] [CrossRef] [PubMed]
- Feng, X.; Degese, M.S.; Iglesias-Bartolome, R.; Vaque, J.P.; Molinolo, A.A.; Rodrigues, M.; Zaidi, M.R.; Ksander, B.R.; Merlino, G.; Sodhi, A.; et al. Hippo-independent activation of YAP by the GNAQ uveal melanoma oncogene through a trio-regulated rho GTPase signaling circuitry. Cancer cell 2014, 25, 831–845. [Google Scholar] [CrossRef] [PubMed]
- Seavey, C.N.; Pobbati, A.V.; Rubin, B.P. Unraveling the Biology of Epithelioid Hemangioendothelioma, a TAZ-CAMTA1 Fusion Driven Sarcoma. Cancers (Basel) 2022, 14. [Google Scholar] [CrossRef] [PubMed]
- Seavey, C.N.; Pobbati, A.V.; Hallett, A.; Ma, S.; Reynolds, J.P.; Kanai, R.; Lamar, J.M.; Rubin, B.P. WWTR1(TAZ)-CAMTA1 gene fusion is sufficient to dysregulate YAP/TAZ signaling and drive epithelioid hemangioendothelioma tumorigenesis. Genes Dev 2021, 35, 512–527. [Google Scholar] [CrossRef]
- Lamar, J.M.; Motilal Nehru, V.; Weinberg, G. Epithelioid Hemangioendothelioma as a Model of YAP/TAZ-Driven Cancer: Insights from a Rare Fusion Sarcoma. Cancers (Basel) 2018, 10. [Google Scholar] [CrossRef]
- Szulzewsky, F.; Holland, E.C.; Vasioukhin, V. YAP1 and its fusion proteins in cancer initiation, progression and therapeutic resistance. Dev Biol 2021, 475, 205–221. [Google Scholar] [CrossRef]
- Xu, L.; Begum, S.; Hearn, J.D.; Hynes, R.O. GPR56, an atypical G protein-coupled receptor, binds tissue transglutaminase, TG2, and inhibits melanoma tumor growth and metastasis. Proc Natl Acad Sci U S A 2006, 103, 9023–9028. [Google Scholar] [CrossRef]
- Lamar, J.M.; Xiao, Y.; Norton, E.; Jiang, Z.G.; Gerhard, G.M.; Kooner, S.; Warren, J.S.A.; Hynes, R.O. SRC tyrosine kinase activates the YAP/TAZ axis and thereby drives tumor growth and metastasis. J Biol Chem 2019, 294, 2302–2317. [Google Scholar] [CrossRef] [PubMed]
- Mahoney, W.M., Jr.; Hong, J.H.; Yaffe, M.B.; Farrance, I.K. The transcriptional co-activator TAZ interacts differentially with transcriptional enhancer factor-1 (TEF-1) family members. Biochem J 2005, 388, 217–225. [Google Scholar] [CrossRef] [PubMed]
- Langmead, B.; Salzberg, S.L. Fast gapped-read alignment with Bowtie 2. Nat Methods 2012, 9, 357–359. [Google Scholar] [CrossRef]
- Trapnell, C.; Pachter, L.; Salzberg, S.L. TopHat: discovering splice junctions with RNA-Seq. Bioinformatics 2009, 25, 1105–1111. [Google Scholar] [CrossRef] [PubMed]
- Trapnell, C.; Roberts, A.; Goff, L.; Pertea, G.; Kim, D.; Kelley, D.R.; Pimentel, H.; Salzberg, S.L.; Rinn, J.L.; Pachter, L. Differential gene and transcript expression analysis of RNA-seq experiments with TopHat and Cufflinks. Nat Protoc 2012, 7, 562–578. [Google Scholar] [CrossRef]
- Sloan, C.A.; Chan, E.T.; Davidson, J.M.; Malladi, V.S.; Strattan, J.S.; Hitz, B.C.; Gabdank, I.; Narayanan, A.K.; Ho, M.; Lee, B.T.; et al. ENCODE data at the ENCODE portal. Nucleic Acids Res 2016, 44, D726–732. [Google Scholar] [CrossRef] [PubMed]
- Subramanian, A.; Tamayo, P.; Mootha, V.K.; Mukherjee, S.; Ebert, B.L.; Gillette, M.A.; Paulovich, A.; Pomeroy, S.L.; Golub, T.R.; Lander, E.S.; et al. Gene set enrichment analysis: a knowledge-based approach for interpreting genome-wide expression profiles. Proc Natl Acad Sci U S A 2005, 102, 15545–15550. [Google Scholar] [CrossRef]
- Mootha, V.K.; Lindgren, C.M.; Eriksson, K.F.; Subramanian, A.; Sihag, S.; Lehar, J.; Puigserver, P.; Carlsson, E.; Ridderstrale, M.; Laurila, E.; et al. PGC-1alpha-responsive genes involved in oxidative phosphorylation are coordinately downregulated in human diabetes. Nat Genet 2003, 34, 267–273. [Google Scholar] [CrossRef]
- Yu, G.; Wang, L.G.; He, Q.Y. ChIPseeker: an R/Bioconductor package for ChIP peak annotation, comparison and visualization. Bioinformatics 2015, 31, 2382–2383. [Google Scholar] [CrossRef]
- Hanzelmann, S.; Castelo, R.; Guinney, J. GSVA: gene set variation analysis for microarray and RNA-seq data. BMC Bioinformatics 2013, 14, 7. [Google Scholar] [CrossRef]
- Lamar, J.M.; Stern, P.; Liu, H.; Schindler, J.W.; Jiang, Z.G.; Hynes, R.O. The Hippo pathway target, YAP, promotes metastasis through its TEAD-interaction domain. Proc Natl Acad Sci U S A 2012, 109, E2441–2450. [Google Scholar] [CrossRef] [PubMed]
- Kim, M.H.; Kim, J.; Hong, H.; Lee, S.H.; Lee, J.K.; Jung, E.; Kim, J. Actin remodeling confers BRAF inhibitor resistance to melanoma cells through YAP/TAZ activation. EMBO J 2016, 35, 462–478. [Google Scholar] [CrossRef] [PubMed]
- Kitagawa, M. A Sveinsson's chorioretinal atrophy-associated missense mutation in mouse Tead1 affects its interaction with the co-factors YAP and TAZ. Biochem Biophys Res Commun 2007, 361, 1022–1026. [Google Scholar] [CrossRef] [PubMed]
- Yuan, Y.; Park, J.; Feng, A.; Awasthi, P.; Wang, Z.; Chen, Q.; Iglesias-Bartolome, R. YAP1/TAZ-TEAD transcriptional networks maintain skin homeostasis by regulating cell proliferation and limiting KLF4 activity. Nat Commun 2020, 11, 1472. [Google Scholar] [CrossRef] [PubMed]
- Cordenonsi, M.; Zanconato, F.; Azzolin, L.; Forcato, M.; Rosato, A.; Frasson, C.; Inui, M.; Montagner, M.; Parenti, A.R.; Poletti, A.; et al. The Hippo transducer TAZ confers cancer stem cell-related traits on breast cancer cells. Cell 2011, 147, 759–772. [Google Scholar] [CrossRef] [PubMed]
- Wang, Y.; Xu, X.; Maglic, D.; Dill, M.T.; Mojumdar, K.; Ng, P.K.; Jeong, K.J.; Tsang, Y.H.; Moreno, D.; Bhavana, V.H.; et al. Comprehensive Molecular Characterization of the Hippo Signaling Pathway in Cancer. Cell Rep 2018, 25, 1304–1317 e1305. [Google Scholar] [CrossRef] [PubMed]
- Zhang, J.; Smolen, G.A.; Haber, D.A. Negative regulation of YAP by LATS1 underscores evolutionary conservation of the Drosophila Hippo pathway. Cancer Res 2008, 68, 2789–2794. [Google Scholar] [CrossRef]
- Tang, T.T.; Konradi, A.W.; Feng, Y.; Peng, X.; Ma, M.; Li, J.; Yu, F.X.; Guan, K.L.; Post, L. Small Molecule Inhibitors of TEAD Auto-palmitoylation Selectively Inhibit Proliferation and Tumor Growth of NF2-deficient Mesothelioma. Mol Cancer Ther 2021, 20, 986–998. [Google Scholar] [CrossRef]
- Kaneda, A.; Seike, T.; Danjo, T.; Nakajima, T.; Otsubo, N.; Yamaguchi, D.; Tsuji, Y.; Hamaguchi, K.; Yasunaga, M.; Nishiya, Y.; et al. The novel potent TEAD inhibitor, K-975, inhibits YAP1/TAZ-TEAD protein-protein interactions and exerts an anti-tumor effect on malignant pleural mesothelioma. Am J Cancer Res 2020, 10, 4399–4415. [Google Scholar]
- Fan, M.; Lu, W.; Che, J.; Kwiatkowski, N.P.; Gao, Y.; Seo, H.S.; Ficarro, S.B.; Gokhale, P.C.; Liu, Y.; Geffken, E.A.; et al. Covalent disruptor of YAP-TEAD association suppresses defective Hippo signaling. Elife 2022, 11. [Google Scholar] [CrossRef]
- Hagenbeek, T.J.; Zbieg, J.R.; Hafner, M.; Mroue, R.; Lacap, J.A.; Sodir, N.M.; Noland, C.L.; Afghani, S.; Kishore, A.; Bhat, K.P.; et al. An allosteric pan-TEAD inhibitor blocks oncogenic YAP/TAZ signaling and overcomes KRAS G12C inhibitor resistance. Nat Cancer 2023. [CrossRef] [PubMed]
- Reggiani, F.; Gobbi, G.; Ciarrocchi, A.; Ambrosetti, D.C.; Sancisi, V. Multiple roles and context-specific mechanisms underlying YAP and TAZ-mediated resistance to anti-cancer therapy. Biochim Biophys Acta Rev Cancer 2020, 1873, 188341. [Google Scholar] [CrossRef] [PubMed]
- Nguyen, C.D.K.; Yi, C. YAP/TAZ Signaling and Resistance to Cancer Therapy. Trends Cancer 2019, 5, 283–296. [Google Scholar] [CrossRef] [PubMed]
- Lin, L.; Sabnis, A.J.; Chan, E.; Olivas, V.; Cade, L.; Pazarentzos, E.; Asthana, S.; Neel, D.; Yan, J.J.; Lu, X.; et al. The Hippo effector YAP promotes resistance to RAF- and MEK-targeted cancer therapies. Nat Genet 2015, 47, 250–256. [Google Scholar] [CrossRef] [PubMed]
- Song, S.; Honjo, S.; Jin, J.; Chang, S.S.; Scott, A.W.; Chen, Q.; Kalhor, N.; Correa, A.M.; Hofstetter, W.L.; Albarracin, C.T.; et al. The Hippo Coactivator YAP1 Mediates EGFR Overexpression and Confers Chemoresistance in Esophageal Cancer. Clin Cancer Res 2015, 21, 2580–2590. [Google Scholar] [CrossRef] [PubMed]
- Guo, L.; Zheng, J.; Zhang, J.; Wang, H.; Shao, G.; Teng, L. Knockdown of TAZ modifies triple-negative breast cancer cell sensitivity to EGFR inhibitors by regulating YAP expression. Oncol Rep 2016, 36, 729–736. [Google Scholar] [CrossRef] [PubMed]
- Edwards, A.C.; Stalnecker, C.A.; Jean Morales, A.; Taylor, K.E.; Klomp, J.E.; Klomp, J.A.; Waters, A.M.; Sudhakar, N.; Hallin, J.; Tang, T.T.; et al. TEAD Inhibition Overcomes YAP1/TAZ-Driven Primary and Acquired Resistance to KRASG12C Inhibitors. Cancer Res 2023, 83, 4112–4129. [Google Scholar] [CrossRef] [PubMed]
- Su, M.; Zhan, L.; Zhang, Y.; Zhang, J. Yes-activated protein promotes primary resistance of BRAF V600E mutant metastatic colorectal cancer cells to mitogen-activated protein kinase pathway inhibitors. J Gastrointest Oncol 2021, 12, 953–963. [Google Scholar] [CrossRef]
- Zhao, X.; Wang, X.; Fang, L.; Lan, C.; Zheng, X.; Wang, Y.; Zhang, Y.; Han, X.; Liu, S.; Cheng, K.; et al. A combinatorial strategy using YAP and pan-RAF inhibitors for treating KRAS-mutant pancreatic cancer. Cancer Lett 2017, 402, 61–70. [Google Scholar] [CrossRef]
- Mudianto, T.; Campbell, K.M.; Webb, J.; Zolkind, P.; Skidmore, Z.L.; Riley, R.; Barnell, E.K.; Ozgenc, I.; Giri, T.; Dunn, G.P.; et al. Yap1 Mediates Trametinib Resistance in Head and Neck Squamous Cell Carcinomas. Clin Cancer Res 2021, 27, 2326–2339. [Google Scholar] [CrossRef]
- Fisher, M.L.; Grun, D.; Adhikary, G.; Xu, W.; Eckert, R.L. Inhibition of YAP function overcomes BRAF inhibitor resistance in melanoma cancer stem cells. Oncotarget 2017, 8, 110257–110272. [Google Scholar] [CrossRef] [PubMed]
- Sun, Y.; Hu, L.; Tao, Z.; Jarugumilli, G.K.; Erb, H.; Singh, A.; Li, Q.; Cotton, J.L.; Greninger, P.; Egan, R.K.; et al. Pharmacological blockade of TEAD-YAP reveals its therapeutic limitation in cancer cells. Nat Commun 2022, 13, 6744. [Google Scholar] [CrossRef]
- Battilana, G.; Zanconato, F.; Piccolo, S. Mechanisms of YAP/TAZ transcriptional control. Cell Stress 2021, 5, 167–172. [Google Scholar] [CrossRef] [PubMed]
- Paul, S.; Xie, S.; Yao, X.; Dey, A. Transcriptional Regulation of the Hippo Pathway: Current Understanding and Insights from Single-Cell Technologies. Cells 2022, 11. [Google Scholar] [CrossRef] [PubMed]
- Hillmer, R.E.; Link, B.A. The Roles of Hippo Signaling Transducers Yap and Taz in Chromatin Remodeling. Cells 2019, 8. [Google Scholar] [CrossRef] [PubMed]
- Zhao, Y.; Sheldon, M.; Sun, Y.; Ma, L. New Insights into YAP/TAZ-TEAD-Mediated Gene Regulation and Biological Processes in Cancer. Cancers (Basel) 2023, 15. [Google Scholar] [CrossRef] [PubMed]
- Li, H.; Wang, Y.; Su, R.; Jia, Y.; Lai, X.; Su, H.; Fan, Y.; Wang, Y.; Xing, W.; Qin, J. Dimethyl Fumarate Combined With Vemurafenib Enhances Anti-Melanoma Efficacy via Inhibiting the Hippo/YAP, NRF2-ARE, and AKT/mTOR/ERK Pathways in A375 Melanoma Cells. Front Oncol 2022, 12, 794216. [Google Scholar] [CrossRef]
- Hoj, J.P.; Mayro, B.; Pendergast, A.M. A TAZ-AXL-ABL2 Feed-Forward Signaling Axis Promotes Lung Adenocarcinoma Brain Metastasis. Cell Rep 2019, 29, 3421–3434 e3428. [Google Scholar] [CrossRef]
- Liu, H.; Dai, X.; Cao, X.; Yan, H.; Ji, X.; Zhang, H.; Shen, S.; Si, Y.; Zhang, H.; Chen, J.; et al. PRDM4 mediates YAP-induced cell invasion by activating leukocyte-specific integrin beta2 expression. EMBO Rep 2018, 19. [Google Scholar] [CrossRef]
- Gill, M.K.; Christova, T.; Zhang, Y.Y.; Gregorieff, A.; Zhang, L.; Narimatsu, M.; Song, S.; Xiong, S.; Couzens, A.L.; Tong, J.; et al. A feed forward loop enforces YAP/TAZ signaling during tumorigenesis. Nat Commun 2018, 9, 3510. [Google Scholar] [CrossRef]
- Yuan, W.C.; Pepe-Mooney, B.; Galli, G.G.; Dill, M.T.; Huang, H.T.; Hao, M.; Wang, Y.; Liang, H.; Calogero, R.A.; Camargo, F.D. NUAK2 is a critical YAP target in liver cancer. Nat Commun 2018, 9, 4834. [Google Scholar] [CrossRef] [PubMed]
- Shen, Y.W.; Zhou, Y.D.; Chen, H.Z.; Luan, X.; Zhang, W.D. Targeting CTGF in Cancer: An Emerging Therapeutic Opportunity. Trends Cancer 2021, 7, 511–524. [Google Scholar] [CrossRef] [PubMed]
- Reya, T.; Duncan, A.W.; Ailles, L.; Domen, J.; Scherer, D.C.; Willert, K.; Hintz, L.; Nusse, R.; Weissman, I.L. A role for Wnt signalling in self-renewal of haematopoietic stem cells. Nature 2003, 423, 409–414. [Google Scholar] [CrossRef] [PubMed]
- Kulkarni, M.; Tan, T.Z.; Syed Sulaiman, N.B.; Lamar, J.M.; Bansal, P.; Cui, J.; Qiao, Y.; Ito, Y. RUNX1 and RUNX3 protect against YAP-mediated EMT, stem-ness and shorter survival outcomes in breast cancer. Oncotarget 2018, 9, 14175–14192. [Google Scholar] [CrossRef] [PubMed]
- Elster, D.; Tollot, M.; Schlegelmilch, K.; Ori, A.; Rosenwald, A.; Sahai, E.; von Eyss, B. TRPS1 shapes YAP/TEAD-dependent transcription in breast cancer cells. Nat Commun 2018, 9, 3115. [Google Scholar] [CrossRef] [PubMed]
- Enzo, E.; Santinon, G.; Pocaterra, A.; Aragona, M.; Bresolin, S.; Forcato, M.; Grifoni, D.; Pession, A.; Zanconato, F.; Guzzo, G.; et al. Aerobic glycolysis tunes YAP/TAZ transcriptional activity. EMBO J 2015, 34, 1349–1370. [Google Scholar] [CrossRef] [PubMed]
- Hiemer, S.E.; Zhang, L.; Kartha, V.K.; Packer, T.S.; Almershed, M.; Noonan, V.; Kukuruzinska, M.; Bais, M.V.; Monti, S.; Varelas, X. A YAP/TAZ-Regulated Molecular Signature Is Associated with Oral Squamous Cell Carcinoma. Mol Cancer Res 2015, 13, 957–968. [Google Scholar] [CrossRef]
- Toth, M.; Wehling, L.; Thiess, L.; Rose, F.; Schmitt, J.; Weiler, S.M.E.; Sticht, C.; De La Torre, C.; Rausch, M.; Albrecht, T.; et al. Co-expression of YAP and TAZ associates with chromosomal instability in human cholangiocarcinoma. BMC Cancer 2021, 21, 1079. [Google Scholar] [CrossRef]
- Gao, Y.; Xu, J.; Li, H.; Hu, Y.; Yu, G. Identification of Metastasis-Associated MicroRNAs in Metastatic Melanoma by miRNA Expression Profile and Experimental Validation. Front Genet 2021, 12, 663110. [Google Scholar] [CrossRef]
- Weiler, S.M.E.; Lutz, T.; Bissinger, M.; Sticht, C.; Knaub, M.; Gretz, N.; Schirmacher, P.; Breuhahn, K. TAZ target gene ITGAV regulates invasion and feeds back positively on YAP and TAZ in liver cancer cells. Cancer Lett 2020, 473, 164–175. [Google Scholar] [CrossRef]
- Mori, M.; Triboulet, R.; Mohseni, M.; Schlegelmilch, K.; Shrestha, K.; Camargo, F.D.; Gregory, R.I. Hippo signaling regulates microprocessor and links cell-density-dependent miRNA biogenesis to cancer. Cell 2014, 156, 893–906. [Google Scholar] [CrossRef] [PubMed]
- Shreberk-Shaked, M.; Dassa, B.; Sinha, S.; Di Agostino, S.; Azuri, I.; Mukherjee, S.; Aylon, Y.; Blandino, G.; Ruppin, E.; Oren, M. A Division of Labor between YAP and TAZ in Non-Small Cell Lung Cancer. Cancer Res 2020, 80, 4145–4157. [Google Scholar] [CrossRef] [PubMed]
- Yang, W.H.; Huang, Z.; Wu, J.; Ding, C.C.; Murphy, S.K.; Chi, J.T. A TAZ-ANGPTL4-NOX2 Axis Regulates Ferroptotic Cell Death and Chemoresistance in Epithelial Ovarian Cancer. Mol Cancer Res 2020, 18, 79–90. [Google Scholar] [CrossRef] [PubMed]
- Yang, W.H.; Lin, C.C.; Wu, J.; Chao, P.Y.; Chen, K.; Chen, P.H.; Chi, J.T. The Hippo Pathway Effector YAP Promotes Ferroptosis via the E3 Ligase SKP2. Mol Cancer Res 2021, 19, 1005–1014. [Google Scholar] [CrossRef] [PubMed]
- Coggins, G.E.; Farrel, A.; Rathi, K.S.; Hayes, C.M.; Scolaro, L.; Rokita, J.L.; Maris, J.M. YAP1 Mediates Resistance to MEK1/2 Inhibition in Neuroblastomas with Hyperactivated RAS Signaling. Cancer Res 2019, 79, 6204–6214. [Google Scholar] [CrossRef] [PubMed]
- Maglic, D.; Schlegelmilch, K.; Dost, A.F.; Panero, R.; Dill, M.T.; Calogero, R.A.; Camargo, F.D. YAP-TEAD signaling promotes basal cell carcinoma development via a c-JUN/AP1 axis. EMBO J 2018, 37. [Google Scholar] [CrossRef]
- Kurppa, K.J.; Liu, Y.; To, C.; Zhang, T.; Fan, M.; Vajdi, A.; Knelson, E.H.; Xie, Y.; Lim, K.; Cejas, P.; et al. Treatment-Induced Tumor Dormancy through YAP-Mediated Transcriptional Reprogramming of the Apoptotic Pathway. Cancer cell 2020, 37, 104–122 e112. [Google Scholar] [CrossRef]
- Meinhardt, G.; Haider, S.; Kunihs, V.; Saleh, L.; Pollheimer, J.; Fiala, C.; Hetey, S.; Feher, Z.; Szilagyi, A.; Than, N.G.; et al. Pivotal role of the transcriptional co-activator YAP in trophoblast stemness of the developing human placenta. Proc Natl Acad Sci U S A 2020, 117, 13562–13570. [Google Scholar] [CrossRef]
- Morice, S.; Danieau, G.; Tesfaye, R.; Mullard, M.; Brion, R.; Dupuy, M.; Ory, B.; Brounais-Le Royer, B.; Corre, I.; Redini, F.; et al. Involvement of the TGF-beta Signaling Pathway in the Development of YAP-Driven Osteosarcoma Lung Metastasis. Front Oncol 2021, 11, 765711. [Google Scholar] [CrossRef]
- Lim, S.; Hermance, N.; Mudianto, T.; Mustaly, H.M.; Mauricio, I.P.M.; Vittoria, M.A.; Quinton, R.J.; Howell, B.W.; Cornils, H.; Manning, A.L.; et al. Identification of the kinase STK25 as an upstream activator of LATS signaling. Nat Commun 2019, 10, 1547. [Google Scholar] [CrossRef]
- Shen, H.; Chen, Y.; Wan, Y.; Liu, T.; Wang, J.; Zhang, Y.; Wei, L.; Hu, Q.; Xu, B.; Chernov, M.; et al. Identification of TAZ-Dependent Breast Cancer Vulnerabilities Using a Chemical Genomics Screening Approach. Front Cell Dev Biol 2021, 9, 673374. [Google Scholar] [CrossRef]
Disclaimer/Publisher’s Note: The statements, opinions and data contained in all publications are solely those of the individual author(s) and contributor(s) and not of MDPI and/or the editor(s). MDPI and/or the editor(s) disclaim responsibility for any injury to people or property resulting from any ideas, methods, instructions or products referred to in the content. |
© 2023 by the authors. Licensee MDPI, Basel, Switzerland. This article is an open access article distributed under the terms and conditions of the Creative Commons Attribution (CC BY) license (http://creativecommons.org/licenses/by/4.0/).


