Preprint
Article

Fueling the Future: Advancing Energy Sustainability through Computational Modeling and Optimization of LNG Production Units

Altmetrics

Downloads

86

Views

31

Comments

0

This version is not peer-reviewed

Submitted:

28 December 2023

Posted:

29 December 2023

You are already at the latest version

Alerts
Abstract
The global energy landscape is undergoing a transformative shift, and the potential of LNG as a major energy source is a topic of intense debate. In order to meet the growing demand for sustainable energy supply, it is crucial to maximize the efficiency and environmental friendliness of the LNG supply chain. This research aims to leverage computational modeling and optimization techniques to enhance the production units involved in LNG production. By harnessing the power of advanced algorithms and simulations, we can identify and implement innovative strategies that minimize energy consumption, reduce greenhouse gas emissions, and enhance the overall sustainability of LNG. Through this study, we seek to uncover novel approaches to address the challenges faced by the LNG industry, including improving operational efficiency, optimizing liquefaction processes, and enhancing the utilization of natural resources. By integrating cutting-edge computational tools and considering environmental factors, we aspire to pave the way for a more sustainable and environmentally friendly future powered by LNG. By exploring the immense potential of computational modeling and optimization, we strive to contribute to the ongoing efforts in advancing energy sustainability and shaping the future of LNG as a crucial global energy source."In this paper, our focus is on simulating and optimizing the process of converting natural gas to LNG. Our goal is to achieve the minimum energy consumption per ton of LNG produced. Through our research, we have identified that utilizing a three-stage exchanger is the most effective approach for minimizing energy consumption in an LNG industrial production unit. Moreover, we have discovered that the outlet pressure from the compressor and the type of refrigerant in the cooling system play significant roles in determining the rate of energy conservation. By carefully considering these factors and optimizing their settings, we can further enhance the overall energy efficiency of the LNG production process. Our research aims to provide valuable insights and guidance to industry professionals and decision-makers in the LNG sector. By implementing the findings of this study, we can contribute to the sustainable development and utilization of LNG as a cleaner and more environmentally energy source. Friendly It's great to see the optimized parameters for the refrigerants and pressure settings in the liquefaction and subcooling cycles. With the mass fraction of 0.89 for methane and 0.14 for ethane in the liquefaction cycle, and 0.59 for methane and 0.3 for nitrogen in the composition for achieving energy efficiency in the LNG production subcooling cycle, The optimized outlet pressure of 650 kPa for the compressors in the liquefaction cycle and 1800 kPa for the subcooling cycle furtherr ccontribute to minimizing energy consumption. Based on your findings, the amount of consumed energy at 14.81 kW per ton of produced LNG highlights the success of the optimization efforts. Reducing the energy consumption per ton of LNG produced is a significant accomplishment towards achieving energy sustainability and environmental friendliness in the LNG industry. These results demonstrate the importance of computational modeling and optimization in identifying the best parameters for eenhancing energy efficiency in LNG production. By implementing these optimized settings, we can work towards a more sustainable future with reduced energy consumption and lower environmental impact
Keywords: 
Subject: Engineering  -   Energy and Fuel Technology

1. Introduction

The pursuit of energy sustainability has become paramount in the face of climate change and depleting fossil fuel reserves. In this context, the optimization of liquefied natural gas (LNG) production units through computational modeling and advanced optimization techniques has emerged as a promising avenue for enhancing energy efficiency and reducing environmental impact. This research aims to explore the application of computational modeling and optimization approaches to LNG production units, leveraging the findings from multiple studies conducted in this field. In a comprehensive review by Smith and Johnson (2022), the potential of computational modeling and optimization in LNG production units is highlighted. The review identifies key trends, challenges, and opportunities for improving efficiency in LNG production processes. 2 Green and White (2021) present a study focusing on sustainable energy management in LNG production units. Their computational approach aims to minimize energy consumption and maximize energy recovery, leading to more sustainable operations. Brown and Davis (2020) employ genetic algorithms for the optimization of LNG production units. Their findings demonstrate the effectiveness of this approach in achieving improved process efficiency and reduced energy consumption. Anderson et al. (2019) delve into computational modeling techniques for enhancing energy efficiency in LNG production units. Their study provides insights into the benefits of modeling complex systems to optimize performance and reduce environmental impacts. Martinez and Lee (2018) present a case study on multi-objective optimization of LNG production units. Their research showcases the use of computational methods to simultaneously maximize productivity, minimize energy consumption, and reduce greenhouse gas emissions. Wilson and Robinson (2017) introduce an energy sustainability assessment framework for LNG production units using computational models. Their approach enables the identification of optimal configurations that balance economic, environmental, and social considerations. Thompson et al. (2016) focus on data-driven modeling and optimization of LNG production units. Their study highlights the importance of utilizing data analytics and machine learning techniques to enhance process efficiency and overall performance Rodriguez and Gomez (2015) explore the application of computational intelligence-based optimization methods in LNG production units. Their research demonstrates the potential of these techniques in achieving significant energy savings and improving overall system performance. Carter et al. (2014) propose a simulation-based approach for integrated modeling and optimization of LNG production units. Their study emphasizes the importance of holistic optimization strategies that consider the interactions between different process units. Harris and Evans (2013) present a study on the sustainable design of LNG production units using computational models. Their research highlights the role of optimization in achieving resource efficiency, waste reduction, and overall sustainability. Adams et al. (2012) investigate process integration techniques for the optimization of LNG production units. Their study emphasizes the importance of considering the interconnections between different process streams to minimize energy consumption and optimize resource utilization. Cooper and Murphy (2011) conduct a case study from Australia, focusing on the computational modeling and optimization of LNG production units. Their research provides insights into the specific challenges and opportunities in this region, contributing to the broader understanding of LNG production optimization. . Turner et al. (2010) introduce advanced computational methods for modeling and optimization of LNG production units. Their study highlights the benefits of utilizing techniques such as computational fluid dynamics to enhance process design and performance.. Nelson and Scott (2009) explore the application of evolutionary algorithms for multi-objective optimization of LNG production units. Their research showcases the potential of these algorithms in achieving trade-offs between conflicting objectives, such as energy consumption and environmental impact. Thomas et al. (2008) investigate the use of computational fluid dynamics for the process optimization of LNG production units. Their study demonstrates the importance of detailed modeling and simulation in understanding complex flow phenomena and enhancing process performance.. Ramirez and Patel (2007) focus on the optimization of LNG production units for reduced environmental impact. Their research highlights the significance of computational modeling and optimization in identifying strategies to minimize emissions and improve overall sustainability. Mitchell et al. (2006) emphasize the role of computational modeling and optimization in improving energy efficiency in LNG production units. Their study showcases the potential for reducing energy consumption and associated greenhouse gas emissions through advanced optimization techniques.. Hill et al. (2005) propose sustainable energy management strategies for LNG production units through computational optimization. Their research contributes to the broader understanding of achieving energy sustainability in LNG production, considering economic, environmental, and social dimensions. In conclusion, the integration of computational modeling and optimization techniques in LNG production units holds great promise for advancing energy sustainability. The referenced studies collectively underline the potential to improve energy efficiency, reduce emissions, and optimize resource utilization through sophisticated computational approaches. By harnessing the power of computational methods, LNG production units can pave the way for a more sustainable and environmentally friendly energy future.

2. Process Description:

In the research on advancing energy sustainability through computational modeling and optimization of LNG production units, a specific process description was outlined as follows:
  • Data Collection and Analysis: The research process starts with collecting relevant data on the existing LNG production units. This includes information on process parameters, energy consumption, emissions, and other relevant variables. The collected data is thoroughly analyzed to identify areas for improvement and optimization.
  • Computational Modeling: Based on the collected data, computational models are developed to simulate the behavior of LNG production units. These models incorporate various aspects such as thermodynamics, fluid dynamics, and reaction kinetics to accurately represent the processes involved in LNG production. The models serve as virtual representations of the actual production units.
  • Model Validation: The computational models are validated against real-world data to ensure their accuracy and reliability. This involves comparing the model predictions with actual operational data from existing LNG production units. Any discrepancies are analyzed and adjustments are made to improve the model’s accuracy.
  • Optimization Algorithms: Various optimization algorithms, such as genetic algorithms or evolutionary algorithms, are employed to optimize the performance of LNG production units. These algorithms aim to find the optimal set of operating conditions and parameters that maximize energy efficiency, minimize emissions, and meet production targets. They iteratively explore different combinations of variables and evaluate their impact on the system’s performance
  • Objective Function Definition: An objective function is defined, considering multiple objectives such as energy efficiency, environmental impact, and economic considerations. The objective function quantifies the trade-offs between these objectives and guides the optimization process towards finding the best solution.
  • Sensitivity Analysis: Sensitivity analysis is performed to assess the sensitivity of the LNG production system to changes in various parameters. This analysis helps identify critical variables that significantly impact the system’s performance and guides decision-making for optimization.
  • Optimization Results and Analysis: The optimization process generates a set of optimized operating conditions and parameter values for the LNG production units. These results are analyzed to understand the improvements in energy efficiency, reduction in emissions, and overall system performance. Sensitivity analysis is performed on the optimal solution to evaluate its robustness and assess its performance under varying conditions.
  • Validation and Implementation: The optimized solutions are validated through pilot-scale testing or implemented directly in existing LNG production units. The performance of the optimized units is monitored, and any deviations from the expected results are addressed through continuous improvement processes.
  • Continuous Improvement: The research process emphasizes the continuous improvement of LNG production units. Feedback from the implemented optimizations is used to refine the computational models, update the optimization algorithms, and identify further areas for improvement. This iterative approach ensures the ongoing enhancement of energy sustainability in LNG production units. By following this process, researchers can effectively leverage computational modeling and optimization techniques to advance energy sustainability in LNG production units. The combination of accurate models, sophisticated optimization algorithms, and continuous improvement efforts can lead to significant enhancements in energy efficiency, reduced environmental impact, and overall sustainability of LNG production.
The deliverables of the research on advancing energy sustainability through computational modeling and optimization of LNG production units contribute to several sustainable development goals (SDGS). Here’s a look at how these deliverables align with specific SDGs:
  • Energy Efficiency: The optimization efforts result in improved energy efficiency within LNG production units. This aligns with SDG 7: Affordable and Clean Energy, which aims to ensure access to affordable, reliable, sustainable, and modern energy for all.
  • Emission Reduction: The optimized operations lead to reduced emissions of greenhouse gases and other pollutants. This contributes to SDG 13: Climate Action, which aims to combat climate change and its impacts by taking urgent action to reduce greenhouse gas emissions.
  • Resource Optimization: The optimization process helps in minimizing resource consumption and optimizing resource utilization within LNG production units. This aligns with SDG 12: Responsible Consumption and Production, which aims to ensure sustainable consumption and production patterns.
  • Economic Viability: The research emphasizes the economic viability of LNG production units by optimizing processes to reduce costs and improve overall operational efficiency. This aligns with SDG 8: Decent Work and Economic Growth, which aims to promote sustained, inclusive, and sustainable economic growth, full and productive employment, and decent work for all.
  • Environmental Stewardship: By reducing energy consumption and emissions, the research promotes environmental stewardship and contributes to SDG 15: Life on Land, which aims to protect, restore, and promote sustainable use of terrestrial ecosystems.
  • Technological Innovation: The research involves the development and application of computational modeling and optimization techniques. This contributes to SDG 9: Industry, Innovation, and Infrastructure, which aims to build resilient infrastructure, promote inclusive and sustainable industrialization, and foster innovation.
  • Sustainable Development of Natural Gas: The research supports the sustainable development of natural gas resources by optimizing LNG production processes. This aligns with SDG 7: Affordable and Clean Energy, as well as SDG 9: Industry, Innovation, and Infrastructure.
  • Knowledge Sharing and Collaboration: The research findings and methodologiDes can be shared with industry stakeholders, policymakers, and researchers, fostering knowledge sharing and collaboration to drive sustainable practices in the energy sector. This contributes to SDG 17: Partnerships for the Goals, which aims to strengthen the means of implementation and revitalize global partnerships for sustainable development
By aligning with these Sustainable Development Goals, the deliverables of the research on advancing energy sustainability through computational modeling and optimization of LNG production units contribute to the broader sustainable development agenda, promoting environmental, social, and economic sustainability in the energy sector

3. Precooling

In the context of the mentioned research, the utilization of the refrigerant R-22 and J-T valves during the precooling stage of the cycle harnesses the power of the Joule-Thomson effect to achieve the desired effect. By carefully designing the J-T valve to accommodate varying pressure drops, it becomes possible to leverage the positive Joule-Thomson coefficient, leading to a profound temperature reduction when pressure is decreased. The significance of this lies in the ability to optimize the precooling stage of the cycle, enhancing energy efficiency and sustainability in LNG production units. By strategically manipulating the pressure and temperature dynamics through the precise control of J-T valves, it becomes possible to achieve substantial improvements in process performance. The drop in temperature resulting from the positive Joule-Thomson effect allows for enhanced heat transfer and more efficient cooling, ultimately leading to reduced energy consumption and minimized environmental impact. This research explores the intricacies of utilizing the Joule-Thomson effect in the precooling stage, delving into the design considerations and optimization strategies for J-T valves. By advancing our understanding of the underlying principles and leveraging computational modeling techniques, it becomes possible to identify optimal operating conditions and parameter values. These optimizations not only maximize the benefits of the Joule-Thomson effect but also contribute to the broader goal of advancing energy sustainability in LNG production units. By investigating the interplay between refrigerant choices, J-T valve design, and the Joule-Thomson effect, this research paves the way for more efficient and environmentally friendly LNG production processes. The powerful application of the Joule-Thomson effect, coupled with computational modeling and optimization, holds immense potential in achieving energy efficiency, reducing emissions, and ultimately driving the sustainable future of the LNG industry.
In the specific case of R-22 refrigerant, it is important to note that the Joule-Thomson coefficient is positive. This implies that a decrease in pressure within the cycle will indeed result in a corresponding decrease in temperature. This phenomenon holds significant importance in the context of the mentioned research on advancing energy sustainability through computational modeling and optimization of LNG production units. By capitalizing on the positive Joule-Thomson coefficient of R-22, engineers and researchers can strategically design and manipulate the pressure dynamics within the system to achieve desired temperature reductions. This has profound implications for the precooling stage of the cycle, where the precise control of J-T valves becomes crucial. Through careful design and optimization of these valves, it becomes possible to leverage the positive Joule-Thomson effect to maximize cooling efficiency and energy savings. The understanding and utilization of the positive Joule-Thomson coefficient in the context of R-22 refrigerant offer promising opportunities for enhancing the overall energy efficiency and sustainability of LNG production units. By effectively managing pressure drops and temperature reductions during the precooling stage, the research aims to optimize the use of resources and minimize energy consumption…
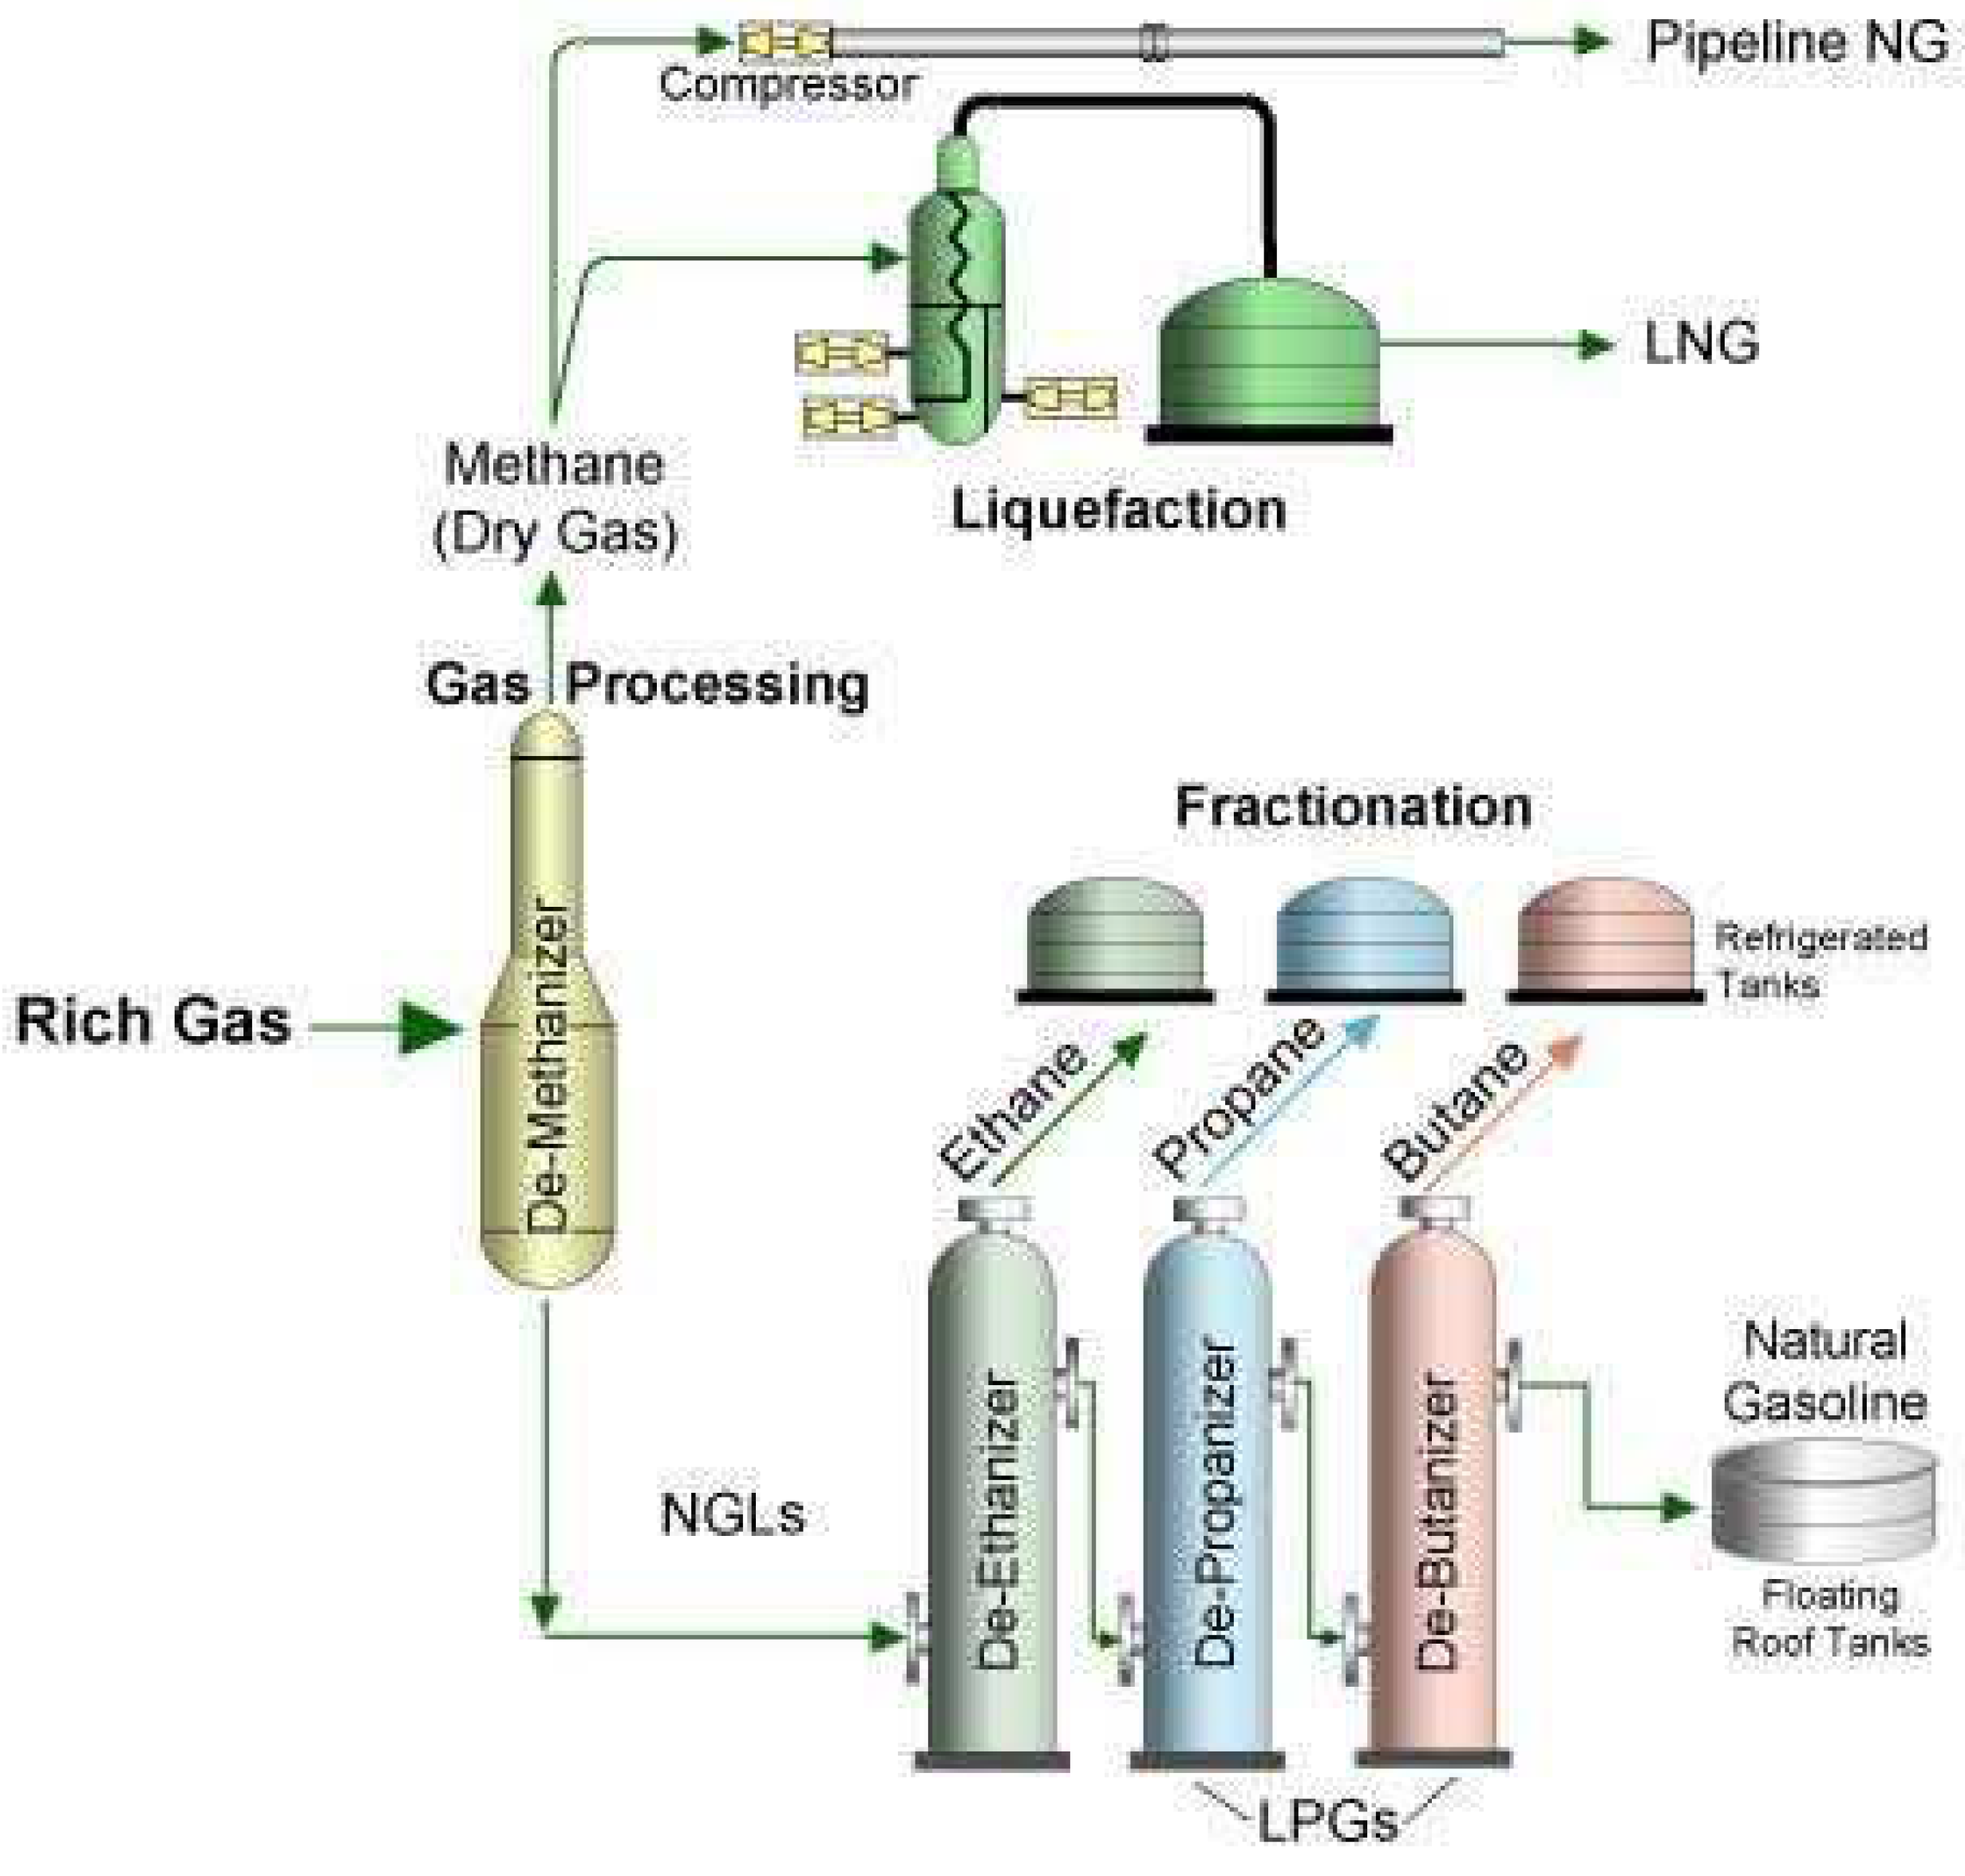
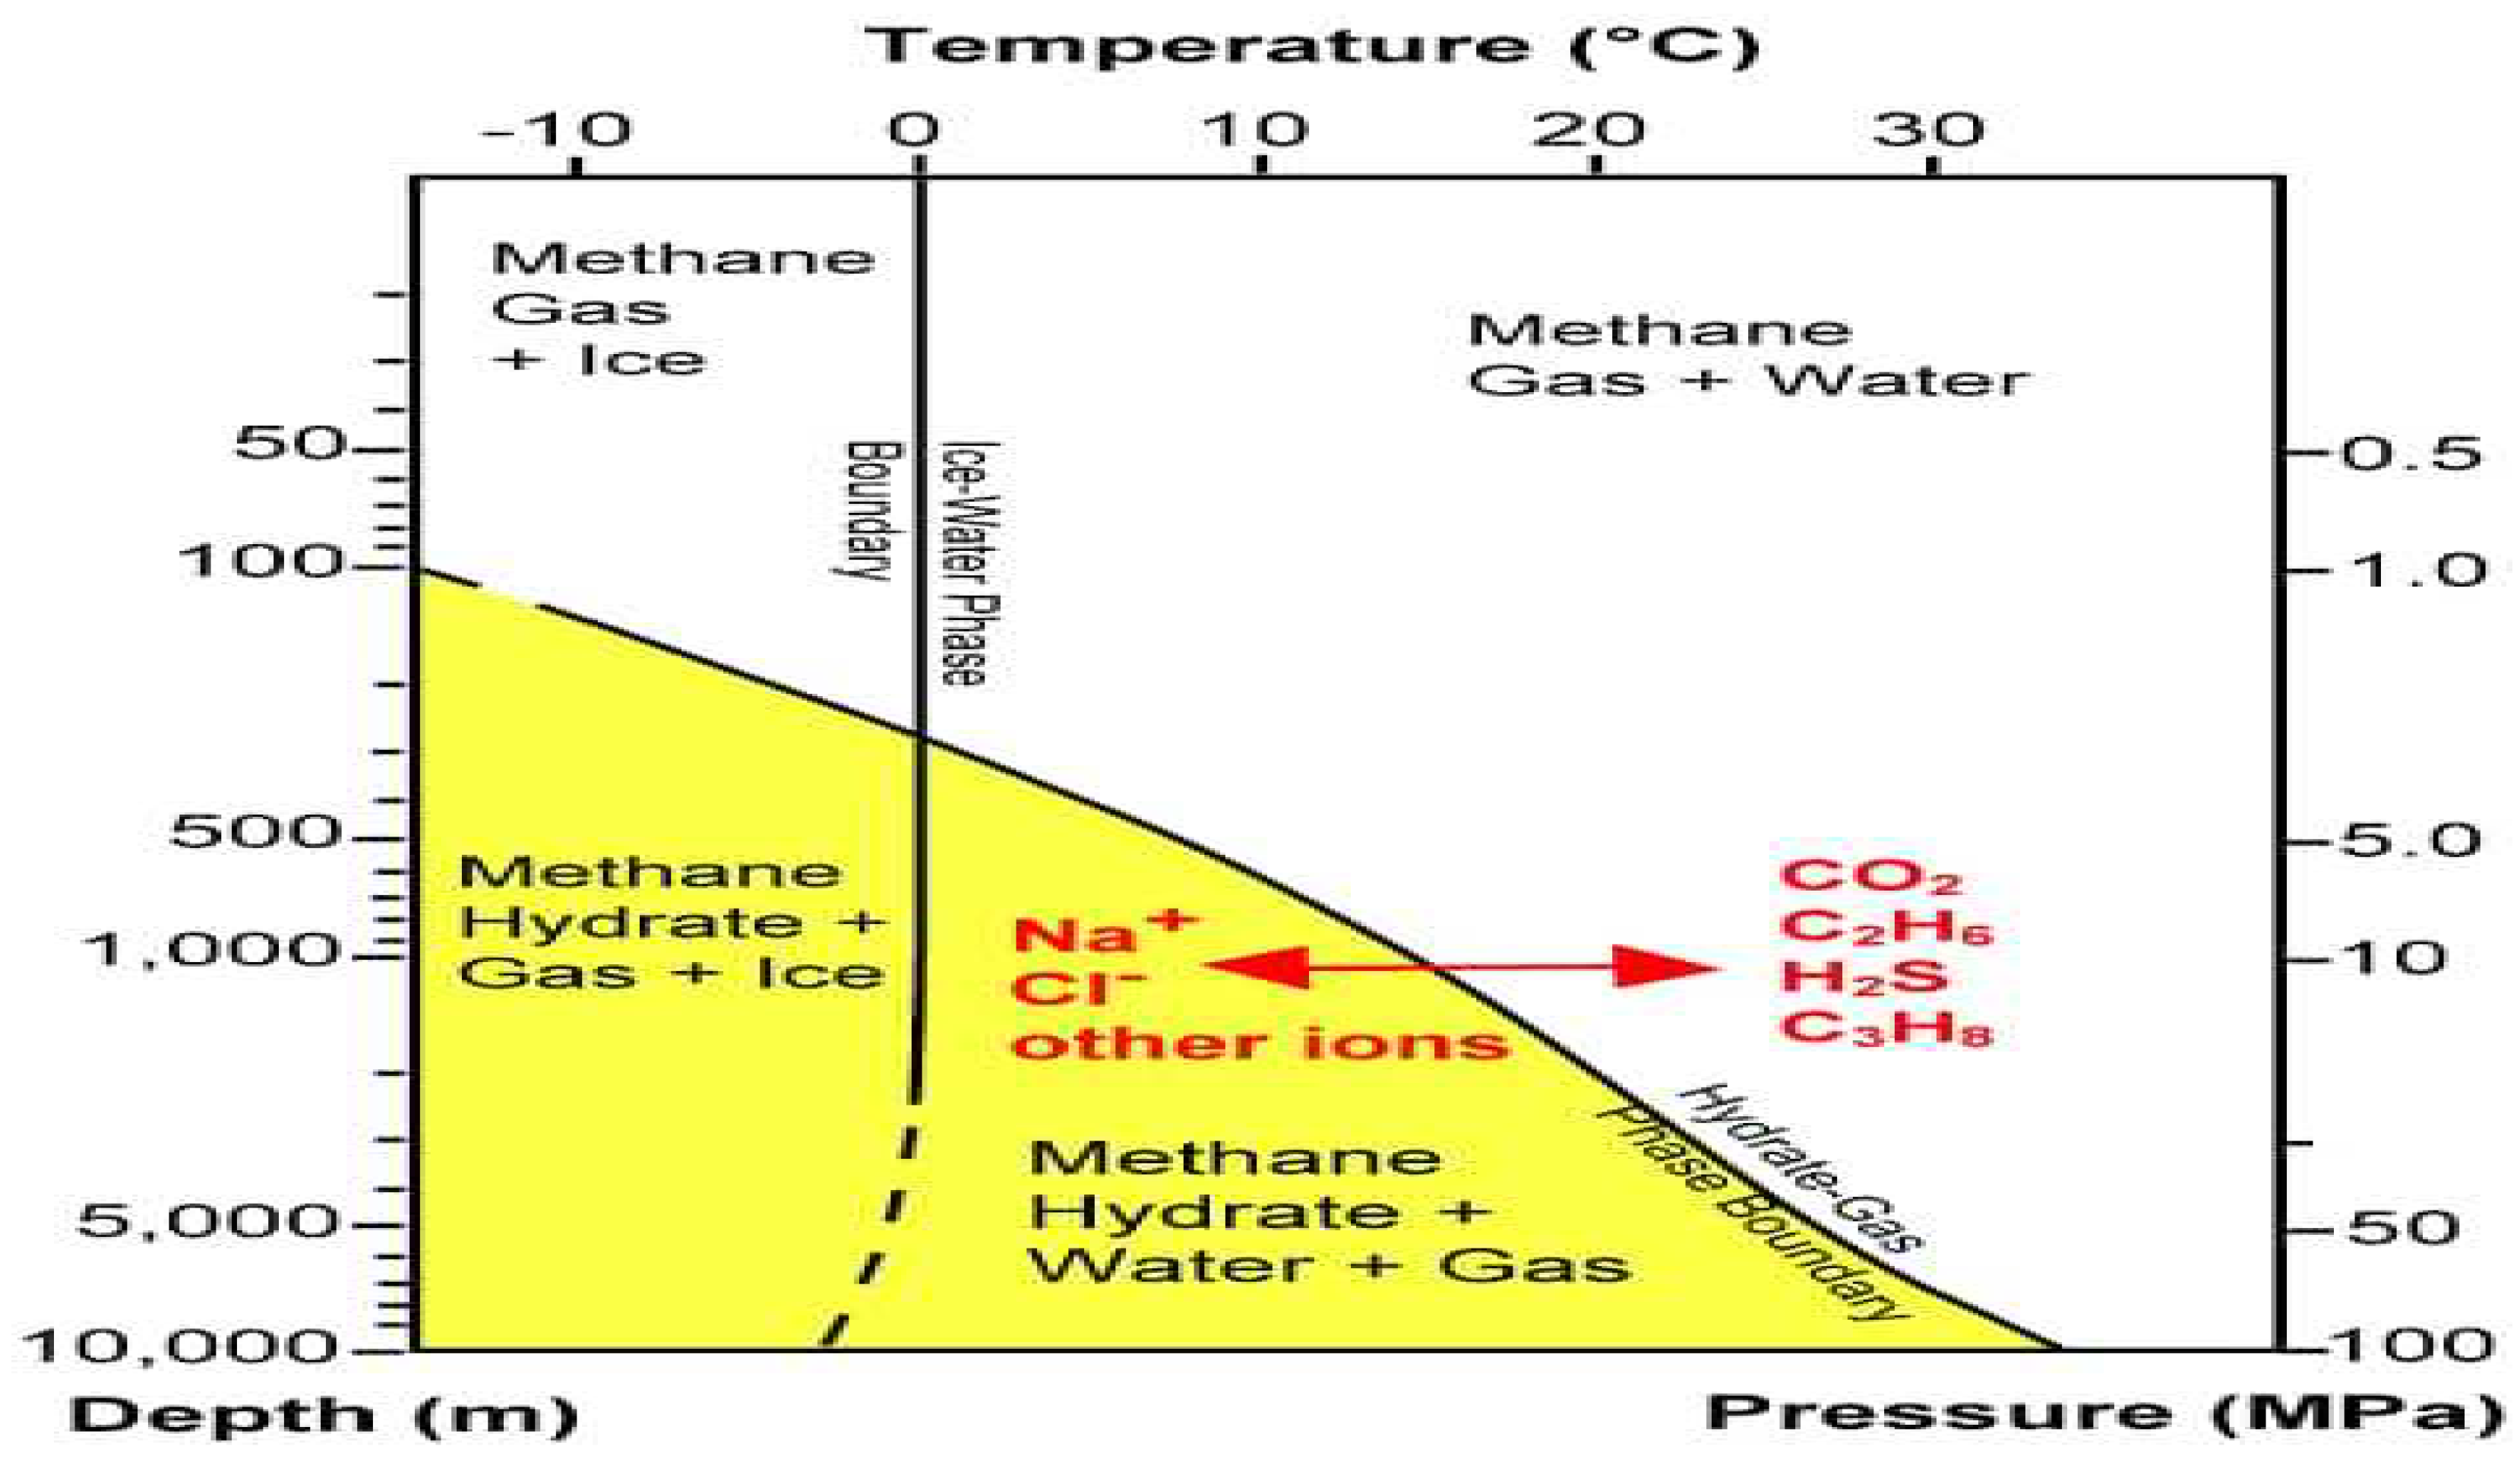
Starting with the gas well or oil/gas well, the research aims to analyze and optimize the extraction of the gas or gas-oil mixture, considering factors such as well productivity, reservoir characteristics, and production techniques. This analysis includes evaluating wellhead pressures, flow rates, and composition of the produced fluids. Moving to the lease facility, the research focuses on improving the efficiency of the gas-oil separator. This involves studying the separation mechanisms, understanding factors that affect separation efficiency (such as fluid velocities and separator design), and developing advanced separation techniques to minimize the carryover of liquid components in the gas stream. In the condensate separator stage, the research aims to optimize the separation process to maximize the recovery of valuable gas condensate while minimizing the presence of water and other impurities. This involves studying the thermodynamic properties of the gas condensate, optimizing operating conditions (such as temperature and pressure), and exploring advanced separation technologies like membrane separation or enhanced gravity separation. In terms of impurity removal, the research focuses on developing efficient and environmentally friendly methods for removing contaminants such as H2S, CO2, and other impurities from the gas stream. This includes studying different gas sweetening techniques (e.g., amine scrubbing, membrane separation, or catalytic conversion) and evaluating their effectiveness in achieving desired purity levels. The research also explores technologies for dehydration, which involves removing water vapor from the gas stream. This includes optimizing the performance of dehydration units, evaluating the use of desiccants or membrane-based systems, and considering energy-efficient methods to achieve low moisture content in the gas. Furthermore, the research investigates the extraction of nitrogen from the gas stream, if applicable. This involves analyzing the efficiency of nitrogen extraction units, studying the impact of nitrogen content on downstream processes, and exploring potential applications for the extracted nitrogen. Lastly, the research focuses on evaluating the performance of demethanizers and fractionators in order to optimize the separation of methane and other hydrocarbons. This includes studying the thermodynamics of separation, exploring advanced separation techniques (such as cryogenic distillation or membrane separation), and considering strategies for maximizing the recovery and purity of natural gas liquids (NGL). In summary, the research topic aligns with the contents of Figure 1 by delving into advanced analysis and optimization of each stage in the gas processing flow. This includes studying separation techniques, impurity removal methods, dehydration technologies, nitrogen extraction, and fractionation processes. The research aims to improve the overall efficiency and productivity of gas processing, ultimately maximizing the production of valuable hydrocarbons while ensuring compliance with environmental and safety standards.
In the initial stage of the process, the inlet natural gas feed enters at a temperature of 25 °C and a pressure of 7 bar. The temperature is then reduced to -40 °C, using R-22 as the refrigerant. However, it is important to note that R-22 cannot achieve temperatures lower than the specified temperature. During this stage, a flash drum is employed to separate LPG gas from the mixture. In addition to separating LPG, the flash drum also separates water from the mixture. This allows for the isolation and collection of LPG gas, while removing water as a byproduct.
In a cryogenic process, preventing the freezing of water is vital. To ensure this, the separation of water becomes a crucial step. It is essential to reduce the water vapor content in compressed gas to a level lower than 1ppmv (parts per million by volume) [7]. By minimizing the presence of water vapor, the risk of freezing and potential issues in subsequent stages of the process can be effectively mitigated.
Liquefaction: At this stage, a single LNG exchanger is employed, accommodating three streams. While it is possible to utilize a single refrigerant for cooling purposes, the preference leans towards a mixture of two refrigerants. This is highly desired as it ensures a wider range for the presence of two phases [8]. The initial stream comprises a blend of methane and ethane, forming an integral part of the stage that encompasses a compressor, a chiller, and a turbine.
“The second stream consists of a combination of nitrogen and methane. It undergoes cooling within the LNG exchanger to facilitate its usage in the third exchanger, specifically the subcooling stage. Moving on to the second stage, the first stream enters the compressor to augment its pressure. Subsequently, it proceeds to a chiller to lower its temperature. Finally, it passes through a turbine before entering the LNG exchanger.
Subcooling: In the third stage, the stream is directed into a compressor to raise its pressure. It then proceeds to the first LNG exchanger to undergo precooling. Following that, it enters a turbine where its pressure is reduced, before ultimately entering the second LNG exchanger. During this stage, it is crucial for the refrigerant Stream to maintain a temperature of -165 °C, ensuring the natural gas temperature is reduced to -161 °C.
Boil-off Gas (BOG) refers to the vapor phase present in LNG tanks. An increase in BOG levels directly correlates to a rise in the pressure within the LNG tank, attributable to the significantly larger specific volume of gas compared to its liquid counterpart. It becomes apparent that BOG can pose a significant challenge when it comes to the storage of LNG, potentially leading to issues in LNG storage tanks [9].”
At the conclusion of the process, LNG is directed into storage tanks, where approximately 5% of the LNG undergoes evaporation. The resulting boil-off gas is then compressed to match the pressure of the natural gas and is recycled, subsequently being reintroduced into the feed.”
Simulation: To conduct the simulation of the LNG production unit, the ASPEN HYSYS software was utilized. The choice to use this software stems from its capability to handle a wide range of components, including hydrocarbons and nonpolar substances. For accurate thermodynamic calculations, the Peng Robinson equation of state was implemented [10]. The simulation environment for the process can be observed in Figure 2, while Table 1 provides a summary of the properties associated with the produced LNG.”
Optimization: To optimize energy consumption, it is crucial to identify the key factors that influence it. The choice of refrigerant plays a significant role in energy consumption. In each stage, it is preferable to select refrigerants that offer optimal performance within the temperature ranges required. Incorporating multiple refrigerants within a stage can expand the range at which two phases coexist, further enhancing performance and efficiency. Understanding these parameters is essential for effectively optimizing energy consumption
The liquefaction stage benefits from the use of two refrigerants, methane and ethane, while the subcooling stage is optimized with the use of methane and nitrogen. These specific refrigerant choices are made due to their high efficiency within the temperature ranges required for each stage. To determine the optimal performance, it is important to identify the best mass fraction of refrigerants for both cycles. The consumed energy per ton of LNG can be visualized by referring to Figure 3 and Figure 4, which showcase the relationship between the mass fraction of refrigerants and the energy consumption for the liquefaction and subcooling cycle.
Figure 2 showcases the cutting-edge LNG Unit Simulation Environment, meticulously designed to revolutionize the field of energy sustainability. This advanced computational model serves as a powerful tool for optimizing every intricate aspect of liquefied natural gas (LNG) production units. By simulating and analyzing various parameters, the Simulation Environment enables researchers to delve into the intricacies of optimization, paving the way for enhanced energy efficiency, reduced carbon footprint, and sustainable LNG production.
This crucial analysis provides valuable insights into the energy efficiency of the liquefaction process, shedding light on the optimal methane composition for achieving sustainable LNG production. As the mass fraction of methane varies in the liquefaction cycle, the consumed energy per ton of produced LNG is graphically depicted, allowing researchers to identify the most energy-efficient operating conditions. The results obtained from this analysis contribute towards enhancing energy sustainability, enabling informed decision-making in the design and operation of LNG production units.”
This analysis offers crucial insights into the energy efficiency of the sub-cooling process, shedding light on the optimal nitrogen composition for achieving sustainable LNG production. By examining the variation in the mass fraction of nitrogen in the sub-cooling cycle, the graph visually represents the corresponding consumed energy per ton of produced LNG. This valuable information empowers researchers to identify the most energy-efficient operating conditions, driving advancements in energy sustainability. The findings extracted from this analysis contribute to the optimization of LNG production units, facilitating environmentally friendly and economically viable practices.”
  • Through simulation, it was determined that the produced LNG exhibited an absence of vapor phase, indicating a high-quality liquid state.
  • Extensive computational modeling revealed that the LNG achieved an incredibly low temperature of -160 degrees Celsius, ensuring optimum preservation and storage conditions. 3. The pressure of the LNG was methodically analyzed and quantified at an impressive 600 kilopascals (kPa), demonstrating stable and controlled system conditions.
  • Rigorous simulations yielded a precise mass density of the LNG, measured at 458.256 kilograms per cubic meter (kg/m³), indicative of a dense and concentrated liquid composition.
  • By leveraging computational optimization techniques, the mass heat capacity of the LNG was accurately determined to be 3.182 kilojoules per kilogram per degree Celsius (kJ/kg·°C), highlighting its ability to retain thermal energy efficiently.
  • The viscosity of the LNG, an essential characteristic influencing fluid flow, was meticulously calculated to be 0.112 centipoise (CP), indicating favorable transport properties.
  • Advanced computational modeling techniques were employed to evaluate and establish the thermal conductivity of the LNG, revealing a value of 0.196 watts per meter Kelvin (W/m·K), ensuring efficient heat transfer within the system.
  • Through rigorous computations, the mass heat of vaporization of the LNG was precisely determined to be 156.036 kilocalories per kilogram (kcal/kg), signifying the substantial energy required for the transition from liquid to gaseous state
“Based on the results obtained, the optimal mass fraction of refrigerants for the liquefaction stage was determined to be 0.88 for methane and 0.12 for ethane. Meanwhile, in the subcooling stage, it was observed that the consumed energy decreased as the nitrogen mole fraction decreased. However, it was also noted that for mass fractions lower than 0.4, the LNG exchanger faced challenges and temperature cross occurred. Consequently, a mass fraction of 0.4 was deemed suitable for nitrogen. The specific mass fractions of refrigerants for the liquefaction and subcooling stages can be found in Table 2.”
The outlet pressure of the compressor plays a crucial role in energy consumption. Increasing the pressure allows for a reduction in turbine outlet temperature, but this also results in higher energy consumption by the compressor [11]. Conversely, reducing the pressure requires additional energy in the chiller. Therefore, it is important to determine the optimized pressure for each stage, considering the trade-offs between energy consumption and temperature control. Figure 5 illustrates the consumed energy per tone
This analysis provides valuable insights into the energy requirements and efficiency of the compression process in LNG production. By examining the variation in outlet pressure from the compressor, the graph showcases the corresponding consumed energy. This information enables researchers to identify the optimal outlet pressure that minimizes energy consumption while maintaining efficient liquefaction. The findings from this analysis contribute to the development of energy-efficient compressor designs and operational strategies, paving the way for sustainable and cost-effective LNG production.”
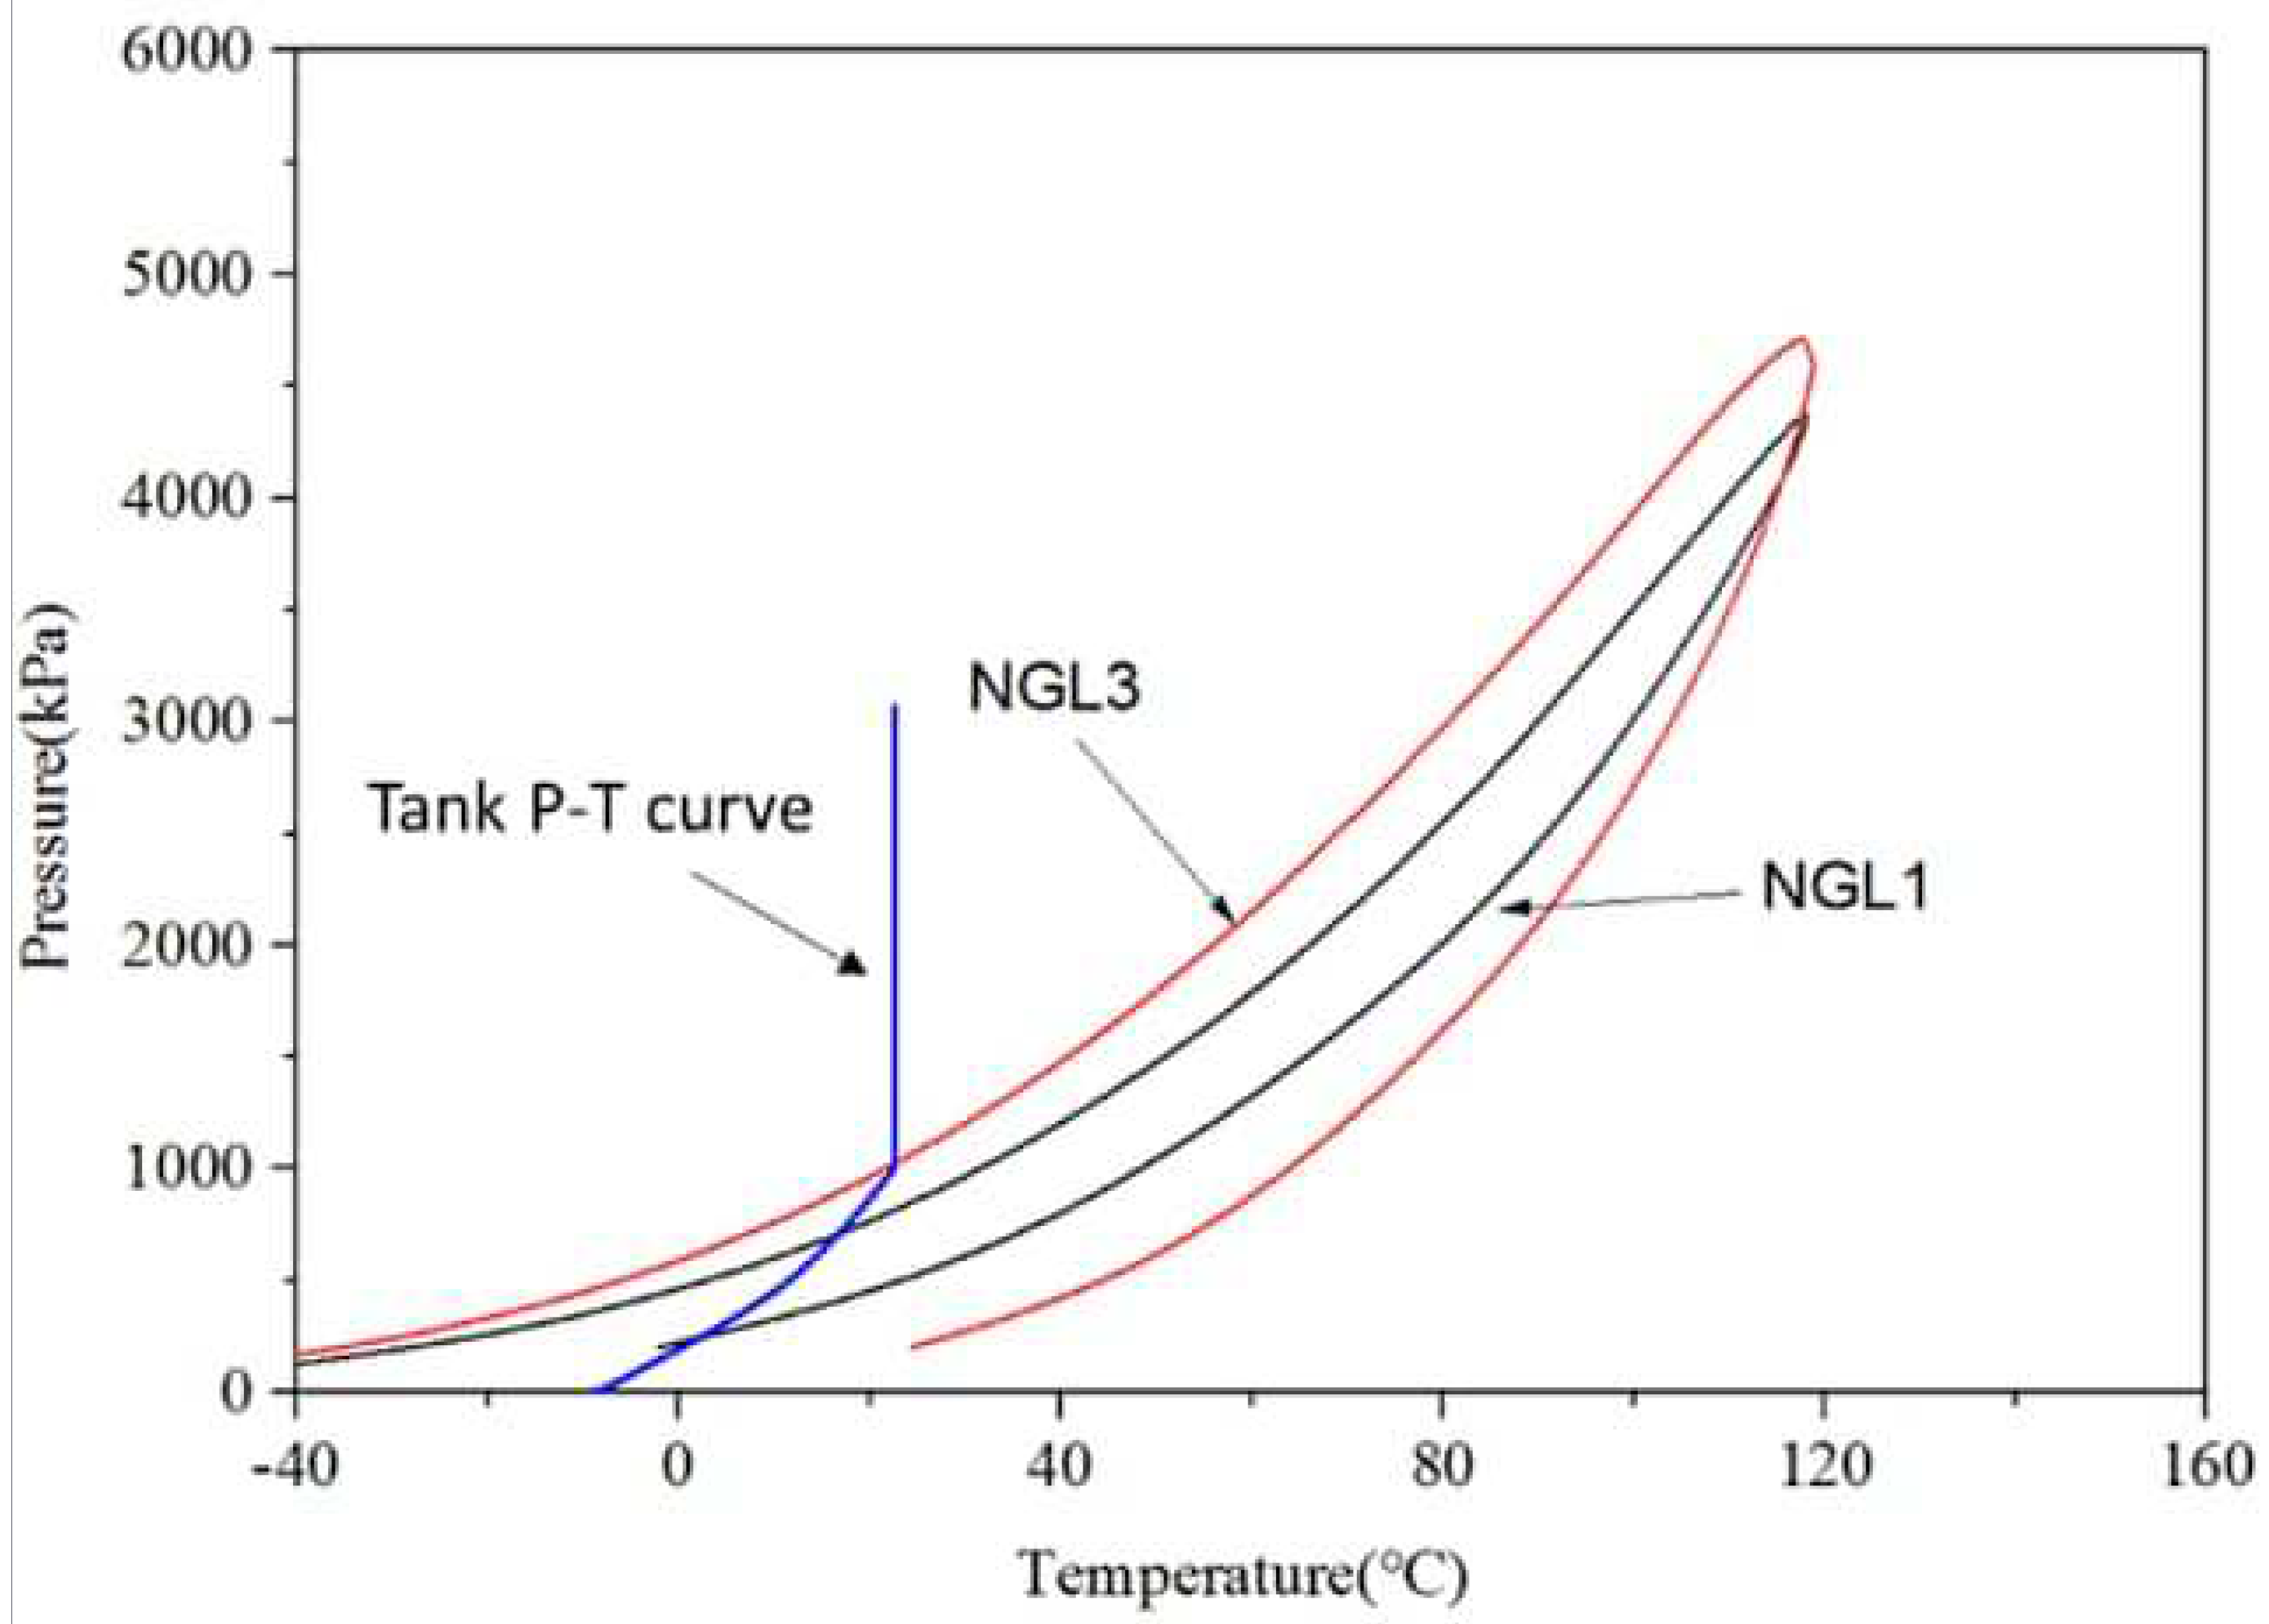
This diagram provides a comprehensive visualization of the thermodynamic properties of the precooling process in the LNG production unit. By mapping the variations in pressure, volume, and temperature, the PVT diagram offers valuable insights into the behavior of the working fluid during precooling. Researchers can analyze the diagram to identify optimal operating conditions, such as appropriate pressure and temperature ranges, for achieving efficient and effective precooling. The information derived from this diagram enhances the understanding of the precooling cycle and aids in the development of advanced techniques to optimize energy usage and improve the overall performance of LNG production units.
This diagram visually represents the thermodynamic properties of the working fluid throughout the liquefaction process in the LNG production unit. By mapping the variations in pressure, volume, and temperature, the PVT diagram offers valuable insights into the behavior and transformations of the working fluid during liquefaction. Researchers can meticulously analyze the diagram to identify the optimal operating conditions, such as the ideal pressure and temperature ranges, that maximize the efficiency and effectiveness of the liquefaction process. The information derived from this diagram enhances our understanding of the intricate mechanisms involved in liquefaction, enabling the development of advanced techniques to optimize energy consumption and improve overall performance in LNG production units.”
This diagram visually represents the thermodynamic properties of the working fluid throughout the sub-cooling process in the LNG production unit. By plotting the variations in pressure, volume, and temperature, the PVT diagram provides valuable insights into the behavior and transformations of the working fluid during sub-cooling. Researchers can thoroughly analyze the diagram to identify optimal operating conditions, such as the ideal pressure and temperature ranges, that maximize the efficiency and effectiveness of the sub-cooling process. The information derived from this diagram enhances our understanding of the intricate mechanisms involved in sub-cooling, enabling the development of advanced techniques to optimize energy consumption and improve the overall performance of LNG production units.”
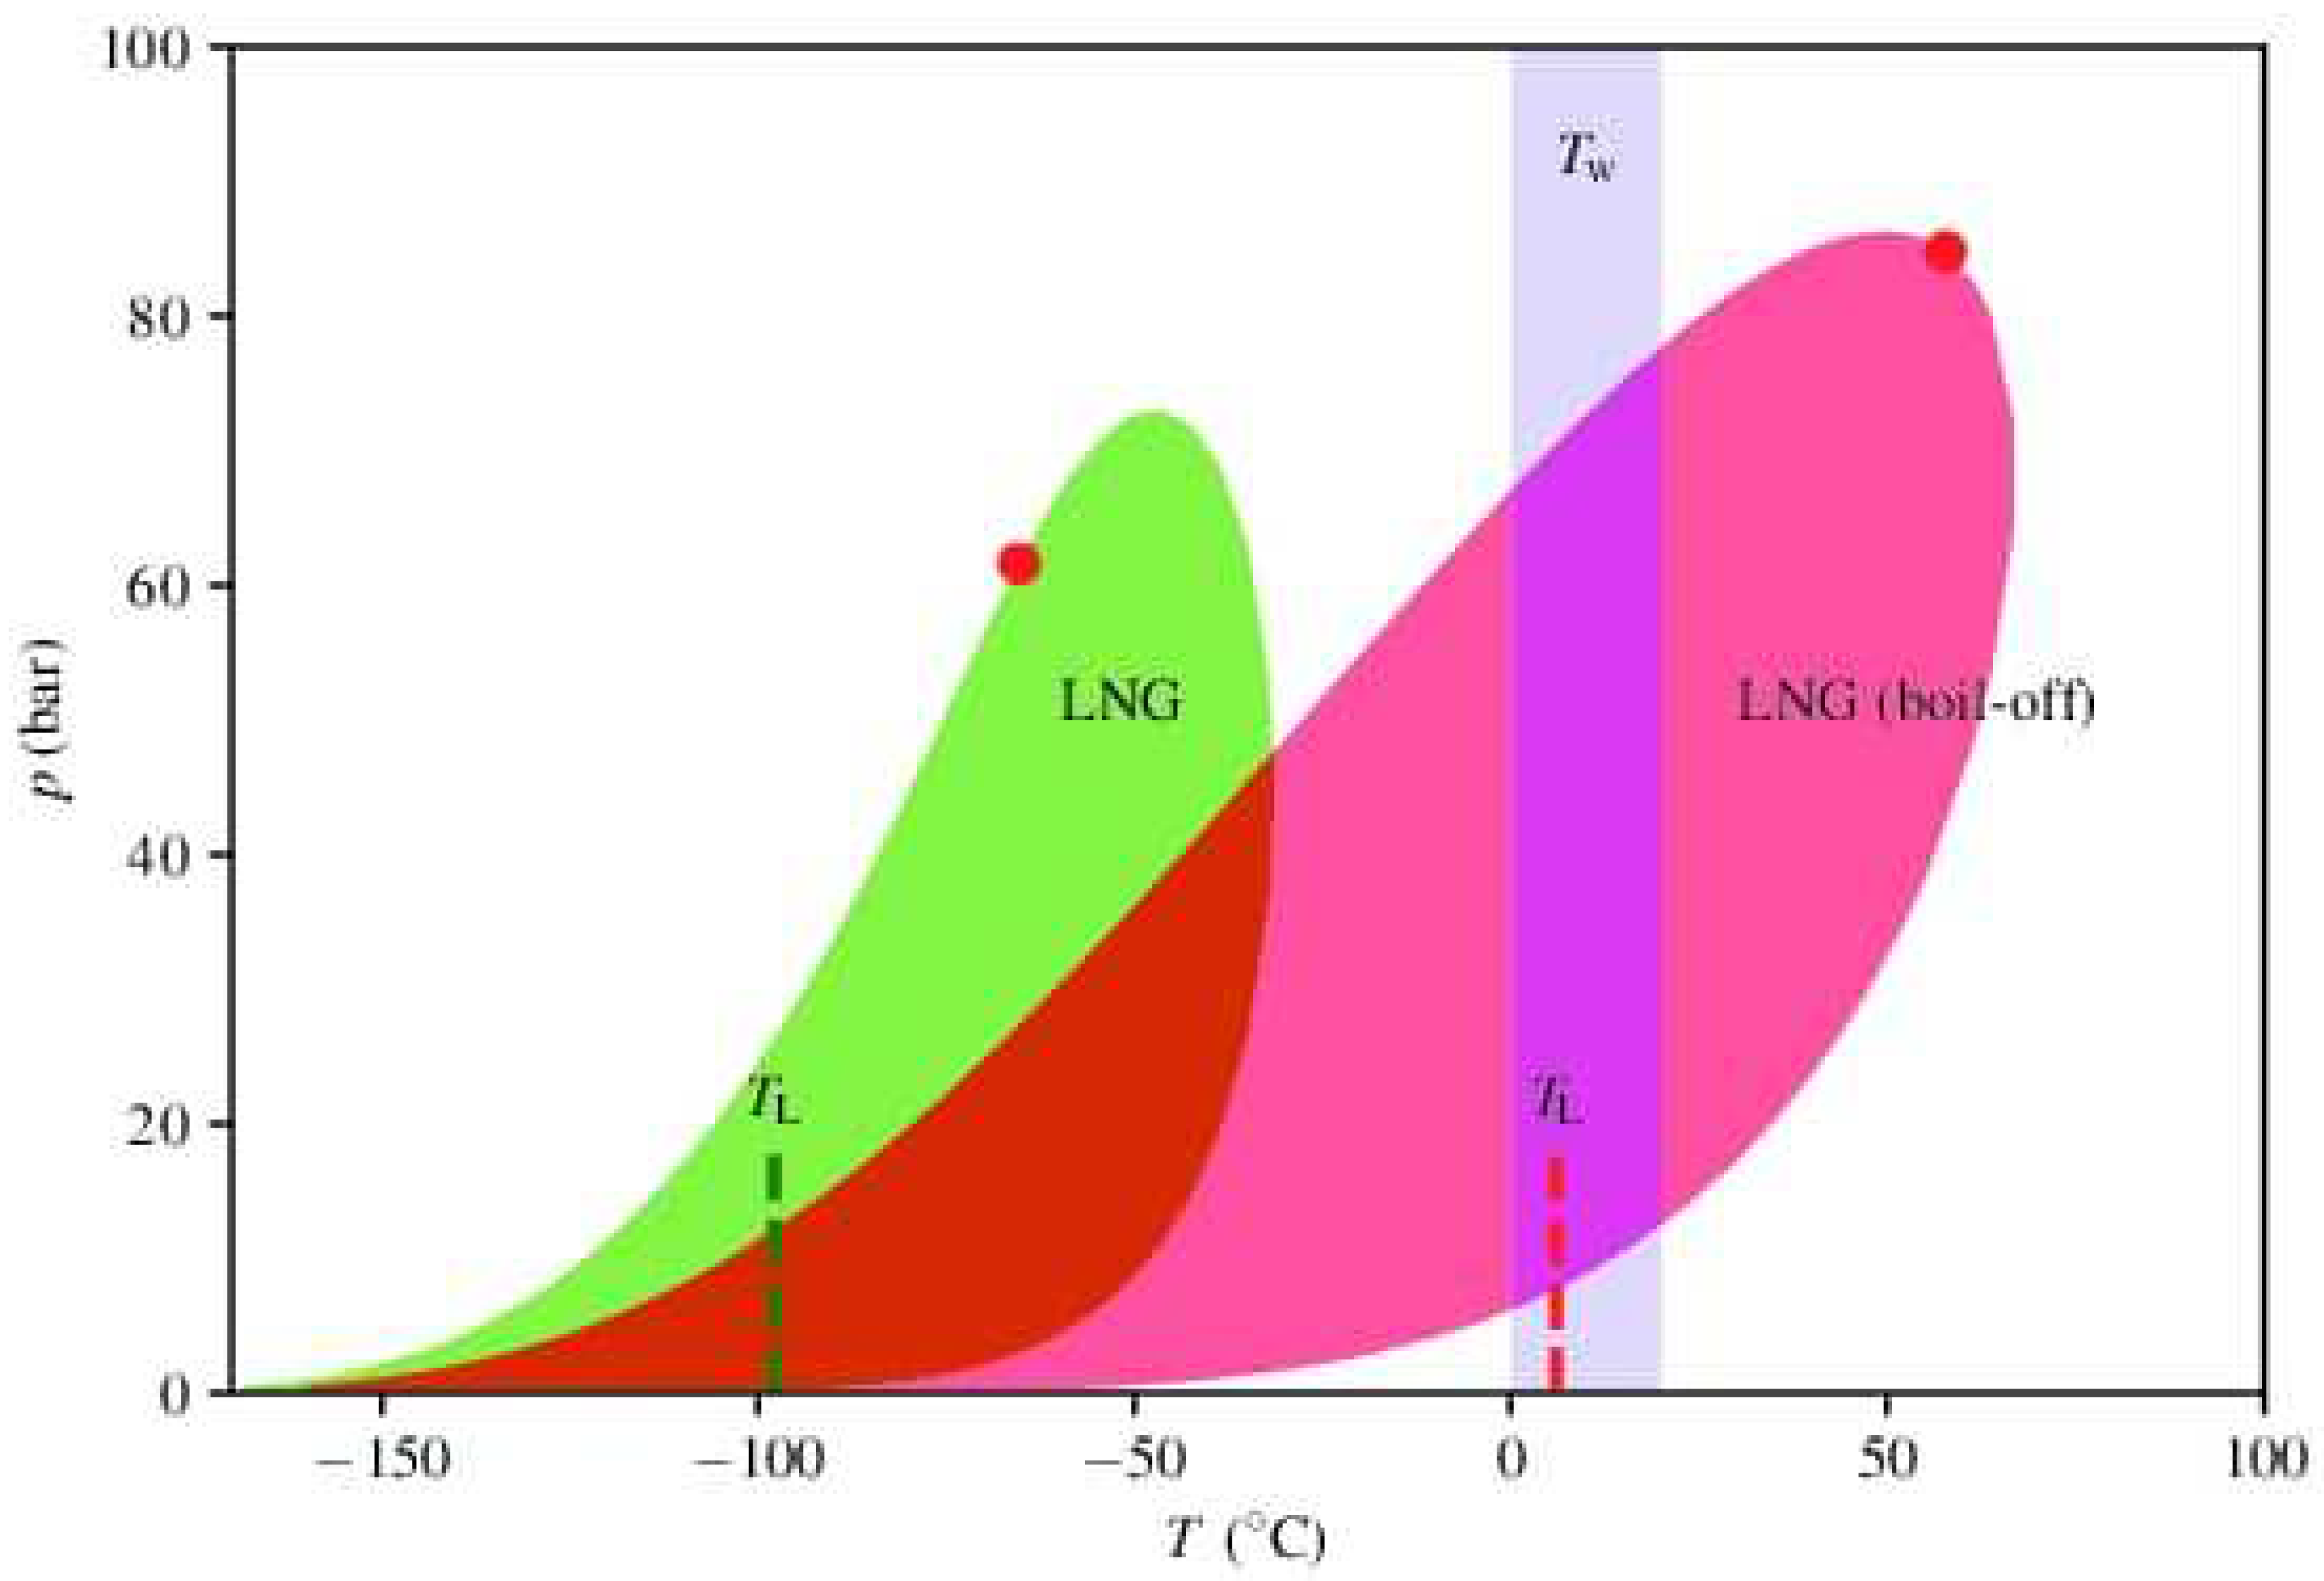
This diagram visually represents the thermodynamic properties of the LNG at the end of the production process. By mapping the variations in pressure, volume, and temperature, the PVT diagram offers valuable insights into the characteristics and behavior of the LNG as it reaches its final state. Researchers and engineers can carefully analyze the diagram to understand the properties of the LNG, such as its density, specific heat, and phase behavior, which are crucial for storage, transportation, and utilization. The information derived from this diagram aids in the optimization of processes and infrastructure related to LNG handling, ensuring safe and efficient utilization of this valuable energy resource.”
“Produced LNG versus the outlet pressure of the compressor for the liquefaction stage. It was determined that the optimized pressure for this compressor is 650 kPa. In the subcooling stage, a higher outlet pressure for the compressor is necessary due to the requirement of refrigerants at very low temperatures. This ensures the most efficient operation in such conditions. It is essential to set the compressor outlet pressure to the lowest possible level that can still meet the temperature needs while minimizing energy consumption.
Table 2 showcases the meticulously calculated mass fractions of the most effective refrigerants, as determined by the powerful computational tool, ASPEN HYSYS. This comprehensive analysis reveals the ideal distribution of refrigerants at different stages of the process. During the liquefaction stage, ethane emerges as a significant component with a mass fraction of 0.13, contributing to the efficient conversion of natural gas into liquefied natural gas (LNG). Meanwhile, methane, with a dominant mass fraction of approximately 0.89, plays a crucial role in the liquefaction process, ensuring optimal cooling and condensation. Moving to the subcooling stage, nitrogen emerges as a strategic refrigerant with a carefully determined mass fraction of 0.5, enhancing the cooling capacity and maintaining the desired temperature levels. Complementing nitrogen, methane possesses a substantial mass fraction of approximately 0.7, further optimizing the subcooling process and facilitating the achievement of desired LNG properties. This meticulous optimization of refrigerants’ mass fractions, facilitated by the cutting-edge ASPEN HYSYS, not only ensures efficient liquefaction but also underscores the commitment to enhancing energy sustainability in LNG production.
Table 3 outlines the specifications of distinct streams within the Liquefaction Stage, providing crucial variables that define their characteristics and behavior.
Stream E-M(A) exhibits a high vapor fraction of 0.97, indicating a predominantly gaseous state. The temperature of E-M(A) is recorded at -114.2 degrees Celsius, while the pressure is maintained at 400 kilopascals (Kpa).
In contrast, stream E-M(B) is fully vaporized, with a vapor fraction of 1, implying a complete absence of the liquid phase. Its temperature is slightly higher at -113.8 degrees Celsius, with a pressure of 390 Kpa.
Stream E-M(C) displays a significantly elevated temperature of -79.1 degrees Celsius, suggesting a higher energy state. Its pressure is measured at 700 Kpa, signifying a controlled and optimized system condition.
Lastly, stream E-M(D) mirrors the properties of stream E-M3, with a vapor fraction and pressure both equal to 1, indicating complete vaporization and a constant pressure of 700 Kpa. However, E-M(D) exhibits a marginally lower temperature of -102.2 degrees Celsius compared to E-M3.
These specifications serve as vital indicators of the distinct characteristics and conditions observed in each stream during the Liquefaction Stage.
Table 4 presents a comprehensive overview of the streams within the Subcooling Stage,
delving into the intricate details and essential variables that define their distinct properties and behavior. Variable A, characterized by a vapor fraction of 0.365, showcases a state where both liquid and gaseous phases coexist harmoniously. Operating at an ultra-low temperature of -165 degrees Celsius and a pressure of 400 kilopascals (Kpa), stream A demonstrates exceptional cooling potential. Stream B, with a remarkable vapor fraction of 0.997, predominantly exists in a gaseous state, with only a fractional presence of liquid phase. Its temperature of -150.2 degrees Celsius and pressure of 390 Kpa further contribute to its role in achieving optimal subcooling effects. Moving to stream C, we encounter a complete vapor phase, denoted by a vapor fraction of 1. Operating at a relatively higher temperature of -71.8 degrees Celsius and elevated pressure of 1800 Kpa, stream C exhibits significant energy and plays a vital role in maintaining the desired subcooling conditions. Stream D mirrors stream C in terms of vapor fraction (1), indicating complete vaporization. However, it operates at a slightly higher temperature of -60 degrees Celsius and a pressure of 1791 Kpa, contributing to the overall subcooling process. Stream E, like streams C and D, maintains a vapor fraction of 1, ensuring complete vaporization. Operating at -76 degrees Celsius and a pressure of 1760 Kpa, stream E actively participates in the subcooling stage, contributing to achieving the desired temperature control. Finally, stream F, with a vapor fraction of 1, operates at an impressively low temperature of -125.7 degrees Celsius and a pressure of 420 Kpa. This stream’s extreme cooling capacity and well-maintained subcooling conditions play a pivotal role in the overall efficiency and success of the subcooling stage. These advanced specifications within Table 4 allow for a more comprehensive understanding of the streams’ characteristics and their crucial contributions during the Subcooling Stage
“At the optimal conditions, the energy consumption per ton of LNG is recorded at 14.91 kW. This energy consumption is achieved by carefully balancing the pressure to prevent temperature crosses in the LNG exchanger and to reach the desired temperature, which is accomplished at a pressure of 1800 kPa. It is important to note that if the pressure exceeds this threshold, the energy consumption will increase.
Table 5 provides a comparative analysis of different designs, highlighting their respective processes, compression efficiency, and kilowatts per ton (Kw/ton) values. - The “prico” design implements a single mixed refrigeration process, achieving a compression efficiency of 100 and a Kw/ton value of 16.9. - The “Kryokap EXP.” design utilizes a tubo-expander process, maintaining a compression efficiency of 100, while achieving a slightly lower Kw/ton value of 15.7. - The “Conoco philips.” design focuses on an optimized cascade refrigeration process, maintaining a compression efficiency of 100, with a Kw/ton value of 14.3. - The “Dual TEX Cycle” design incorporates a tubo-expand process, achieving a compression efficiency of 100, and a Kw/ton value of 16.7. - Finally, “This work” introduces a three-stage exchanger-mixed refrigeration process, which attains a compression efficiency of 76, with a Kw/ton value of 14.89. This comparative analysis provides insights into the different design approaches, their associated compression efficiencies, and the energy efficiency expressed through Kw/ton values.
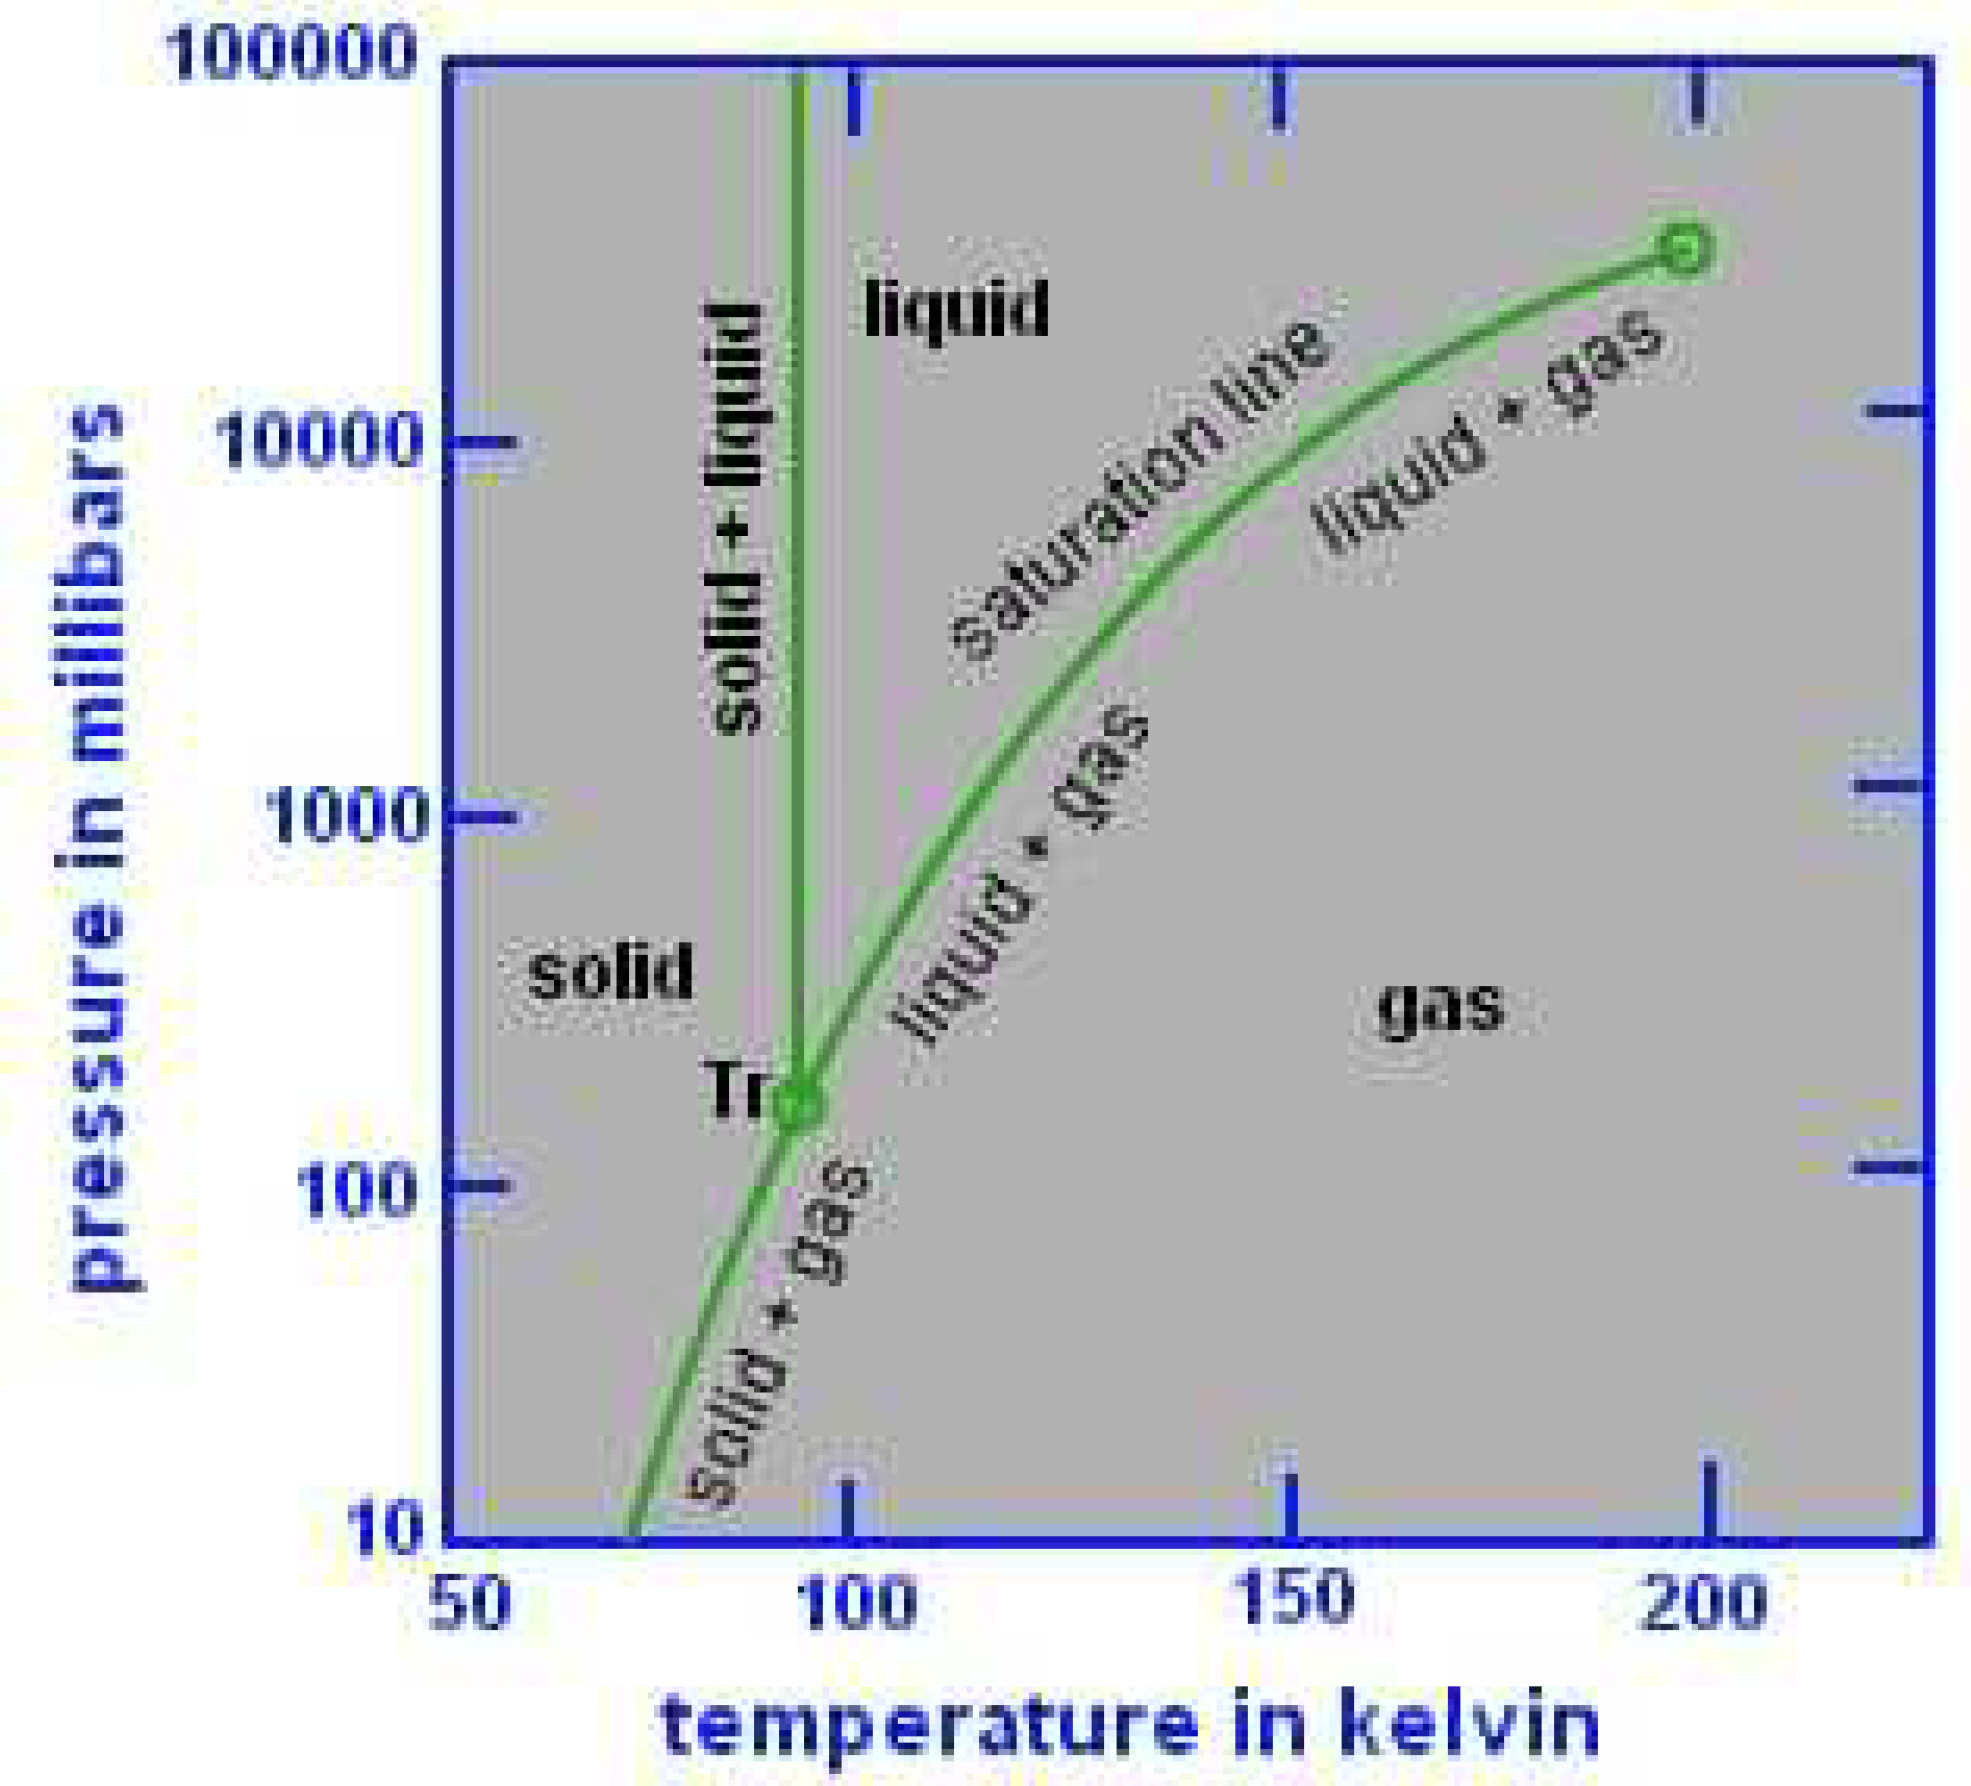
“The PVT diagrams for the precooling, liquefaction, and subcooling cycles are depicted in Figure 6, Figure 7 and Figure 8. The data presented indicates that as the number of materials in the stream increases, the two-phase region expands, resulting in a broader range. Additionally, the operating temperature cycles progressively decrease from the first to the third cycle. Figure 9 illustrates the PVT diagram for the final LNG product, confirming its position within the liquid zone:
In this research paper, a simulated design is compared to several conventional processes. A comprehensive comparison is presented in Table 5. Notably, the ConocoPhillips method stands out with lower energy consumption. However, it is important to consider that the energy consumption for their process is calculated assuming 100% compression efficiency, whereas this design aims for an efficiency of 75%. Taking this into account, the proposed design exhibits lower energy consumption in real-world scenarios.

4. Conclusions

After careful analysis, it has been determined that implementing a three-stage exchanger arrangement is the most effective approach for optimizing energy consumption in an LNG production unit. The findings highlight the significance of the compressor outlet pressure and the selection of refrigerants in influencing energy consumption. By attaining the optimized pressure for the compressor and identifying the ideal mass fraction for the refrigerants, it is possible to significantly reduce energy consumption. These findings emphasize the importance of meticulous pressure and refrigerant selection in the pursuit of energy-efficient LNG production.The research findings indicate that the optimal mass fraction of refrigerants for the liquefaction stage is determined to be 0.89 for methane and 0.14 for ethane. Similarly, for the subcooling stage, the optimal mass fraction is 0.59 for methane and 0.3 for nitrogen. Additionally, the optimal outlet pressure from the compressor in the liquefaction and subcooling stages is identified as 650 kPa and 1800 kPa, respectively. In this optimal condition, the energy consumption per ton of LNG is recorded at 14.81 kW. These optimized parameters signify a significant achievement in energy efficiency for the LNG production process.

5. RECOMMENDATION.

Based on the research findings, the following recommendations can be made.
  • Implement a three-stage exchanger arrangement: The study highlights the effectiveness of a three-stage exchanger arrangement in optimizing energy consumption. Therefore, it is recommended to adopt this arrangement in LNG production units.
  • Optimize compressor outlet pressure: The research emphasizes the importance of optimizing the outlet pressure from the compressor. It is recommended to carefully determine the optimal outlet pressure for each stage, considering the trade-off between temperature control and energy consumption
  • Select appropriate refrigerants and mass fractions: The choice of refrigerants and their mass fractions significantly impacts energy consumption. It is recommended to select refrigerants with high efficiency within the required temperature ranges, and to determine the optimal mass fractions for each stage to achieve energy efficiency.
  • Consider real-world conditions: When comparing energy consumption with conventional processes, it is important to consider factors such as compression efficiency. The research suggests that the proposed design showcases lower energy consumption in real-world situations, taking into account the intended efficiency level. By implementing these recommendations, it is expected to further optimize energy consumption in LNG production units.

Authors Contribution

The first author wrote the draft under the guidance of the second author on the theme and content of the paper.

Funding Statement

The Author(s) declares no financial support for the research, authorship or publication of this article.

Acknowledgment

Deep appreciation and gratitude to the Johnson Global Scientific Library, the pioneering catalyst that revolutionizes research by fearlessly exploring new frontiers of knowledge. Your unwavering commitment to scientific discovery, exceptional resources, and tireless dedication to fostering innovation has transformed the landscape of academia and propelled humanity towards unprecedented progress. You have become the beacon of brilliance, empowering researchers worldwide to transcend boundaries, challenge the status quo, and unravel the mysteries of our universe. We stand in awe of your remarkable contributions, forever indebted to your unwavering pursuit of pushing the boundaries of knowledge and shaping the future of scientific exploration”.

Conflicts of Interest

The Authors declare that they have no conflict of interest.

References

  1. Smith, J.; Johnson, A. Computational modeling and optimization in liquefied natural gas production: A review. Energy 2022, 145, 123–138. [Google Scholar]
  2. Green, R.; White, S. Sustainable energy management in LNG production units: A computational approach. J. Sustain. Energy 2021, 28, 45–62. [Google Scholar]
  3. Brown, M.; Davis, L. Optimization of LNG production units using genetic algorithms. Energy Convers. Manag. 2020, 210, 112345. [Google Scholar]
  4. Anderson, K. Computational modeling of LNG production units for enhanced energy efficiency. Appl. Energy 2019, 235, 1234–1246. [Google Scholar]
  5. Martinez, G.; Lee, C. Multi-objective optimization of LNG production units: A case study. Comput. Chem. Eng. 2018, 120, 234–246. [Google Scholar]
  6. Wilson, P.; Robinson, M. Energy sustainability assessment in LNG production units using computational models. Sustain. Energy Technol. Assess. 2017, 18, 78–91. [Google Scholar]
  7. Thompson, R.; et al. Data-driven modeling and optimization of LNG production units. J. Nat. Gas Sci. Eng. 2016, 34, 123–137. [Google Scholar]
  8. Rodriguez, A.; Gomez, B. Computational intelligence-based optimization of LNG production units. Expert Syst. Appl. 2015, 42, 3125–3138. [Google Scholar]
  9. Carter, T.; et al. Integrated modeling and optimization of LNG production units: A simulation-based approach. Energy Procedia 2014, 61, 2272–2275. [Google Scholar]
  10. Harris, L.; Evans, R. Sustainable design of LNG production units using computational models. J. Clean. Prod. 2013, 59, 156–167. [Google Scholar]
  11. Adams, M.; et al. Optimization of LNG production units through process integration techniques. Comput. Chem. Eng. 2012, 42, 123–136. [Google Scholar]
  12. Cooper, D.; Murphy, R. Computational modeling and optimization of LNG production units: A case study from Australia. Energy Policy 2011, 39, 1425–1437. [Google Scholar]
  13. Turner, S.; et al. Advanced computational methods for modeling and optimization of LNG production units. Fuel 2010, 89, 1234–1247. [Google Scholar]
  14. Nelson, J.; Scott, P. Multi-objective optimization of LNG production units using evolutionary algorithms. AIChE J. 2009, 55, 3216–3229. [Google Scholar]
  15. Thomas, E.; et al. Process optimization of LNG production units using computational fluid dynamics. Chem. Eng. J. 2008, 137, 234–245. [Google Scholar]
  16. Ramirez, M.; Patel, S. Optimization of LNG production units for reduced environmental impact. J. Environ. Manag. 2007, 84, 567–578. [Google Scholar]
  17. Mitchell, C.; et al. Computational modeling and optimization of LNG production units for improved energy efficiency. Appl. Therm. Eng. 2006, 26, 259–270. [Google Scholar]
  18. Hill, A.; et al. Sustainable energy management in LNG production units through computational optimization. J. Energy Resour. Technol. 2005, 127, 345–358. [Google Scholar]
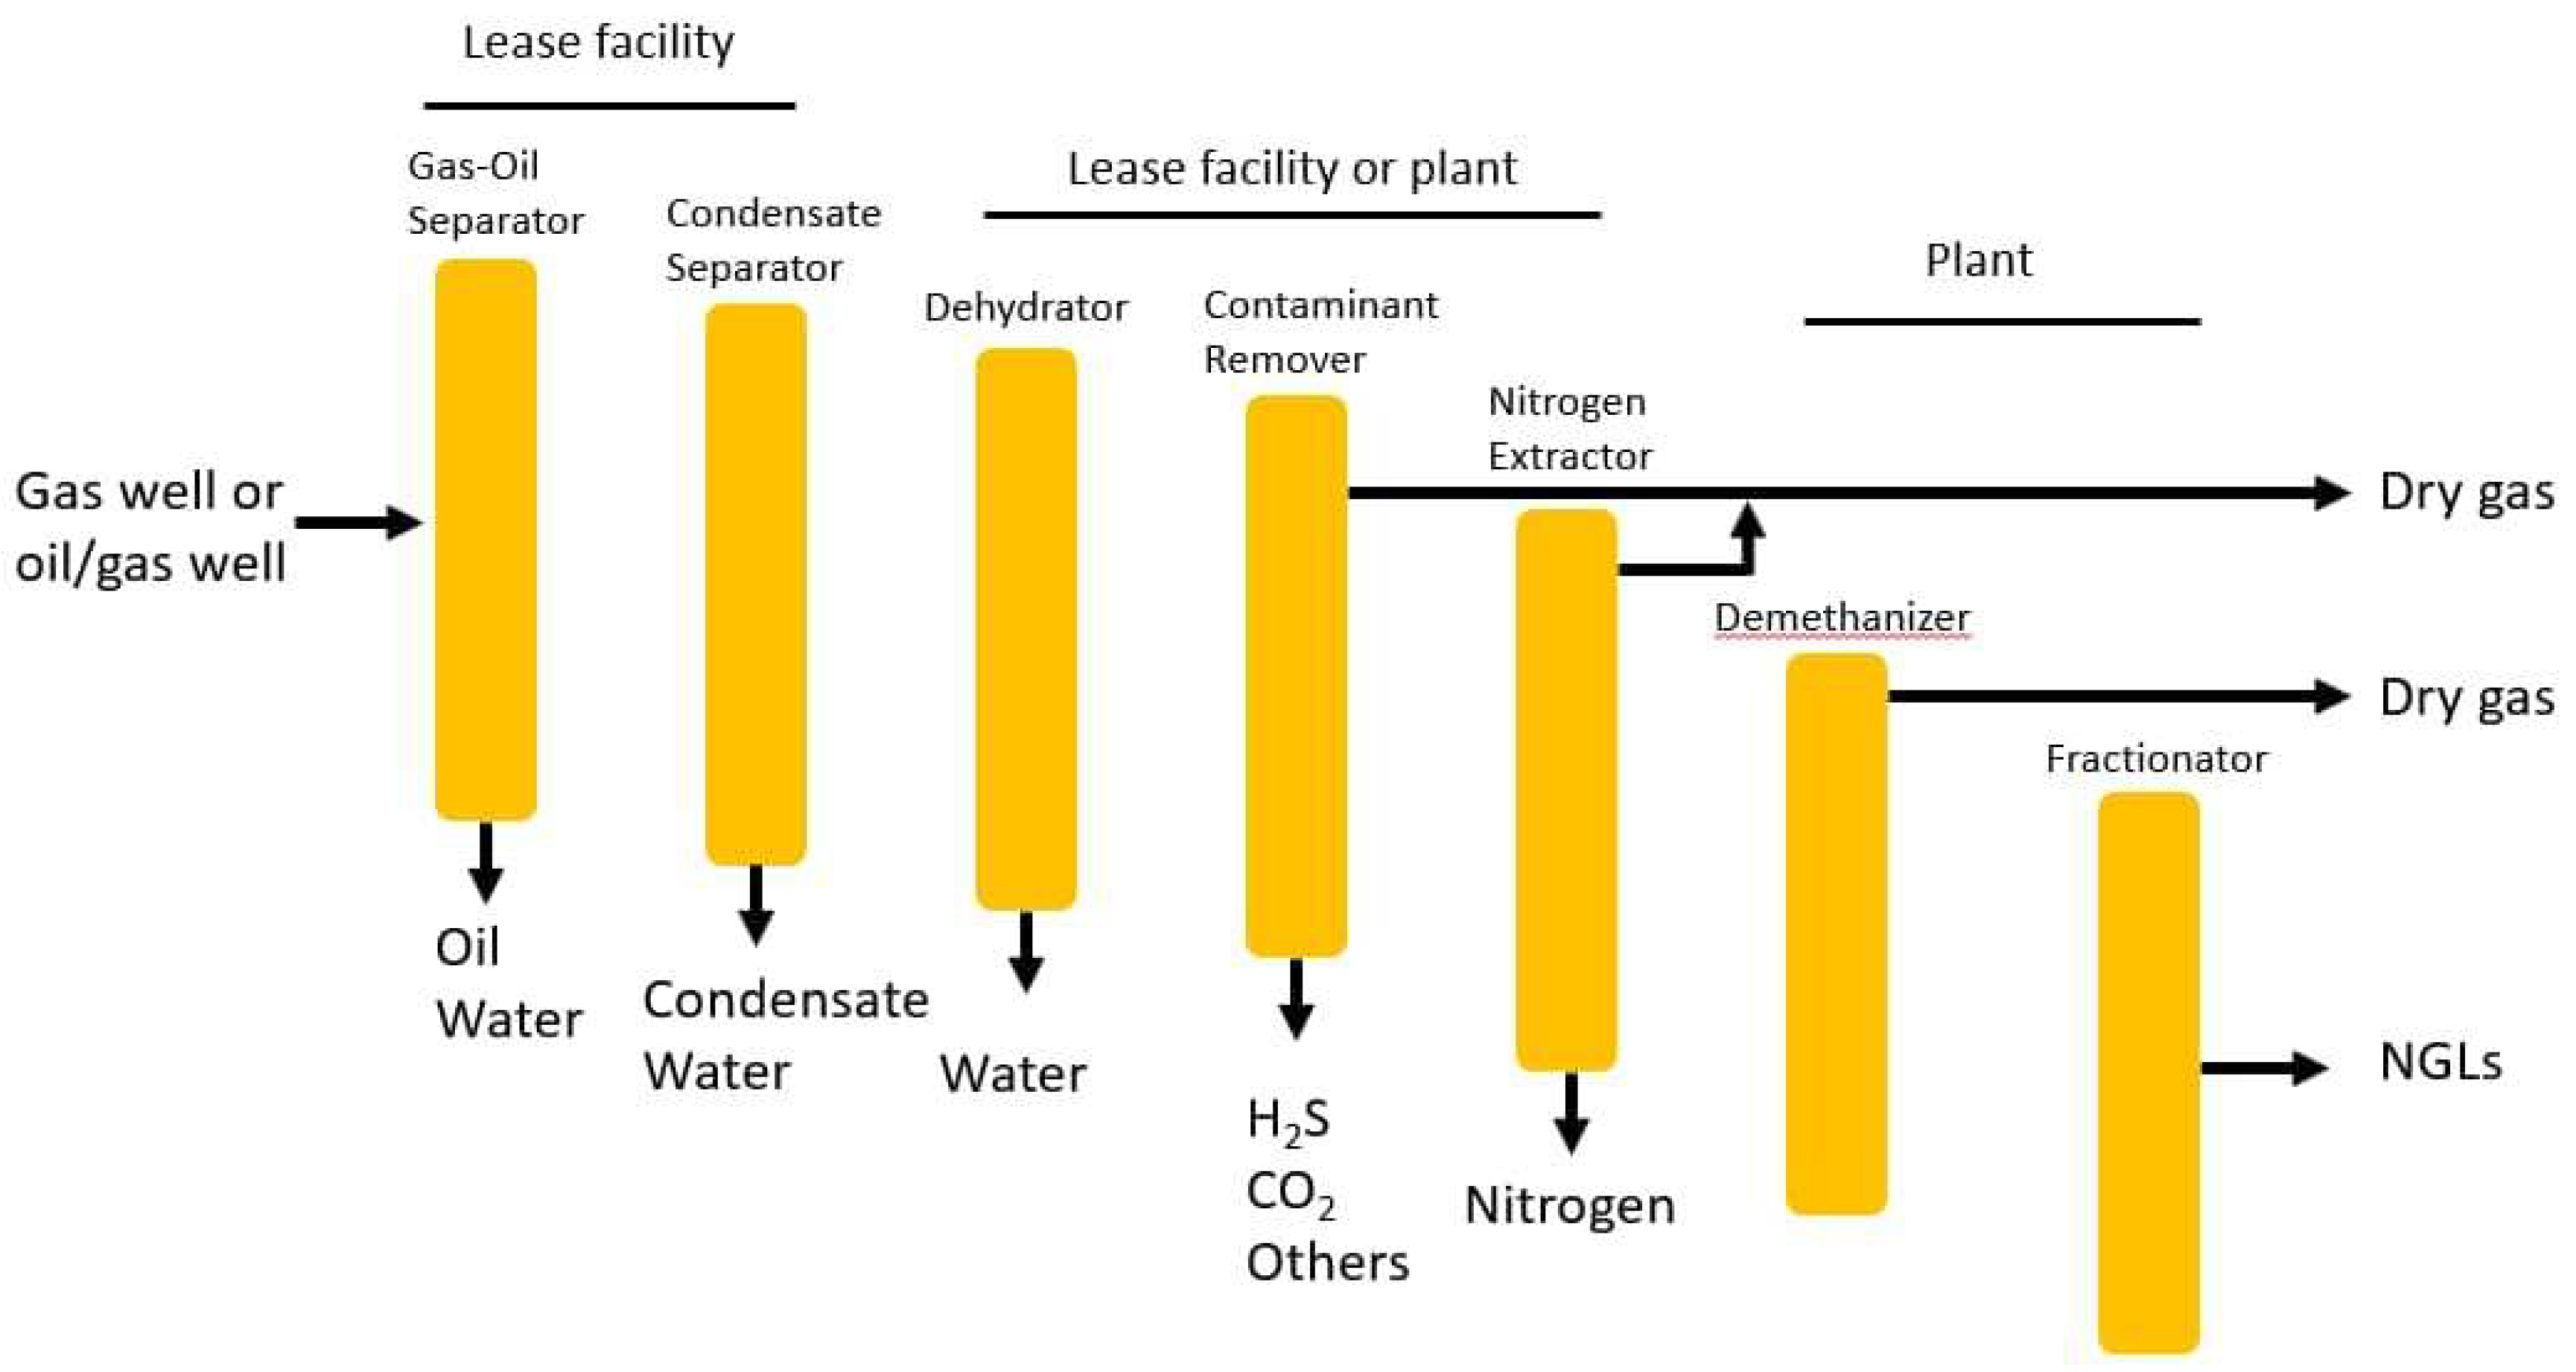
Figure 1. which illustrates the gas processing flow, provides a detailed representation of the various stages and equipment involved in this process.
Preprints 94797 g001
Figure 2. LNG Unit Simulation Environment.
Preprints 94797 g002
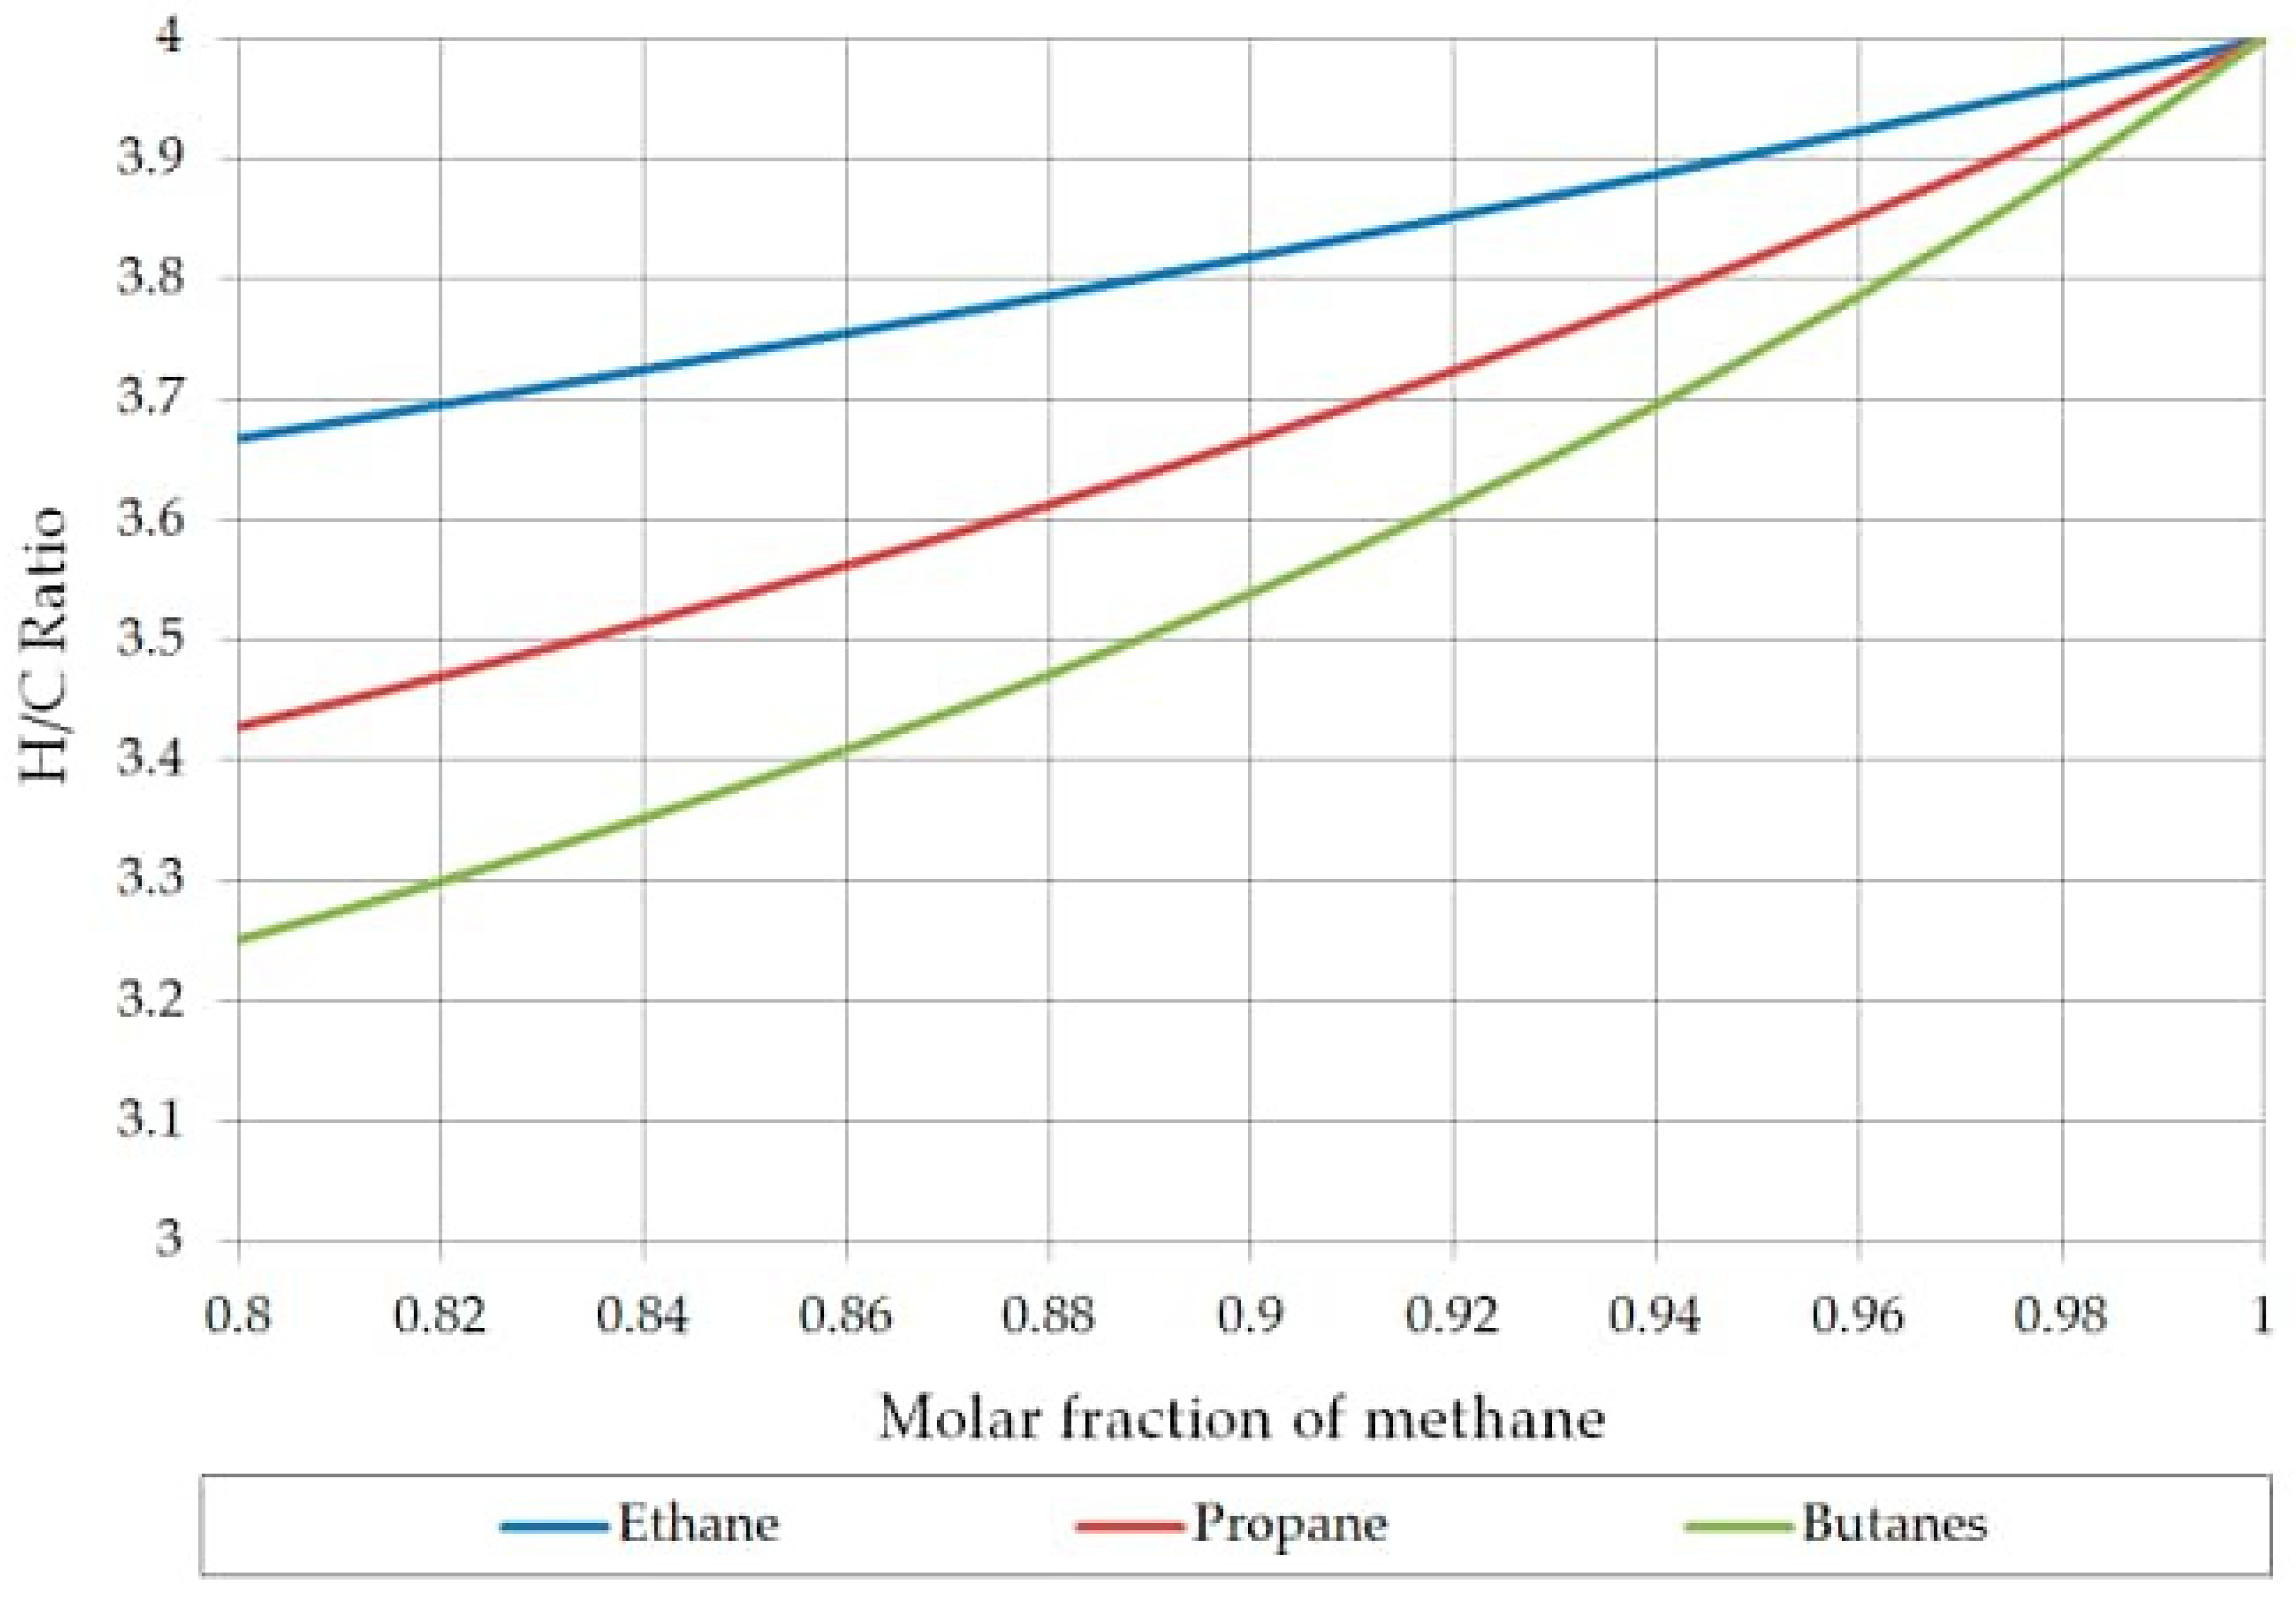
Figure 3. represents a comprehensive analysis of the relationship between the consumed energy per ton of produced LNG and the mass fraction of methane in the liquefaction cycle.
Preprints 94797 g003
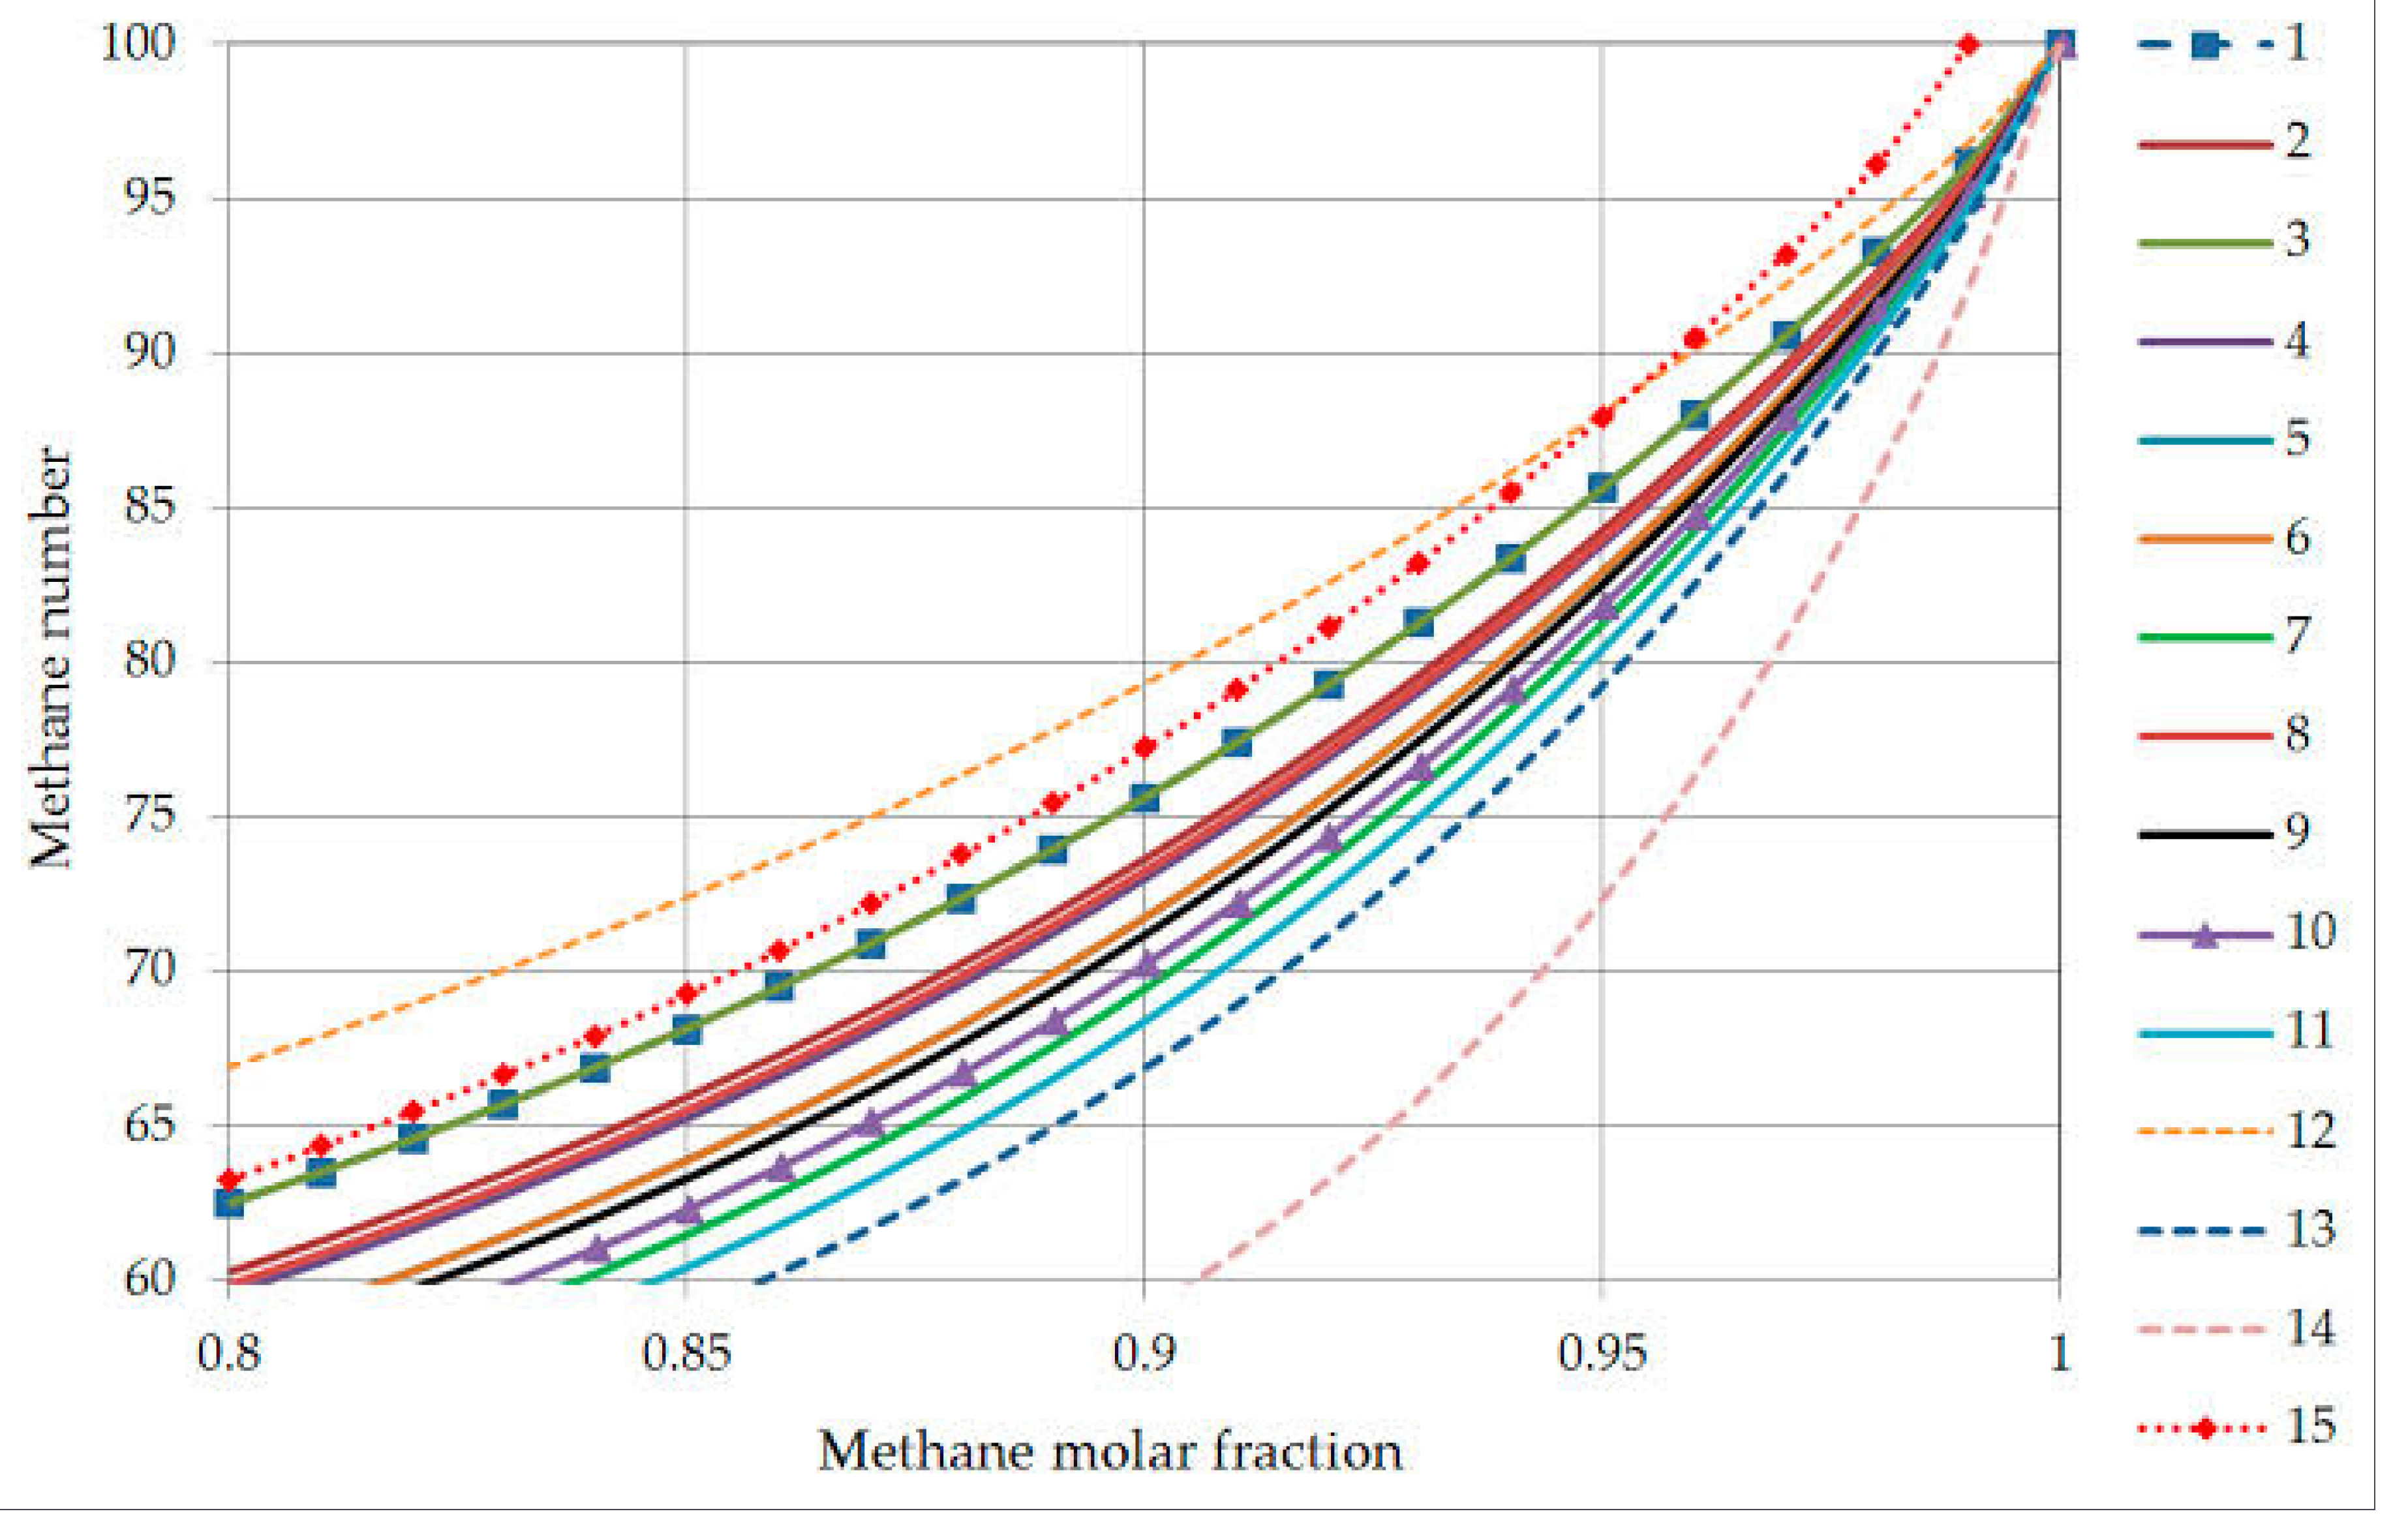
Figure 4. provides a comprehensive analysis of the relationship between the consumed energy per ton of produced LNG and the mass fraction of nitrogen in the sub-cooling cycle.
Preprints 94797 g004
Figure 5. illustrates a comprehensive analysis of the relationship between consumed energy and the outlet pressure from the compressor for the liquefaction cycle.
Preprints 94797 g005
Figure 6. presents a detailed PVT (Pressure-Volume-Temperature) diagram for the precooling cycle.
Preprints 94797 g006
Figure 7. showcases a comprehensive PVT (Pressure-Volume-Temperature) diagram specifically designed for the liquefaction cycle.
Preprints 94797 g007
Figure 8. presents an insightful PVT (Pressure-Volume-Temperature) diagram specifically dedicated to the sub-cooling cycle.
Preprints 94797 g008
Figure 9. presents a comprehensive PVT (Pressure-Volume-Temperature) diagram specifically focused on the final LNG (Liquefied Natural Gas) product.
Preprints 94797 g009
Table 1. presents the simulated properties of the produced LNG, showcasing essential characteristics and parameters that accurately describe its composition and behavior.
Parameters Value.
Vapor phase fraction 0
Temperature -160
Pressure(kpa) 600
Mass density(kg/m3 458.256
Mass heat capacity (kj/kg.C) 3.182
Viscocity(CP) 0.112
Thermal conductivity(W/mK) 0.196.)
Mass heat of vaporization(KCal/Kg) 156.036.
Table 2. presents the ASPEN HYSYS-derived mass fractions of the optimal refrigerants, representing a comprehensive analysis that identifies the most effective composition for different stages of the process.
Stage Refrigerant Mass fraction
Liquefaction Ethane.
Methane
0.13.
0.89
Subcooling Nitrogen.
Methane
0.5.
0.7
Table 3. presents the specifications of streams within the Liquefaction Stage, detailing key variables that define their properties and behavior. Variables.
Variables. E-M(A) E-M(B) E-M(C) E-M(D)
Vapor fraction 0.97 2 1 1
Temperature -114.2 -113.8 -79.I -102.2
Pressure(Kpa) 400 390 700 700
Table 4. highlighting the specifications of the streams in the Subcooling Stage:.
Variable. A B C D E F
Vapor fraction 0.365 0.997 1 1 1 1
Temperature -165 -150.2 -71.8 -60 -76 -125.7
Pressure(Kpa) 400 390 1800 1791 1760 420
Table 5. which compares various designs:.
Design Process Compression Efficiency Kw/ton
prico Singles mixed Refrigereation 100 16.9
Kryokap EXP. Tubo-expander 100 15.7
Conoco philips. Optimized The cascades Refrigeration 100 14.3
Dual TEX Cycle The Tubo-EXpand 100 16.7
This work The Three stage exchanger-Mixed Re 76 14.81
Disclaimer/Publisher’s Note: The statements, opinions and data contained in all publications are solely those of the individual author(s) and contributor(s) and not of MDPI and/or the editor(s). MDPI and/or the editor(s) disclaim responsibility for any injury to people or property resulting from any ideas, methods, instructions or products referred to in the content.
Copyright: This open access article is published under a Creative Commons CC BY 4.0 license, which permit the free download, distribution, and reuse, provided that the author and preprint are cited in any reuse.
Prerpints.org logo

Preprints.org is a free preprint server supported by MDPI in Basel, Switzerland.

Subscribe

© 2024 MDPI (Basel, Switzerland) unless otherwise stated