Submitted:
29 December 2023
Posted:
29 December 2023
You are already at the latest version
Abstract
Keywords:
1. Introduction
2. Materials and Methods
Raw material properties
SPS sintering
2.1. Determination of the quantity of collapsed CS
3. Results and discussion
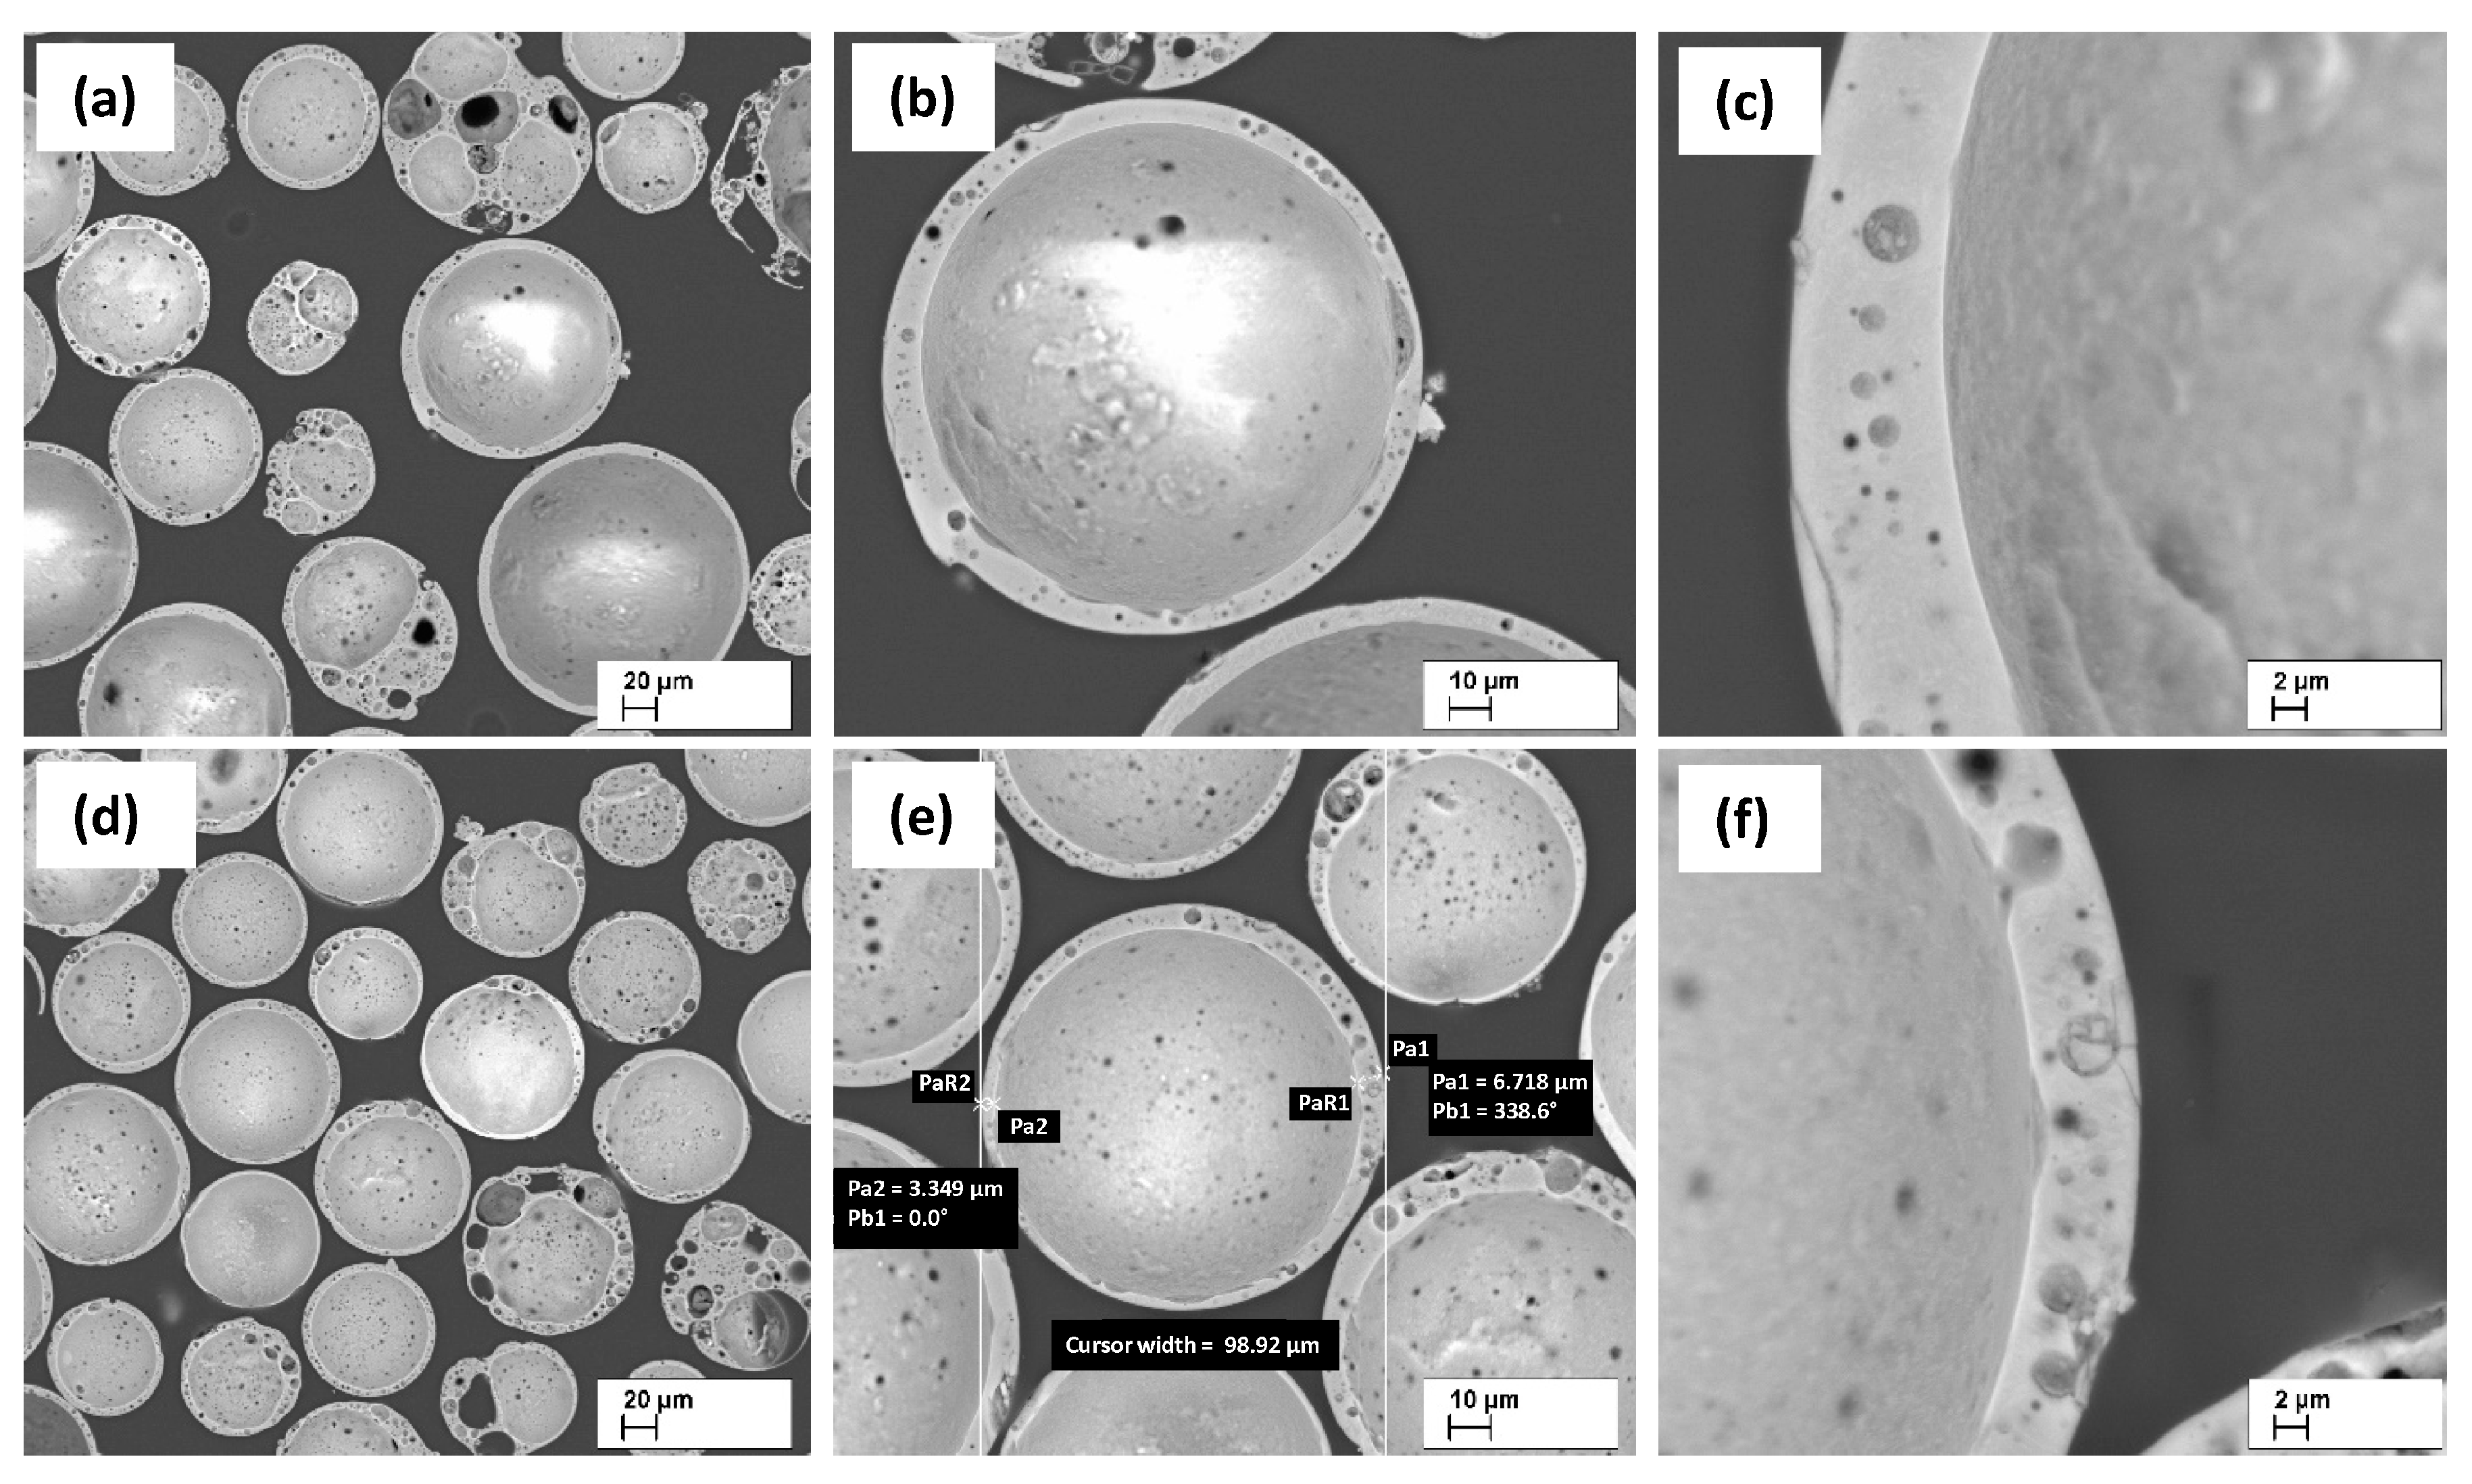
3.1. Particle destruction prior to the SPS process
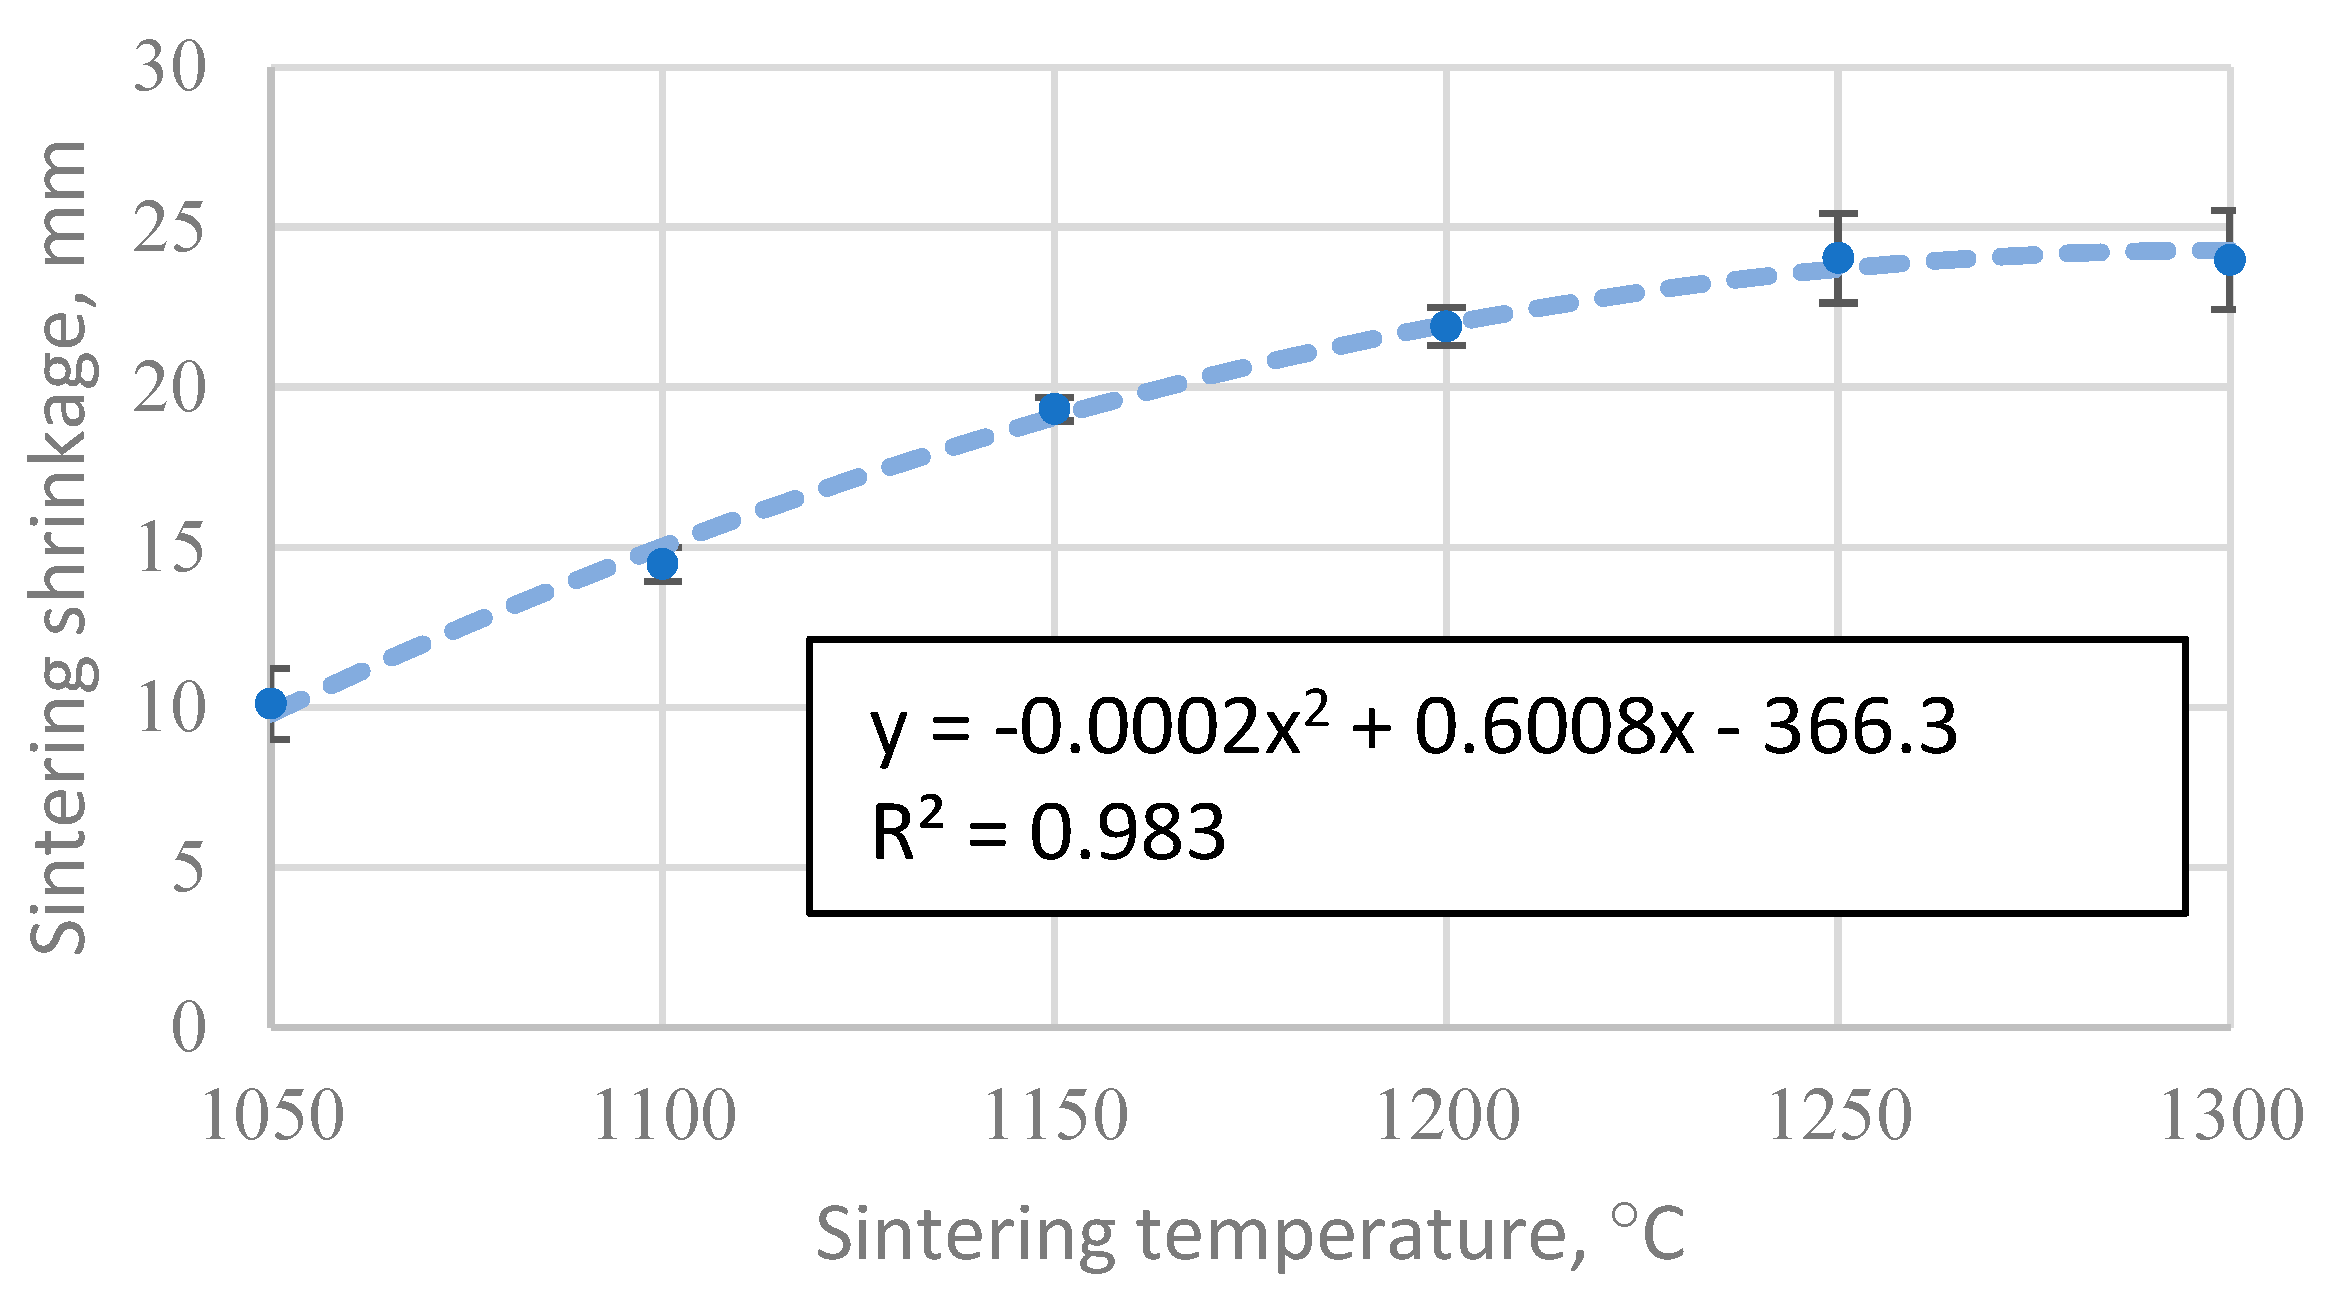
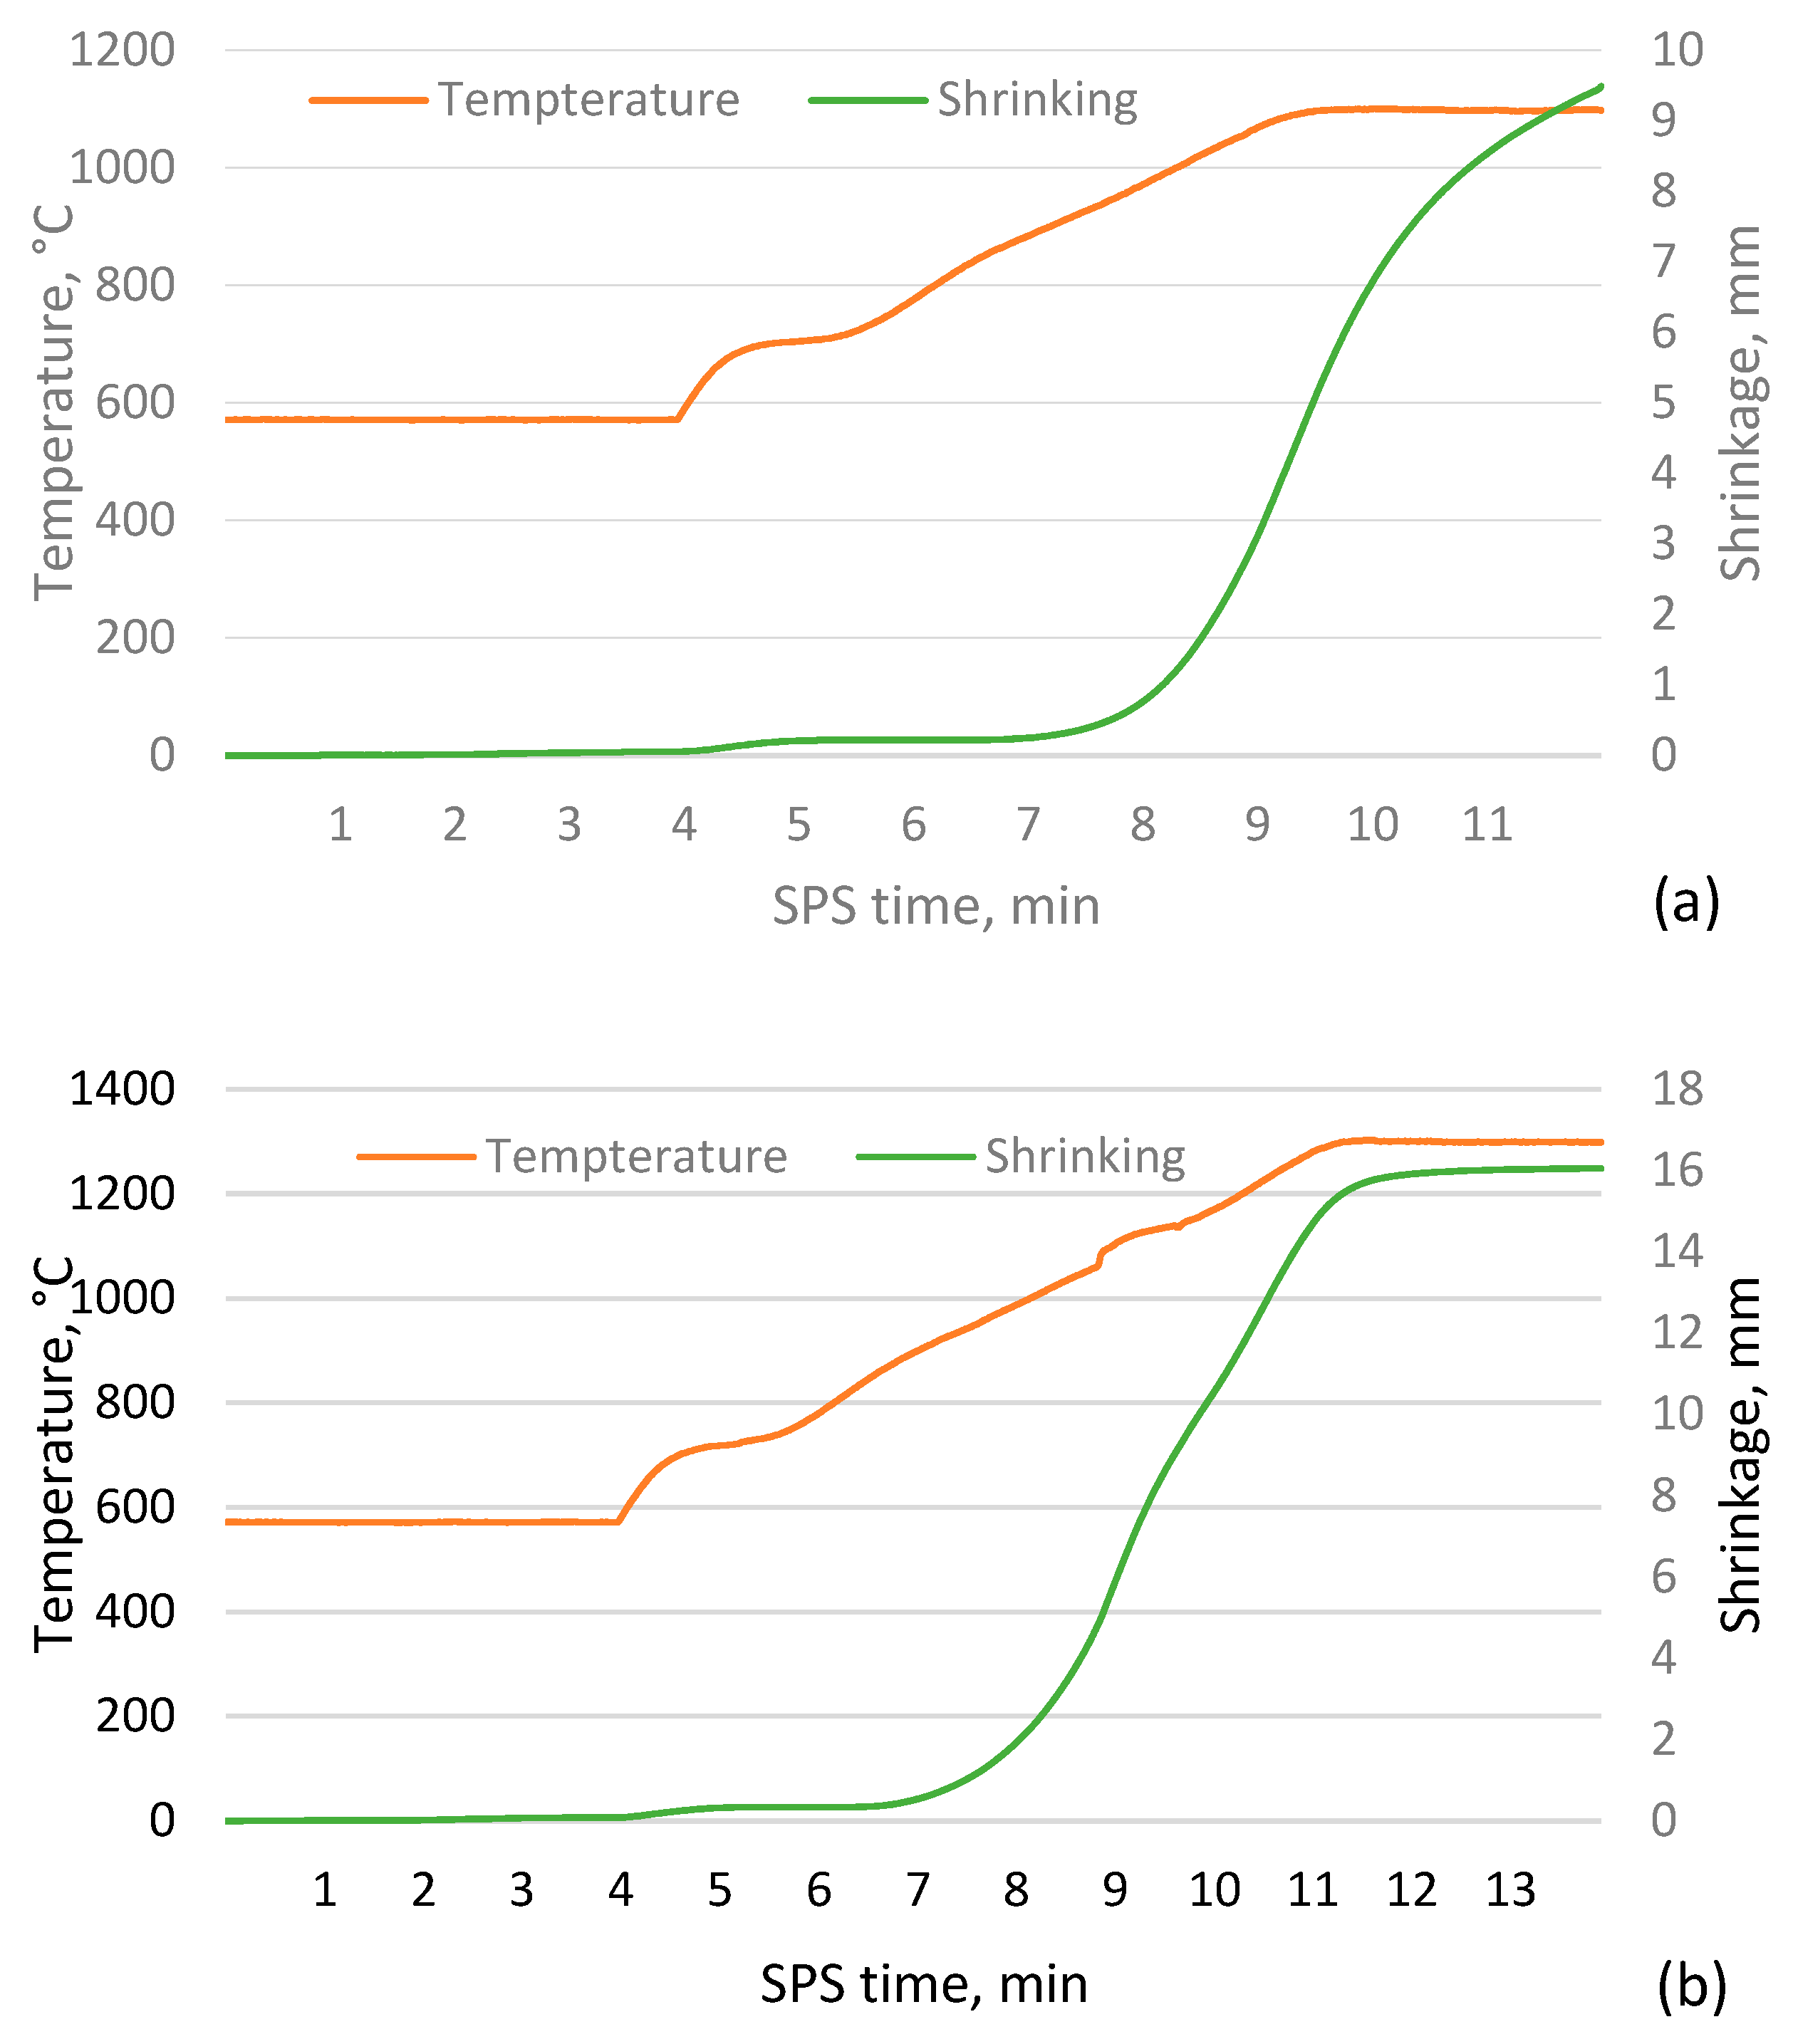
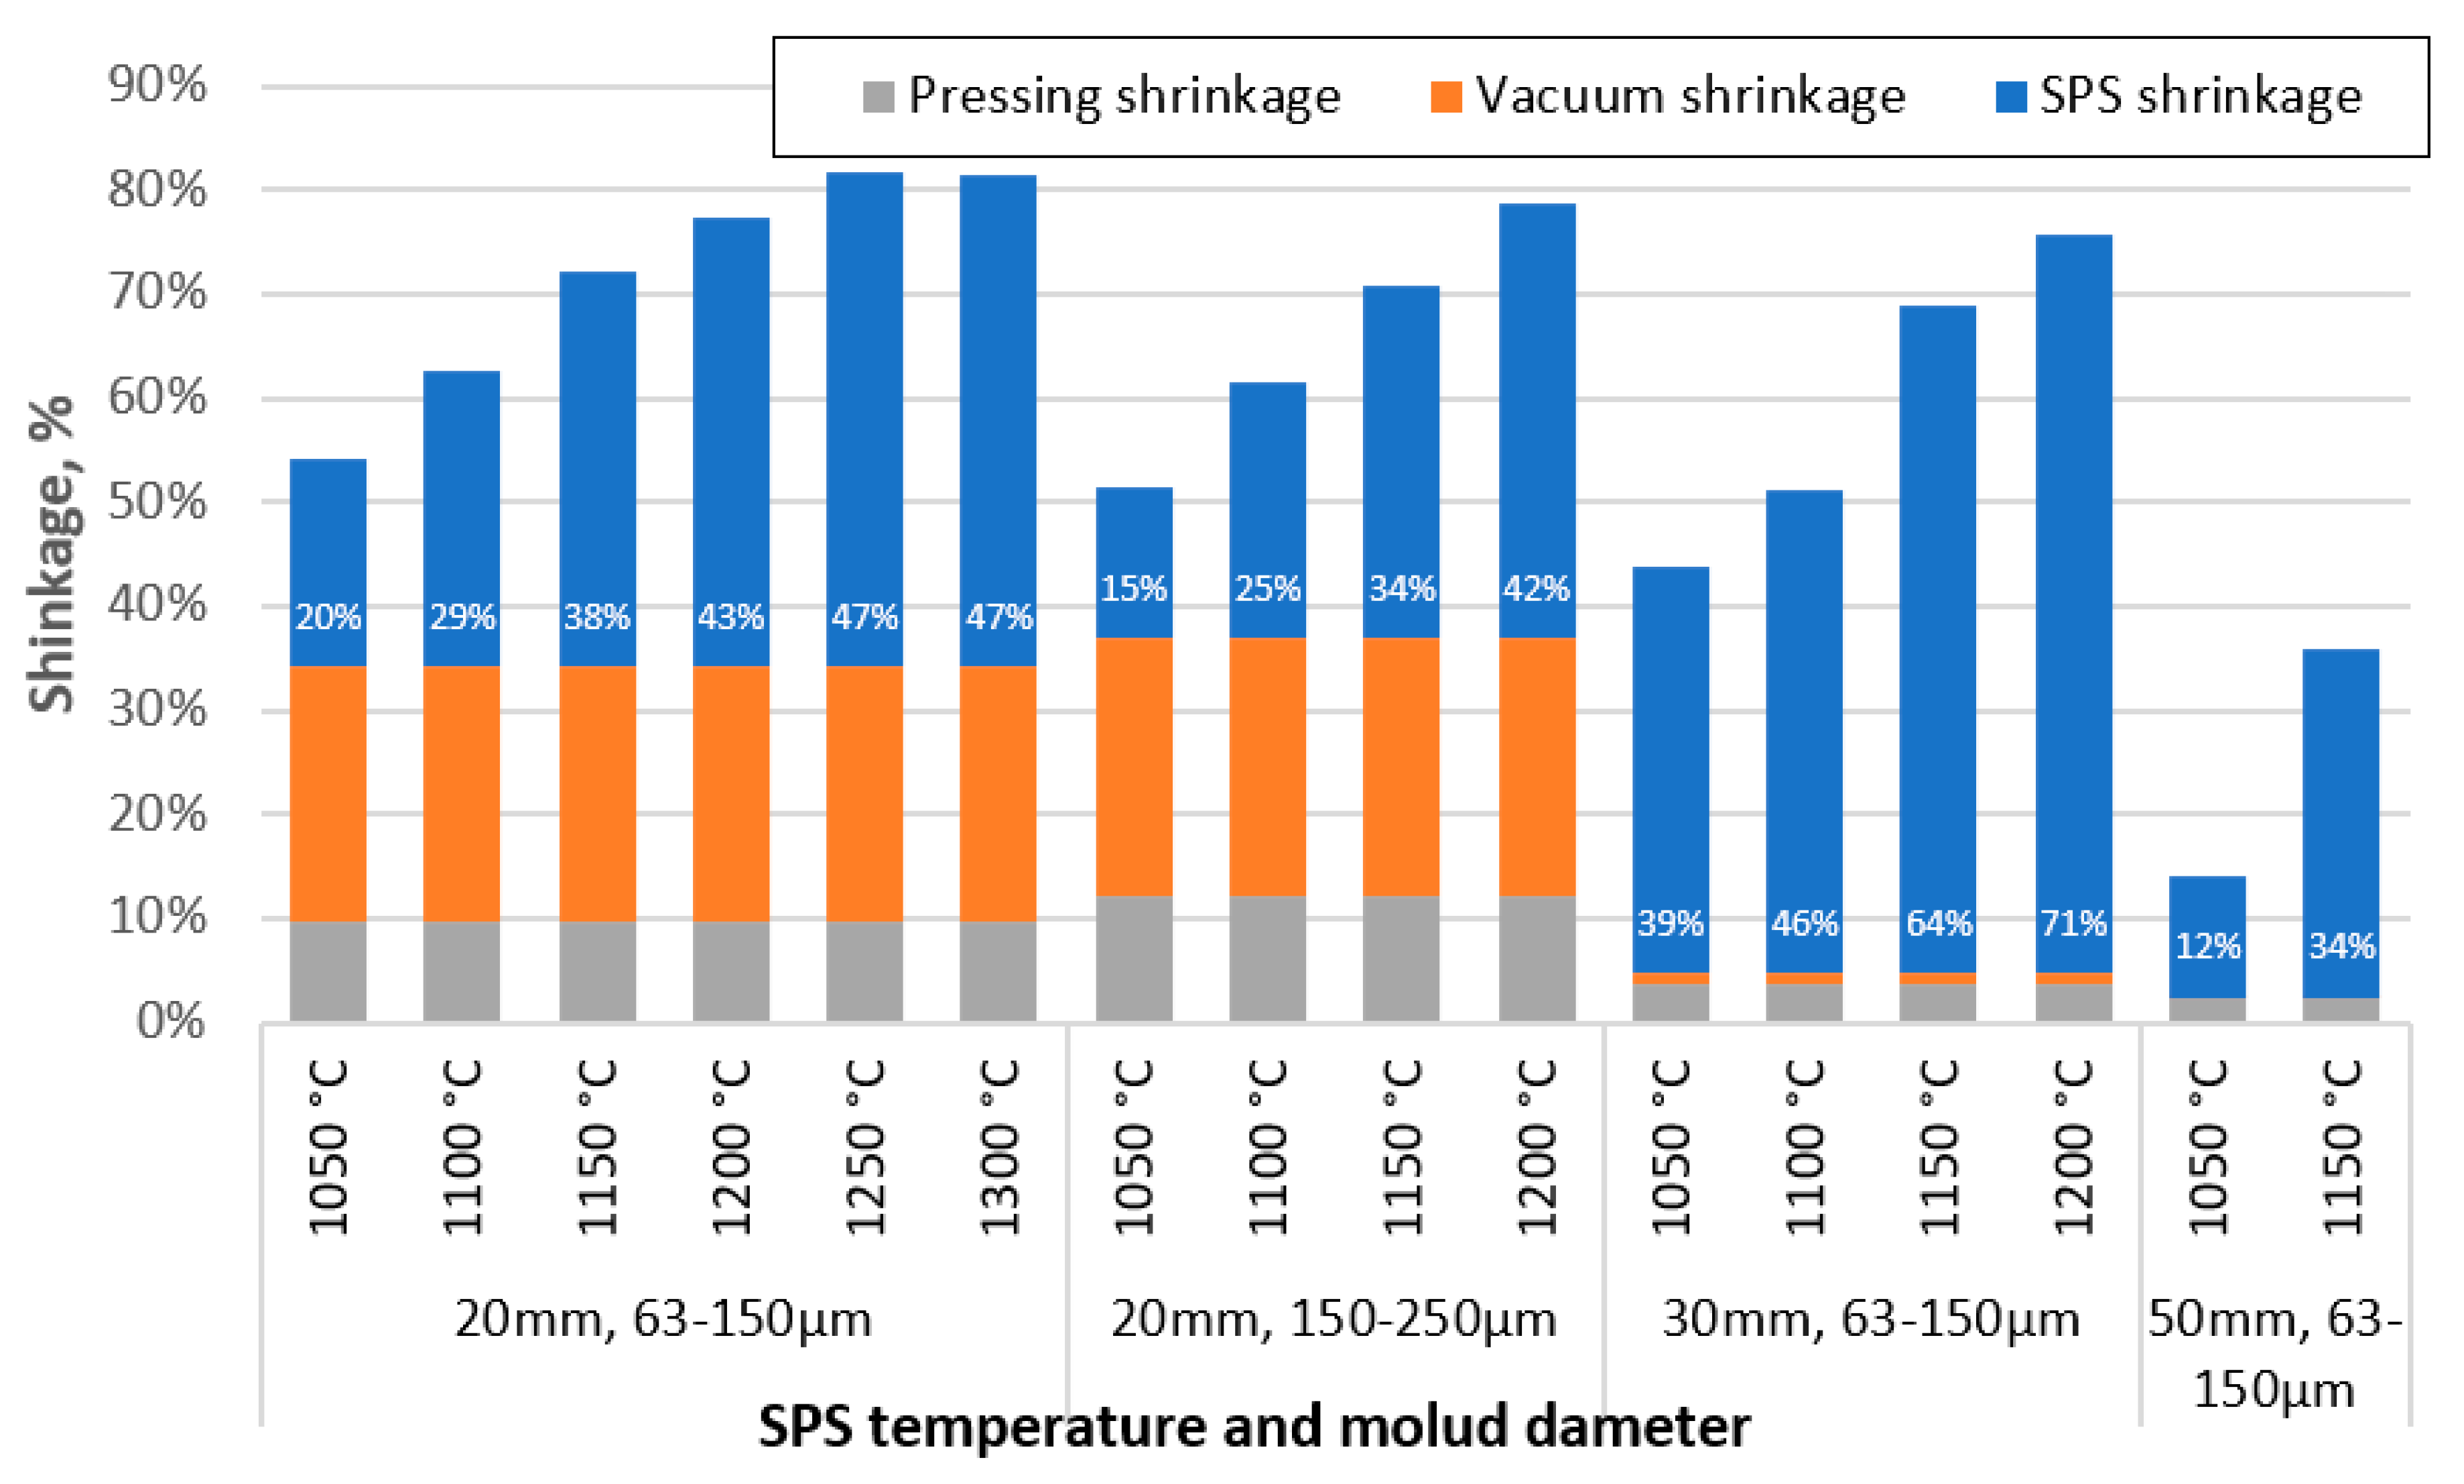
3.2. Sample shrinkage during the SPS process
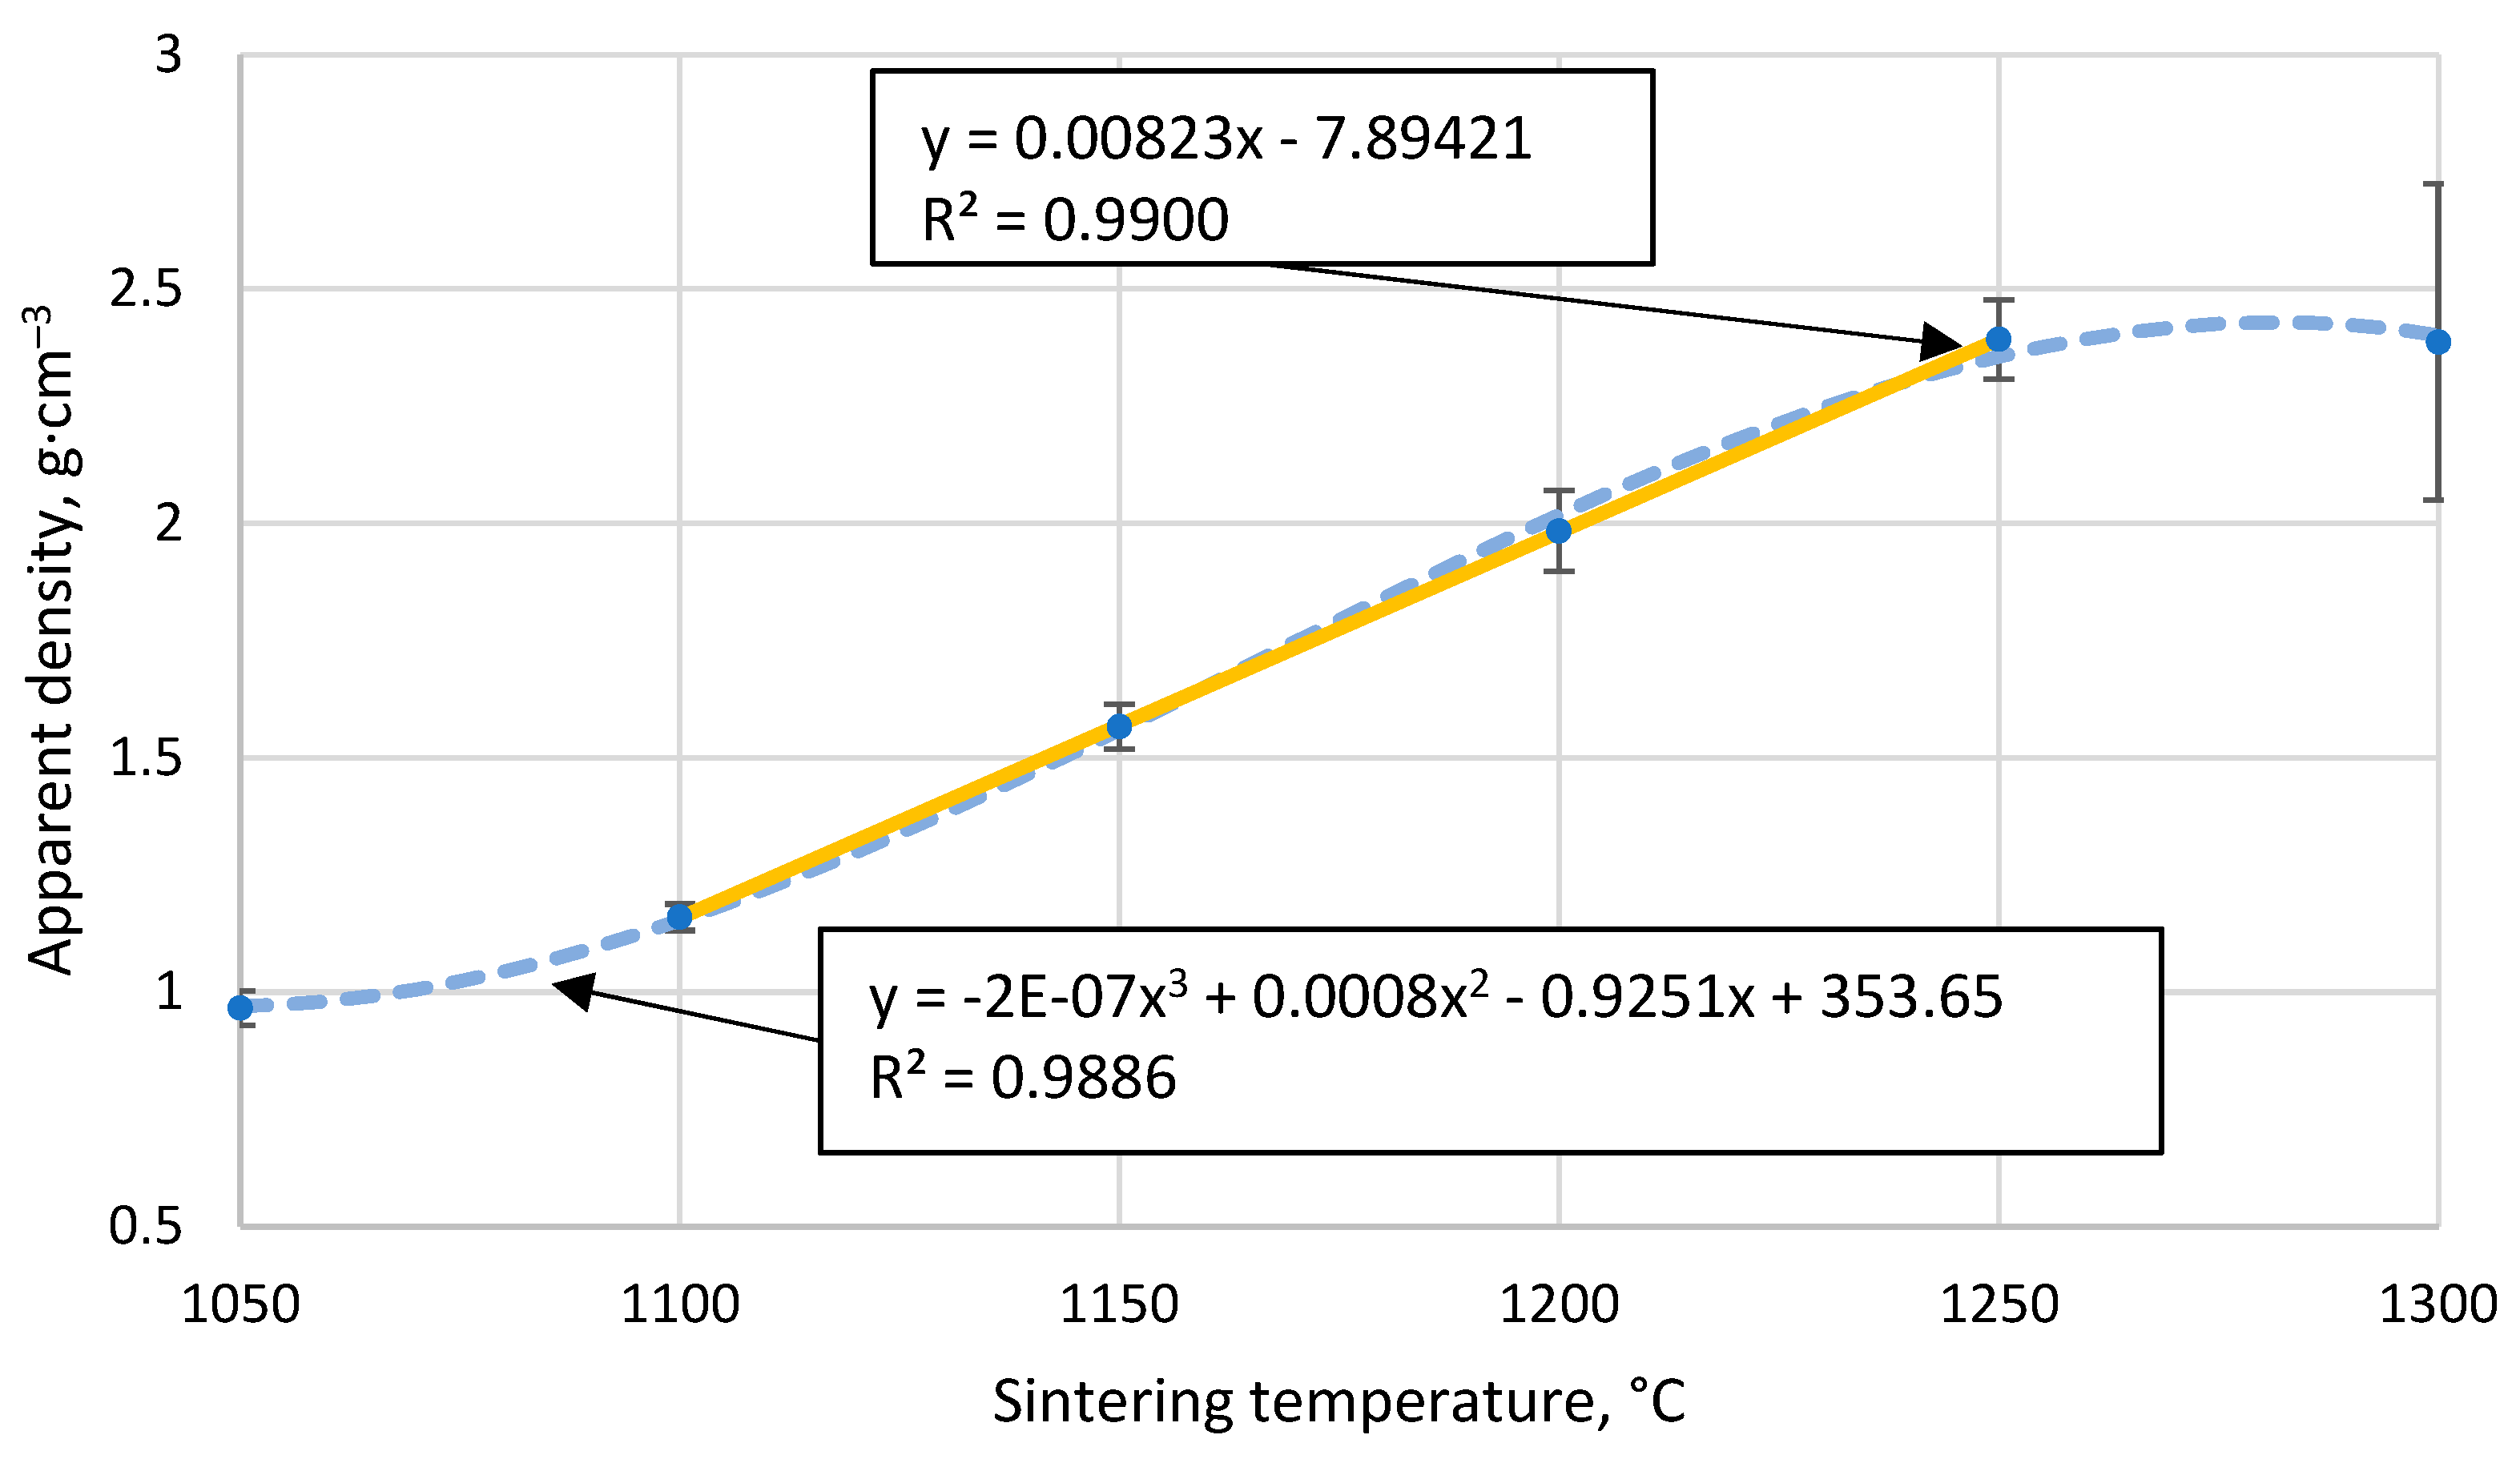
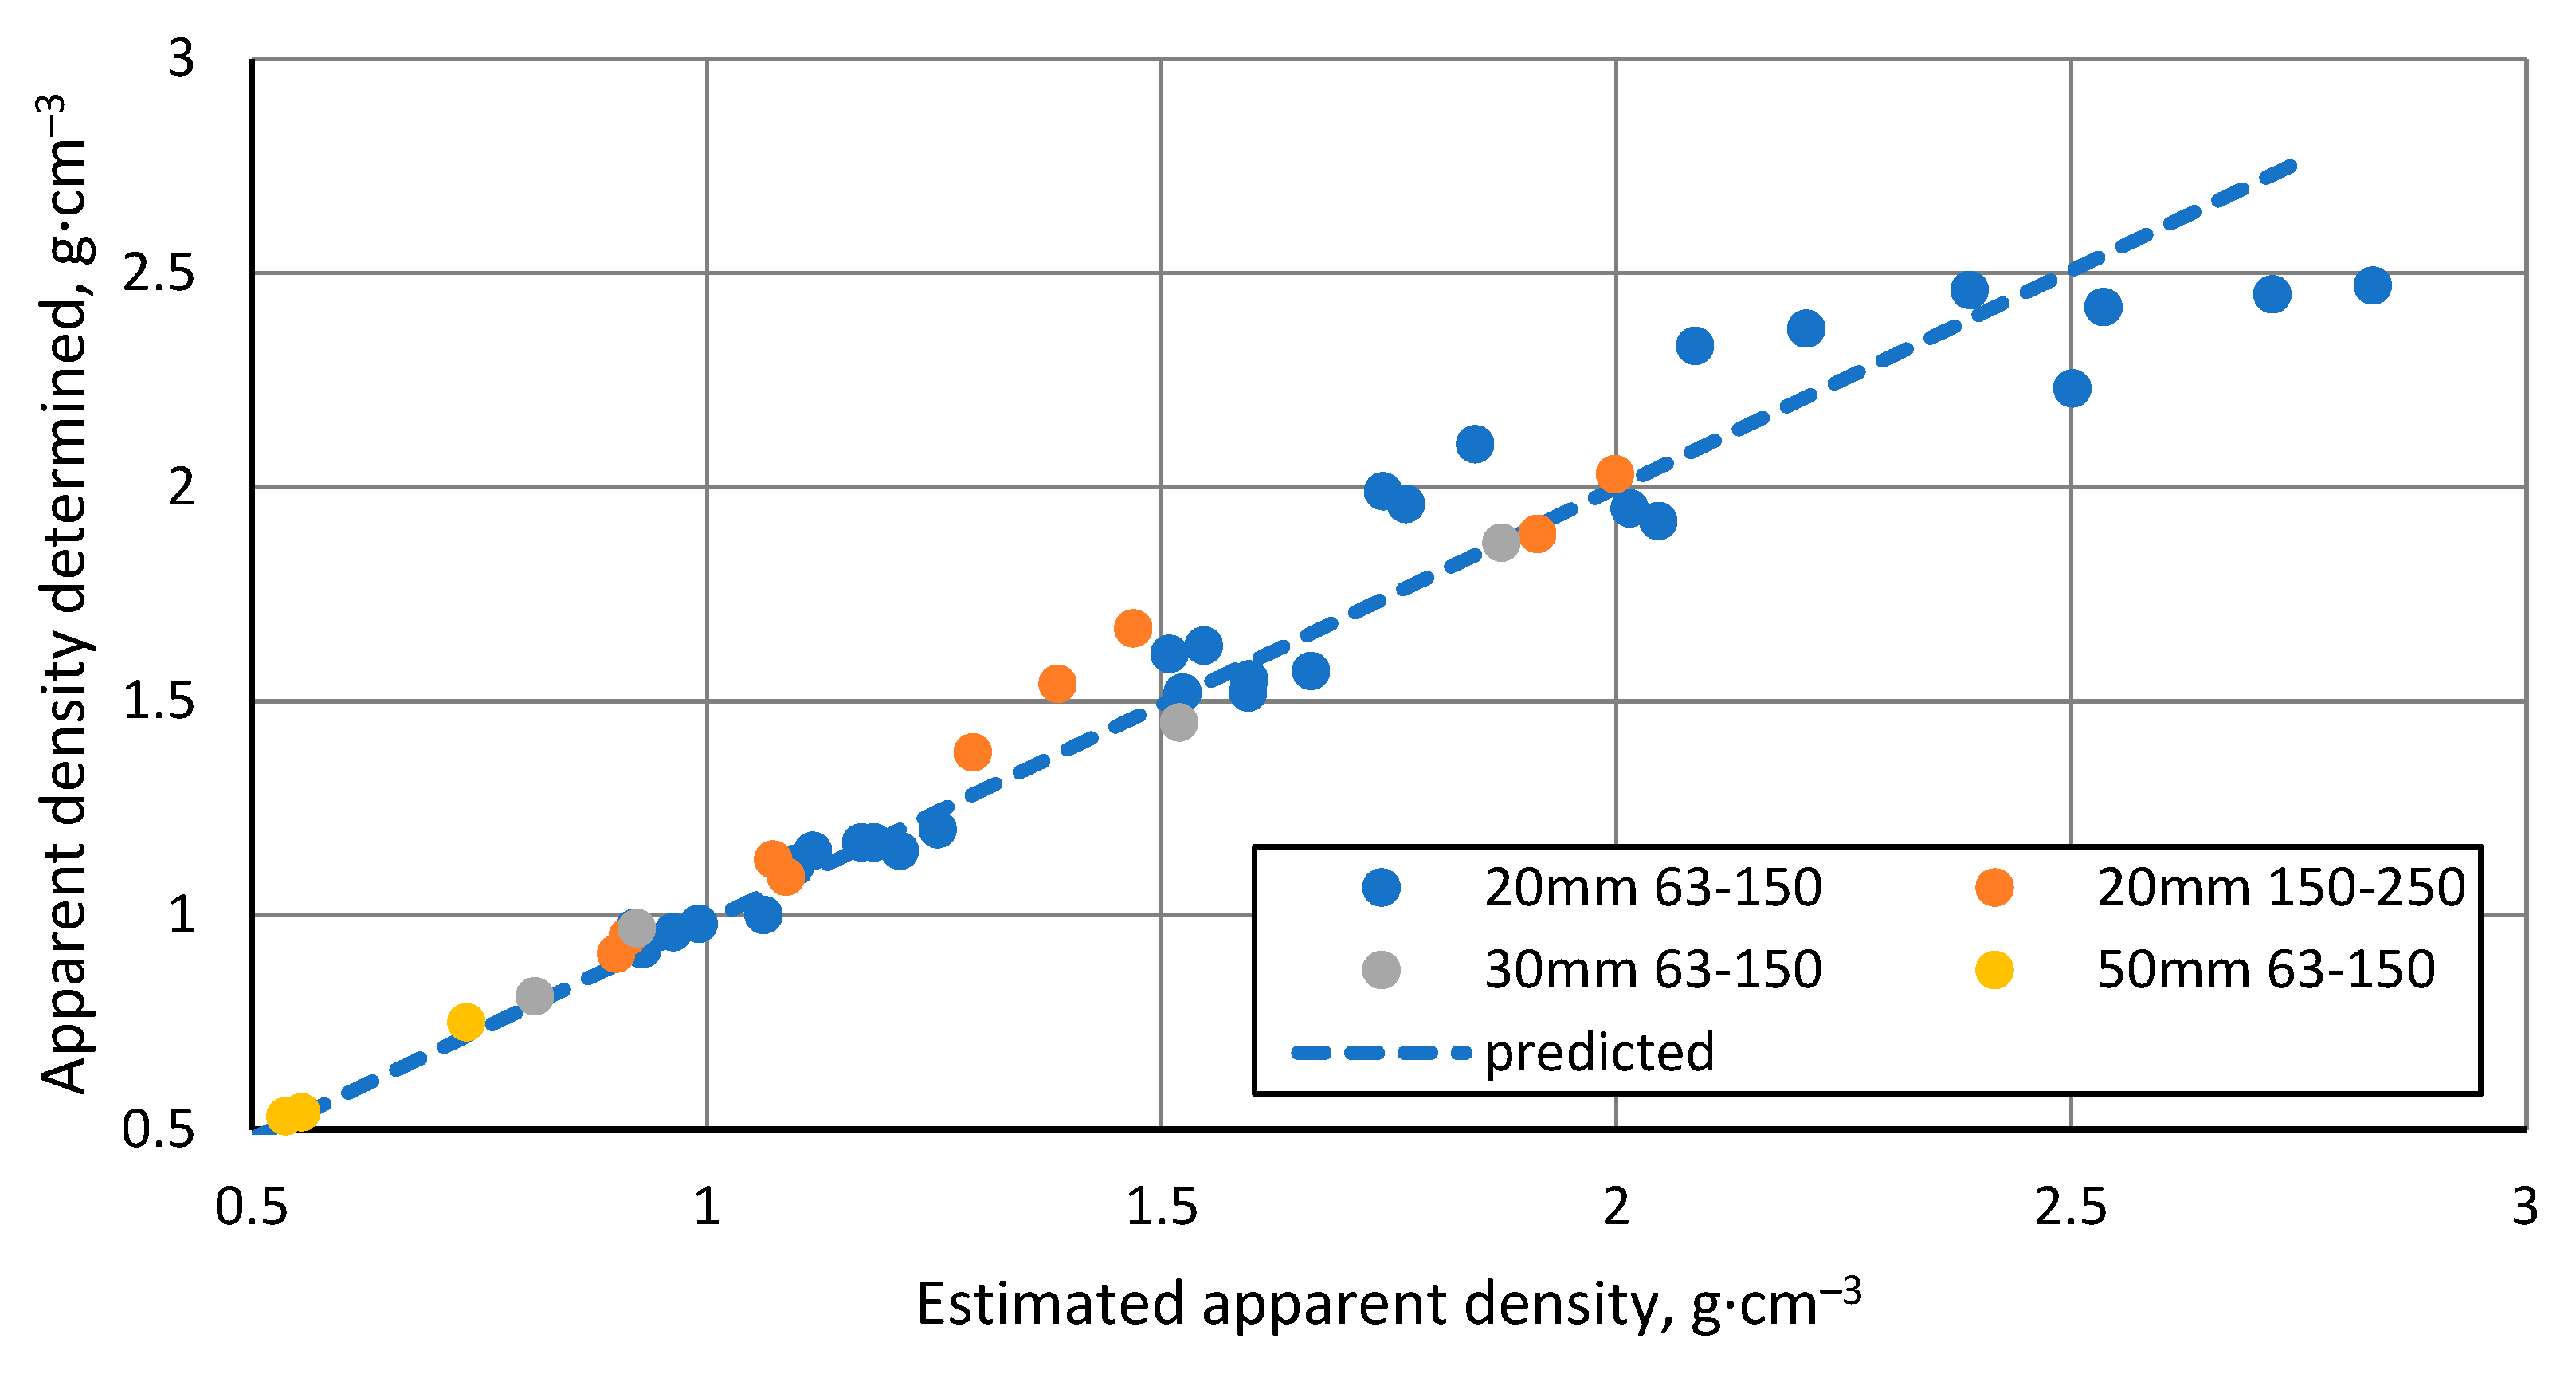
3.3. The apparent density of the resulting materials
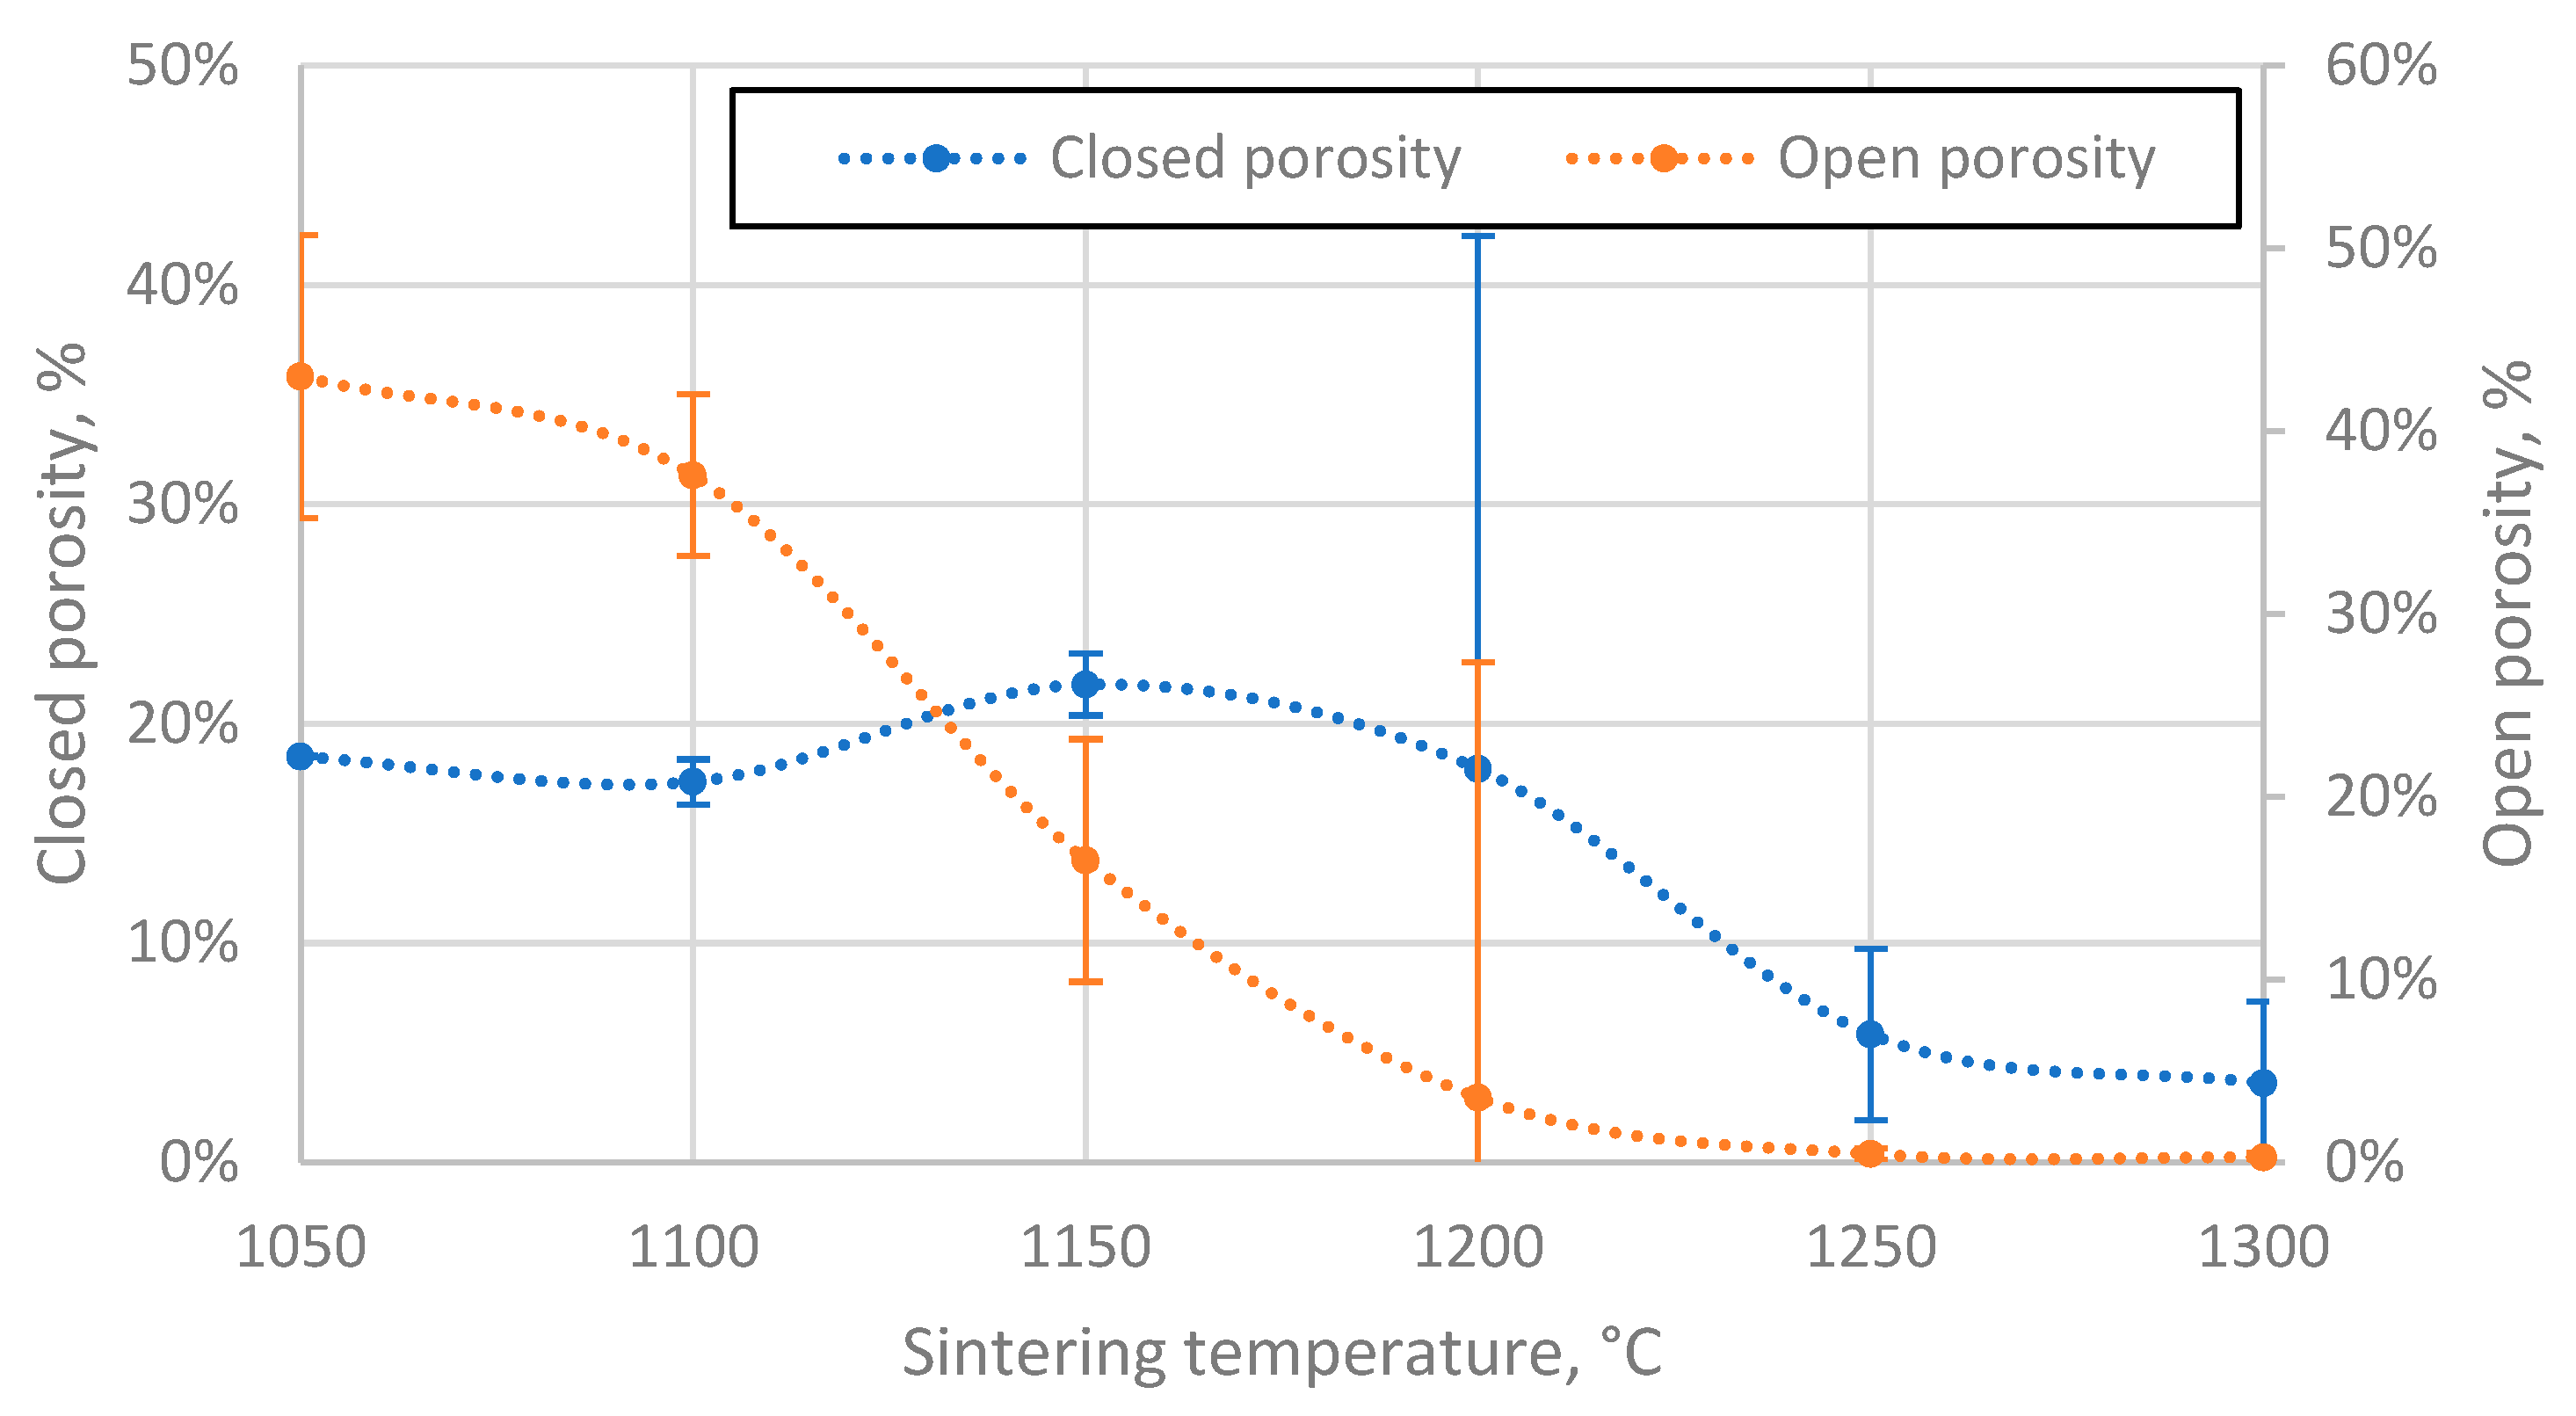
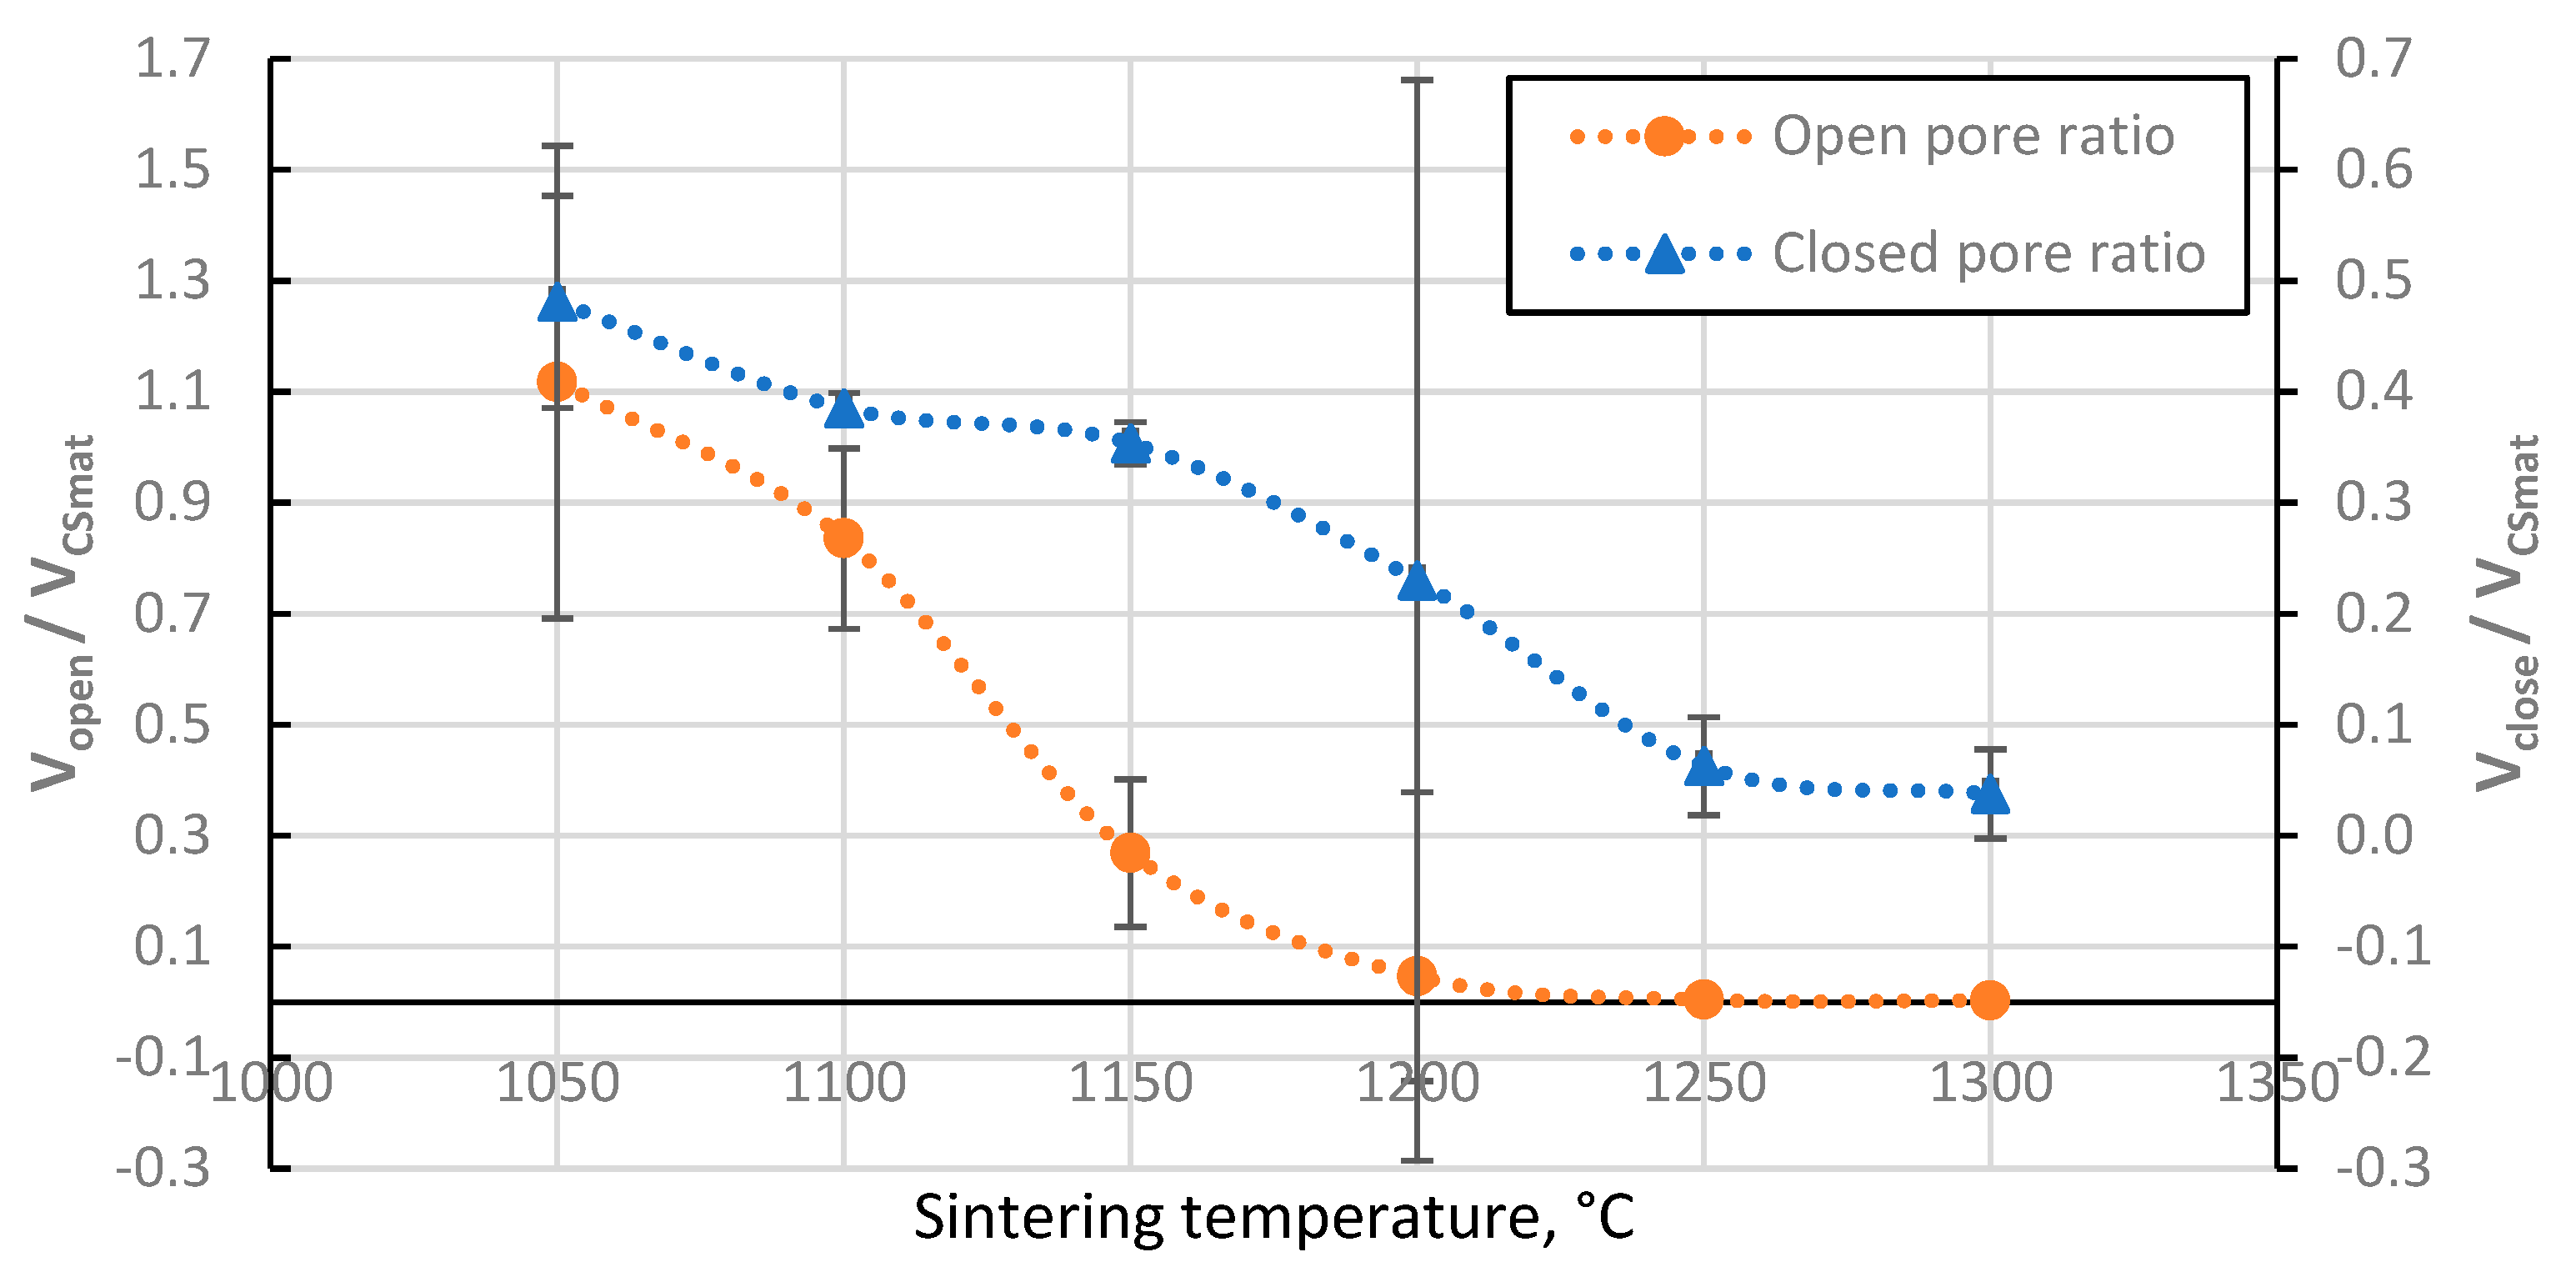
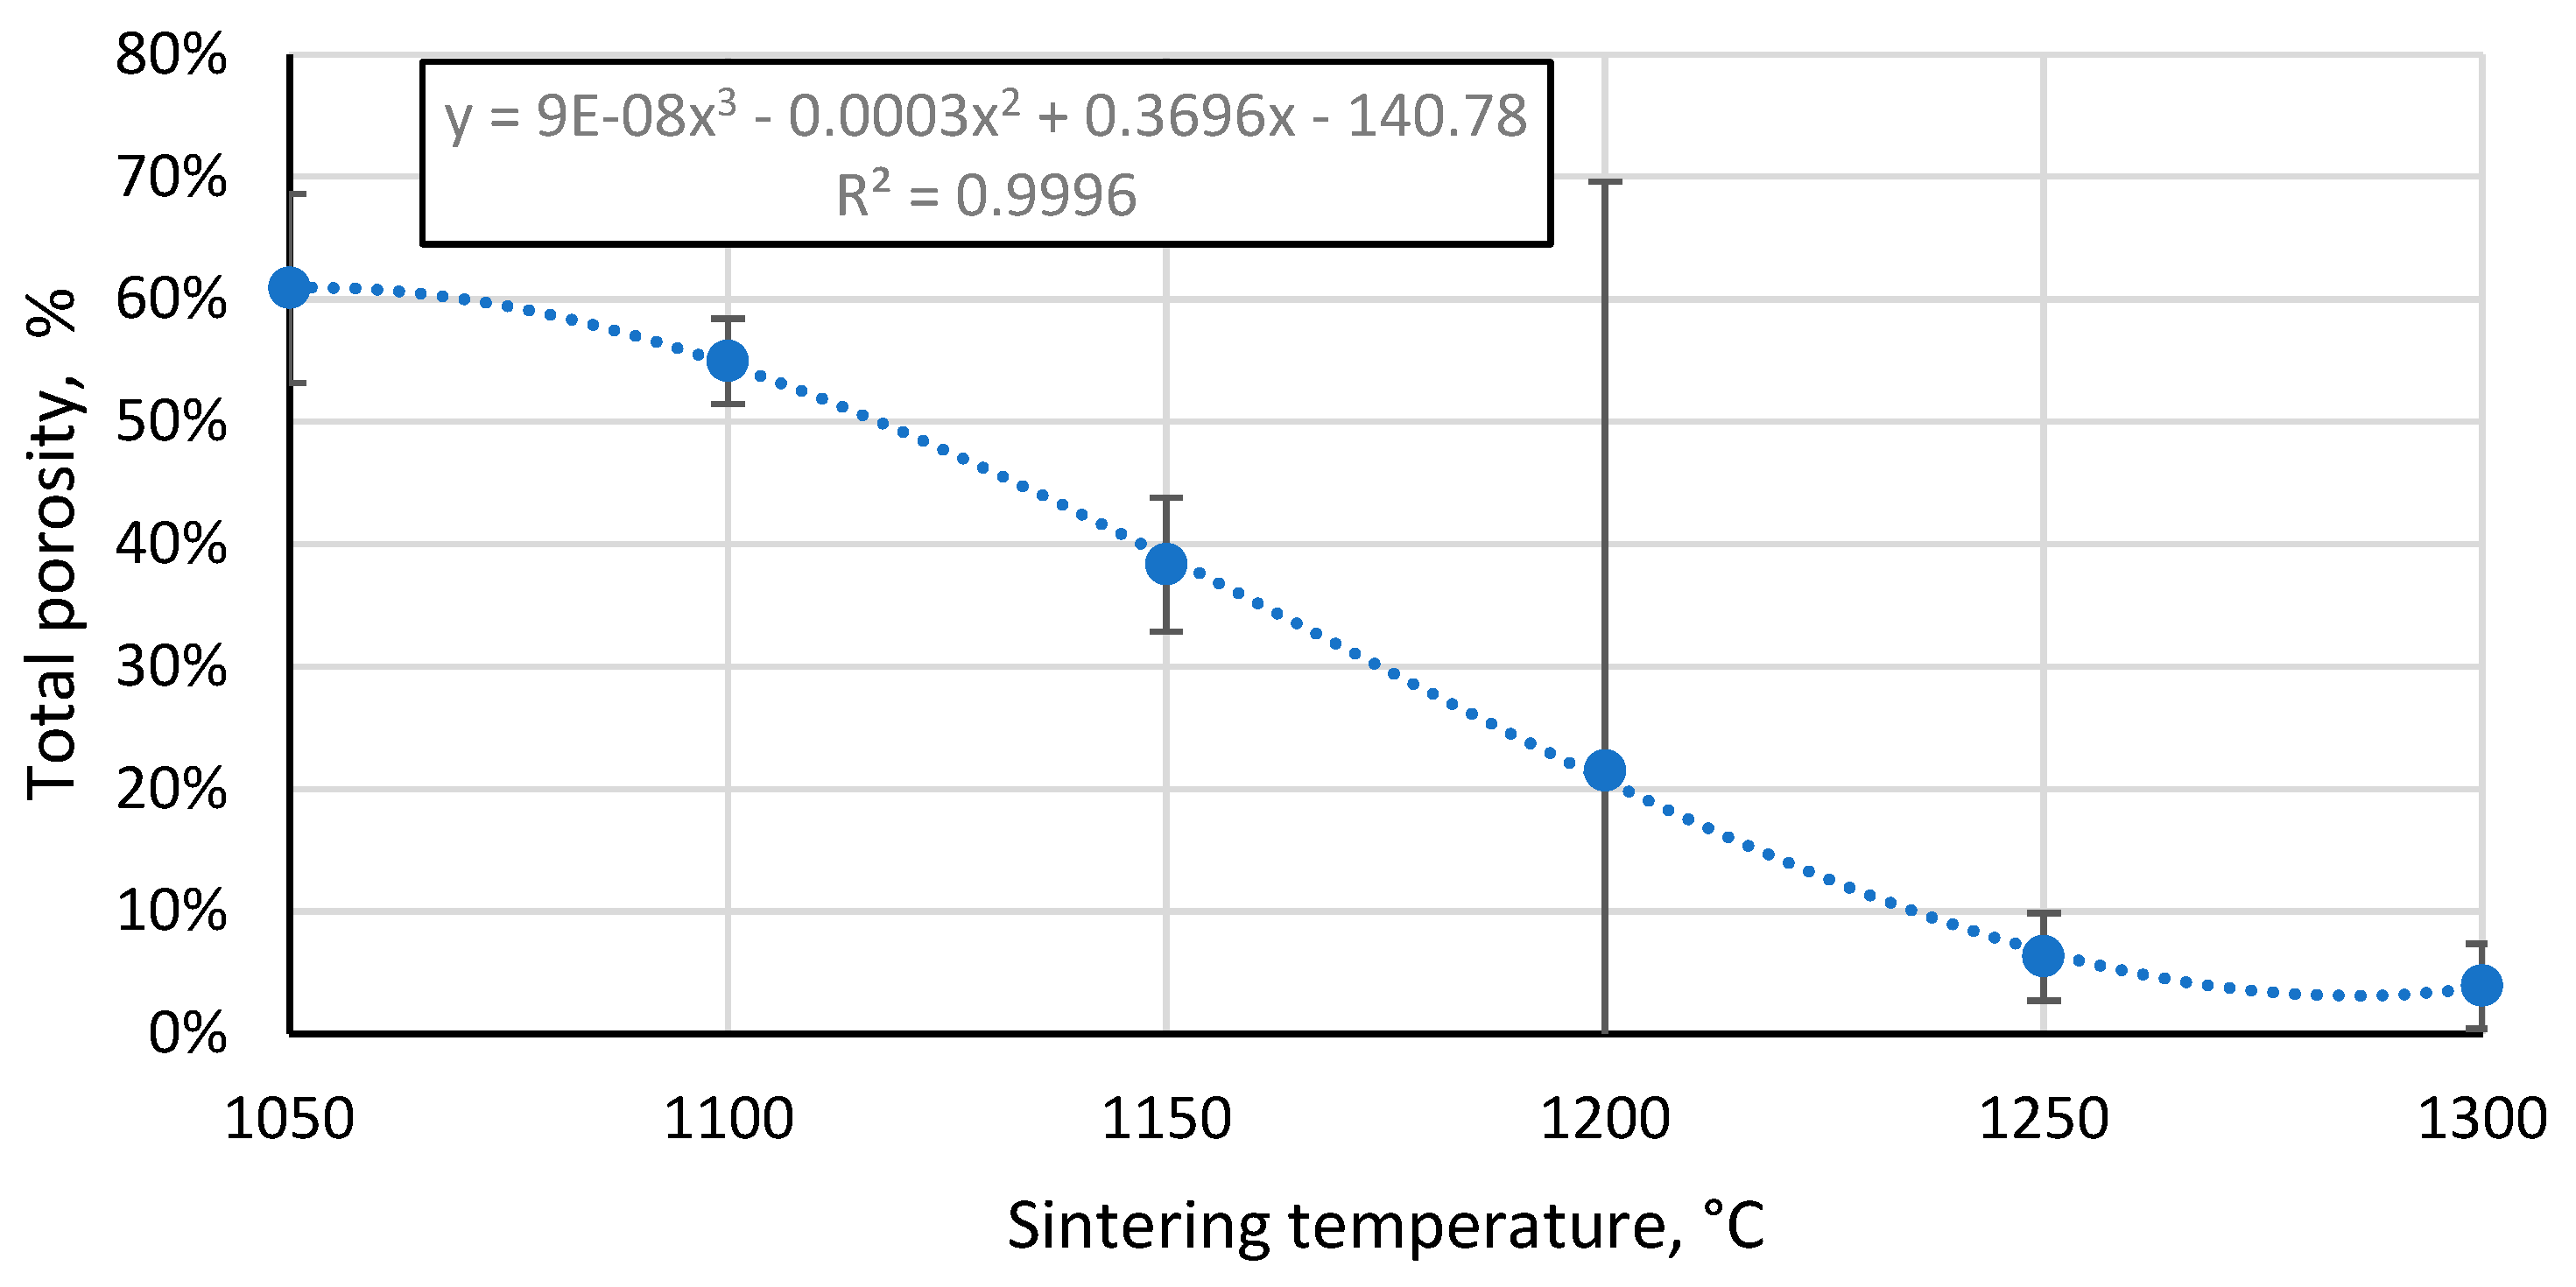
3.4. Porosity of the resulting materials
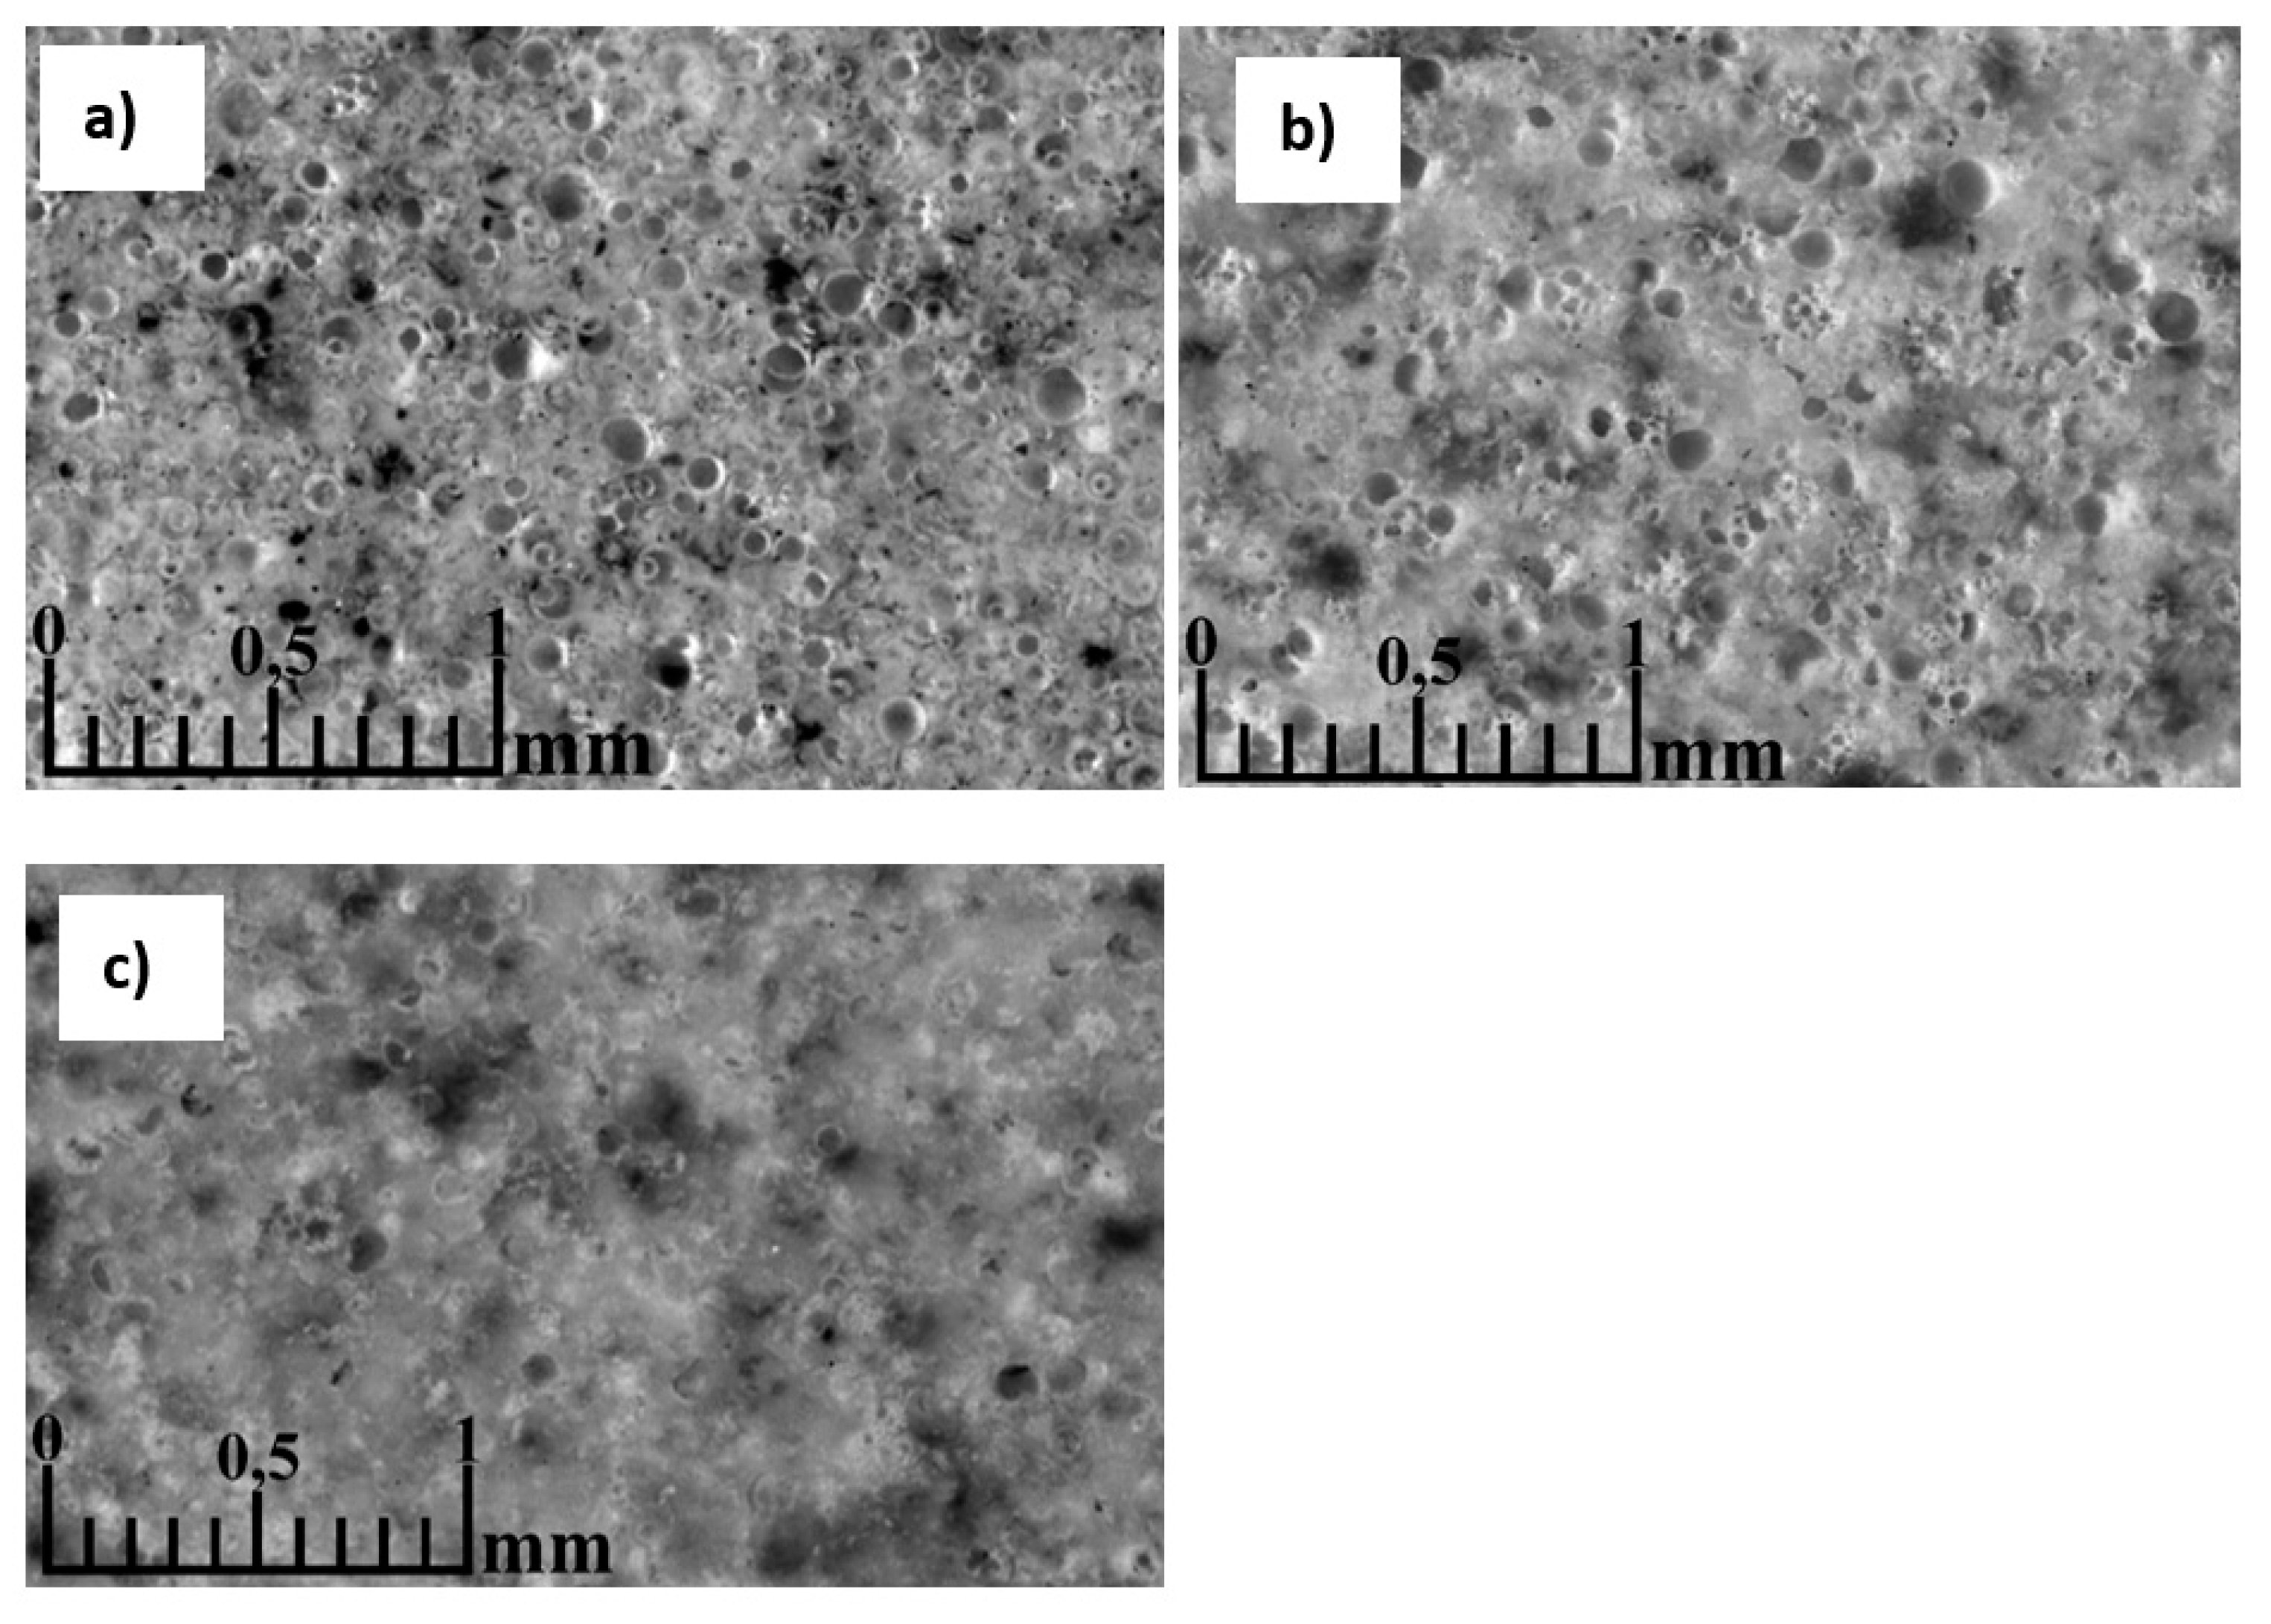
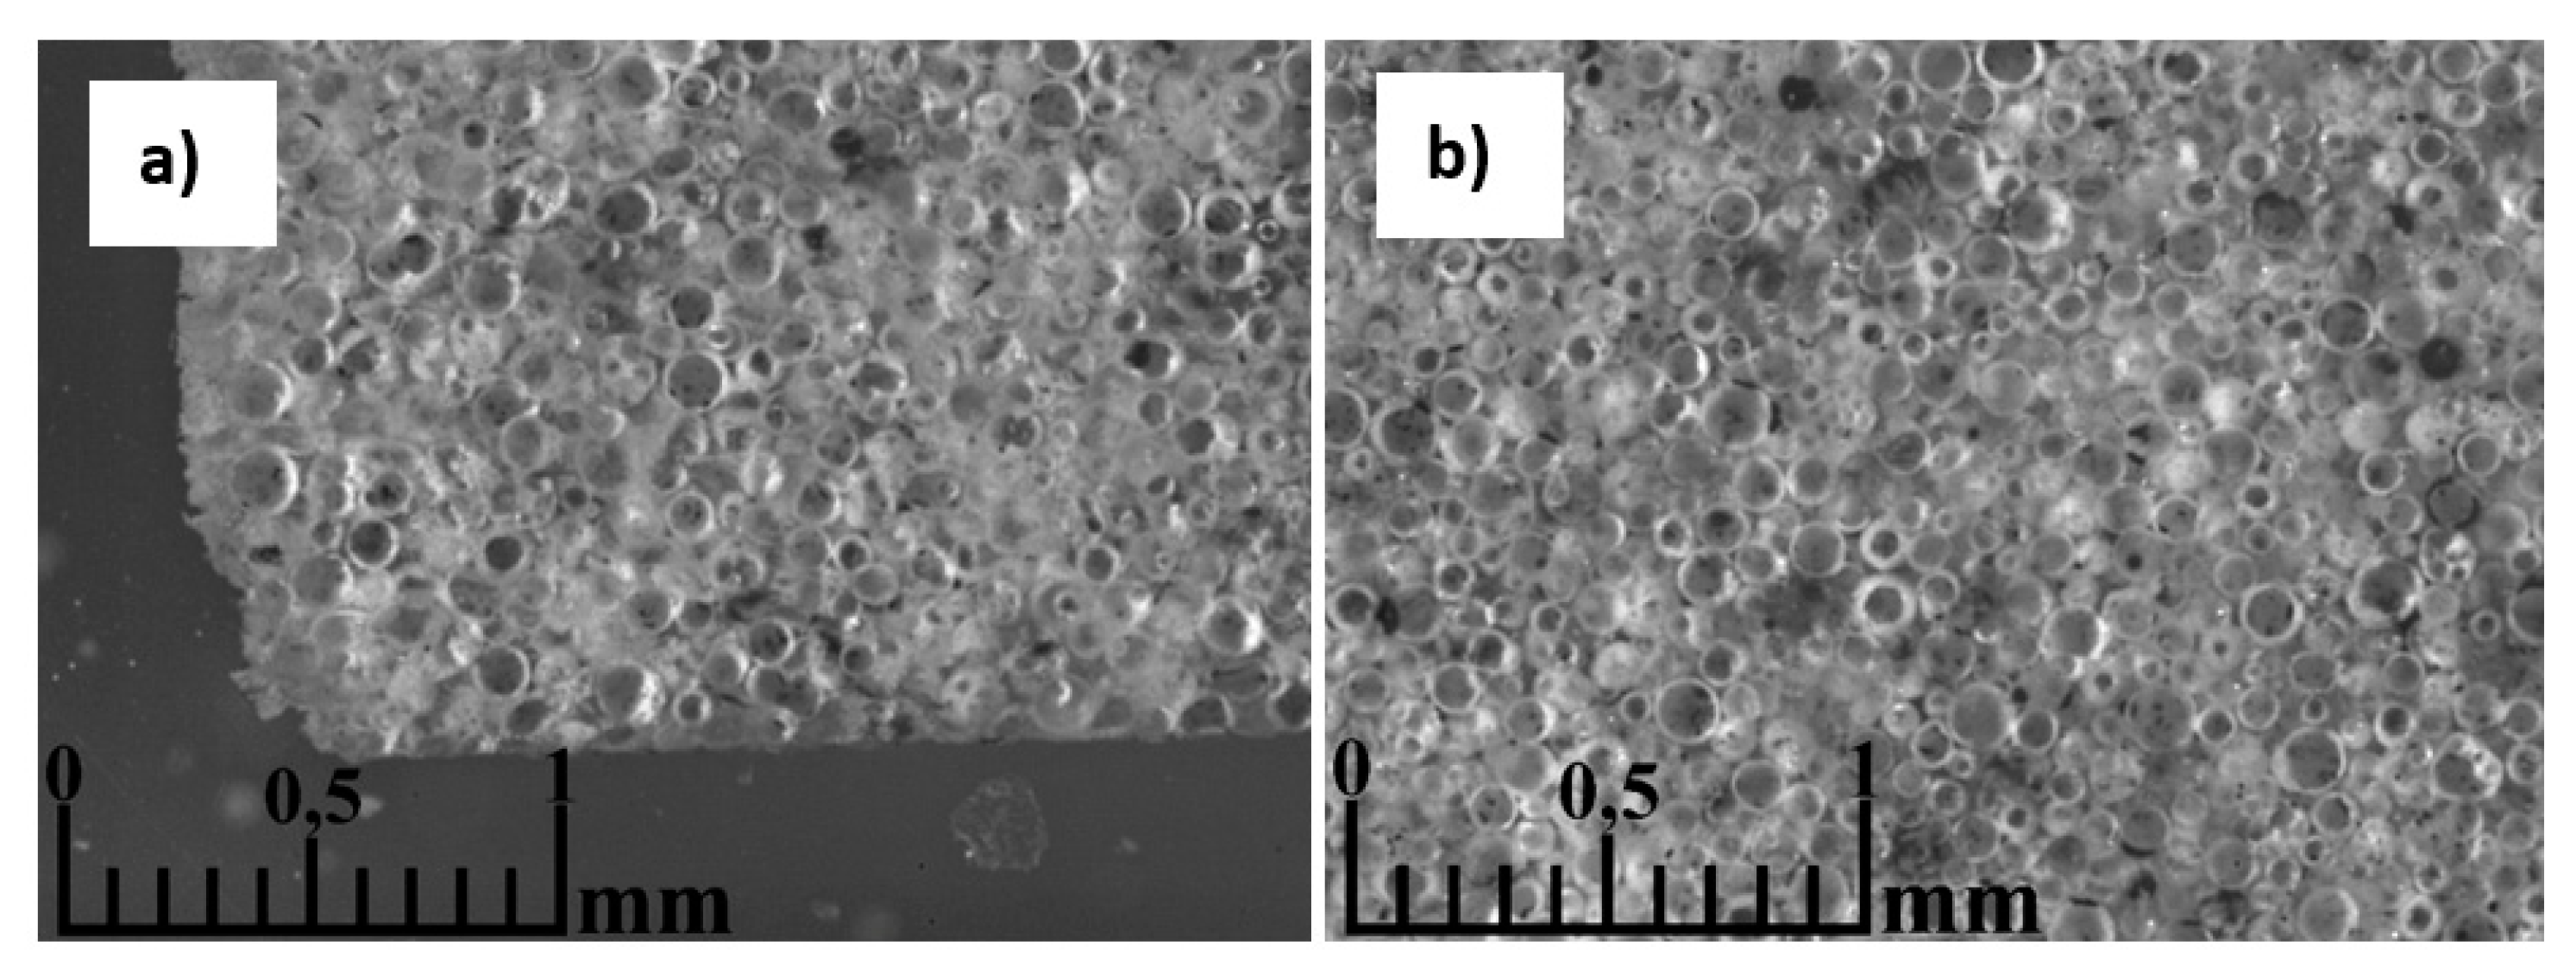
3.5. Morphology of the resulting materials
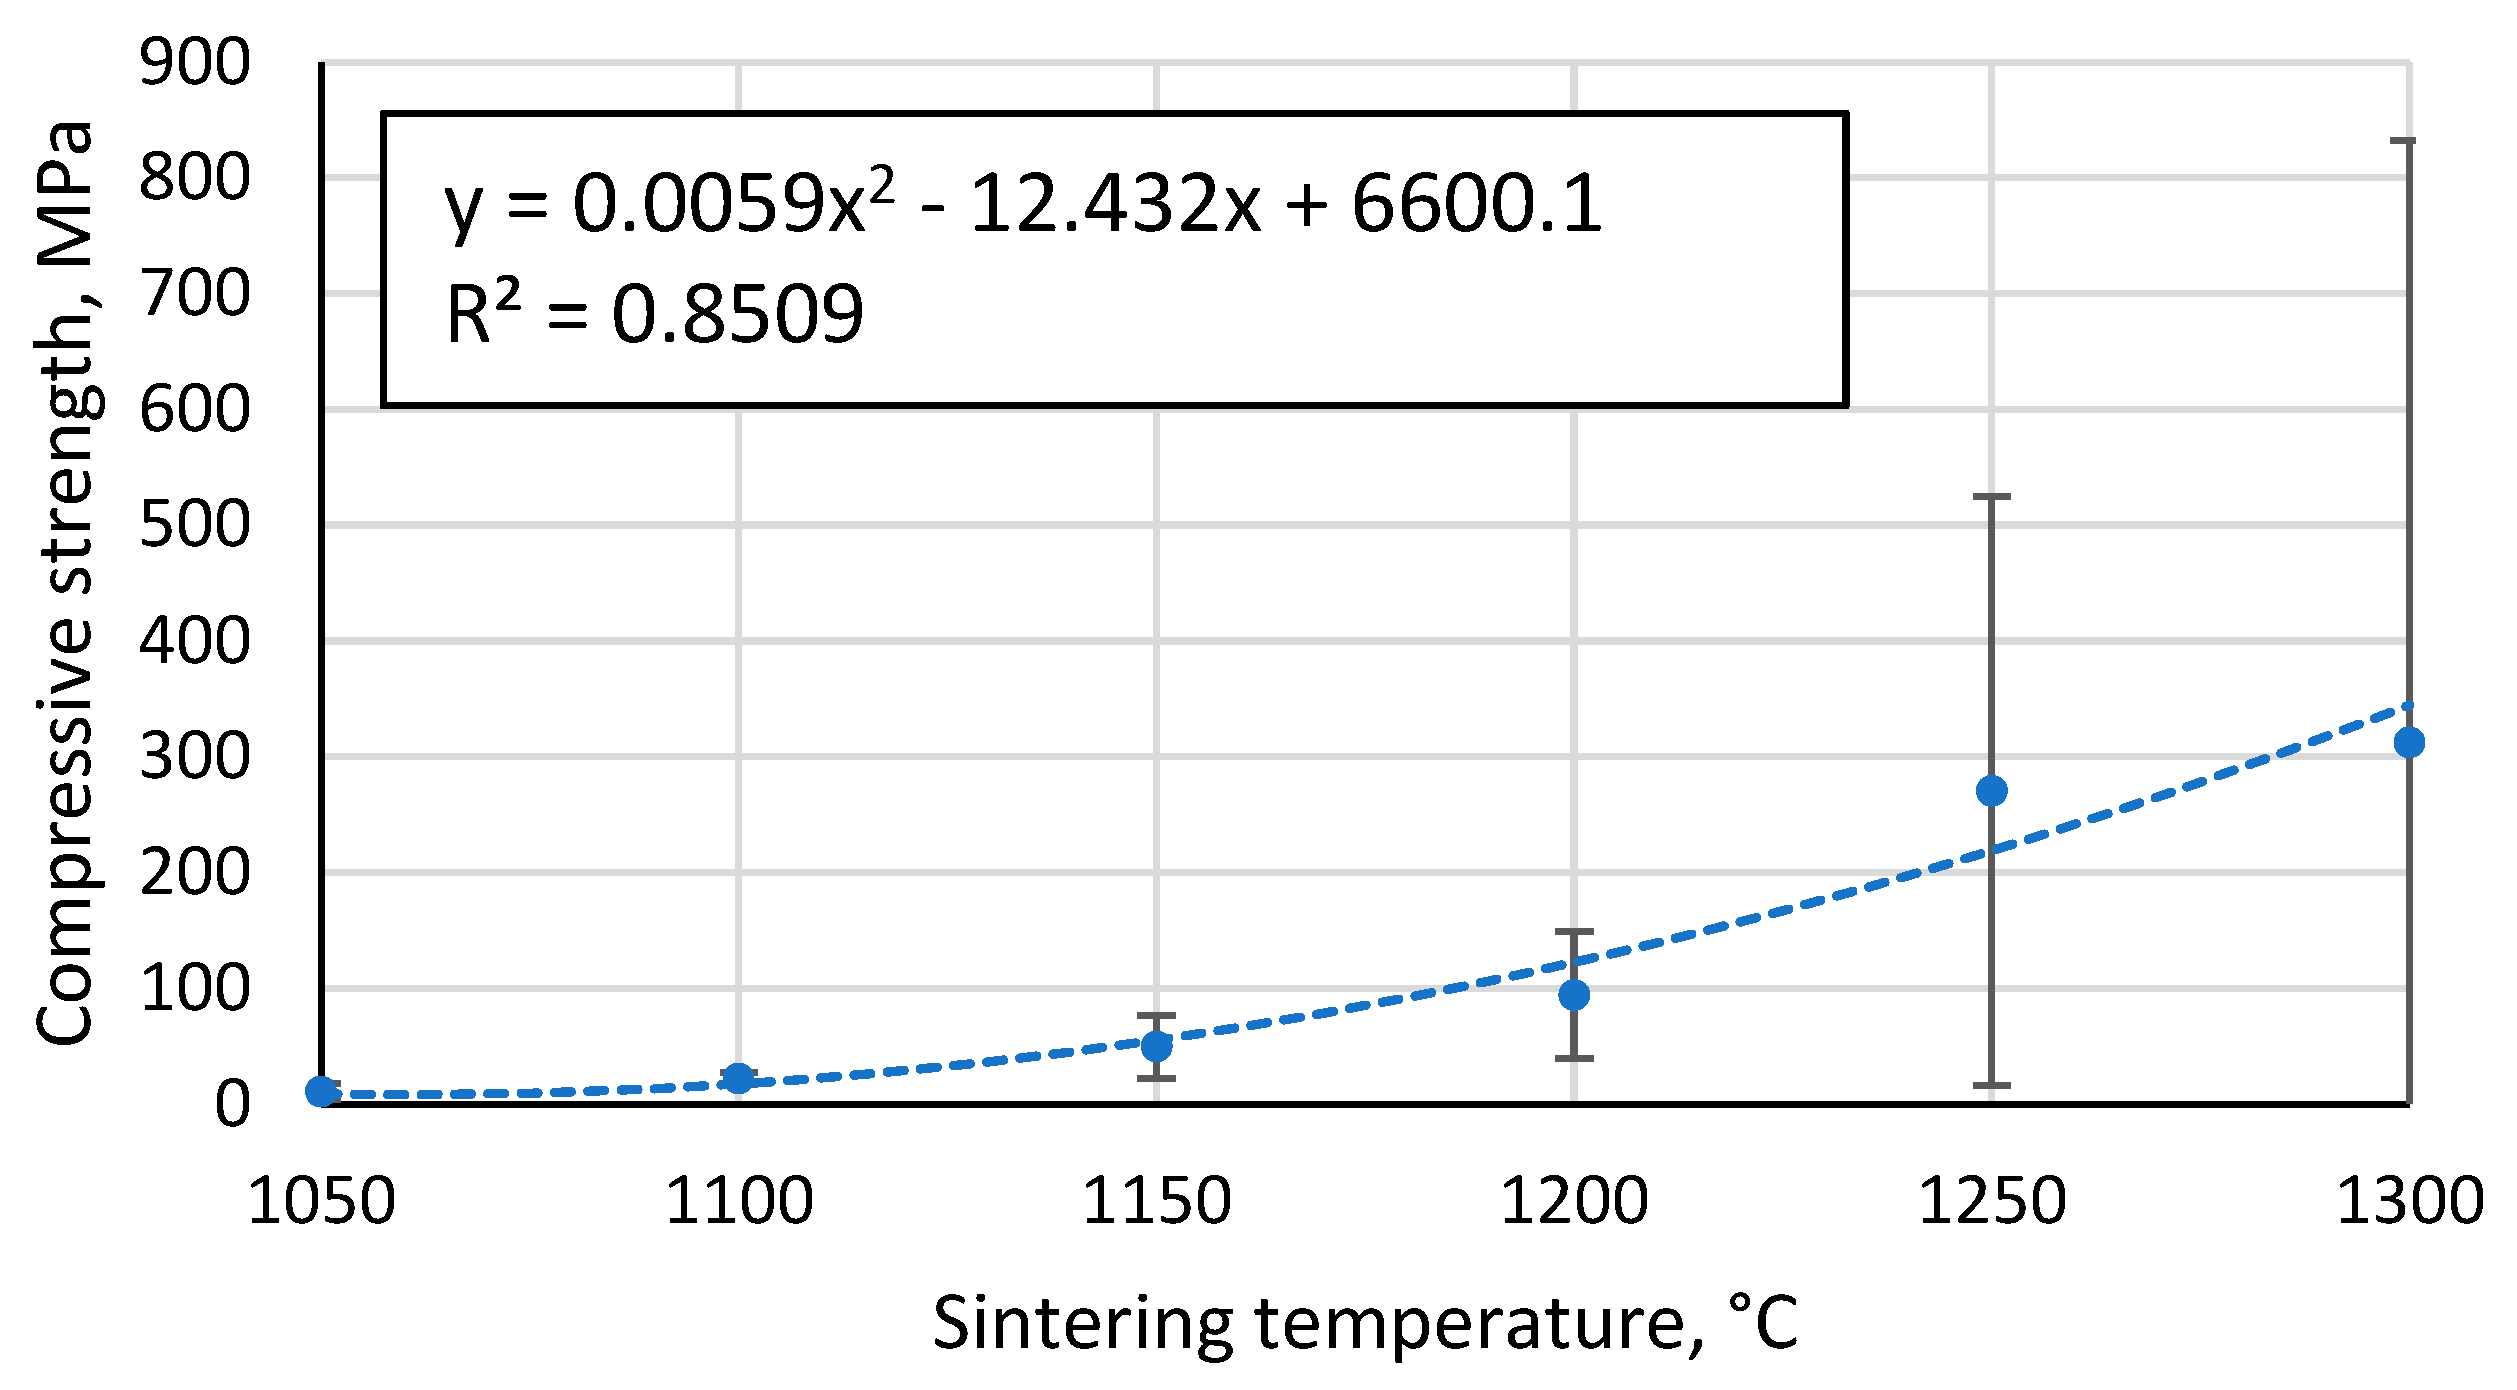
3.6. Compressive strength of the resulting materials
3.7. Composition of the crystalline phases of the starting materials and samples
3.8. Comparison of material properties with literature data.
4. Conclusions
Author Contributions
Funding
Conflicts of Interest
References
- Bhong, M.; Khan, T.K.H.; Devade, K.; Vijay Krishna, B.; Sura, S.; Eftikhaar, H.K.; Pal Thethi, H.; Gupta, N. Review of Composite Materials and Applications. Materials Today: Proceedings 2023. [Google Scholar] [CrossRef]
- Yang, J.; Chen, J.; Ye, F.; Cheng, L.; Zhang, Y. High-Temperature Atomically Laminated Materials: The Toughening Components of Ceramic Matrix Composites. Ceramics International 2022, 48, 32628–32648. [Google Scholar] [CrossRef]
- Ulloa, N.; Choto, S.; Baskaran, J.; Ramesh, G.; Rajesh, S.; Nanthakumar, S. Toughening and Strengthening of Silicon Carbide/Aluminium Composites by the Optimization of Fe3O4 Distribution at Hot Rolling. Materials Today: Proceedings 2023. [Google Scholar] [CrossRef]
- Thiyagarajan, R.; Senthil kumar, M. A Review on Closed Cell Metal Matrix Syntactic Foams: A Green Initiative towards Eco-Sustainability. Materials and Manufacturing Processes 2021, 36, 1333–1351. [Google Scholar] [CrossRef]
- Manakari, V.; Parande, G.; Gupta, M. Effects of Hollow Fly-Ash Particles on the Properties of Magnesium Matrix Syntactic Foams: A Review. Matls. Perf. Charact. 2016, 5, 116–131. [Google Scholar] [CrossRef]
- Anirudh, S.; Jayalakshmi, C.G.; Anand, A.; Kandasubramanian, B.; Ismail, S.O. Epoxy/Hollow Glass Microsphere Syntactic Foams for Structural and Functional Application-A Review. European Polymer Journal 2022, 171, 111163. [Google Scholar] [CrossRef]
- Ryzhenkov, A.; Loginova, N.; Belyaeva, E.; Lapin, Y.; Prischepov, A. Review of Binding Agents in Syntactic Foams for Heat-Insulating Structures in Power Industry Facilities. Modern Applied Science 2014, 9, p96. [Google Scholar] [CrossRef]
- Materials | Free Full-Text | Water Impact of Syntactic Foams. Available online: https://www.mdpi.com/1996-1944/10/3/224 (accessed on 28 December 2023).
- Rugele, K.; Lehmhus, D.; Hussainova, I.; Peculevica, J.; Lisnanskis, M.; Shishkin, A. Effect of Fly-Ash CS on Properties of Clay-Ceramic Syntactic Foams. Materials 2017, 10, 828. [Google Scholar] [CrossRef]
- Gupta, N.; Ye, R.; Porfiri, M. Characterization of Vinyl Ester-Glass Microballoon Syntactic Foams for Marine Applications: 22nd Technical Conference of the American Society for Composites 2007 - Composites: Enabling a New Era in Civil Aviation. American Society for Composites - 22nd Technical Conference of the American Society for Composites 2007 - Composites 2007, 1875–1889. [Google Scholar]
- Colloca, M.; Gupta, N.; Porfiri, M. Tensile Properties of Carbon Nanofiber Reinforced Multiscale Syntactic Foams. Composites Part B: Engineering 2013, 44, 584–591. [Google Scholar] [CrossRef]
- Gupta, N.; Ye, R.; Porfiri, M. Comparison of Tensile and Compressive Characteristics of Vinyl Ester/Glass Microballoon Syntactic Foams. Composites Part B: Engineering 2010, 41, 236–245. [Google Scholar] [CrossRef]
- Singh, A.K.; Behera, R.; Shishkin, A.; Gupta, N. Effect of Expanded Glass Particle Size on Compressive Properties of Vinyl Ester Syntactic Foams. SPE Polymers n/a. [CrossRef]
- Peroni, L.; Scapin, M.; Avalle, M.; Weise, J.; Lehmhus, D. Dynamic Mechanical Behavior of Syntactic Iron Foams with Glass Microspheres. Materials Science and Engineering: A 2012, 552, 364–375. [Google Scholar] [CrossRef]
- Lin, Y.; Zhang, Q.; Zhang, F.; Chang, J.; Wu, G. Microstructure and Strength Correlation of Pure Al and Al-Mg Syntactic Foam Composites Subject to Uniaxial Compression. Materials Science and Engineering: A 2017, 696, 236–247. [Google Scholar] [CrossRef]
- Baronins, J.; Setina, J.; Sahmenko, G.; Lagzdina, S.; Shishkin, A. Pore Distribution and Water Uptake in a Cenosphere-Cement Paste Composite Material. In Proceedings of the IOP Conference Series: Materials Science and Engineering; 2015; Vol. 96. [Google Scholar]
- Geng, H.; Liu, J.; Guo, A.; Ren, S.; Xu, X.; Liu, S. Fabrication of Heat-Resistant Syntactic Foams through Binding Hollow Glass Microspheres with Phosphate Adhesive. Materials & Design 2016, 95, 32–38. [Google Scholar] [CrossRef]
- Jaworek, A.; Sobczyk, A.T.; Czech, T.; Marchewicz, A.; Krupa, A. Recovery of CS from Solid Waste Produced by Coal-Fired Power Plants. Cleaner Waste Systems 2023, 6, 100109. [Google Scholar] [CrossRef]
- Shishkin, A.; Mironovs, V.; Zemchenkov, V.; Antonov, M.; Hussainova, I. Hybrid Syntactic Foams of Metal – Fly Ash Cenosphere – Clay. Key Engineering Materials 2016, 674, 35–40. [Google Scholar] [CrossRef]
- Acar, I.; Atalay, M.U. Recovery Potentials of CS from Bituminous Coal Fly Ashes. Fuel 2016, 180, 97–105. [Google Scholar] [CrossRef]
- Ranjbar, N.; Kuenzel, C. CS: A Review. Fuel 2017, 207, 1–12. [Google Scholar] [CrossRef]
- Shishkin, A.; Abramovskis, V.; Zalite, I.; Singh, A.K.; Mezinskis, G.; Popov, V.; Ozolins, J. Physical, Thermal, and Chemical Properties of Fly Ash CS Obtained from Different Sources. Materials 2023, 16, 2035. [Google Scholar] [CrossRef] [PubMed]
- Weise, J.; Lehmhus, D.; Baumeister, J.; Kun, R.; Bayoumi, M.; Busse, M. Production and Properties of 316L Stainless Steel Cellular Materials and Syntactic Foams. steel research international 2014, 85, 486–497. [Google Scholar] [CrossRef]
- Yashas Gowda, T.G.; Sanjay, M.R.; Subrahmanya Bhat, K.; Madhu, P.; Senthamaraikannan, P.; Yogesha, B. Polymer Matrix-Natural Fiber Composites: An Overview. Cogent Engineering 2018, 5, 1446667. [Google Scholar] [CrossRef]
- Zhang, J.; Gong, M.; Tian, C.; Wang, C.-A. Facile Synthesis of Well-Defined CeO2 Hollow Spheres with a Tunable Pore Structure. Ceramics International 2016, 42, 6088–6093. [Google Scholar] [CrossRef]
- Ozcivici, E.; Singh, R.P. Fabrication and Characterization of Ceramic Foams Based on Silicon Carbide Matrix and Hollow Alumino-Silicate Spheres. Journal of the American Ceramic Society 2005, 88, 3338–3345. [Google Scholar] [CrossRef]
- Gupta, N. A Functionally Graded Syntactic Foam Material for High Energy Absorption under Compression. Materials Letters 2007, 61, 979–982. [Google Scholar] [CrossRef]
- Lin, T.C.; Gupta, N.; Talalayev, A. Thermoanalytical Characterization of Epoxy Matrix-Glass Microballoon Syntactic Foams. J Mater Sci 2009, 44, 1520–1527. [Google Scholar] [CrossRef]
- Shao, Y.; Jia, D.; Liu, B. Characterization of Porous Silicon Nitride Ceramics by Pressureless Sintering Using Fly Ash Cenosphere as a Pore-Forming Agent. Journal of the European Ceramic Society 2009, 29, 1529–1534. [Google Scholar] [CrossRef]
- Wang, C.; Liu, J.; Du, H.; Guo, A. Effect of Fly Ash CS on the Microstructure and Properties of Silica-Based Composites. Ceramics International 2012, 38, 4395–4400. [Google Scholar] [CrossRef]
- Ren, S.; Tao, X.; Ma, X.; Liu, J.; Du, H.; Guo, A.; Xu, J.; Liang, J.; Chen, S.; Ge, J. Fabrication of Fly Ash CS-Hollow Glass Microspheres/Borosilicate Glass Composites for High Temperature Application. Ceramics International 2018, 44, 1147–1155. [Google Scholar] [CrossRef]
- Ren, S.; Tao, X.; Xu, X.; Guo, A.; Liu, J.; Fan, J.; Ge, J.; Fang, D.; Liang, J. Preparation and Characteristic of the Fly Ash CS/Mullite Composite for High-Temperature Application. Fuel 2018, 233, 336–345. [Google Scholar] [CrossRef]
- Sankaranarayanan, S.; Nguyen, Q.B.; Shabadi, R.; Almajid, A.H.; Gupta, M. Powder Metallurgy Hollow Fly Ash CS’ Particles Reinforced Magnesium Composites. Powder Metallurgy 2016, 59, 188–196. [Google Scholar] [CrossRef]
- Luong, D.; Lehmhus, D.; Gupta, N.; Weise, J.; Bayoumi, M. Structure and Compressive Properties of Invar-Cenosphere Syntactic Foams. Materials 2016, 9, 115. [Google Scholar] [CrossRef] [PubMed]
- Rugele, K.; Lehmhus, D.; Hussainova, I.; Peculevica, J.; Lisnanskis, M.; Shishkin, A. Effect of Fly-Ash CS on Properties of Clay-Ceramic Syntactic Foams. Materials 2017, 10. [Google Scholar] [CrossRef]
- Wang, M.-R.; Jia, D.-C.; He, P.-G.; Zhou, Y. Microstructural and Mechanical Characterization of Fly Ash Cenosphere/Metakaolin-Based Geopolymeric Composites. Ceramics International 2011, 37, 1661–1666. [Google Scholar] [CrossRef]
- Adesina, A. Sustainable Application of CS in Cementitious Materials – Overview of Performance. Developments in the Built Environment 2020, 4, 100029. [Google Scholar] [CrossRef]
- Tatarinov, A.; Shishkin, A.; Mironovs, V. Correlation between Ultrasound Velocity, Density and Strength in Metal-Ceramic Composites with Added Hollow Spheres. In Proceedings of the IOP Conf. Ser. Mater. Sci. Eng. Rucevskis, S., Bajare, D., Toma, D., Vitola, L., Eds.; Institute of Physics Publishing, 2019; Vol. 660. [Google Scholar]
- Irtiseva, K.; Lapkovskis, V.; Mironovs, V.; Ozolins, J.; Thakur, V.K.; Goel, G.; Baronins, J.; Shishkin, A. Towards Next-Generation Sustainable Composites Made of Recycled Rubber, CS, and Biobinder. Polymers 2021, 13, 1–14. [Google Scholar] [CrossRef] [PubMed]
- Shishkin, A.; Drozdova, M.; Kozlov, V.; Hussainova, I.; Lehmhus, D. Vibration-Assisted Sputter Coating of CS: A New Approach for Realizing Cu-Based Metal Matrix Syntactic Foams. Metals 2017, 7. [Google Scholar] [CrossRef]
- Dudina, D.V.; Bokhonov, B.B.; Olevsky, E.A. Fabrication of Porous Materials by Spark Plasma Sintering: A Review. Materials (Basel) 2019, 12, 541. [Google Scholar] [CrossRef] [PubMed]
- Saheb, N.; Iqbal, Z.; Khalil, A.; Hakeem, A.S.; Al Aqeeli, N.; Laoui, T.; Al-Qutub, A.; Kirchner, R. Spark Plasma Sintering of Metals and Metal Matrix Nanocomposites: A Review. Journal of Nanomaterials 2012, 2012. [Google Scholar] [CrossRef]
- Tokita, M. Progress of Spark Plasma Sintering (SPS) Method, Systems, Ceramics Applications and Industrialization. Ceramics 2021, 4, 160–198. [Google Scholar] [CrossRef]
- Peroni, L.; Scapin, M.; Lehmhus, D.; Baumeister, J.; Busse, M.; Avalle, M.; Weise, J. High Strain Rate Tensile and Compressive Testing and Performance of Mesoporous Invar (FeNi36) Matrix Syntactic Foams Produced by Feedstock Extrusion. Advanced Engineering Materials 2017, 19, 1600474. [Google Scholar] [CrossRef]
- Klymenko, V.M. Spark Plasma Sintering of Porous Materials Made of 1Kh18N9T Corrosion-Resistant Steel Fibers. Powder Metall Met Ceram 2019, 58, 23–28. [Google Scholar] [CrossRef]
- Manukyan, K.V.; Yeghishyan, A.V.; Shuck, C.E.; Moskovskikh, D.O.; Rouvimov, S.; Wolf, E.E.; Mukasyan, A.S. Mesoporous Metal - Silica Materials: Synthesis, Catalytic and Thermal Properties. Microporous and Mesoporous Materials 2018, 257, 175–184. [Google Scholar] [CrossRef]
- Eichhorn, F.; Biggemann, J.; Kellermann, S.; Kawai, A.; Kato, K.; Kakimoto, K.; Fey, T. Influence of Cell Size on Mechanical and Piezoelectric Properties of PZT and LNKN Ceramic Foams. Advanced Engineering Materials 2017, 19, 1700420. [Google Scholar] [CrossRef]
- Rice, R.W. Comparison of Stress Concentration versus Minimum Solid Area Based Mechanical Property-Porosity Relations. Journal of Materials Science 1993, 28, 2187–2190. [Google Scholar] [CrossRef]
- Dong, E.; Yu, W.; Cai, Q.; Cheng, L.; Shi, J. High-Temperature Oxidation Kinetics and Behavior of Ti–6Al–4V Alloy. Oxid Met 2017, 88, 719–732. [Google Scholar] [CrossRef]
- Maróti, J.E.; Orbulov, I.N. Characteristic Compressive Properties of AlSi7Mg Matrix Syntactic Foams Reinforced by Al2O3 or SiC Particles in the Matrix. Materials Science and Engineering: A 2023, 869, 144817. [Google Scholar] [CrossRef]
- Dong, Z.; Song, D.; Sun, W.; Wang, J.; Liu, J. Compressive Properties of the Magnesium Matrix Syntactic Foams Using Different Types of Porous Volcanic Rock Particles. Materialia 2022, 25, 101535. [Google Scholar] [CrossRef]
- Akinwekomi, A.D.; Tang, C.-Y.; Tsui, G.C.-P.; Law, W.-C.; Chen, L.; Yang, X.-S.; Hamdi, M. Synthesis and Characterisation of Floatable Magnesium Alloy Syntactic Foams with Hybridised Cell Morphology. Materials & Design 2018, 160, 591–600. [Google Scholar] [CrossRef]
- Kádár, C.; Kubelka, P.; Szlancsik, A. On the Compressive Properties of Aluminum and Magnesium Syntactic Foams: Experiment and Simulation. Materials Today Communications 2023, 35, 106060. [Google Scholar] [CrossRef]
- Mandal, D.P.; Majumdar, D.D.; Bharti, R.K.; Majumdar, J.D. Microstructural Characterisation and Property Evaluation of Titanium Cenosphere Syntactic Foam Developed by Powder Metallurgy Route. Powder Metallurgy 2015, 58, 289–299. [Google Scholar] [CrossRef]
- Liu, D.; Jin, X.; Li, N.; Li, J.; Zhang, S.; Yi, T.; Li, X.; Li, X.; Zhang, B.; Dong, L.; et al. In-Situ Synthesis of Hierarchically High Porosity ZrB2 Ceramics from Carbon Aerogel Template with Excellent Performance in Thermal Insulation and Light Absorption. Journal of the European Ceramic Society 2024, 44, 738–747. [Google Scholar] [CrossRef]
- Huang, Y.; Chen, Z.; Liu, Y.; Lu, J.X.; Bian, Z.; Yio, M.; Cheeseman, C.; Wang, F.; Sun Poon, C. Recycling of Waste Glass and Incinerated Sewage Sludge Ash in Glass-Ceramics. Waste Management 2024, 174, 229–239. [Google Scholar] [CrossRef] [PubMed]
- Nithyanandam, A.; Deivarajan, T. Development of Fly Ash Cenosphere-Based Composite for Thermal Insulation Application. International Journal of Applied Ceramic Technology 2021, 18, 1825–1831. [Google Scholar] [CrossRef]
- Xia, B.; Wang, Z.; Gou, L.; Zhang, M.; Guo, M. Porous Mullite Ceramics with Enhanced Compressive Strength from Fly Ash-Based Ceramic Microspheres: Facile Synthesis, Structure, and Performance. Ceramics International 2022, 48, 10472–10479. [Google Scholar] [CrossRef]
- Zhu, G.; Peng, Z.; Yang, L.; Tang, H.; Fang, X.; Rao, M. Facile Preparation of Thermal Insulation Materials by Microwave Sintering of Ferronickel Slag and Fly Ash Cenosphere. Ceramics International 2023, 49, 11978–11988. [Google Scholar] [CrossRef]
- Yeung, K.-W.; Tang, C.-Y.; Hu, R.; Lam, C.-H.; Law, W.-C.; Tsui, G.C.-P.; Zhao, X.; Chung, J.K.-H. Fabrication of Ceramic Bioscaffolds from Fly Ash Cenosphere by Susceptor-Assisted Microwave Sintering. Journal of the European Ceramic Society 2022, 42, 4410–4419. [Google Scholar] [CrossRef]
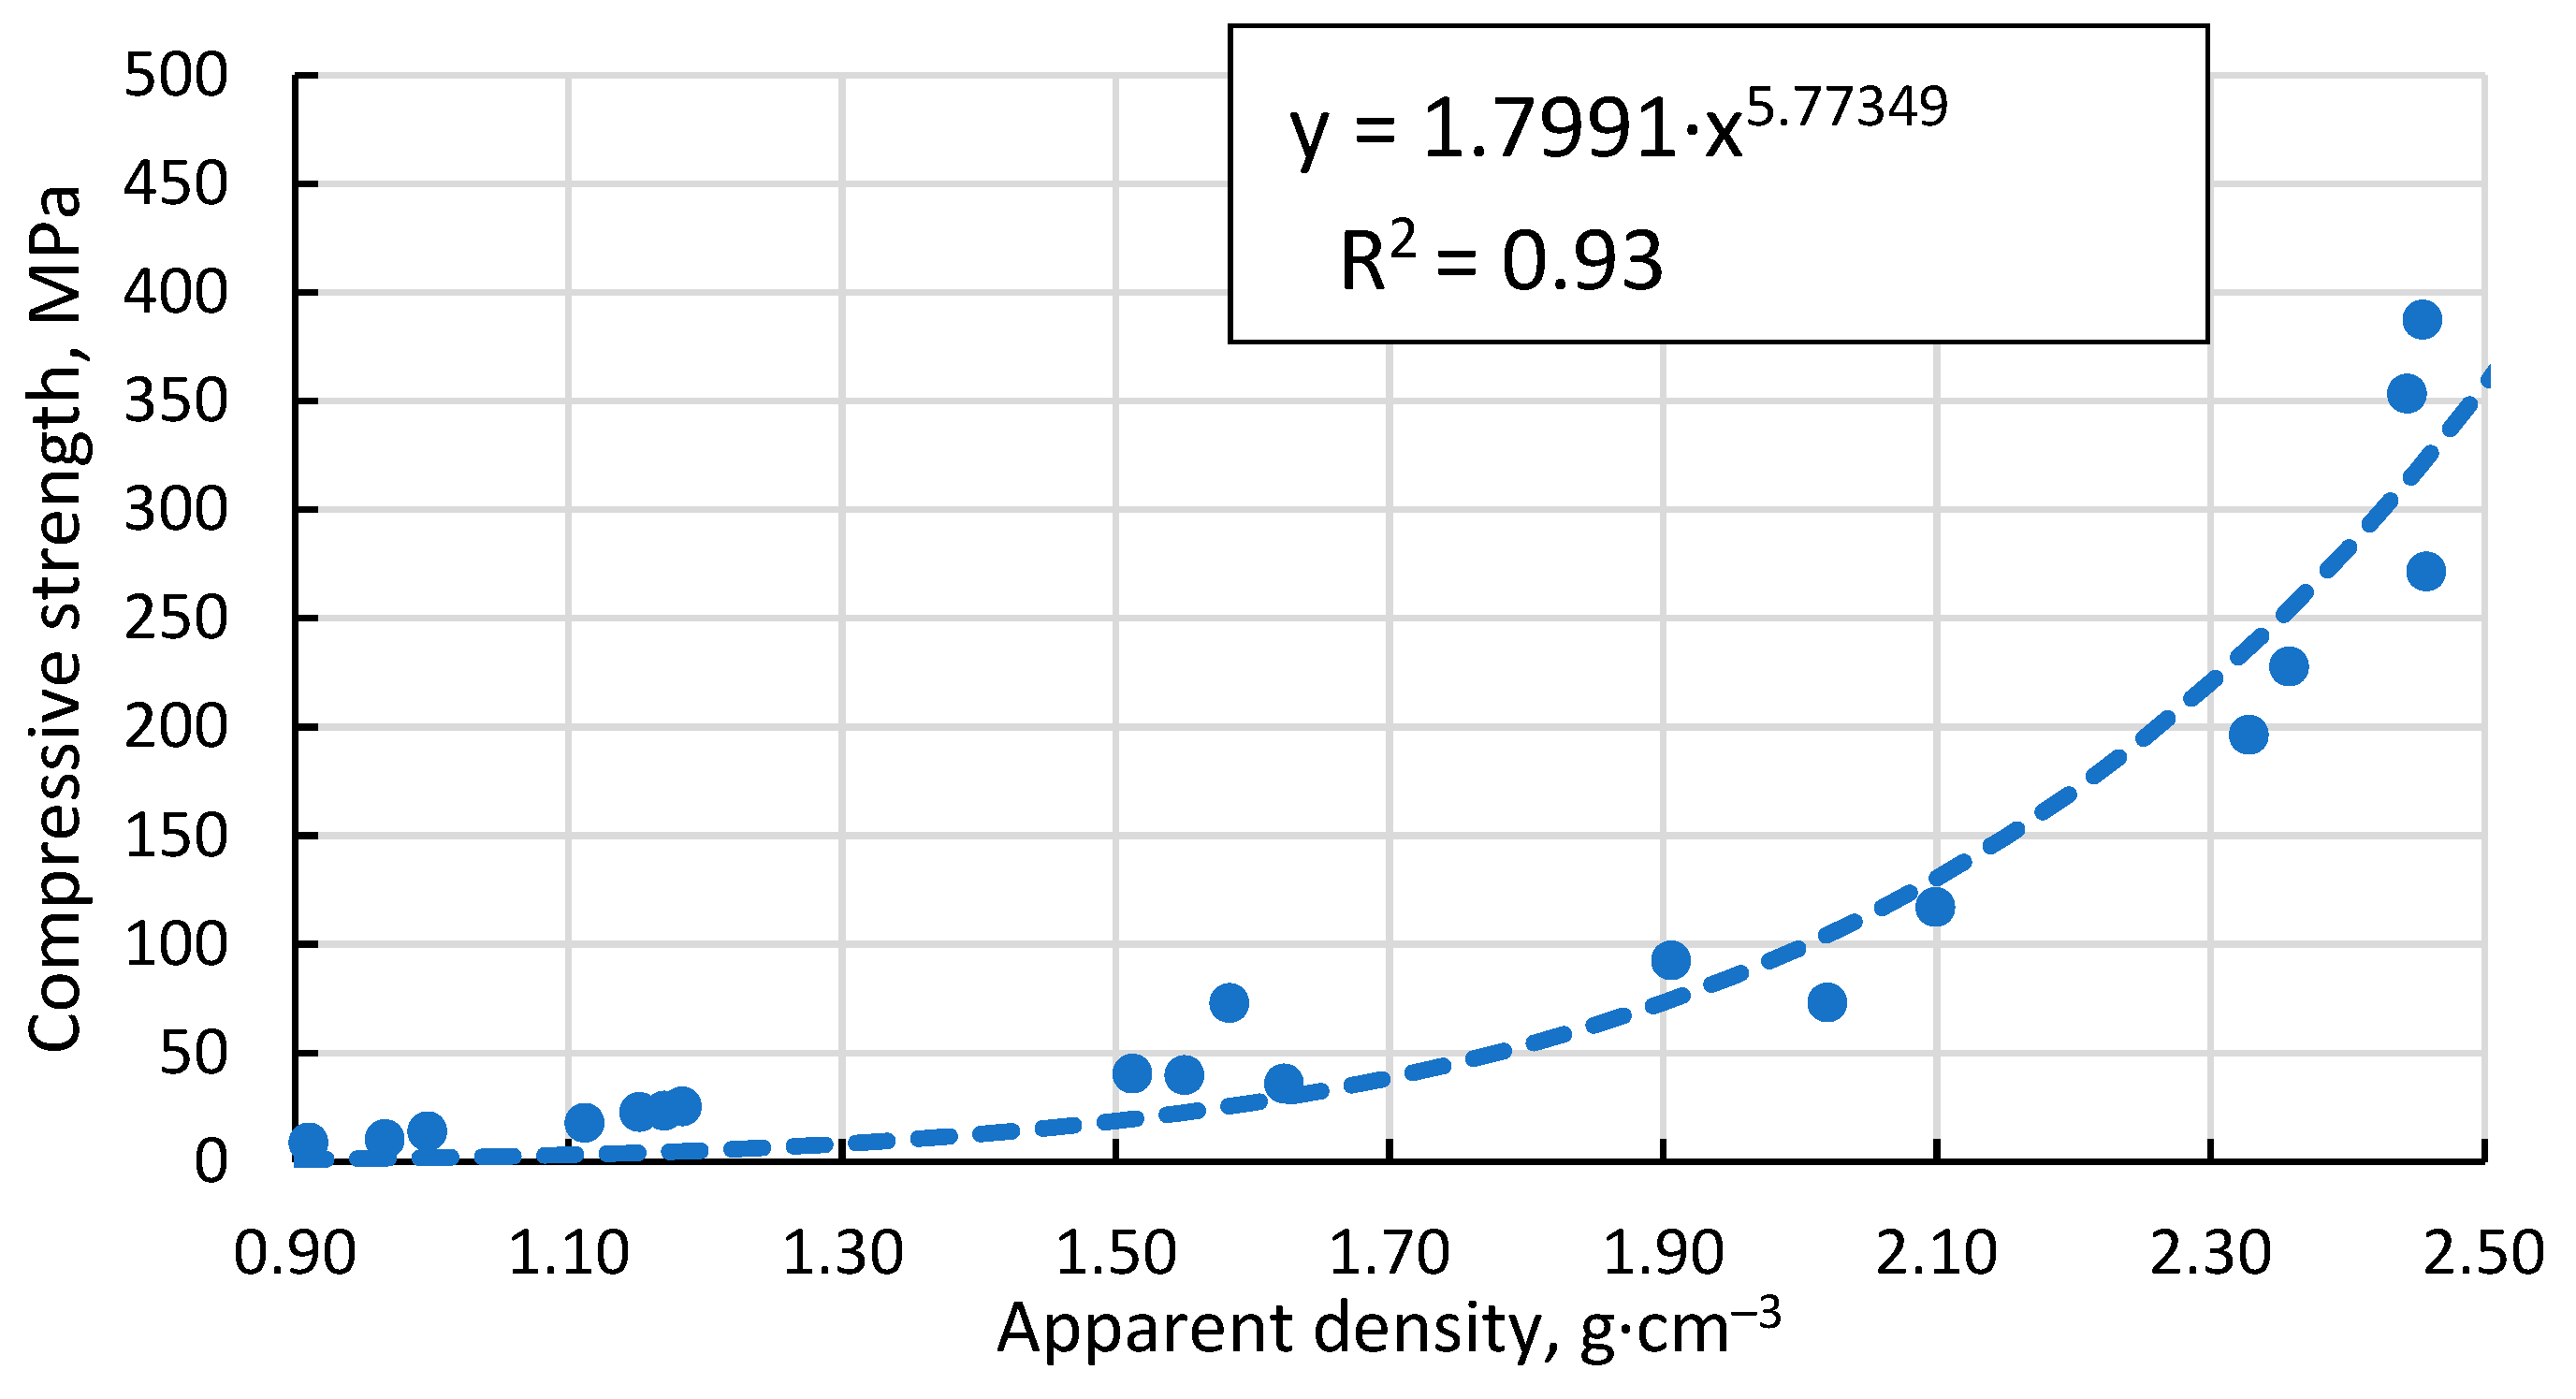
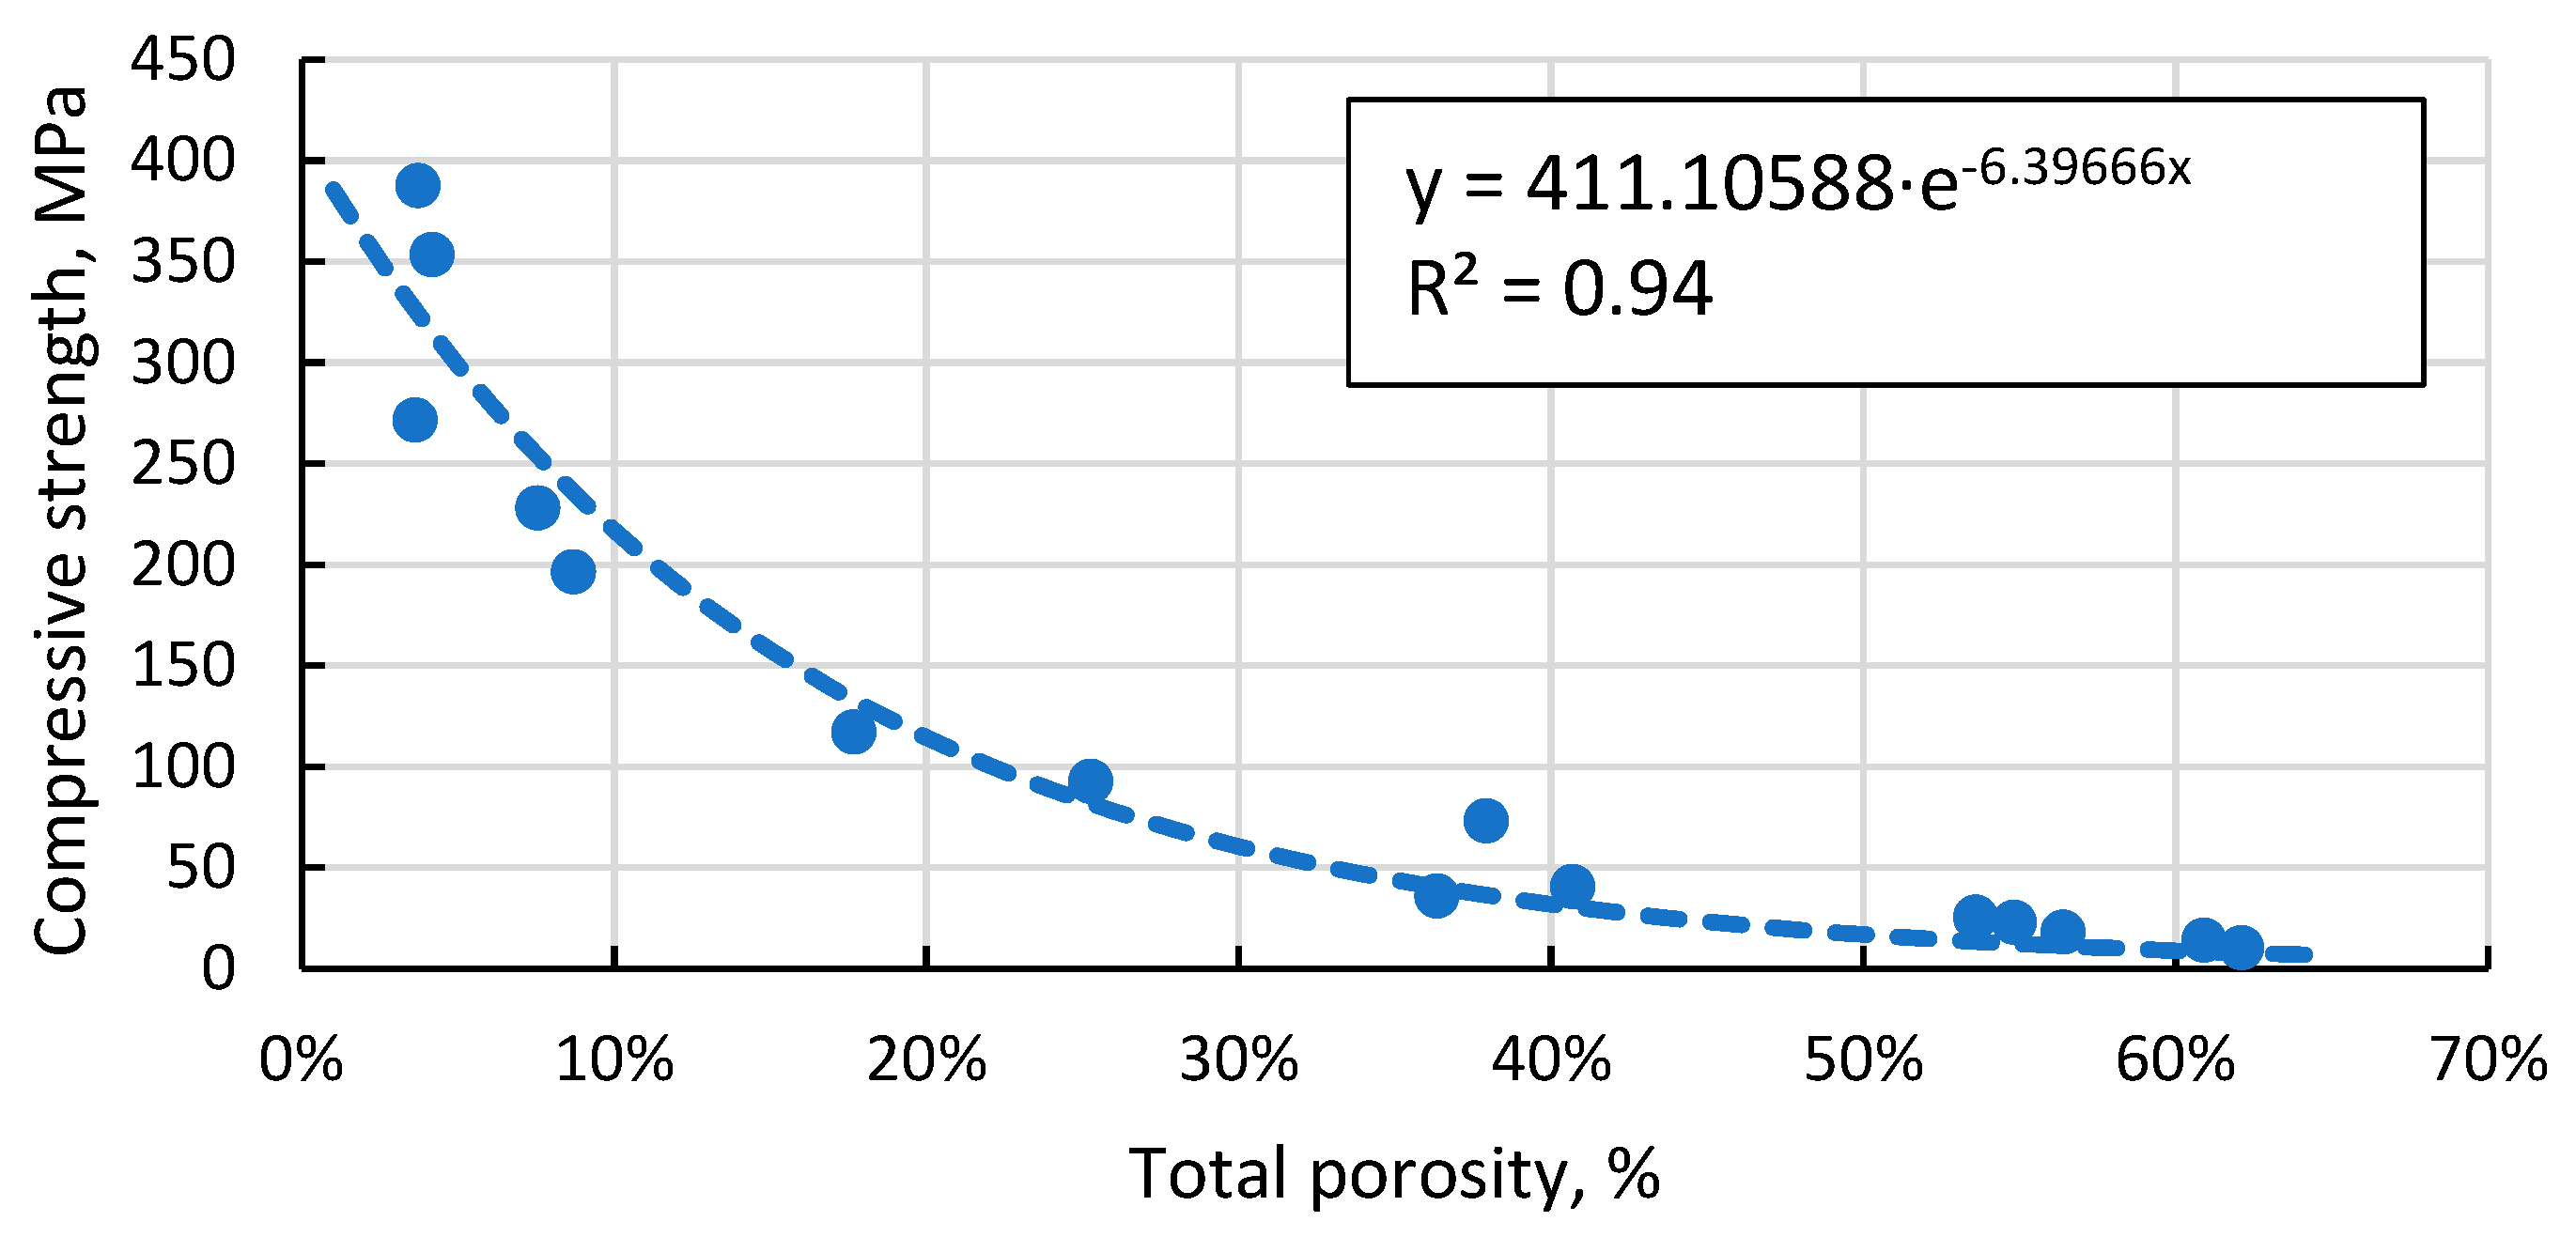
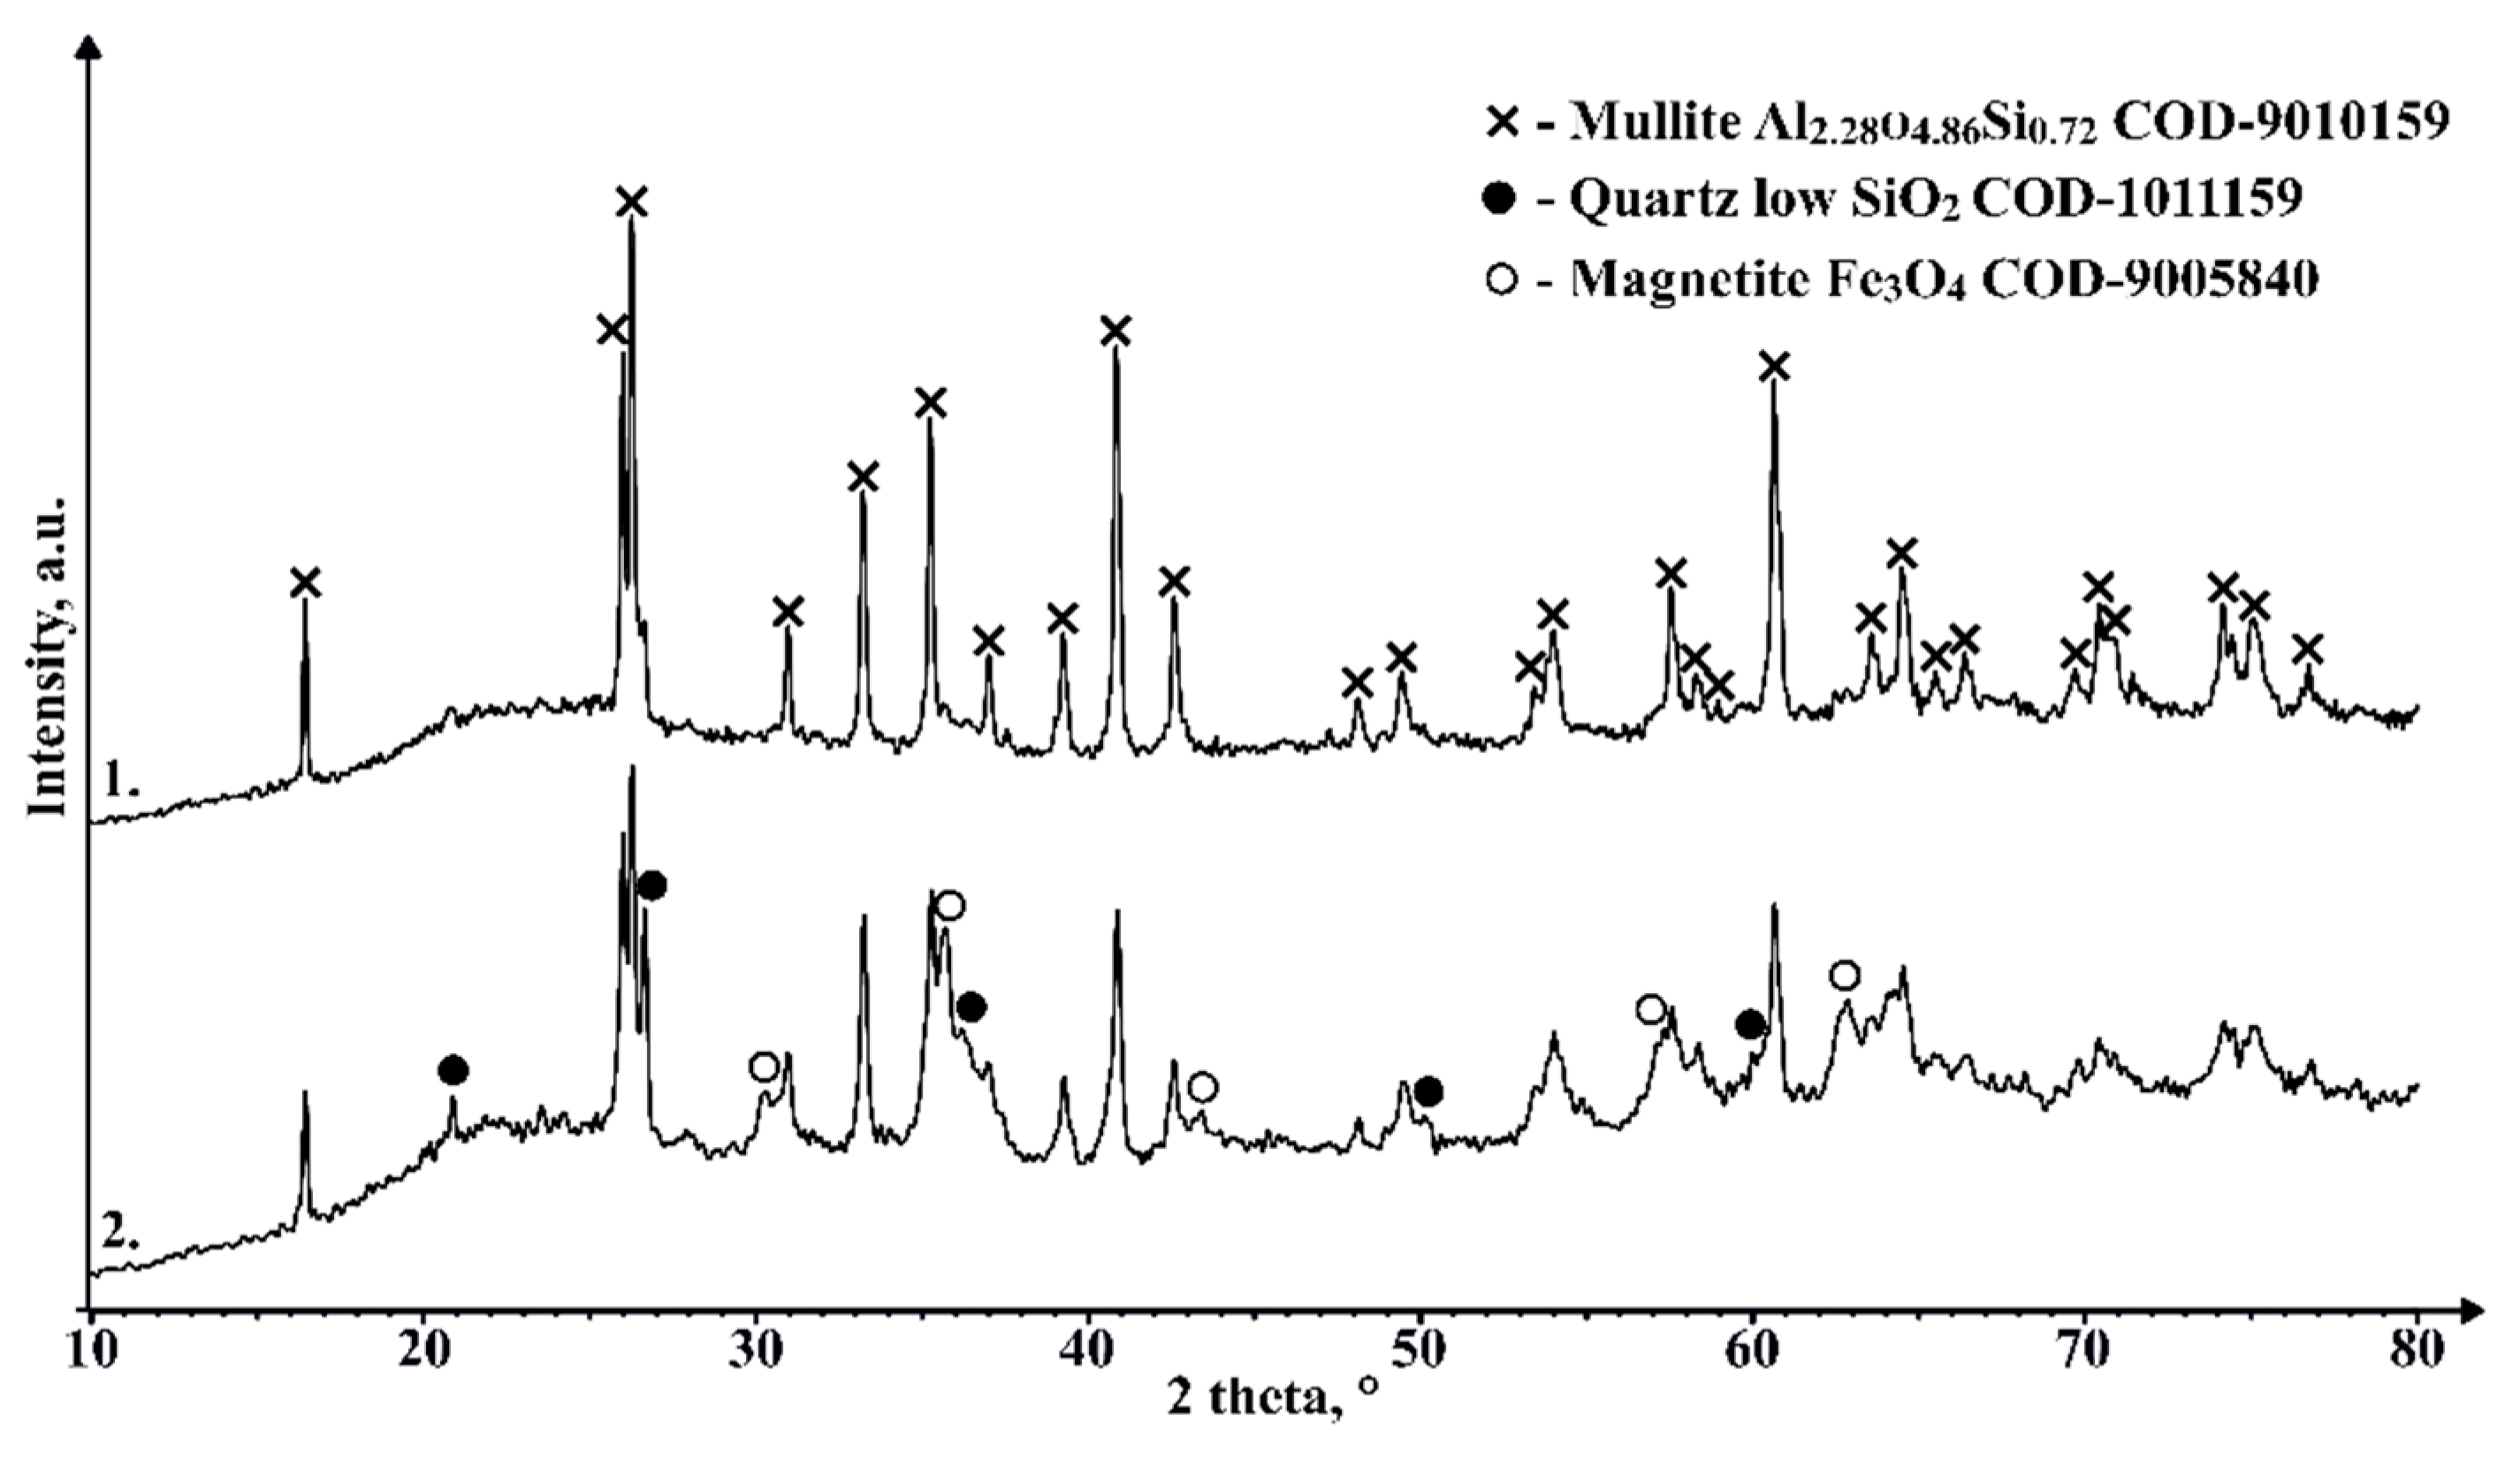
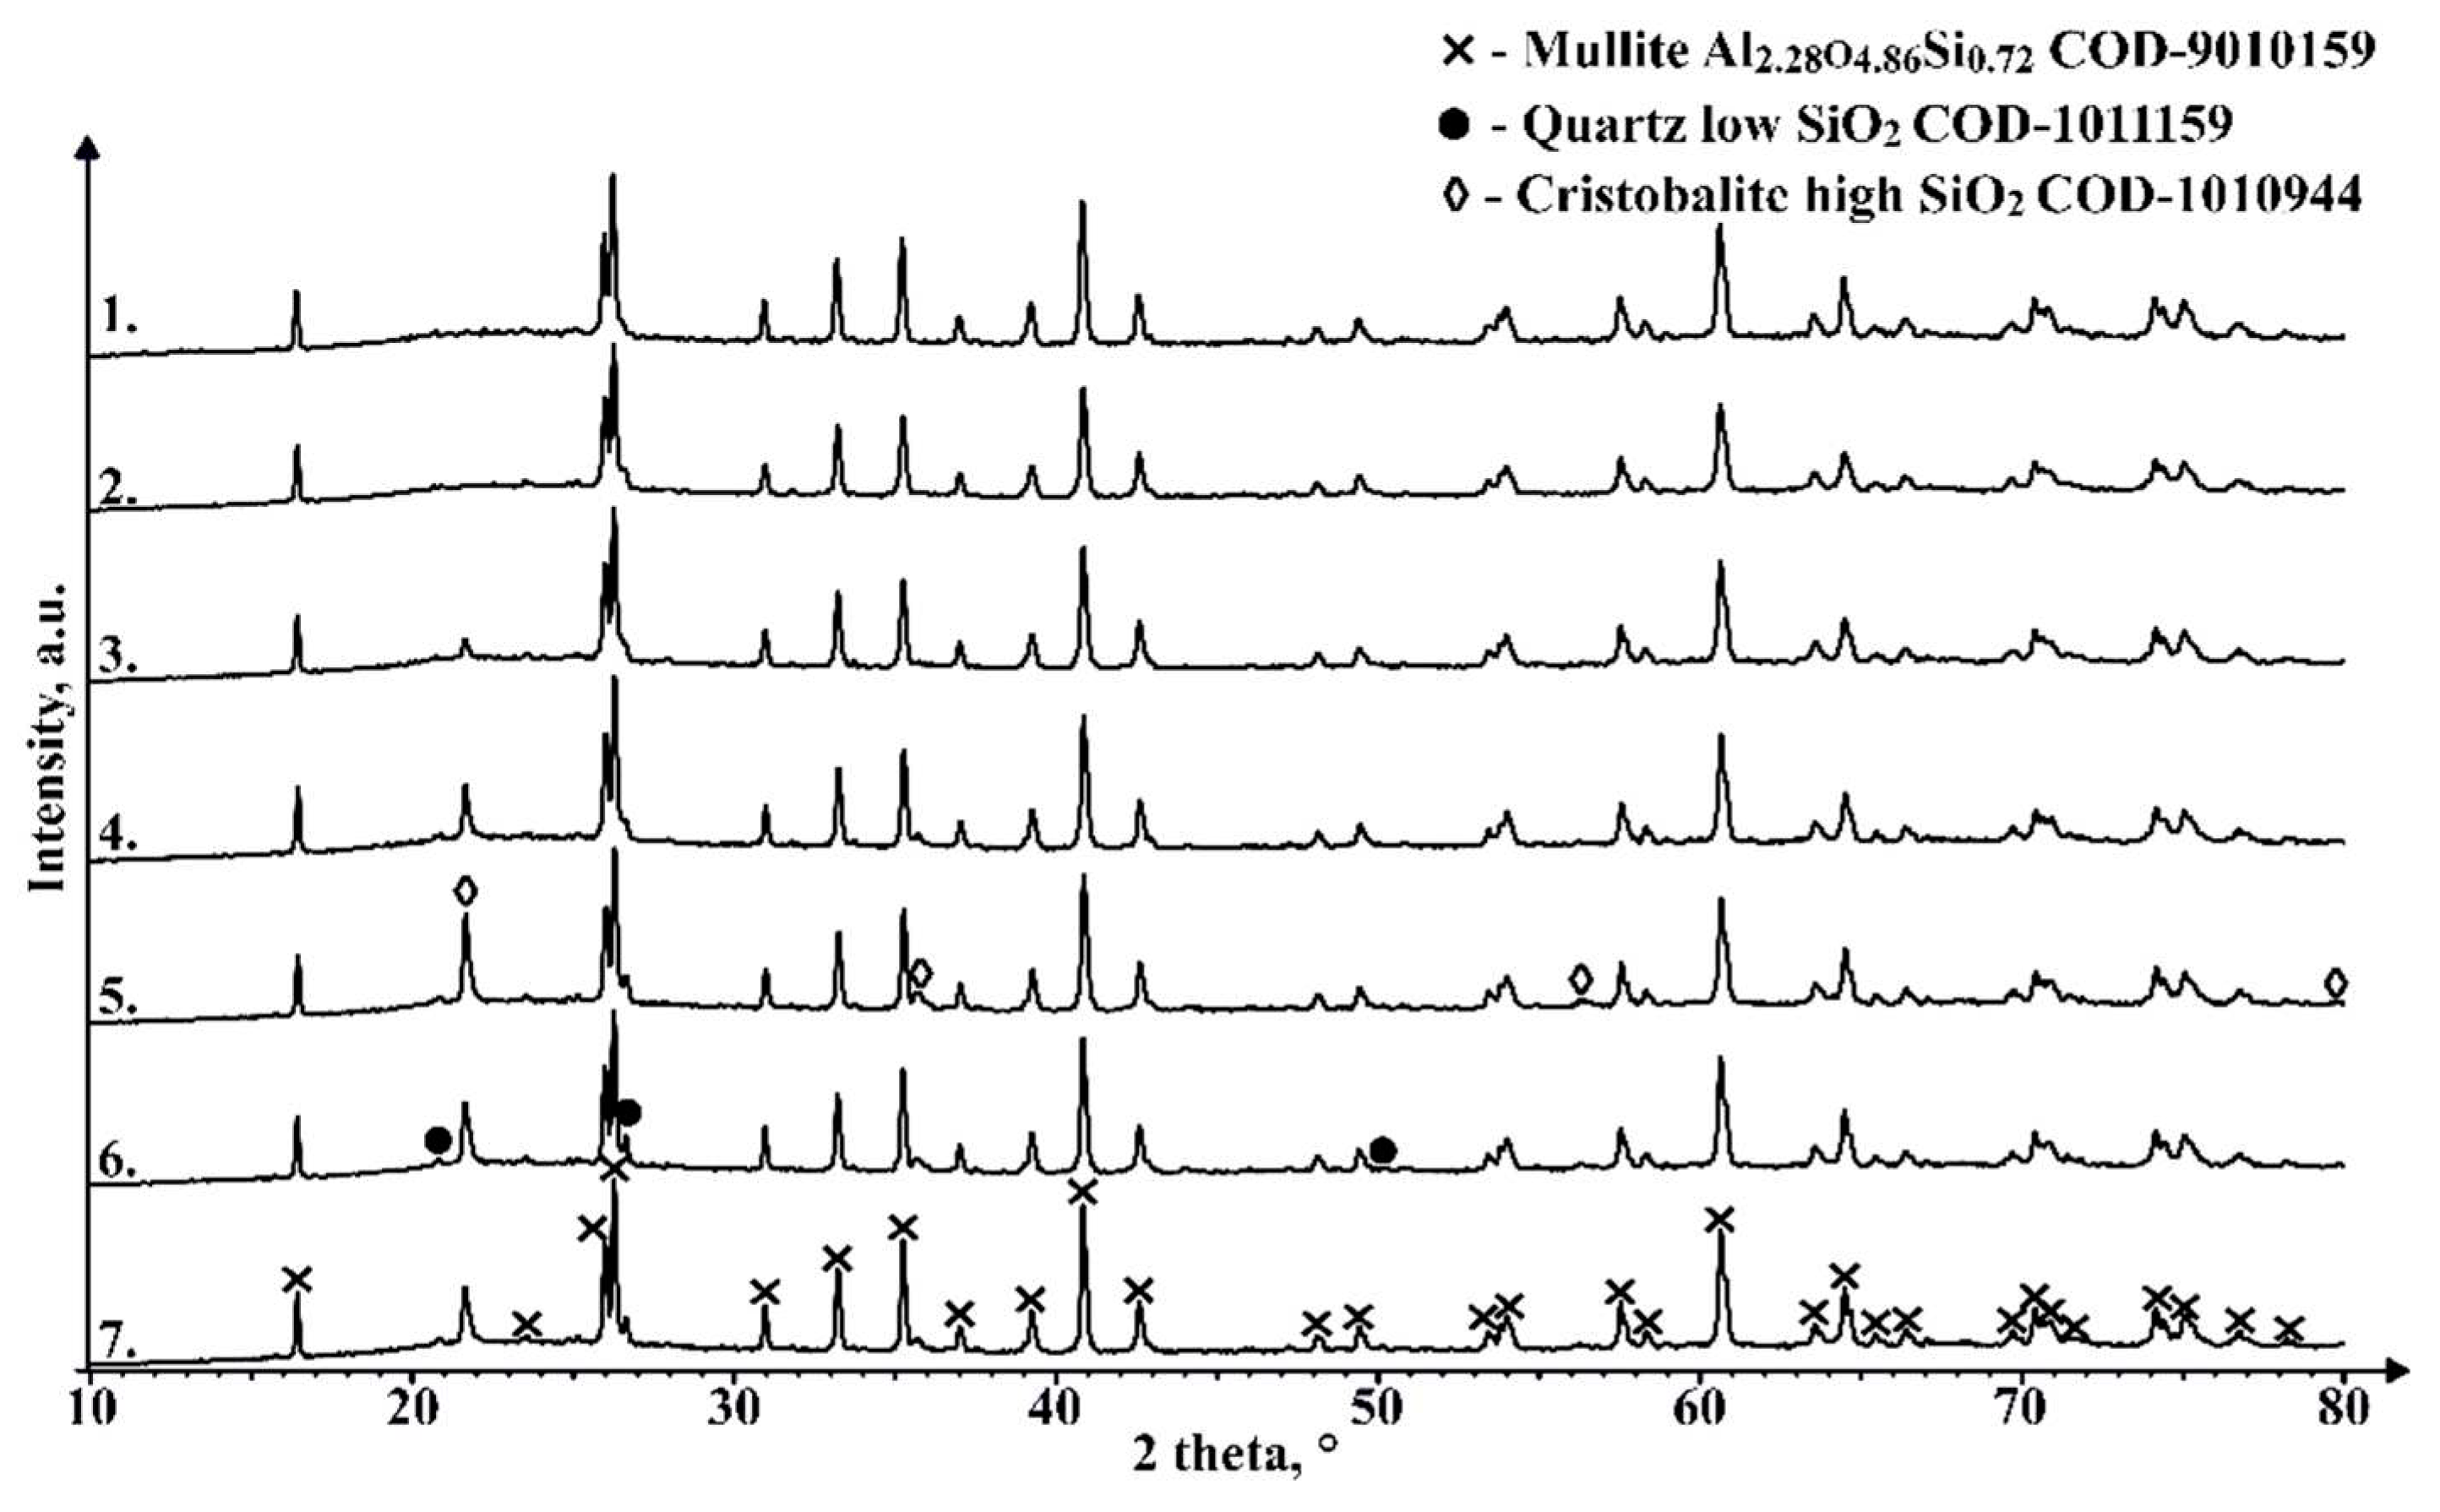
| Sample | SiO2 | Al2O3 | Fe2O3 | CaO | MgO | Na2O | K2O | LOI* 400 °C, % | LOI*1000 °C, % |
|---|---|---|---|---|---|---|---|---|---|
| CS1 | 56.5 | 36.9 | 1.4 | 2.4 | 1.2 | 1.1 | 0.5 | 0.5 | 0.1 |
| CS2 | 53.8 | 40.7 | 1.0 | 1.4 | 0.6 | 0.5 | 0.4 | 0.6 | 0.4 |
| Material | Bulk Density, g·cm–3 | Pycnometric Density g·cm–3 | Voids, % |
|---|---|---|---|
| Raw CS1 | 0.415 ± 0.004 | 2.153 ± 0.001 | 40.0 |
| Raw CS2 | 0.380 ± 0.002 | 2.272 ± 0.001 | 43.0 |
| Nr. | Used materials | Density, g·cm-3 | Melt. / Dec., °C |
Compr. strength, MPa | Porosity, % | Pore size, µm | Sintering method | Ref | ||
| Total | Open | Closed | ||||||||
| Metal matrix syntactic foam | ||||||||||
| 1 | AlSi7Mg + light expanded clay agglomerate particles + Al2O3 or SiC |
1.58 - 1.71 | 570 | 60 - 79 | <2300 | Low-pressure infiltration | [50] |
|||
| 2 | AlSi7Mg + ceramic hollow spheres + Al2O3 or SiC | 1.66 - 1.9 | 570 | 101 - 137 | ||||||
| 3 | Mg + Low density vulcanic rock | 0.89 | 650 | 10 | 49.5 | Pressure infiltration | [51] |
|||
| 4 | Mg + High density vulcanic rock | 1.68 | 650 | 40 | 32.5 | Pressure infiltration | [51] |
|||
| 5 | Mg AZ61 alloy + CS + carbamide granules | 0.79-1.1 | 650 | 16 - 30 | <1000 | Microwave sintering | [52] |
|||
| 6 | Al + G1.45 Globocer hollow spheres | 1.8 | 660 | 43 | 1000 | Low-pressure infiltration | [53] |
|||
| 7 | Al + G3.83 Globocer hollow spheres | 1.55 | 660 | 43 | 3500 | |||||
| 8 | Mg + G1.45 Globocer hollow spheres | 1.5 | 650 | 84 | 1000 | |||||
| 9 | Mg + G3.83 Globocer hollow spheres | 1.15 | 650 | 59 | 3500 | |||||
| 10 | CS + Ti + NaCl + PVA | 1.33-1.81 | 1500 | 50 - 63 | 50-60 | <75 | Argon atm. furnace | [54] | ||
| Ceramic matrix syntactic foam | ||||||||||
| 11 | CS 60 vol.% + clay | 0.94 | 900 | 7 | 66 | 28 | 50-100 | Muffle furnace 1000 °C | [35] | |
| 12 | CS 50 vol.% + clay | 1,10 | 900 | 10 | 53 | 21 | ||||
| 13 | CS 30 vol.% + clay | 1,50 | 900 | 23 | 37 | 13 | ||||
| 14 | Ceramic aerogel ZrB2 | 0.26-0.48 | 0.26 - 0.51 | 85-93 | 12-31 | In-situ synthesis | [55] |
|||
| 15 | Waste glass powder + incinerated sewage sludge ash | 1.67 -1.89 | 600 | 7 - 43 | 10 - 43 | 0.1-1.3 | Muffle furnace | [56] |
||
| 16 | CS + ball clay + rice husk ash | 0.57 - 0.67 | 900 | 5 - 8 | 50-56 | <150 | Muffle furnace | [57] |
||
| 17 | CS + mullite | 1.18 - 1.86 | 900 | 2 - 187 | 56 - 18 | <65 | Box furnace | [58] |
||
| 18 | Cu coated CS | 0.9-1.5 | 800 | 9-62 | 47 - 67 | <200 | SPS | [40] | ||
| 19 | CS + ferronichel slag | 1.18-2.0 | 1.6-42 | 51 - 26 | 93-290 | Microwave sintering | [59] |
|||
| Polymer matrix syntactic foam | ||||||||||
| 20 | CS + PVA | 1.4-1.9 | 200 | up to 100 | >8.8 | <20 | Microwave sintering | [60] |
||
| 21 | CS + more PVA | 0.54 | 200 | 39 | ||||||
| 22 | CS + PVA + PU | 0.44 | 200 | 10 | 66 | <250 | ||||
| Matrix-less syntactic foam (this work) made in 20 mm mold | ||||||||||
| 23 | CS 63-150 µm | 0.97 |
1100 | 10.95 | 61.5 | 43.00 | 18.51 | 50-120 | SPS at 1050 °C | |
| 23 | CS 63-150 µm | 1.16 | 1100 | 22.21 | 54.9 | 37.59 | 17.35 | SPS at 1100 °C | ||
| 25 | CS 63-150 µm | 1.57 | 1100 | 49.57 | 38.3 | 16.53 | 21.80 | SPS at 1150 °C | ||
| 26 | CS 63-150 µm | 1.98 | 1100 | 94.26 | 21.5 | 3.54 | 17.93 | SPS at 1200 °C | ||
Disclaimer/Publisher’s Note: The statements, opinions and data contained in all publications are solely those of the individual author(s) and contributor(s) and not of MDPI and/or the editor(s). MDPI and/or the editor(s) disclaim responsibility for any injury to people or property resulting from any ideas, methods, instructions or products referred to in the content. |
© 2023 by the authors. Licensee MDPI, Basel, Switzerland. This article is an open access article distributed under the terms and conditions of the Creative Commons Attribution (CC BY) license (http://creativecommons.org/licenses/by/4.0/).


