1. Introduction
The quantification of red blood cells (RBCs), and white blood cells (WBCs) in both healthy and diseased patients is essential, and a complete blood count (CBC) is routinely done to establish a patient evaluation database [
1,
2,
3]. Laboratory tests are conducted for various reasons, including screening tests like CBC on healthy animals as a preventive medicine measure, testing geriatric patients for subclinical disease, and identifying conditions that could make an animal a surgical or anesthetic risk. Tests may also confirm a presumptive diagnosis or determine the severity of a disease, formulate a prognosis, and monitor response to therapy or disease progression. [
2].
Automated hematology analyzers are commonly used in veterinary reference laboratories and clinics to generate quick and cost-effective CBC results, which can aid in improving patient care [
1,
3]. The decision to request hematology tests is based on the cost of the test versus the potential benefit to the animal. [
2].
State-of-the-art hematology analyzers employ various techniques, such as electrical impedance counting, flow cytometry, and light/laser scattering, to measure blood parameters [
4]. Although these analyzers are reliable in RBC counts, they are less accurate in determining WBC differential. Consequently, the American Society for Veterinary Clinical Pathology (ASCVP) has issued thorough guidelines for hemogram quality assurance, which involve manual counting through microscopic examination of blood smears [
5].
There is significant promise in using visible shortwave near-infrared (Vis-SWNIR) spectroscopy for point-of-care (POC) applications. Spectral POC has the advantage of not requiring any sample preparation or reagents, as it can accurately measure hemograms using just one drop of blood [
6,
7,
8].
Visible short-wave near-infrared (Vis-SWNIR) spectroscopy is a technology that provides important information, encompassing both physical and chemical aspects. Information concerning blood cells and components is distributed across different wavelengths at varying scales. However, chemometrics and artificial intelligence methods have predominantly focused on modeling absorbance or transmittance while neglecting the scattering information that is present in the spectra. This scattering information has been considered a systematic effect that needs to be corrected and hence disregarded as irrelevant to the chemical composition [
9]. Therefore, scattering correction algorithms are applied as pre-processing steps in Vis-SWNIR spectroscopy. The different cell types, with their diverse sizes and shapes, leave behind a unique scattering pattern in the observed spectra. This property is applied for cell differentiation in laser scattering cell counters at specific laser wavelengths [
10].
Vis-SWNIR blood spectroscopy is subject to scattering effects caused by geometrical, Mie, and Rayleigh scattering. These effects occur simultaneously, operate at varying scales, and affect each wavelength differently. This study investigates the correlation between scattering coefficients obtained through extended multiplicative scattering correction and blood cell counts, including RBC, WBC, hemoglobin content, and hematocrit.
2. Materials and Methods
Dog blood samples were obtained by veterinary doctors during routine clinical practice at the Anicura CHV - Veterinary Hospital Center, using standard venipuncture technique. The remaining blood from EDTA tubes from routine clinical diagnostic procedures, collected previously and still in a fresh state, was subsequently utilized for these tests. Hemogram parameters were determined by the Mindray BC-5800-vet auto-hematology analyzer.
A POC prototype was utilized to record blood spectra, which consisted of a 4500K power LED as a light source and a miniaturized spectrometer (Ocean Insight STS-vis) that was USB-based. The optical configuration and plug-in capsule system were in accordance with [
7]. The LED temperature and spectrometer integration times were automatically regulated to ensure result consistency, and three replicates were taken for each blood sample.
Extended scattering correction algorithm [
8] was employed to obtain scattering coefficients. These coefficients were computed relative to the median sample spectra and are contained within the scattering matrix S. The scattering matrix is associated with hemogram parameters such as RBC, Hemoglobin (Hgb), Hematocrit (HTC), and WBC, through a multivariate linear model (MLM). To evaluate the statistical significance, metrics including the standard error (SE), Pearson correlation coefficient (R), mean absolute error percentage (MAPE), and coefficient of determination (R2) were used.
3. Results
3.1. Scattering correction analysis
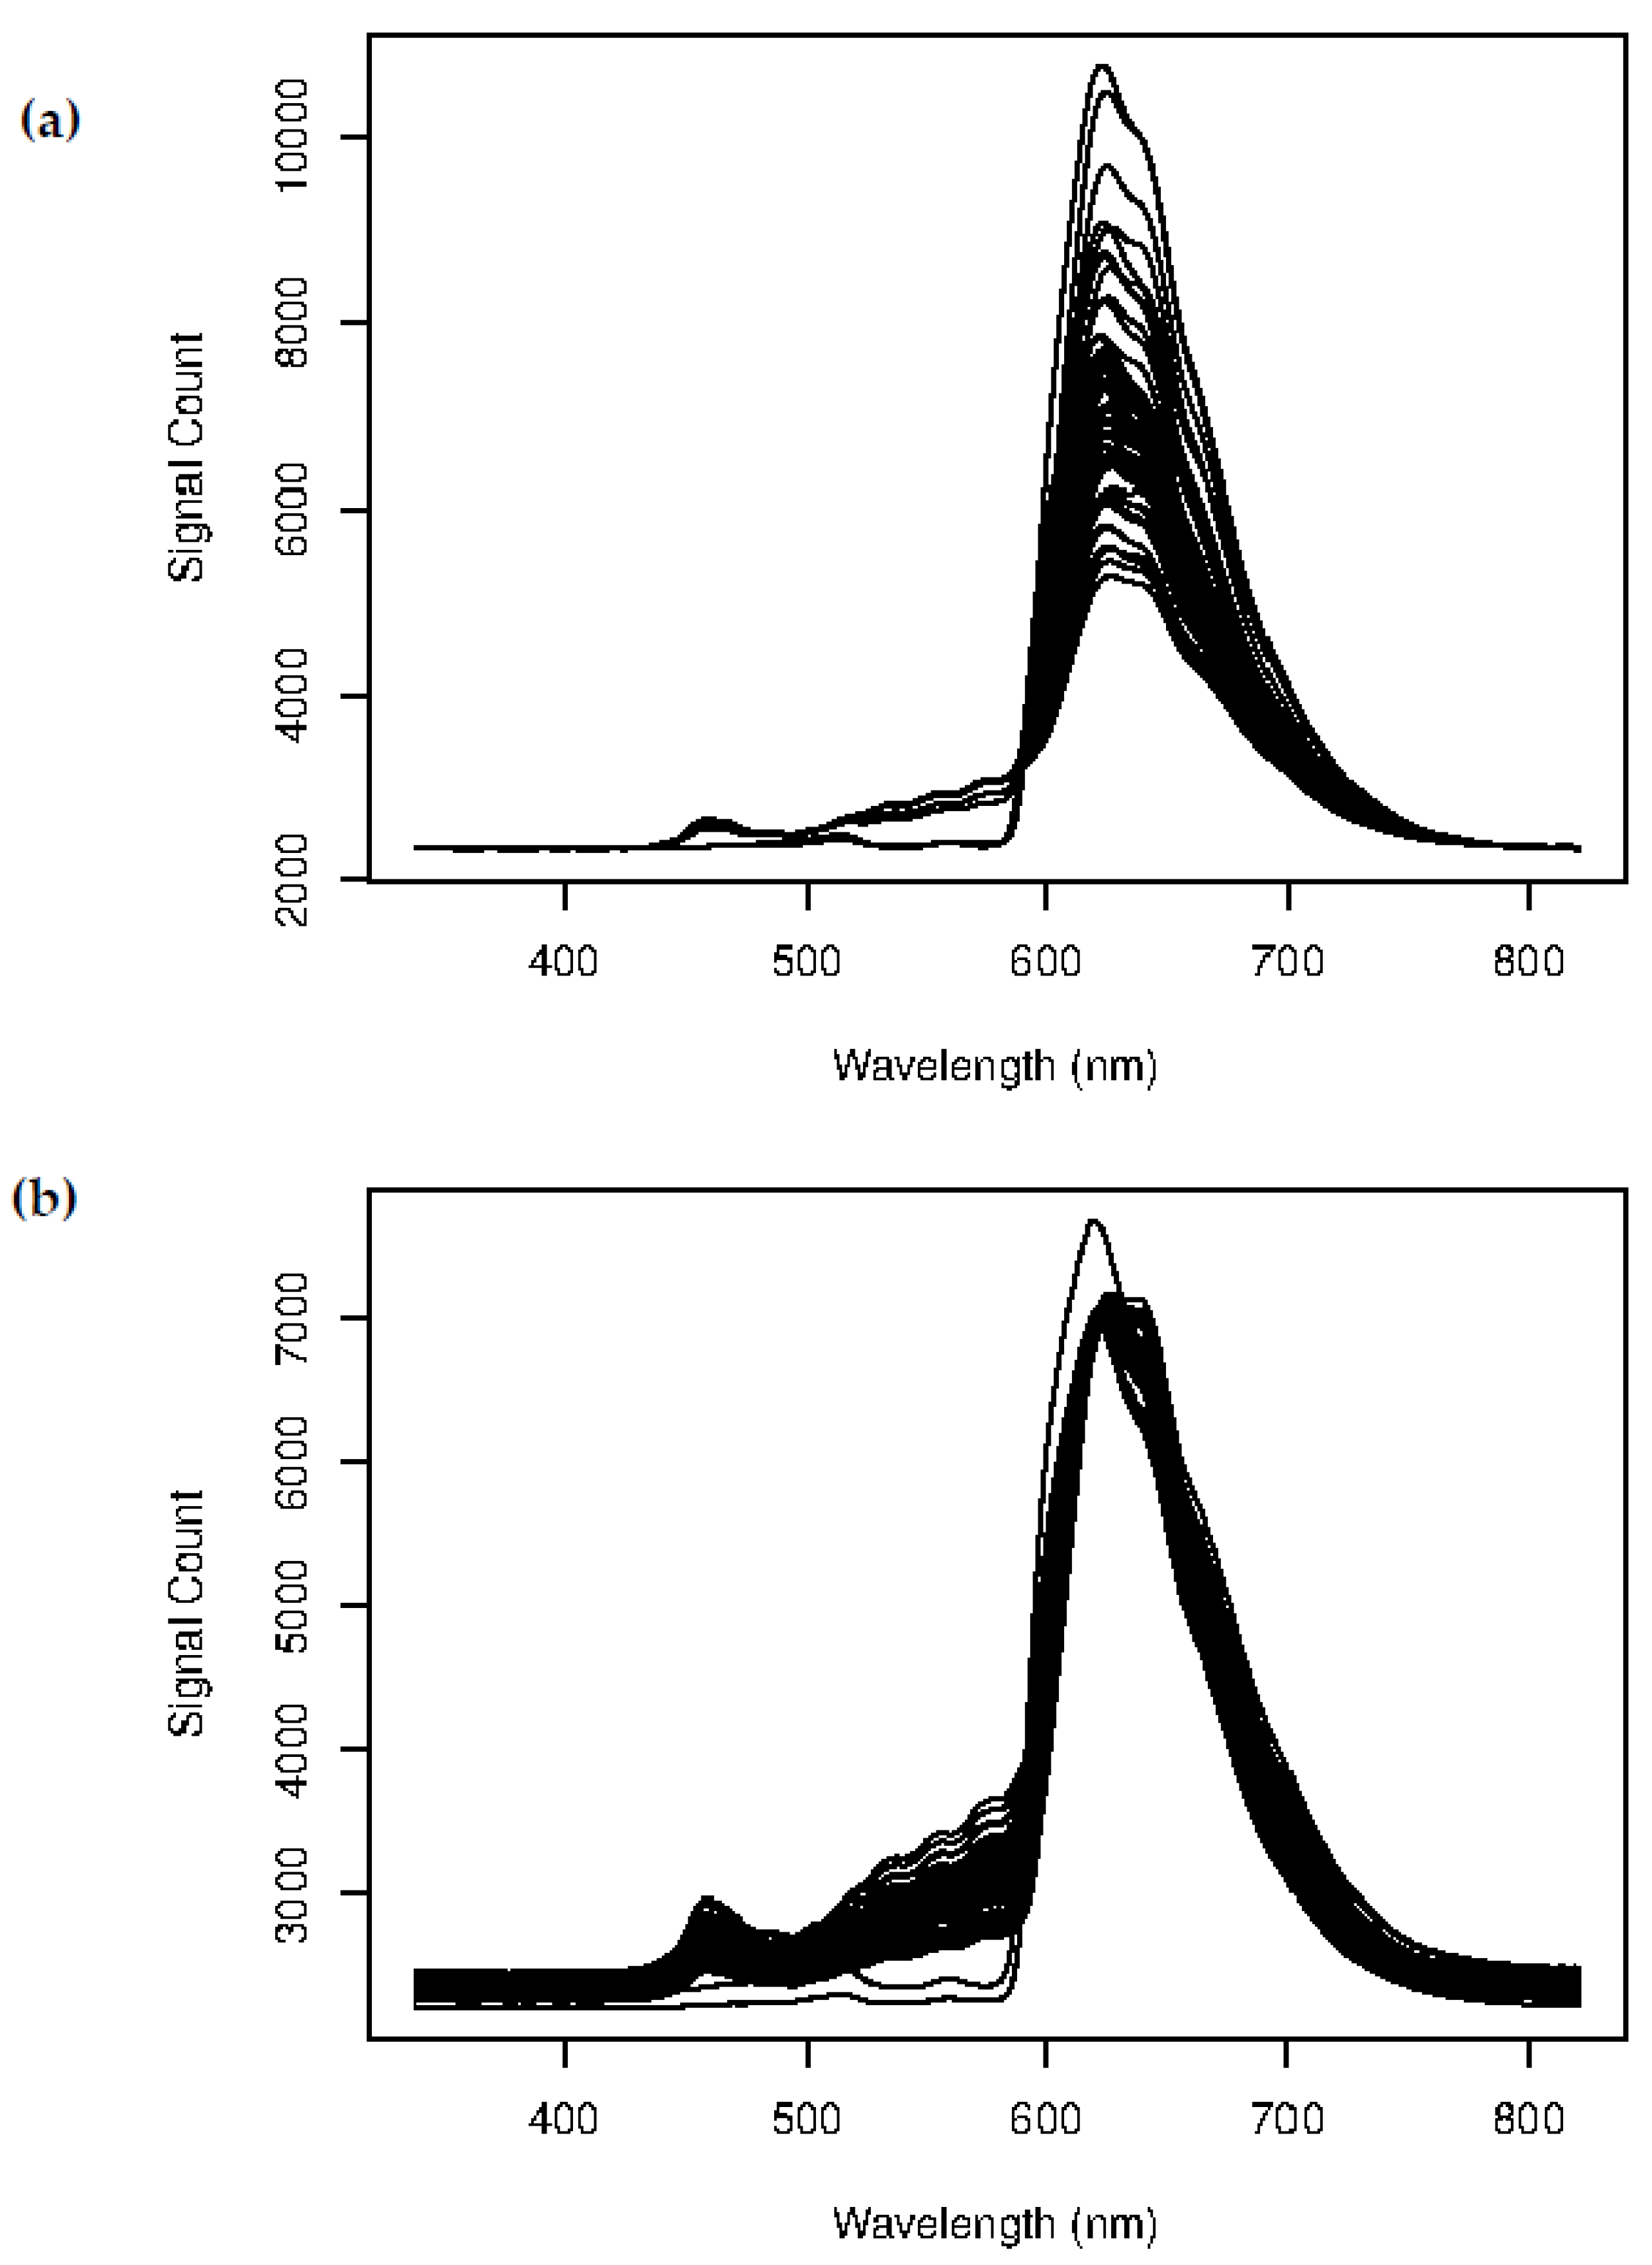
Figure 1 presents the results of the scattering correction analysis. Scattering effects were observed to impact all wavelengths, with a significant effect in the 400 to 600 nm region of interest 1 (ROI 1). This region of the spectrum is within the maximum absorbance range of hemoglobin and bilirubin, where the scattering effect was found to be especially pronounced. In contrast, the region of 600 to 800 nm (ROI 2) exhibited significantly less scattering. Blood spectra in this region were highly differentiated. ROI 1 was characterized by the high absorbance and scattering of Hgb, which is attributed to the densely packed RBC in dog blood. Higher wavelengths displayed much less significant absorbance and scattering. Therefore, each blood sample has a unique scattering fingerprint that is directly linked to blood cell counts and composition.
3.2. Correlation plots
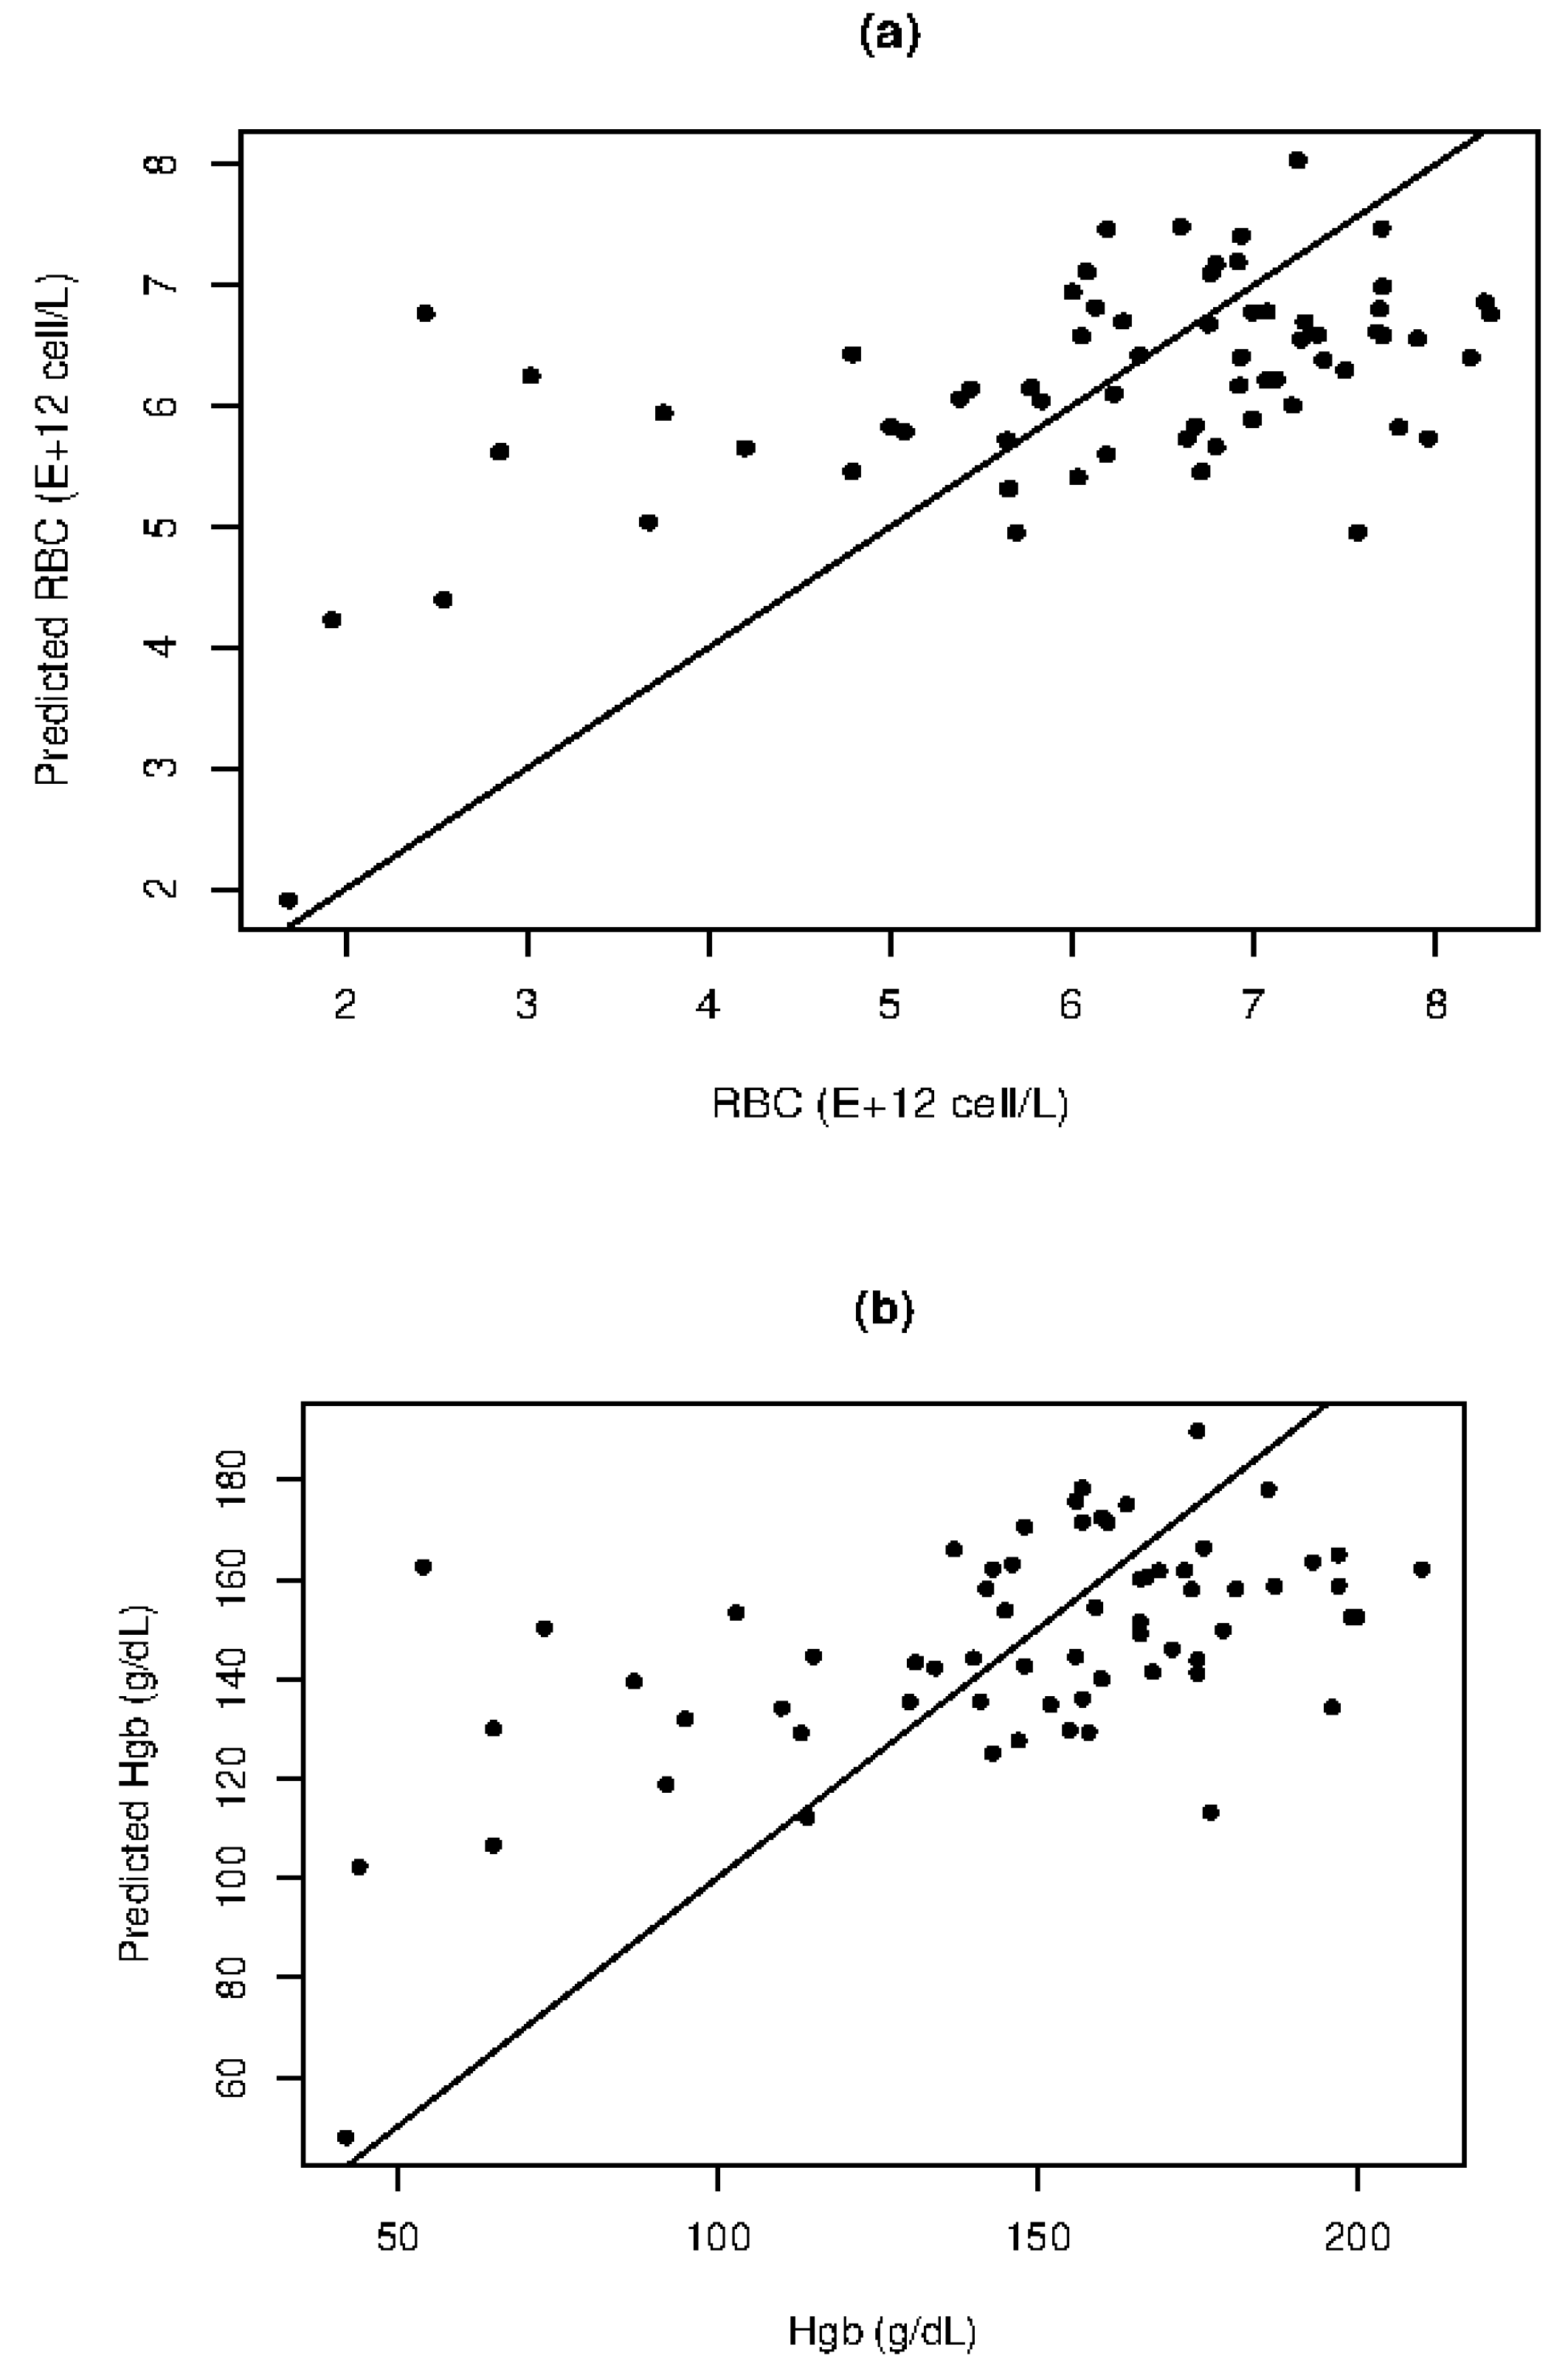
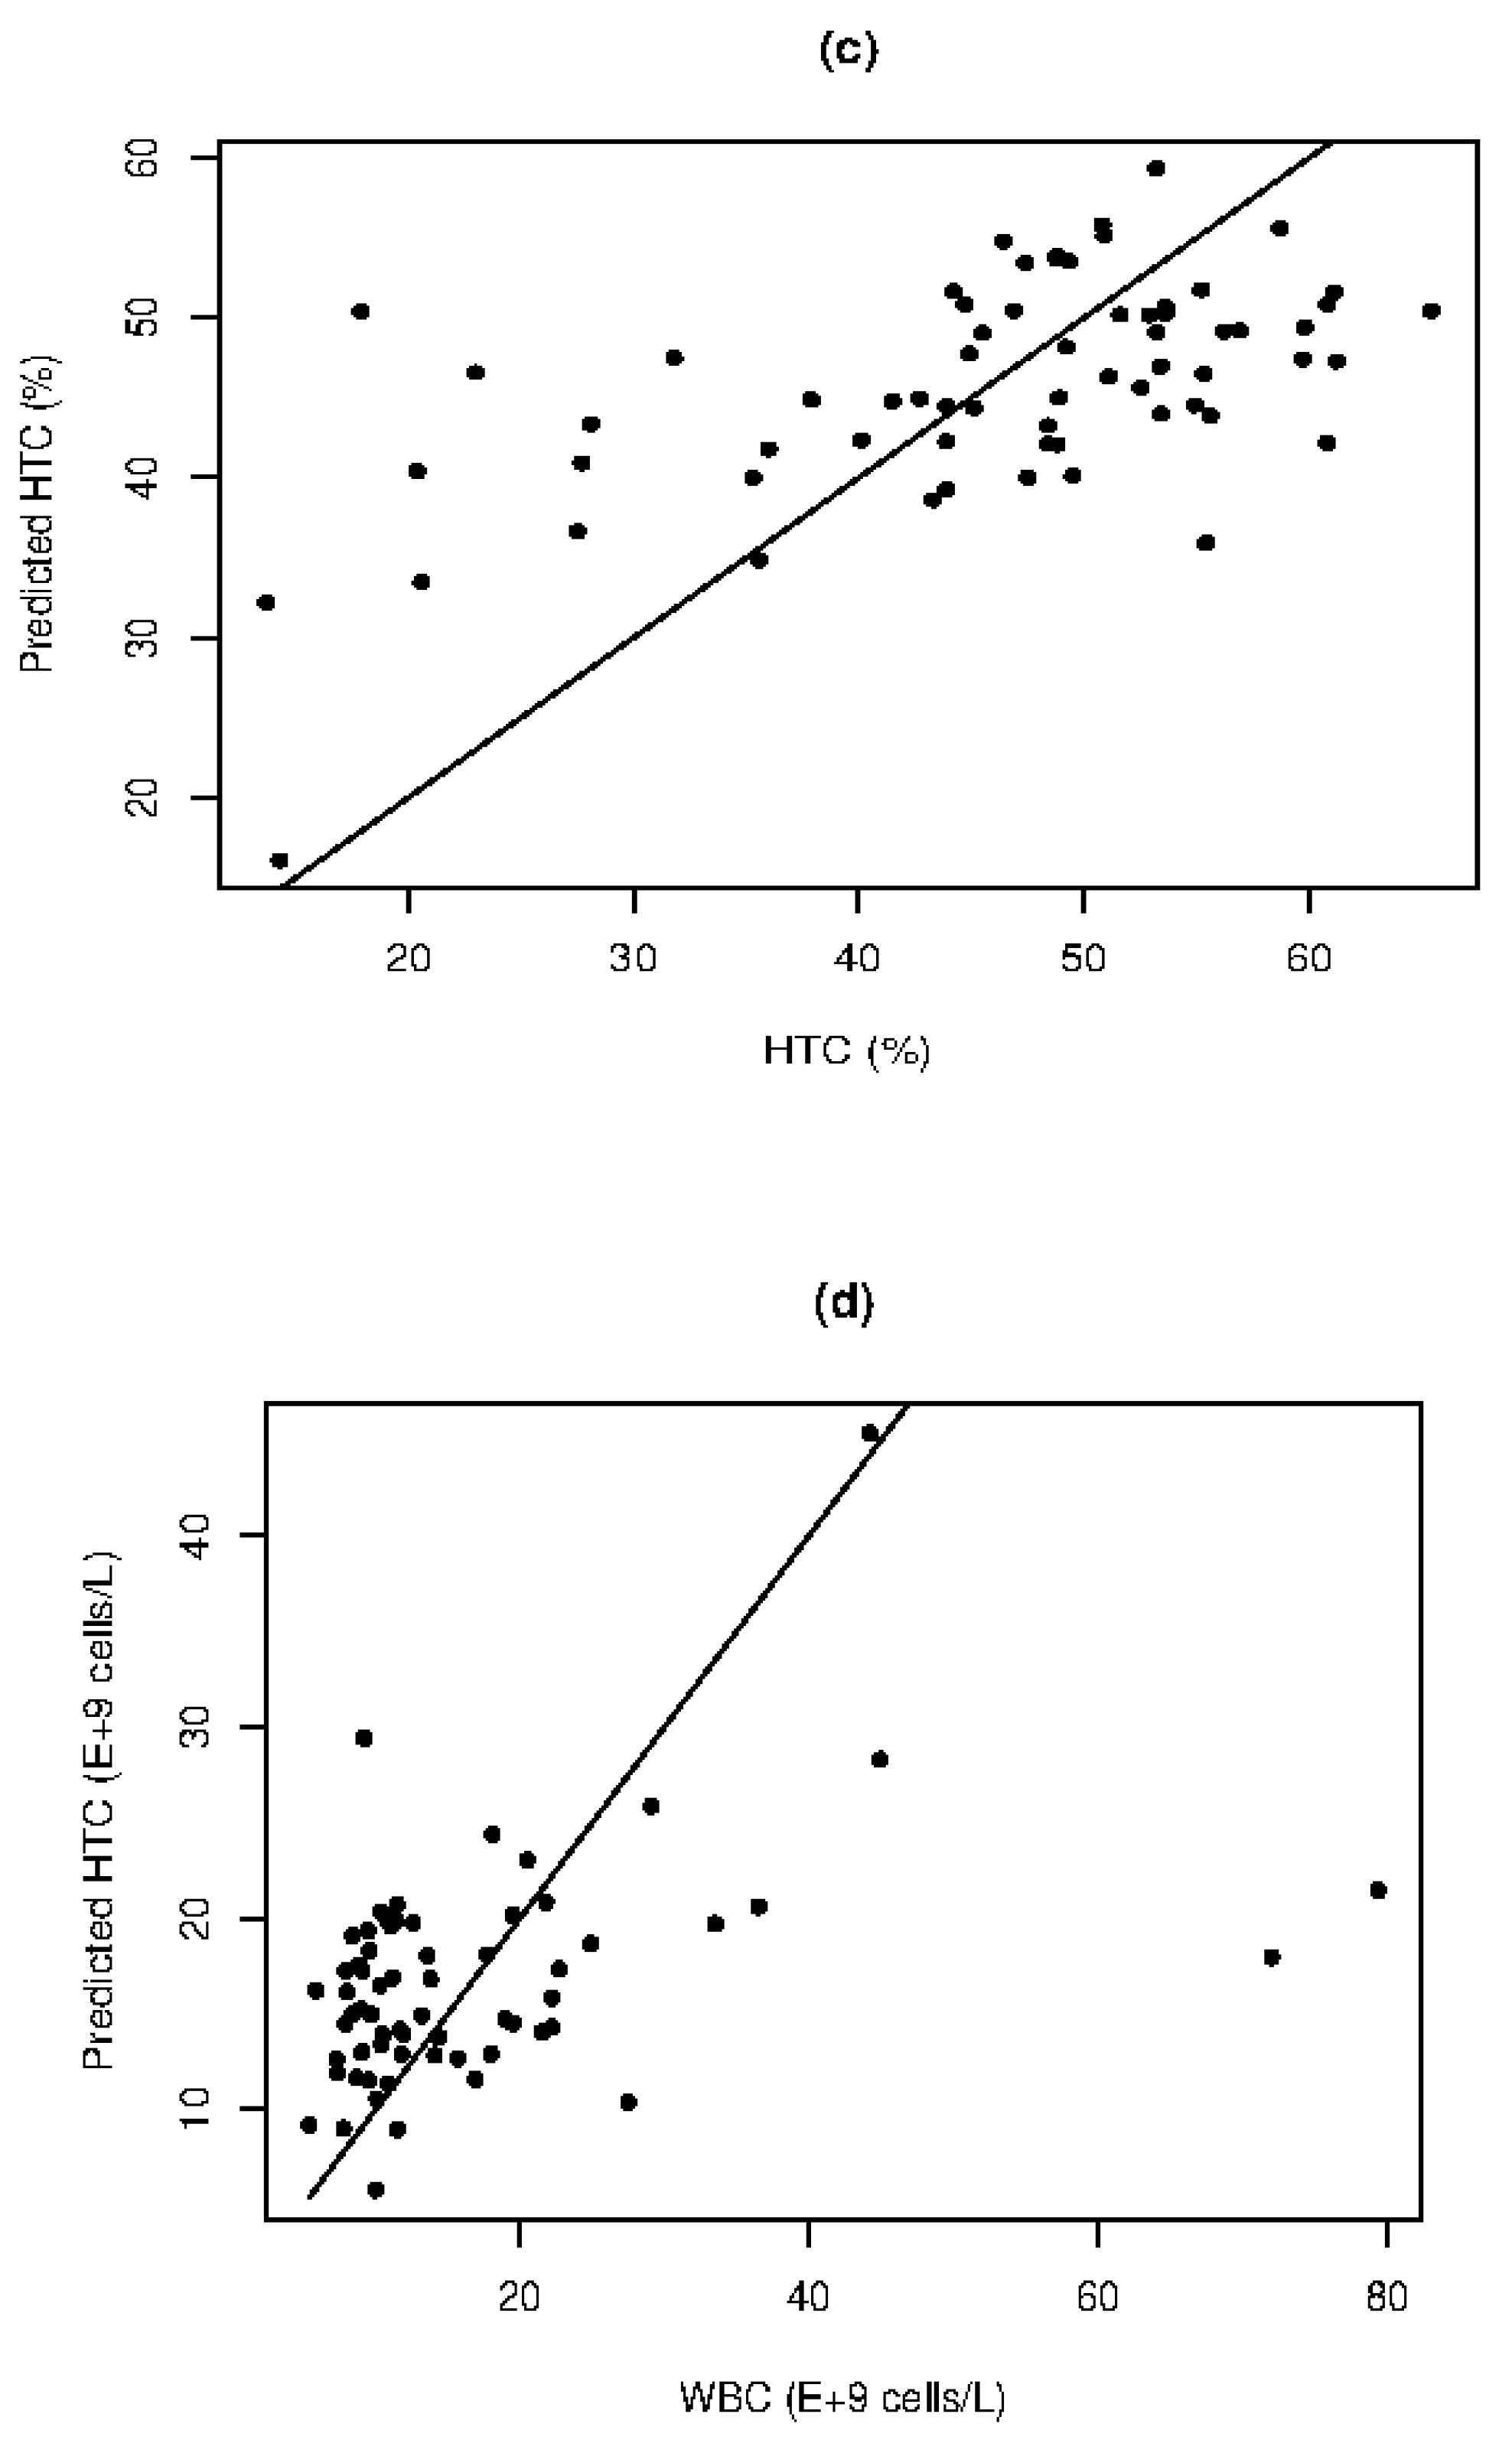
The correlation plots for RBC, Hgb, HTC, and WBC are presented in
Figure 2, while
Table 1 displays the MLR results. Moderate linear correlation between scattering coefficients and RBC counts (R=0.5739) is demonstrated, as shown by the SE of 1.309×10
12 and MAPE of 21.48%. This indicates that scattering coefficients carry information about RBC in dog blood, despite the observed large variance. The MLR can provide qualitative quantification between high and low RBC values. Similarly, a moderate correlation (R=0.5623) is observed for Hgb, which is highly co-linear with RBC. The MLR can capture the major relationship between Hgb and scattering, with a MAPE of 22.66% and SE of 32.51 g/dL allowing for qualitative quantification of Hgb levels.
4. Discussion
The correlation between HTC and scattering coefficients, which represents the percentage of RBC in relation to serum volume, is expectedly positive (R=0.5682). A qualitative quantification for HTC is achieved with a MAPE of 21.99% and SE of 9.5%. Although WBC are present in low concentrations, results demonstrate that WBC counts are correlated with scattering coefficients (
Figure 2d). The overall correlation of 0.4270 is skewed by two outliers with very high WBC counts (
Figure 2d). However, good agreement is observed for results within the range of 5 to 40×10
9 cell/L (
Figure 2d). The scattering information obtained from the spectra carries information about blood cells, including RBC and WBC, as well as Hgb and HTC. The MLM demonstrates a correlation with high variance, which requires further investigation to:
i. Evaluate the efficacy of scattering correction in extracting scattering coefficients, considering the possibility of corrections being distorted for samples that differ significantly from the reference;
ii. Investigate the efficiency of alternative scattering models for obtaining scattering information from spectra;
iii. Examine the potential of scattering information as a complementary factor to absorbance or transmittance.
5. Conclusions
Scattering effects present in blood Vis-SWNIR spectra provide a potential link to parameters such as RBC, WBC, Hgb, and HTC. However, the relationship between these parameters exhibits significant variability. Thus, mitigating this variance becomes pivotal in harnessing scattering effects for spectral quantification. Further investigation is required to comprehensively investigate the potential of utilizing scattering properties for accurate quantification of blood hemogram.
Acknowledgments
Martins: R.C. acknowledges Fundação para a Ciência e Tecnologia (FCT) research contract grant (CEEIND/017801/2018).
Conflicts of Interest
The authors declare no conflict of interest.
References
- Zitzer, N.C. The Greatness of Glass: Importance of Blood Smear Evaluation. Vet. Clin. North Am. Small Anim. 2023, 53(1), 29–52. [Google Scholar] [CrossRef]
- Harvey, J.W. Introduction to Veterinary Hematology. In Veterinary Hematology. Harvey, J.W. W.B. Saunders: Pennsylvania, United States. 2012, pp. 1-10, ISBN 9781437701739. [CrossRef]
- Green, R.; Wachsmann-Hogiu, S. Development, history, and future of automated cell counters. Clin. Lab. Med. 2015, 35, 1–10. [Google Scholar] [CrossRef] [PubMed]
- Arnold, J.E.; Camus, M.S.; Freeman, K.P.; Giori, L.; Hooijberg, E.H.; Jeffery, U.; Korchia, J.; Meindel, M.J.; Moore, A.R.; Sisson, S.C.; Vap, L.M.; Cook, J.R. ASVCP guidelines: Principles of quality assurance and standards for veterinary clinical pathology (version 3.0). Vet. Clin. Pathol. 2019, 48, 542–618. [Google Scholar] [CrossRef] [PubMed]
- Barroso, T.G.; Ribeiro, L.; Gregório, H.; Santos, F.; Martins, R.C. Point-of-care Vis-SWNIR spectroscopy towards reagent-less hemogram analysis. Sens Actuators B Chem. 2021, 343, 130138. [Google Scholar] [CrossRef]
- Martins, R.C.; Sousa, N.J., Osorio R. Optical system for parameter characterization of an element of body fluid or tissue. US10209178B2. 2017 (Granted 19 Fev 2019).
- Martins, R.C. Big data self-learning artificial intelligence methodology for the accurate quantification and classification of spec- tral information under complex variability and multi-scale interference. WO/2018/060967. 2018.
- Martens, H.; Stark, E. Extended multiplicative signal correction and spectral interference subtraction: New preprocessing meth- ods for near infrared spectroscopy. J. Pharm. Biomed. Anal. 1991, 9, 625–635. [Google Scholar] [CrossRef]
- Brown, M.; Wittwer, C. Flow cytometry: principles and clinical applications in hematology. Clin. Chem. 2000, 46, 1221–1229. [Google Scholar] [CrossRef] [PubMed]
- Gallagher, N.B.; Blake, T.A.; Gassman, P.L. Application of Extended Multiplicative Scatter Correction to mid-Infrared Reflectance Spectroscopy of Soil. J. Chemometr. 2005, 19, 271–281. [Google Scholar] [CrossRef]
|
Disclaimer/Publisher’s Note: The statements, opinions and data contained in all publications are solely those of the individual author(s) and contributor(s) and not of MDPI and/or the editor(s). MDPI and/or the editor(s) disclaim responsibility for any injury to people or property resulting from any ideas, methods, instructions or products referred to in the content. |
© 2024 by the authors. Licensee MDPI, Basel, Switzerland. This article is an open access article distributed under the terms and conditions of the Creative Commons Attribution (CC BY) license (http://creativecommons.org/licenses/by/4.0/).


