Submitted:
31 December 2023
Posted:
02 January 2024
You are already at the latest version
Abstract
Keywords:
1. Introduction
2. Experiment
2.1. Chemical reagents
2.2. Preparation of ZIF-67
2.3. Purification Treatment of MWCNTs
2.4. Fabrication of ZIF-67/GCE, ZIF-67/MWCNTs/GCE, ZIF-67/MWCNTs/Nafion/GCE
2.5. Instruments and measurements
3. Results and discussion
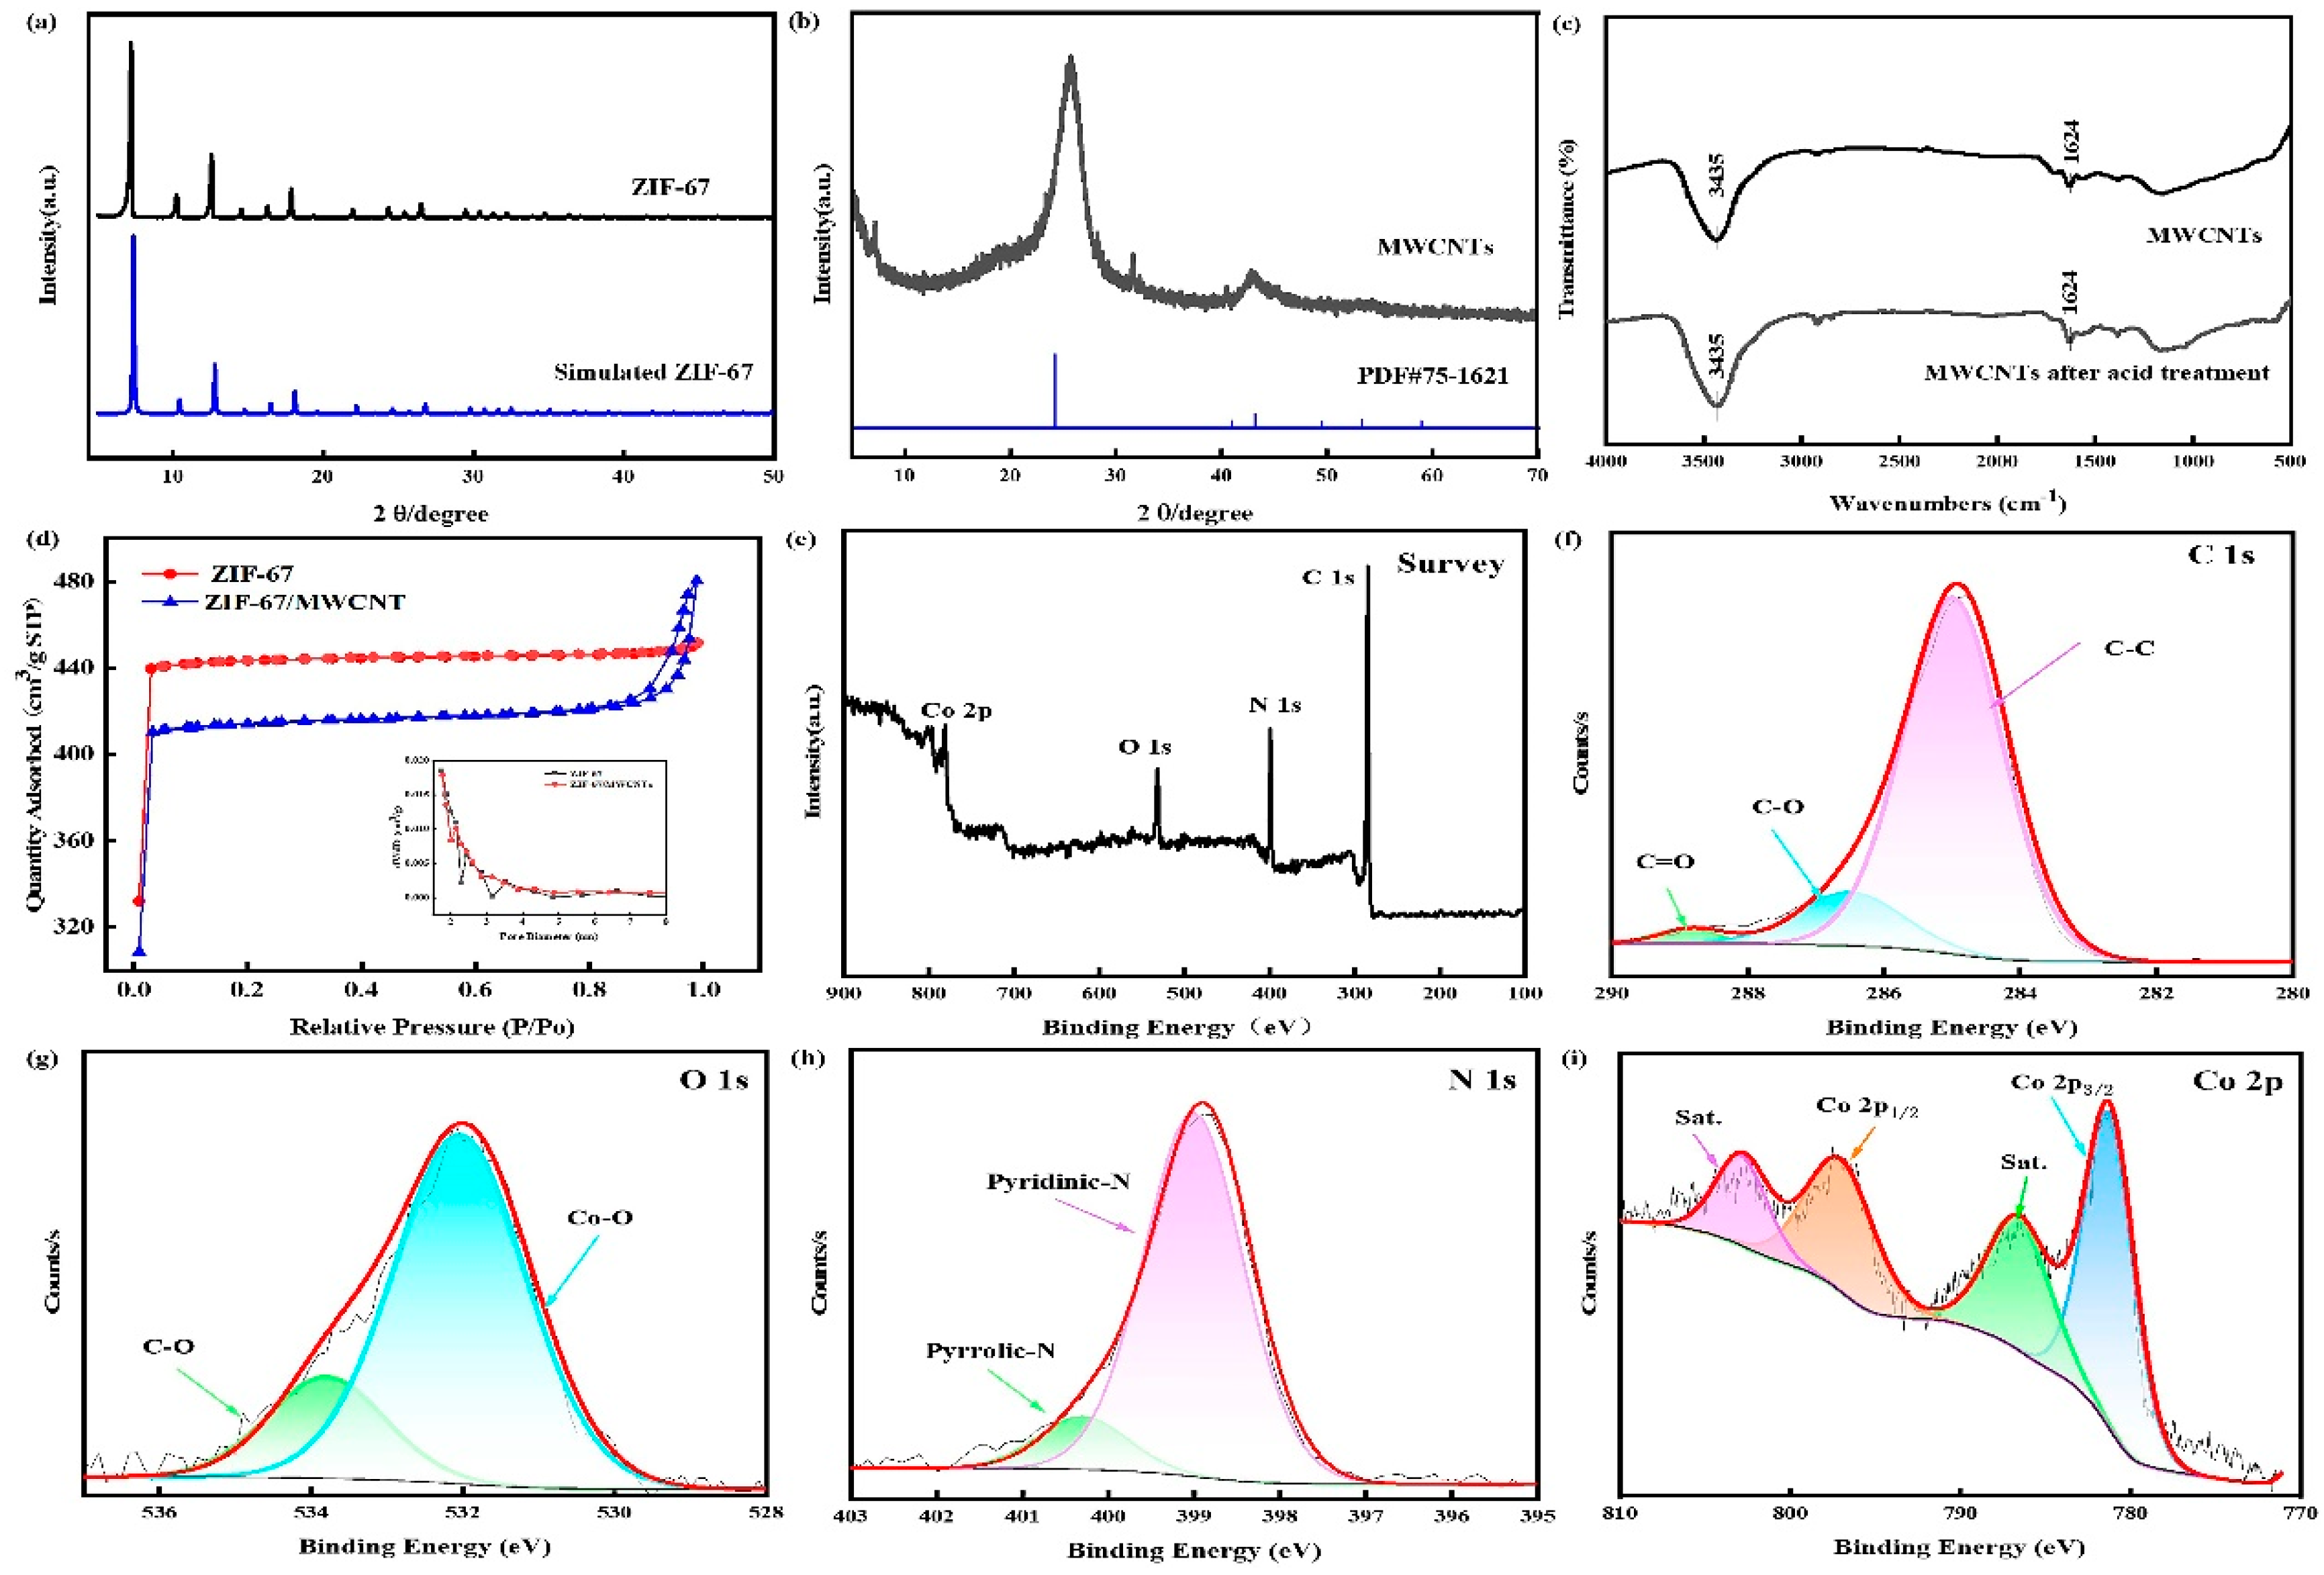
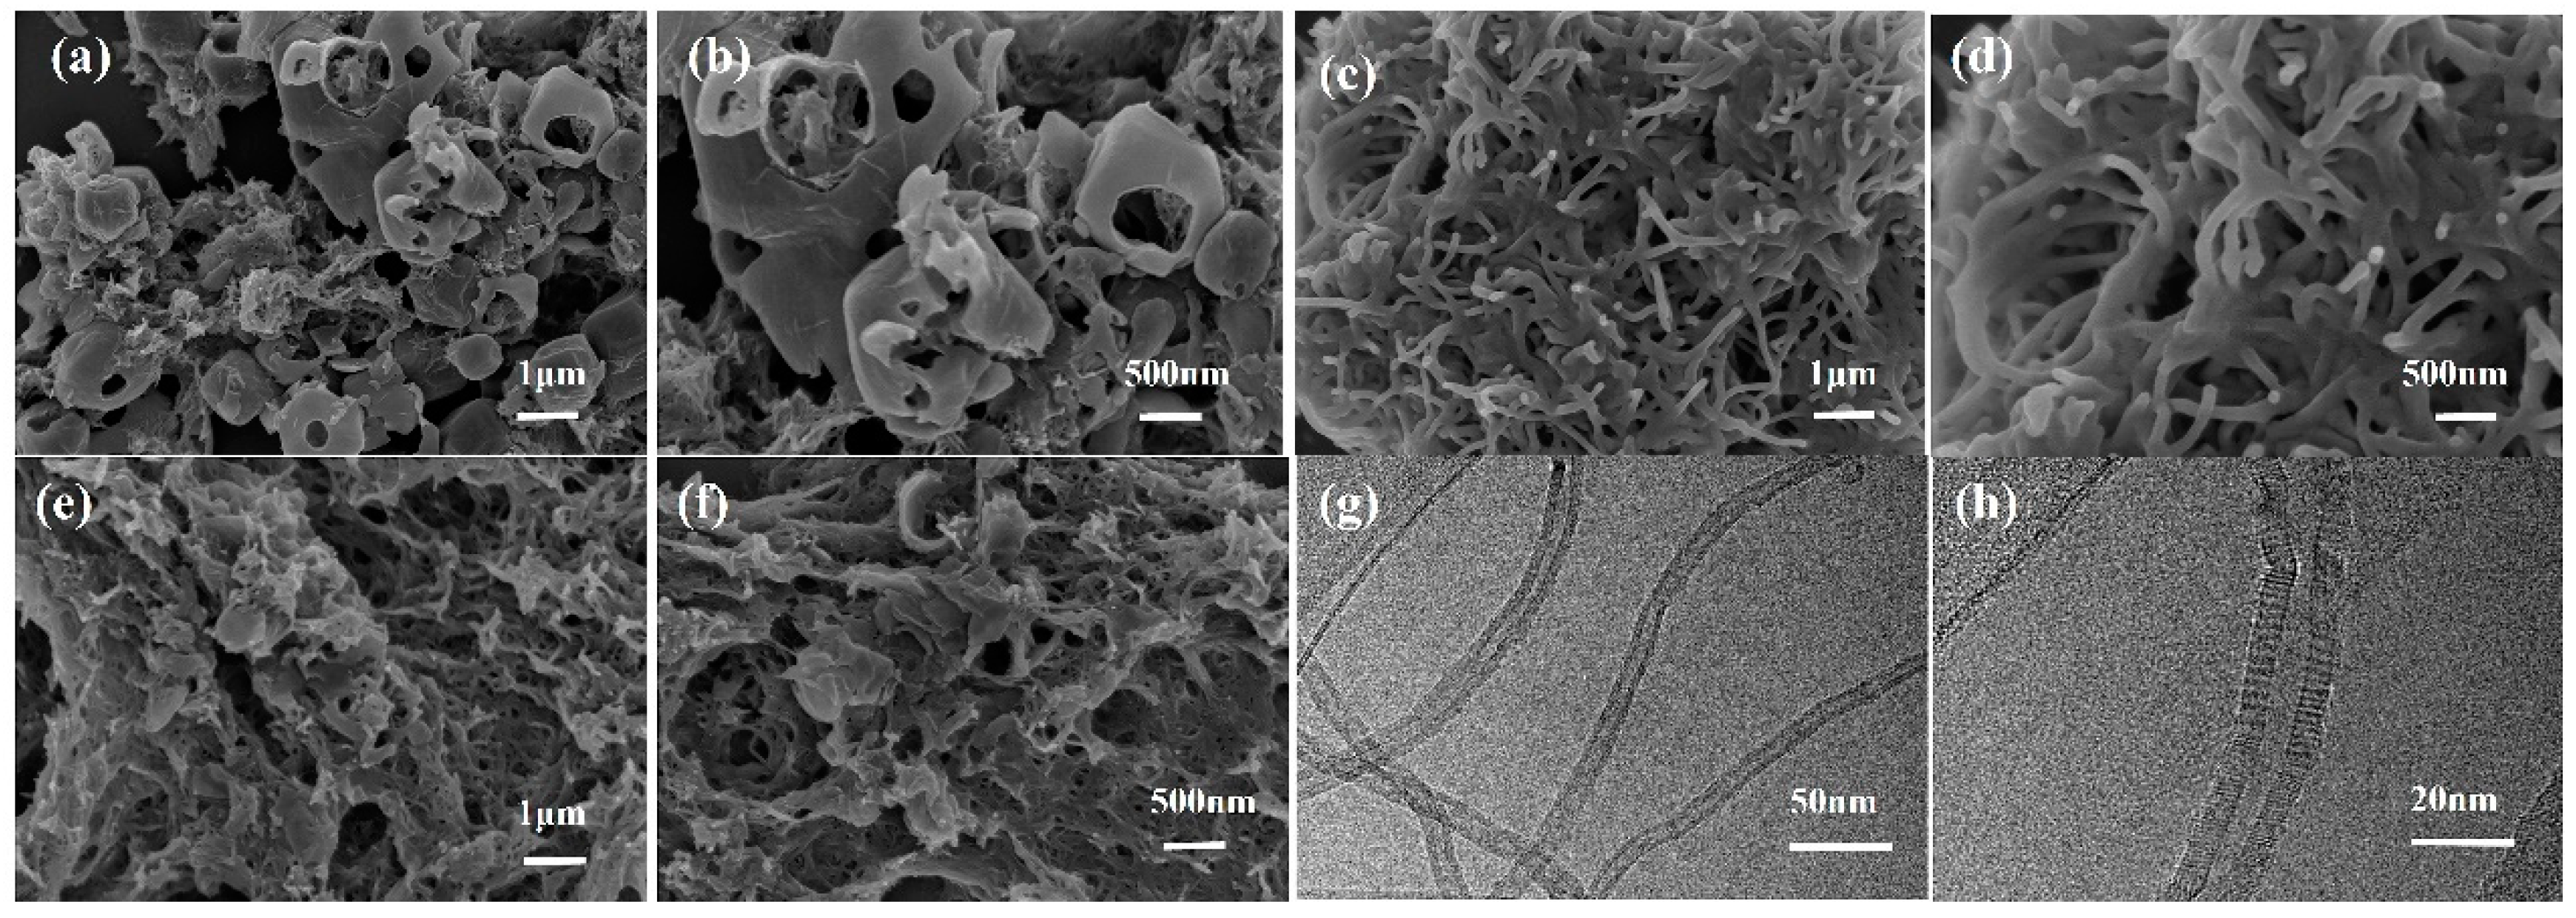
3.1. Characterization of electrode modification materials
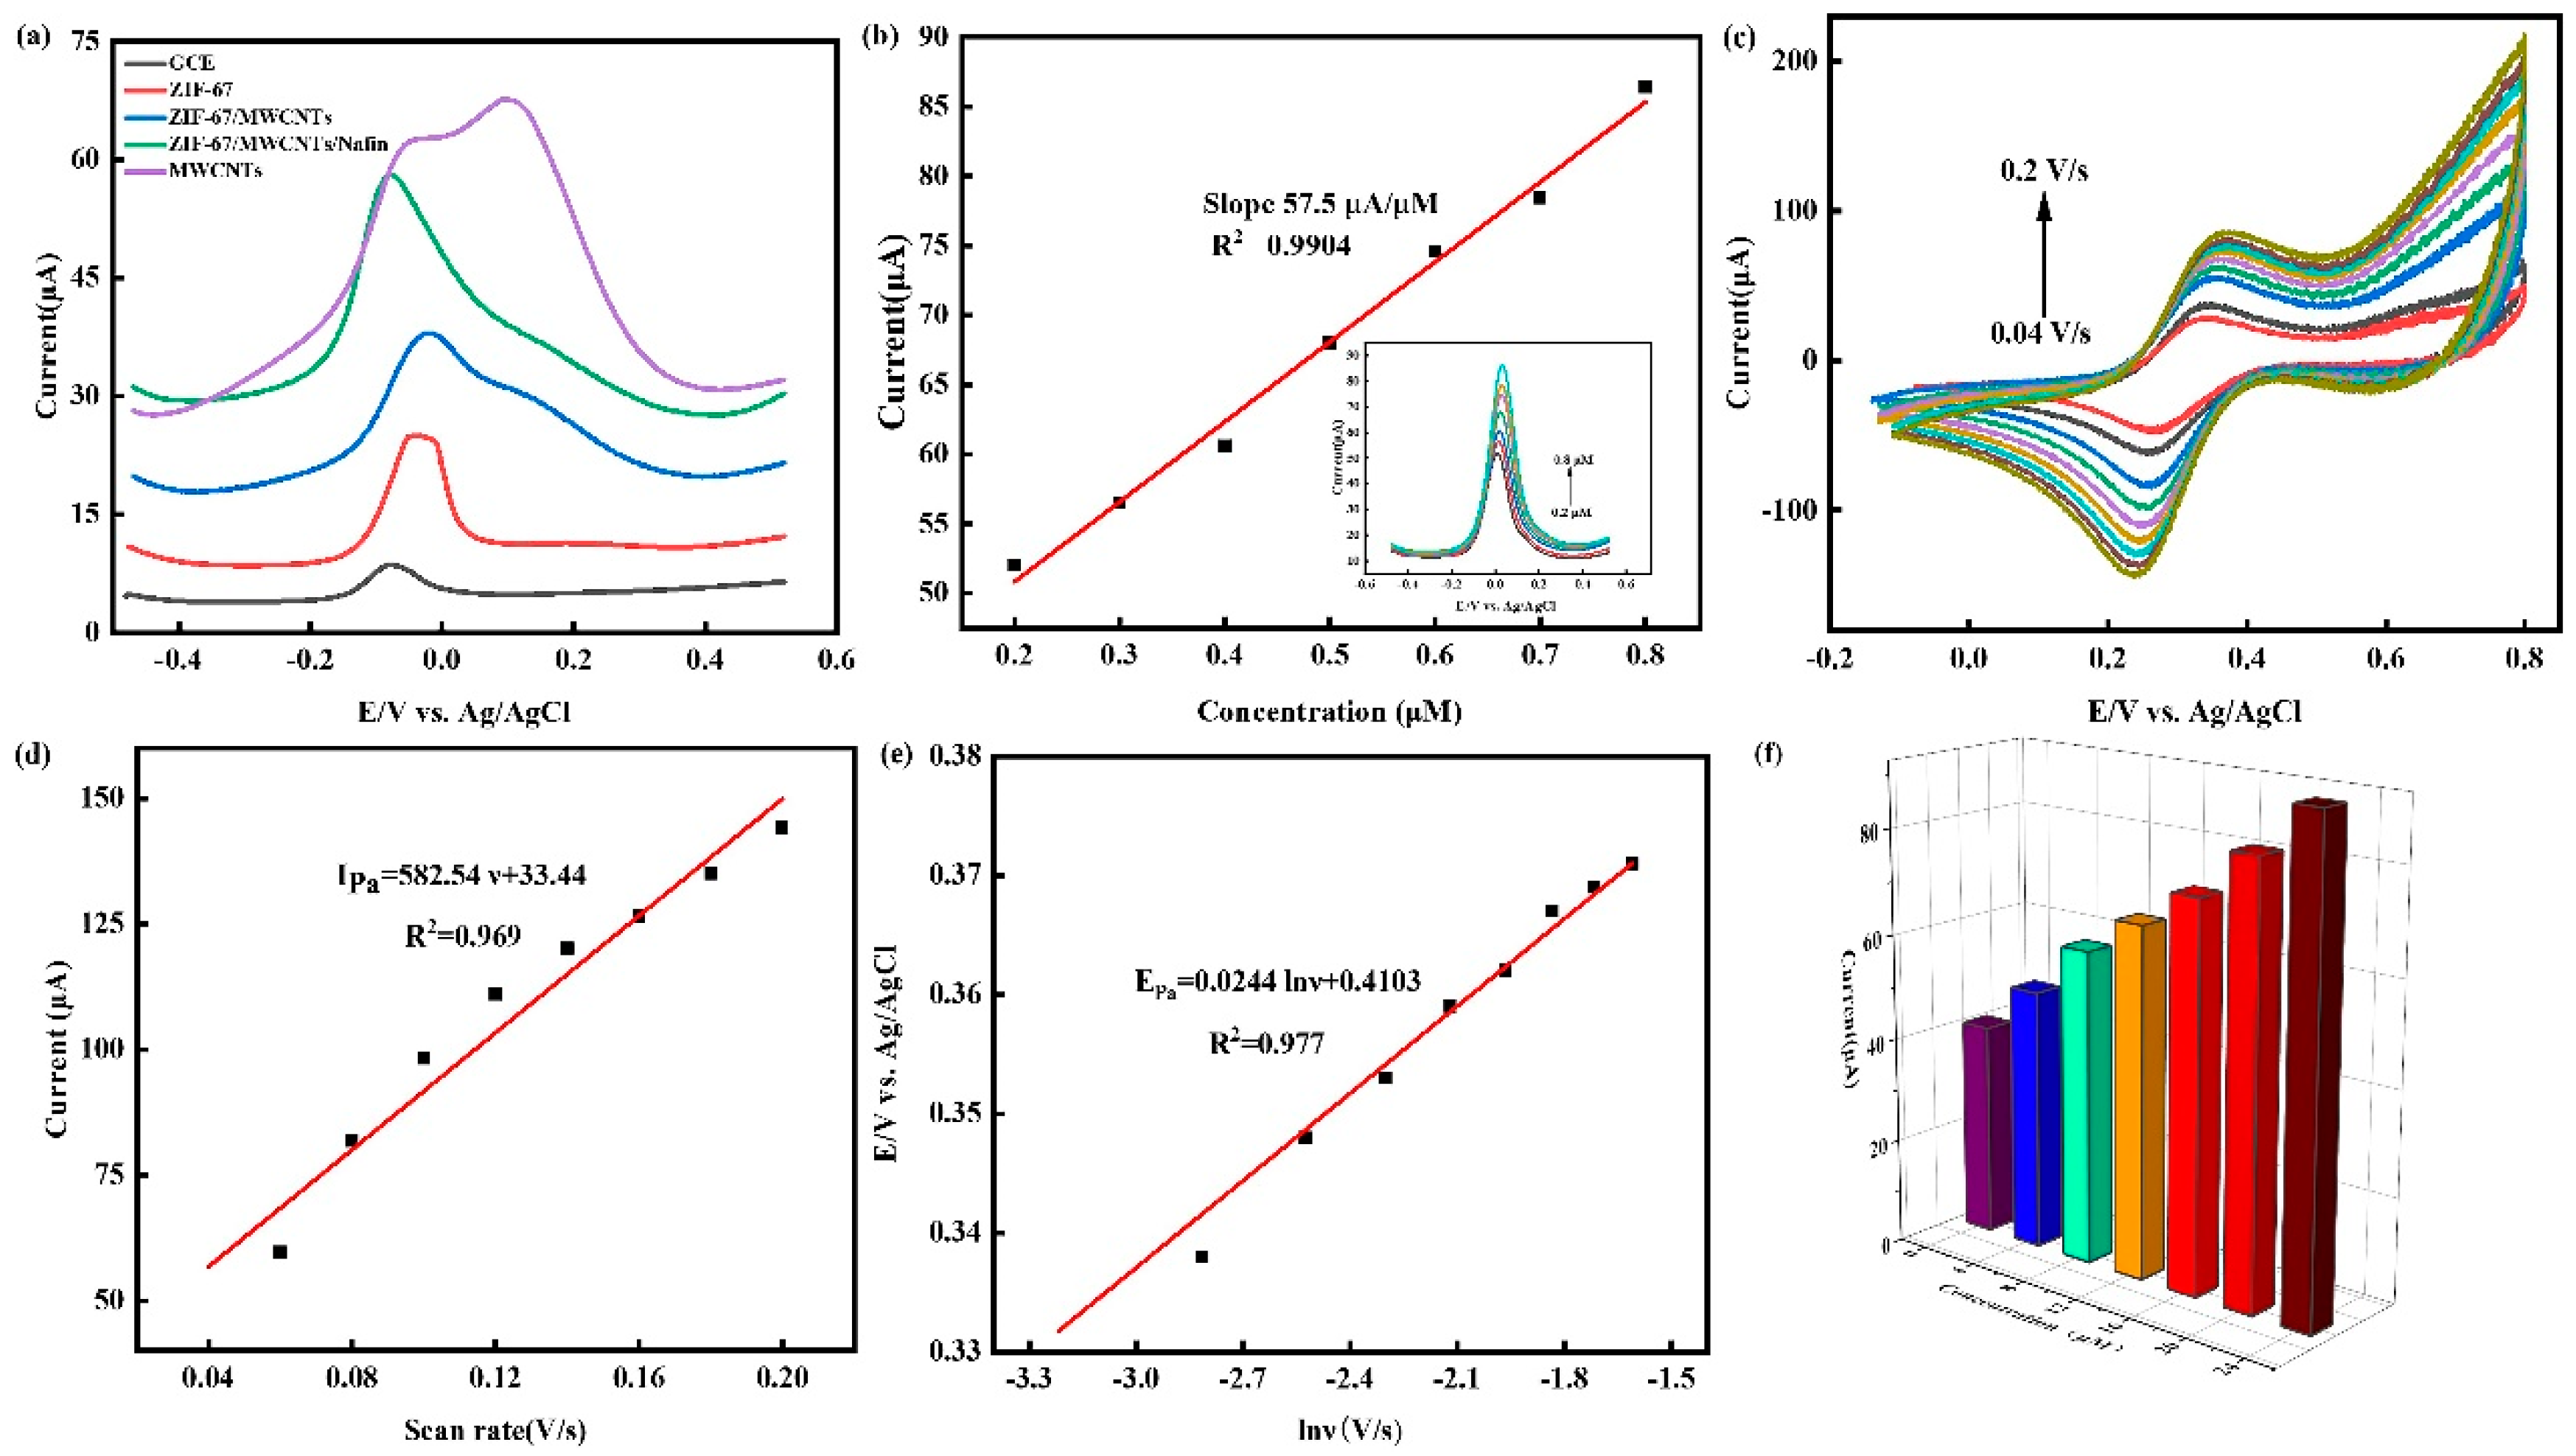
3.2. Electrochemical characterization of electrodes
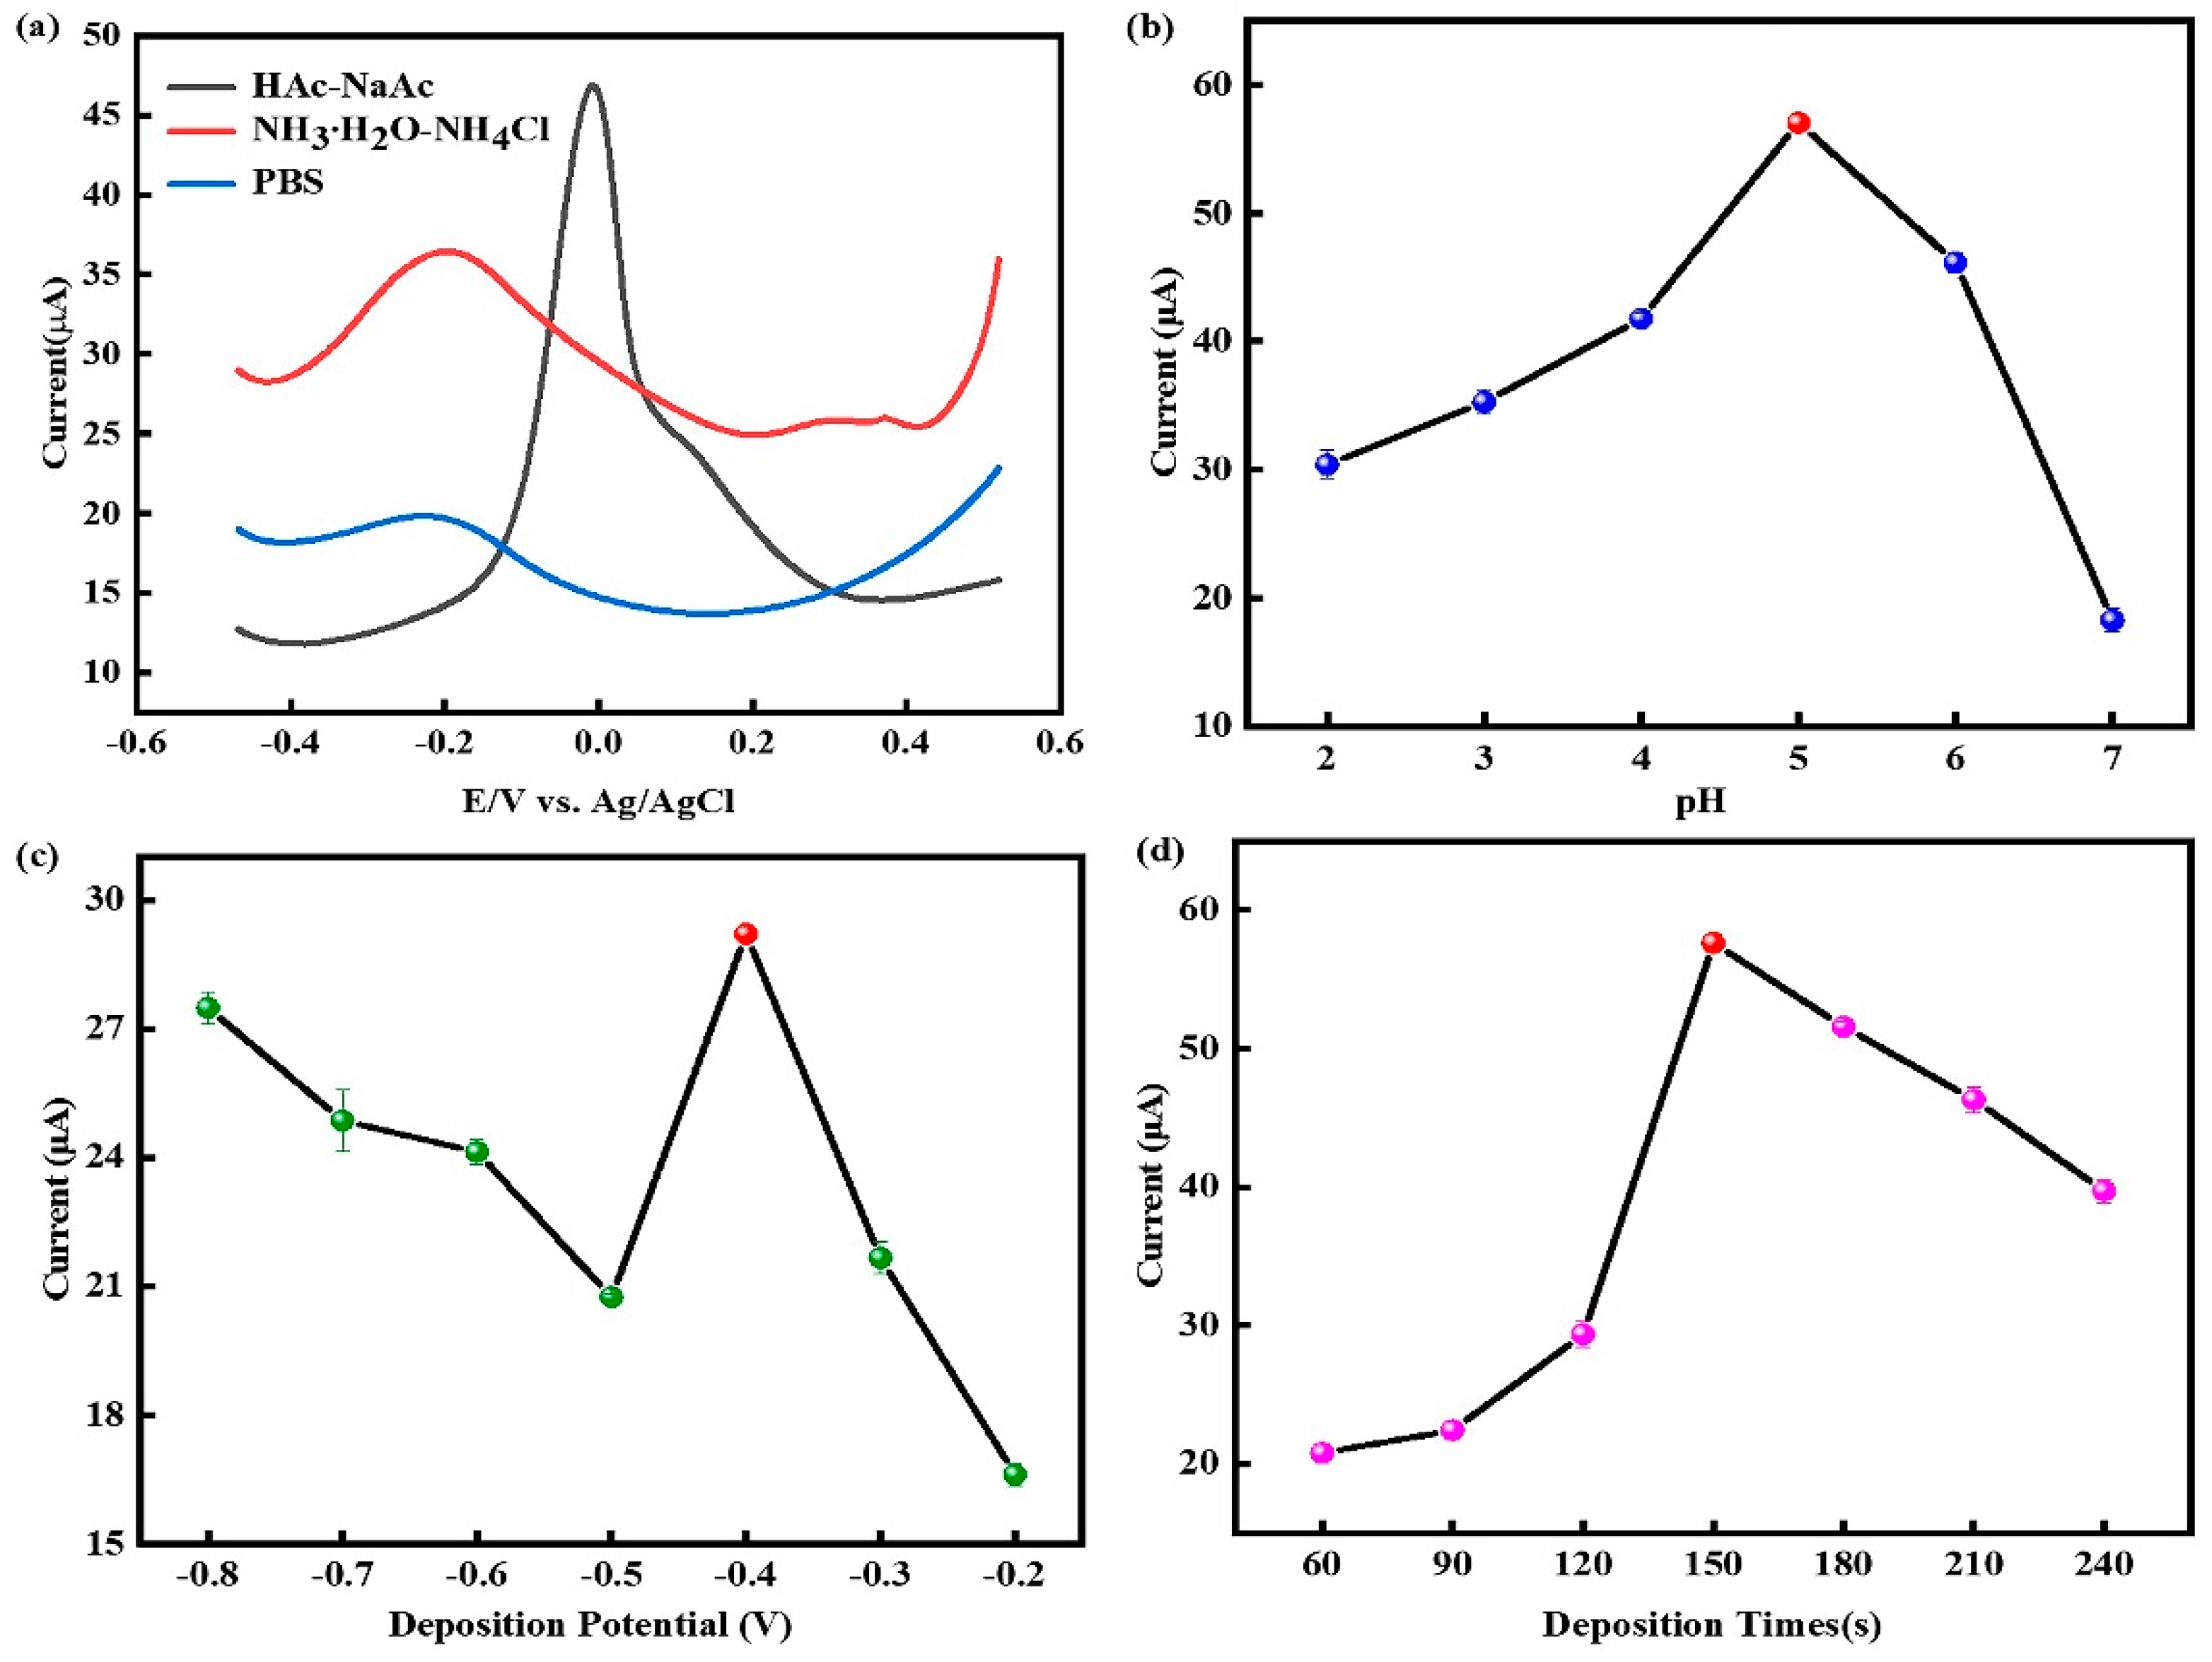
3.3. Optimization of test conditions
3.4. Detection of Cu2+ by SWSV
3.5. Effect of scan rate
3.6. Effect of Co2+ on the detection of Cu2+
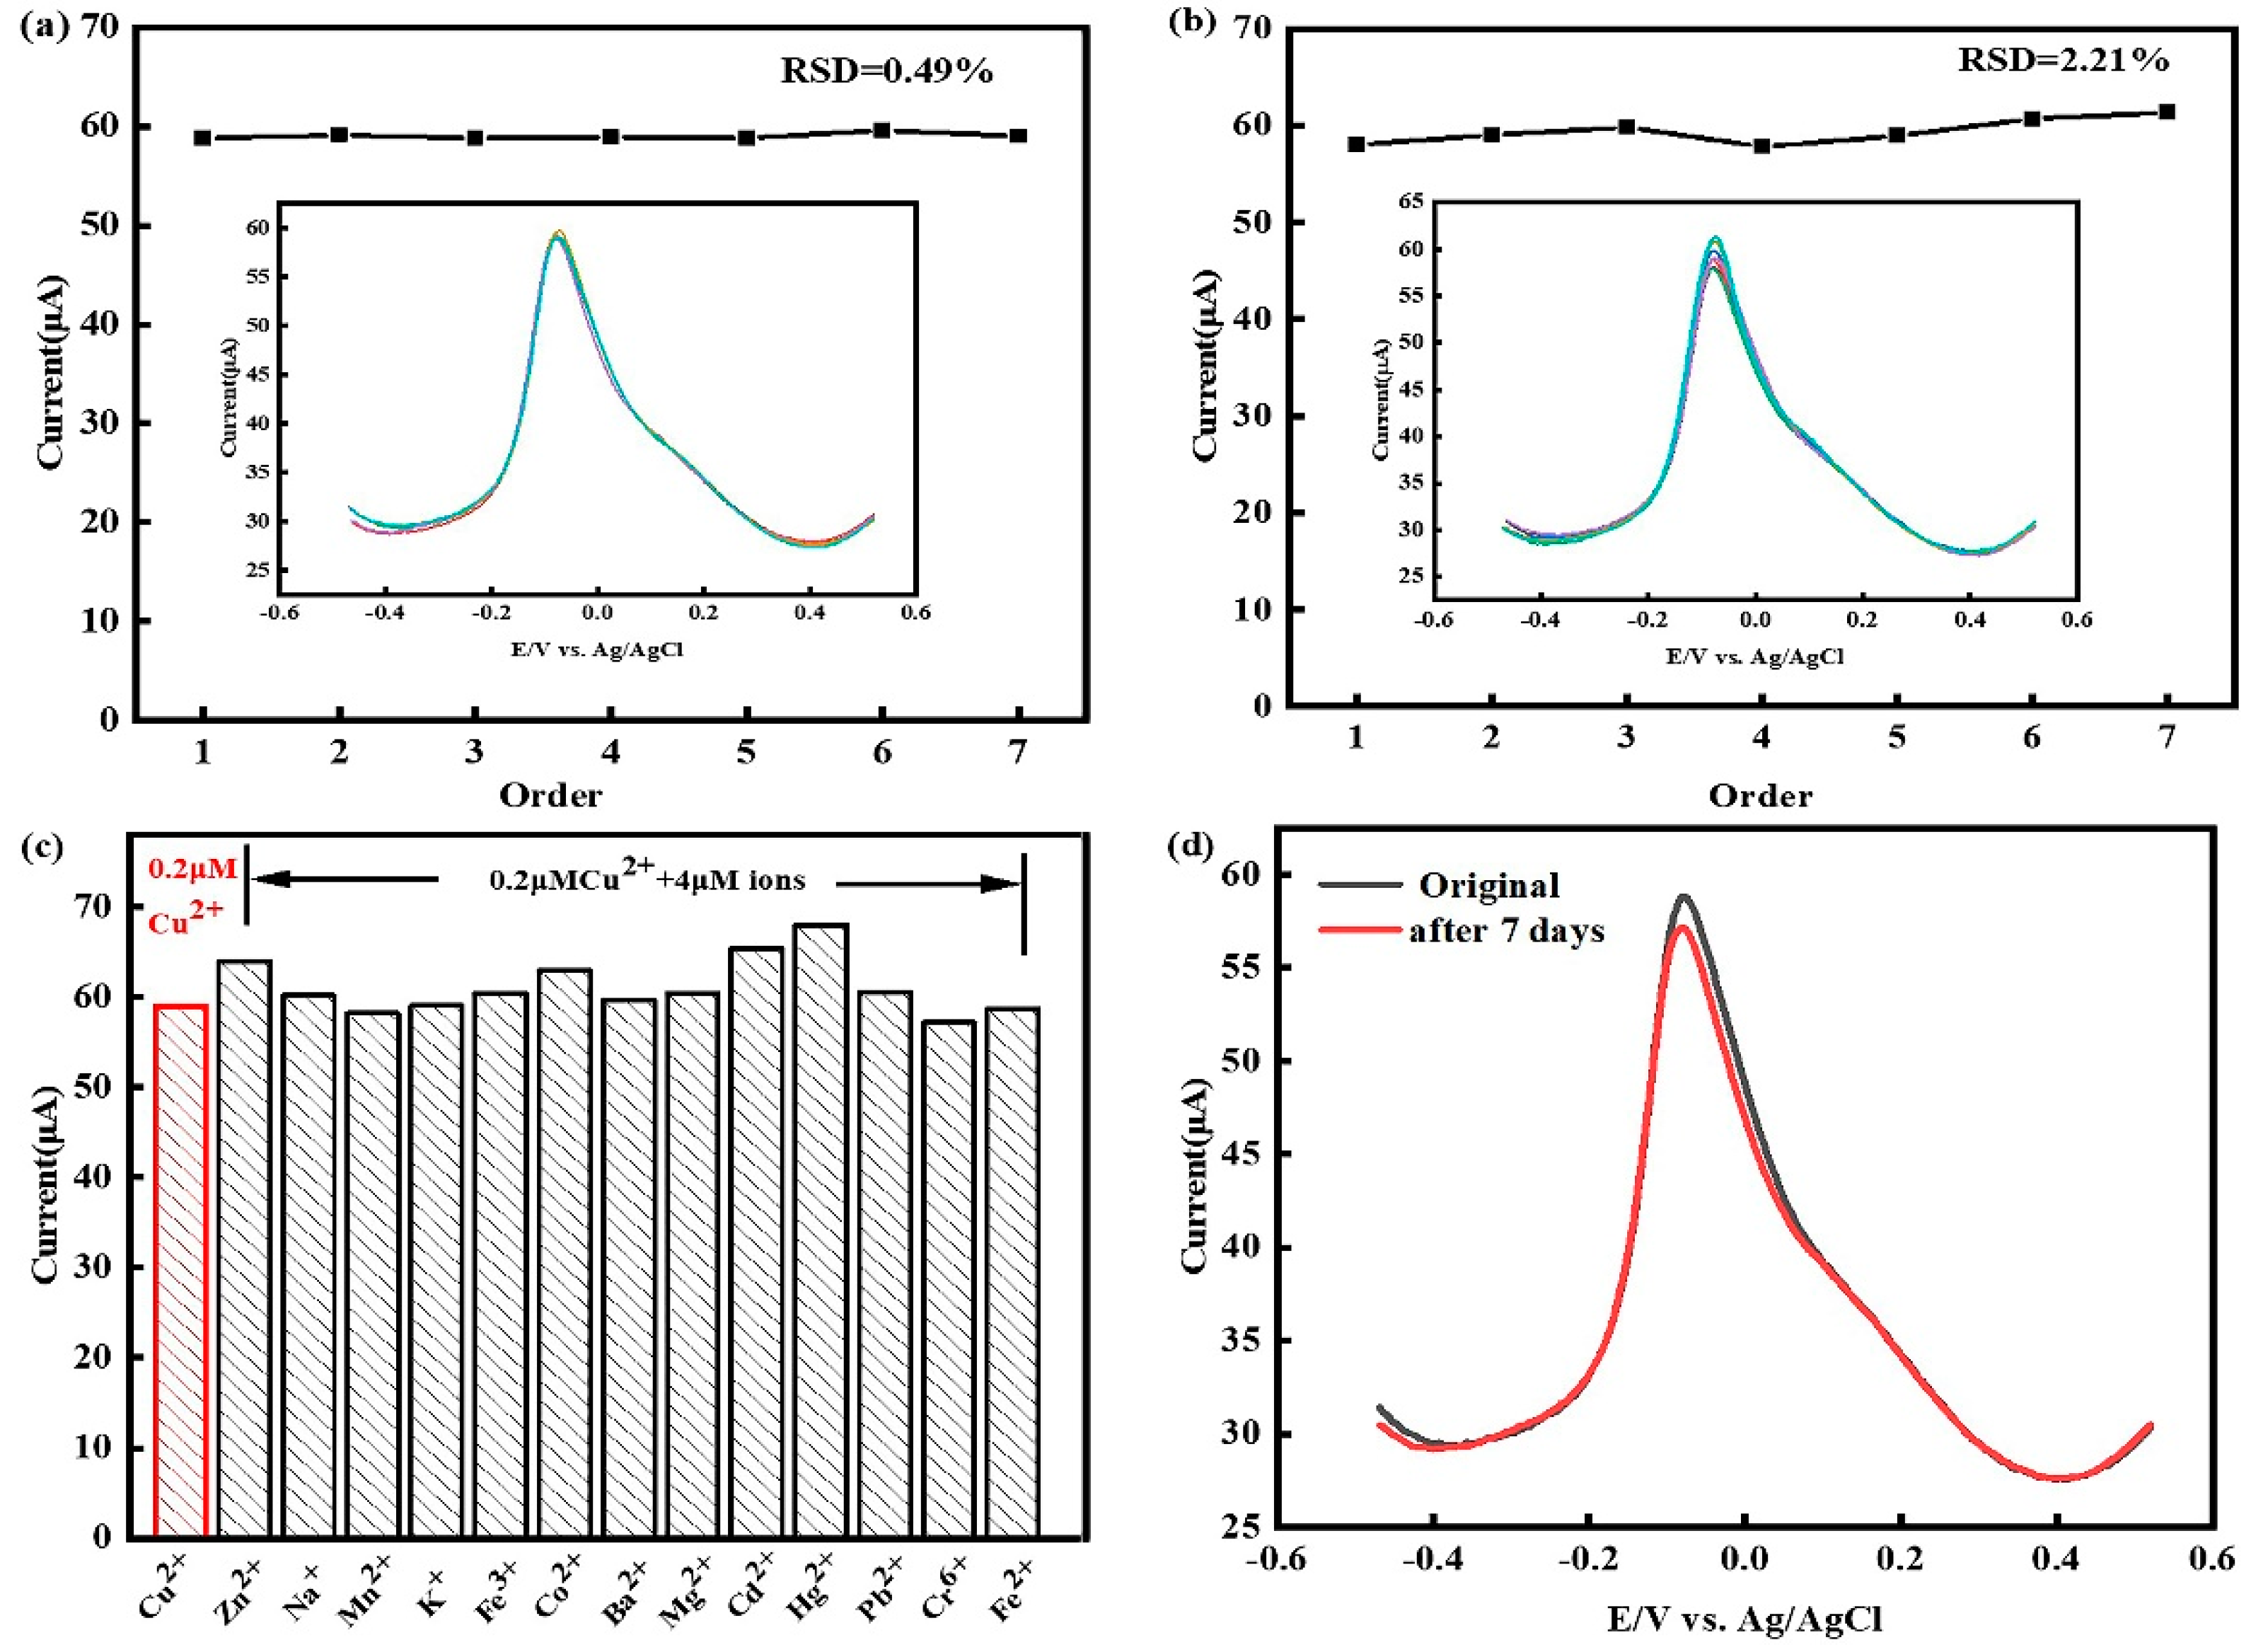
3.7. Research on the repeatability, reproducibility, stability and anti-interference ability of the sensor
3.8. Testing of real water samples
4. Conclusion
Acknowledgments
References
- Lvova, L. Chemical sensors for heavy metals/toxin detection. Chemosensors 2020, 8, 14. [Google Scholar] [CrossRef]
- Zhu, S.; Chen, B.; He, M.; Huang, T.; Hu, B. Speciation of mercury in water and fish samples by HPLC-ICP-MS after magnetic solid phase extraction. Talanta. 2017, 171, 213–219. [Google Scholar] [CrossRef]
- Guo, Y.; Liu, C.; Ye, R. Advances on water quality detection by uv-vis spectroscopy. Appl. Sci. 2020, 10, 6874. [Google Scholar] [CrossRef]
- Chen, S.; Li, Y.; Li, P.; Xiao, X.; Jiang, M.; Li, S.; Zhou, W.; Yang, M.; Huang, X.; Liu, W. Electrochemical spectral methods for trace detection of heavy metals: A review. Trac. Trend. Anal. Chem. 2018, 106, 139–150. [Google Scholar] [CrossRef]
- Ding, Q.; Li, C.; Wang, H.; Xu, C.; Kuang, H. Electrochemical detection of heavy metal ions in water. Chem. Commun. 2021, 57, 7215–7231. [Google Scholar] [CrossRef] [PubMed]
- Chen, Y.; Bai, X.; Ye, Z. Recent progress in heavy metal ion decontamination based on metal–organic frameworks. Nanomaterials 2020, 10, 1–23. [Google Scholar] [CrossRef] [PubMed]
- Zhu, S.; Yang, Y.; Chen, K.; Su, Z.; Wang, J.; Li, S.; Song, N.; Luo, S.; Xie, A. Novel cubic gravel-like EDAPbCl4@ZIF-67 as electrochemical sensor for the detection of protocatechuic acid. J. Alloy. Compd. 2022, 903, 163946. [Google Scholar] [CrossRef]
- Wang, G.; Liu, J.; Yue, F.; Shen, Z.; Xu, d.; Fang, H.; Chen, W.; Wang, Z.; Li, P.; Guo, Y.; Snu, X. Dual enzyme electrochemiluminescence sensor based on in situ synthesis of ZIF-67@AgNPs for the detection of IMP in fresh meat. LWT. 2022, 65, 113658. [Google Scholar] [CrossRef]
- Hou, Y.; Wang, J.; Liu, S.; Sun, Y.; Dai, Y.; Luo, C.; Wang, X. A novel flower-shaped Ag@ZIF-67 chemiluminescence sensor for sensitive detection of CEA. Talanta. 2023, 253, 123938. [Google Scholar] [CrossRef]
- Hussain, Z.; Arif, D.; Sohail, M.; Liaqat, M.A.; Khan, M.A.; Noor, T. A non-enzymatic electrochemical sensor for glucose detection based on Ag@TiO2@ Metal-Organic Framework (ZIF-67) nanocomposite. Front. Chem. 2020, 8, 573510. [Google Scholar]
- Fan, J.; Jiang, L.; Lv, H.; Qin, F.; Fan, Y.; Wang, J.; Ikram, M.; Shi, K. ZIF-67/BiOCl nanocomposites for highly efficient detection of NO2 gas at room temperature. Journali. Mater. Chem. A. 2023, 11, 15370–15379. [Google Scholar] [CrossRef]
- Ma, Z.; Yang, B.; Song, Y.; Song, Y.; Sun, J. Highly conductive ZIF-67 derived La-doped hollow structure for H2S detection. Sens. Actuat. B. Chem. 2023, 379, 133139. [Google Scholar] [CrossRef]
- Han, S.; Sun, R.; Teng, F.; Wang, Y.; Chu, H.; Zong, W.; Chen, Y.; Sun, Z. A highly selective molecularly imprinted electrochemical sensor with anti-interference based on GO/ZIF-67/AgNPs for the detection of p-cresol in a water environment. Anal. Methods 2022, 14, 3079–3086. [Google Scholar] [CrossRef]
- Liu, X.; Yao, Y.; Ying, Y.; Ping, J. Recent advances in nanomaterial-enabled screen-printed electrochemical sensors for heavy metal detection. Trac. Trend. Anal Chem. 115, 187–202. [CrossRef]
- Mandal, S.; Natarajan, S.; Mani, P.; Pankajakshan, A. Post-synthetic modification of metal–organic frameworks toward applications. Adv. Funct. Mater. 2021, 31, 2006291. [Google Scholar] [CrossRef]
- Sawan, S.; Maalouf, R.; Errachid, A.; Jaffrezic, R. Metal and metal oxide nanoparticles in the voltammetric detection of heavy metals: A review. Trac. Trend. Anal. Chem. 2020, 131, 116014. [Google Scholar] [CrossRef]
- Shellaiah, M.; Sun, K.W. Progress in metal-organic frameworks facilitated mercury detection and removal. Chemosensors 2021, 9, 101. [Google Scholar] [CrossRef]
- Baghayeri, M.; Amiri, A.; Karimabadi, F.; Di Masi, S.; Maleki, B.; Adibian, F.; Pourali, A.; Malitesta, C. Magnetic MWCNTs-dendrimer: A potential modifier for electrochemical evaluation of As (III) ions in real water samples. J. Electroanal. Chem. 2021, 888, 115059. [Google Scholar] [CrossRef]
- Filik, H.; Avan, A.A. Neutral red interlinked gold nanoparticles/multiwalled carbon nanotubes modified electrochemical sensor for simultaneous speciation and detection of chromium (VI) and vanadium (V) in water samples. Microchem. J. 2020, 158, 105242. [Google Scholar] [CrossRef]
- Nguyen, L. D.; Huynh, T. M.; Nguyen, T. S. V.; Le, D. N.; Baptist, R.; Doan, T. C. D.; Dang C., M. Nafion/platinum modified electrode-on-chip for the electrochemical detection of trace iron in natural water. J Electroanal Chem 2020, 873, 114396. [Google Scholar] [CrossRef]
- Alexandratos, S. D. From ion exchange resins to polymer-supported reagents: an evolution of critical variables. J. Chem. Technol. Biot. 2018, 93, 20–27. [Google Scholar] [CrossRef]
- Yu, L.; Zhang, Q.; Yang, B.; Xu, Q.; Xu, Q.; Hu, X. Electrochemical sensor construction based on Nafion/calcium lignosulphonate functionalized porous graphene nanocomposite and its application for simultaneous detection of trace Pb2+ and Cd2+. Sens. Actuat. B. Chem. 2018, 259, 540–551. [Google Scholar] [CrossRef]
- Şahin, F.; Topuz, B.; Kalıpçılar, H. Synthesis of ZIF-7, ZIF-8, ZIF-67 and ZIF-L from recycled mother liquors. Micropor. Mesopor. Mat. 2018, 261, 259–267. [Google Scholar] [CrossRef]
- Sezer, N.; Koç, M. Oxidative acid treatment of carbon nanotubes. Surf. Interfaces. 2019, 14, 1–8. [Google Scholar] [CrossRef]
- Li, Z.; Guo, Z.; Zhang, T.; Li, Q.; Chen, J.; Ji, W.; Liu, C.; Wei, Y. Fabrication of in situ ZIF-67 grown on alginate hydrogels and its application for enhancing Cu (II) adsorption from aqueous solutions. Colloid. Surface. B. 2021, 207, 112036. [Google Scholar] [CrossRef]
- Yu, H.; Kang, J.; Huang, L.; Wang, J.; Wang, X.; Zhao, X.; Du, C. Co/Zn-metal organic frameworks derived functional matrix for highly active amorphous Se stabilization and advanced lithium storage. Rare Metals. 2023, 42, 76–84. [Google Scholar] [CrossRef]
- Wang, F.; Zhao, D.; Li, W.; Zhang, H.; Li, B.; Hu, T.; Tan, L. Rod-shaped units based cobalt (II) organic framework as an efficient electrochemical sensor for uric acid detection in serum. Microchem. J. 2023, 185, 108154. [Google Scholar] [CrossRef]
- Yang, B.; Shao, M.; Xu, Y.; Du, Y.; Yang, H.; Bin, D.; Lu, H. Core-Shell ZIF-8@ZIF-67-Derived Cobalt Nanoparticles In Situ Grown on N-doped Carbon Nanotube Polyhedra for Ultrasensitive Electrochemical Detection of Chloramphenicol. ChemElectroChem 2022, 9, e202200438. [Google Scholar] [CrossRef]
- Wang, S.; Cao, Y.; Liang, C.; Geng, S.; Guo, H.; Liu, Y.; Li, L. Application of ZIF-67 based nitrogen-rich carbon frame with embedded Cu and Co bimetallic particles in QDSSCs. Sol. Energy 2022, 237, 144–152. [Google Scholar]
- Liu, Z.; Ye, D.; Zhu, X.; Wang, S.; Zou, Y.; Lan, L.; Liao, Q. ZIF-67-derived Co nanoparticles embedded in N-doped porous carbon composite interconnected by MWCNTs as highly efficient ORR electrocatalysts for a flexible direct formate fuel cell. Chem. Eng. J. 2022, 432, 134192. [Google Scholar] [CrossRef]
- Nataraj, N.; Chen, T.; Chen, S.; Tseng, T. W.; Bian, Y.; Sun, T.; Jiang, J. Metal-organic framework (ZIF-67) interwoven multiwalled carbon nanotubes as a sensing platform for rapid administration of serotonin. J. Taiwan. Inst. Chem. E. 2021, 129, 299–310. [Google Scholar] [CrossRef]
- Shen, H.; He, J.; Shao, X.; Su, Q.; Zhao, D.; Feng, S. Effect of partial substitution of Zn2+ with Co2+ on catalytic methane combustion performance of Zn1-xCoxGa2O4 (X= 0, 0.1, 0.3) microspheres. Solid. State. Sci. 2021, 118, 106678. [Google Scholar] [CrossRef]
- Yu, Y.; You, S.; Du, J.; Xing, Z.; Dai, Y.; Chen, H.; Zou, J. ZIF-67-derived CoO (tetrahedral Co2+)@ Nitrogen-doped porous carbon protected by oxygen vacancies-enriched SnO2 as highly active catalyst for oxygen reduction and Pt co-catalyst for methanol oxidation. Appl. Catal. B. Environ. 2019, 259, 118043. [Google Scholar] [CrossRef]
- Lu, Z.; Zhao, W.; Wu, L.; He, J.; Dai, W.; Zhou, C.; Ye, J. Tunable electrochemical of electrosynthesized layer-by-layer multilayer films based on multi-walled carbon nanotubes and metal-organic framework as high-performance electrochemical sensor for simultaneous determination cadmium and lead. Sens. Actuat. B. Chem. 2021, 326, 128957. [Google Scholar] [CrossRef]
- Alimohammady, M.; Jahangiri, M.; Kiani, F.; Tahermansouri, H. Preparation and characterization of functionalized MWCNTs-COOH with 3-amino-5-phenylpyrazole as an adsorbent and optimization study using central composite design. Carbon. Lett. 2019, 29, 1–20. [Google Scholar] [CrossRef]
- Heidarzadeh, T.; Nami, N.; Zareyee, D. Application of (MWCNTs)-COOH/CeO2 hybrid as an efficient catalyst for the synthesis of some nitrogen-containing organic compounds. Inorg. Nano. Met. Chem. 2022, 52, 1173–1182. [Google Scholar] [CrossRef]
- Zhang., Y.; Yu., H.; Liu, T.; Li, C.; Hao, X.; Lu, Q.; Liang, X.; Liu, F.; Liu, F.; Wang, C.; Yang, C.; Zhu, C.; Lu, G. Highly sensitive detection of Pb2+ and Cu2+ based on ZIF-67/MWCNT/Nafion-modified glassy carbon electrode. Anal. Chim. Acta 2020, 1124, 166–175. [Google Scholar] [CrossRef] [PubMed]
- Wen, T.; Wang, L.; Gong, Y. Construction of FeOOH modified CoMxOy (M= Mo, W, V) on nickel foam for highly efficient oxygen evolution reaction. Sustain. Energ. Fuels. 2023, 7, 977–985. [Google Scholar] [CrossRef]
- Liu, Z.; Puumala, E.; Chen, A. Sensitive electrochemical detection of Hg (II) via a FeOOH modified nanoporous gold microelectrode. Sens. Actuat. B. Chem. 2019, 287, 517–525. [Google Scholar] [CrossRef]
- Pushpanjali, P. A.; Manjunatha, J. G. Electroanalysis of sodium alizarin sulfonate at surfactant modified carbon nanotube paste electrode: a cyclic voltammetric study. J. Mater. Environ. Sci. 2019, 10, 939–47. [Google Scholar]
- Laviron, E. General expression of the linear potential sweep voltammogram in the case of diffusionless electrochemical systems. J. Electroanal. Chem. 1979, 101, 19–28. [Google Scholar] [CrossRef]
- Hu, H.; Lu, W.; Liu, X.; Meng, F.; Zhu, J. A high-response electrochemical As (III) sensor using Fe3O4-rGO nanocomposite materials. Chemosensors 2021, 9, 150. [Google Scholar] [CrossRef]


| water sample | Added (μM) | Found (μM) | Recovery (%) | RSD (%) |
| tap water mineral water |
0.3 | 0.51 | 102.0 | 1.40 |
| 0.5 | 0.69 | 98.6 | 1.02 | |
| 0.7 | 0.93 | 103.0 | 2.32 | |
| 0.3 | 0.49 | 98.0 | 1.43 | |
| 0.5 | 0.72 | 102.9 | 1.99 | |
| 0.7 | 0.89 | 99.6 | 0.08 |
Disclaimer/Publisher’s Note: The statements, opinions and data contained in all publications are solely those of the individual author(s) and contributor(s) and not of MDPI and/or the editor(s). MDPI and/or the editor(s) disclaim responsibility for any injury to people or property resulting from any ideas, methods, instructions or products referred to in the content. |
© 2024 by the authors. Licensee MDPI, Basel, Switzerland. This article is an open access article distributed under the terms and conditions of the Creative Commons Attribution (CC BY) license (http://creativecommons.org/licenses/by/4.0/).


