Submitted:
29 December 2023
Posted:
03 January 2024
You are already at the latest version
Abstract
Keywords:
1. Introduction
2. Materials and Methods
2.1. Plant materials and growth conditions
2.2. Treatments
2.3. Morphological properties
2.4. Assessment of fast induction of chlorophyll fluorescence
2.5. Imaging of chlorophyll fluorescence quenching
2.6. Pigments analysis
2.7. Measurement of total anthocyanin content
2.8. Quantitative Analysis of Carbohydrates
2.9. Statistical analysis
3. Results
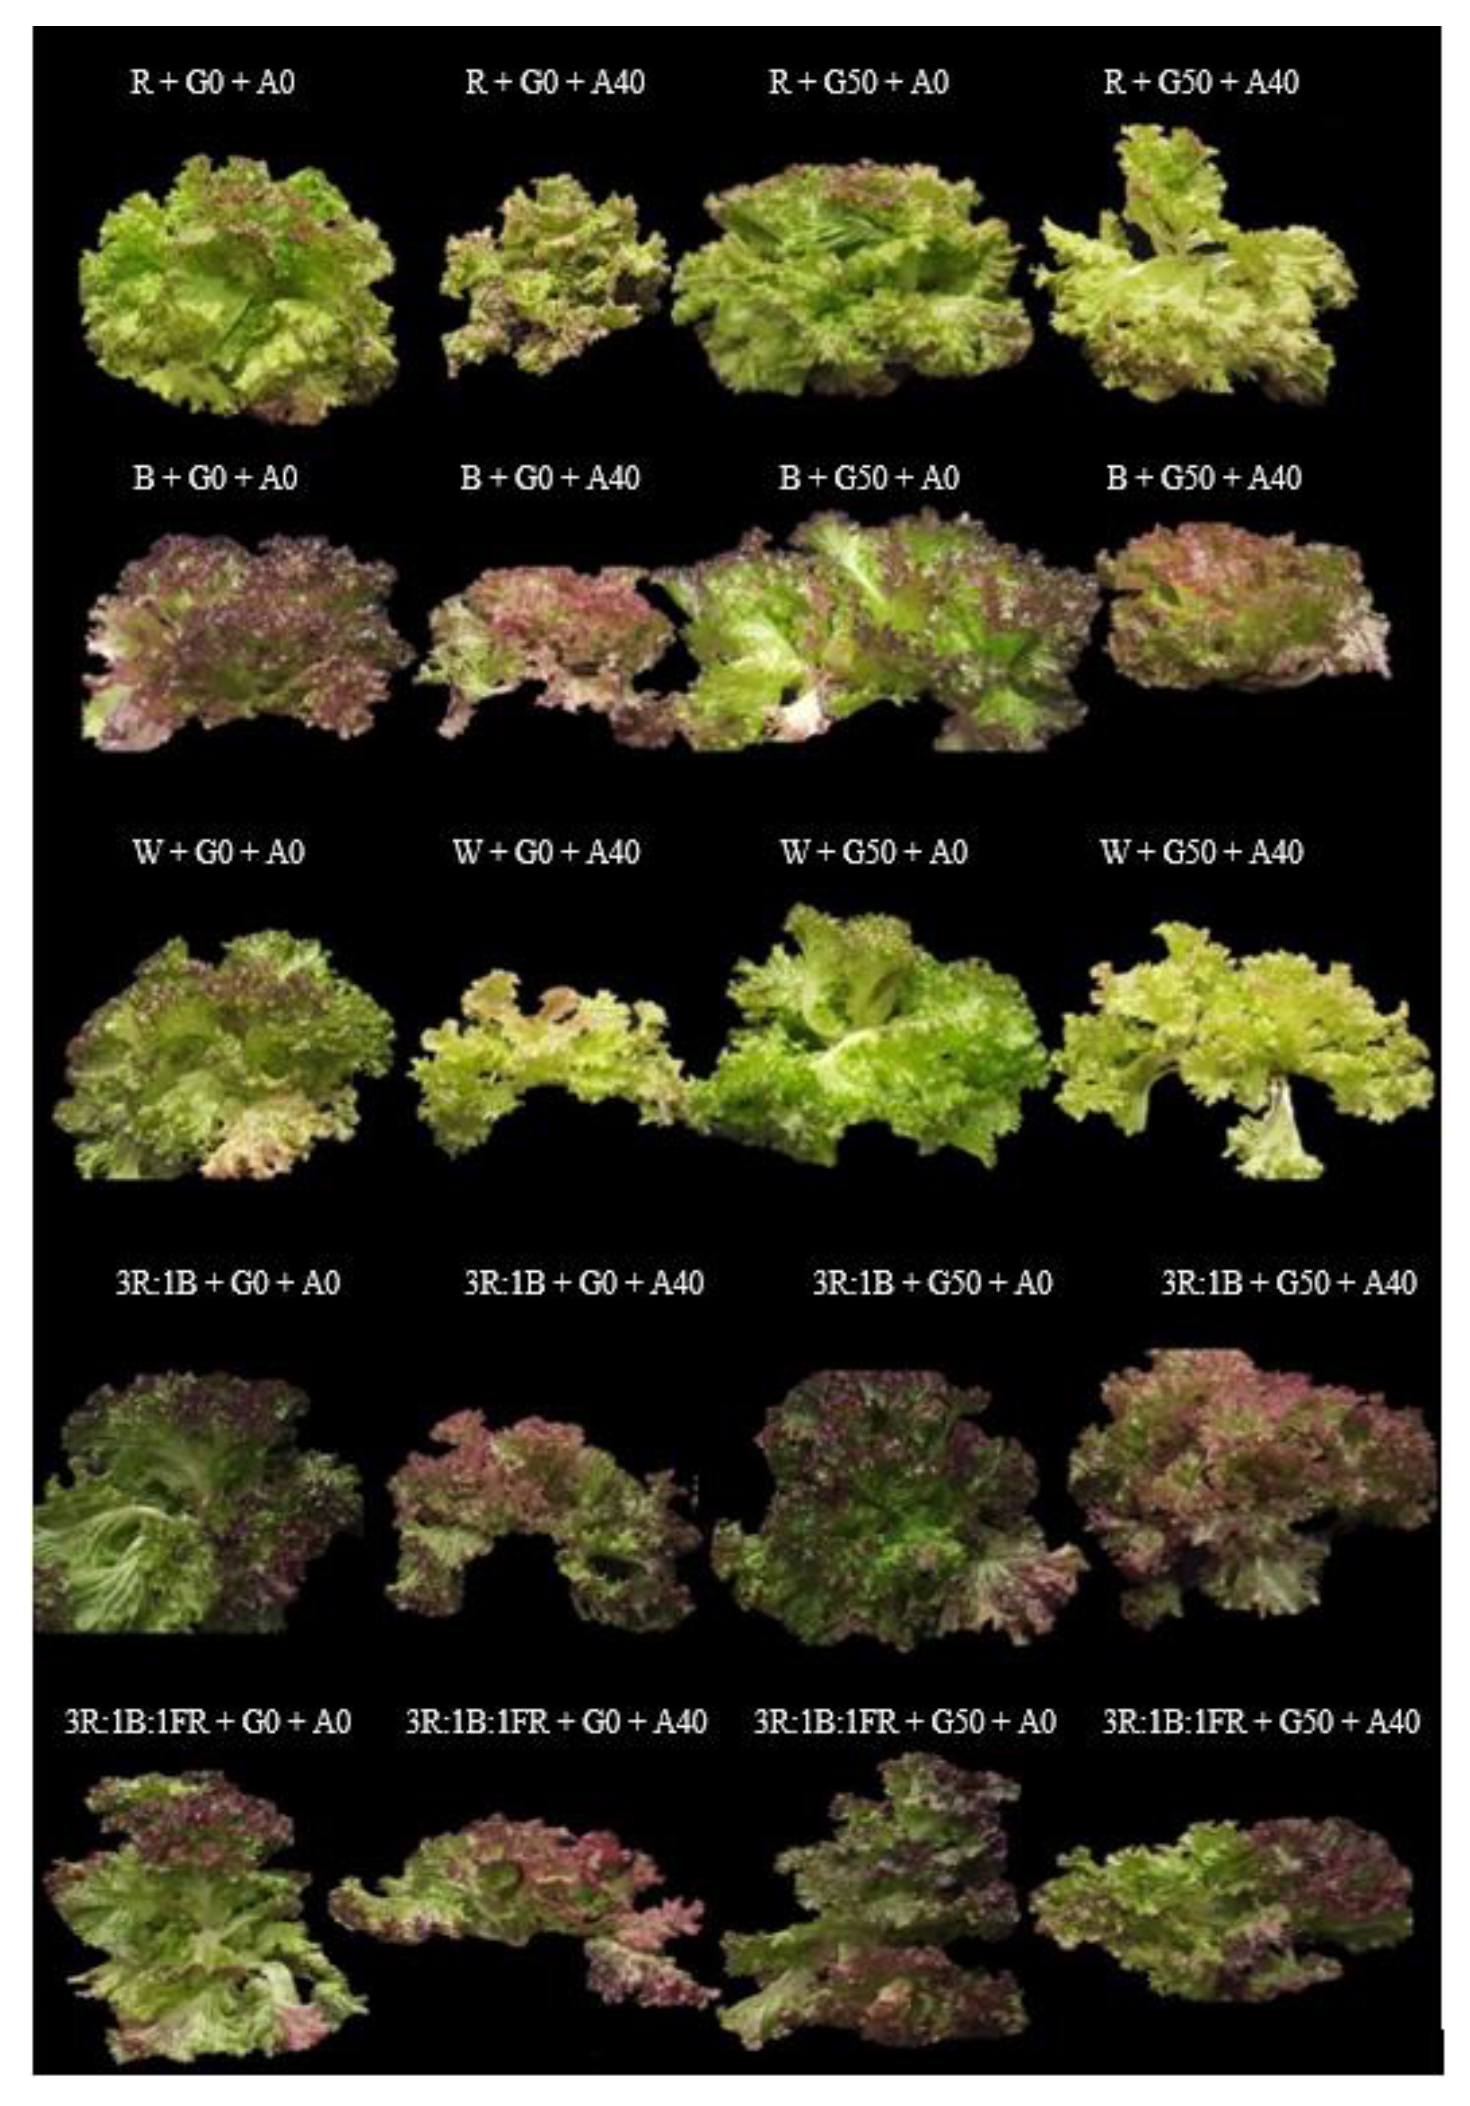
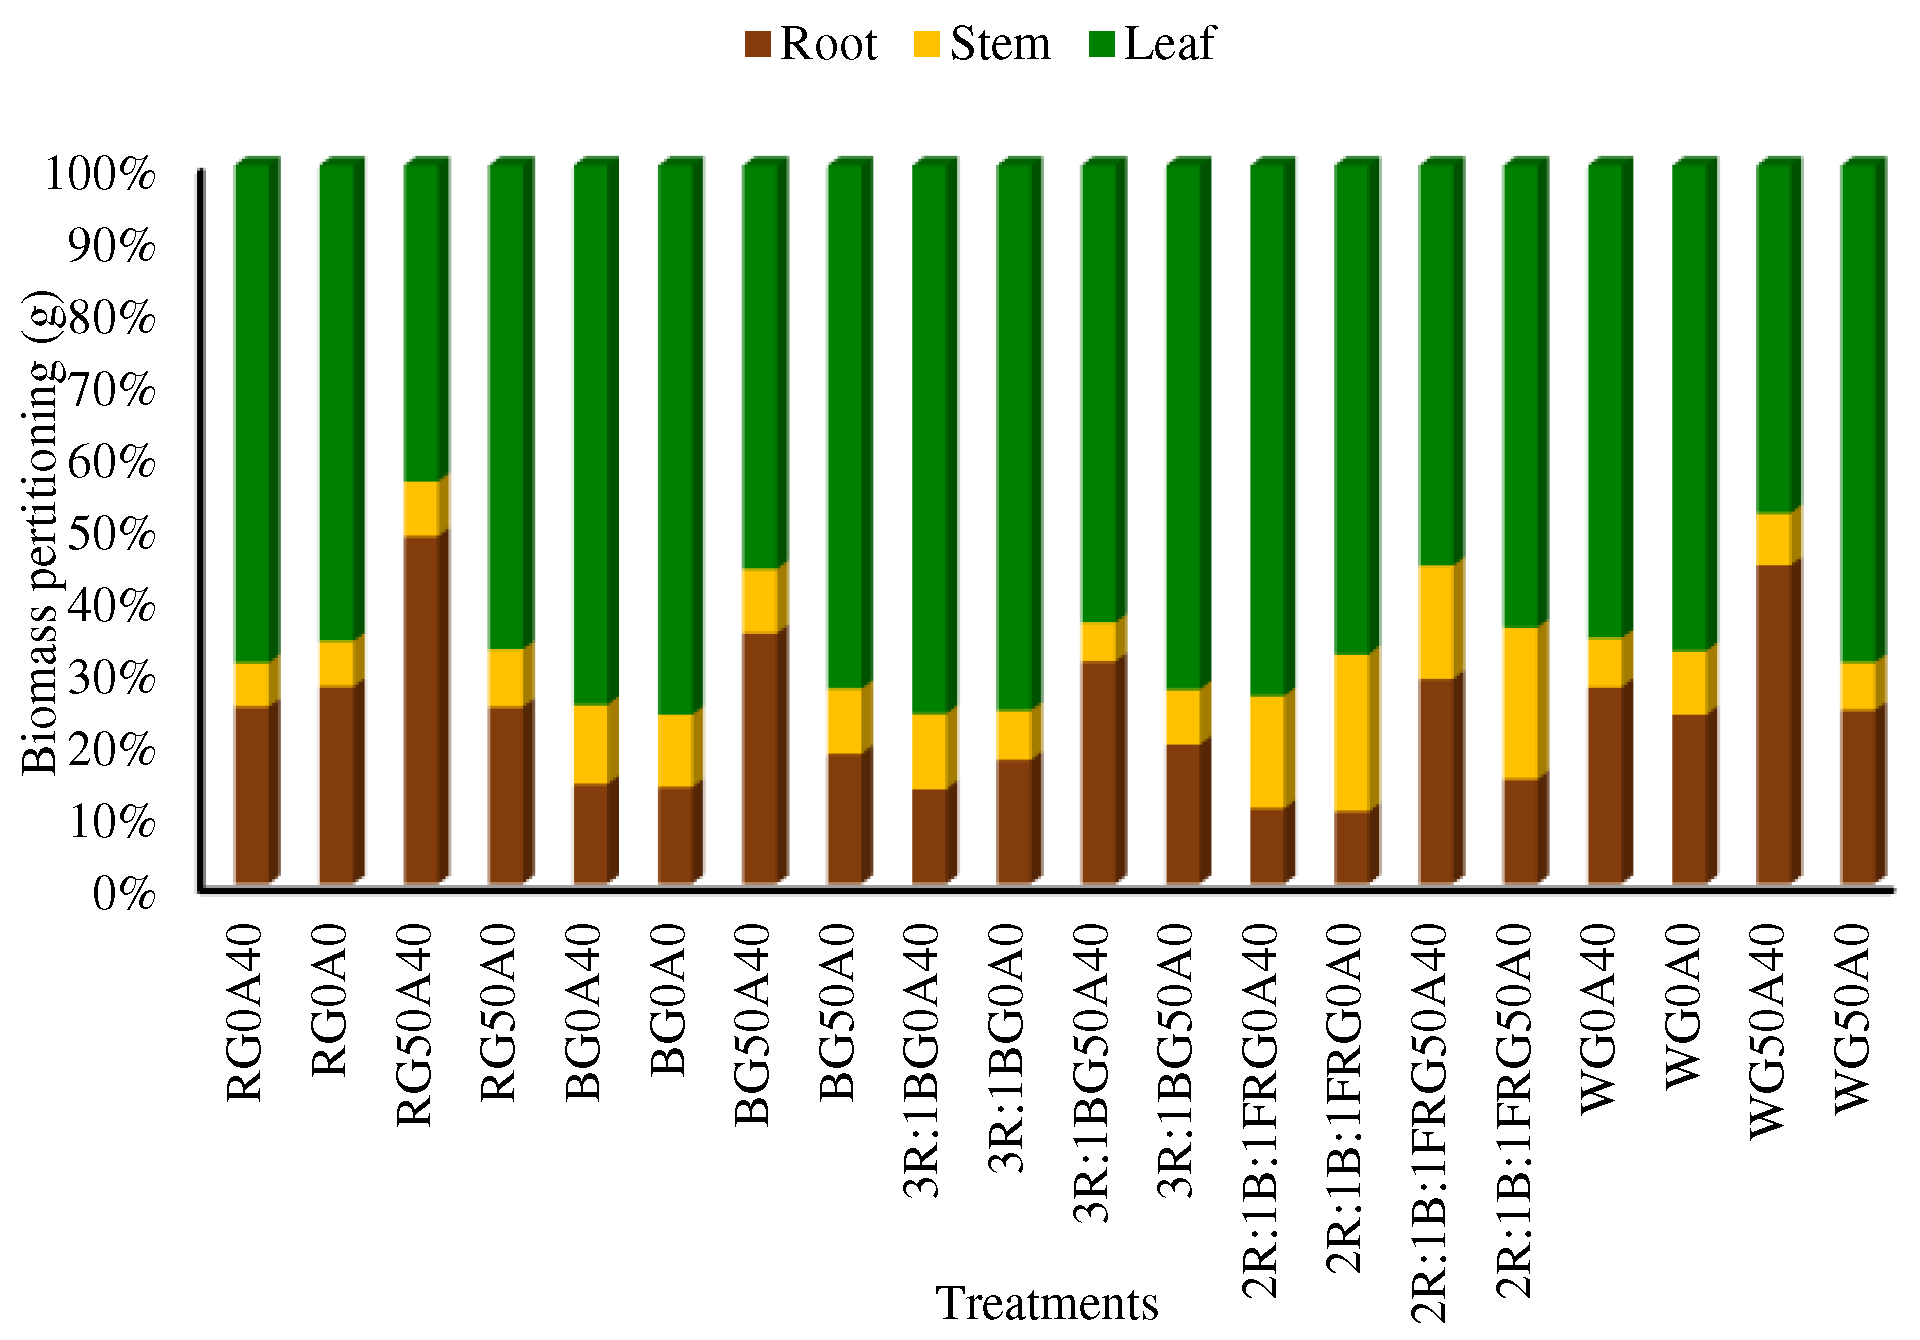
3.1. Morphological characteristics of lettuce plant were affected by light spectra, alkaline stress and GABA feeding
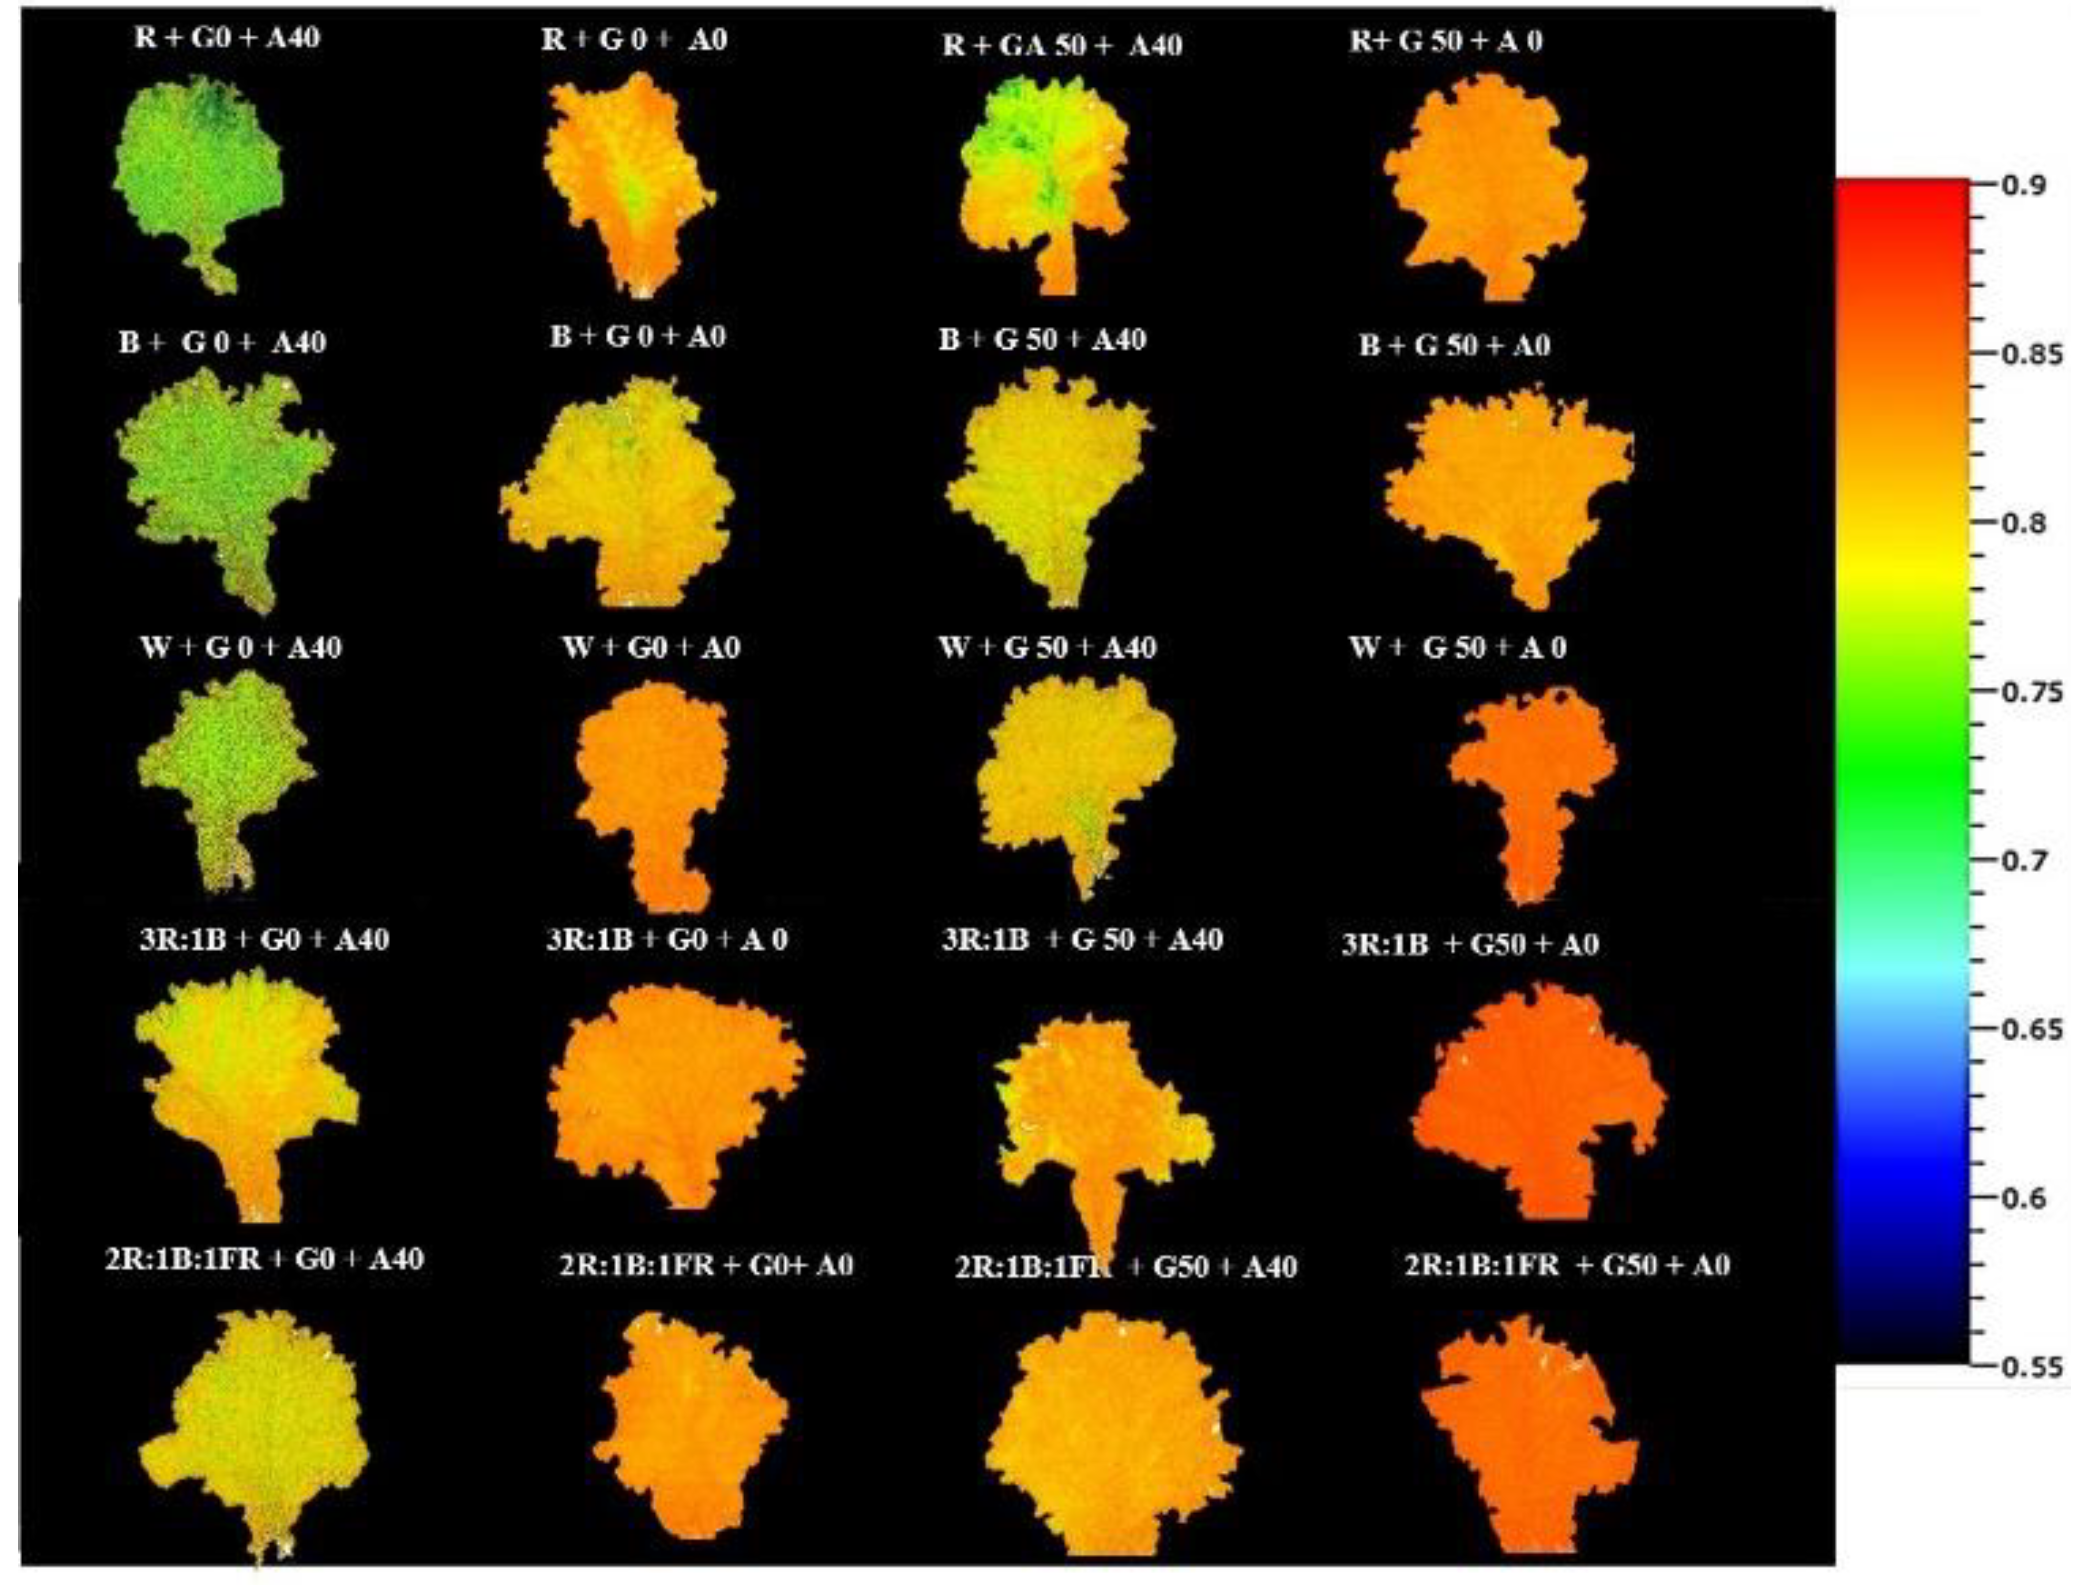
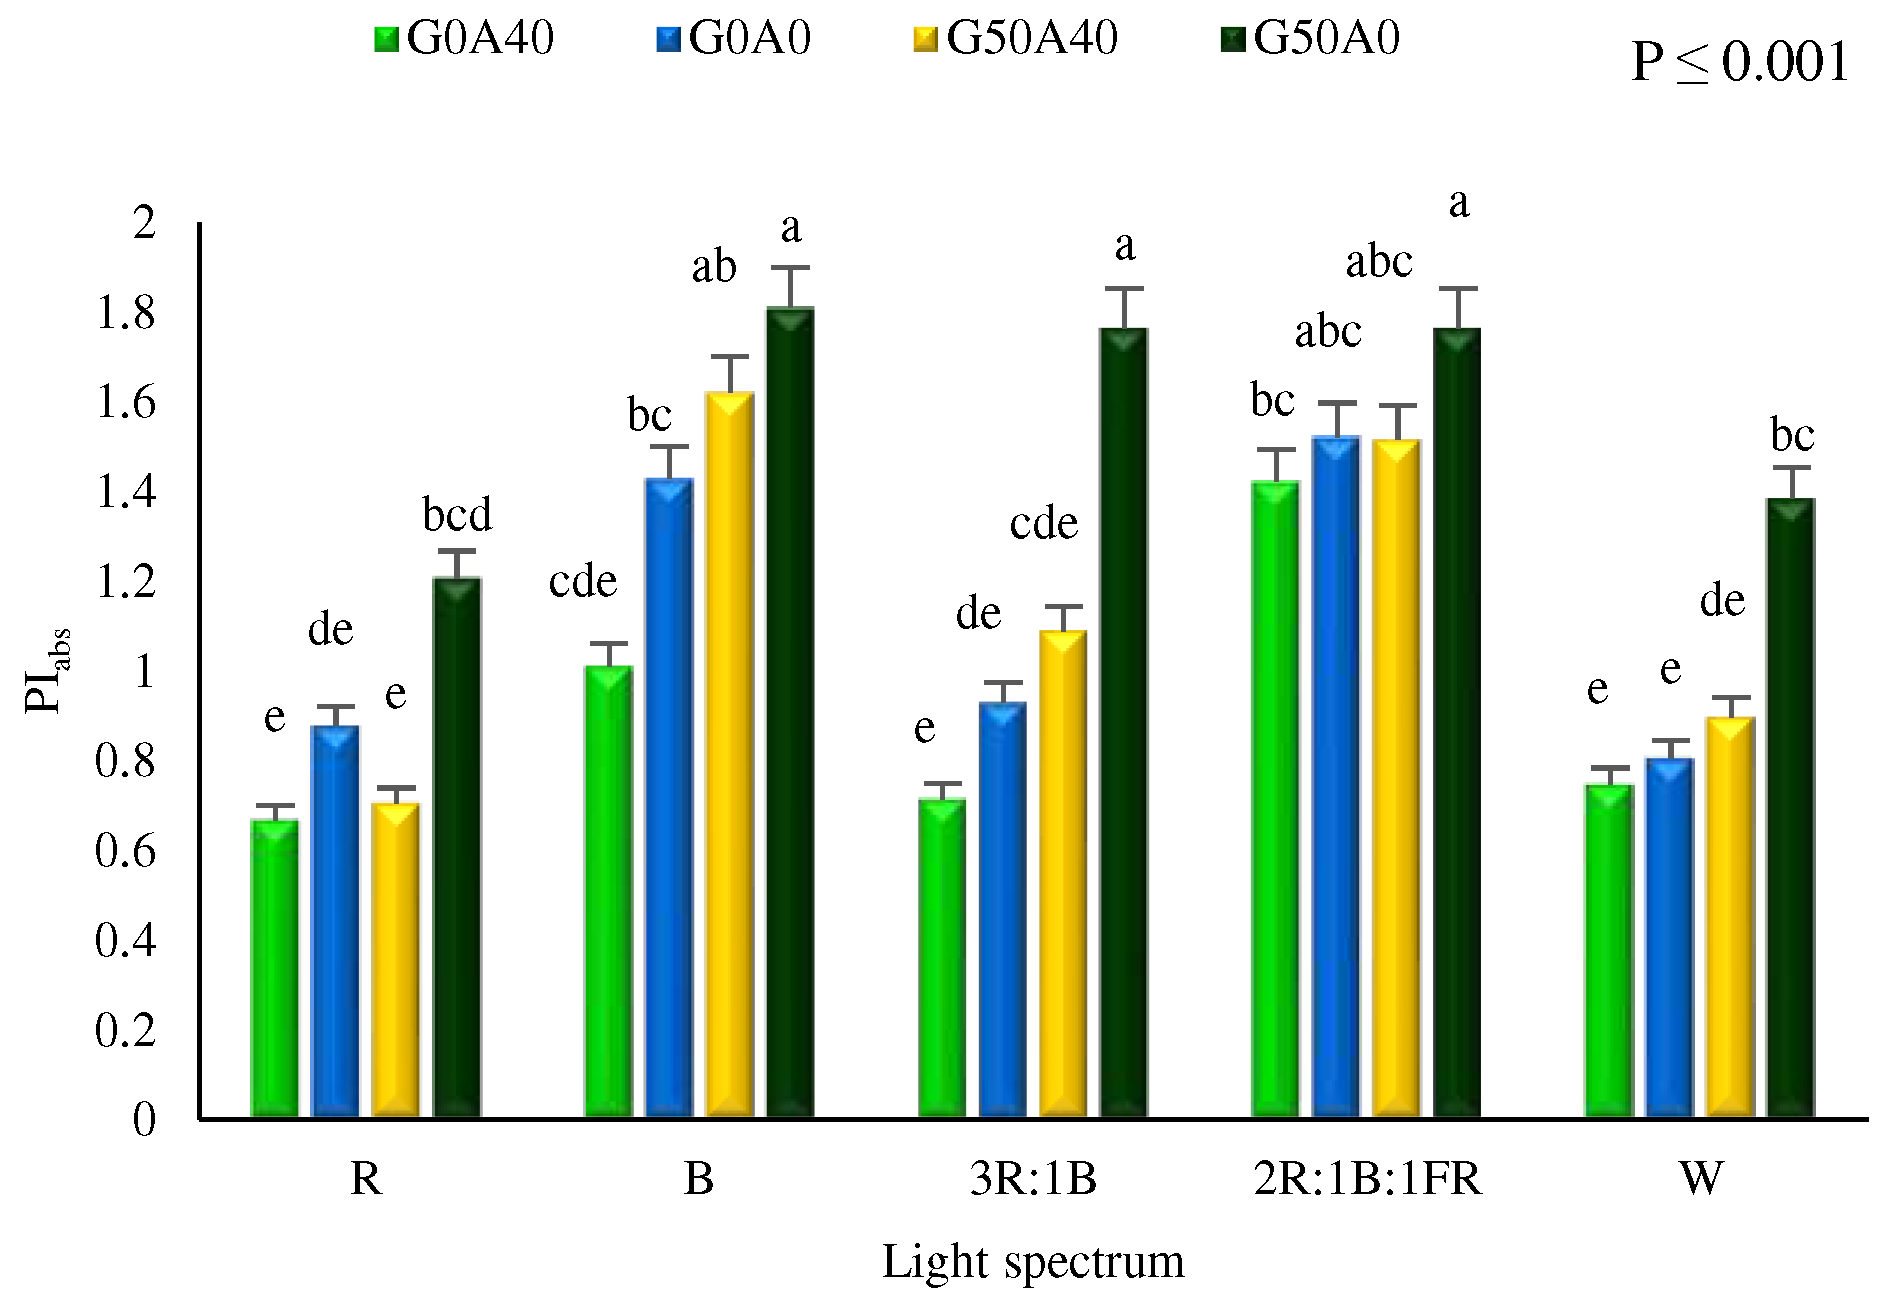
3.2. Photosynthetic performance positively affected by GABA
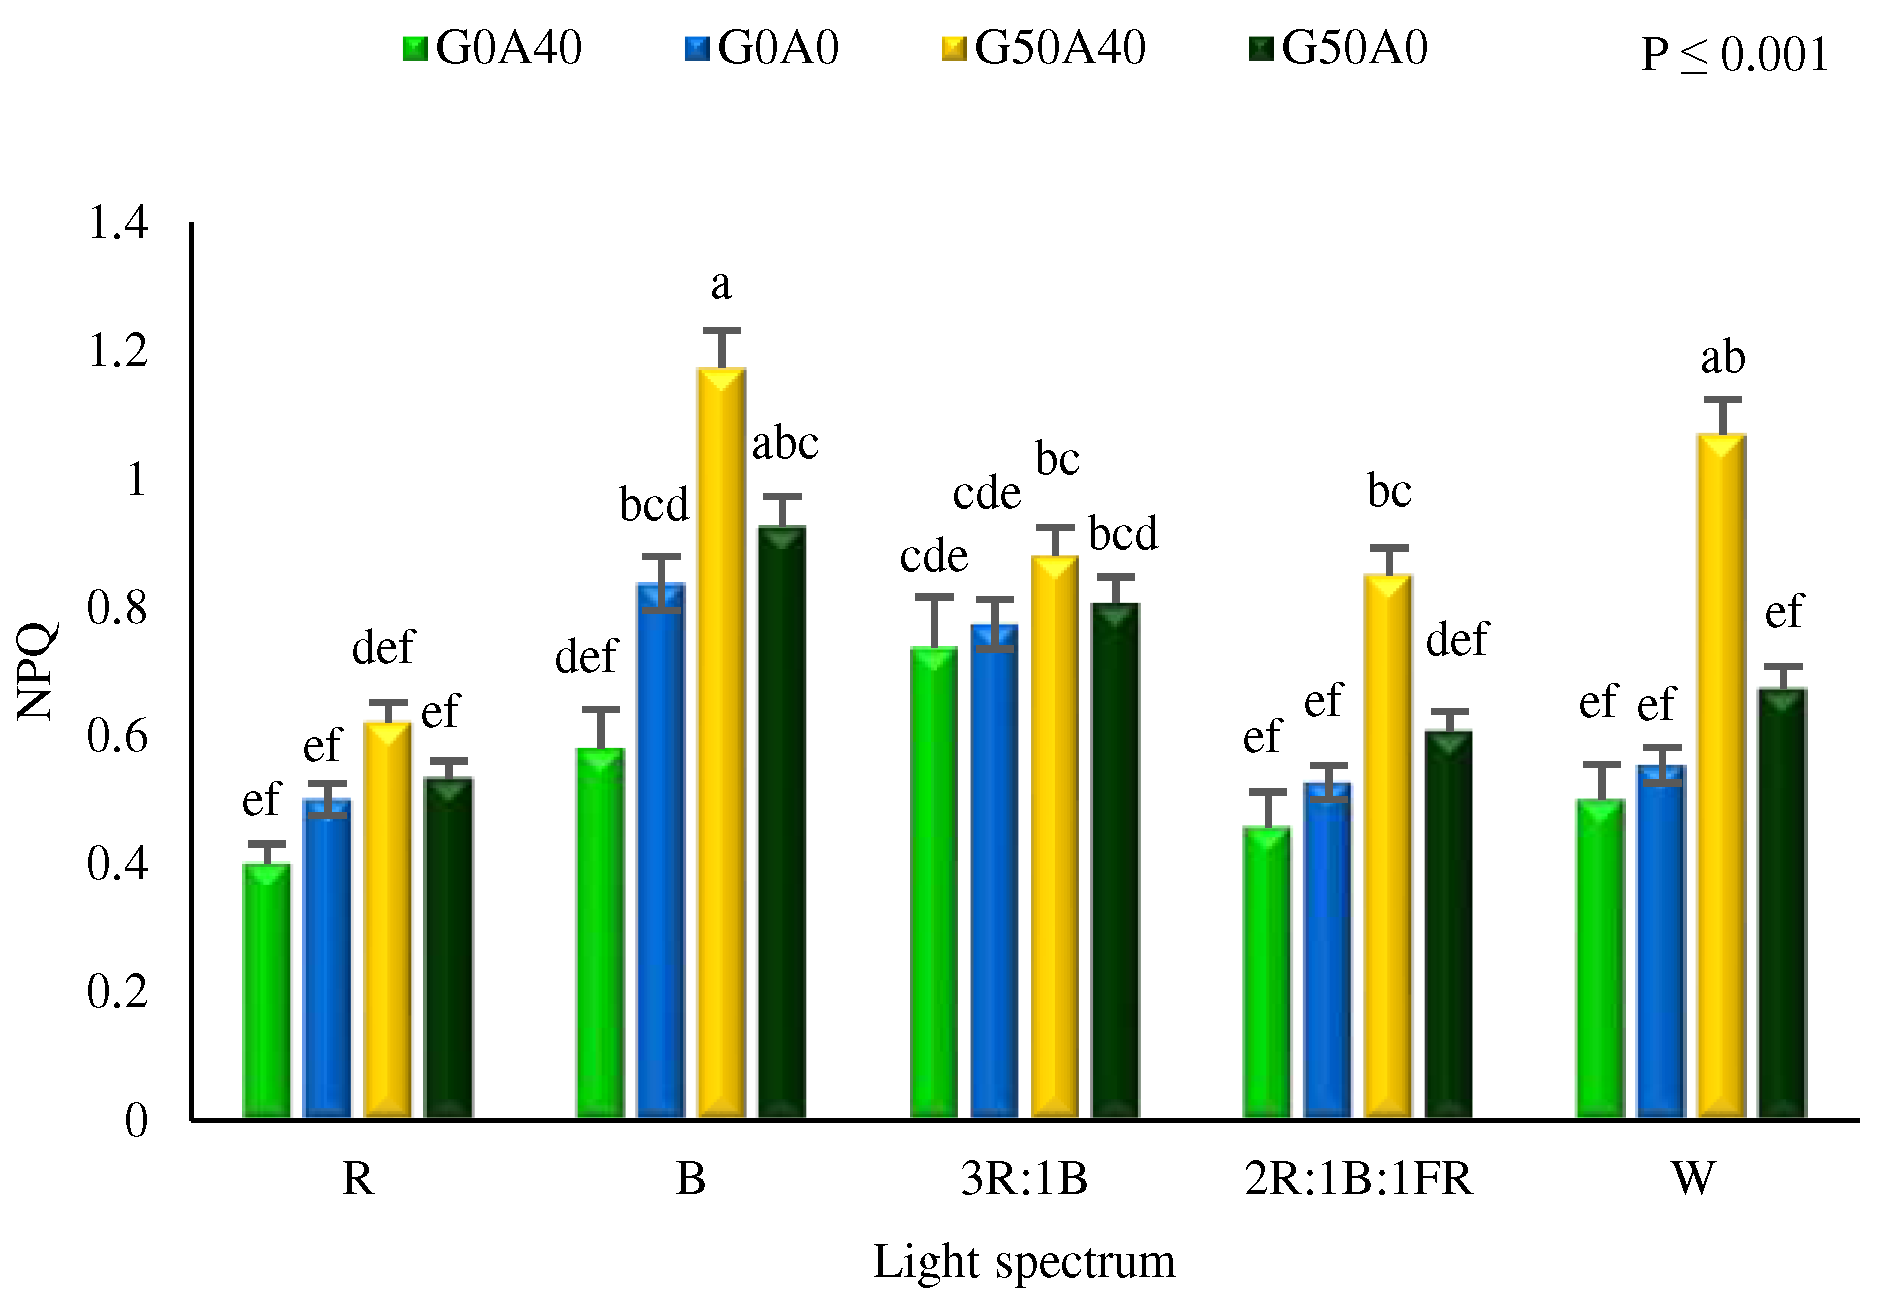
3.3. B light and GABA enhanced NPQ in lettuce leaves
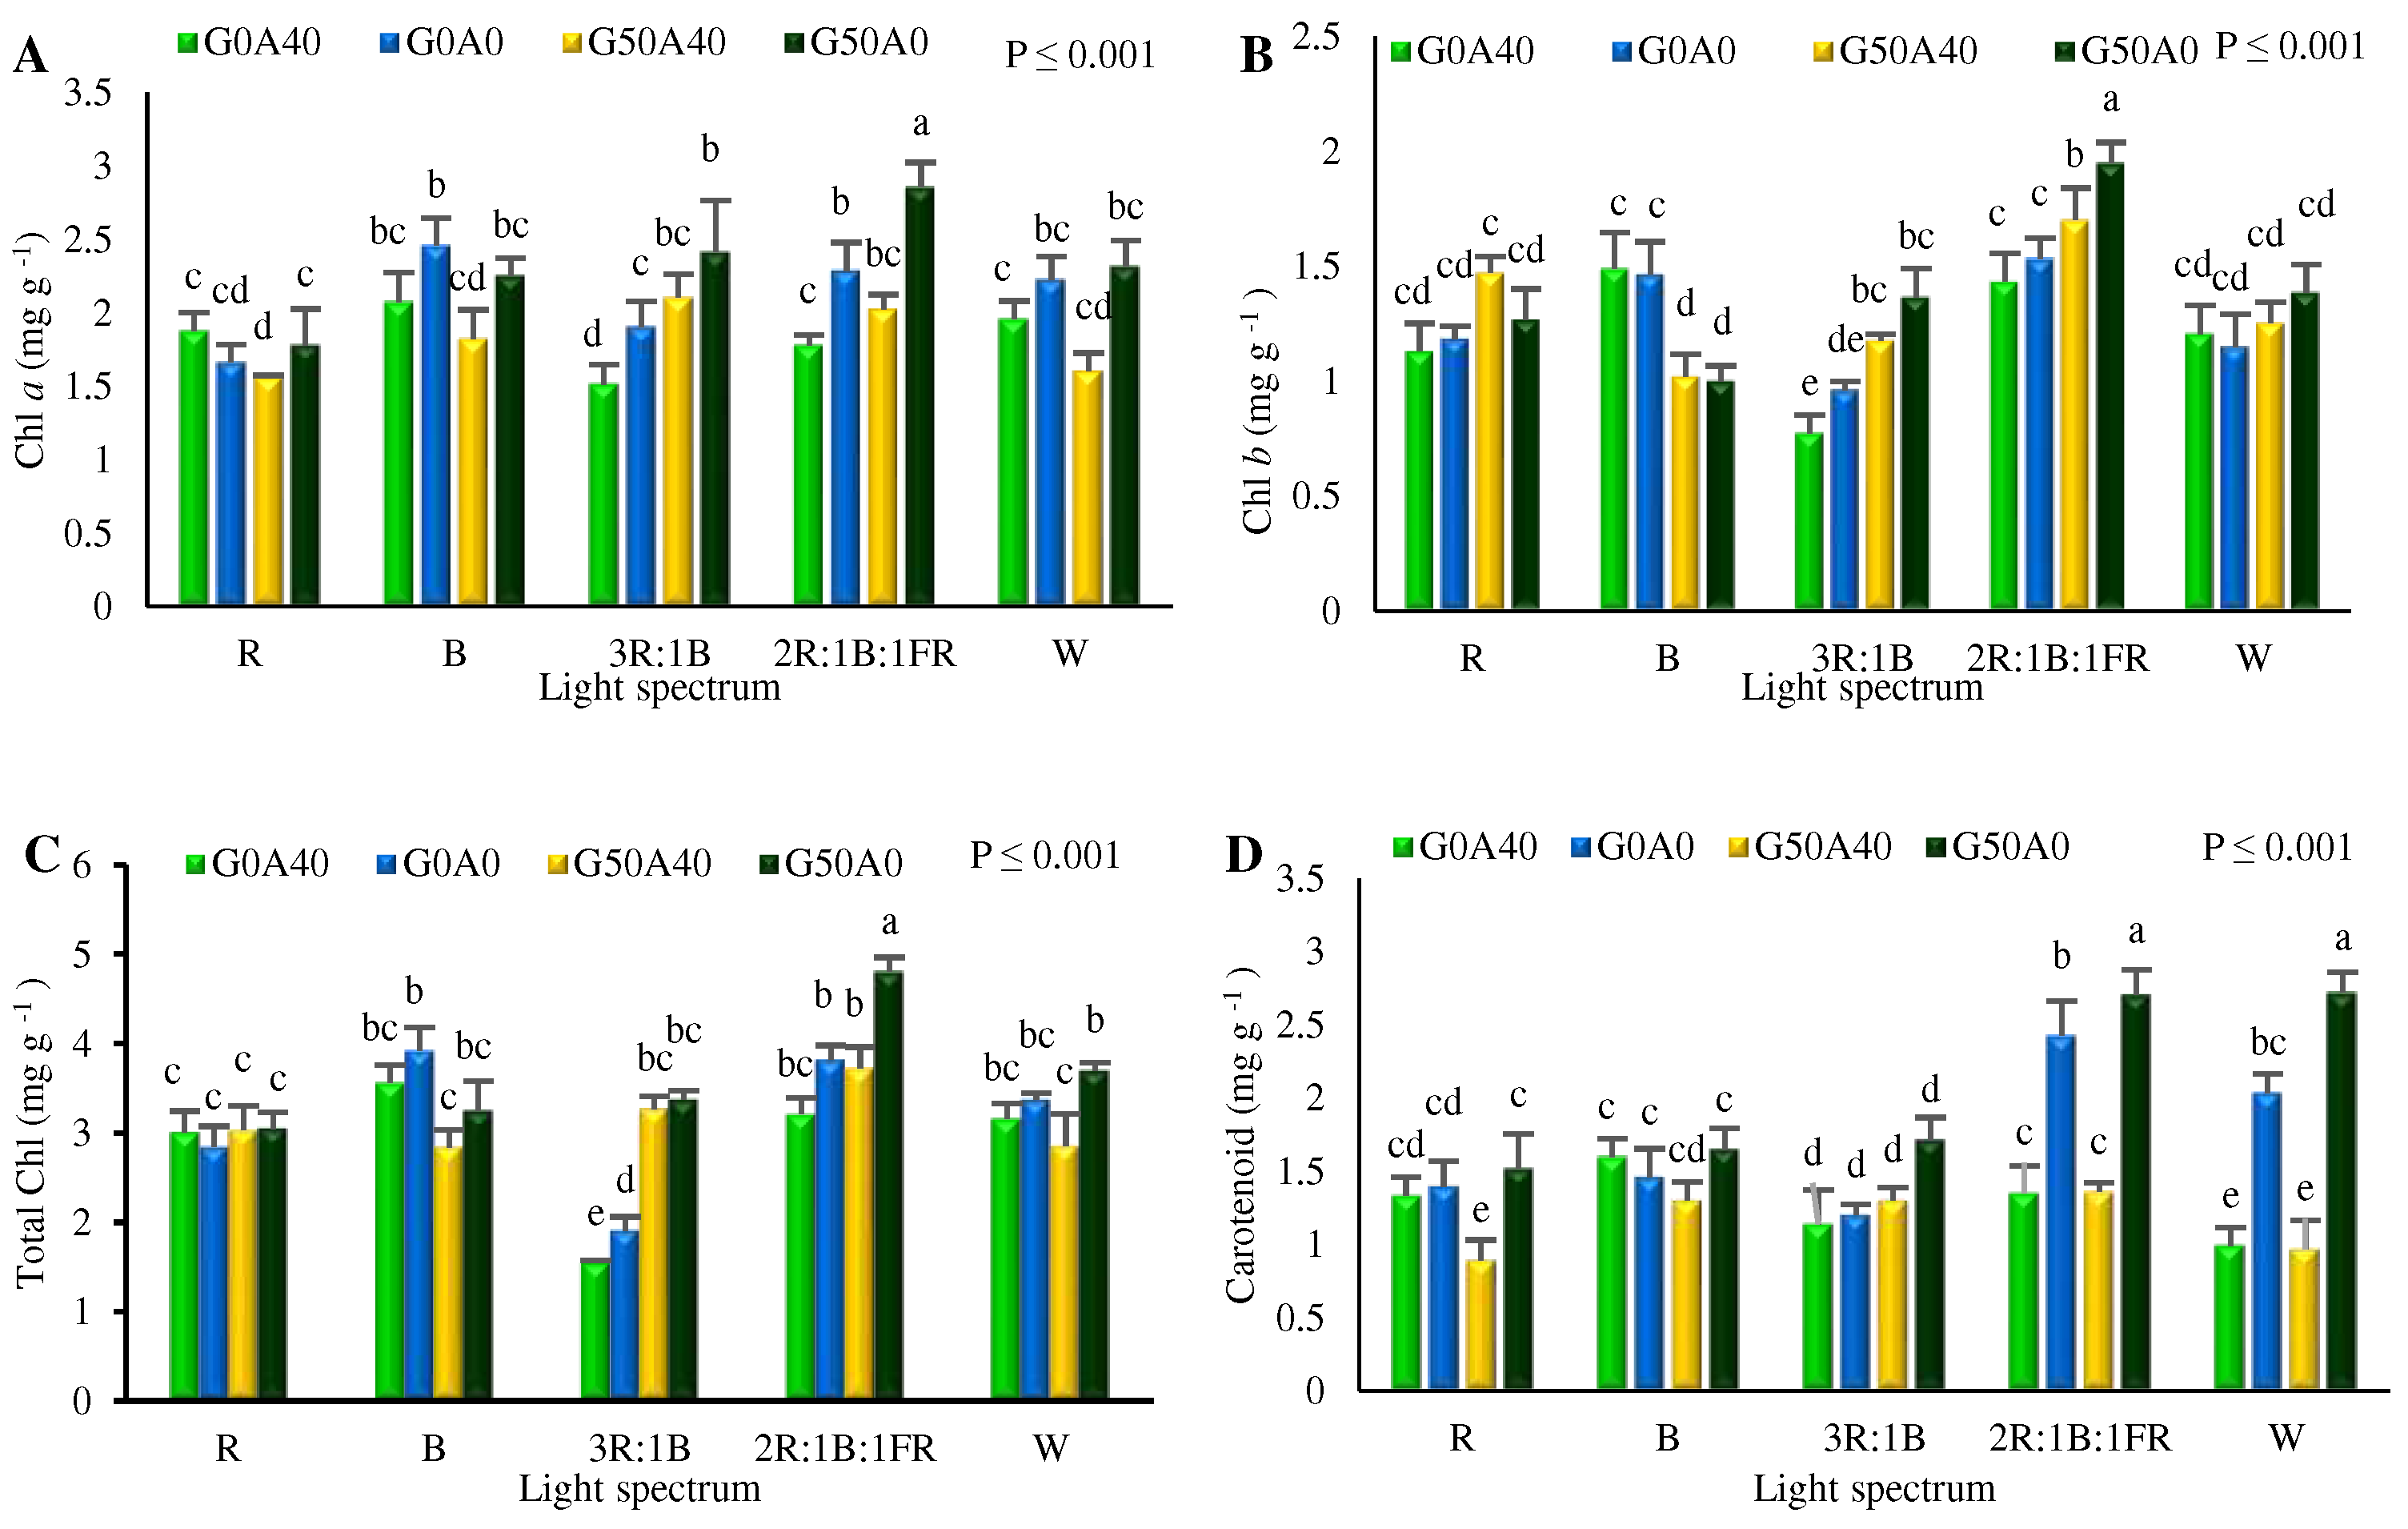
3.4. Photosynthetic pigments influenced by GABA feeding and different light spectra
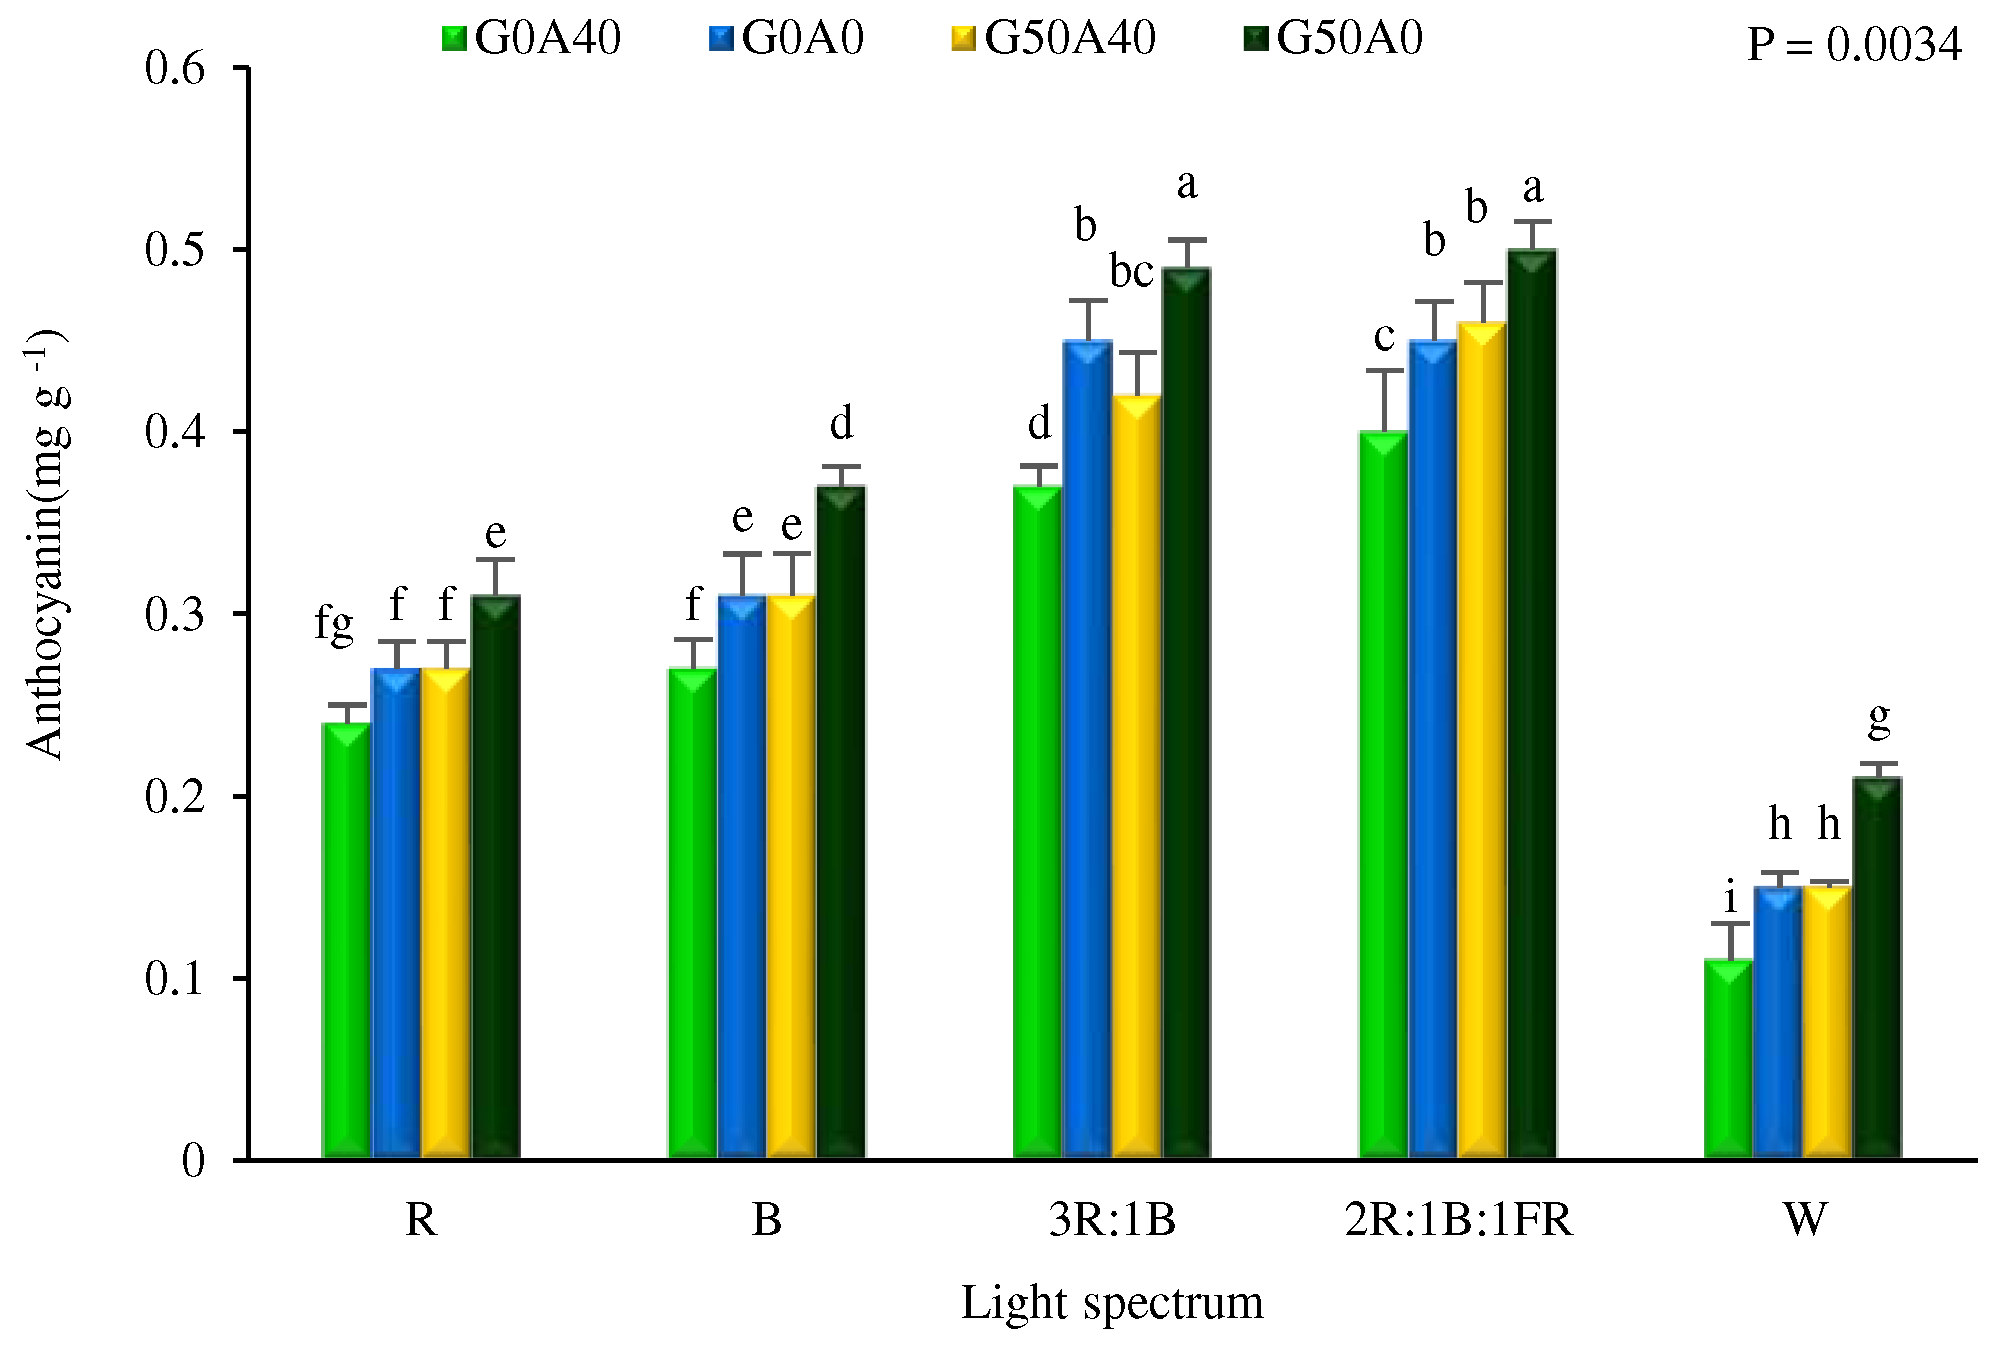
3.5. Total anthocyanins were increased by GABA application and combinational light
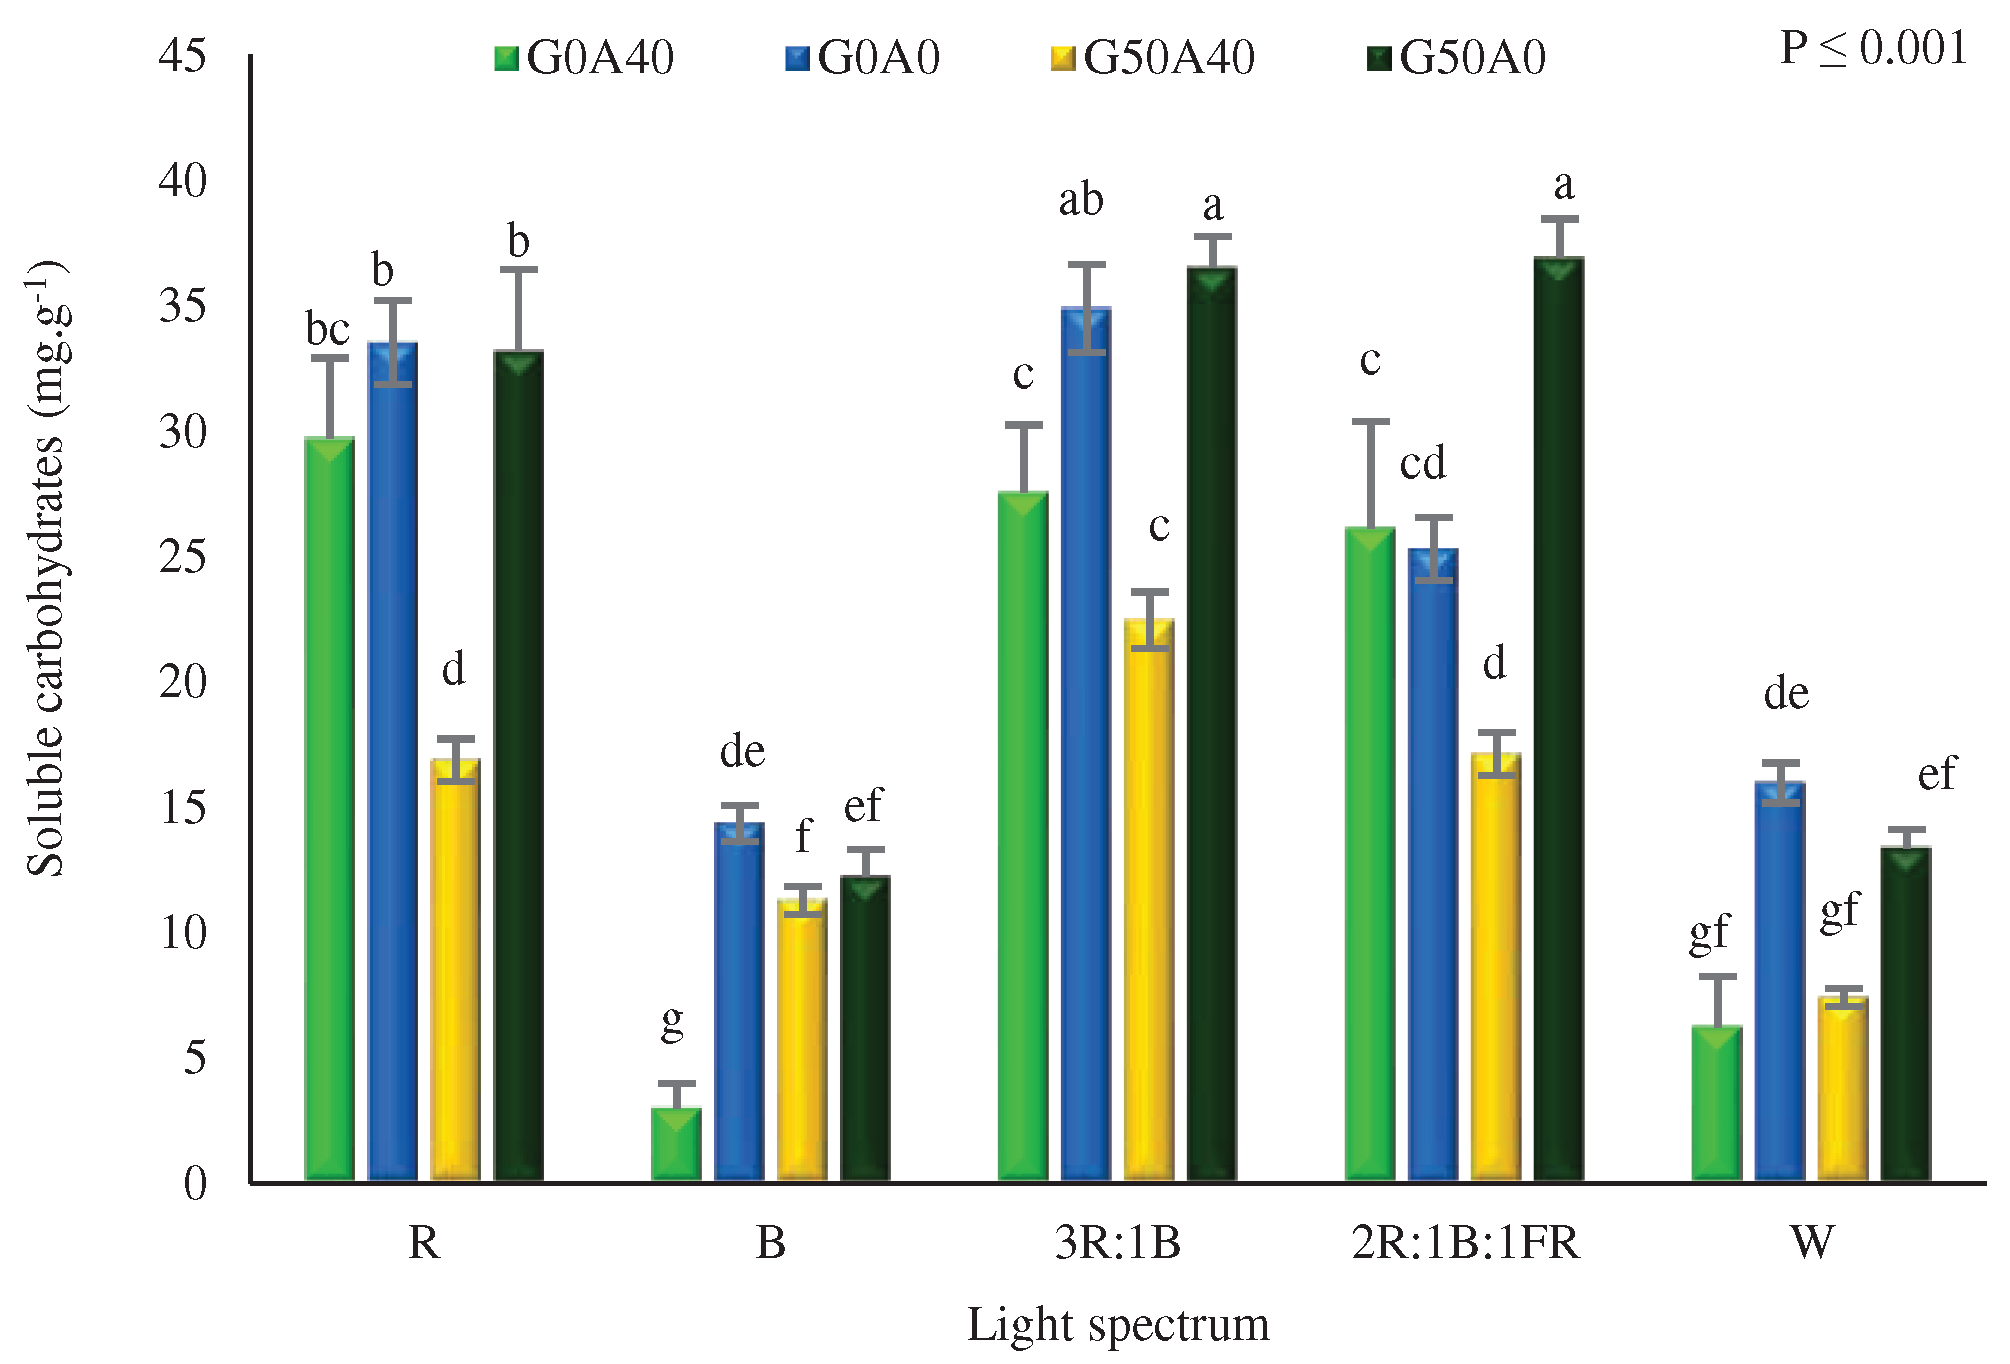
3.6. Carbohydrate levels were accumulated due to GABA feeding and red light exposure
4. Discussion
4.1. Red light promoted the growth of lettuce, and GABA reduced the negative impact of alkaline stress on biomass production
4.2. Red light and alkalinity down-regulated photosynthetic performance, while GABA application enhanced it in lettuce leaves
4.3. Blue light and GABA enhanced tolerance mechanisms against alkaline stress
4.4. GABA induced pigment and carbohydrate accumulation in lettuce plants
5. Conclusions
References
- Fang, S.; Hou, X.; Liang, X. Response Mechanisms of Plants Under Saline-Alkali Stress. Front. Plant Sci. 2021, 12, 667458. [Google Scholar] [CrossRef]
- Shamsabad, M.R.M.; Esmaeilizadeh, M.; Roosta, H.R.; Dehghani, M.R.; Dąbrowski, P.; Kalaji, H.M. The effect of supplementary light on the photosynthetic apparatus of strawberry plants under salinity and alkalinity stress. Sci. Rep. 2021, 12, 13257. [Google Scholar] [CrossRef]
- Anderson, T.S.; Martini, M.R.; De Villiers, D.; Timmons, M.B. Growth and tissue elemental composition response of Butterhead lettuce (Lactuca sativa, cv. Flandria) to hydroponic conditions at different pH and alkalinity. Hortic. 2017, 3, 41. [Google Scholar] [CrossRef]
- Boyd, C.E.; Tucker, C.S.; Somridhivej, B. Alkalinity and hardness: Critical but elusive concepts in aquaculture. J. World Aquacult. Soc. 2016, 47, 6–41. [Google Scholar] [CrossRef]
- Lastochkina, O.; Aliniaeifard, S.; SeifiKalhor, M.; Bosacchi, M.; Maslennikova, D.; Lubyanova, A. Novel approaches for sustainable horticultural crop production: Advances and prospects. Hortic. 2022, 8, 910. [Google Scholar] [CrossRef]
- Li, Y.; Liu, B.; Peng, Y.; Liu, C.; Zhang, X.; Zhang, Z.; Liang, W.; Ma, F.; Li, C. Exogenous GABA alleviates alkaline stress in Malus hupehensis by regulating the accumulation of organic acids. Sci. Hortic. 2020, 261. [Google Scholar] [CrossRef]
- Ullah, A.; Ali, I.; Noor, J.; Zeng, F.; Bawazeer, S.; Eldin, S.M.; Asghar, M.A.; Javed, H.H.; Saleem, K.; Ullah, S.; Ali, H. Exogenous γ-aminobutyric acid (GABA) mitigated salinity-induced impairments in mungbean plants by regulating their nitrogen metabolism and antioxidant potential. Front. Plant Sci. Front. Plant Sci. 2023, 13, 1081188. [Google Scholar] [CrossRef]
- Khan, M.I.R.; Jalil, S.U.; Chopra, P.; Chhillar, H.; Ferrante, A.; Khan, N.A.; Ansari, M.I. Role of GABA in plant growth, development and senescence. Plant Gene 2021, 26, 100283. [Google Scholar] [CrossRef]
- Ramos-Ruiz, R.; Martinez, F.; Knauf-Beiter, G. The effects of GABA in plants. Cogent Food Agr. 2019, 5, 1670553. [Google Scholar] [CrossRef]
- Hoagland, D.R.; Arnon, D.I. The water-culture method for growing plants without soil: University of California. Circular. Calif. Agric. Exp. Stn. 1938, 347, 32. [Google Scholar]
- Estaji, A.; Kalaji, H.M.; Karimi, H.R.; Roosta, H.R.; Moosavi-Nezhad, S.M. How glycine betaine induces tolerance of cucumber plants to salinity stress? Photosynthetica 2019, 57, 753–761. [Google Scholar] [CrossRef]
- Hosseini, A.; Zare Mehrjerdi, M.; Aliniaeifard, S.; Seif, M. Photosynthetic and growth responses of green and purple basil plants under different spectral compositions. Physiol. Mol. Biol. Pla. 2019, 25, 741–752. [Google Scholar] [CrossRef]
- Moradi, S.; Kafi, M.; Aliniaeifard, S.; Salami, S.A.; Shokrpour, M.; Pedersen, C.; Moosavi-Nezhad, M.; Wrobel, J.; Kalaji, H.M. Blue light improves photosynthetic performance and biomass partitioning toward harvestable organs in saffron (Crocus sativus L.). Cells 2021, 10, 1994. [Google Scholar] [CrossRef]
- Strasser, R.J.; Srivastava, A.; Tsimilli-Michael, M. The fluorescence transient as a tool to characterize and screen photosynthetic samples. Probing Photosynth. Mech. Regul. Adapt. 2000, 25, 445–483. [Google Scholar]
- Aliniaeifard, S.; Malcolm Matamoros, P.; van Meeteren, U. Stomatal malfunctioning under low VPD conditions: Induced by alterations in stomatal morphology and leaf anatomy or in the ABA signaling? Physiol. Plantarum 2014, 152, 688–699. [Google Scholar] [CrossRef]
- Shomali, A.; Aliniaeifard, S.; Bakhtiarizadeh, M.R.; Lotfi, M.; Mohammadian, M.; Sadi, M.S.V.; Rastogi, A. Artificial neural network (ANN)-based algorithms for high light stress phenotyping of tomato genotypes using chlorophyll fluorescence features. Plant Physiol. Bioch. 2023, 201, 107893. [Google Scholar] [CrossRef]
- Lichtenthaler, H.K. Chlorophylls and carotenoids: Pigments of photosynthetic biomembranes. Method. Enzymol. 1987, 148, 350–382. [Google Scholar] [CrossRef]
- Wagner, G.J. Content and Vacuole/Extravacuole Distribution of Neutral Sugars, Free Amino Acids, and Anthocyanin in Protoplasts. Plant Physiol. 1979, 64, 88–93. [Google Scholar] [CrossRef]
- Van Doorn, W.G. Water relations of cut flowers: An update. Hortic. Rev. 2012, 40, 55–106. [Google Scholar]
- Zhang, Y.; Ji, J.; Song, S.; Su, W.; Liu, H. Growth, nutritional quality and health-promoting compounds in Chinese Kale grown under different ratios of red: Blue LED lights. Agronomy 2020, 10, 1248. [Google Scholar] [CrossRef]
- Oh, H.E.; Yoon, A.; Park, Y.G. Red light enhances the antioxidant properties and growth of Rubus hongnoensis. Plants 2021, 10, 2589. [Google Scholar] [CrossRef]
- Jin, W.; Urbina, J.L.; Heuvelink, E.; Marcelis, L.F. Adding far-red to red-blue light-emitting diode light promotes yield of lettuce at different planting densities. Front. Plant Sci. 2021, 11, 609977. [Google Scholar] [CrossRef]
- Martinez-Garcia, J.F.; Gallemi, M.; Molina-Contreras, M.J.; Llorente, B.; Bevilaqua, M.R.; Quail, P.H. The shade avoidance syndrome in Arabidopsis: The antagonistic role of phytochrome A and B differentiates vegetation proximity and canopy shade. PLoS ONE 2014, 9, 109275. [Google Scholar] [CrossRef]
- Ortiz-Alcaide, M.; Llamas, E.; Gomez-Cadenas, A.; Nagatani, A.; Martinez-Garcia, J.F.; Rodriguez-Concepcion, M. Chloroplasts modulate elongation responses to canopy shade by retrograde pathways involving HY5 and abscisic acid. Plant Cell 2019, 31, 384–398. [Google Scholar] [CrossRef]
- Seifikalhor, M.; Aliniaeifard, S.; Hassani, B.; Niknam, V.; Lastochkina, O. Diverse role of γ-aminobutyric acid in dynamic plant cell responses. Plant Cell Rep. 2019, 38, 847–867. [Google Scholar] [CrossRef]
- Ramos-Ruiz, R.; Martinez, F.; Knauf-Beiter, G. The effects of GABA in plants. Cogent Food Agric. 2019, 5. [Google Scholar] [CrossRef]
- Li, L.; Dou, N.; Zhang, H.; Wu, C. The versatile GABA in plants. Plant Signal. Behav. 2021, 16, 1862565. [Google Scholar] [CrossRef]
- Barbosa, J.M.; Locy, R.D.; Barger, T.W.; Singh, N.K.; Cherry, J.H. GABA Increases the Rate of Nitrate Uptake and Utilization in Arabidopsis Roots. Plant Tolerance to Abiotic Stresses in Agricu: Role of Genetic Engineering 2000, 53–63. [CrossRef]
- Pan, Y.; Shen, Y.; Zhang, H.; Ran, X.; Xie, T.; Zhang, Y.; Yao, C. Fine-tuned regulation of photosynthetic performance via γ-aminobutyric acid (GABA) supply coupled with high initial cell density culture for economic starch production in microalgae. Bioresources Bioproc. 2022, 9, 1–18. [Google Scholar] [CrossRef]
- Moosavi-Nezhad, M.; Alibeigi, B.; Estaji, A.; Gruda, N.S.; Aliniaeifard, S. Growth, biomass partitioning, and photosynthetic performance of chrysanthemum cuttings in response to different light spectra. Plants 2022, 11, 3337. [Google Scholar] [CrossRef]
- Wang, J.; Lu, W.; Tong, Y.; Yang, Q. Leaf morphology, photosynthetic performance, chlorophyll fluorescence, stomatal development of lettuce (Lactuca sativa L.) exposed to different ratios of red light to blue light. Front. Plant Sci. 2016, 7, 250. [Google Scholar] [CrossRef]
- Bayat, L.; Arab, M.; Aliniaeifard, S.; Seif, M.; Lastochkina, O.; Li, T. Effects of growth under different light spectra on the subsequent high light tolerance in rose plants. AoB Plants 2018, 10, ply052. [Google Scholar] [CrossRef]
- Cheng, P.; Yue, Q.; Zhang, Y.; Zhao, S.; Khan, A.; Yang, X.; He, J.; Wang, S.; Shen, W.; Qian, Q.; Du, W. Application of γ-aminobutyric acid (GABA) improves fruit quality and rootstock drought tolerance in apple. J. Plant Physiol. 2023, 280, 153890. [Google Scholar] [CrossRef] [PubMed]
- Roeber, V.M.; Bajaj, I.; Rohde, M.; Schmülling, T.; Cortleven, A. Light acts as a stressor and influences abiotic and biotic stress responses in plants. Plant Cell Enviro. 2021, 44, 645–664. [Google Scholar] [CrossRef] [PubMed]
- Malekzadeh Shamsabad, M.R.; Esmaeilizadeh, M.; Roosta, H.R.; Dąbrowski, P.; Telesinski, A.; Kalaji, H.M. Supplemental light application can improve the growth and development of strawberry plants under salinity and alkalinity stress conditions. Sci. Rep. 2022, 12, 9272. [Google Scholar] [CrossRef] [PubMed]
- Seifikalhor, M.; Aliniaeifard, S.; Bernard, F.; Seif, M.; Latifi, M.; Hassani, B.; Didaran, F.; Bosacchi, M.; Rezadiist, H.; Li, T. γ-Aminobutyric acid confers cadmium tolerance in maize plants by concerted regulation of polyamine metabolism and antioxidant defense systems. Sci. Rep. 2020, 10, 3356. [Google Scholar] [CrossRef] [PubMed]
- Kalhor, M.S.; Aliniaeifard, S.; Seif, M.; Asayesh, E.J.; Bernard, F.; Hassani, B.; Li, T. Enhanced salt tolerance and photosynthetic performance: Implication of γ -amino butyric acid application in salt-exposed lettuce (Lactuca sativa L.) plants. Plant Physiol. Bioch. 2018, 130, 157–172. [Google Scholar] [CrossRef] [PubMed]
- Kaspal, M.; Kanapaddalagamage, M.H.; Ramesh, S.A. Emerging roles of γ aminobutyric acid (GABA) gated channels in plant stress tolerance. Plants 2021, 10, 2178. [Google Scholar] [CrossRef] [PubMed]
- Yuan, D.; Wu, X.; Gong, B.; Huo, R.; Zhao, L.; Li, J.; Li, J.; Lu, G.; Gao, H. GABA Metabolism, Transport and Their Roles and Mechanisms in the Regulation of Abiotic Stress (Hypoxia, Salt, Drought) Resistance in Plants. Metabolites 2023, 13, 347. [Google Scholar] [CrossRef] [PubMed]
- Carillo, P. GABA shunt in durum wheat. Front. Plant Sci. 2018, 9, 100. [Google Scholar] [CrossRef]
- Carvalho, R.F.; Campos, M.L.; Azevedo, R.A. The role of phytochrome in stress tolerance. J. Integr. Plant Biol. 2011, 53, 920–929. [Google Scholar] [CrossRef]
- Manivannan, A.; Soundararajan, P.; Halimah, N.; Ko, C.H.; Jeong, B.R. Blue LED light enhances growth, phytochemical contents, and antioxidant enzyme activities of Rehmannia glutinosa cultured in vitro. Hortic. Environ. Biote. 2015, 56, 105–113. [Google Scholar] [CrossRef]
- Wang, F.F.; Wang, M.H.; Zhang, M.K.; Qin, P.; Cuthbertson, A.G.S.; Lei, C.L.; Qiu, B.L.; Yu, L.; Sang, W. Blue light stimulates light stress and phototactic behavior when received in the brain of Diaphorina citri. Ecotox. Environ. Saf. 2023, 251, 114519. [Google Scholar] [CrossRef]
- Yu, G.; Chen, F.; Wang, Y.; Chen, Q.; Liu, H.; Tian, J.; Wang, M.; Ren, C.; Zhao, O.; Yang, F.; Sheng, Y. Exogenous γ-aminobutyric acid strengthens phenylpropanoid and nitrogen metabolism to enhance the contents of flavonoids, amino acids, and the derivatives in edamame. Food Chem. X 2022, 16, 100511. [Google Scholar] [CrossRef]
- Ren, T.; Zheng, P.; Zhang, K.; Liao, J.; Xiong, F.; Shen, Q.; Ma, Y.; Fang, W.; Zhu, X. Effects of GABA on the polyphenol accumulation and antioxidant activities in tea plants (Camellia sinensis L.) under heat-stress conditions. Plant Physiol. Bioch. 2021, 159, 363–371. [Google Scholar] [CrossRef]

| Light spectrum | GABA (µmolL-1) | Alkalinity stress(mM) | ABS/RC | TR0/RC | ET0/RC | DI0/RC |
|---|---|---|---|---|---|---|
| R | 0 | 0 | 3.8f | 3.2f | 1.8e | 0.9f |
| R | 0 | 40 | 4.2e | 3.3e | 1.9d | 1e |
| R | 50 | 0 | 3.4g | 3.1g | 1.7f | 0.8g |
| R | 50 | 40 | 3.8f | 3.2f | 1.8e | 0.9f |
| B | 0 | 0 | 5.4b | 3.6b | 2.1b | 1.3b |
| B | 0 | 40 | 5.7a | 3.7a | 2.2a | 1.4a |
| B | 50 | 0 | 5c | 3.5c | 2c | 1.2c |
| B | 50 | 40 | 5.4b | 3.6b | 2.2a | 1.3b |
| 3R:1B | 0 | 0 | 2.6i | 3h | 1.6h | 0.6i |
| 3R:1B | 0 | 40 | 3.4g | 3.1g | 1.8g | 0.8g |
| 3R:1B | 50 | 0 | 2.2j | 2.9i | 1.4j | 0.5j |
| 3R:1B | 50 | 40 | 3h | 3h | 1.6h | 0.7h |
| 2R:1B:1FR | 0 | 0 | 2.6i | 2.8j | 1.5i | 0.6i |
| 2R:1B:1FR | 0 | 40 | 3h | 2.9i | 1.7f | 0.7h |
| 2R:1B:1FR | 50 | 0 | 2.2j | 2.7k | 1.4j | 0.5j |
| 2R:1B:1FR | 50 | 40 | 2.6i | 2.8j | 1.5i | 0.6i |
| W | 0 | 0 | 4.6d | 3.4d | 2c | 1.1d |
| W | 0 | 40 | 5c | 3.5c | 2.1b | 1.2c |
| W | 50 | 0 | 4.2e | 3.3e | 1.9d | 1e |
| W | 50 | 40 | 4.6d | 3.4d | 2c | 1.1d |
| P Value | - | - | 0.014 | 0.025 | 0.0148 | 0.001 |
Disclaimer/Publisher’s Note: The statements, opinions and data contained in all publications are solely those of the individual author(s) and contributor(s) and not of MDPI and/or the editor(s). MDPI and/or the editor(s) disclaim responsibility for any injury to people or property resulting from any ideas, methods, instructions or products referred to in the content. |
© 2024 by the authors. Licensee MDPI, Basel, Switzerland. This article is an open access article distributed under the terms and conditions of the Creative Commons Attribution (CC BY) license (http://creativecommons.org/licenses/by/4.0/).


