1. Introduction
Peatlands and peat soils are of great importance as they are crucial for climatic changes, biodiversity and ecosystem services [
1,
2,
3]. The assessment of peatland values, their functions and properties in relation to changing environmental conditions is important to introduce strategies to protect them as well as enable wise use [
4,
5,
6] and management [
7].
The lowering of water level water in peat soils (drainage of peat soils) and temperature rise are the most important drivers of SOM mineralisation in peat soils, contributing to not only increased CO
2 and N
2O emission [
8,
9,
10], but also phosphorous and other elements leaching to groundwater and surface waters due to preferential flow [
11]. Peat soils are regarded a boundary zone between terrestrial and aquatic ecosystems, and are characterized by excessive phosphorus accumulation, which poses a risk of phosphorus dispersion, entailing the process of eutrophication [
12,
13]. Moreover high variability of oxidation and reduction conditions in both wet and drained peat soils has a significant effect on the forms and solubility of phosphorus [
14,
15,
16]. The P release as a result of drying and rewetting of organic soils may limit the ability of natural, restored, and constructed wetlands and streams to provide substantial ecosystem services. Within ecosystems, eutrophication resulting from soil P release may deteriorate wetland habitat quality and ecosystem health. Along landscape flow paths, soil P release may cause aquatic ecosystems or semi-aquatic. to act as sources, rather than sinks, for P, potentially contributing to harmful eutrophication in vulnerable downstream ecosystems [
17]. Rewetting of drained fens is necessary to stop further soil degradation and to reestablish important ecological functions. In the context of climate-neutral soil management rewetting is inevitable to cease the emission of carbon dioxide from peatlands. On the other side, substantial changes of peat character in the upper soil layers, due to drainage and land use, could counteract their recovery. Peatlands may be a source of biogens and may release P to the adjacent ecosystems, becoming nutrient-poor systems itself for an unknown period. Very important, form ecological restoration and target species point of view, is
high nutrient availability in highly decomposed peat soils [
18,
19]
.
Cultivated organic soils make a significant contribution to P leaching from agricultural areas but still the knowledge about P immobilization and the P forms present in peat soils compared with mineral soils is insufficient [
20]. Also rewetting of drained peat soils by can have negative effects on runoff water due to release of some phosphorus [
21,
22,
23]. The distribution of various forms of phosphorus in the catchment area provides valuable knowledge about risk of phosphorus leaching which will help to preserve these areas, especially when they are protected under local law [
3,
24].
Issues related to the transformation and mobility of phosphorus in organic soils have been widely studied for years, but they are still an extremely actual topic. Researchers report excessive dispersion of phosphorus in the natural environment. Moreover, dynamic changes in the use of peatlands and organic soils very often lead to the land rewetting. Excessive accumulation of phosphorus found in grassland soils may be a source of negative impact on groundwater causing their eutrophication [
16,
25].
The processes of phosphorus release from organic soil formations and the mechanisms of its mobility depend on multiple factors. These include, among others: soil reaction, organic carbon content, as well as iron, aluminum and nitrogen amounts [
16,
26].
Sapek [
16] indicates very complicated relationships in the processes of phosphorus release and migration in organic soils in the Biebrza Valley. The author suggests the influence of different sorption capacity and phosphorus binding strength of various soil formations in the Murshic Histosols on the migration of organic and inorganic phosphorus compounds. Van de Riet et al. [
5] reported that constant flooding of meadows on drained peat soils causes the release of large amounts of compounds, especially phosphorus, into groundwater - much more than in the case of mineral soils. The author explained this fact by the higher content of iron-bound phosphorus in peat formations.
Phosphorus losses from organic soils of grasslands do not only occur as a result of leaching into the soil profile. A very important cause of these losses is surface and subsurface runoff associated with agricultural drainage [
25]. Moreover, there is the mutual influence of phosphorus stocks in soil, water regime and proper use on the mobility of phosphorus in soils.
Observing new trends related to the sustainable use of wetlands, especially peatlands, the studies concentrated on the transformation of phosphorus in organic soils become very important and urgent topic. Therefore the studies of factors enabling to assess the potential and share of phosphorus release from organic soils are crucial. So as the modelling and studies in the natural environment which are focused on accumulation, transformation and P release in rewetted organic soils and sediments [
12,
17].
The aim of the study was to assess the amounts of phosphorous that are released in organic soils developed at natural and rewetted peatlands and grasslands near nature reserve. We hypothesized that the largest amounts of P may be released from the topsoil of rewetted peatlands.
2. Materials and Methods
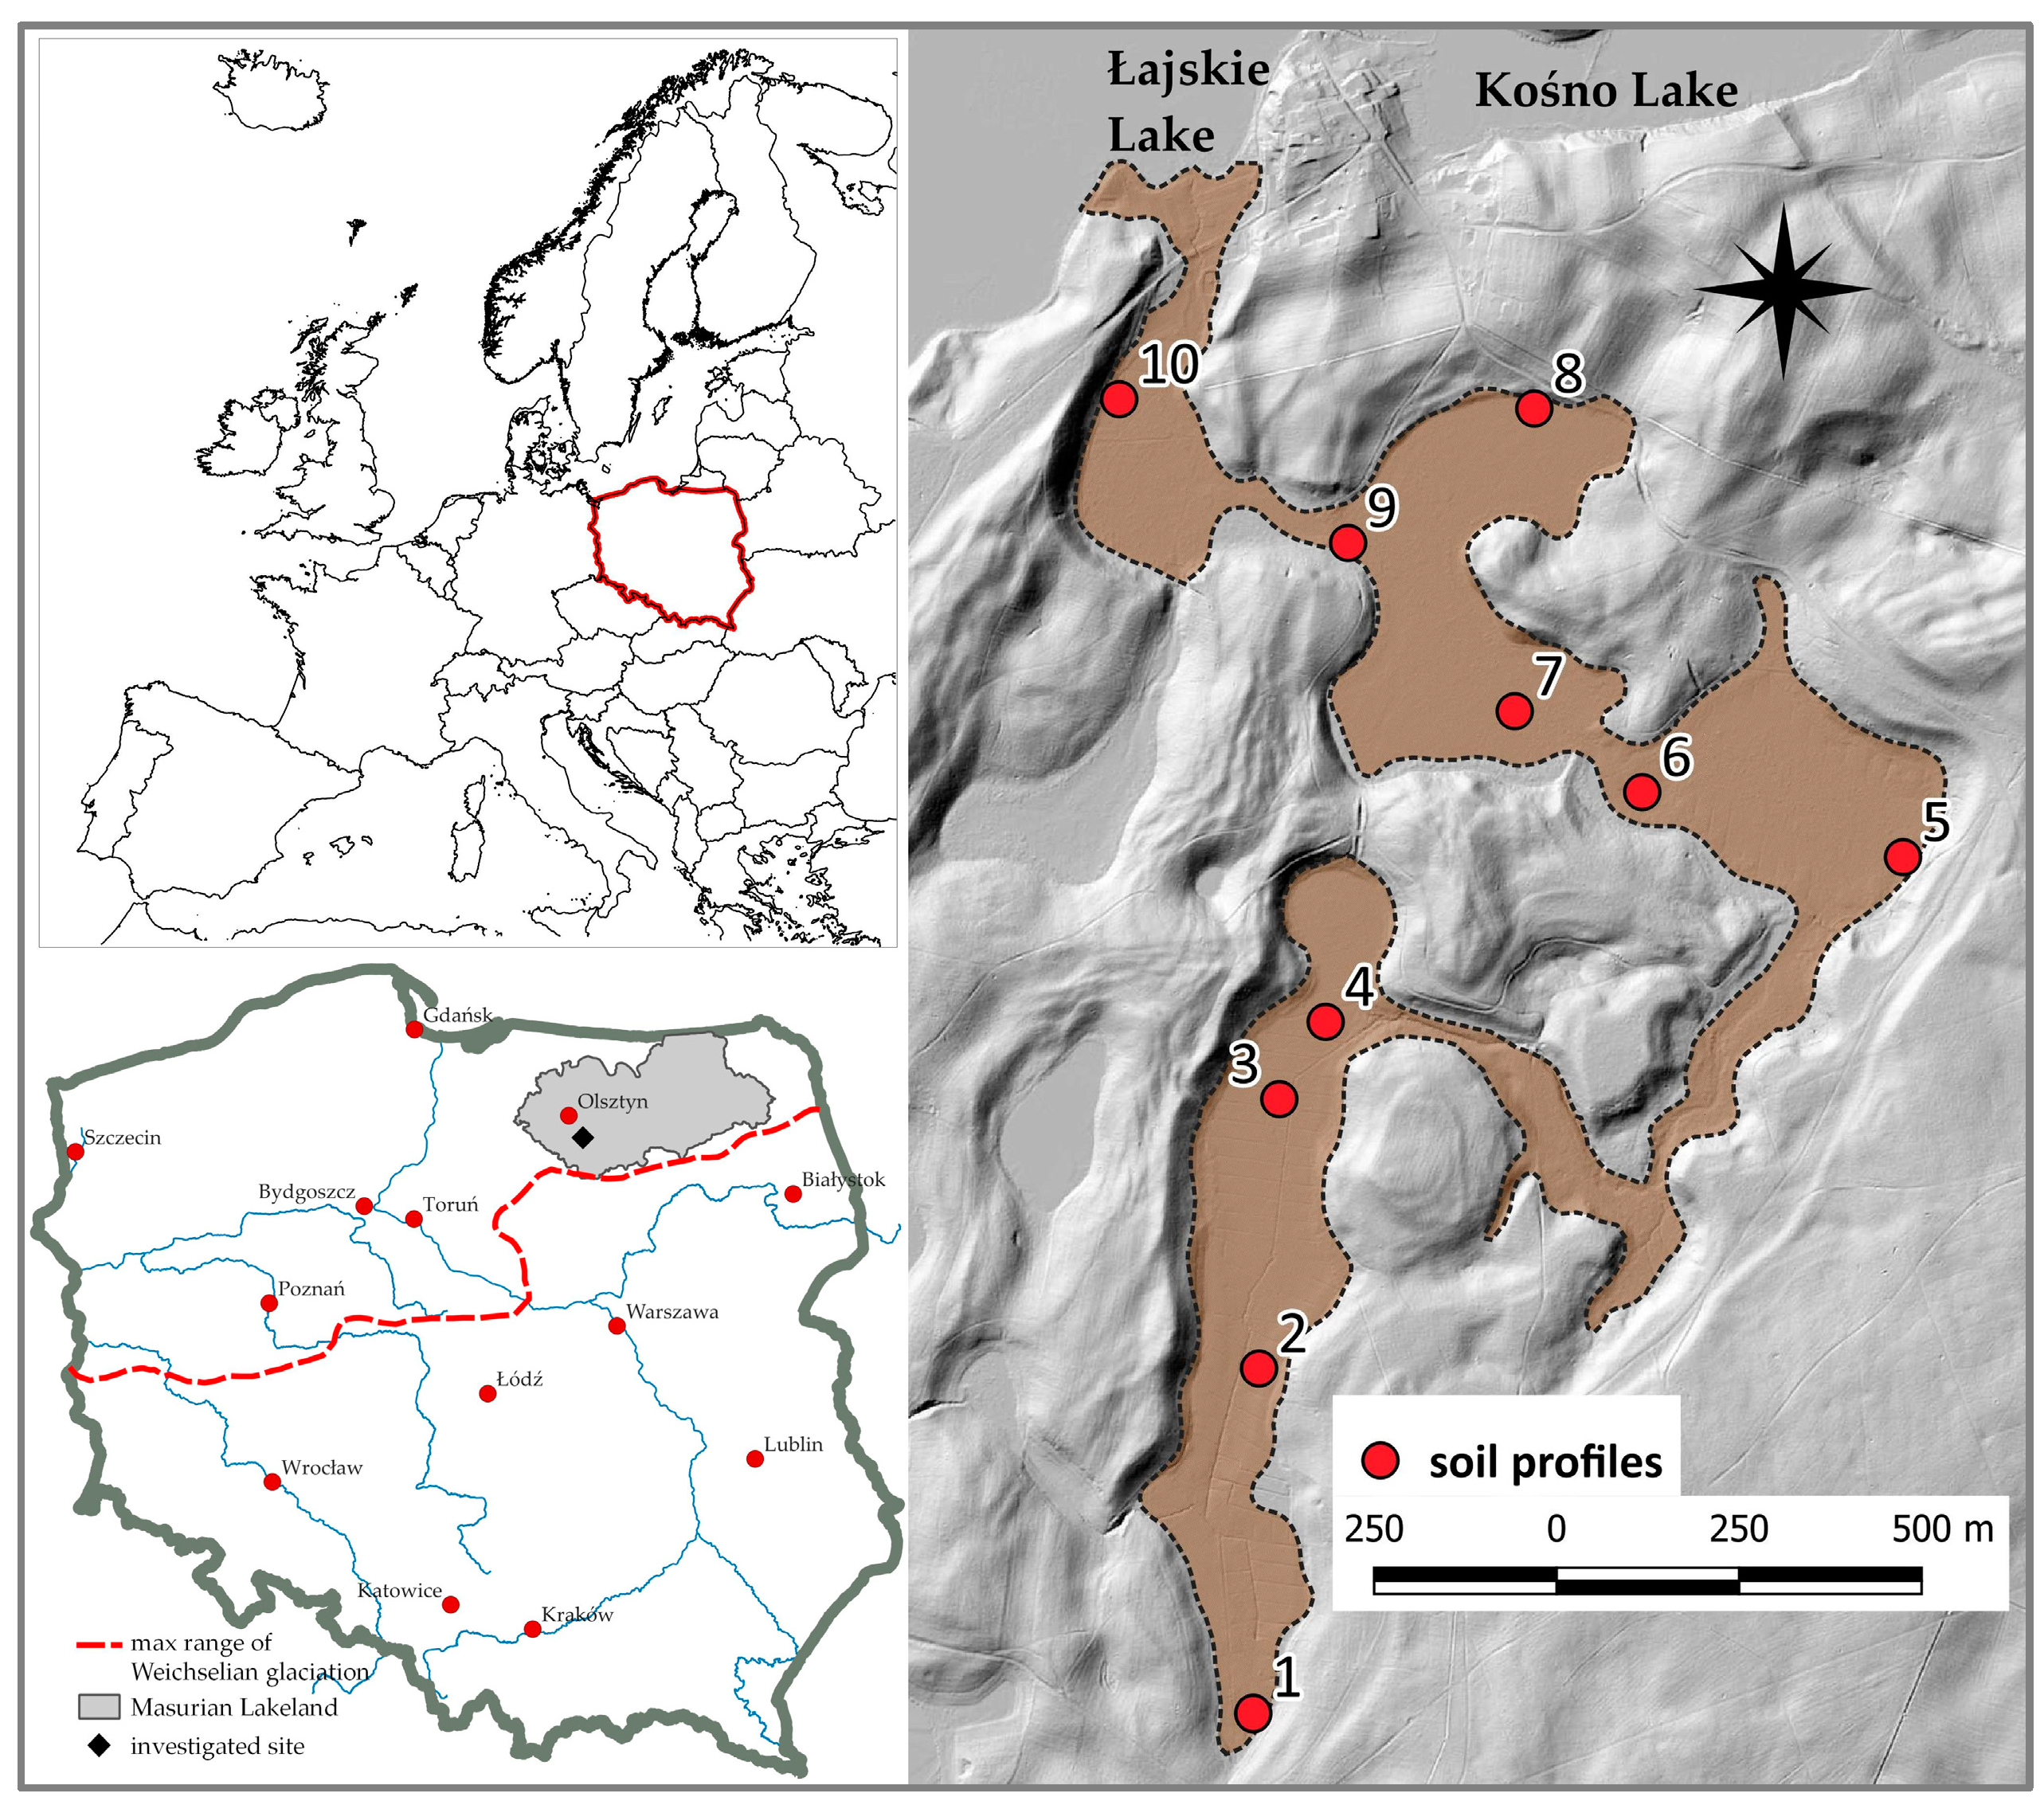
The study was carried out at 10 soil profiles located south-west of Lake Kośno nature reserve in northern-central Europe (north-eastern Poland), in Olsztyn Lakeland mesoregion (macroregion Masurian Lakeland, Warmia and Mazury voivodship) (
Table 1,
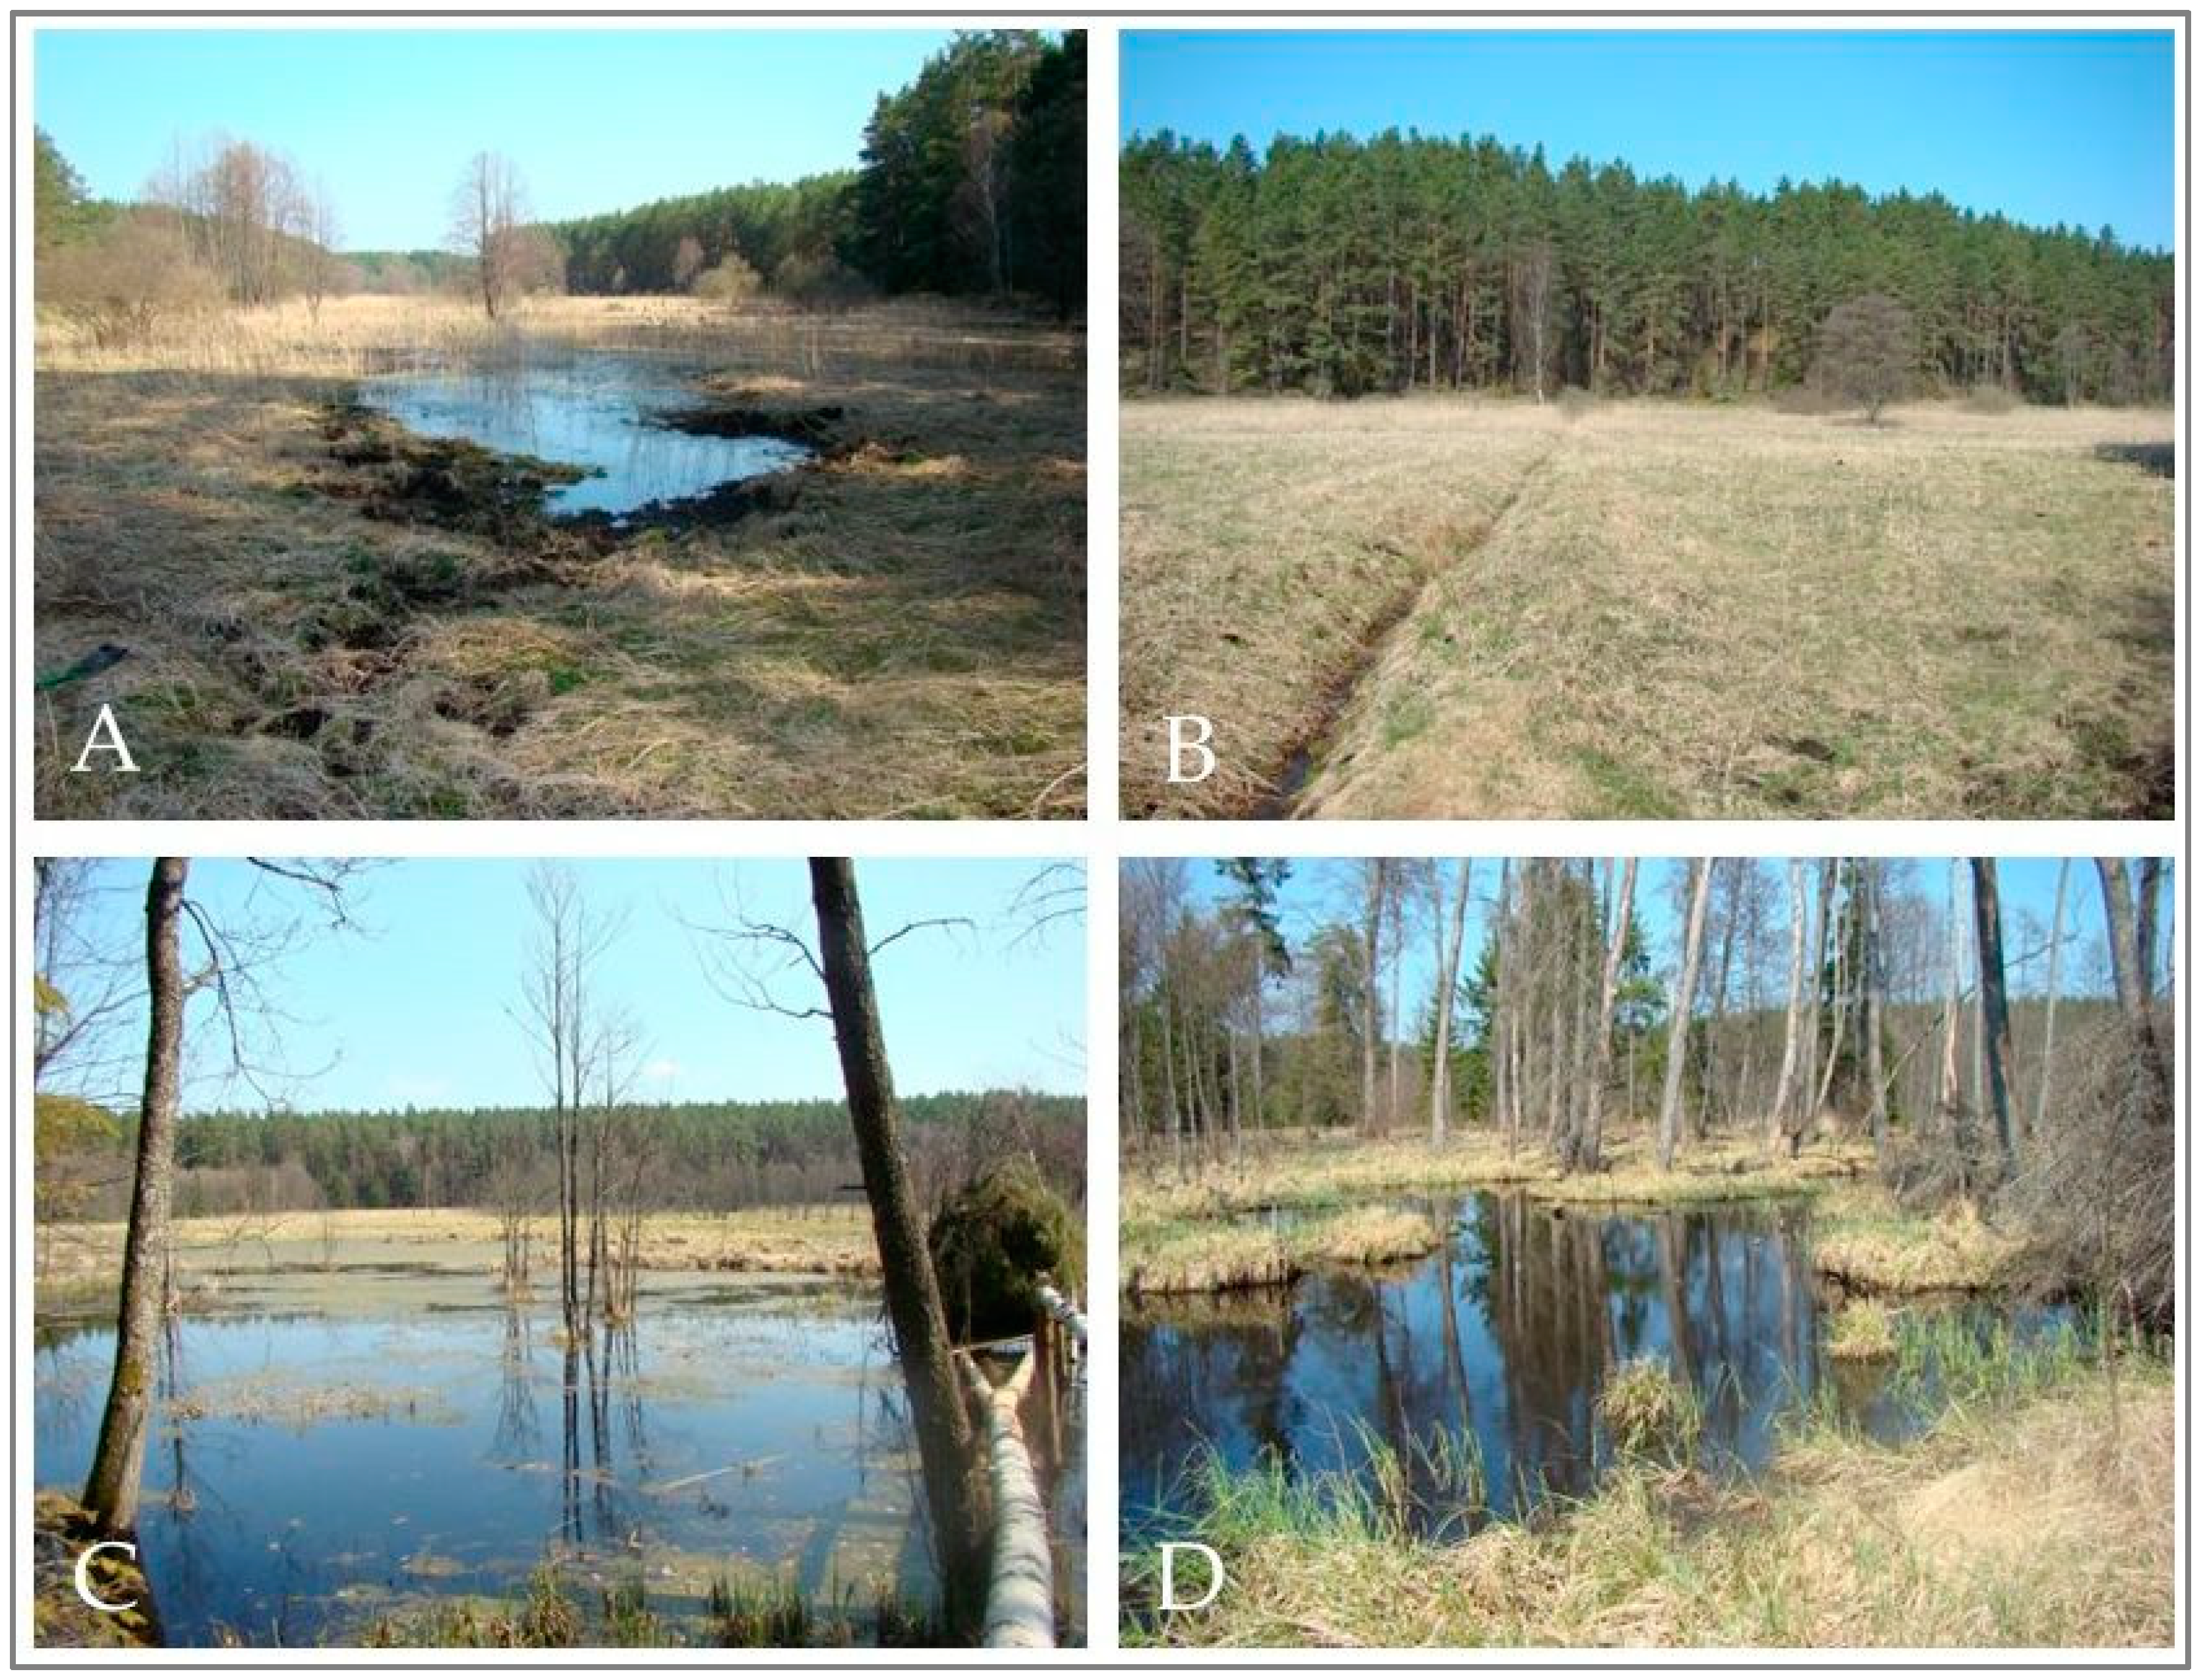
Figure 1). Contemporary land relief of research area shows a young glacial character of outwash plain, formed as a result of melted glacial waters after the Pomeranian Phase of Weichselian glaciation (Pleistocene). The outwash plain landscape is rather flat with or undulating, associated with the presence of sands and silts of kames. The depressions between kames are filled with peats on gyttjas and colluvium. Also remains of a bottom moraines formed by boulder clays and dunes formed by a eolian sands are present. Lake Kośno basin is covered mainly by coniferous and mixed forests. Different types of depressions are occupied by wetlands – lakes and peatlands. Peat soils had been drained and used as grasslands in the previous century. In the last decade they had been flooded. Rewetting of studied grasslands and peatlands was not anthropogenic. Higher groundwater level at these lands was the result of beavers activity.
2.1. Soil Sampling and Preparation
Field research was carried out in spring (April), summer (July) and autumn (October) in 2011. Ten soil exposures were made at different landcovers: grassland, peatland, re-wetted grassland and rewetted peatland (
Figure 2). For the analysis of 30 soil samples were collected. In each soil profile the soil samples were collected from the following depths: 0-30 cm, 50-80 cm and 100-130 cm. The soil morphological features, type of peat and degree of peat decomposition were determined. In the laboratory, the following soil properties were determined: loss-on-ignition (LOI) at the temperature of 550
ᵒC, soil reaction potentiometrically in deionized water and calcium chloride (1 mol dm
-3), content of total organic carbon (TOC) by Alten’s method, total nitrogen (TN) by Kiejdahl method, total phosphorous (TP) colorimetrically after digestion in sulphuric acid and labile form phosphorus (AP) in hydrochloric acid (0.5 mol∙dm
-3). The amounts of phosphorous extracted with hydrochloric acid (0.5 mol∙dm
-3) are a relatively labile form of phosphorus in organic compounds [
14,
27].
2.2. Statistical Analysis
Statistical calculations (mean, correlation coefficients, standard deviation, clustering) were carried out using Statistica 13.1. The agglomerative hierarchical cluster analysis using Ward’s method was applied in order to group the soils. The basis for choosing the Ward’s method was its efficiency that derives from using an analysis of variance approach to estimate the distance between clusters. In general, this approach minimizes the sum of the squared deviation of any two clusters which may be formed at the stages of the analysis.
3. Results and discussion
3.1. Soil systematics and soil properties
In the studied area various organic soils occurred (
Table 1 and
Table 2). They were developed from fen peats of various degrees of decomposition (Fibric, Sapric and Hemic Histosols), frequently with mursh on the top (Murshic Fibric, Hemic and Sapric Histosols). The soil profiles No. 1, 3 and 4 gyttja was present (suffix Limnic). In the soil Profile No. 5 and 8-10 organic materials were developed on mineral subsoil (loose sand texture). The genetic types of peats in the studied soils were divers, and so was their degree of decomposition. Rush peats were most frequent. Their degree of decomposition amounted to approx. 30-60% (hemic peats) or > 60% (sapric peats). The structure of these peats was fibrous-amorphous. Less frequent were alder peats with high degree of decomposition and amorphous structure. Weakly decomposed peats (< 30%) – sedge with fibrous structure and moss ones with sponge structure - were stated in two soil profiles. The murshes which were developed in the topsoil of drained peat had granular structure.
The studied soils are slightly acidic and mean pH values show minor variations (
Table 3). The lowest mean pH values were in fibric peats (pH KCl - 5.53) and the highest in gyttja formations (pH KCl - 6.20). In murshes as well as in hemic and sapric peats, the pH KCl ranged from 5.71 to 5.78. The organic carbon content in peat formations ranged from 251.50 g∙kg
-1 (sapric peats) to 500.83 g∙kg
-1 (hemic peats). The carbon content in murshes was lower – 259.34 g∙kg
-1 and was similar to gyttja. The lowest content of organic carbon was stated in the subsoil (sand) - 185.45 g∙kg
-1. The highest content of nitrogen was stated in hemic and fibric peats (23.05 g∙kg
-1 and 21.20 g∙kg
-1, respectively), whereas in in murshes and sapric peat the TN content was lower – 14.42 g∙kg
-1 and 14.56 g∙kg
-1, respectively. The C:N ratio was lower in murshes (16.03) than in peats (18.94-22.18). The quantities of organic carbon and nitrogen are typical for drained organic soils. The OC content in murshes is frequently lower than in underlying peats due to mineralisation of organic matter in the topsoil [
8,
10].
3.2. Content of total and bio-aviable forms of phosphorus
The highest total phosphorus content was stated in gyttjas (6.77 g∙kg
-1), and hemic peats – 2.29 g∙kg
-1 (
Table 4). The content of this element in murshes was twice lower (1.18 g∙kg
-1). Saltali & Nedirli [
29] confirm in their research the ability of gyttja to absorb phosphorus. However, Zak et al. [
19] indicate a positive correlation between the degree of peat decomposition and the risk of phosphorus release. The obtained results of TP content in gyttja are much higher than those observed in calcareous gyttja from the post-bog area [
30]. This is probably related to the much lower organic matter content. However, the TP contents in the studied peats and murshes were lower than those reported in the literature from NE Poland [
10,
31].The content of labile form of phosphorus was extremely diverse. In spring, more labile form of phosphorus (AP sp) was released in murshes (0.29 g∙kg
-1) than in peats (0.07-0.14 g∙kg
-1). In the summer, more labile form of phosphorus was found in fibric peats (0.37 g∙kg
-1) than in murshes (0.26 g∙kg
-1). In autumn, the phosphorus content in murshes and peats did not vary (0.21-0.23 g∙kg
-1). Noteworthy is that during research seasons, the highest average amounts of AP were released in gyttjas, lower in murshes (0.26 g∙kg
-1) and fibric peats (0.25 g∙kg
-1), and the lowest in sapric peats (0.15 g∙kg
-1).
The content of labile form of phosphorus is be the basis for estimating the abundance of this element in soils [
32]. In the studied topsoils the amounts of this form of phosphorus were extremely diverse and ranged from very low to very high.
Total and labile forms of phosphorus were positively correlated with soil pH ( r = 0.370-0.551) (
Table 5). The contents of AP were significantly correlated with TP, noteworthy is that AP sp and AP su were the most correlated with TP (r = 0.946-0.949), whereas AP au had lower correlation coefficient (r = 0.659).
The majority of phosphorus in the soil occurs in the form of bonds with divalent and trivalent metal cations (e.g. Ca, Mg, Fe, Al, Mn), forming sparingly soluble compounds [
12,
14,
27]. This process is called phosphorus retrogression. The combination of phosphorus with metal cations is faster when the soil has lower pH value. This may hamper the uptake of P by plants [
26], and also to P immobilization. However, in soils containing higher amounts of organic matter, the release of phosphorus is higher.
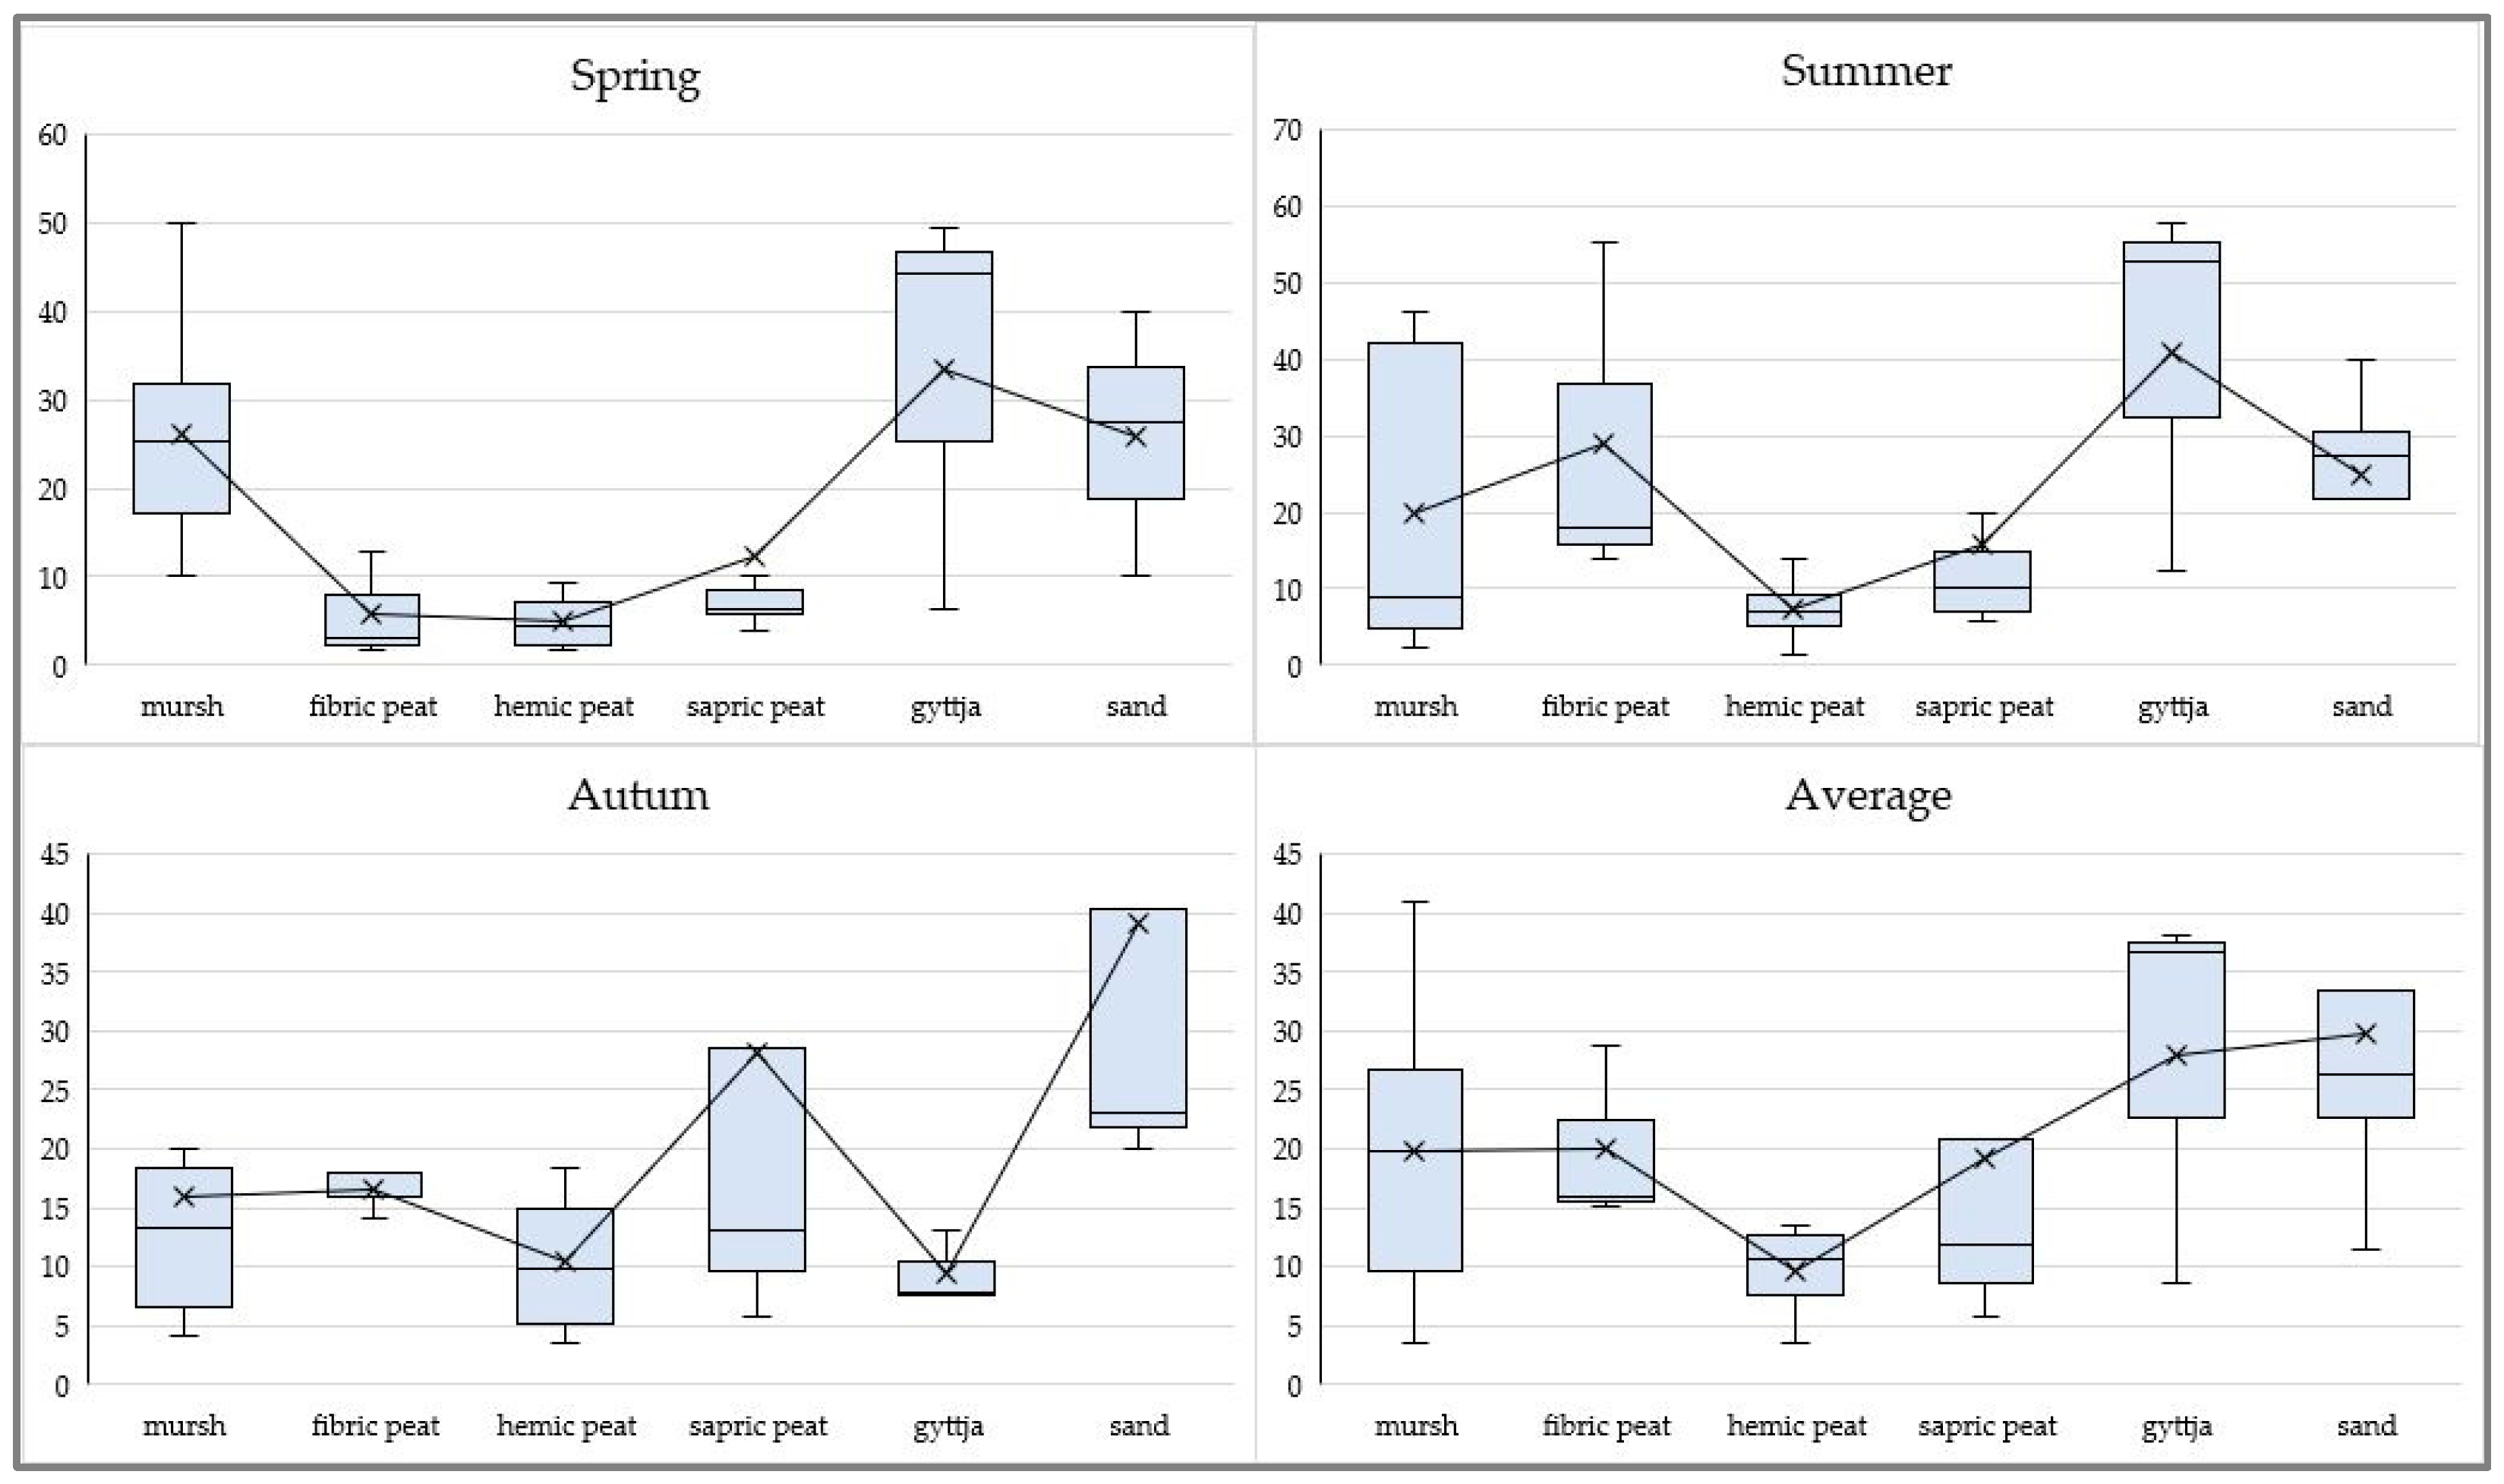
Figure 3 shows the percentage of labile forms of phosphorus (AP) in relation to total phosphorus (TP). In spring, the highest share of AP in relation to TP was observed in gyttja (average 33.4%), mursh – 26.3% and mineral subsoil (sand) – 25.8%. The lowest ones were found in peat - 5.0-12.2%. In summer, similarly to spring, the highest share of AP in TP was found in gyttja (average 40.9%). Much lower share was observed in: fibric peat (29.0%), sand (24.8%) and mursh (19.9%). The lowest values were recorded in hemic peat - average 7.4%. In autumn, the highest average share of AP in TP was found in sand (39.9%) and sapric peat (28.1%). However, noteworthy is that the lowest values were in gyttjas (9.4%). To sum up, the potential to release phosphorus from the studied soil formations can be presented in the following sequence: sand>gyttja>fibric peat>mursh>sapric peat>hemic peat. Such significant variation for this parameter indicates high spatial variability of the potential efficiency of soils as a phosphorus source. Murshes as a source of labile P in spring, one of biogens, pose threat to surrounding ecosystems because they may initiate eutrophication process. It should also be noted that labile P accumulates in the lower parts of the soil profile, especially gyttjas. In the context of sustainable use of these soils, and responsible land management, this parameter should be monitored seasonally.
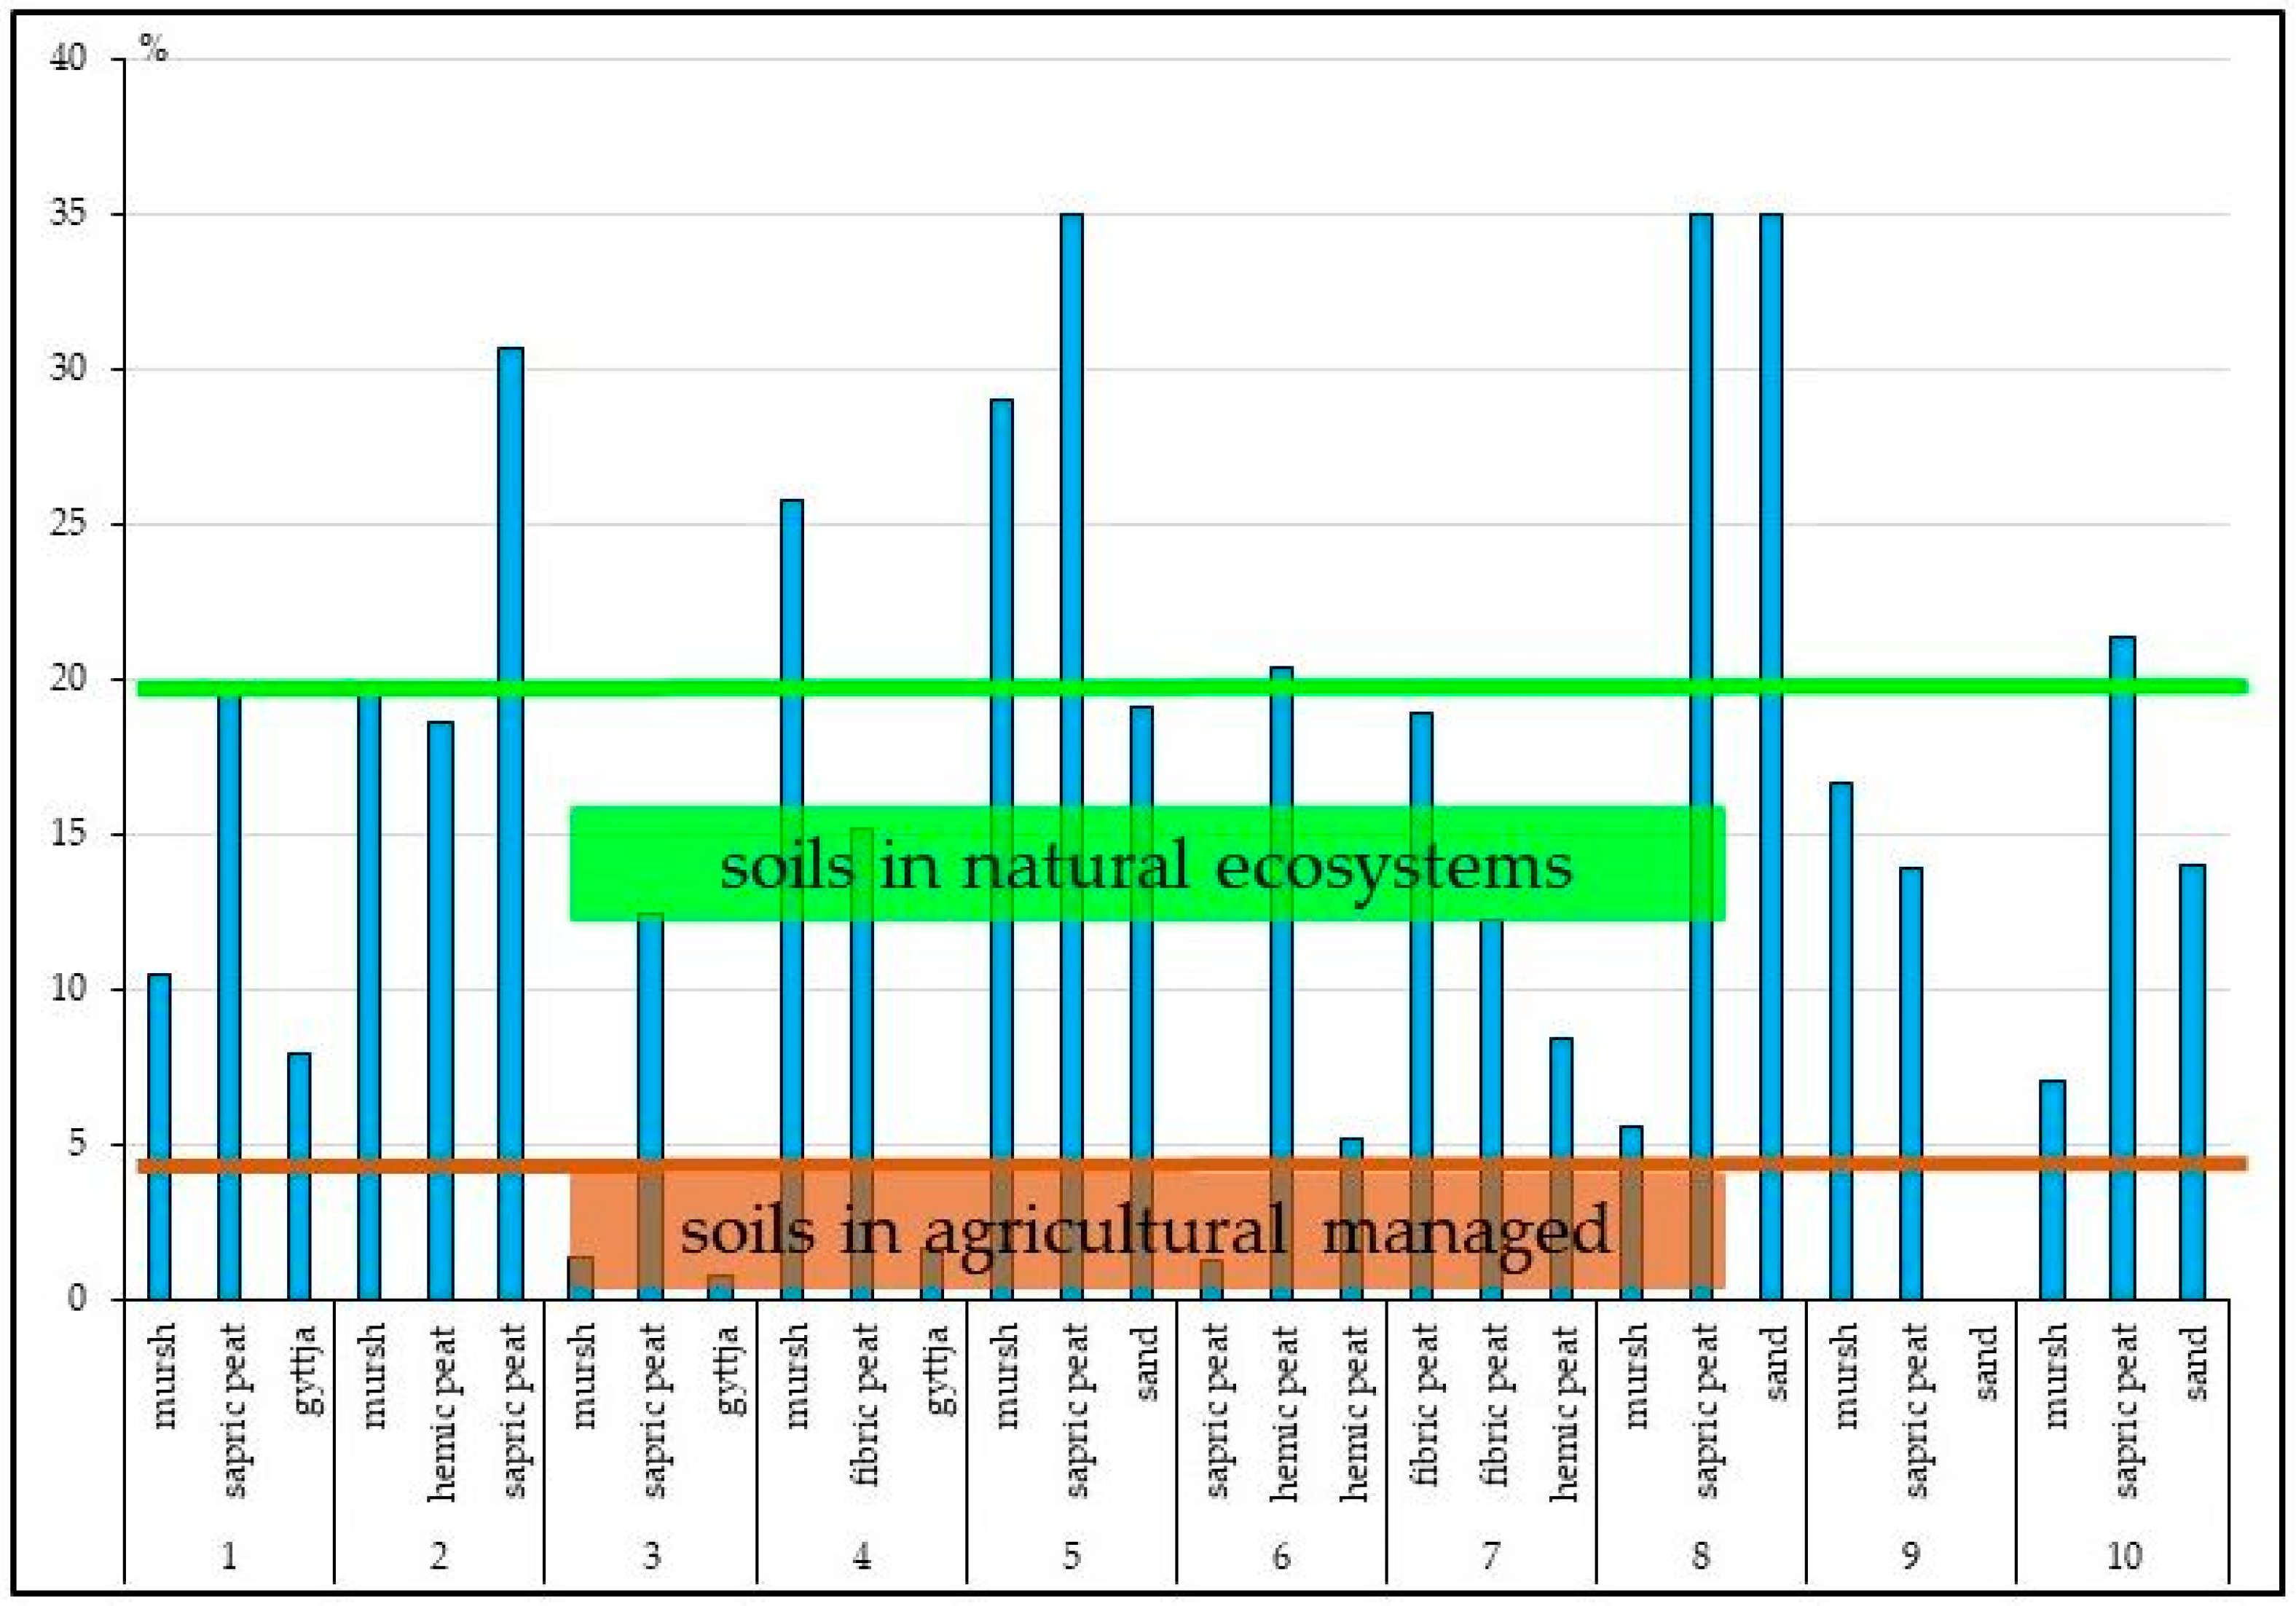
The comparison of N and P ratios in soils formations enables the interpretation of P stock in soils. The N/P ratio may be very different in soils due various contents of P in the soil parent material and soil fertilization. It is narrow in soils which are in agricultural use and wider in soils which are devoid anthropogenic impact (
Figure 4).
3.3. Soil phosphorus release risk
In hydrogenic soils located close to watercourses, significant amounts of phosphorus are released, carried away with biomass or washed (soluble phosphates) into surface and groundwater [
31,
34]. Improper air-water relations and improper use of these soils may cause unfavorable processes that may result in eutrophication of water reservoirs. Phosphorus is a component that determines the fertility of ecosystems. In soils, P occurs mainly in organic forms (phytin, nucleic acids, phospholipids) and in small amounts in mineral forms (minerals, ions). In Histosols, phosphorus in organic connections may constitute 50–90% of its total content, but in conditions of intense mineralization this amount may decrease by 1–2% per year [
35,
36]. Drainage of organic soils results in mineralization and leaching of phosphorus. Increasing the groundwater level to mitigate GHGs emissions from organic soils may result in the release and migration of phosphorus due to the reduction of iron and the release of phosphates associated with Fe [
37]. Rewetting of organic soils may result in leaching of phosphorus and accelerated eutrophication of aquatic ecosystems [
37]. Aldous at al. [
38] and Graham et al. [
39] reported the higher content of soil phosphorus in restored wetland soils compared to natural wetlands.
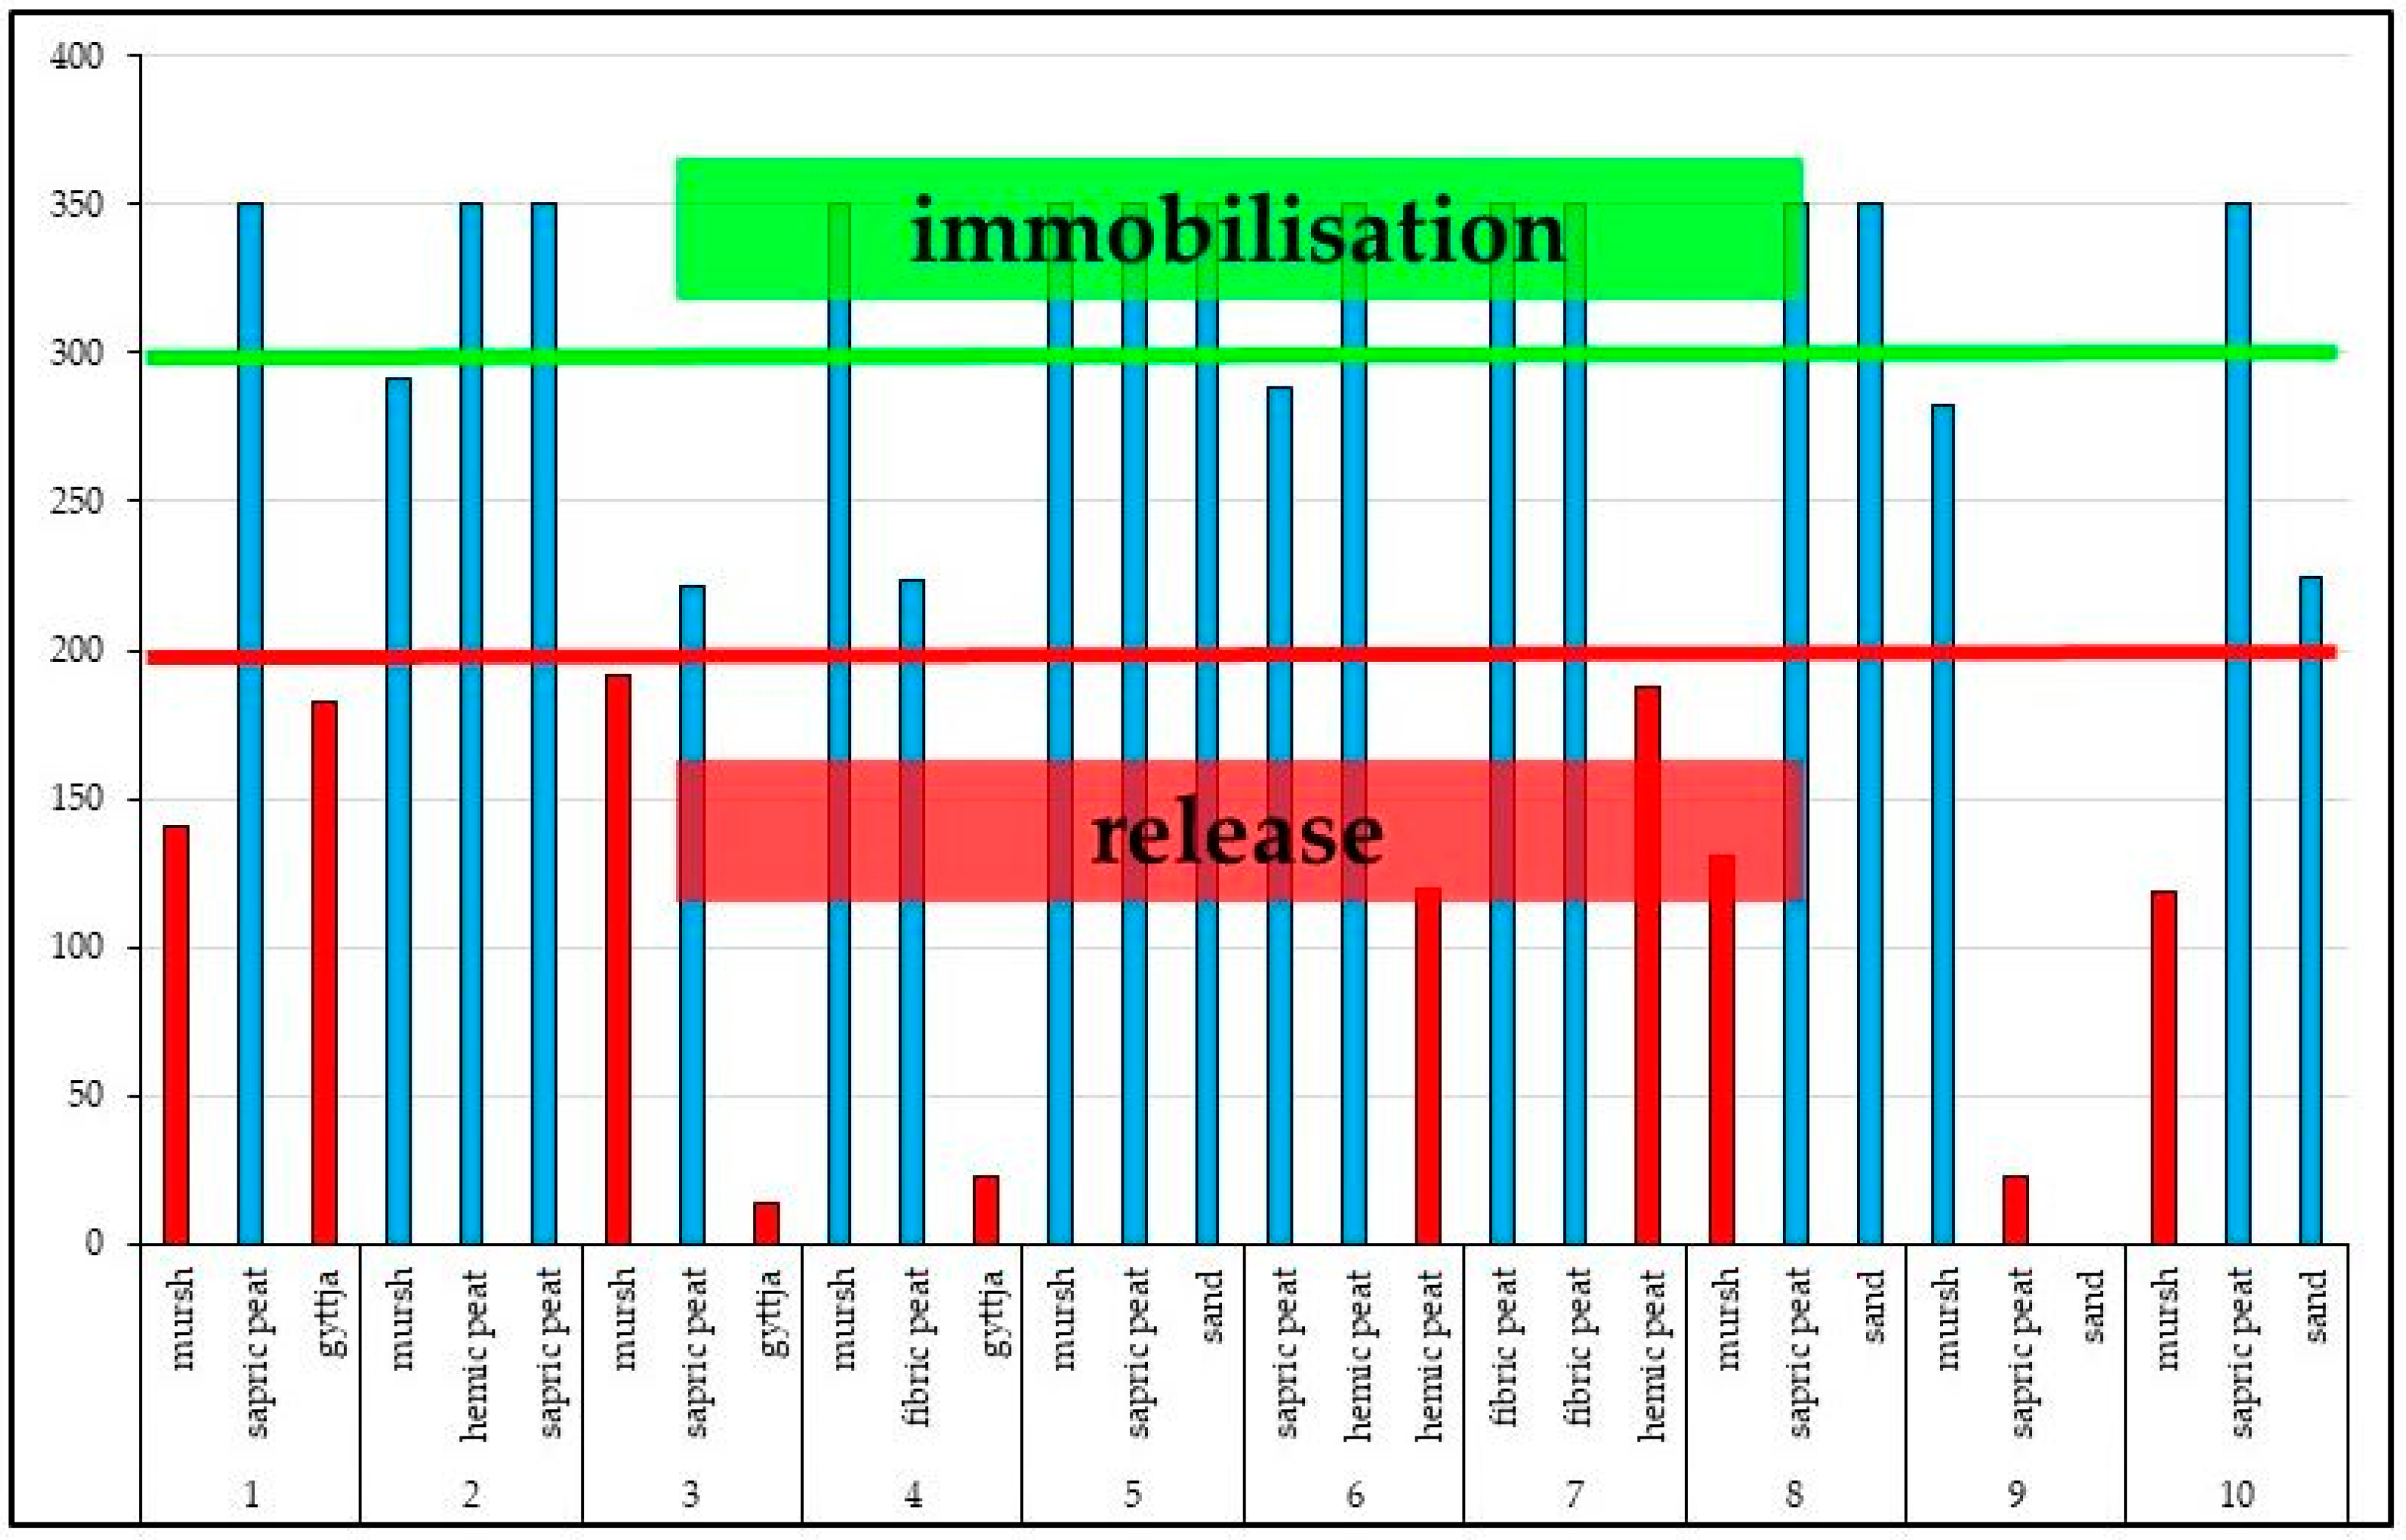
The release of phosphorus from organic compounds and binding by organic matter (immobilization) depend on the C:P ratio in plant residues and soil. If this ratio is wide (>300), phosphorus is bound, if it is narrower (150–200), P is released. The less phosphorus there is in the soil, the greater the probability of its immobilization in organic connections [
40]. In the examined soils, the C:P ratio ranged from 20 to 320. The relatively high content of mobile phosphorus in organic soils is a potential threat of P release into water. Narrow C/P ratio is typical for soil formations which have well decomposed and humified organic matter, i.e. mursh and sapric peat [
12,
14,
41,
42]. The TOC:TP ratio below 200 was also stated in gyttjas.
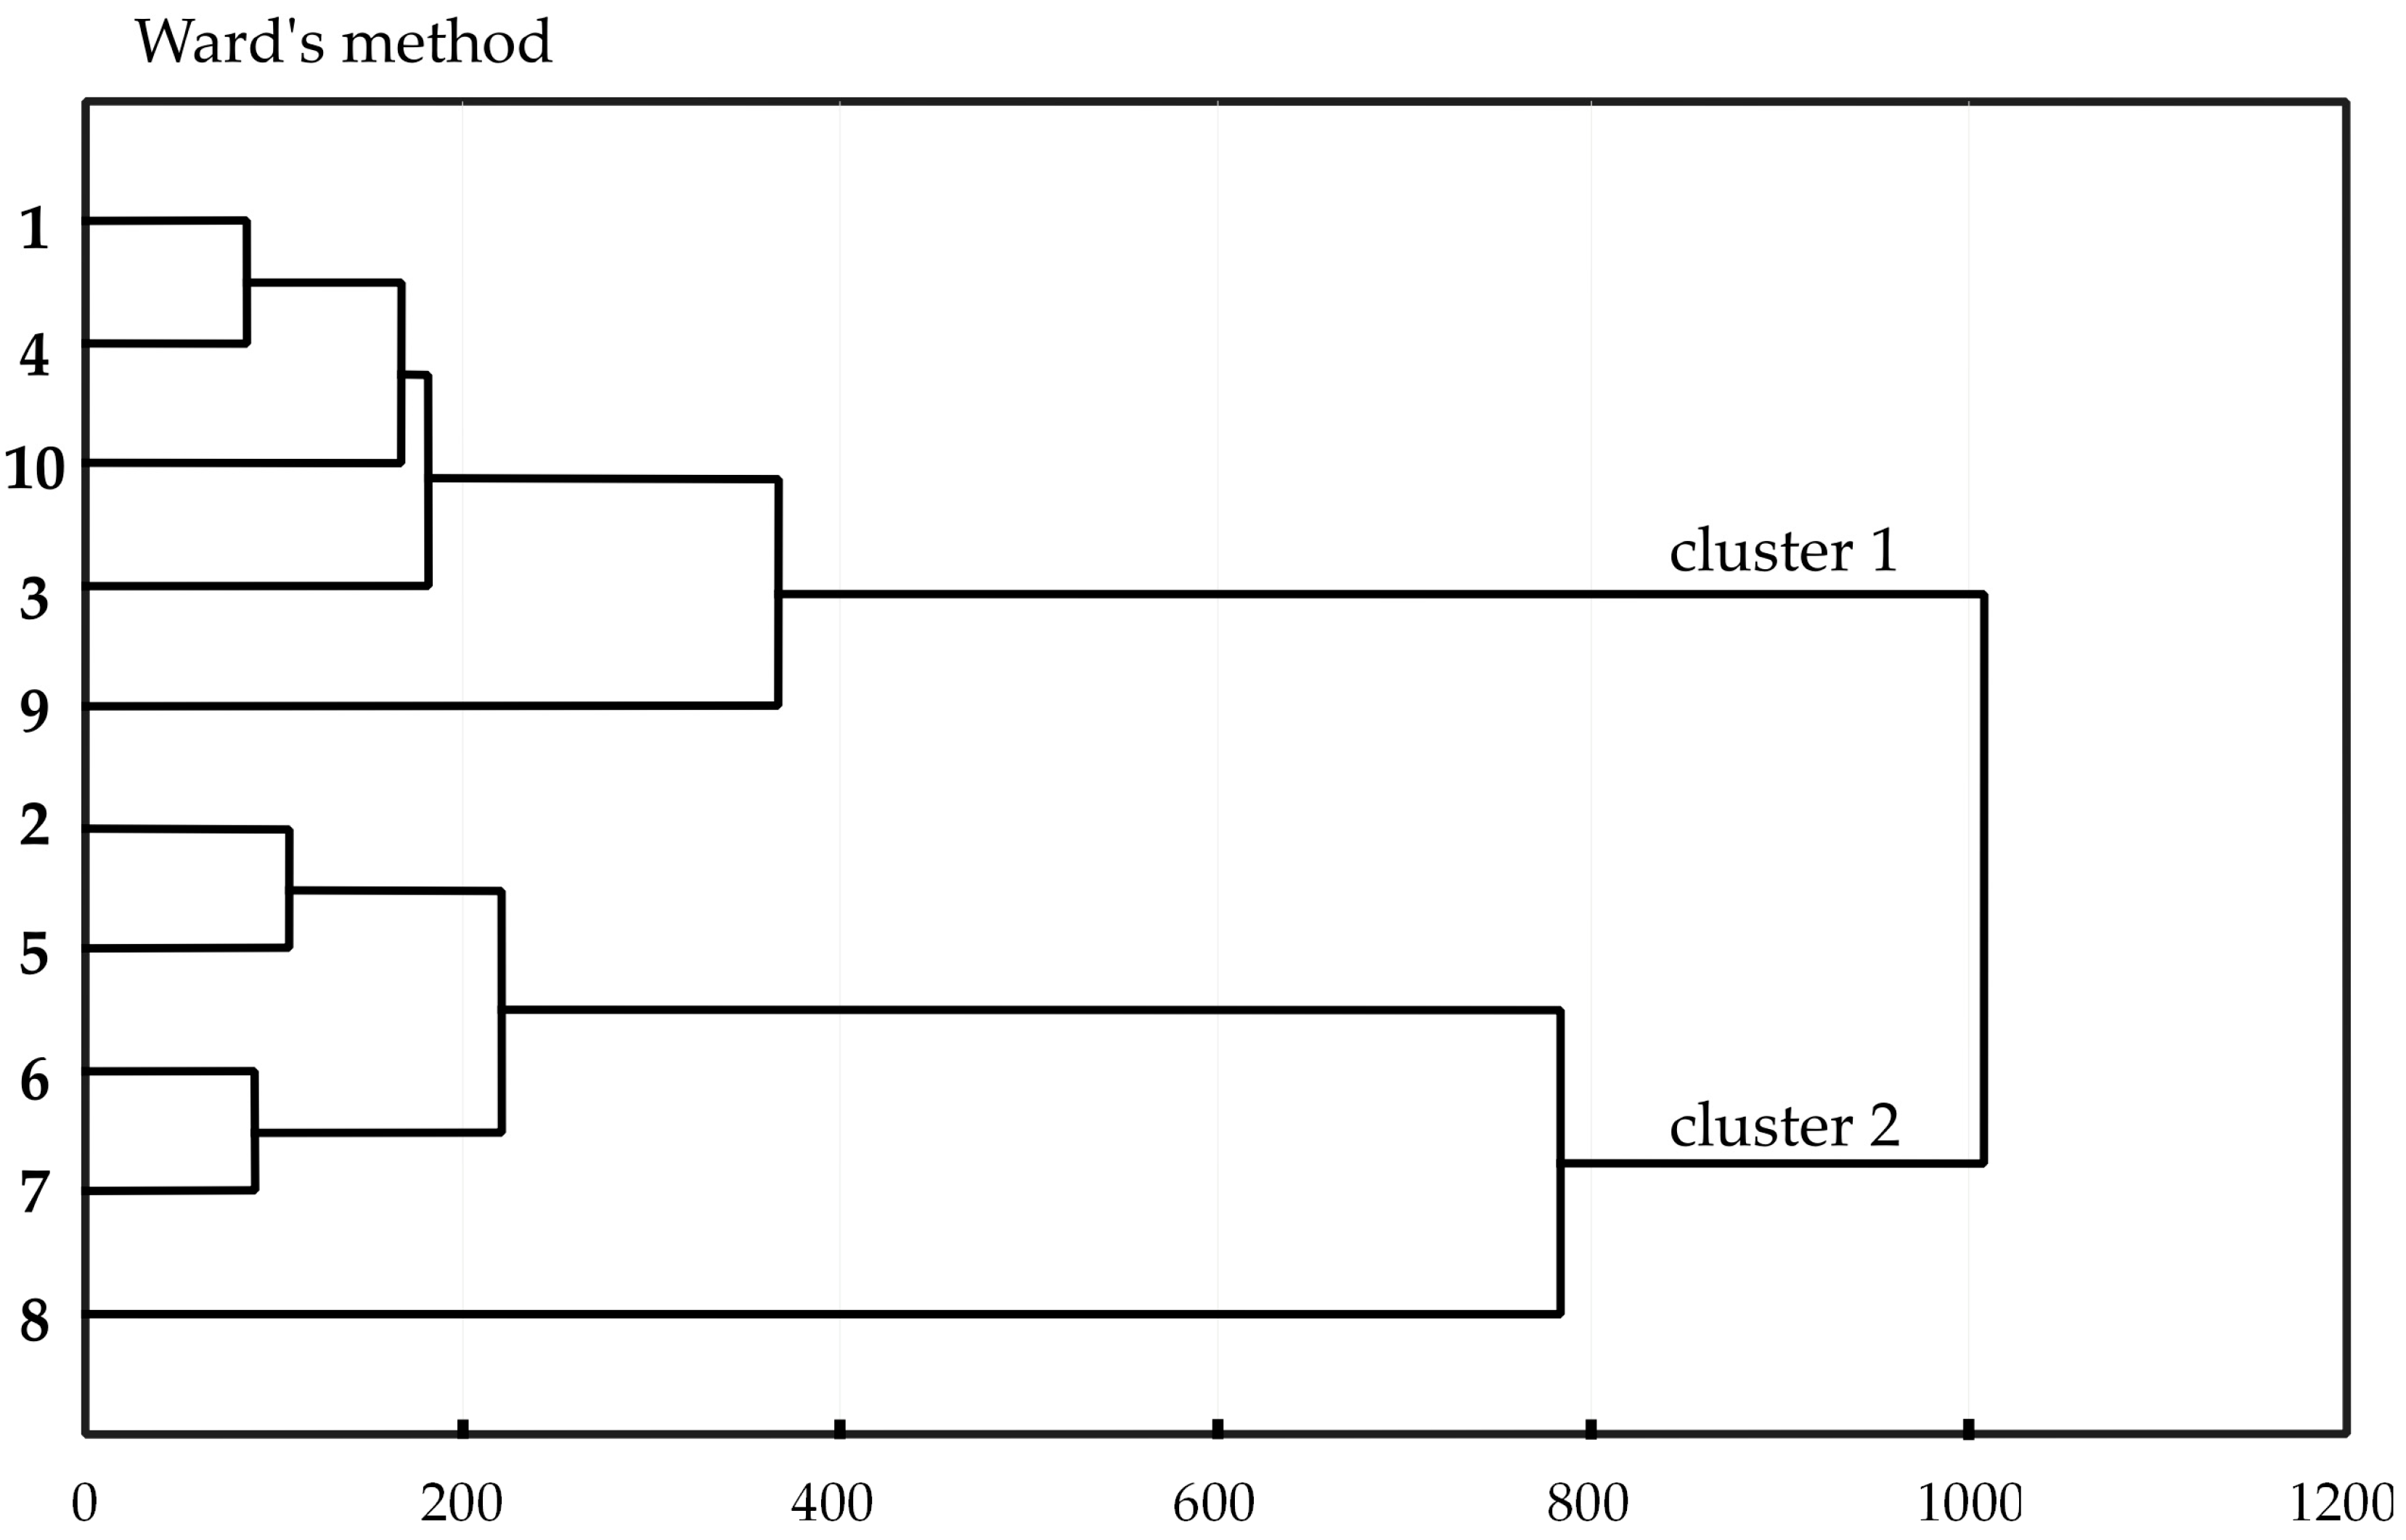
In the Ward’s method of clustering, based on soil properties, similarities between all 30 soil formations of 10 soil profiles were shown (
Figure 6). The most distinct differences were observed between the Murshic Sapric Histosol District Limnic (profile 1) and the Murshic Sapric Histosol Eutric (profile 8). Cluster 1 grouped the soils with mursh on the top and gyttja or sand in the subsoil (profiles 1, 3, 4, 9 and 10). Cluster 2 aggregated soils, with mursh or peat on the top and peat or sand below 100 cm.
Within cluster 1, two subgroups were identified: (i) soils at grassland, rewetted grassland and rewetted peatland (profile1, 3, 4 and 9), (ii) soil at the peatland (profile 10).
Within cluster 2 three subgroups were identified: (i) soils at grasslands and peatlands (profile 2 and 5), (ii) soils of re-wetted peatland and peatland (profile 6 and 7) and (iii) one soil profile (number 8) at the peatland.
The clustering did not enable to distinguish the soils basing on the soil use or different landcover due to similar use of soils and location of the soil profiles within one research area.
4. Conclusions
The studied soils contained various amounts of phosphorous in surface horizons and in the subsoils. The content of labile form of phosphorus was changing during the studied seasons and varying between the soil formations studied. The soils which were drained and had mursh in the top contained more labile form of phosphorus, especially in spring season. However the release rate or immobilization of P by these soil formations depended strongly on the C:P ratio, which was varying in murshes. Based on our study the highest risk of phosphorus release was stated for gyttjas, lying deeper in the soil profile.
Author Contributions
Conceptualization, P.S., B.K. and M.Ł.; methodology, P.S, B.K. and M.Ł; software P.S., B.K. and S.S.; validation, P.S. B.K., M.Ł., S.S. M.O. A.B and J.L.; formal analysis, P.S., B.K., S.S. and M.O.; investigation, P.S., B.K., M.Ł, S.S., M.O. A.B. and J.L.; resources, P.S., B.K., S.S. and M.O.; data curation, P.S., B.K., M.Ł. and S.S.; writing—original draft preparation, P.S. B.K., M.Ł., S.S., M.O. A.B. and J.L.; writing—review and editing, P.S. B.K., S.S. and M.O.; visualization, P.S. and B.K.; supervision, P.S. B.K., M.Ł., S.S., M.O. A.B. and J.L.; All authors have read and agreed to the published version of the manuscript.
Funding
University of Warmia and Mazury in Olsztyn, Faculty of Agriculture and Forestry, Department of Soil Science and Microbiology (grant No. 30.610.005-110) and Bydgoszcz University of Science and Technology, Laboratory of Soil Science and Biochemistry (grant BN 38/2019).
Data Availability Statement
Not applicable.
Conflicts of Interest
The authors declare no conflict of interest.
References
- Joosten, H., Tanneberger, F., Moen, A. (eds). Peatland use in Europe. Mires and Peatlands of Europe: Status, Distribution and Conservation. Schweizerbart Science Publishers, 2017.
- Jurasinski, G., Ahmad, S., Anadon-Rosell, A., Berendt, J., Beyer, F., Bill, R., Blume-Werry, G., Couwenberg, J., Günther, A., Joosten, H., Koebsch, F., Köhn, D., Koldrack, N., Kreyling, J., Leinweber, P., Lennartz, B., Liu, H.J., Michaelis, D., Mrotzek, A., Negassa, W., Schenk, S., Schmacka, F., Schwieger, S., Smiljanic, M., Tanneberger, F., Teuber, L., Urich, T., Wang, H.T., Weil, M., Wilmking, M., Zak, D., Wrage-Mönnig, N., From Understanding to Sustainable Use of Peatlands: The WETSCAPES Approach. Soil Systems, 2020, 4Approach. [CrossRef]
- Tanneberger, F., Moen, A., Barthelmes, A., Lewis, E., Miles, L., Sirin, A., Tegetmeyer, C., Joosten, H. Mires in Europe-Regional Diversity, Condition and Protection. Diversity-Basel. 2021, 13. [CrossRef]
- Joosten, H., Clarke, D., Wise use of mires and peatlands. International Mire Conservation Group and International Peat Society, 2002, Totnes.
- Riet Van De, B.P., Hefting, M.M., Verhoeven, J.T.A. Rewetting drained peat meadows: risks and benefits in terms of nutrient release and greenhouse gas exchange. Water Air and Soil Pollution. 2013, 224, 1440. [CrossRef]
- Schrier-Uijl, A.P., Kroon, P.S., Hendriks, D.M.D., Hensen, A., Van Huissteden, J., Berendse, F., Veenendaal, E.M. Agricultural peatlands: towards a greenhouse gas sink - a synthesis of a Dutch landscape study. Biogeosciences. 2014, 11, 4559-4576. [CrossRef]
- Strack, M., Davidson, S.J., Hirano, T., Dunn, C. The Potential of Peatlands as Nature-Based Climate Solutions. Current Climate Change Reports. 2022, 8, 71-82. [CrossRef]
- Kalisz, B., Lachacz, A., Glazewski, R., Effects of peat drainage on labile organic carbon and water repellency in NE Poland. Turkish Journal of Agriculture and Forestry. 2015, 39, 20-27. [CrossRef]
- Kalisz, B.; Łachacz, A. Relations between labile and stable pool of soil organic carbon in drained and rewetted peatlands. Journal of Elementology, 2023; 28, 263–278. [Google Scholar]
- Łachacz, A. , Kalisz, B., Sowiński, P., Smreczak, B., Niedźwiecki, J. Transformation of organic soils due to artificial drainage and agricultural use in Poland. Agriculture. 2023, 13, 634. [Google Scholar] [CrossRef]
- Sinaj, S. , Stamm, C. , Toor, G.S., Condron, L.M., Hendry. T., Di H.J., Cameron. K.C., Frossard, E. Phosphorus exchangeability and leaching losses from two grassland soils. J Environ Qual. 2002, 31, 319–30. [Google Scholar] [CrossRef]
- Becher, M. , Pakula, K., Jaremko, D., Phosphorus Accumulation in the Dehydrated Peat Soils of the Liwiec River Valley. Journal of Ecological Engineering, 2020; 21, 213–220. [Google Scholar] [CrossRef]
- Meissner, R., Leinweber, P., Rupp, H., Shenker, M., Litaor M.I., Robinson S., Schlichting A., Koehn J. Mitigation of diffuse phosphorus pollution during rewetting of fen peat soils: A Trans-European case study. Water, Air, and Soil Pollution. 2008, 188, 1–4, 111–126. [CrossRef]
- Becher, M. , Pakuła, K., Pielech, J., Trzcińska, E. Phosphorus resources and fractions in peat-muck soils. Environmental Protection and Natural Resources 2018, 29, 1–6. [Google Scholar] [CrossRef]
- Sapek, A. , Sapek, B., Chrzanowski, S., Urbaniak, M. Nutrient mobilisation and losses related to the groundwater level in low peat soils. International Journal of Environment and Pollution. 2009, 37, 398–408. [Google Scholar] [CrossRef]
- Sapek, B. Phosphorus sorption properties of deposits from peat-muck soil profile in the Kuwasy object. Journal of Water and Land Development. 2012, 16, 61–66. [Google Scholar] [CrossRef]
- Kinsman-Costello, L. E.; Hamilton, S. K.; O’Brien, J. M.; Lennon, J. T. Phosphorus release from the drying and reflooding of diverse shallow sediments. Biogeochemistry, 1007. [Google Scholar]
- Zak, D. , Gelbrecht, J., Zerbe, S., Shatwell, T., Barth, M., Cabezas, A., Steffenhagen, P. How helophytes influence the phosphorus cycle in degraded inundated peat soils – Implications for fen restoration. Ecological Engineering 2014, 66, 82–90. [Google Scholar] [CrossRef]
- Zak, D. , Payer, B., Augustin, J., Gelbrecht, J. Phosphorus mobilization in rewetted fens: the effect of altered peat properties and implications for their restoration. Ecological Applications, 2010; 20, 1336–1349. Available online: https://www.jstor.org/stable/25680382.
- Schneider, K.D. , Martens, J. R.T., Zvomuya, F., Reid, D.K., Fraser, T.D., Lynch, D.H., O'Halloran, I.P., Wilson, H.F. Options for Improved Phosphorus Cycling and Use in Agriculture at the Field and Regional Scales. Journal of Environmental Quality. 2019, 48, 1247–1264. [Google Scholar] [CrossRef]
- Kieckbusch, J.J. , Schrautzer, J. Nitrogen and phosphorus dynamics of a re-wetted shallow-flooded peatland. Science of the Total Environment, 2007; 380, 3–12. [Google Scholar] [CrossRef]
- Meissner, R. , Rupp, H., Seeger, J., Leinweber, P. Strategies to mitigate diffuse phosphorus pollution during rewetting of fen peat soils. Water Science and Technology, 2010; 62, 123–131. [Google Scholar] [CrossRef]
- Niedermeier, A., Robinson, J.S. Phosphorus dynamics in the ditch system of a restored peat wetland. Agriculture Ecosystems & Environment. 2009, 131, 161-169. [CrossRef]
- Lemkowska, B. , Sowiński P., Pożarski, K., Changes in soil trophic conditions as a treat to natural functions of the Ustnik reserve. Water-Environment-Rural Areas. 2010; 10, 73–87. [Google Scholar]
- McDowell, R.W., Sharpley, A.N., Condron, L.M., Haygarth, P.M, Brookes, P.C Process controlling soil phosphorus release to runoff and implications for agricultural management [in] Phosphorus in action. Biological processes in soil phosphorus cycle. E.K. Buenemann, A. Oberson, E. Frossard (Eds). Series: Soil Biology, Springer-Verlag, Berlin, Heidelberg, 2011, 100, 269-284.
- Sapek, B. Soil phosphorus accumulation and release – sources, processes, causes. Water-Environment-Rural Areas. 2014, 14, 77–100. (In Polish with English summary).
- Jordan, S. , Velty, S., Zeitz, J. The influence of degree of peat decomposition on phosphorus binding forms in fens. Mires and Peat, 2007, 2, 1–10.
- IUSS Working Group WRB. World Reference Base for Soil Resources. In International Soil Classification System for Naming Soils and Creating Legends for Soil Maps, 4th ed.; International Union of Soil Sciences (IUSS): Vienna, Austria, 2022. [Google Scholar]
- Saltali, K. , Nedirli, A. Phosphorus sorption by gyttja and its effect on the pH value and phosphorus in acidic soils. Turkish Journal of Agriculture and Forestry 2021, 54, 402–410. [Google Scholar] [CrossRef]
- Jarnuszewski, G. , Meller, E. Total content of macroelements and trace elements in Holocene calcareous gyttja from the post-bog area of north-western Poland. Soil & Water Res. 2019, 14, 40-46. [CrossRef]
- Frossard, E. , Skrabal, P., Sinaj, S., Bangerter, F., Traore, O. Forms and exchangeability of inorganic phosphate in composted solid organic wastes. Nutrient Cycling in Agroecosystems 2022, 62, 103–113. [Google Scholar] [CrossRef]
- Brown, J.B. , Sprague, L.A., Dupree, J.A., Nutrient Sources and Transport in the Missouri River Basin, with Emphasis on the Effects of Irrigation and Reservoirs. J Am Water Resour Assoc. 2011, 47, 1034–1060. [Google Scholar] [CrossRef]
- Sapek, A. Dispersion of the phosphorus from agriculture and potential risks to the environment. Zeszyty Problemowe Postępów Nauk Rolniczych. 2001, 476, 269-280. (In Polish with English summary).
- Sapek, A. , Sapek, B., Chrzanowski, S., Nadany, P., Urbanik, M.. Leaching of phosphate from dewatered peat soil after their renaturalization - the “PROWATER” project results. Soil Science Annual. 2004, 40, 173-183. (In Polish with English summary).
- Sapek, A. Phosphorus fertilization and its environmental consequences. A debate. Water-Environment-Rural Areas. 2008, 8, 127–137. (In Polish with English summary).
- Sapek, A. , Reasons for the increasing of phosphorus pool in Poland's soils. Soil Science Annual. 2007, 58, 110–118. (In Polish with English summary).
- 37. Forsmann ,D. M., Kjaergaard, C. Phosphorus release from anaerobic peat soils during convective discharge – Effect of soil Fe: P molar ratio and preferential flow. Geoderma, 2014, 223–225, 21–32. [CrossRef]
- Aldous, A.; McCormick, P.; Ferguson, C.; Graham, S.; Craft, C. Hydrologic regime controls soil phosphorus fluxes in restoration and undisturbed wetlands. Restoration Ecology, 2005, 13, 341-347. [CrossRef]
- Graham, S.A. , Craft, C. B., McCormick, P.V., Aldous, A. Forms and accumulation of soil P in natural and recently restored peatlands-Upper Klamath Lake, Oregon, USA. Wetlands, 2005, 25, 594–606. [CrossRef]
- Kalembasa, D. , Becher, M. The content of phosphorus in grassland soils of the Liwiec river valley on Siedlce Upland. Water-Environment-Rural Areas. 2010, 10, 107–117, (In Polish with English summary). [Google Scholar]
- Otabbong, E. ,Fristedt, A., Otabbong I. Phosphorus status, disposition and seasonal dynamics in the Swedish Kristianstad Riparian Histosol Wetlands. Acta Agriculturae Scandinavica, Soil & Plant Science, 2009; 59, 179–188. [Google Scholar] [CrossRef]
- Worrall, F. , Moody, C.S., Clay, G.D., Burt, T., Rose, R. The total phosphorus budget of a peat-covered catchment. Journal of Geophysical Research: Biogeosciences, 2016, 121, 1814–1828,. [CrossRef]
|
Disclaimer/Publisher’s Note: The statements, opinions and data contained in all publications are solely those of the individual author(s) and contributor(s) and not of MDPI and/or the editor(s). MDPI and/or the editor(s) disclaim responsibility for any injury to people or property resulting from any ideas, methods, instructions or products referred to in the content. |
© 2024 by the authors. Licensee MDPI, Basel, Switzerland. This article is an open access article distributed under the terms and conditions of the Creative Commons Attribution (CC BY) license (http://creativecommons.org/licenses/by/4.0/).
