1. Introduction
Sugarcane is a vital bioenergy crop due to its rapid growth and high energy balance, representing a relevant alternative in the production of biofuels [
1,
2,
3]. The high concentration of sucrose in its stalks mostly meets the demand of the sugar-energy sector [
4], which favors replacing fossil fuels and minimizing the anthropogenic impact on the planet.
Brazil ranks first in global sugarcane production, with production estimated at 677.6 million tons in the 2023/24 harvest, representing an increase of 10.9% compared to the 2022/23 harvest, which makes us a country with great potential for exporting biofuels [
5]. Favorable soil and climate conditions and the use of technologies have made it possible to increase the efficiency of inputs, reduce production costs, and increase the productivity of land and human resources [
6,
7].
Since the dawn of sugarcane cultivation, sugarcane fields have been established by planting billets containing buds that provide the sprouting of new plants [
4,
8]. In this method, a high density of billets is necessary to ensure adequate sprouting, contributing to the reduction of stalks used for sugar and ethanol production [
9]. Brazilian researchers have developed a method of planting pre-sprouted seedlings (PSS) to reduce the material used. This method consists of individualizing the buds in trays so that the sprouts emerge before planting, which reduces the number of stalks used per area in this operation by 90% [
9,
10,
11].
The use of PSS as propagation material has stood out due to the efficiency promoted through varietal guarantee and high health [
10,
12,
13,
14], especially in association with the MEIOSI (Simultaneously Occurring Interrotational Method) system, due to the smaller production scale and operational advantage [
15,
16].
However, PSS have reduced nutrient and water reserves compared to the conventional method and, consequently, are more susceptible to abiotic stresses, especially water restriction [
17]. Therefore, water supplementation is recommended after transplanting PSS from plant seedling nurseries to the field since there is high plant mortality in planting seasons with low rainfall [
10,
17,
18].
Furthermore, as the sugarcane cycle can vary from 12 to 18 months, this crop is susceptible to climatic adversities throughout the year. Scarce water supply is the main limiting factor to sugarcane’s good growth and development [
4,
19], with the beginning of development being the most sensitive period to water restriction [
20,
21]. Therefore, technologies that mitigate water restrictions are required to form new sugarcane fields that meet the demand for sugar, biofuels, and by-products even under limited resource availability [
22]. The current climate change scenario, characterized by increased temperature and reduced precipitation and aggravated by the burning of fossil fuels, supports these new technologies [
1,
23,
24,
25].
An alternative that has shown positive results is using plant growth-promoting bacteria (PGPB). Among the known species, the most abundant belong to the genus
Bacillus [
26,
27,
28]. Many of these bacteria can produce phytohormones, antioxidant enzymes, and siderophores, in addition to promoting the availability of nutrients through nitrogen fixation and solubilization of phosphate, potassium, and micronutrients [
29,
30,
31,
32,
33,
34], inducing tolerance to environmental stresses, such as water deficiency [
34,
35,
36].
In this sense, increases in sprouting speed and root and shoot dry matter accumulation of sugarcane PSS have already been observed under the association of PGPB and nitrogen doses [
37]. Furthermore, the increase in nutrient concentration in the shoot, the increase in photosynthetic efficiency and water use, as well as the stimulation of root system growth after inoculation with
Bacillus subtilis under water deficit conditions have already been reported in sugarcane [
36,
38]. Tolerance to water deficiency induced by
Bacillus licheniformis has also been reported in maize [
39] and potato [
40], mainly due to increased water use efficiency, CO
2 assimilation, and greater production of antioxidant enzymes.
The association of two
Bacillus species is a promising approach to improving plant growth, given the particularities present in each species and the increased spectrum of action and specificity [
41,
42]. However, there are still no studies involving the association of
Bacillus licheniformis and
Bacillus subtilis in sugarcane propagated by PSS in the field.
Considering the importance of seeking plant tolerance to water stress, the advance in the use of PSS in the formation of new sugarcane fields, the biological mechanisms of action of these microorganisms, and the potential of the association of two species of the Bacillus genus, this research hypothesizes that the inoculation of PSS, during its formation in the plant seedling nursery, with Bacillus licheniformis and Bacillus subtilis will increase the survival rates and growth of seedlings after transplanting in the field, as well as improving the nutritional status, resulting in higher multiplication rates for MEIOSI under different water regimes.
Therefore, this study aimed to evaluate the survival, growth, nutrient content, and yield of sugarcane plants from a pre-sprouted seedling nursery treated with Bacillus licheniformis strain FMCH001 (DSM32154) and Bacillus subtilis strain FMCH002 (DSM32155) under different water regimes.
4. Discussion
The establishment method using PSS is under development in Brazil [
18], and its expansion is associated with the significant growth of the MEIOSI production system [
60]. The MEIOSI system consists of planting central rows of sugarcane in consortium with other crops of economic interest. After harvesting the crops grown between the rows, the sugarcane in the main rows is used as propagation material for the rest of the area [
15,
16,
58]. The search for propagation materials that present varietal guarantee and better health conditions drives the expansion of PSS planting in this production system. In addition, sugarcane propagated by this method has nutritional and tillering characteristics similar to the conventional method [
18].
However, despite the reduction in the propagation material volume for the MEIOSI central rows, PSS have low water and nutrient reserves, a poorly developed root system, and low leaf area when they are transplanted to the field [
17], which makes water supplementation indispensable for plant establishment, since the absence of irrigation leads to high plant mortality and the need for replanting [
18].
This study showed that plant growth-promoting bacteria (PGPB) from the genus
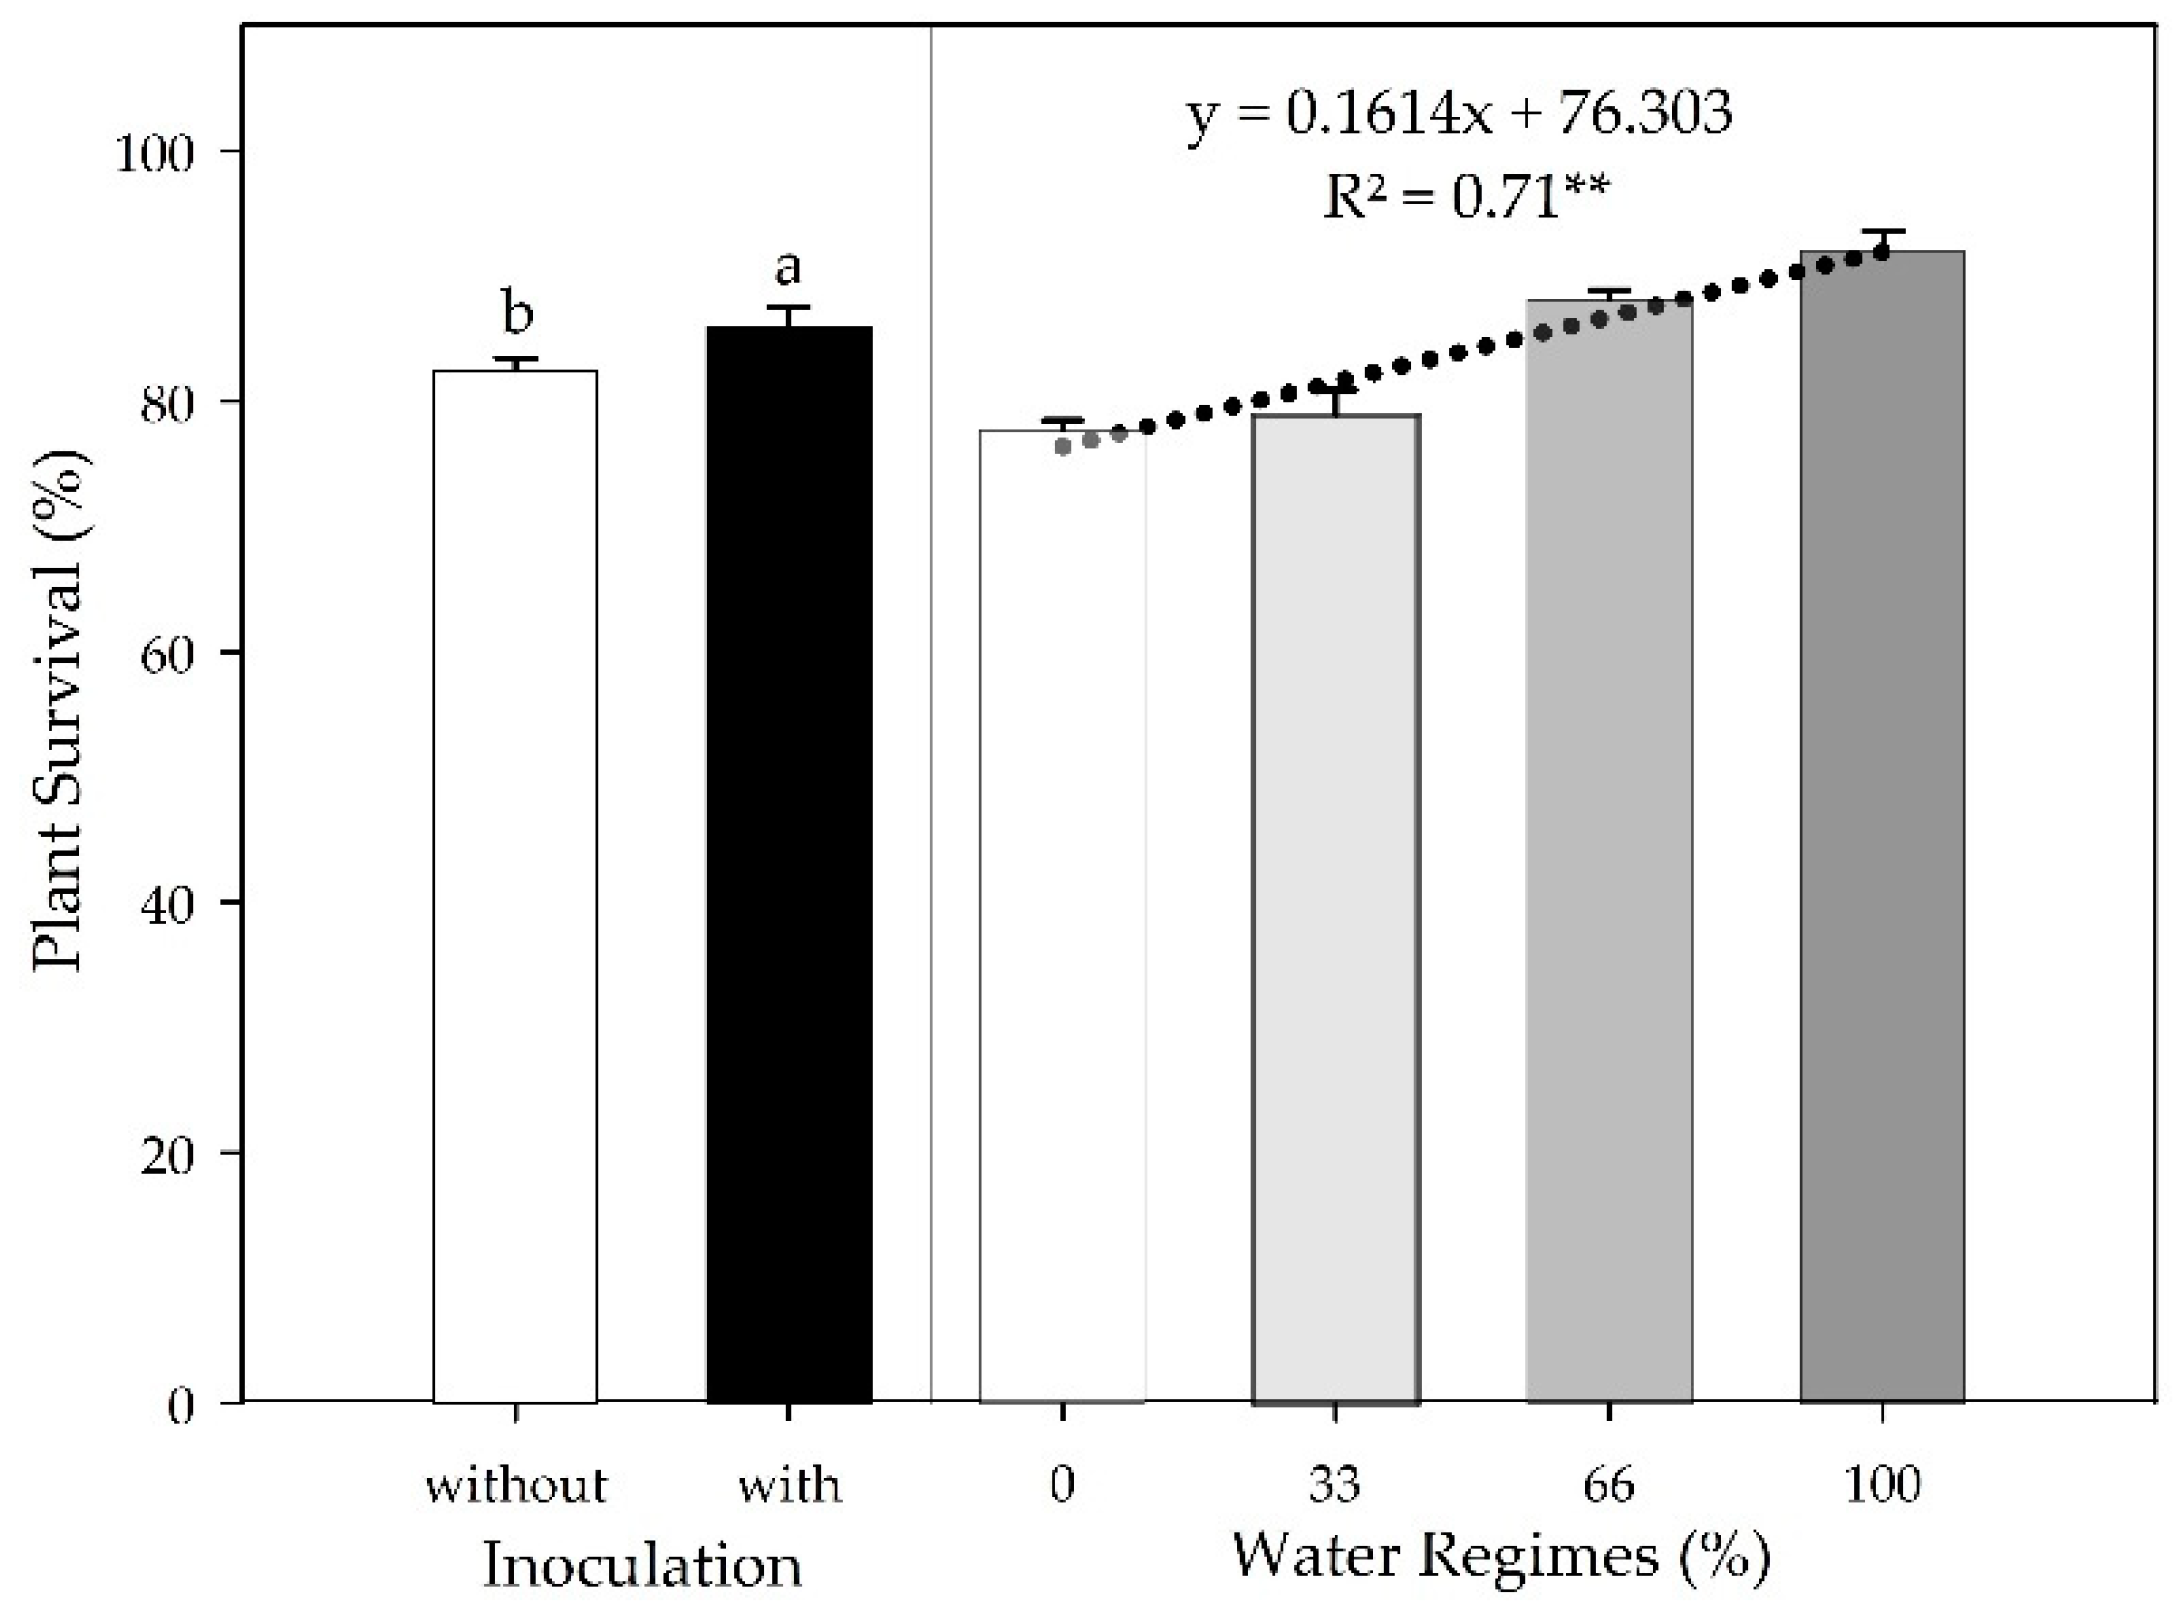
Bacillus spp. can help with this problem. The increase in plant survival promoted by PGPB inoculation at 30 DAT suggests that the inoculated plants were influenced by the biological mechanisms already reported by
B. licheniformis [
35,
61] and
B. subtilis [
38,
62,
63,
64,
65,
66], such as the production of phytohormones, siderophores and exopolysaccharides, biofertilization, and remediation of abiotic stresses. In the absence of inoculation, PSS survival of 82.4% corroborates with the percentage found by Almeida Neto et al. [
67]. Although no other studies evaluate PSS survival in the field under the use of microorganisms, studies report the action of PGPB in improving rooting and nutritional aspects [
37,
68,
69,
70,
71].
Inoculation of
B. licheniformis and
B. subtilis can be a promising approach to improving plant growth, as the particularities of each species allow for a greater spectrum of action on signaling pathways, nutrient solubilization, and phytohormone production [
38,
41,
42,
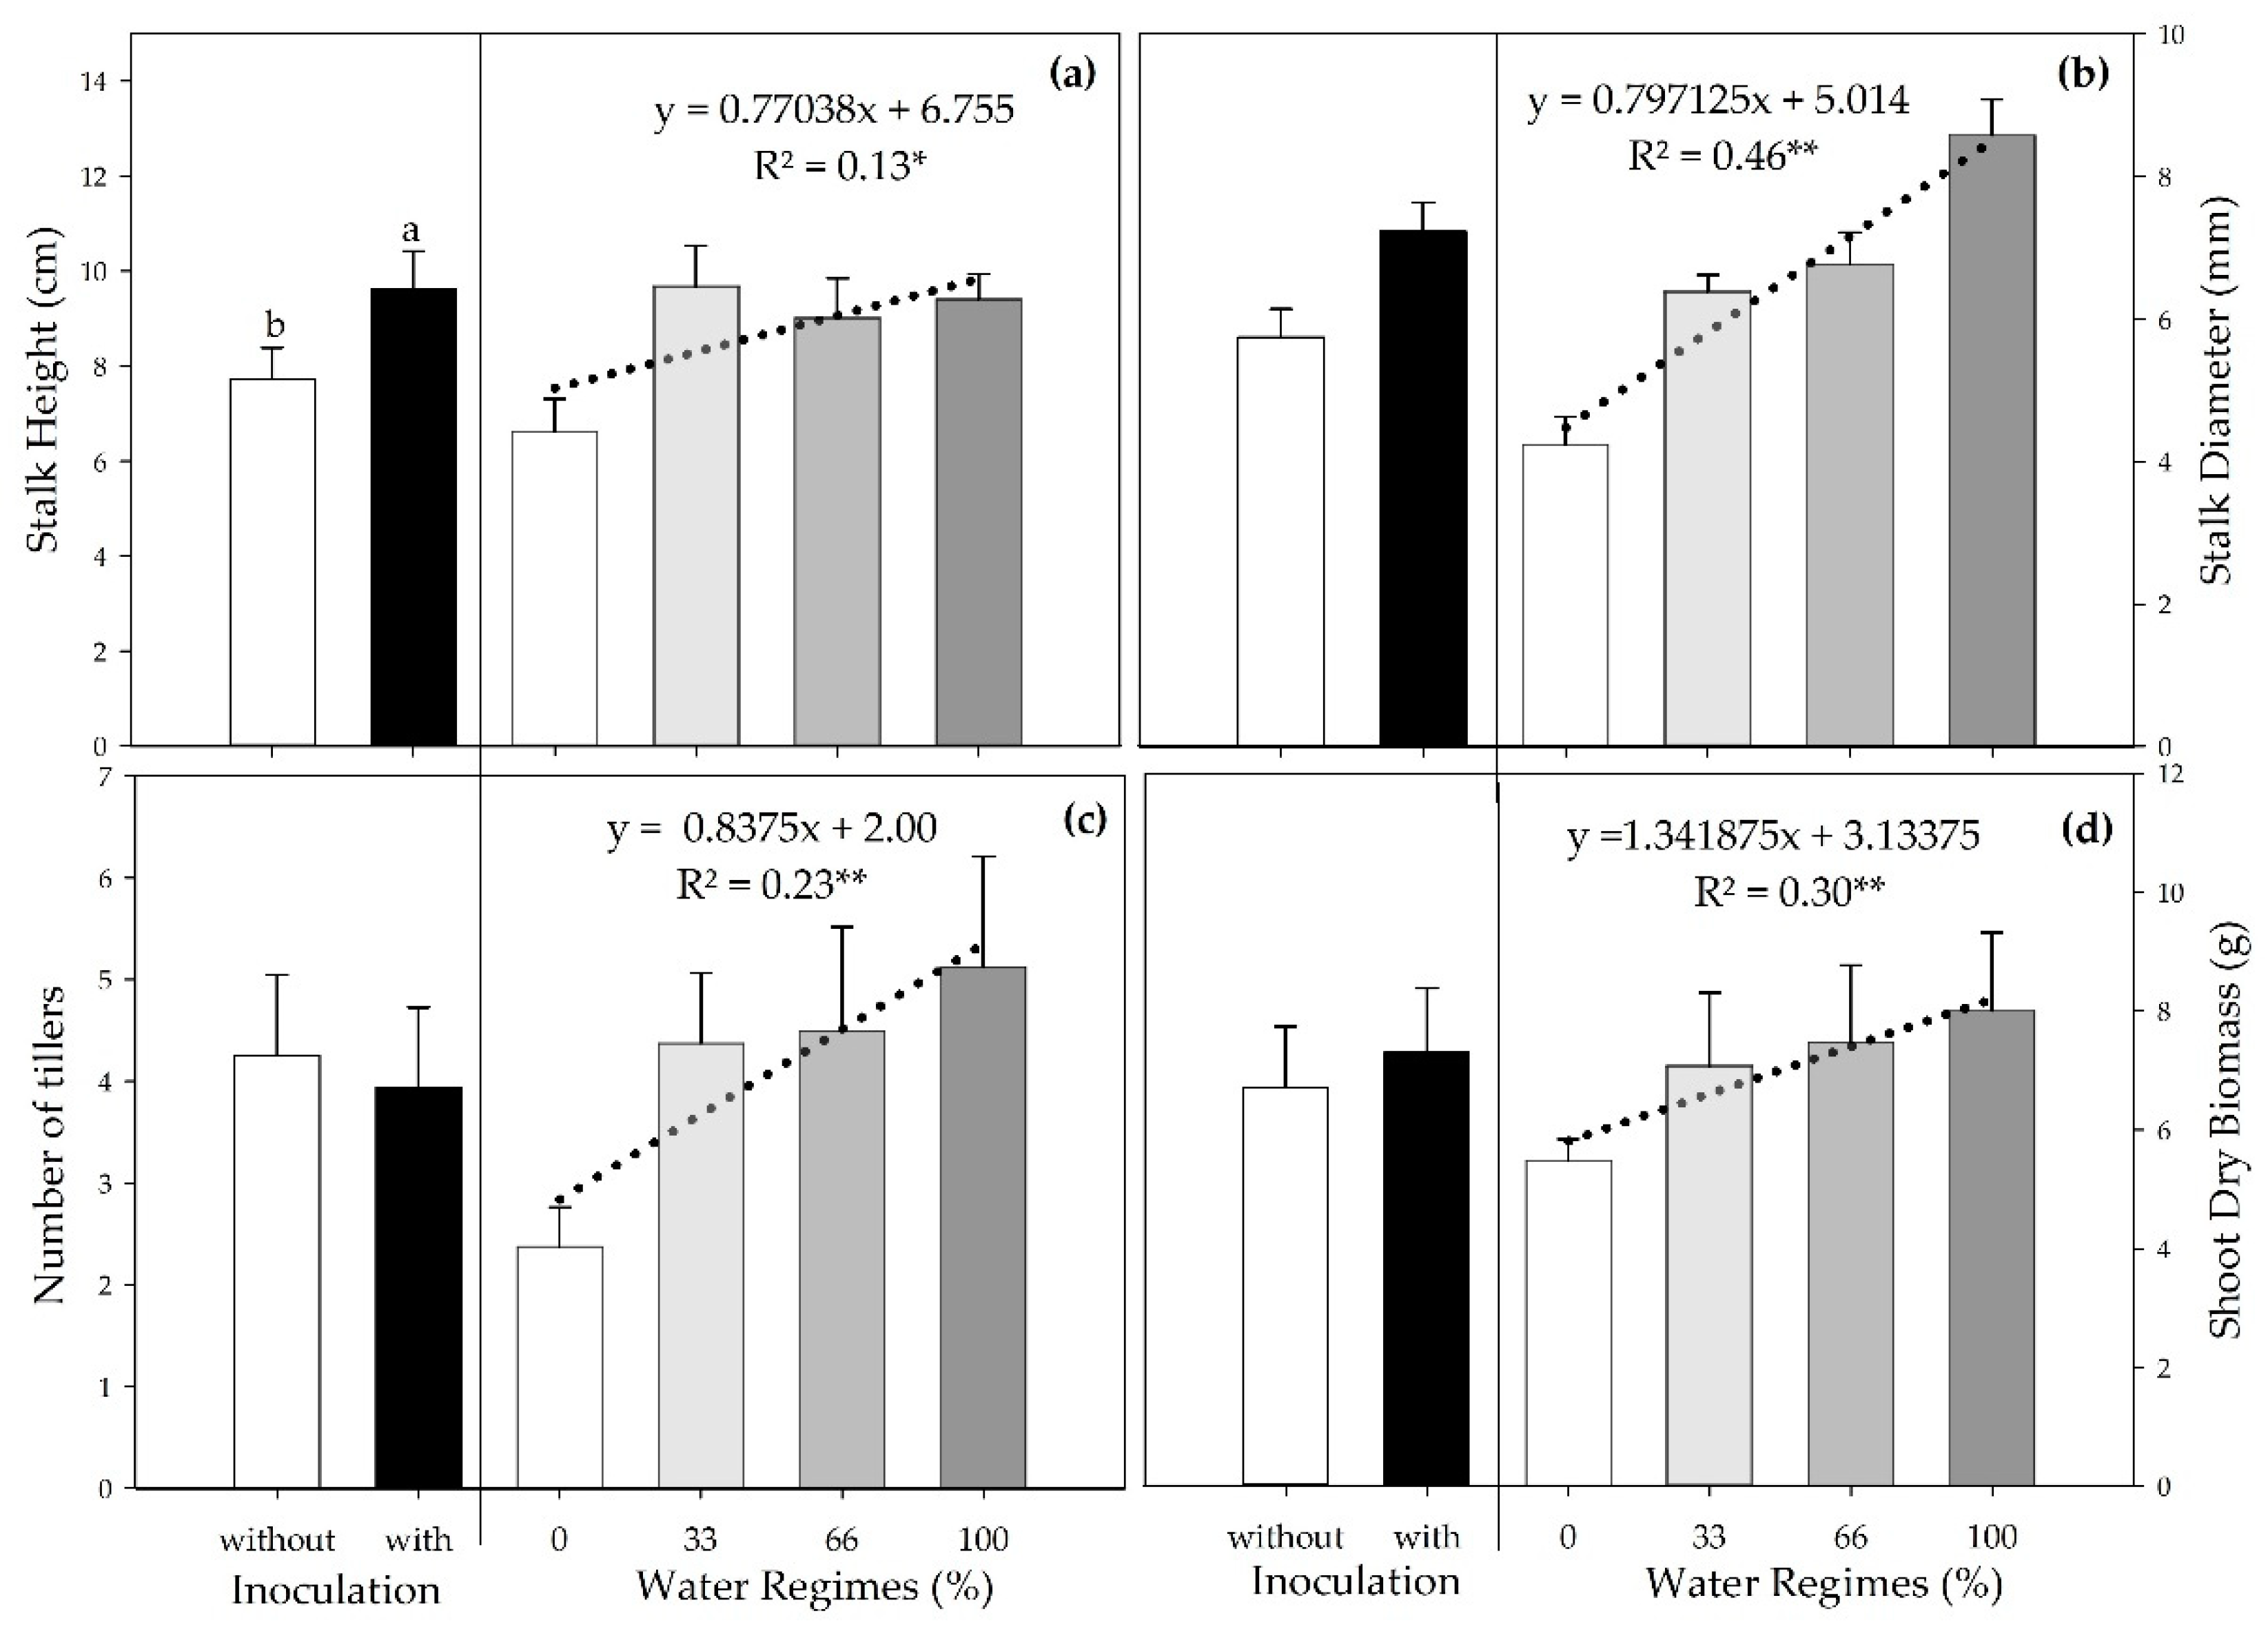
72]. Our results show that inoculation promoted an increase in stalk height (SH) at 63 DAT, a result similar to that found by Brandi et al. [
41], who reported that the association of two bacteria of the
Bacillus genus increased the sugarcane height. In contrast, individual inoculation of each species did not raise this parameter. However, PGPB inoculation did not affect the number of tillers (NT), stalk diameter (SD), and shoot dry biomass (SDB), a result that was also observed by Wang et al. [
73] and Ferreira et al. [
70].
Water is indispensable for plant development and is involved in metabolic processes. Hence, a decrease in water supply directly and indirectly interferes with various processes related to plant growth and development [
74,
75], which explains the increase in SH, SD, NT, and SDB as the water supply increased.
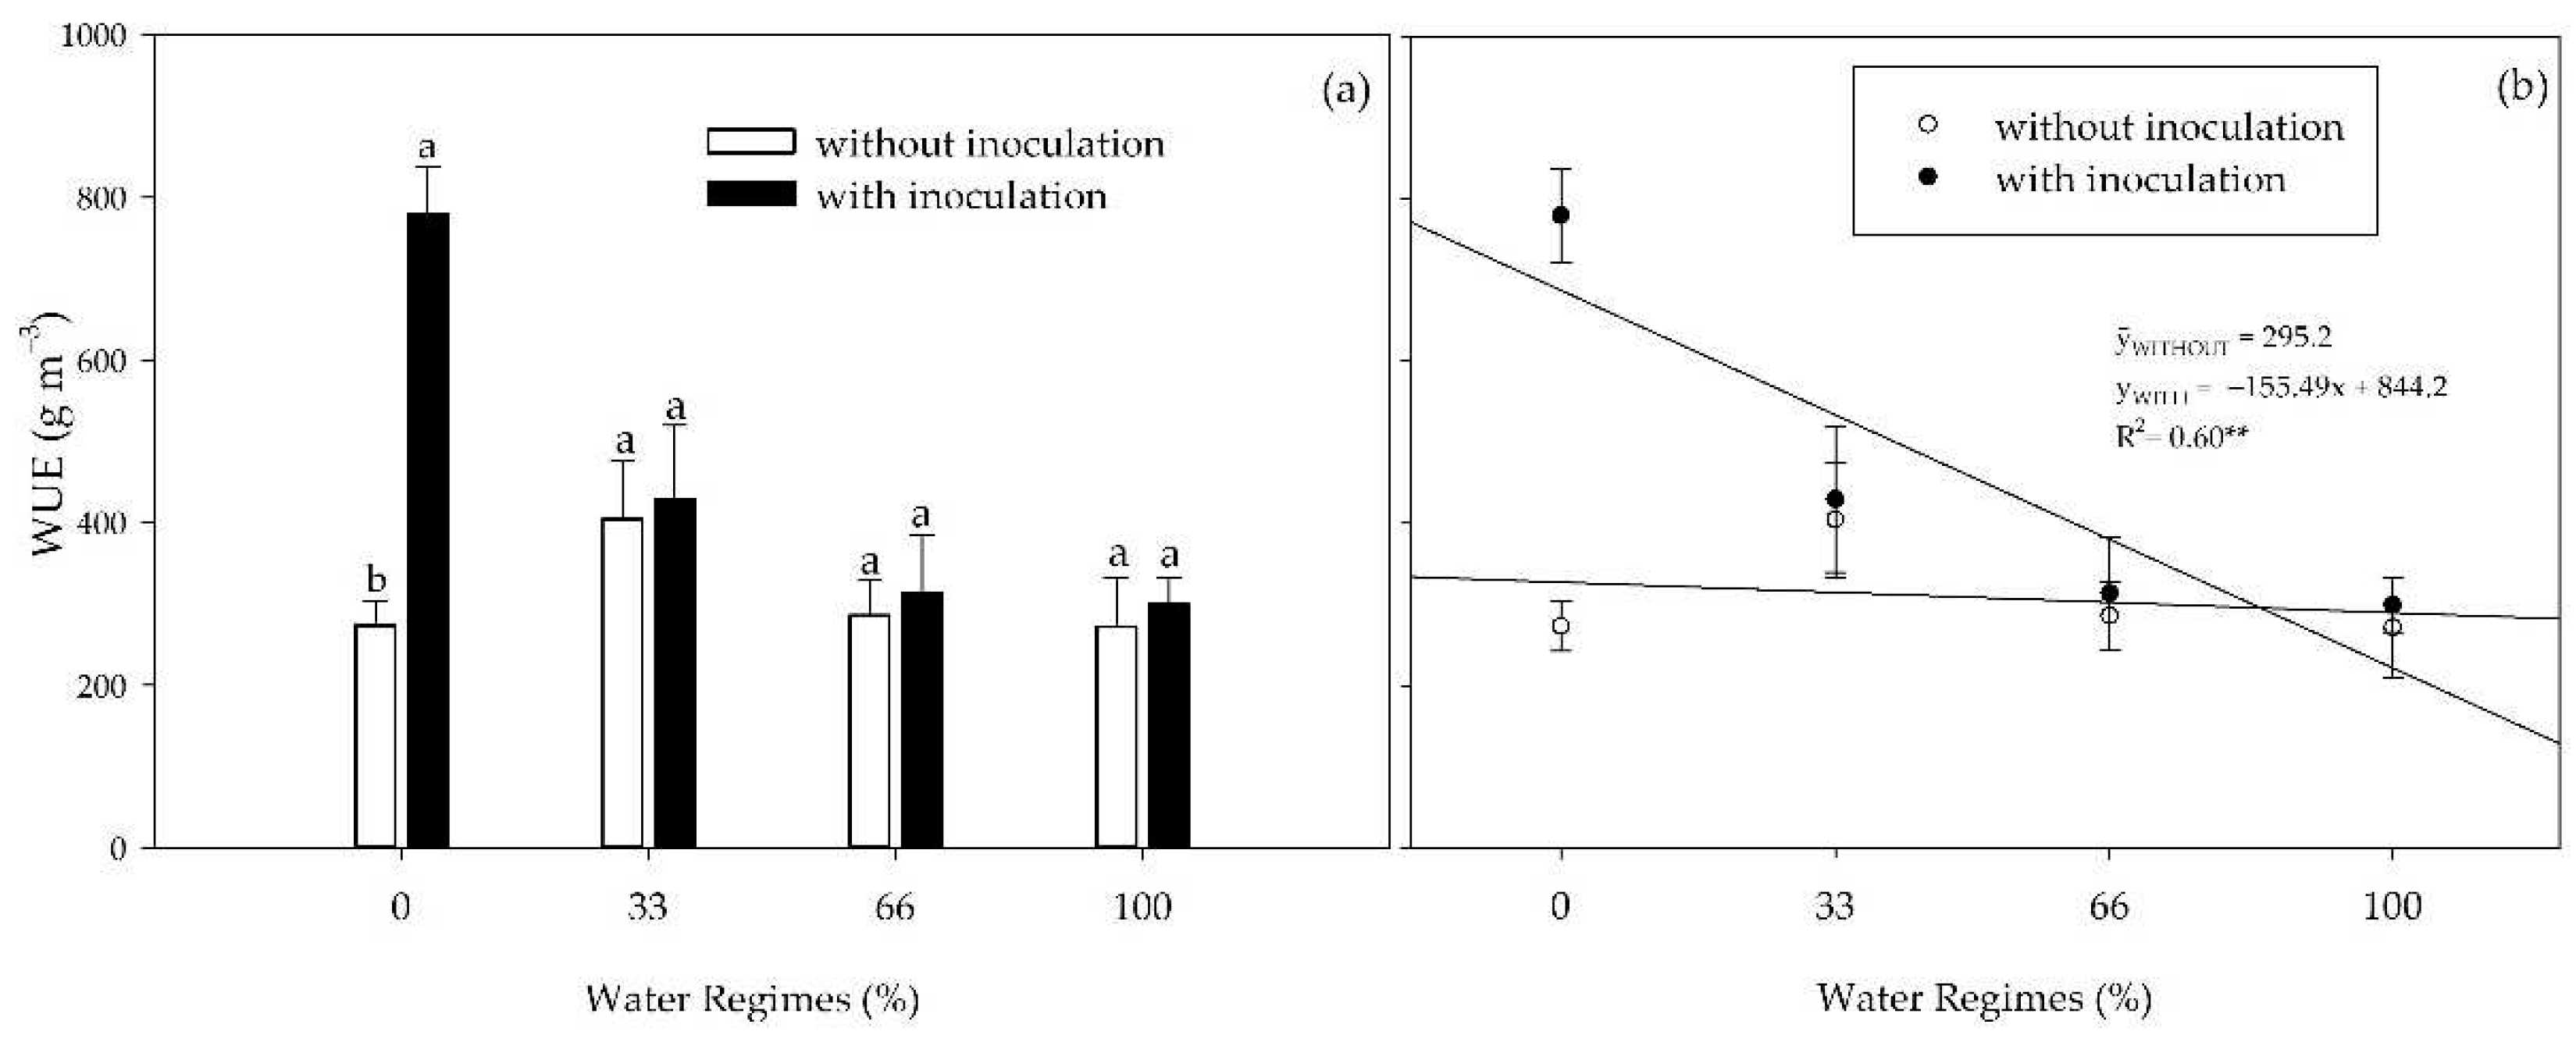
As water availability decreased, there was an increase in WUE; however, the inoculation × water regime interaction was only verified under severe water restriction (0% irrigation), where PGPB surprisingly increased WUE by 185%. These results indicate that the plants treated with FMCH001 and FMCH002 had better control of maintaining the plant’s water status during the progressive drought than the non-inoculated control plants. These bacteria remain as spores for survival in water-scarce conditions, which helps them survive better in extreme conditions for extended periods [
39].
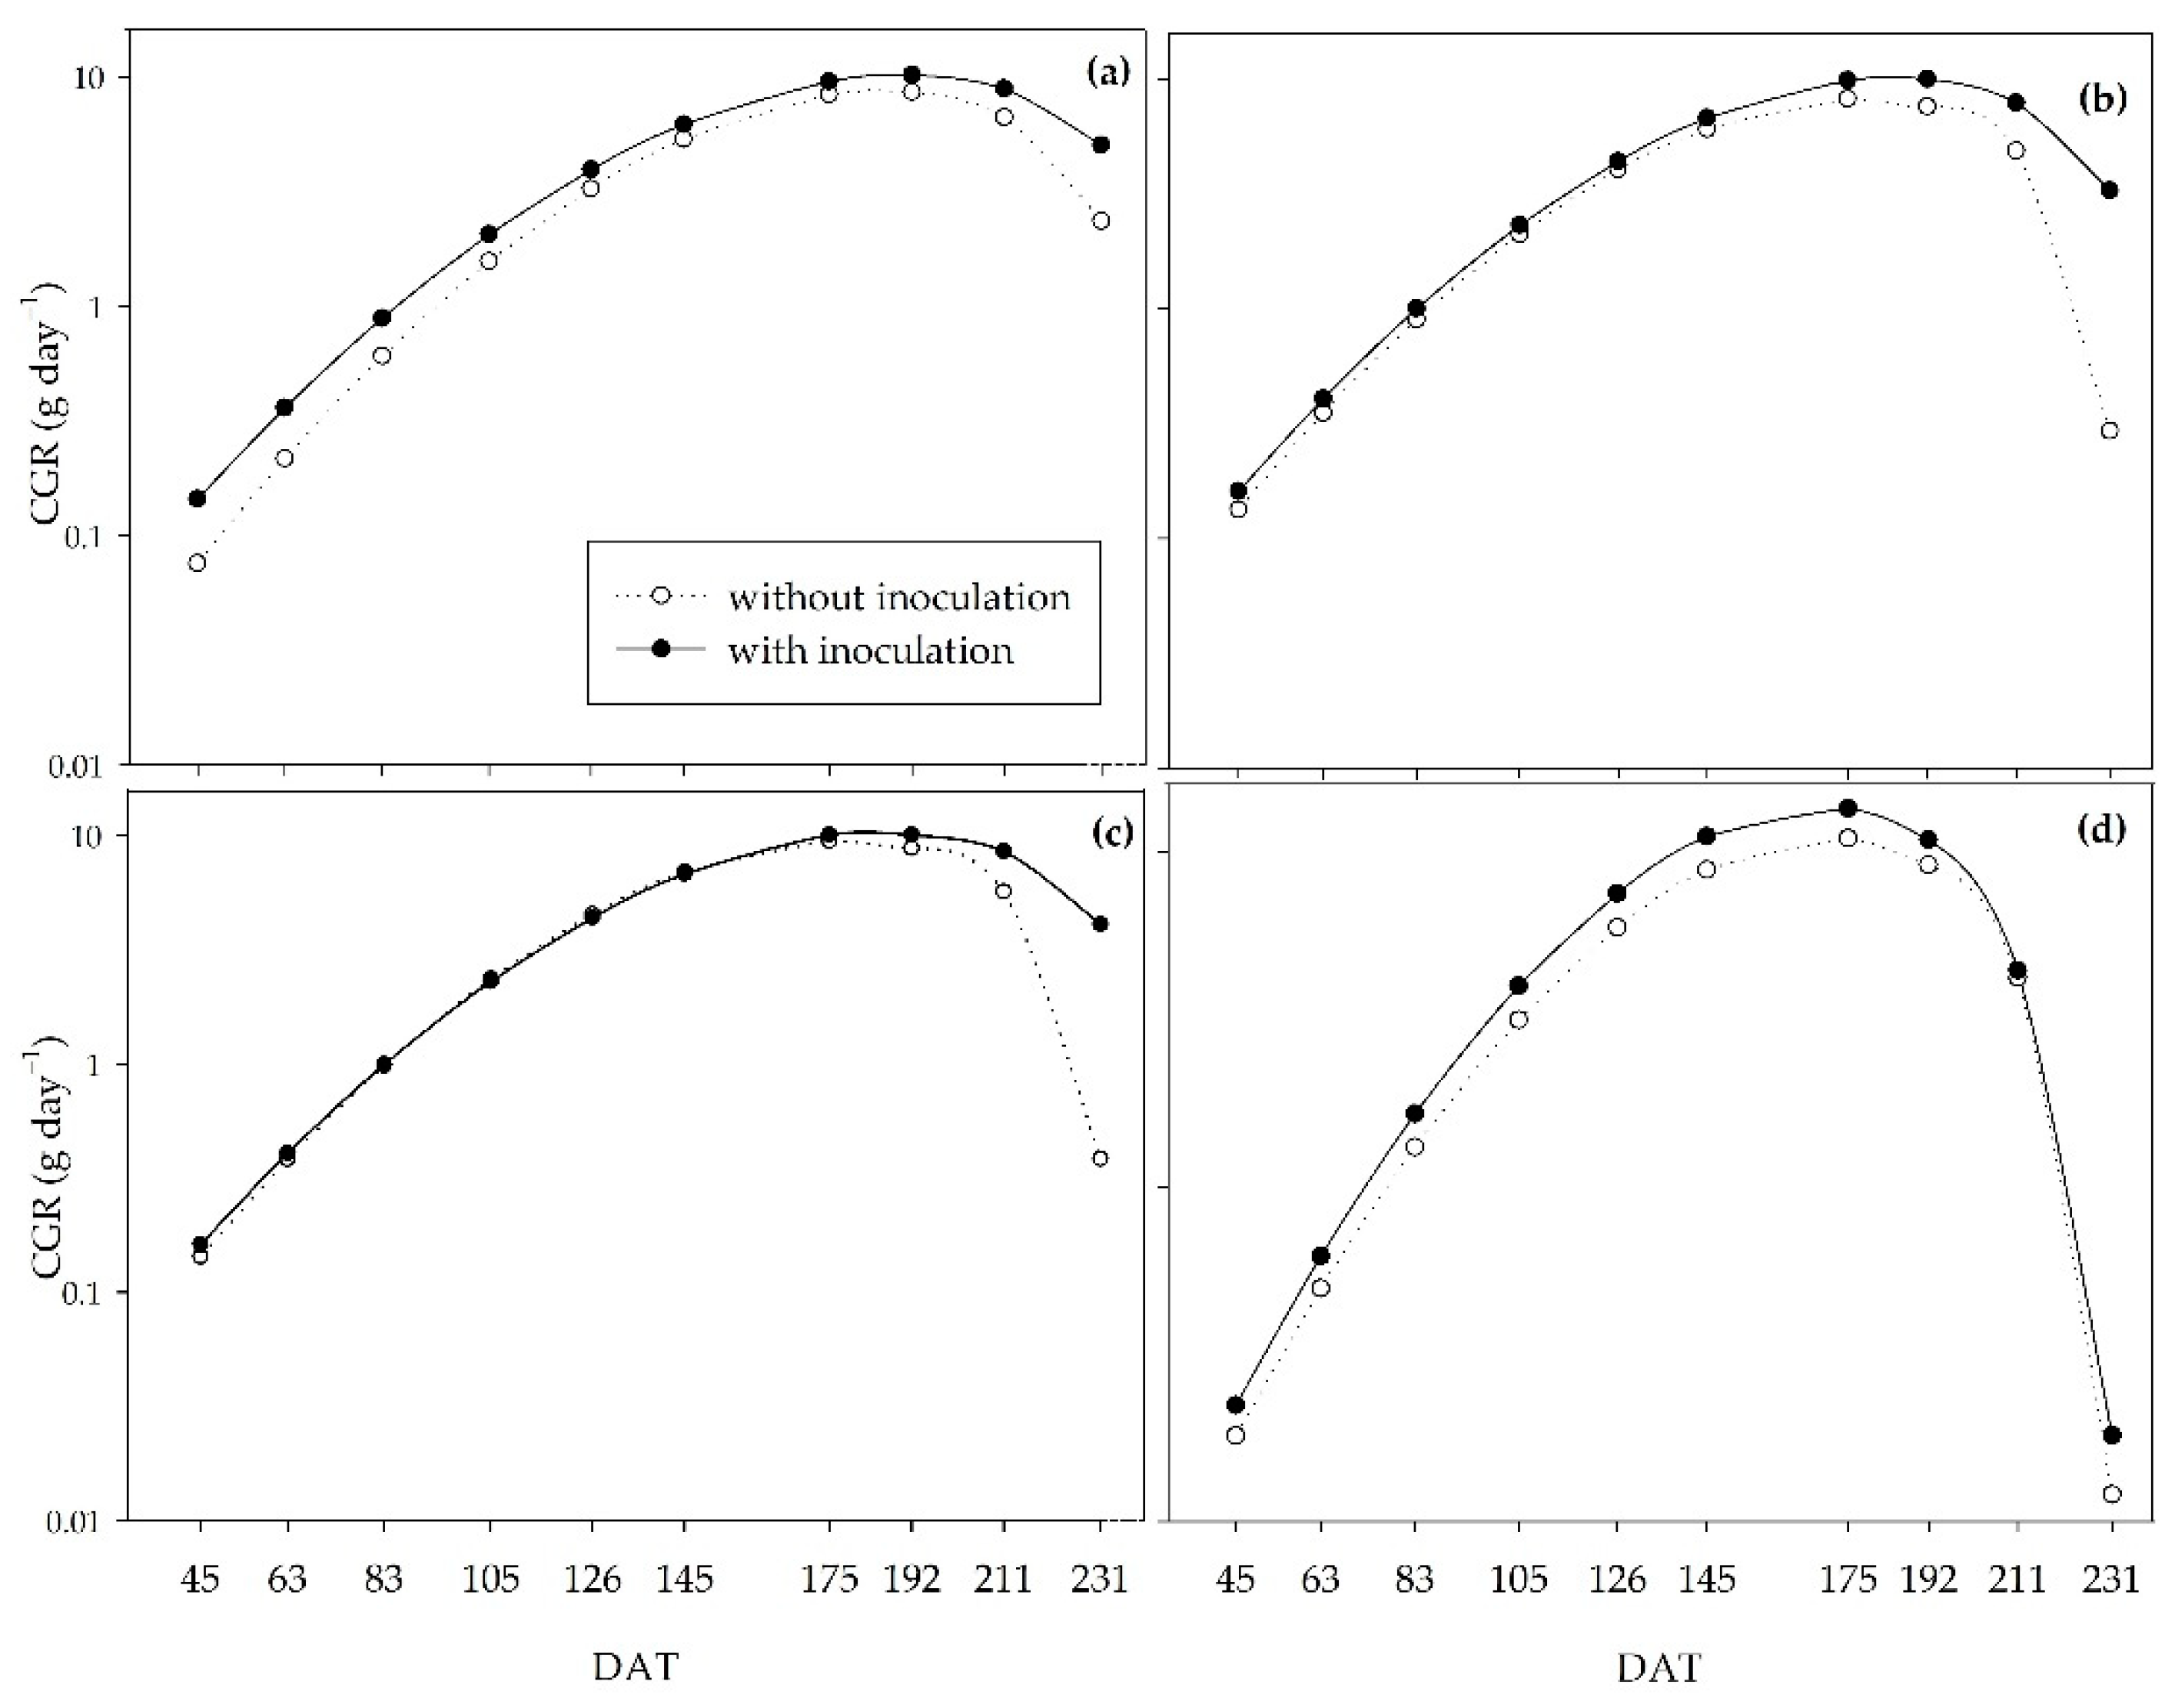
Inoculation provided a higher crop growth rate (CGR) at the peak of development (145 to 192 DAT) for all the water regimes studied. The CGR measures the variation in dry matter mass over time, which in this study reached the maximum accumulation of dry matter mass per day at approximately 180 DAT. Between 130 and 180 days after planting, in mid-August/September, sugarcane plants are at the peak of their development due to favorable temperature and rainfall conditions [
4], which justifies the higher net assimilation rate (NAR) for all treatments. The CGR and NAR curves corroborate the results of Pedula et al. [
76], who showed an increase in these indices by applying five diazotrophic bacteria.
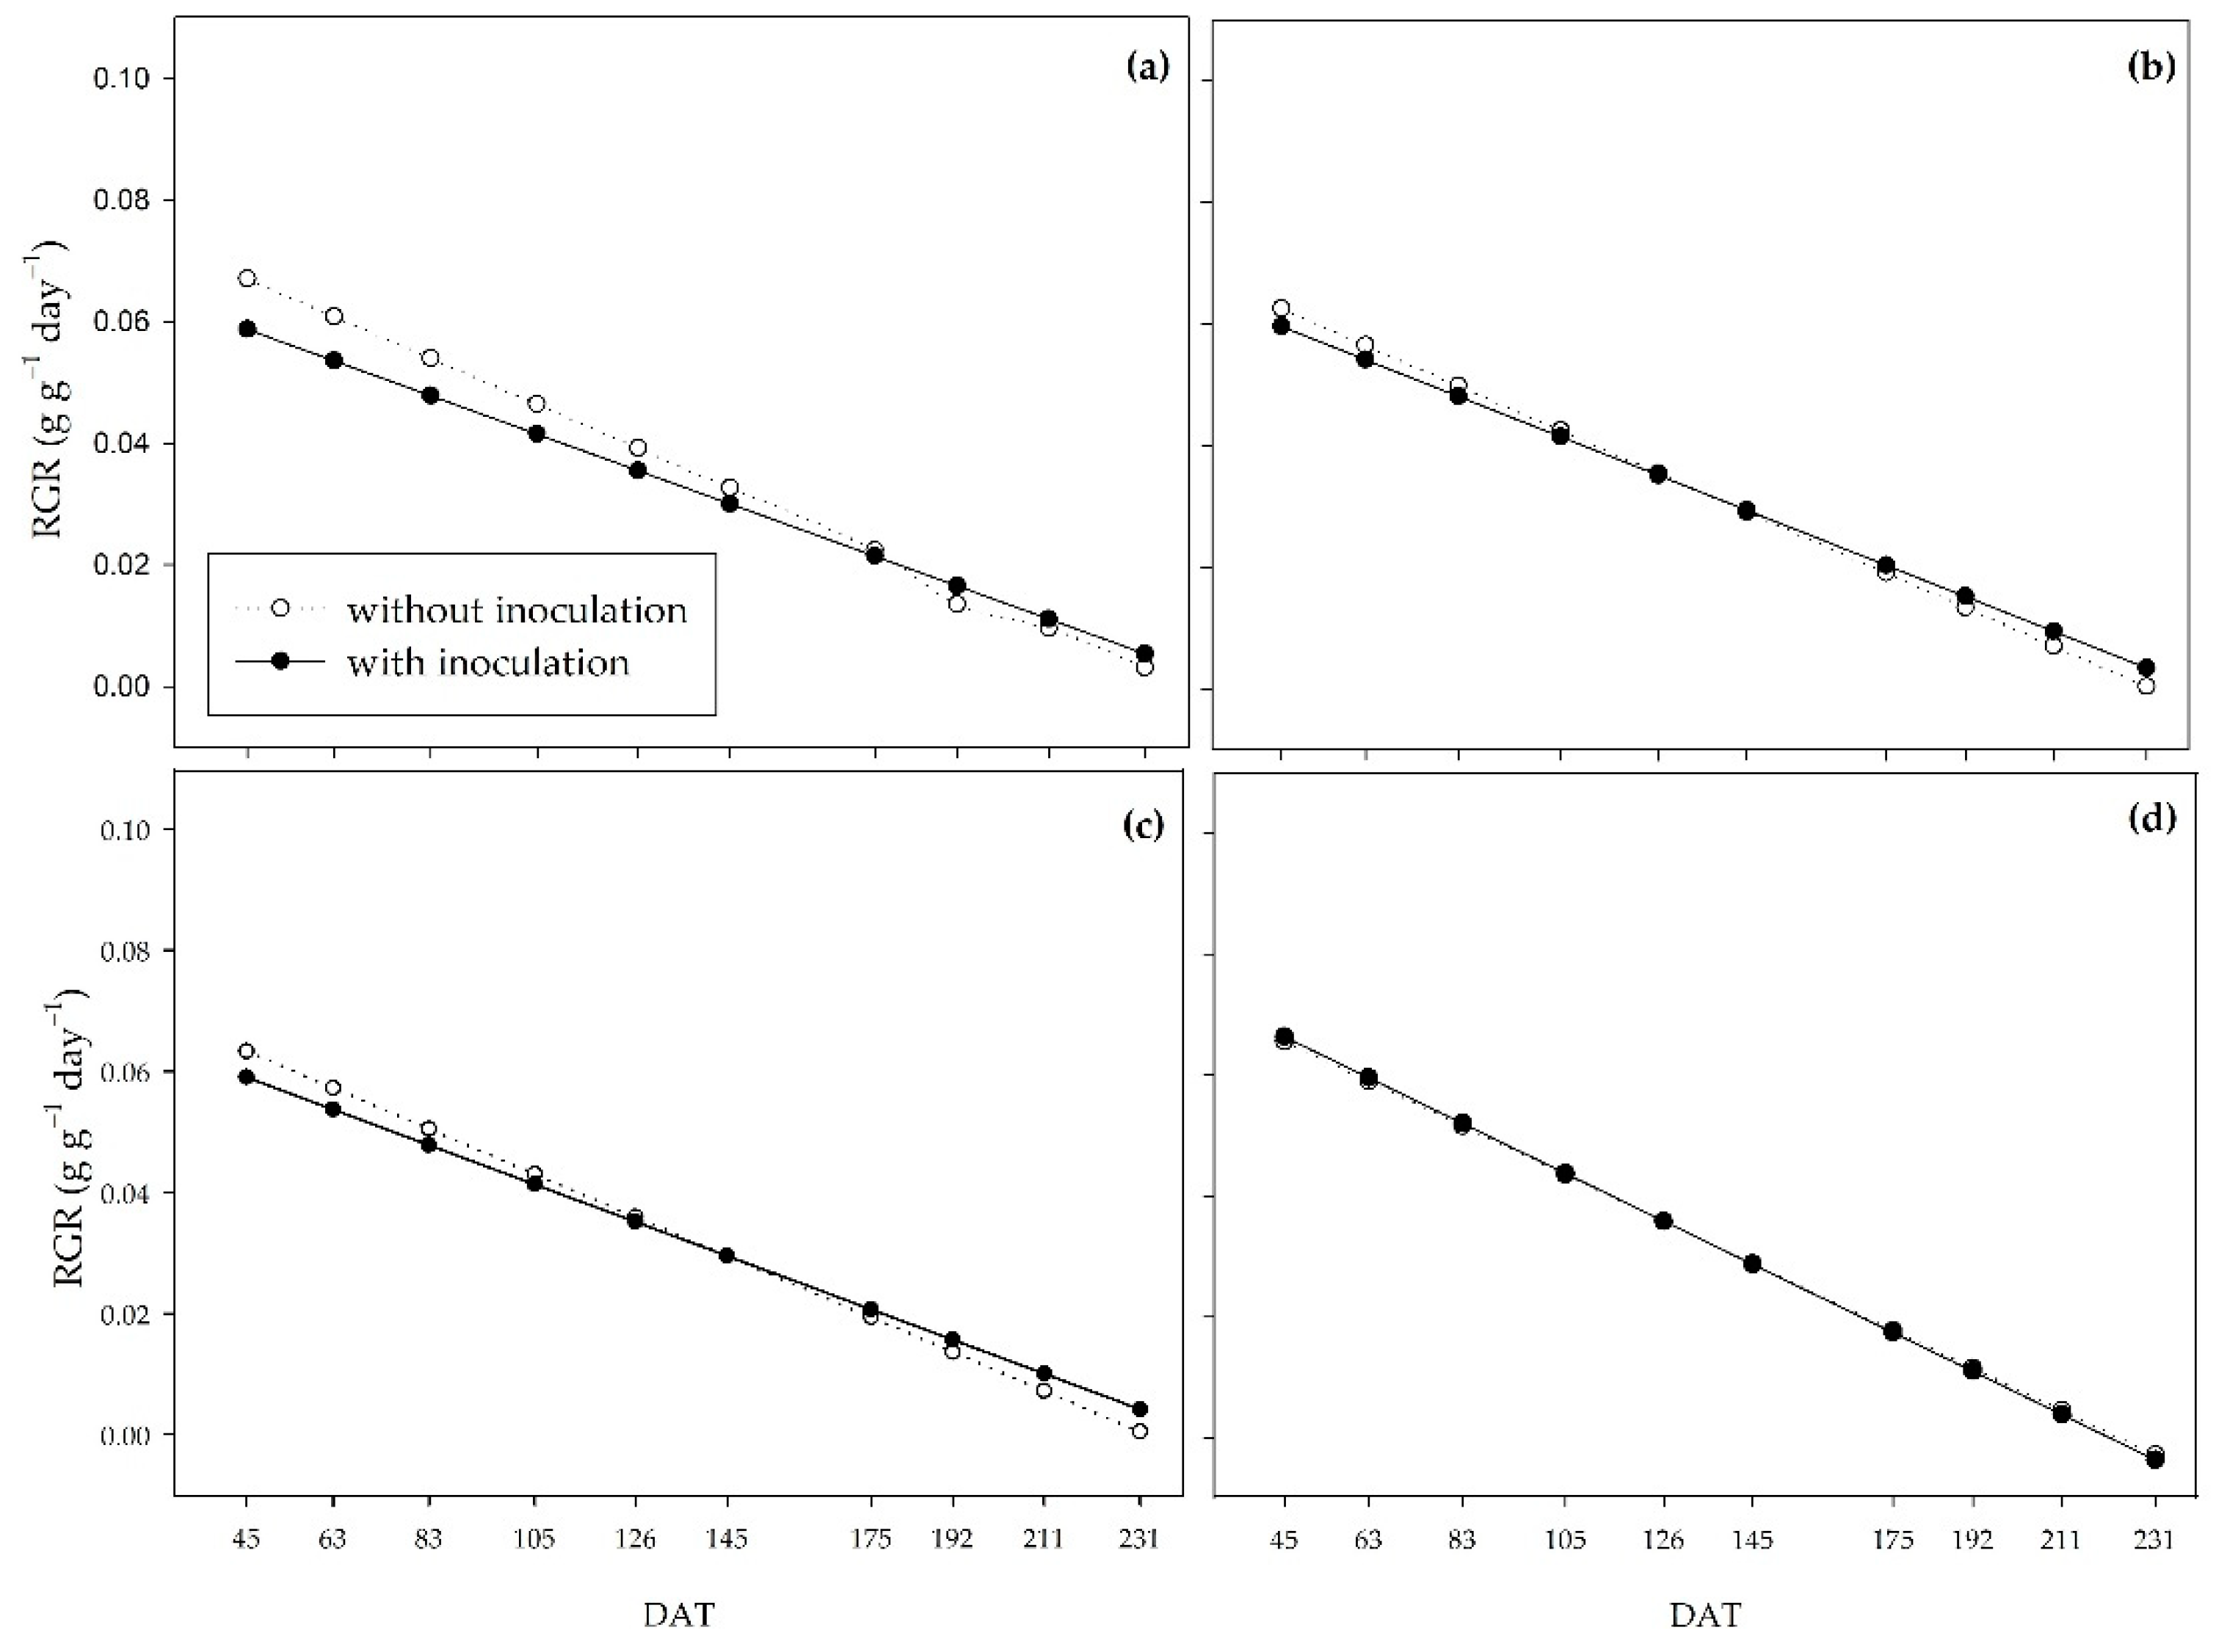
The relative growth rate (RGR) is the increase in dry matter mass per unit of original dry mass over a period, representing the plant’s efficiency in producing new material [
54]. The RGR curves were inverted throughout the cycle between the inoculated and non-inoculated plants. The inoculated plants began the cycle with lower RGR in the 0 to 33% water regimes and higher RGR in the 66 and 100% regimes. The opposite was observed at the end of the experiment, where the inoculated plants had higher mass values per pre-existing mass compared to the non-inoculated plants in the 0 and 33% water regimes.
It is estimated that 40% of the photoassimilates produced by plants go into the production of exudates by the root system [
77]. The exudates released by plant roots play a role in maintaining and interacting with rhizospheric microorganisms [
78], as they are the primary source of organic carbon in the rhizodeposition process [
79]. Root exudation represents a significant carbon cost for the plant [
80]. At the beginning of the cycle, under water restriction, the plants may have partitioned part of their assimilates for the inoculated bacteria maintenance, which possibly affected carbohydrate production. This allowed the colonies to settle and develop in the rhizosphere of the plants and promote the inversion of the curve at the end of the cycle. Under conditions closer to adequate in terms of the necessary water supply (66 and 100% water tables), the partitioning to the production of exudates probably didn’t interfere enough to influence the production of dry matter by pre-existing material.
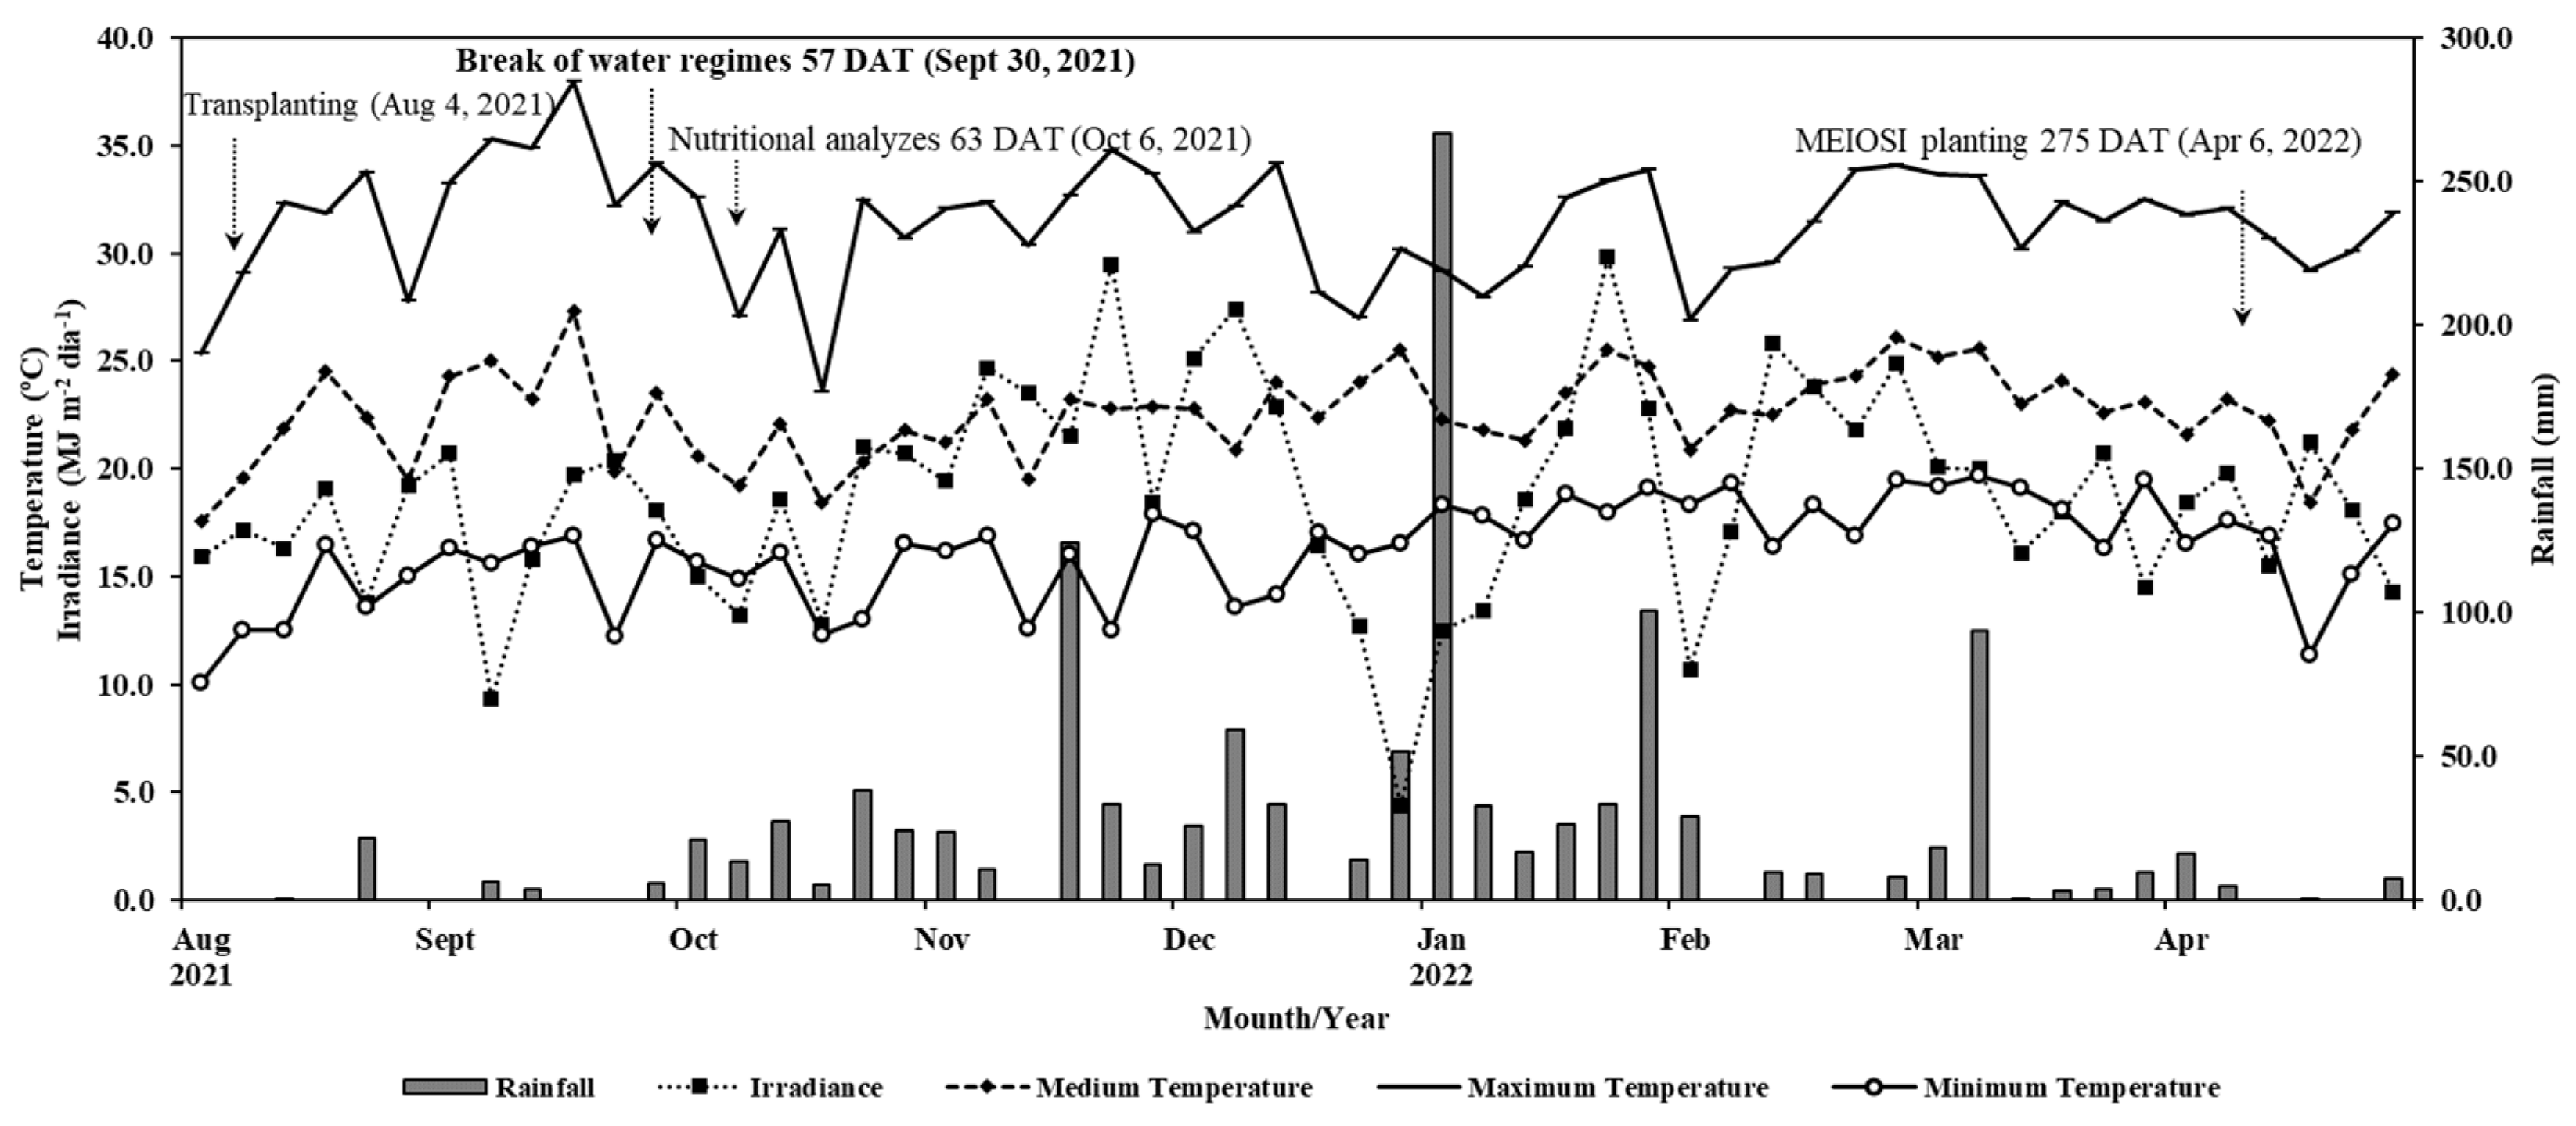
It is worth noting that the treatments related to the water regimes took up to 57 DAT (
Figure 1), after which all the plants were subjected to natural rainfall. Considering the long period of the crop in the field (231 DAT) and the controlled irrigation period (57 DAT), it is possible that, at the end of the evaluations, the dry matter mass production parameters were level for all the water regimes.
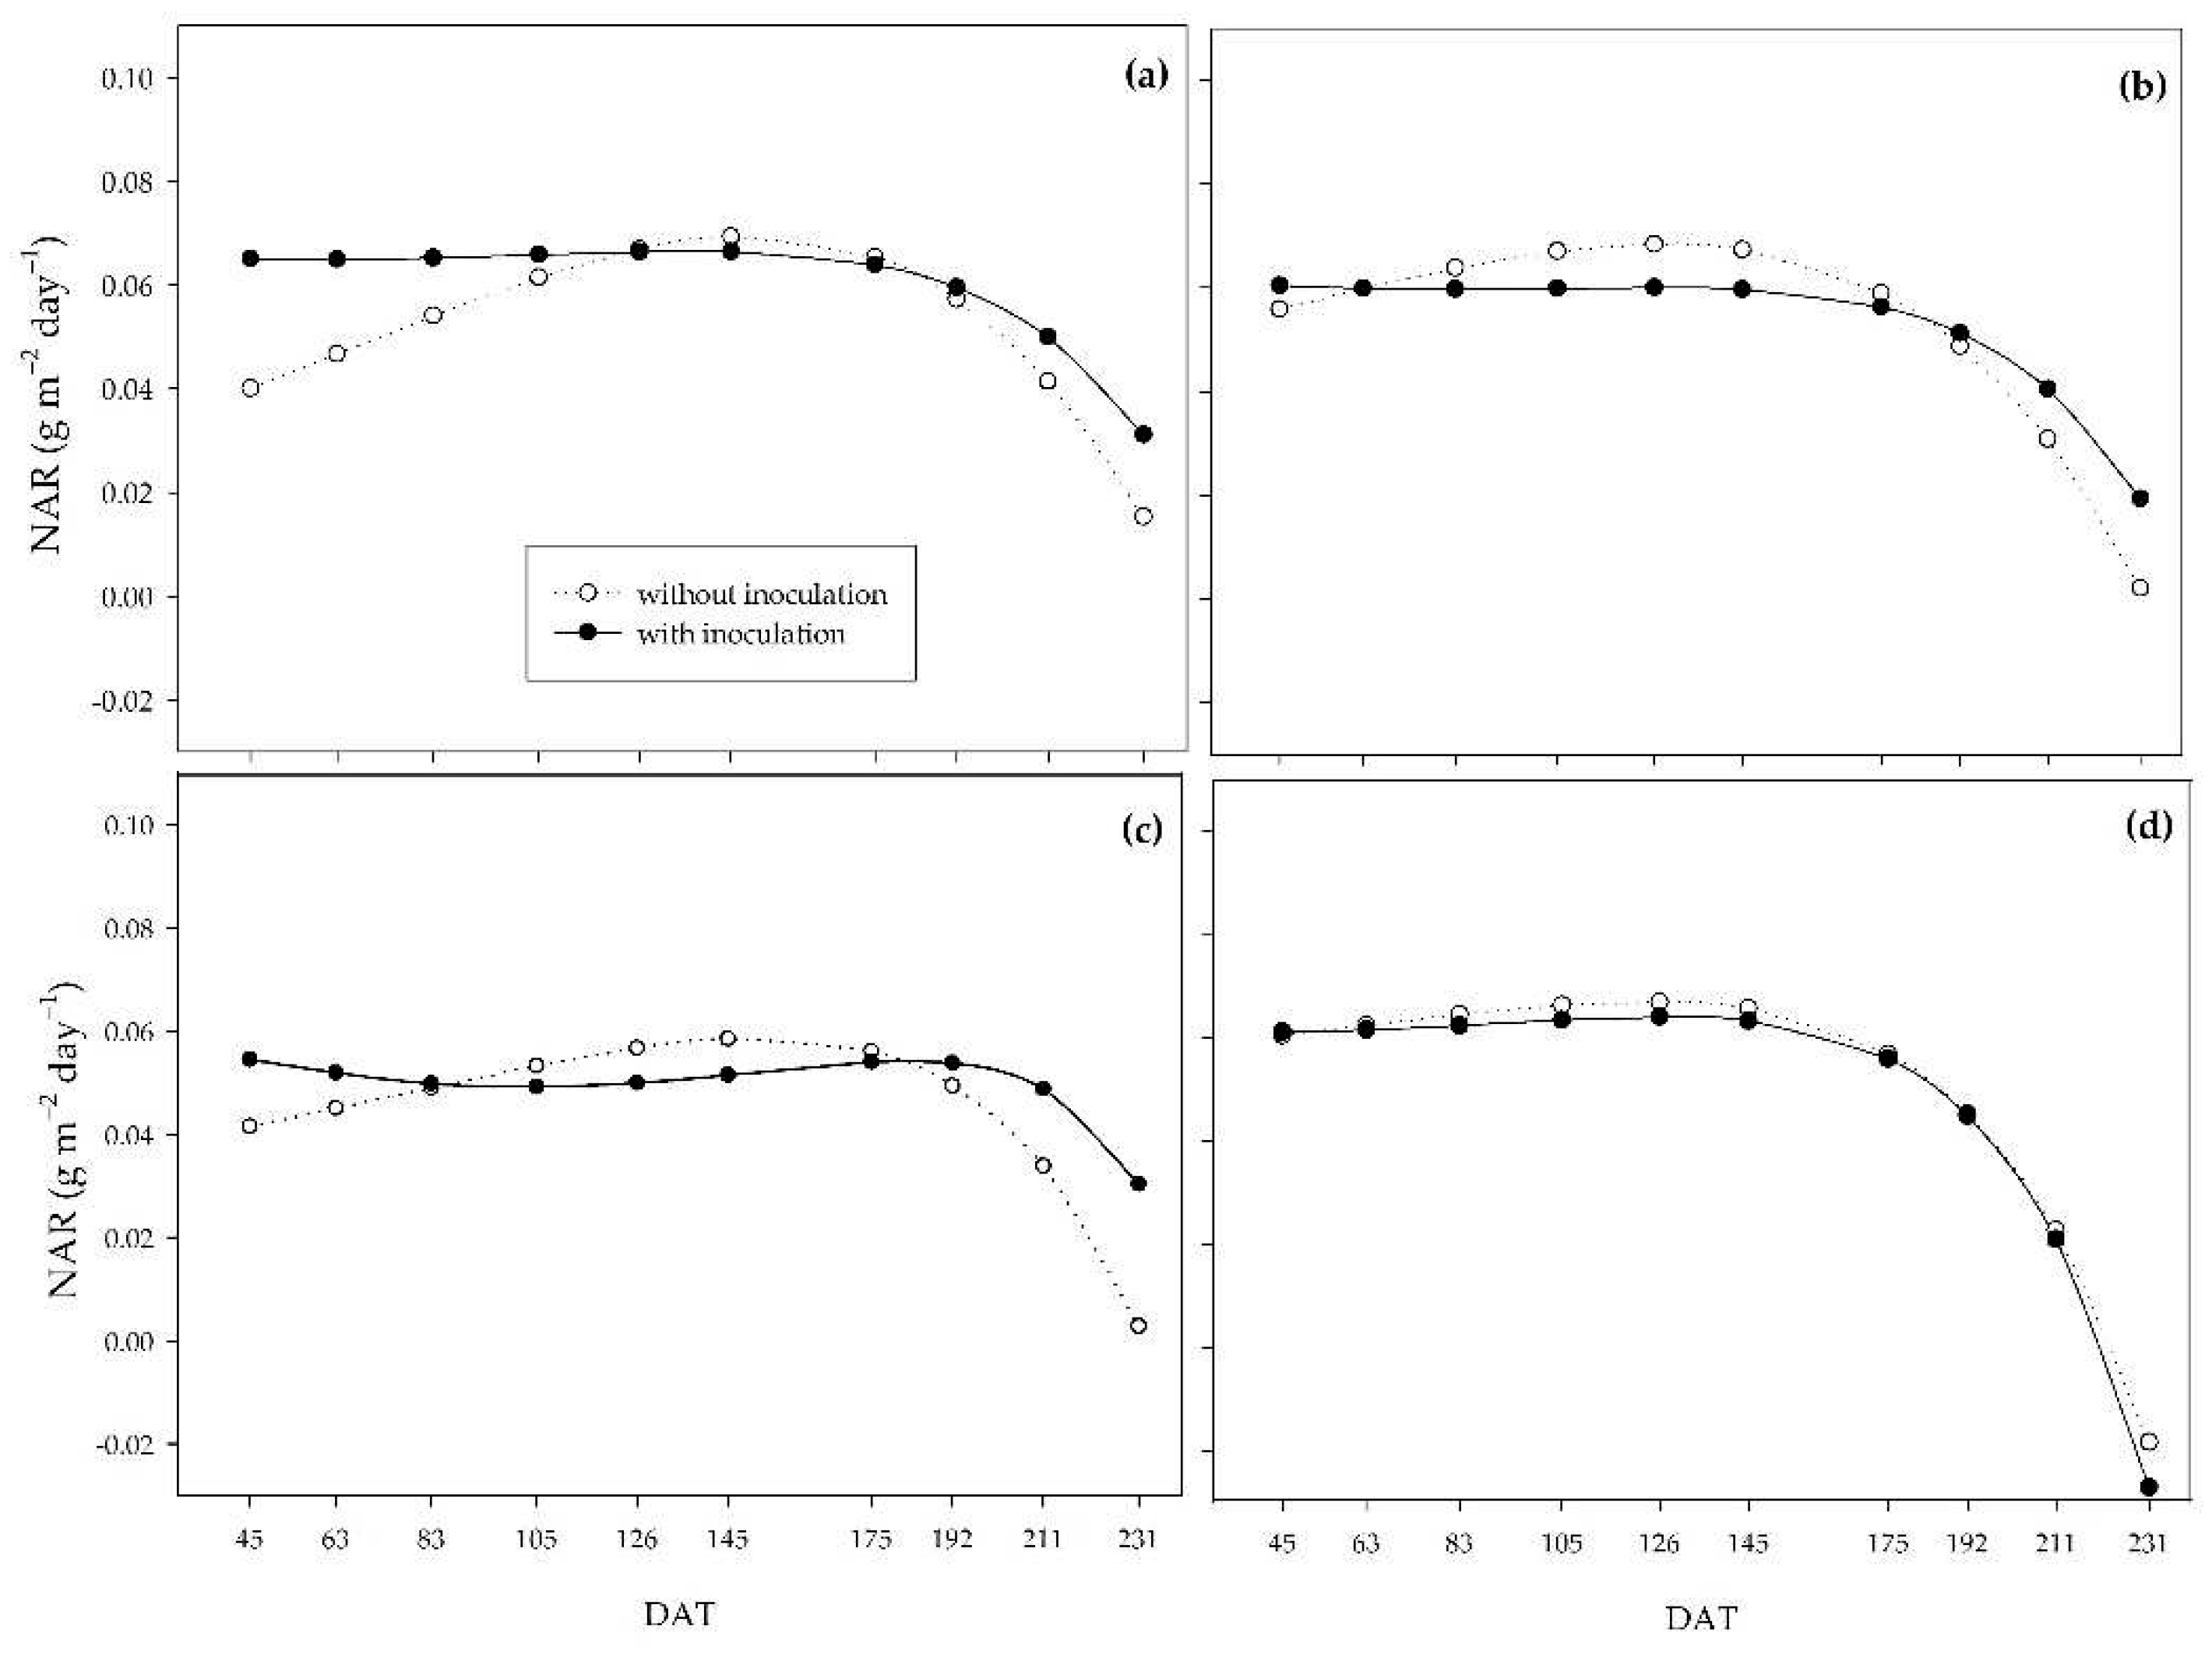
The NAR considers leaf area as the surface capable of producing carbohydrates. In this case, unlike the RGR, the inoculated plants showed higher values at the beginning of the cycle, which indicates that the photoassimilates resulting from the higher net assimilation rate of the inoculated plants were being partitioned to resources other than the production of shoot dry matter mass, such as the root system improvement [
39,
81]. These resources may have aided the greater production of shoot dry matter mass after 145 DAT, as shown by the CGR and RGR curves under inoculation with
B. licheniformis and
B. subtilis.
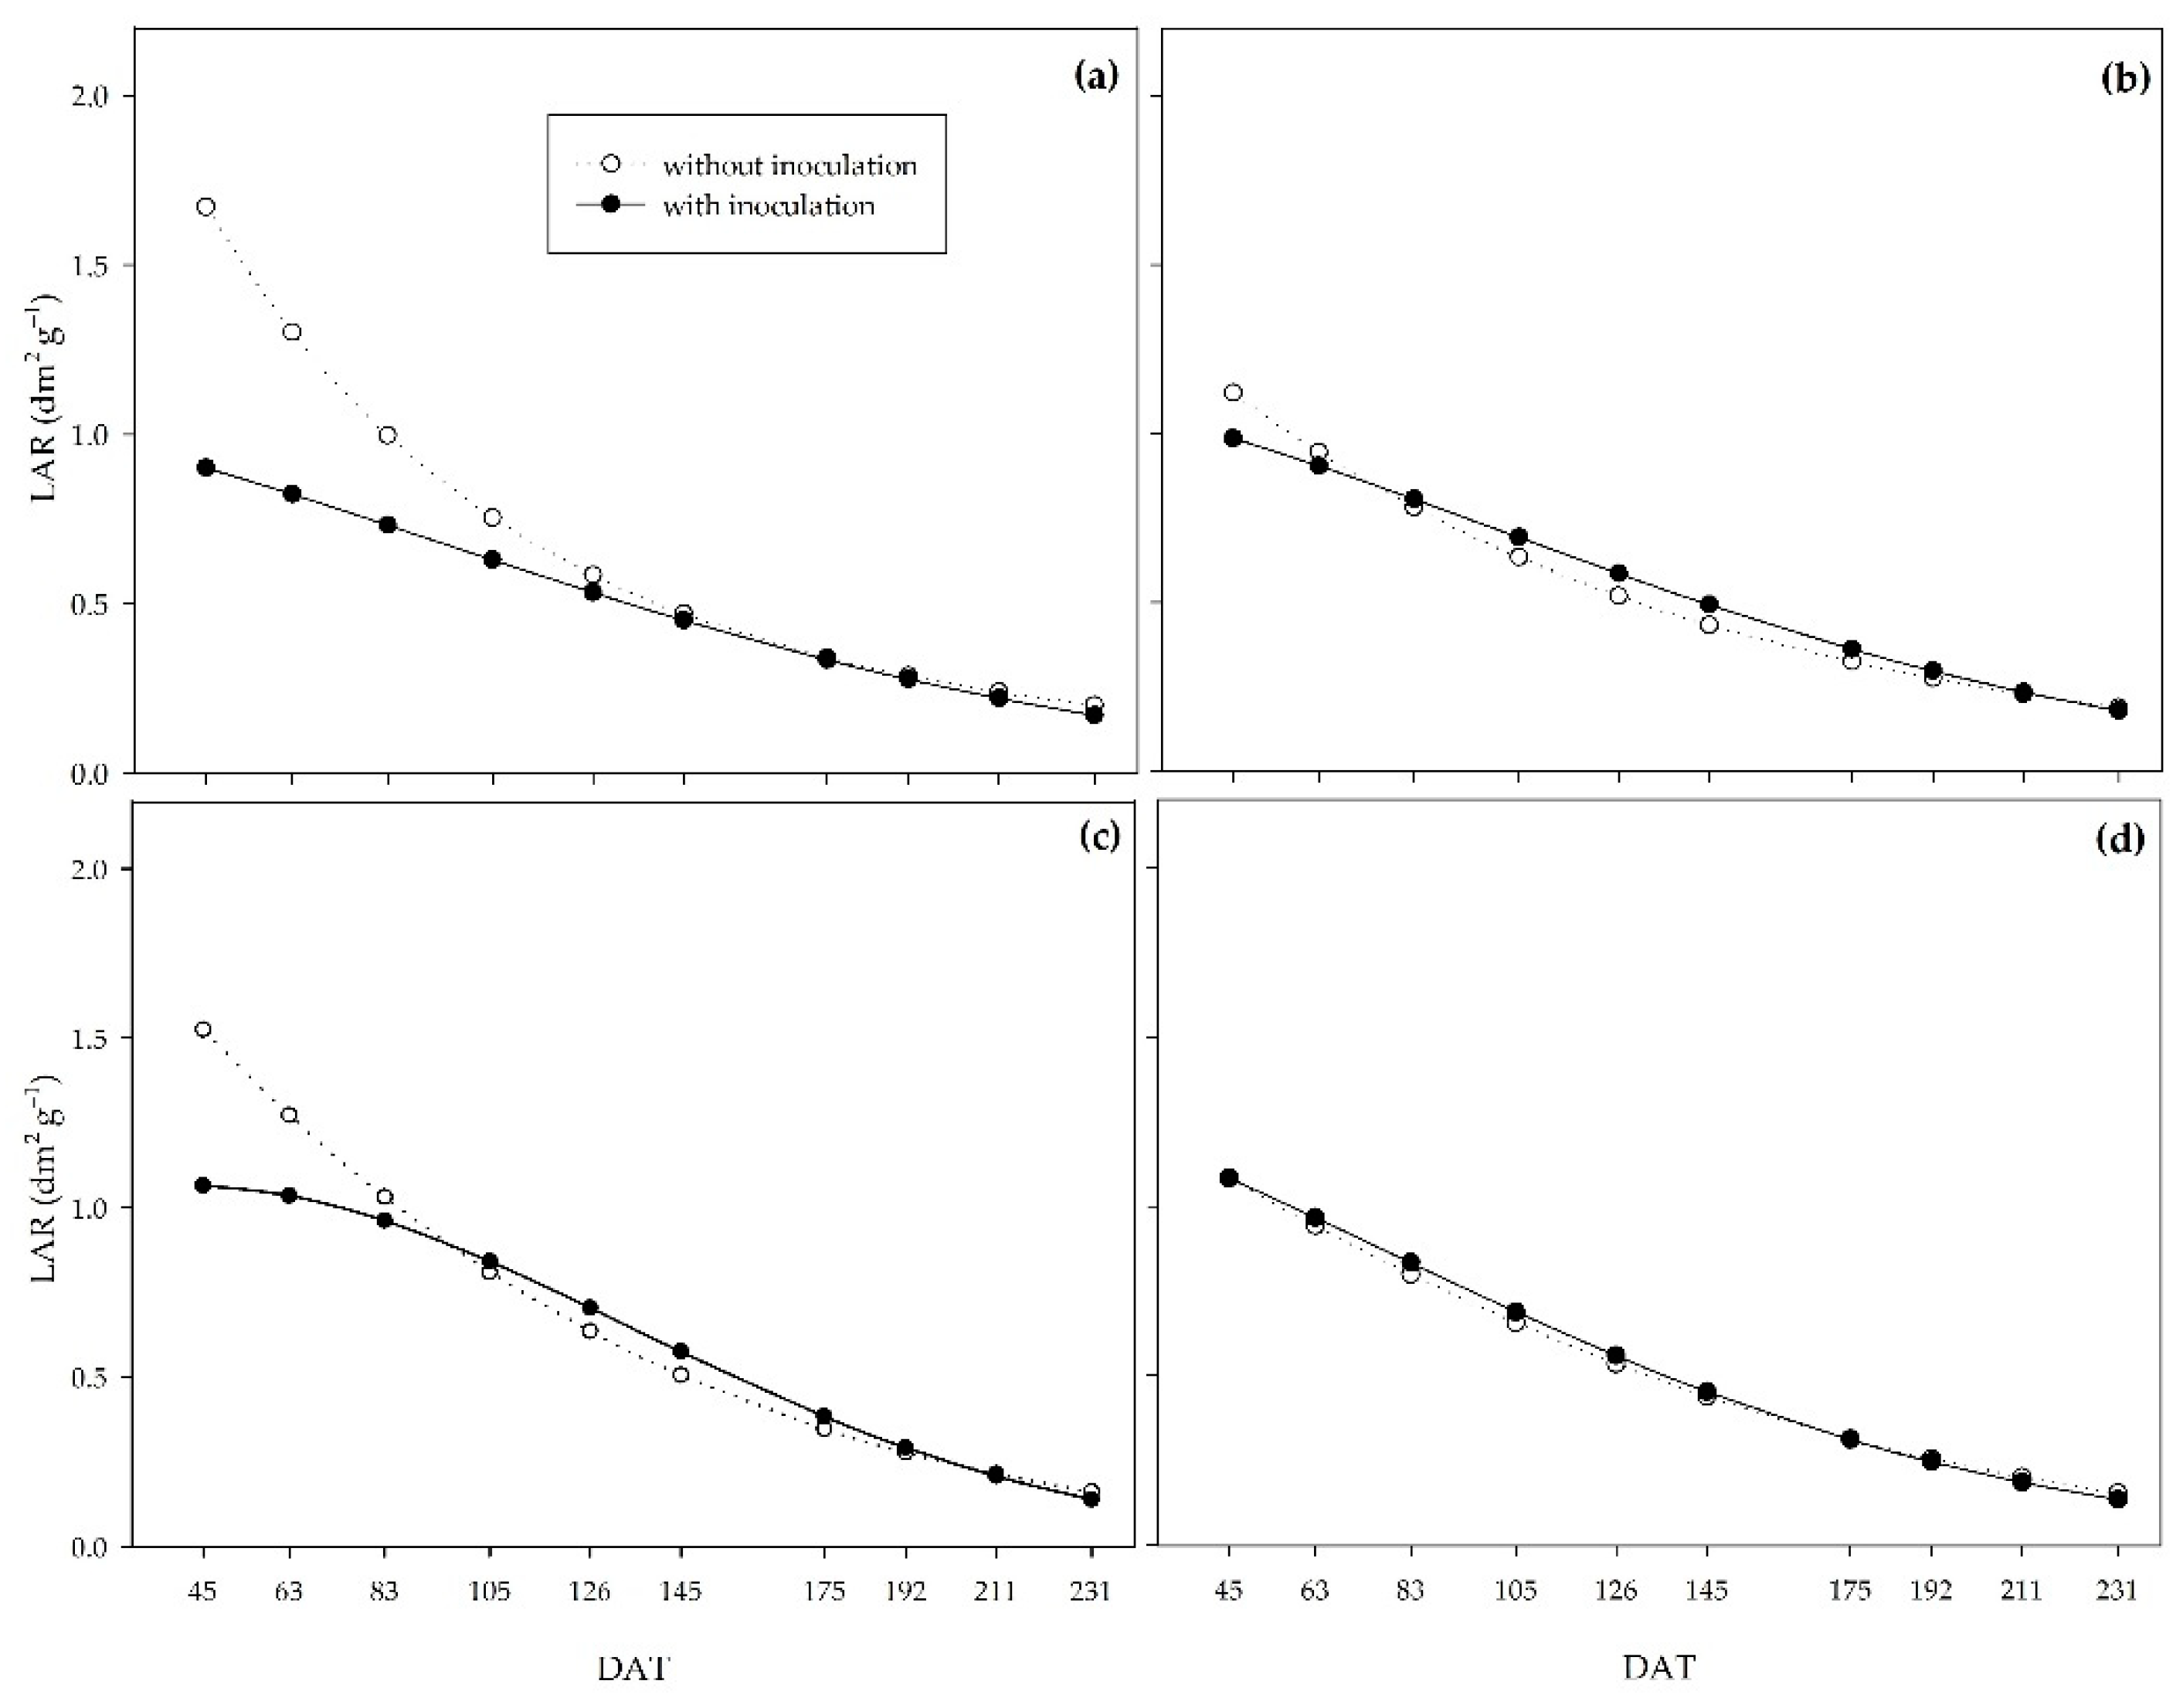
The leaf area ratio can be interpreted as the ratio between the assimilatory surface and the material assimilated by that surface. Thus, lower values under the action of PGPB indicate the action of
Bacillus on yield efficiency, as it indicates that the inoculated plants produced more assimilate per unit of assimilatory surface [
54].
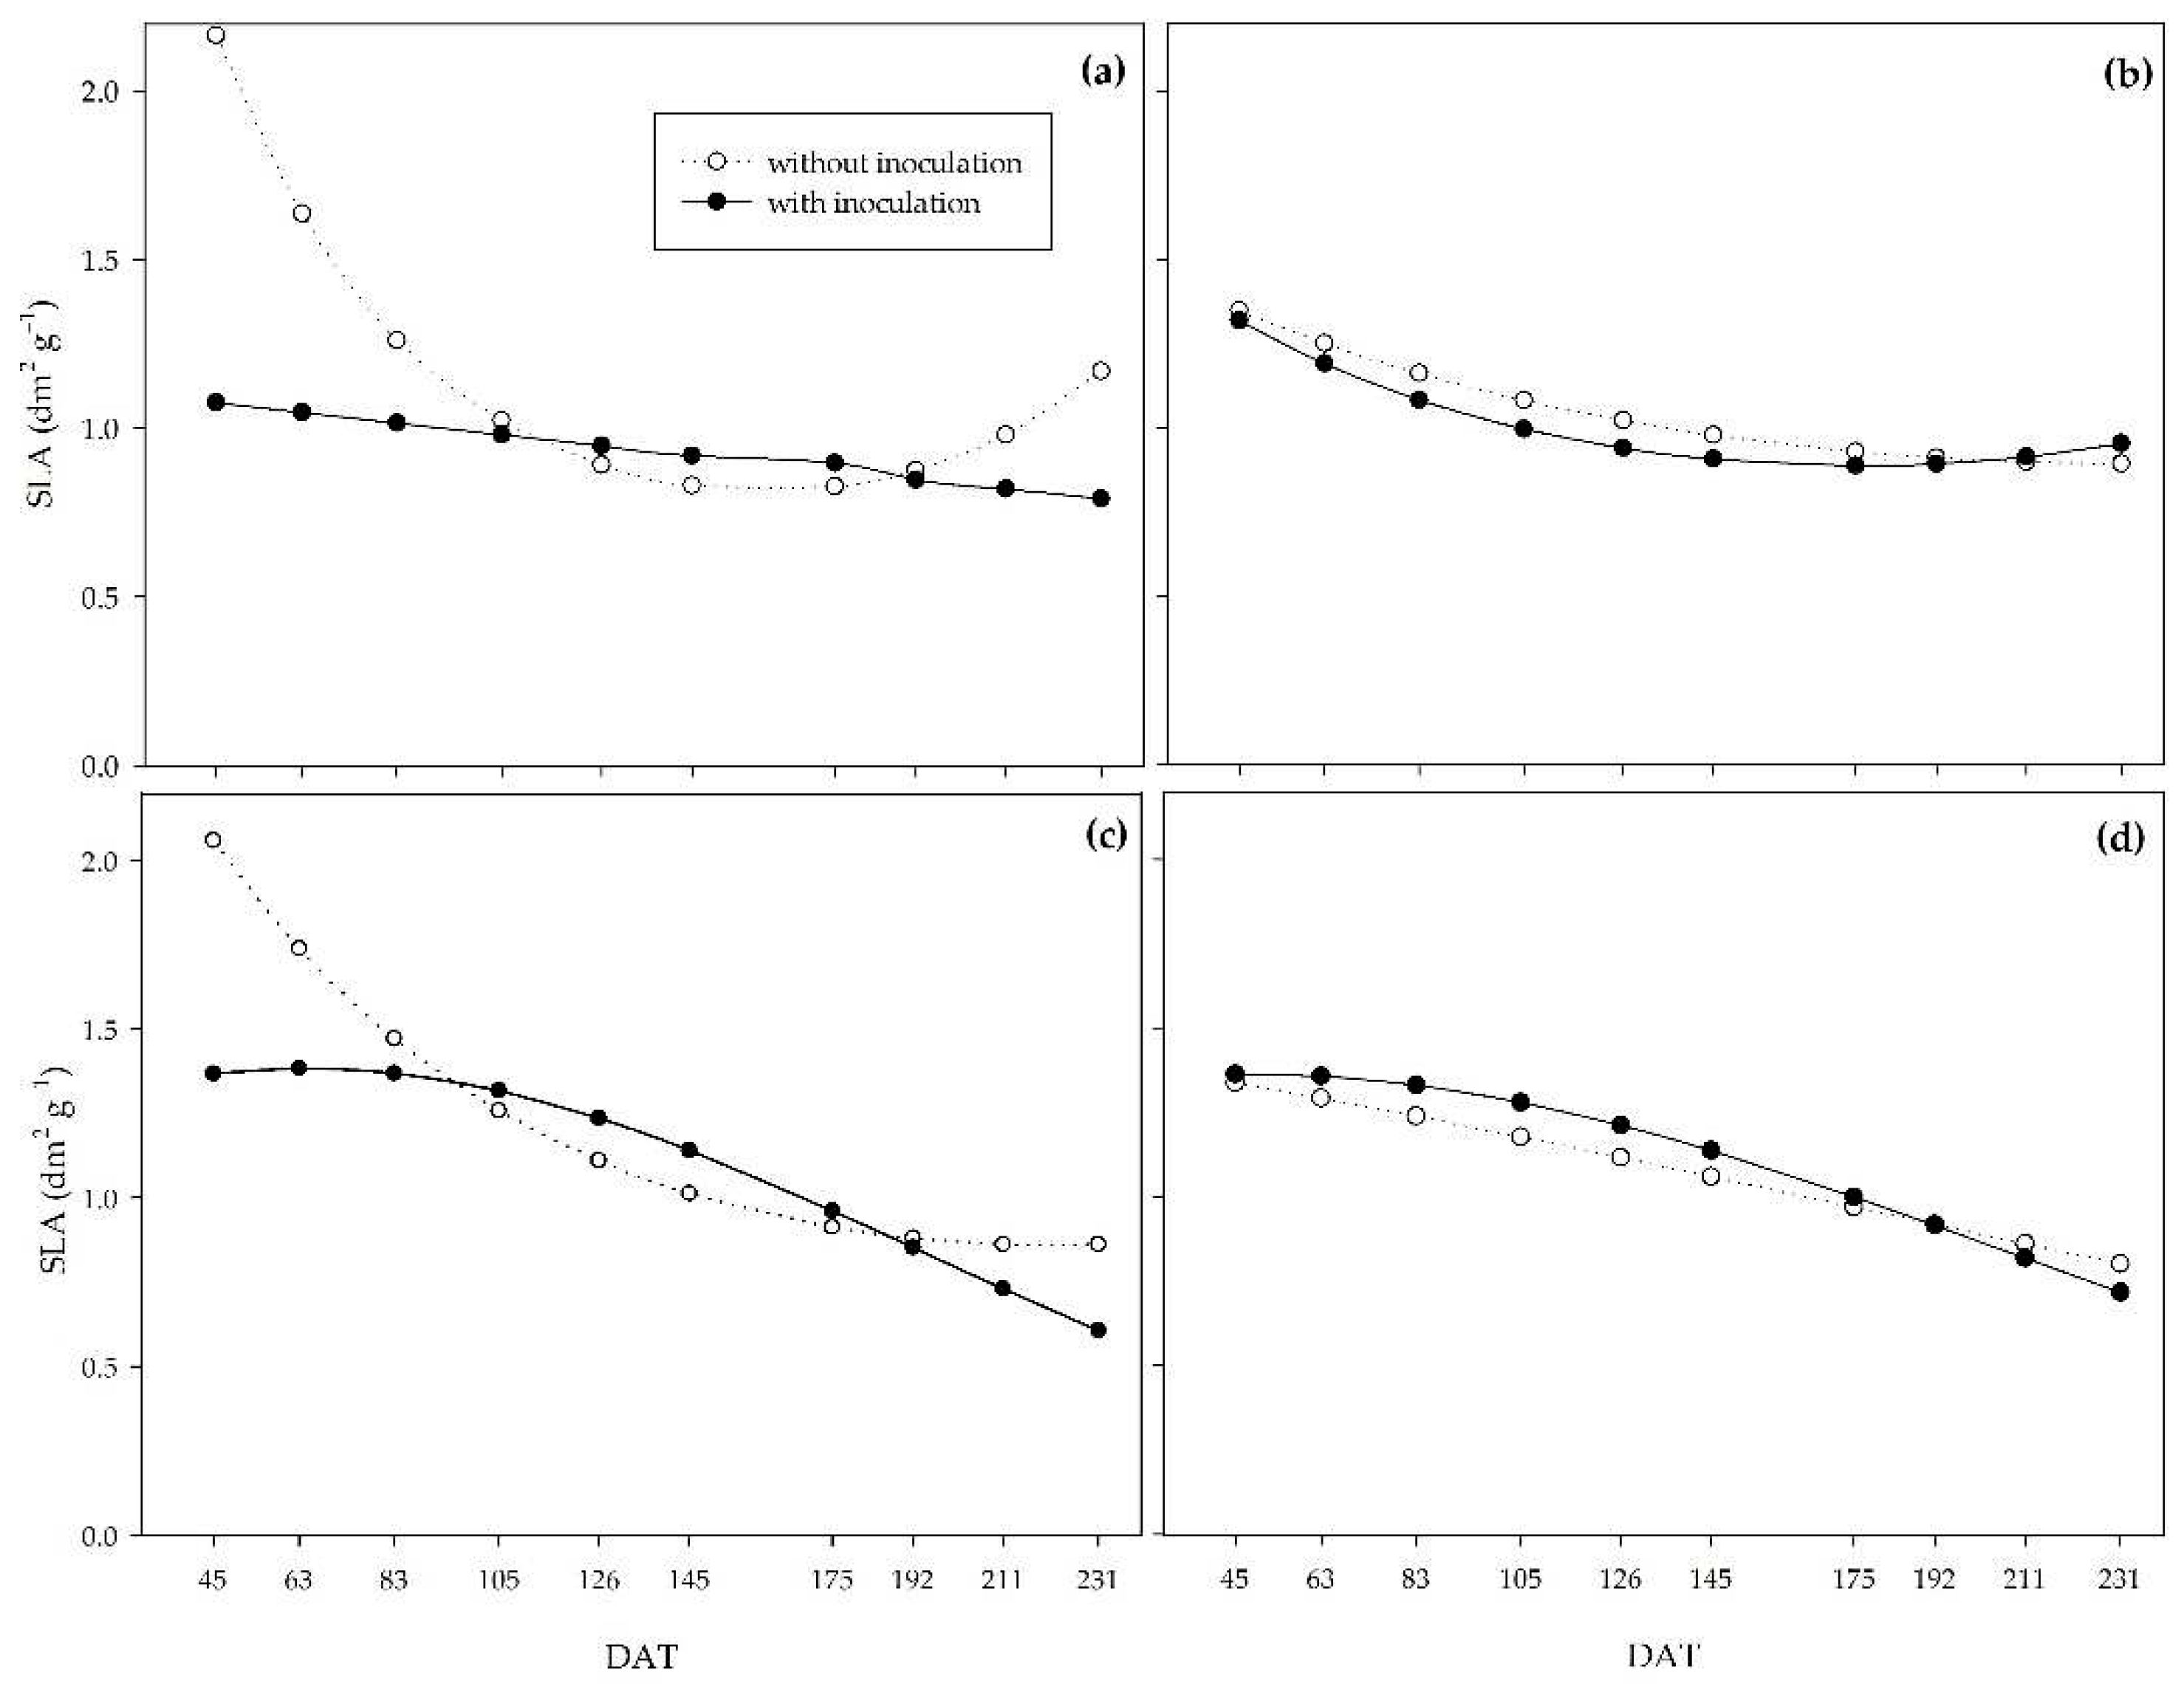
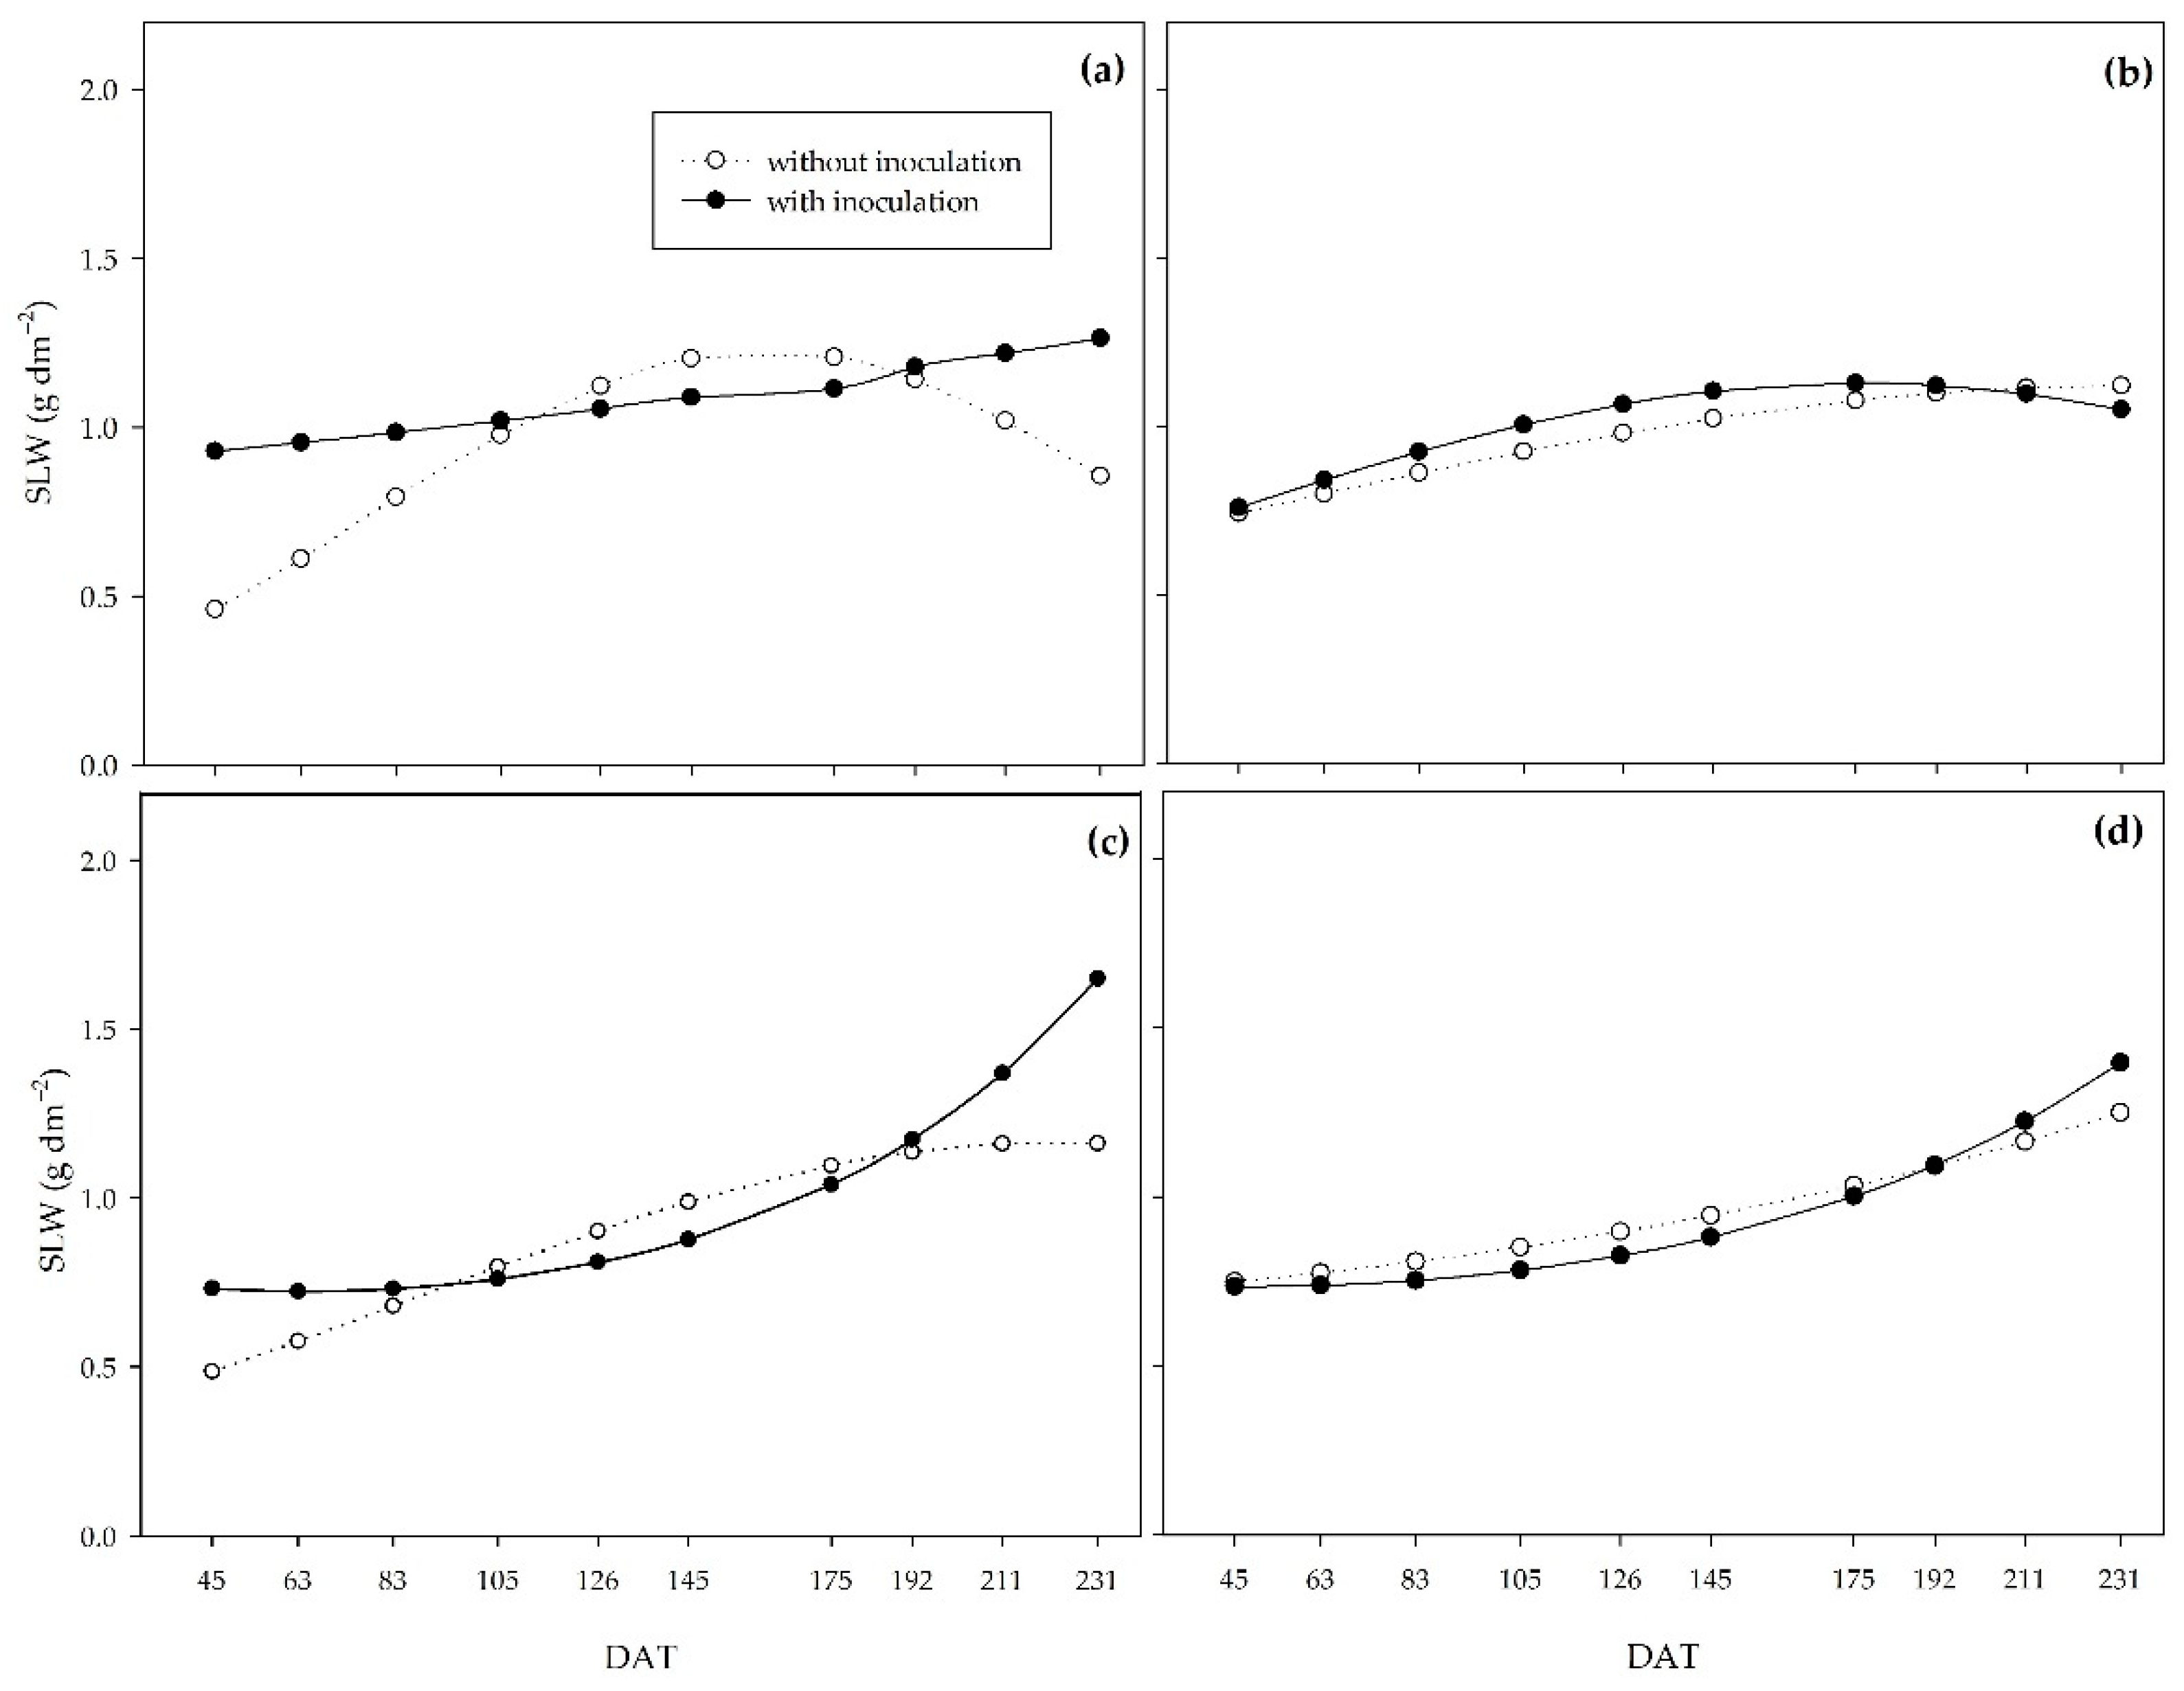
On the other hand, the specific leaf area (SLA) represents the ratio between leaf area and leaf dry matter mass, while the specific leaf weight (SLW) indicates the inverse of SLA. Both indices allow us to analyze leaf thickness since the higher the SLA, the lower the leaf thickness, and the higher the SLW, the greater the leaf thickness. Thus, compared to non-inoculated plants, PGPB increased leaf thickness at the beginning of the cycle for the 0, 33, and 66% regimes. For the 0% regime, the leaf thickness of the treatments leveled off at around 110 DAT. PGPB promoted greater leaf thickness, which explains the higher net assimilation rate in inoculated plants during this period. The higher leaf thickness may represent greater shoot dry biomass production efficiency by improving the photosynthetic apparatus, mainly due to the vascular bundle sheath in C
4 plants such as sugarcane [
4]. SLW at 63 DAT was highly correlated with shoot dry biomass, crop growth rate, and net assimilation rate (R
2 = 0.5**).
These results show the potential of PGPB to promote tolerance to water deficiency since, under water restriction, these bacteria enabled greater dry matter mass yield efficiency at the end of the experiment, as well as a higher assimilation rate and greater leaf thickness at the beginning of the PSS growth in the field.
Several reports of bacteria of the genus
Bacillus increase the rooting of sugarcane, which explains the increase in volume, area projection, and surface area of roots at a depth of 20 cm [
28,
36,
82]. One of the ways PGPBs promote tolerance is by acting on signaling pathways that promote more significant partitioning of assimilates to the root system [
81]. In addition, these bacteria are abundant in the root zone of drought-adapted plants [
39].
Zhang et al. [
83] demonstrated that B. subtilis could regulate auxin homeostasis in
A. thaliana, resulting in higher auxin levels in the root system. In addition, species of the genus
Bacillus spp. can synthesize auxins, gibberellins, cytokinins, and spermidines, which increases the division and elongation of root cells [
84]. Roots are considered one of the essential adaptive traits for withstanding water stress. Much evidence shows that plants with more prolific, deeper, and higher root biomass can tolerate water stress better than plants with thinner root systems since roots are the only organ capable of extracting water from the soil profile [
85,
86].
In addition to increased rooting, which increases the uptake of water and nutrients, enabling the tolerance to water deficiency in plants [
74,
75,
87], it also increases root and shoot dry matter, directly related to the plant’s WUE [
39]. In this study, inoculation increased the absorption of N, P, Mn, and Zn at 63 DAT and increased WUE at whole plant level under more severe water stress.
Increased water restriction led to increased bifurcations and the surface area of the roots at 60–80 cm depth. Water deficit stimulates the expansion of the root system to deeper regions of the soil profile [
88,
89,
90,
91]. The emission of root hairs increases the surface area and maximizes water uptake [
75].
Water entry into the xylem directly affects the concentration of ions in the leaf tissues. Under water restriction, nutrient absorption decreases due to transpiration, which reduces mass flow. However, due to the reduction in dry matter mass resulting from water restriction, the reduction in absorption may have a low effect on the element concentration in the tissue [
92]. Thus, the final nutrient concentration in the tissues depends on the relation between the reduction in uptake and dry matter accumulation. If the decrease in uptake is more significant than the reduction in dry matter accumulation, the element concentration in the tissues will be more significantly affected [
93]. Here, we found an influence of water regimes on N, P, Ca, Mn, Zn, and Fe levels. On the other hand, water regimes did not affect K, Mg, S, B, and Cu levels, probably due to the decrease in dry matter mass accumulation. However, leaf accumulation of these nutrients, considering dry matter mass, was strongly influenced by water regimes.
Around 40% to 70% of the N and 80% to 90% of the P fertilizers applied are lost to the environment due to variations in soil dynamics [
94]. In this sense, the use of
B. licheniformis and
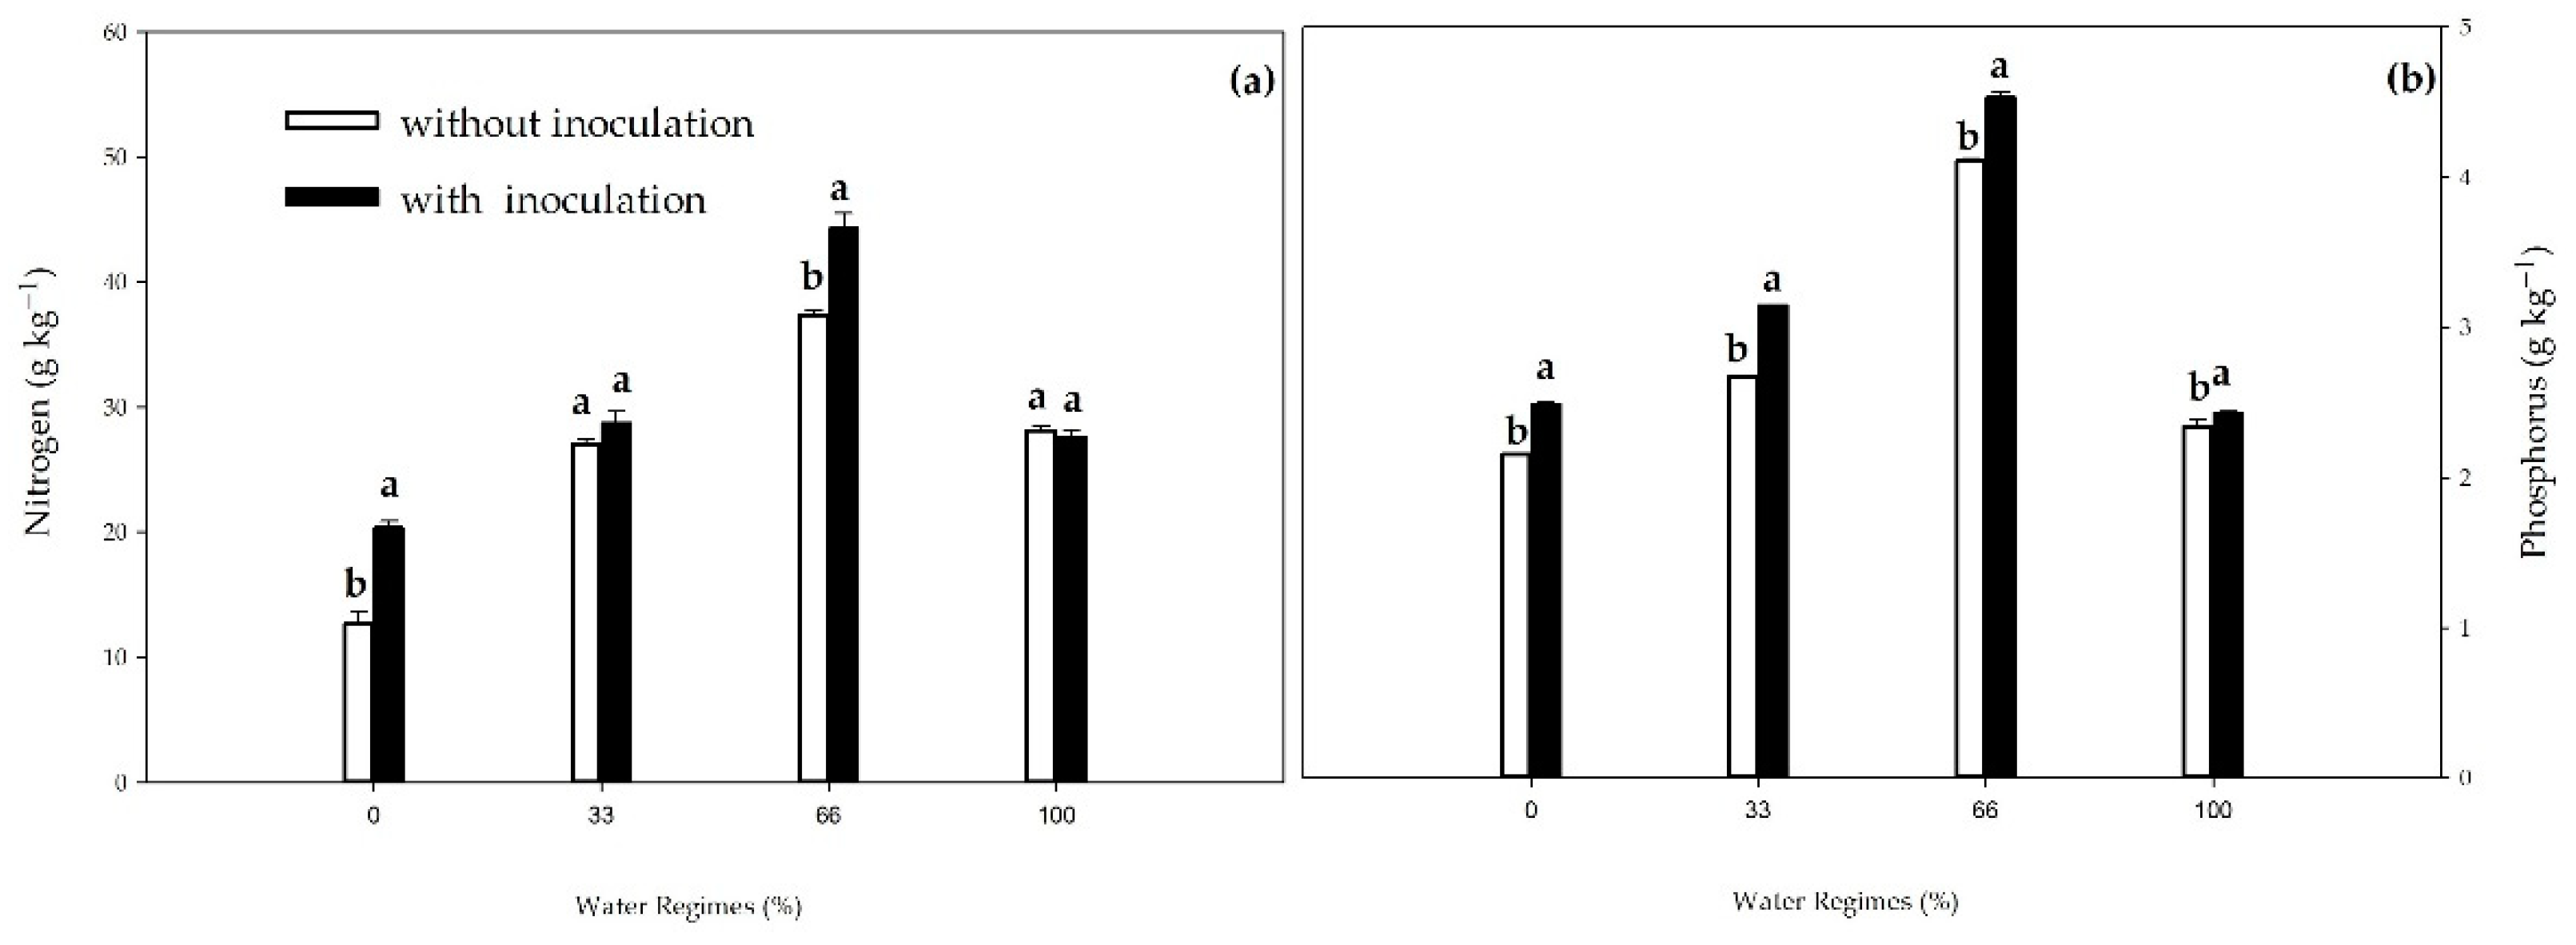
B. subtilis can minimize these losses and contribute to nutrient uptake, promoting sugarcane growth in the initial phase, with nutritional increases of 14.9% and 10.8%, respectively, compared to the control in the 66% water regime.
The increase in P content (13%) was also observed by [
95], studying PSS treated with
B. subtilis and
B. pumilus. In addition, the authors reported greater root growth and an increase in total dry matter in PSS treated with
B. subtilis. The
Bacillus genus is deeply associated with phosphorus solubilization [
96] due to mechanisms such as the production of organic acids, acidification, and chelation [
36,
97], which increases the nutrient uptake efficiency by the roots, especially under adequate water availability.
As diffusion is the primary means of P-root contact, water availability is indispensable for the successful uptake of this nutrient by the roots; the lower the humidity, the more critical the P diffusion, especially in sandy soils [
98,
99], which explains the increase in phosphorus availability from 0 to 66% of the irrigation depth. In addition, water is mainly required to mineralize organic P through microbial activity [
100].
However, PGPB contributed to minimizing this effect in conditions of low water availability since, under severe water stress, there was a 15.3% increase in the P content of inoculated plants. Fonseca et al. [
36], studying PSS inoculated and not inoculated with
B. subtilis under adequate water regime and moderate drought, found increases of 15% and 33% in P content in irrigated plants and under moderate drought, respectively, in inoculated plants.
The endogenous P availability influences the N metabolism, so plants with an adequate P supply increase the nitrate uptake from the soil solution, which is transported from the roots to the shoot, with a more significant accumulation of amino acids in the leaves and roots [
101,
102,
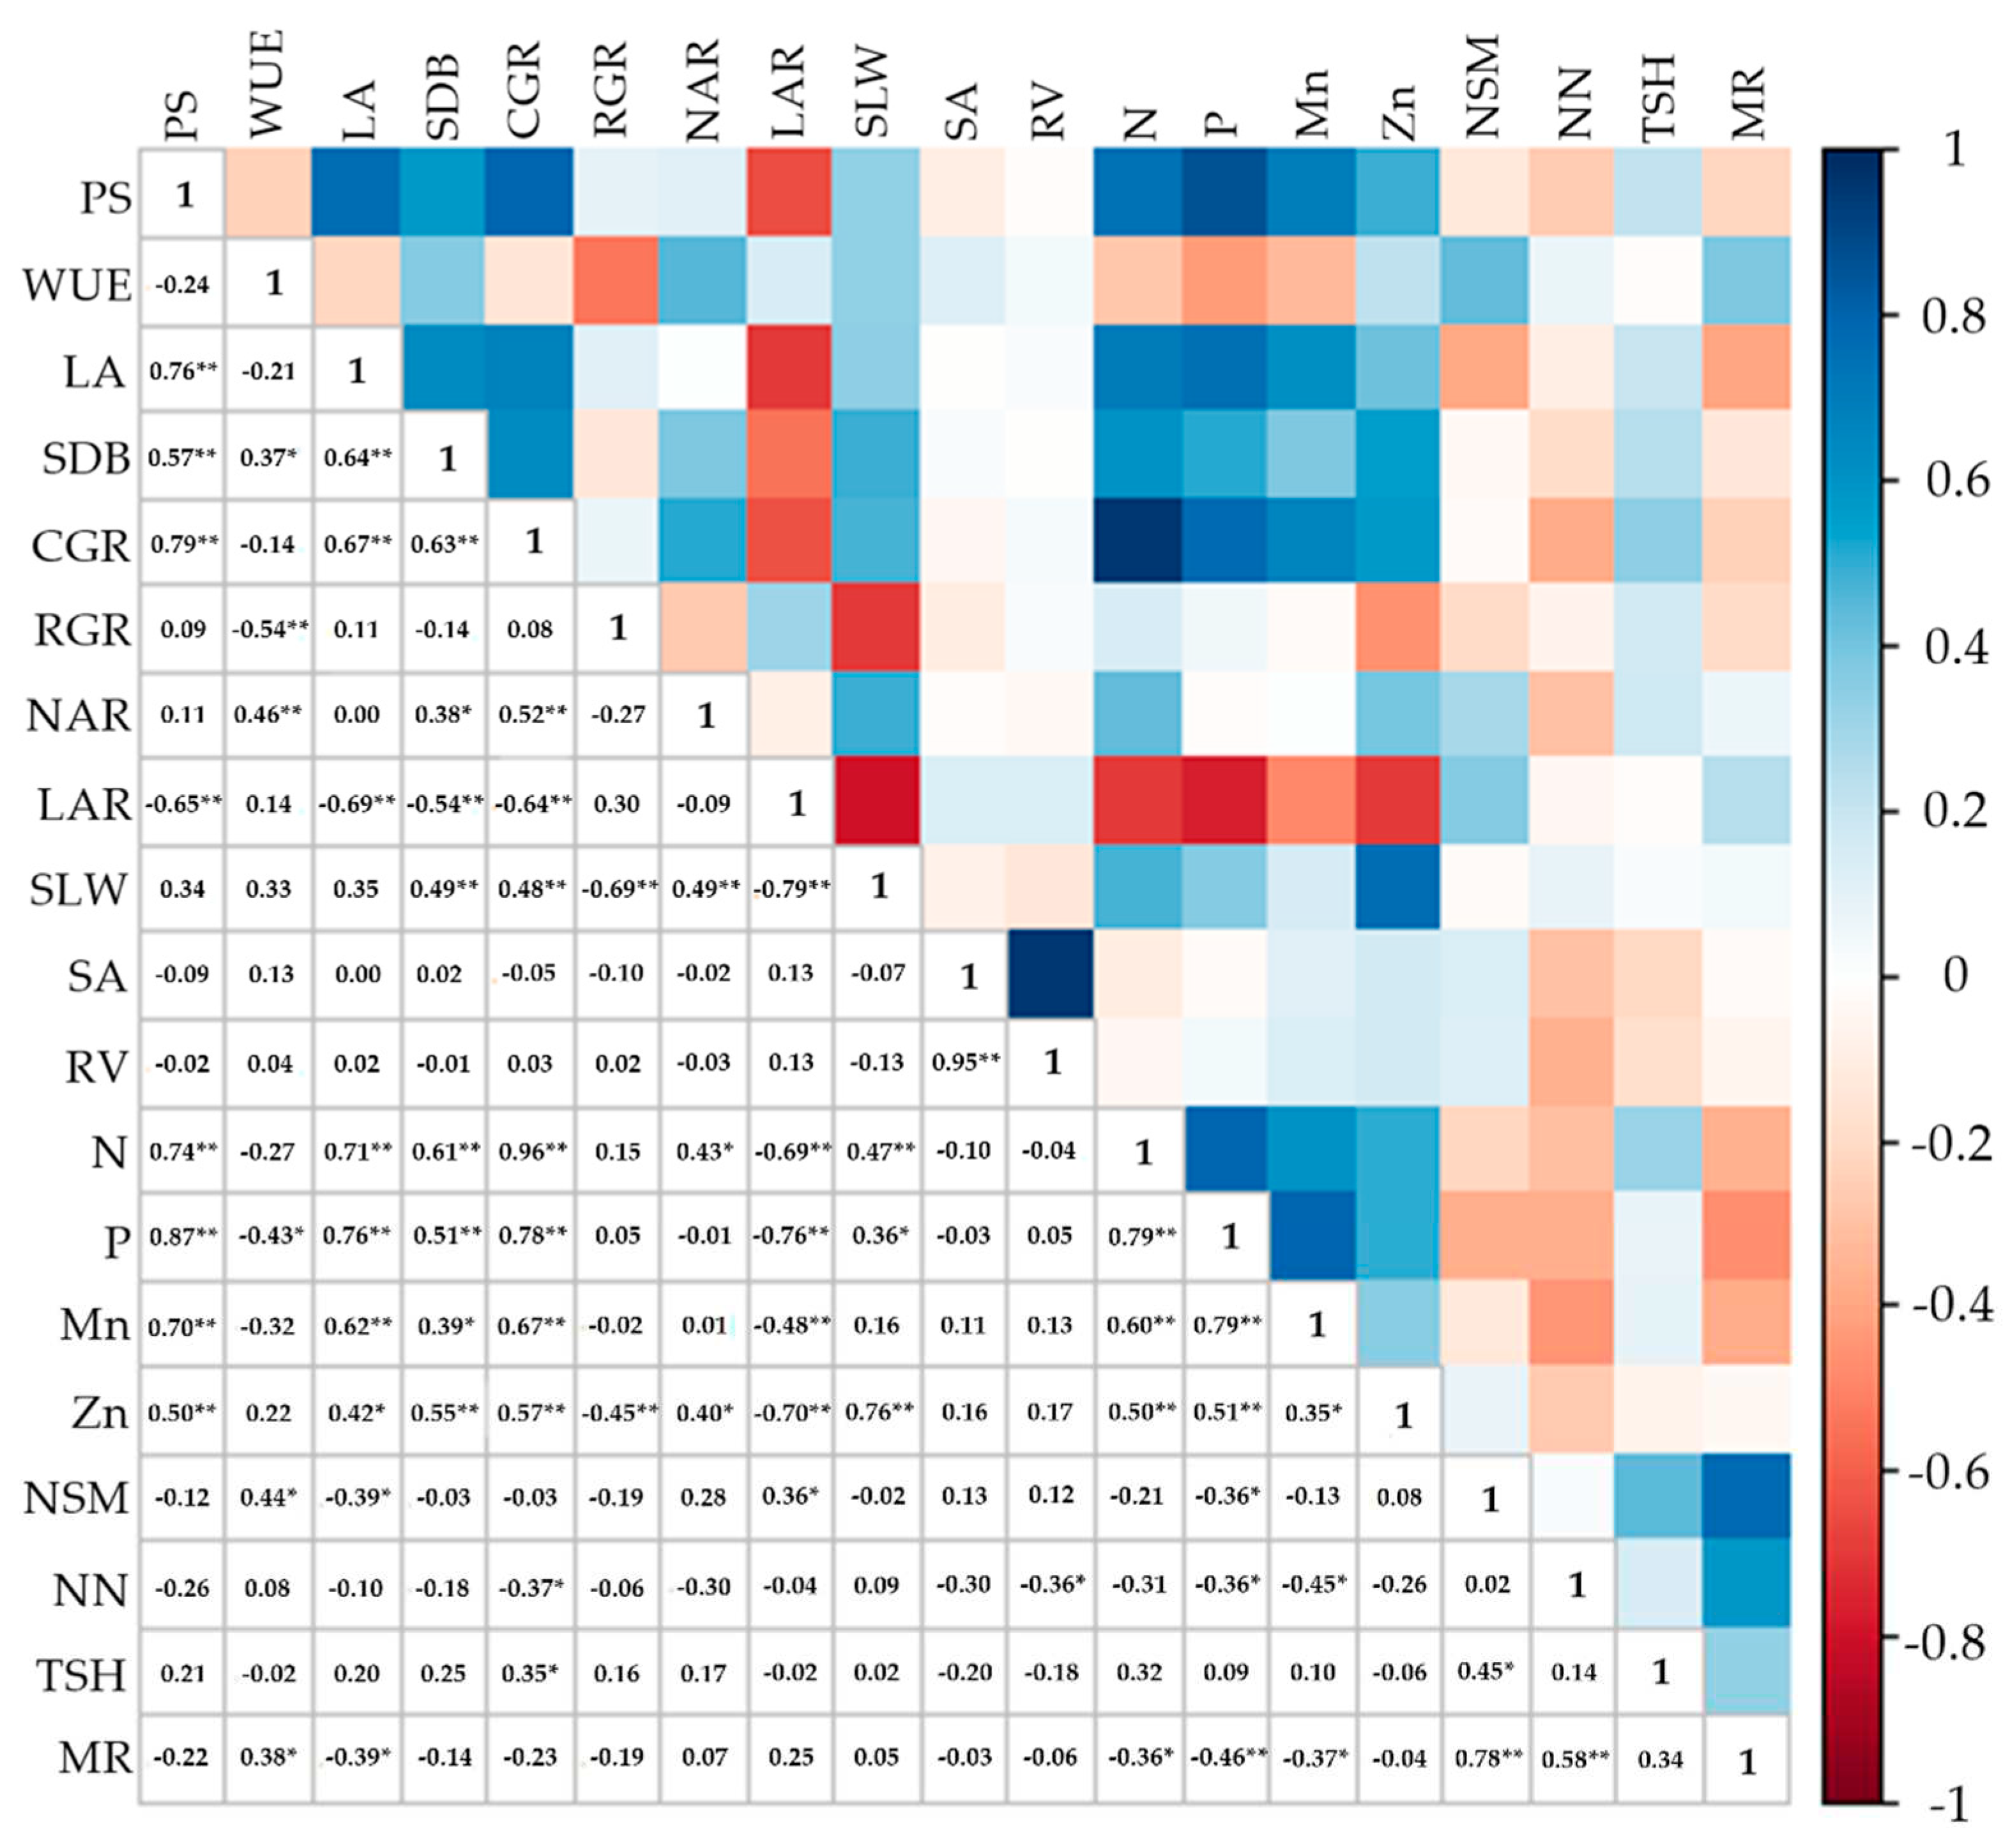
103]. This is why the N and P contents had a high correlation (R
2 = 0.8**), indicating that the metabolism dynamics of these nutrients are strongly interlinked. Nitrogen is essential for forming proteins and enzymes that help plant growth and development [
75]. In our study, water availability also contributed to higher N levels in the treatments associated with
Bacillus. The 66% rate was higher than the others, possibly due to the mechanisms above and the higher P levels in this irrigation rate. In a study carried out by Rosa et al. [
104], the authors assessed the interaction of N and P concentrations in sugarcane leaves inoculated with
A. brasilense,
B. subtilis, and
P. fluorescens as a function of phosphate fertilization and found an increase in N concentration which resulted in higher agro-industrial quality of the sugarcane.
Singh et al. [
105], when verifying the potential of nitrogen-fixing rhizobacteria, found that
Bacillus species isolated from the root system of sugarcane plants could produce ammonia and showed high nitrogenase activity in vitro. This explains the promotion of N uptake by sugarcane by applying
B. licheniformis and
B. subtilis [
36,
82,
106]. Under water stress, PGPB promoted a 60.8% increase in N content compared to the control, corroborating Gírio et al. [
37], who studied sugarcane seedlings inoculated with PGPB associated with the application of N in low-fertility soils and found gains in initial growth, dry matter mass, and root length, regardless of fertilizer application, resulting in a positive physiological effect of the bacteria on sugarcane growth.
The correlation between the contents of N, P, and Zn and SLW, CGR, LA, and PS shows that the increase in the leaf nutrient concentration resulted in greater thickness, which led to greater net CO2 assimilation, promoting greater survival and a higher crop growth rate. The effect of inoculation with Bacillus on the uptake of N and P is already well-established, but verifying a high correlation between these nutrients and plant survival elucidates the mechanisms of action of these microorganisms in the survival of pre-sprouted seedlings in the field.
PGPB also favored the uptake of Mn and Zn. Rana et al. [
107] cite that Mn and Zn can be supplied to plants by microbial exudates since uptake is carried out directly by microorganisms [
108]. Most bacteria of the
Bacillus genus are gram-positive and have a significant amount of teichoic acid and peptidoglycan. These compounds have amide and carboxyl groups that can give cells a functional charge through the proton loss originating from metals’ electrostatic attraction [
109]. In a heavy metal phytoremediation study, Huang et al. [
110]. reported that two species of the genus
Bacillus sp. improved Mn absorption and increased this nutrient content in the leaves and stem of
Broussonetia papyrifera. This suggests that the
Bacillus species studied promoted a more significant translocation of these nutrients to the shoot. In addition, the increase in root length and surface area seen in inoculated plants is closely linked to the uptake and translocation of micronutrients.
The soil Zn mobility is directly associated with microbial metabolism [
111]. Zn uptake and transport in plants occur in several stages and can be affected by nitrogen mediated by microorganisms [
107]. There is evidence that the plant nitrogen status can positively impact the nutrient translocation between the root and shoot and positively affect the root Zn uptake. Rana et al. [
107] demonstrated a highly significant correlation between Zn and N and P concentrations, as observed in our results (
Figure 14). This suggests that the improved nutritional status promoted by
B. licheniformis and
B. subtilis about the nutrients N and P may have favored Zn uptake.
Inoculation did not influence the yield variables SH, SD, NN, and IL at harvest. However, PGPB increased NT under the 33% and 100% water regimes. The number of tillers per meter is a component of productivity that acts as a strong indicator of drought tolerance in sugarcane [
112], so the increase obtained from
B. licheniformis and
B. subtilis in the initial 33% regime demonstrates the tolerance-promoting potential of these species. Other studies have also reported an increase in the number of tillers under inoculation with species of the genus
Bacillus [
36,
41,
96,
113].
The increase in NT in the 33% and 100% water regimes resulted in higher MEIOSI multiplication rates in these conditions, considering the high level of correlation between these variables (R
2 = 0.8**). It is, therefore, pertinent to emphasize the beneficial effects of inoculation with two species of
Bacillus in PSS in the context of producing basic propagative material for the MEIOSI system. The increase in the NT results in greater quantities of plant material suitable for subsequent planting throughout the area [
58,
114].
The different water regimes influenced the NN and, consequently, the IL. The lowest irrigation rates reduced IL. This phenomenon is called curling and is common in water restriction conditions [
115]. Therefore, as the multiplication rate is a result of the number of tillers per meter and the number of buds per stalk [
58], and lower initial irrigation rates resulted in shorter internodes and a greater number of nodes/buds, the multiplication rate responded with a linearity that was inversely proportional to the regimes.
All of these demonstrate that the synergism between B. licheniformis and B. subtilis favored the sugarcane pre-sprouted seedlings growth in the MEIOSI system, with an increase in root attributes and nutrient uptake and, therefore, favored the multiplication rate in the MEIOSI system, even under water deficiency.
Figure 1.
Rainfall (mm), average, maximum, and minimum temperatures (°C), and solar irradiance (MJ m–2 day–1) from August 2021 to April 2022.
Figure 1.
Rainfall (mm), average, maximum, and minimum temperatures (°C), and solar irradiance (MJ m–2 day–1) from August 2021 to April 2022.
Figure 2.
Sugarcane pre-sprouted seedlings survival in the field under different water regimes and with or without inoculation of B. licheniformis and B. subtilis at 30 DAT. Different letters indicate differences for inoculation by Student’s t-test (p≤0.05). **indicates the significance of the water regimes regression at 1% (p≤0.01).
Figure 3.
Stalk height (a), stalk diameter (b), number of tillers (c), and shoot dry biomass (d) of sugarcane pre-sprouted seedlings in the field under different water regimes and with or without inoculation of B. licheniformis and B. subtilis at 63 DAT. Different letters indicate differences for inoculation by Student’s t-test (p≤0.05). * e **indicates the significance of the water regimes regression at 5% (p≤0.01) and 1% (p≤0.01), respectively.
Figure 4.
Water use efficiency (WUE) of sugarcane pre-sprouted seedlings in the field with or without inoculation of B. licheniformis and B. subtilis under different water regimes at 63 DAT. Different letters indicate differences for inoculation within water regimes by Student’s t-test (p≤0.05).
Figure 4.
Water use efficiency (WUE) of sugarcane pre-sprouted seedlings in the field with or without inoculation of B. licheniformis and B. subtilis under different water regimes at 63 DAT. Different letters indicate differences for inoculation within water regimes by Student’s t-test (p≤0.05).
Figure 5.
Crop growth rate (CGR) of sugarcane pre-sprouted seedlings with or without inoculation of B. licheniformis and B. subtilis under the 0% (a), 33% (b), 66% (c), and 100% (d) water regimes.
Figure 5.
Crop growth rate (CGR) of sugarcane pre-sprouted seedlings with or without inoculation of B. licheniformis and B. subtilis under the 0% (a), 33% (b), 66% (c), and 100% (d) water regimes.
Figure 6.
Relative growth rate (RGR) of sugarcane pre-sprouted seedlings with or without inoculation of B. licheniformis and B. subtilis under the 0% (a), 33% (b), 66% (c), and 100% (d) water regimes.
Figure 6.
Relative growth rate (RGR) of sugarcane pre-sprouted seedlings with or without inoculation of B. licheniformis and B. subtilis under the 0% (a), 33% (b), 66% (c), and 100% (d) water regimes.
Figure 7.
Net assimilation rate (NAR) of sugarcane pre-sprouted seedlings with or without inoculation of B. licheniformis and B. subtilis under the 0% (a), 33% (b), 66% (c), and 100% (d) water regimes.
Figure 7.
Net assimilation rate (NAR) of sugarcane pre-sprouted seedlings with or without inoculation of B. licheniformis and B. subtilis under the 0% (a), 33% (b), 66% (c), and 100% (d) water regimes.
Figure 8.
Leaf area ratio (LAR) of sugarcane pre-sprouted seedlings with or without inoculation of B. licheniformis and B. subtilis under the 0% (a), 33% (b), 66% (c), and 100% (d) water regimes.
Figure 8.
Leaf area ratio (LAR) of sugarcane pre-sprouted seedlings with or without inoculation of B. licheniformis and B. subtilis under the 0% (a), 33% (b), 66% (c), and 100% (d) water regimes.
Figure 9.
Specific leaf area (SLA) of sugarcane pre-sprouted seedlings with or without inoculation of B. licheniformis and B. subtilis under the 0% (a), 33% (b), 66% (c), and 100% (d) water regimes.
Figure 9.
Specific leaf area (SLA) of sugarcane pre-sprouted seedlings with or without inoculation of B. licheniformis and B. subtilis under the 0% (a), 33% (b), 66% (c), and 100% (d) water regimes.
Figure 10.
Specific leaf weight (SLW) of sugarcane pre-sprouted seedlings with or without inoculation of B. licheniformis and B. subtilis under the 0% (a), 33% (b), 66% (c), and 100% (d) water regimes.
Figure 10.
Specific leaf weight (SLW) of sugarcane pre-sprouted seedlings with or without inoculation of B. licheniformis and B. subtilis under the 0% (a), 33% (b), 66% (c), and 100% (d) water regimes.
Figure 11.
Nitrogen (N) (a) and phosphorus (P) contents (b) in leaves of sugarcane pre-sprouted seedlings with or without inoculation of B. licheniformis and B. subtilis under different water regimes at 63 DAT. Different letters indicate differences for inoculation within water regimes by Student’s t-test (p≤0.01 or p≤0.01).
Figure 12.
Manganese (Mn) (a) and zinc (Zn) contents (b) in leaves of sugarcane pre-sprouted seedlings with or without inoculation of B. licheniformis and B. subtilis under different water regimes at 63 DAT. Error bars represent the minimum significant difference. **indicates the significance of the regression of water regimes at 1% (p≤0.01). NSnot significant.
Figure 13.
Number of stalks per meter (NSM) (a), tons of stalks per hectare (TSH) (b), and multiplication rate (MR) (c) of sugarcane pre-sprouted seedlings under different water regimes and with or without inoculation of B. licheniformis and B. subtilis. Error bars represent the minimum significant difference. * and ** indicate significance at 5% (p≤0.05) and 1% (p≤0.01), respectively. NSnot significant.
Figure 14.
Pearson’s linear correlation coefficient (p≤0.05* and p≤0.01**) between variables influenced by inoculation with B. licheniformis and B. subtilis. WR: water regimes; I: inoculation; PS: plant survival; WUE: water use efficiency; LA: leaf area; SDB: shoot dry biomass; CGR: crop growth rate; RGR: relative growth rate; NAR: net assimilatory rate; LAR: leaf area rate; SLW: specific leaf weight; SA: root surface area; RV: root; N: nitrogen content; P: phosphorus content; Mn: manganese content; Zn: zinc content; NSM: number of stalks for meter; NN: number of nodes; TSH: ton of stalks per hectare; MR: multiplication rate.
Table 1.
Initial soil chemical analysis from the soil of the experimental area.
Table 1.
Initial soil chemical analysis from the soil of the experimental area.
| Depth |
pH1
|
OM2
|
Al3+
|
H+Al |
K |
Ca |
Mg |
SB3
|
CTC |
V5
|
Presin
|
S |
Cu |
Fe |
Mn |
Zn |
B |
| cm |
CaCl2
|
g dm–1
|
mmolc dm–3
|
% |
mg dm–3
|
| 00-20 |
4.8 |
12.8 |
0 |
20.5 |
2.3 |
10 |
4 |
16.3 |
37 |
43 |
22 |
9 |
0.4 |
64 |
6.1 |
0.4 |
0.28 |
| 20-40 |
4.6 |
9.9 |
0 |
17.9 |
2.1 |
7 |
3 |
12.1 |
30 |
40 |
12 |
7 |
0.3 |
63 |
5.1 |
0.3 |
0.31 |
Table 2.
Interpretation of the correlation coefficient.
Table 2.
Interpretation of the correlation coefficient.
| R-value (+ or –) |
Interpretation |
| 0–0.25 |
Weak correlation |
| 0.26–0.50 |
Moderate correlation |
| 0.51–0.75 |
Strong correlation |
| 0.76–0.89 |
Very strong correlation |
Table 3.
Potassium (K), calcium (Ca), magnesium (Mg), and sulfur (S) contents in leaves of sugarcane pre-sprouted seedlings under different water regimes and with or without inoculation of B. licheniformis and B. subtilis at 63 DAT.
Table 3.
Potassium (K), calcium (Ca), magnesium (Mg), and sulfur (S) contents in leaves of sugarcane pre-sprouted seedlings under different water regimes and with or without inoculation of B. licheniformis and B. subtilis at 63 DAT.
| Treatments |
K |
Ca |
Mg |
S |
| g kg–1
|
|---|
| Inoculation |
With |
22.74 |
3.58 |
2.48 |
1.43 |
| Without |
22.27 |
3.55 |
2.48 |
1.34 |
| Water Regimes |
0% |
22.47 |
3.51 |
2.42 |
1.33 |
| 33% |
21.53 |
3.60 |
2.51 |
1.41 |
| 66% |
23.43 |
3.53 |
2.44 |
1.38 |
| 100% |
22.57 |
3.63 |
2.53 |
1.41 |
Table 4.
Boron (B), iron (Fe), and copper (Cu) contents in leaves of sugarcane pre-sprouted seedlings under different water regimes and with or without inoculation of B. licheniformis and B. subtilis at 63 DAT.
Table 4.
Boron (B), iron (Fe), and copper (Cu) contents in leaves of sugarcane pre-sprouted seedlings under different water regimes and with or without inoculation of B. licheniformis and B. subtilis at 63 DAT.
| Treatments |
B |
Fe |
Cu |
| mg kg–1
|
|---|
| Inoculation |
Without |
25.92 |
35.58 |
7.3 |
| With |
26.02 |
36.17 |
7.05 |
| Water regimes |
0% |
25.40 |
35.23 |
7.88 |
| 33% |
25.54 |
35.56 |
7.64 |
| 66% |
26.36 |
36.45 |
6.11 |
| 100% |
26.58 |
36.25 |
7.17 |
| |
R² - RL |
NS |
0.47** |
0.11* |
Table 5.
Nitrogen (N), phosphorus (P), potassium (K), calcium (Ca), magnesium (Mg), and sulfur (S) accumulation in leaves of sugarcane pre-sprouted seedlings under different water regimes and with or without inoculation of B. licheniformis and B. subtilis at 63 DAT.
Table 5.
Nitrogen (N), phosphorus (P), potassium (K), calcium (Ca), magnesium (Mg), and sulfur (S) accumulation in leaves of sugarcane pre-sprouted seedlings under different water regimes and with or without inoculation of B. licheniformis and B. subtilis at 63 DAT.
| Treatments |
N |
P |
K |
Ca |
Mg |
S. |
| mg plant–1
|
|---|
| Inoculation |
Without |
138.01 |
16.68 |
103.68 |
16.46 |
11.34 |
6.25 |
| With |
179.94 |
21.72 |
127.16 |
20.46 |
14.38 |
7.71 |
| Water regimes |
0% |
59.68 |
7.73 |
70.71 |
11.24 |
7.79 |
3.99 |
| 33% |
142.52 |
15.08 |
109.95 |
18.64 |
12.93 |
7.18 |
| 66% |
145.80 |
22.60 |
122.00 |
18.39 |
12.65 |
7.18 |
| 100% |
287.91 |
31.39 |
159.01 |
25.58 |
18.08 |
9.58 |
| |
R² - RL |
0.56** |
0.57** |
0.32** |
0.29** |
0.28** |
0.35** |
Table 6.
Boron (B), manganese (Mn), zinc (Zn), iron (Fe), and copper (Cu) accumulation in leaves of sugarcane pre-sprouted seedlings under different water regimes and with or without inoculation of B. licheniformis and B. subtilis at 63 DAT.
Table 6.
Boron (B), manganese (Mn), zinc (Zn), iron (Fe), and copper (Cu) accumulation in leaves of sugarcane pre-sprouted seedlings under different water regimes and with or without inoculation of B. licheniformis and B. subtilis at 63 DAT.
| Treatments |
B |
Mn |
Zn |
Fe |
Cu |
| mg plant–1
|
|---|
| Inoculation |
Without |
0.12 |
0.47 |
0.58 |
1.64 |
1.73B
|
| With |
0.15 |
0.69 |
0.77 |
1.98 |
2.20A
|
| Water regimes |
0% |
0.09 |
0.31 |
0.39 |
1.00 |
0.02 |
| 33% |
0.13 |
0.50 |
0.66 |
1.64 |
0.04 |
| 66% |
0.14 |
0.64 |
0.70 |
1.71 |
0.03 |
| 100% |
0.19 |
0.87 |
0.96 |
2.91 |
0.02 |
| |
R² - RL |
0.29** |
0.41** |
0.30** |
0.42** |
0.27** |
Table 7.
Root length (RL), surface area (SA), area projection (AP), root volume (RV), average root diameter (RD), and number of bifurcations (NBif) of sugarcane pre-sprouted seedlings under different water regimes and with or without inoculation of B. licheniformis and B. subtilis at four depths (0–20, 20–40, 40–60, and 60–80 cm) at 243 DAT.
| Traits |
Treatments |
0–20 |
20–40 |
40–60 |
60–80 |
| RL (cm2 cm–3) |
Inoculation |
Without |
3.49 |
1.16 |
0.38 |
0.30 |
| With |
3.84 |
1.66 |
0.52 |
0.45 |
| Water regimes |
0% |
3.87 |
1.86 |
0.59 |
0.67 |
| 33% |
3.81 |
1.25 |
0.40 |
0.33 |
| 66% |
3.70 |
1.31 |
0.44 |
0.28 |
| 100% |
3.26 |
1.22 |
0.38 |
0.22 |
| |
R² - RL |
NS |
NS |
NS |
0.33** |
| SA (cm2 cm–3) |
Inoculation |
Without |
0.40B
|
0.21 |
0.07 |
0.04 |
| With |
0.45A
|
0.22 |
0.09 |
0.07 |
| Water regimes |
0% |
0.47 |
0.32 |
0.10 |
0.10 |
| 33% |
0.39 |
0.18 |
0.09 |
0.05 |
| 66% |
0.43 |
0.16 |
0.06 |
0.04 |
| 100% |
0.41 |
0.21 |
0.07 |
0.03 |
| |
RL – R² |
NS |
NS |
NS |
0.26** |
| AP (cm2 cm–3) |
Inoculation |
Without |
0.13B
|
0.06 |
0.02 |
0.02 |
| With |
0.14A
|
0.07 |
0.03 |
0.02 |
| Water regimes |
0% |
0.15 |
0.10 |
0.03 |
0.03 |
| 33% |
0.13 |
0.06 |
0.03 |
0.02 |
| 66% |
0.14 |
0.05 |
0.02 |
0.01 |
| 100% |
0.13 |
0.07 |
0.02 |
0.01 |
| |
RL – R² |
NS |
NS |
NS |
0.25** |
| RV (cm3 cm–3) |
Inoculation |
Without |
3.7×10⁻⁴B
|
4.4×10⁻⁴
|
1.1×10⁻⁴
|
7.2×10⁻⁴
|
| With |
4.3×10⁻⁴A
|
2.5×10⁻⁴
|
0.0015 |
9.0×10⁻⁵
|
| Water regimes |
0% |
4.5×10⁻⁴
|
7.3×10⁻⁴
|
1.7×10⁻⁴
|
1.2×10⁻⁴
|
| 33% |
3.4×10⁻⁴
|
2.0×10⁻⁴
|
1.9×10⁻⁴
|
1.4×10⁻³
|
| 66% |
4.1×10⁻⁴
|
1.6×10⁻⁴
|
6.0×10⁻⁵
|
6.0×10⁻⁵
|
| 100% |
4.2×10⁻⁴
|
2.8×10⁻⁴
|
1.0×10⁻⁴
|
4.0×10⁻⁵
|
| |
RL – R² |
NS |
NS |
NS |
NS |
| SD (cm) |
Inoculation |
Without |
1.8×10⁻⁴
|
1.3×10⁻⁴
|
1.2×10⁻⁴
|
1.0×10⁻⁴
|
| With |
1.9×10⁻⁴
|
1.1×10⁻⁴
|
1.3×10⁻⁴
|
1.1×10⁻⁴
|
| Water regimes |
0% |
1.9×10⁻⁴
|
1.4×10⁻⁴
|
1.3×10⁻⁴
|
1.2×10⁻⁴
|
| 33% |
1.7×10⁻⁴
|
1.1×10⁻⁴
|
1.5×10⁻⁴
|
1.0×10⁻⁴
|
| 66% |
1.8×10⁻⁴
|
1.0×10⁻⁴
|
9.0×10⁻⁵
|
1.0×10⁻⁴
|
| 100% |
1.9×10⁻⁴
|
1.3×10⁻⁴
|
1.3×10⁻⁴
|
1.1×10⁻⁴
|
| |
RL – R² |
NS |
NS |
NS |
NS |
| NBif (un cm–3) |
Inoculation |
Without |
24.56 |
8.16 |
2.65 |
1.88 |
| With |
27.68 |
11.88 |
4.04 |
3.45 |
| Water regimes |
0% |
26.39 |
12.86 |
4.37 |
4.65 |
| 33% |
31.00 |
8.74 |
3.09 |
2.66 |
| 66% |
25.94 |
10.00 |
3.27 |
1.97 |
| 100% |
21.14 |
8.48 |
2.64 |
1.39 |
| |
RL – R² |
NS |
NS |
NS |
0.27* |
Table 8.
Stalk length (RL), stalk diameter (SD), number of nodes (NN), internode length (IL), and mass of 10 stalks (M10) of sugarcane pre-sprouted seedlings under different water regimes and with or without inoculation of B. licheniformis and B. subtilis at 245 DAT.
Table 8.
Stalk length (RL), stalk diameter (SD), number of nodes (NN), internode length (IL), and mass of 10 stalks (M10) of sugarcane pre-sprouted seedlings under different water regimes and with or without inoculation of B. licheniformis and B. subtilis at 245 DAT.
| Treatments |
SL |
SD |
NN |
IL |
M10 |
| m |
mm |
un stalk–1
|
cm |
kg |
| Inoculation |
Without |
1.21 |
27.80 |
11.46 |
10.65 |
7.58 |
| With |
1.17 |
27.82 |
10.75 |
10.97 |
7.31 |
| Water regimes |
0% |
1.11 |
26.67 |
11.09 |
9.99 |
7.77 |
| 33% |
1.20 |
28.70 |
12.01 |
9.95 |
7.59 |
| 66% |
1.18 |
27.41 |
11.27 |
10.61 |
6.81 |
| 100% |
1.27 |
28.47 |
10.05 |
12.70 |
7.61 |
| |
R² - RL |
NS |
NS |
0.12* |
0.44** |
NS |
