Preprint
Article

The Influence of Lobbies: Analyzing Group Consensus from a Physics Approach

Altmetrics

Downloads

104

Views

39

Comments

0

A peer-reviewed article of this preprint also exists.

This version is not peer-reviewed

Submitted:

02 January 2024

Posted:

03 January 2024

You are already at the latest version

Alerts
Abstract
In this paper we study the influence of a small group of agents (i.e., a lobby) who is trying to spread a rumor in a population using the well known model suggested by Galam. In particular, lobbies are modeled as subgroups of people who strategically choose their seating in the social space in order to protect their opinion and influence the others. We consider different social gatherings and simulate the opinion dynamics comparing situations in which a lobby is present to those without lobby. Our results show how the lobby can influence the opinion dynamics in terms of the prevailing opinion and the mean time to reach unanimity. The approach we follow overcomes some of the issues that behavioral economics and psychology have recently encountered in terms of replicability. This approach relates to the methodological revolution which is slowly changing the perspective in psychology.
Keywords: 
Subject: Physical Sciences  -   Other

1. Introduction

Besides the well known incident [1] and the more recent case [2] in behavioral economics, also in psychology replicability has been under scrutiny at least since 2015 [3] and alternative approaches to analyze the phenomena studied by these disciplines may help shedding light on human behavior in groups.
Social influence is a topic which has attracted a lot of interest from both social psychology [4] and behavioral economics [5]. In particular, social psychology provided some seminal experiments where the effect of groups in changing opinions [6] was investigated. Another interesting example can be found in the studies on the influence of small groups on majority consent [7]. These studies analyze group influence on the microscopic level and suggest some insights to be applied in the analysis of political change [8]. In particular, past research focused on two different aspects: the influence of majority (i.e. conformity, [6]) and the influence of minority [9]. Conformity studies show that the most frequent opinion in a group is able to exert a huge influence on individuals, leading them to provide inaccurate answers [6]. By contrast, studies on minority influence focused on how people resist to group pressure and how individuals are able to change the opinion held by the dominant position [10]. Minority studies have been applied to innovation and social change [11] and also to the study of influence on dominant positions [8]; for reviews on the influence of small groups see [7,12,13]. Further experimental studies have been conducted in order to shed light on the psychological processes of minority influences [14] and on strategies to be followed to influence dominant positions [15].
Recently, the widespreading of conspiracy theories [16] on different topics [17] but also about science [18,19] and the social process underlying their diffusion [20], show how these phenomena can be relevant for our society. Given the problems of replicability mentioned above, analytical approaches or replicable simulation models can be quite useful; therefore, we introduce minorities in the well known model proposed by Galam [21] which, already twenty years ago, analyzed the diffusion of hoaxes using sociophysics.
The structure of the paper is the following: in Section 2, we discuss some possible approaches to model opinion spreading; in Section 3 we summarize Galam’s model [21] and illustrate how we extend it introducing lobbies; the results of our simulation are analyzed in Section 4 and, finally, the last section is devoted to conclusions and further research.

2. Analytical and Computational Approaches to Opinion Spreading

Although experimental studies provided by social psychology offer important contributions in understanding the proximate mechanisms that influence human behavior, this approach presents some intrinsic limits [9]. One of these limits is that experimental studies cannot investigate the temporal dimensions and the long-run effect of opinion dynamics on a population. Therefore, it is crucial to integrate the knowledge of the proximate processes derived from social psychology with methods that can focus on a more dynamic dimension. That is to say, once we know that a local majority opinion can influence individuals in small groups, how will this effect spread to the population? One attempt to fill this gap has been provided by sociophysics [22]. A sociophysic approach focuses on the dynamic dimension, i.e. the time needed to a minority to reach consensus in a population. One of the first attempts to integrate social psychological theories with the methods of sociophysics was proposed in [23]; this work provides a different context to test theories developed in the experimental setting, and allows for a validation of these concepts on a broader scale. In particular, this study focuses on the phenomenon of polarization in groups, which is the tendency of individuals to express more radical opinions in the presence of others.
Other approaches that can be integrated with social psychology for the study of opinion dynamics are mathematical modeling [24,25,26], and agent-based simulations [27,28]. Recently, the integration of other approaches such as Agent Based Modeling is becoming more and more popular (see e.g. [29]) because they make possible to consider several phenomena in social psychology “as emergent results of dynamically interactive processes taking place in their contexts”[30]. This is part of the methodological quiet revolution mentioned in [31] as statistics is moving from the mechanical application of a series of procedures to the building and the evaluation of models.
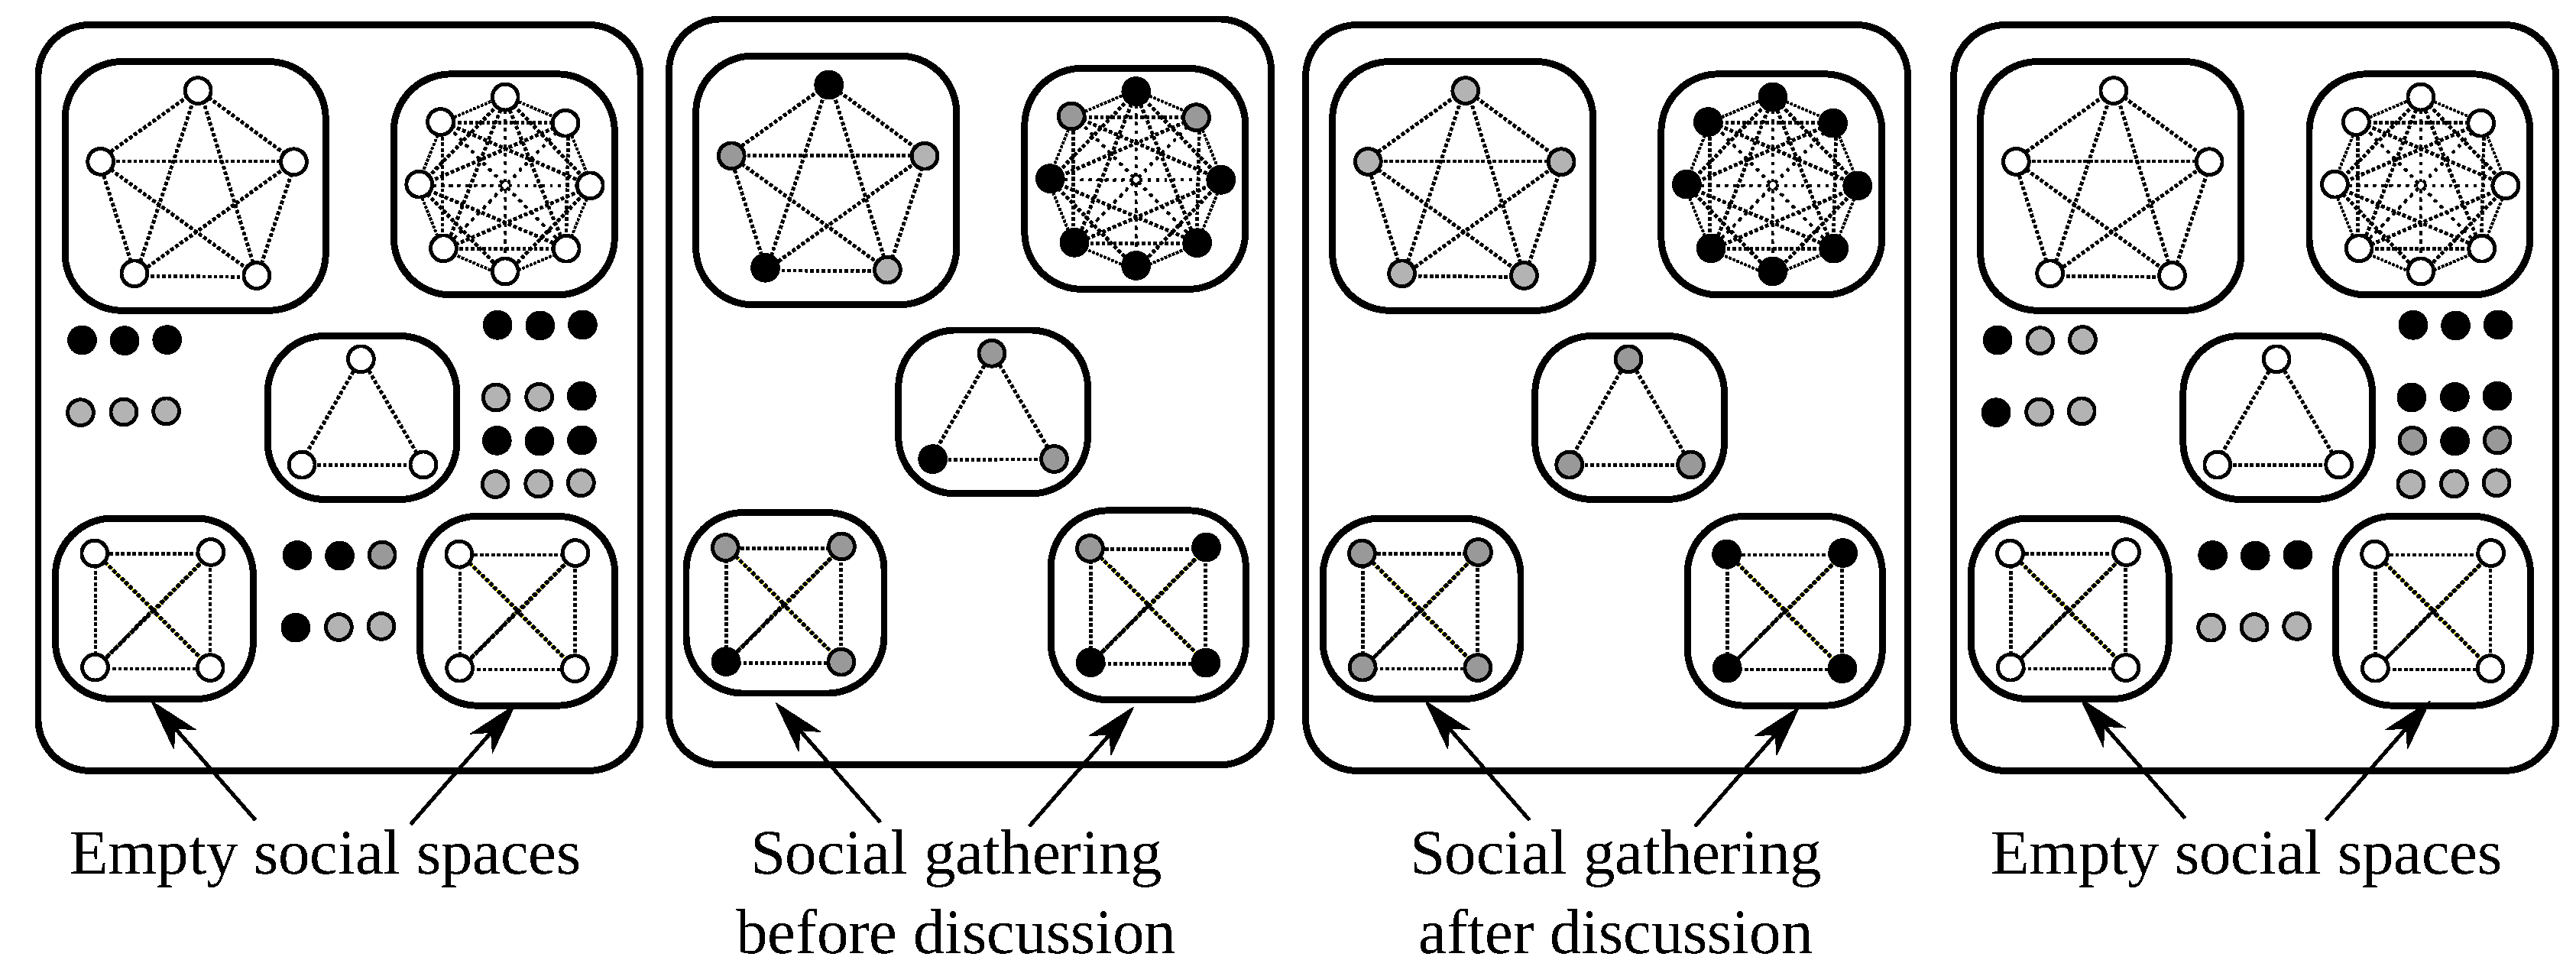
Among other disciplines, sociophysics is offering some important insights to the analysis of social influence in opinion dynamics and consensus [27,32,33]. One of the main interesting models is proposed in [21]. Galam’s model focuses on the analysis of the propagation of diffusion of hoaxes in public debates. To be more specific, in the Galam’s model individuals interact together on a specific topic in groups of different dimensions. The model shows that even if at the beginning an opinion represents the minority, after a certain amount of discussions this opinion can be diffused to the population. The configuration of different tables of different sizes where people discuss is called social space (see [21] and [34] for details). An example of interaction in the Galam’s model is provided in Figure 1. Further research introduced more complexity in this model [35]. For example, the agents proposed by [35] hold always the same opinion and have the ability to influence all the agents sitting at the table. In this research, we introduce the presence of lobbies in the Galam’s model. Lobbies are modeled as minorities that are able to influence other opinions with a specific strategy. In fact, members of the lobby have the ability to find and seat, when possible, at the tables where they can be the majority and exert their influence more efficiently.

3. Rumors and Lobbies in Galam’s Model

Galam’s model can be considered a dynamic application of conformity influence in different social gatherings. In [21], individuals have the same characteristics (i.e., they all meet randomly and change their opinion according to majority) and consensus can be reached when a specific minority threshold is reached. Therefore, Galam’s model does not explain the dynamics in which small organized groups as lobbies can implement some strategies to influence others’ behavior. Lobbies can be modeled in different ways and can have a wide range of strategies, behaviors or interactions. In this paper, we present a model of lobby capable of influencing the dynamics of opinions at strategic tables. To be more specific, as in other studies investigating seating positions at specific tables [36,37,38], lobbies are group of people who always sit at tables where they can influence others. The influence rule is the same of Galam’s model [21] but in our case we have a small part of the population who strategically sit at the tables where they represent the majority and then persuade the others. To summarize, we consider a Galam like model with a lobby, where the lobby is modeled as a subgroup of people with opinion ‘against X ’ who coordinate their sitting at the tables of the social space with the aim of influencing as many agents as possible of the opposite opinion without being overridden. The strategic choice of the lobby depends on the social space configuration. As it is impossible to consider all the possible social space configurations for any number of individuals we consider an example to study the opinion dynamics.
In Galam’s model [21] gatherings take place in different times, and each individual holds one of two possible opinions, e.g. in favor of X , or against X . When individuals meet in a specific gathering configuration (a table of 3, 4, …n individuals), they change their opinion according to the majority. Then, they will discuss again randomly in different social gatherings and change always their opinion according this rule.

3.1. The Model without Lobby

We consider a population of N individuals, with opinion X (in favor) or X ¯ (against it). In particular, as in [34], individuals interact in a social space consisting in a set of available tables T r N = T 1 , T 2 , , T L , whose size is denoted T r . The size of the tables in N are represented as a vector n = T 1 , T 2 , , T L R L , where 1 L < N and T r N T r = N . Opinions map into a boolean random variable o i for each individual i = 1 , , N s.t. o i X , t = 1 and o i X ¯ , t = 0 . The number of individuals sharing the same opinion at a given table of size s is denoted by n X and n X ¯ respectively, so that n X + n X ¯ = s .
At each time step t the dynamics of each individual’s opinion is governed by the following set of rules:
  • individuals are randomly distributed on the available seats;
  • individuals change their opinion according to a local or table majority rule, i.e., at each table if n X > n X ¯ then all the individuals sitting at that table will change to opinion X ; vice versa, if n X ¯ n X then all the individuals sitting at that table will change to opinion X ¯ .
This approach leads to a process where the individuals submit to the local majority with certainty; this is different, for instance, from [39] where individuals may also change opinion, with a certain probability, depending on a propensity parameter.

3.2. The Model with Lobby

We assume that an interest group, with the goal of influencing the population’s opinion, is able to strategically choose seats. Organized interests very often target opponents and undecideds [40]. We therefore assume that, within the population of N individuals, there exists a subset of size N * N –called lobby– who will strategically distribute on the available tables in order to maximize the number of new allies which will share their same opinion X ¯ . Taking into account the table majority rule defined above in SubSection 3.1, the dynamics rules are:
  • lobbyists sit at the tables, occupying half of the seats available at each table (if s is an even number), or s / 2 (if the seats are an odd number);
  • non-lobbyist individuals are randomly distributed on the remaining seats;
  • the table majority rule is applied and opinions are updated.

3.3. Simulation Model

The opinion dynamics can be modeled as a finite Markov chain [34], i.e., a discrete-time process for which the future state only depends on the present state and not on the past states [41]. In fact, all possible opinion configurations can be considered as states and the probability of transition between any couple of states can be computed as illustrated in [34]. As usual, for finite Markov chains the transition probabilities are arranged in a matrix [42, p. 374]; furthermore, from these matrices we computed the time of convergence to an opinion rather than another, i.e. the opinion dynamics according to each scenario. However, when the population is large, computing each transition probability may become overly time consuming and prone to errors; therefore, we used simulation rather than formally deriving the transition matrices.
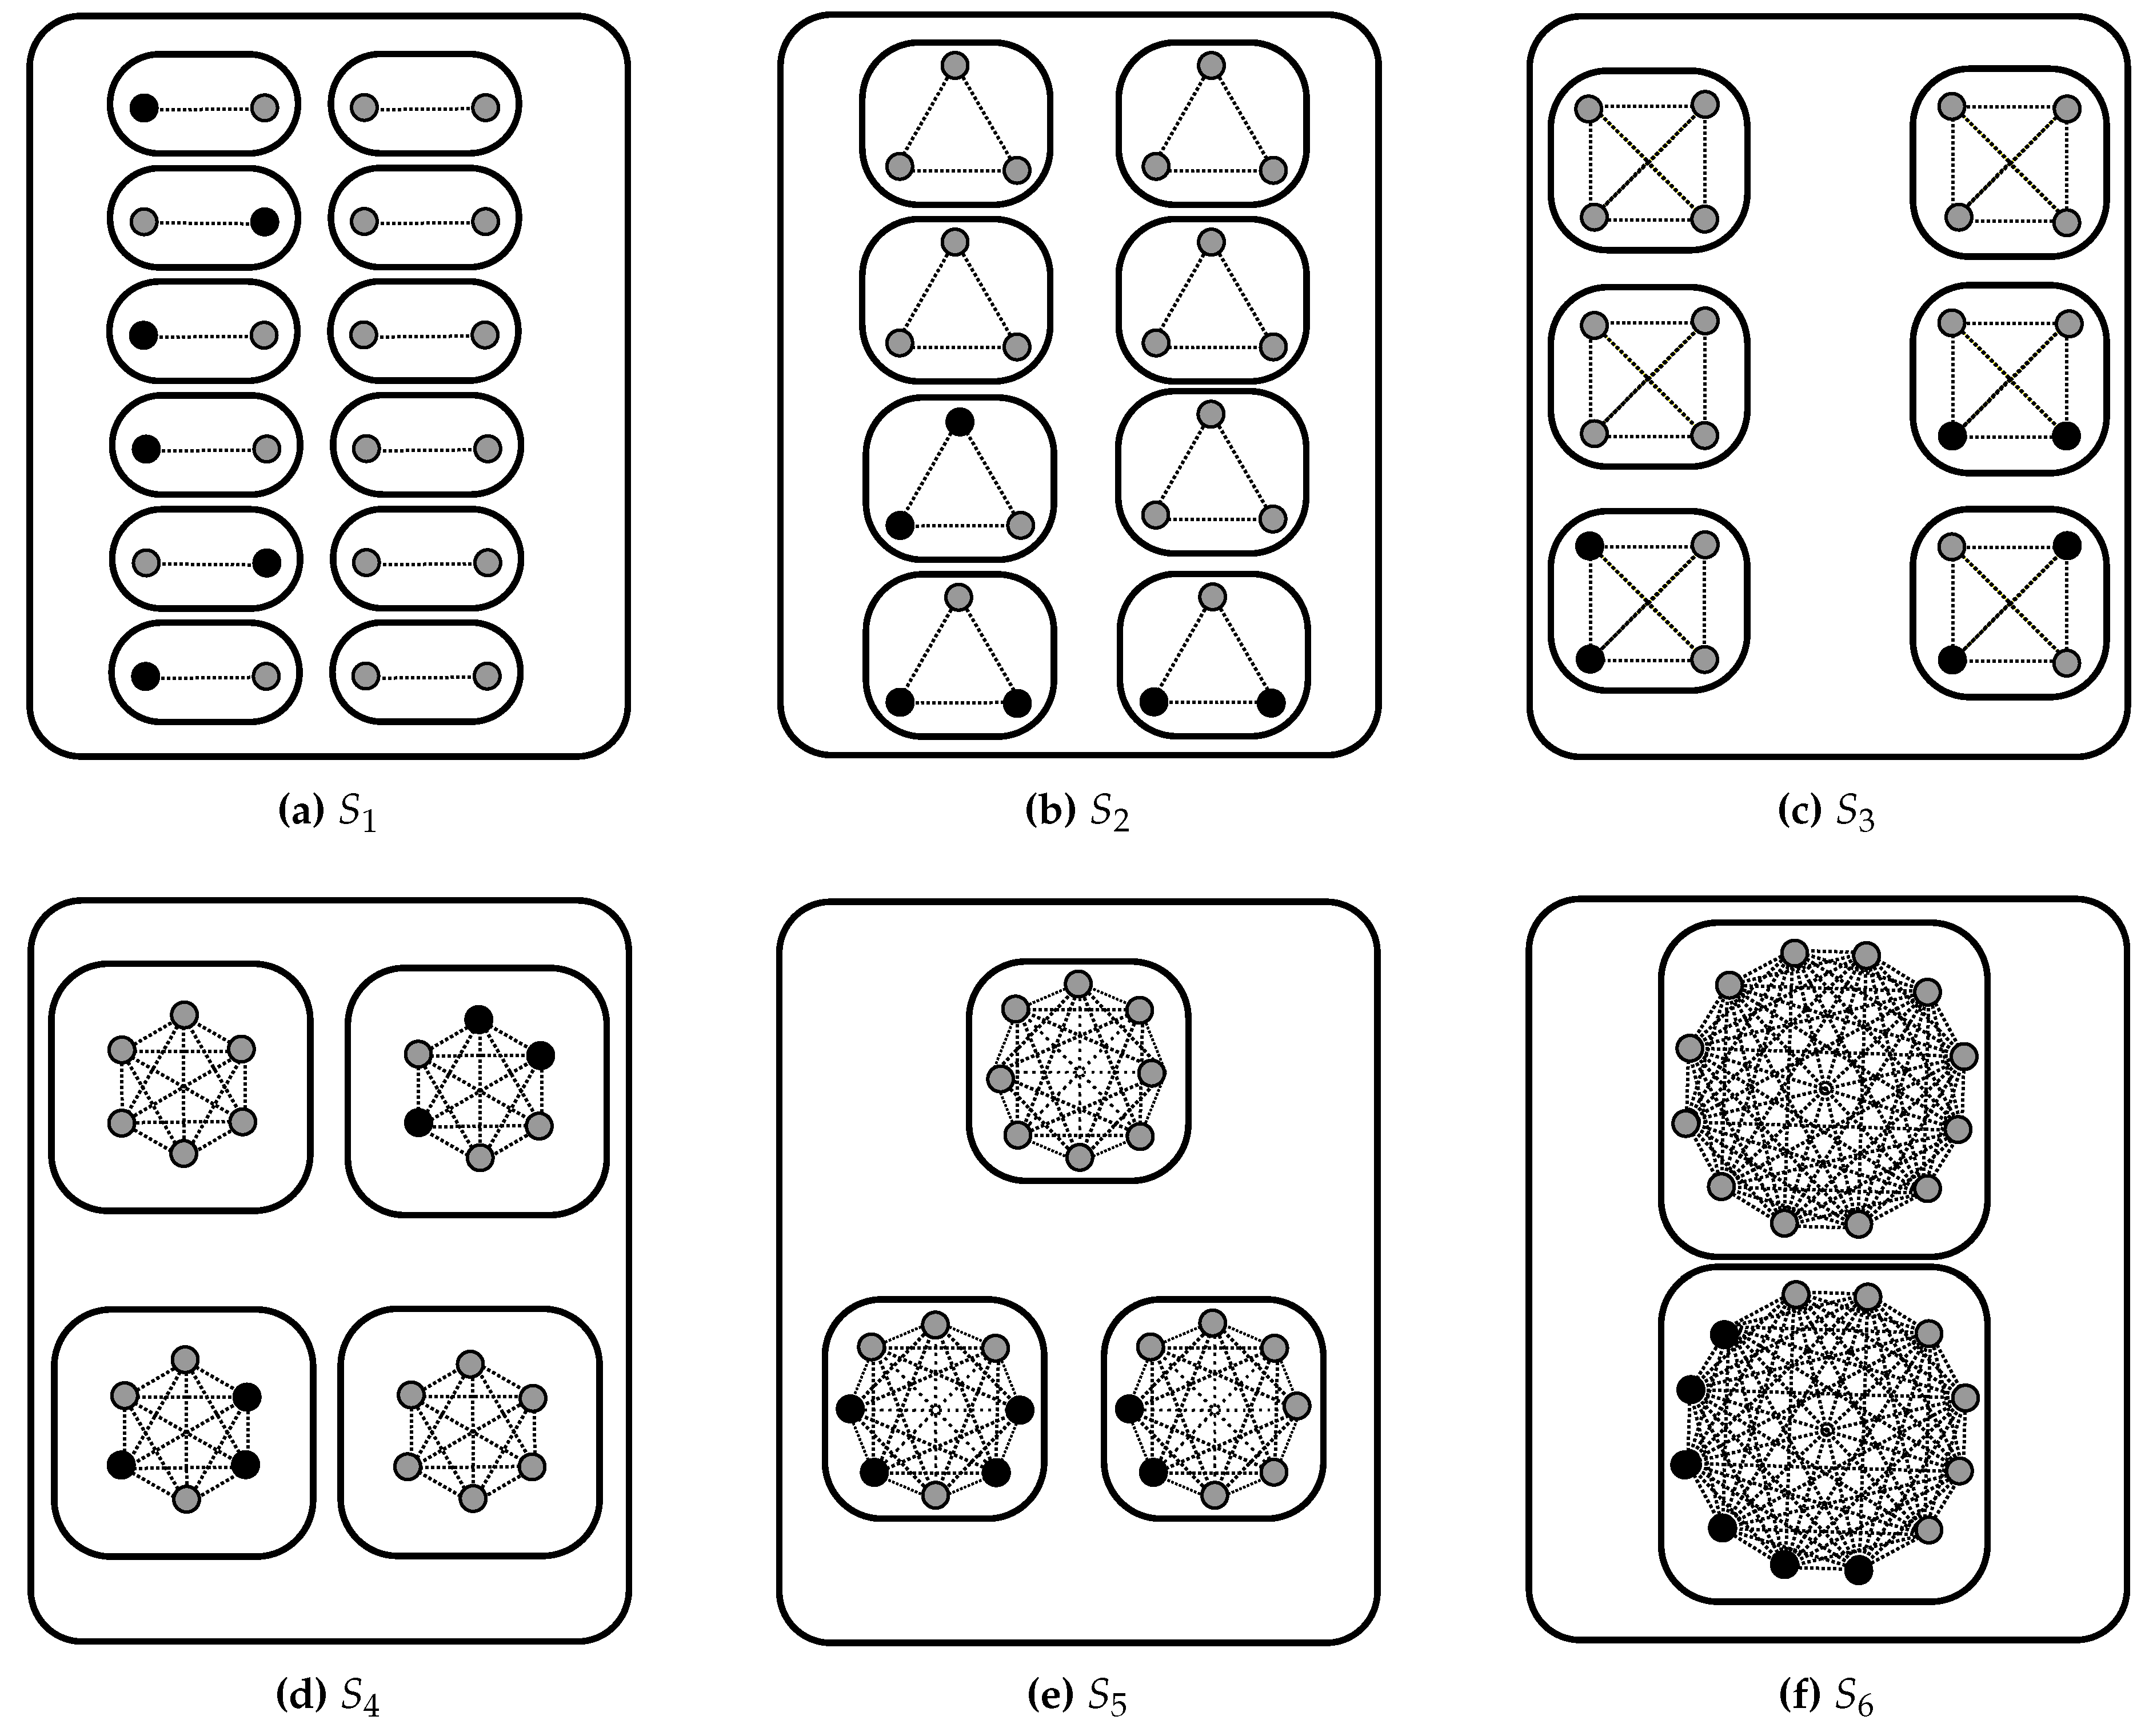
For the simulations we considered the population with N = 24 individuals as it offers a large enough number of social spaces; even in this case the partition number is too large for a systematic analysis of all the possible spaces since for N = 24 the partition number is 1,575 [43, A000041]; therefore we considered the special cases in which all the tables have the same size. In order to be able to asses the role of the lobby we limited its size to at most six individuals. The social spaces we considered, together with the strategic seating choices of the lobby members, are represented in Figure 2. As in the Galam’s model when a table has the same number of contrasting opinions, the bias is in favor of people with opinion ‘against X ’.
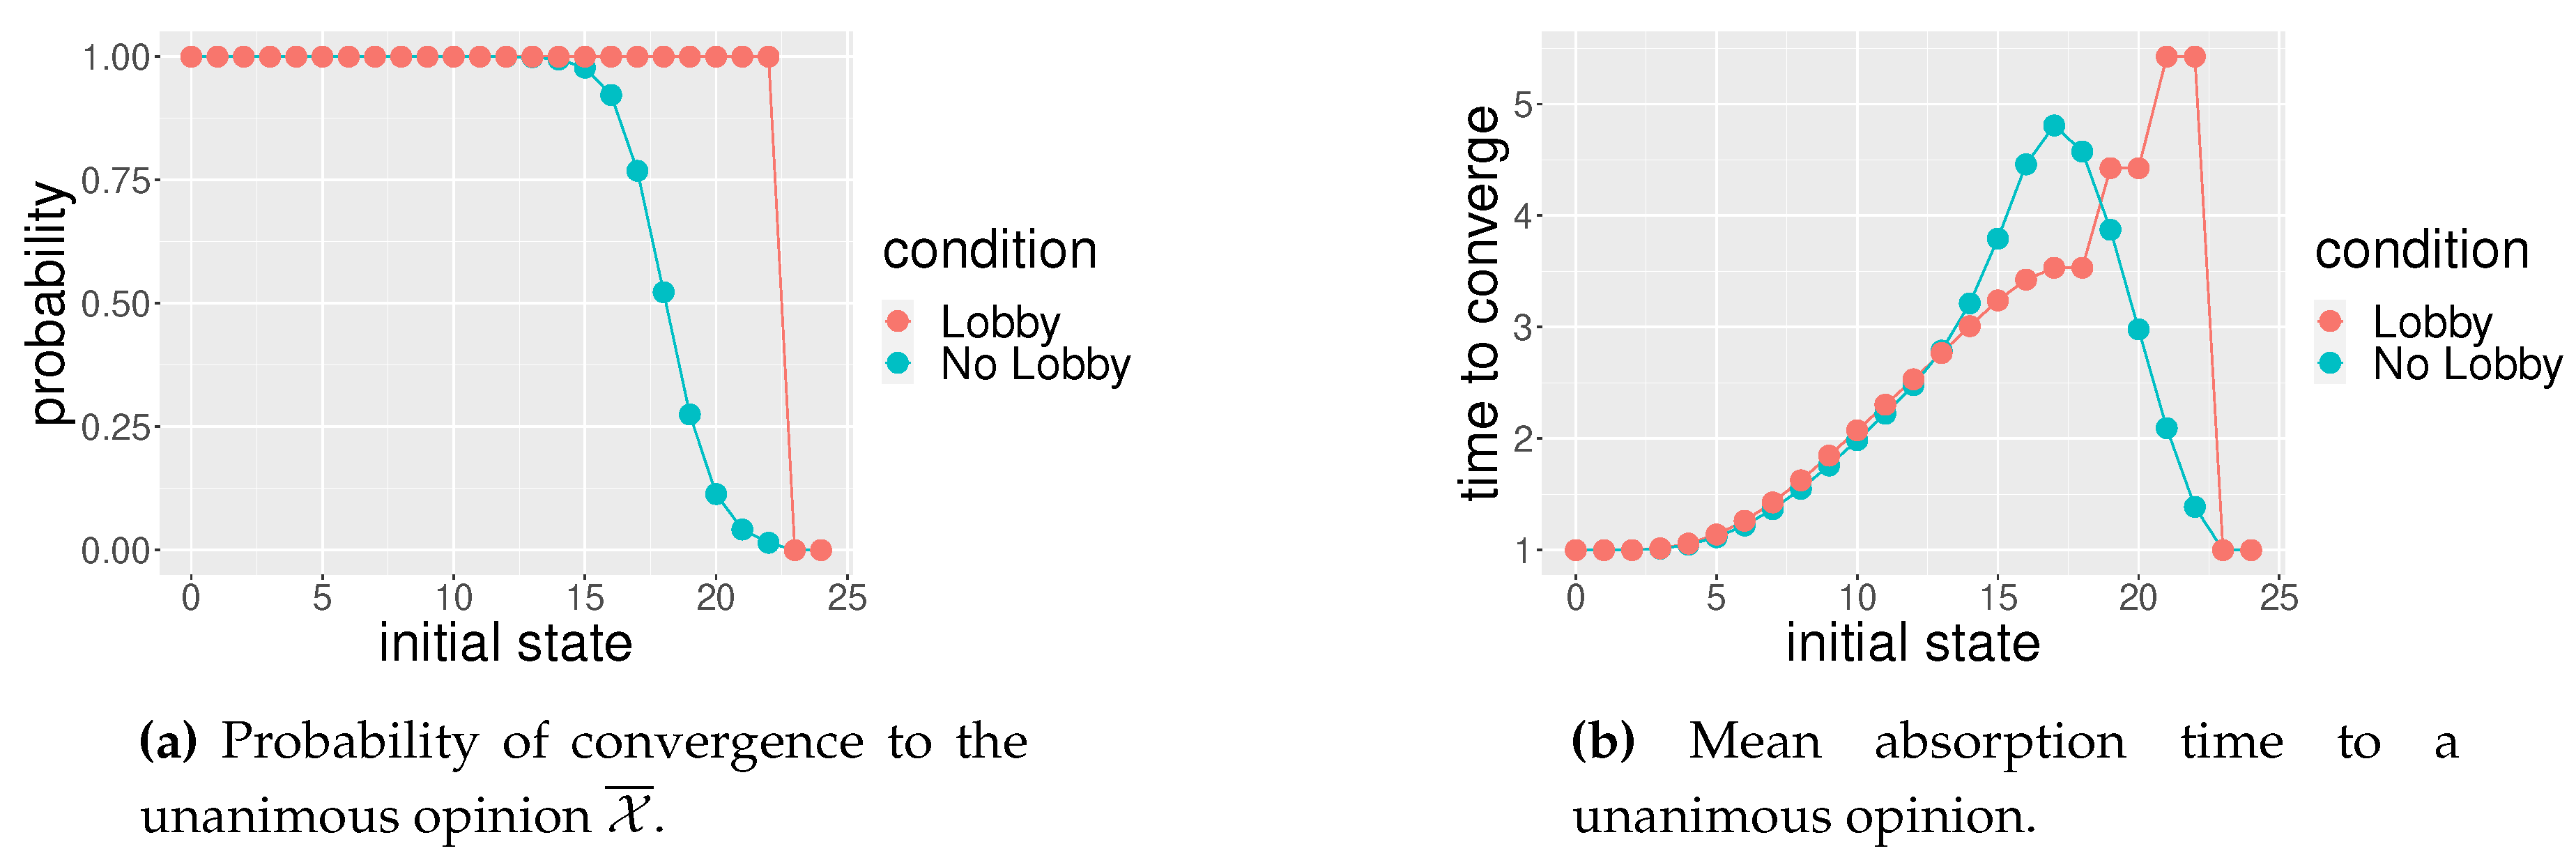
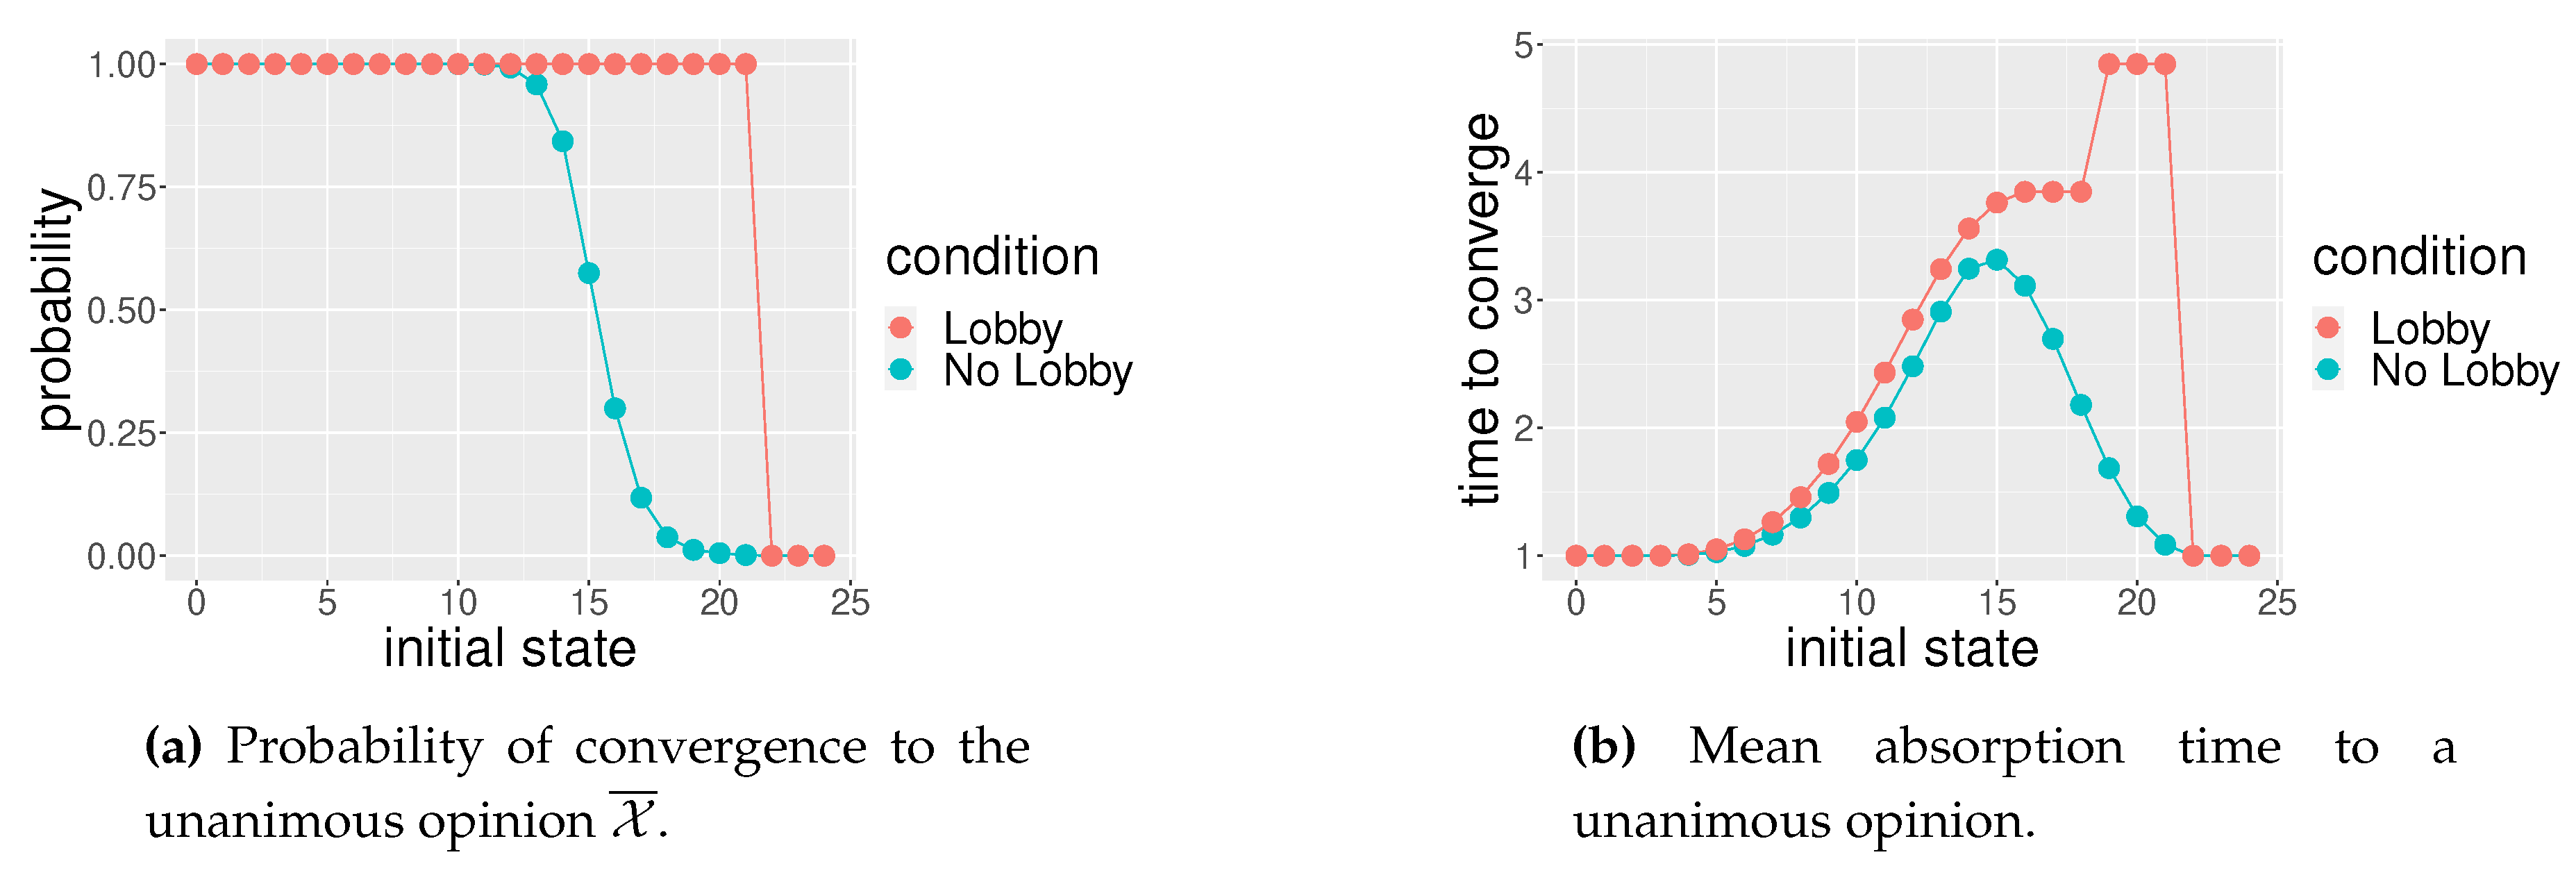
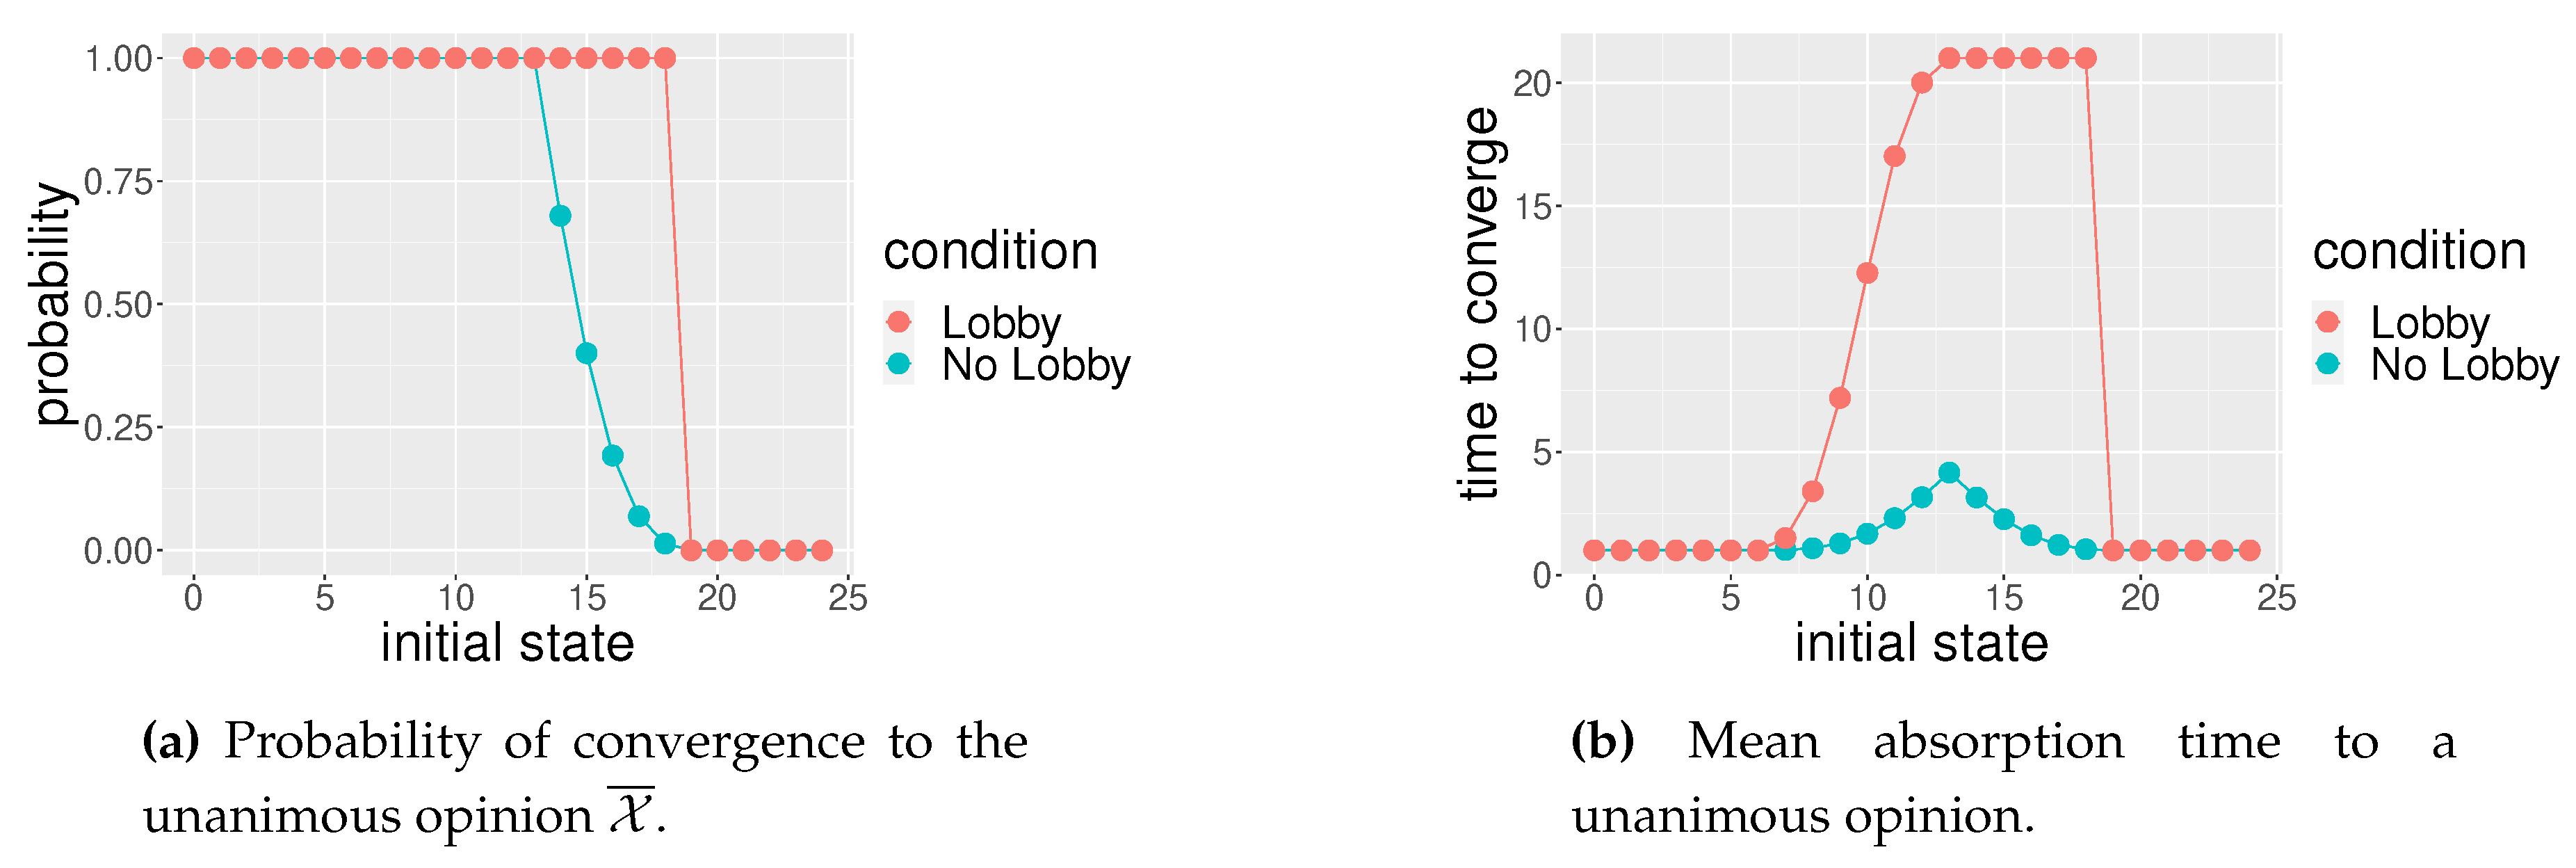
For each social space S i we compared the two scenarios, one with the lobby and the other one without. For each scenario, 1 , 000 , 000 simulations were run in order to determine the transition matrix. From the transition matrices we computed the probabilities of converging to the absorbing states as illustrated in [34]; they are graphically represented, together with the average time of convergence to the absorbing states, from Figure 3, Figure 4, Figure 5, Figure 6, Figure 7 and Figure 8. For each social space S i ( i = 1 , , 6 ), the left side of these figures represents the probabilities of converging to the respective absorbing states from any initial state j = 0 , , 24 . The graph on the right of these figures represents the mean time t j of convergence towards the absorbing states, starting from each initial state j. Since we are considering discrete states, the lines connecting the dots are for illustration purposes only. Obviously, when j N / 2 opinion X ¯ is no longer a minority opinion. In Appendix A we provide the pseudocode for respectively computing: the transition matrices M i without lobby and the transition matrices M ¯ i of the population with the lobby2.

4. Results and Discussion

Results show that, across all the social spaces considered, lobbies are able to influence populations with increased sample size. This is true in all the social spaces, expect for the simplest one where there are no differences in the dynamics between the lobby and the no lobby situation. Moreover, if we consider the time of convergence of each figure, i.e., the time to converge to the opinion held by the lobby (‘against X ’), lobbies increase rather than significantly decrease the average number of steps to convergence to an absorbing state, i.e., to a state which once entered cannot be left [41, p.35]. This means that, even if strategic lobbies are able to influence a wider set of the population, their presence can deteriorate the time to change public opinion on a specific issue. Putting these two insights together, we can infer that the presence of lobby can ensure an influence on larger scale but with a cost in time. In the following figures, we summarize the dynamics with and without lobbies for each of the considered social space.
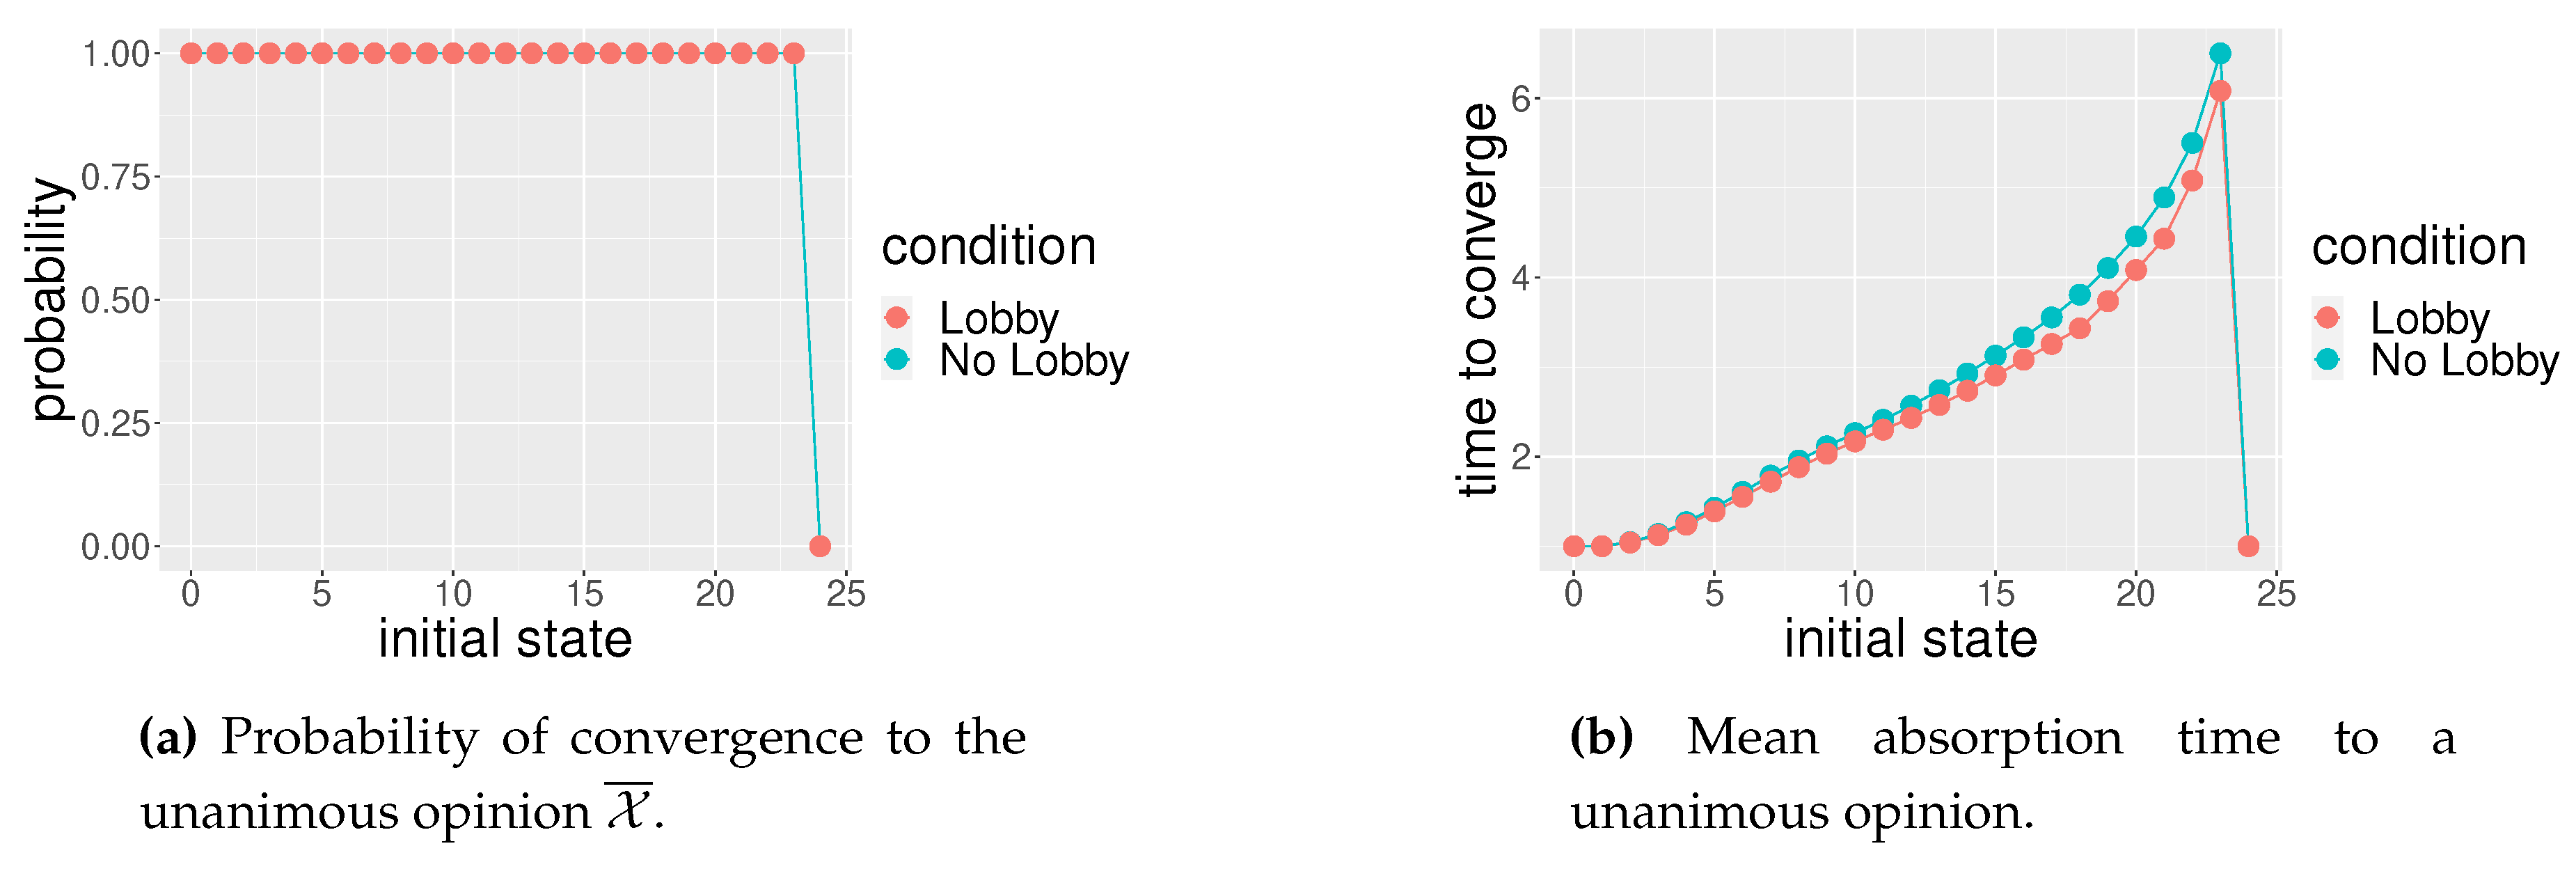
In the social space S 1 the results on convergence are the very same for both the models with and without lobby; however, the average convergence time decreases when there are lobby’s members (Figure 3).
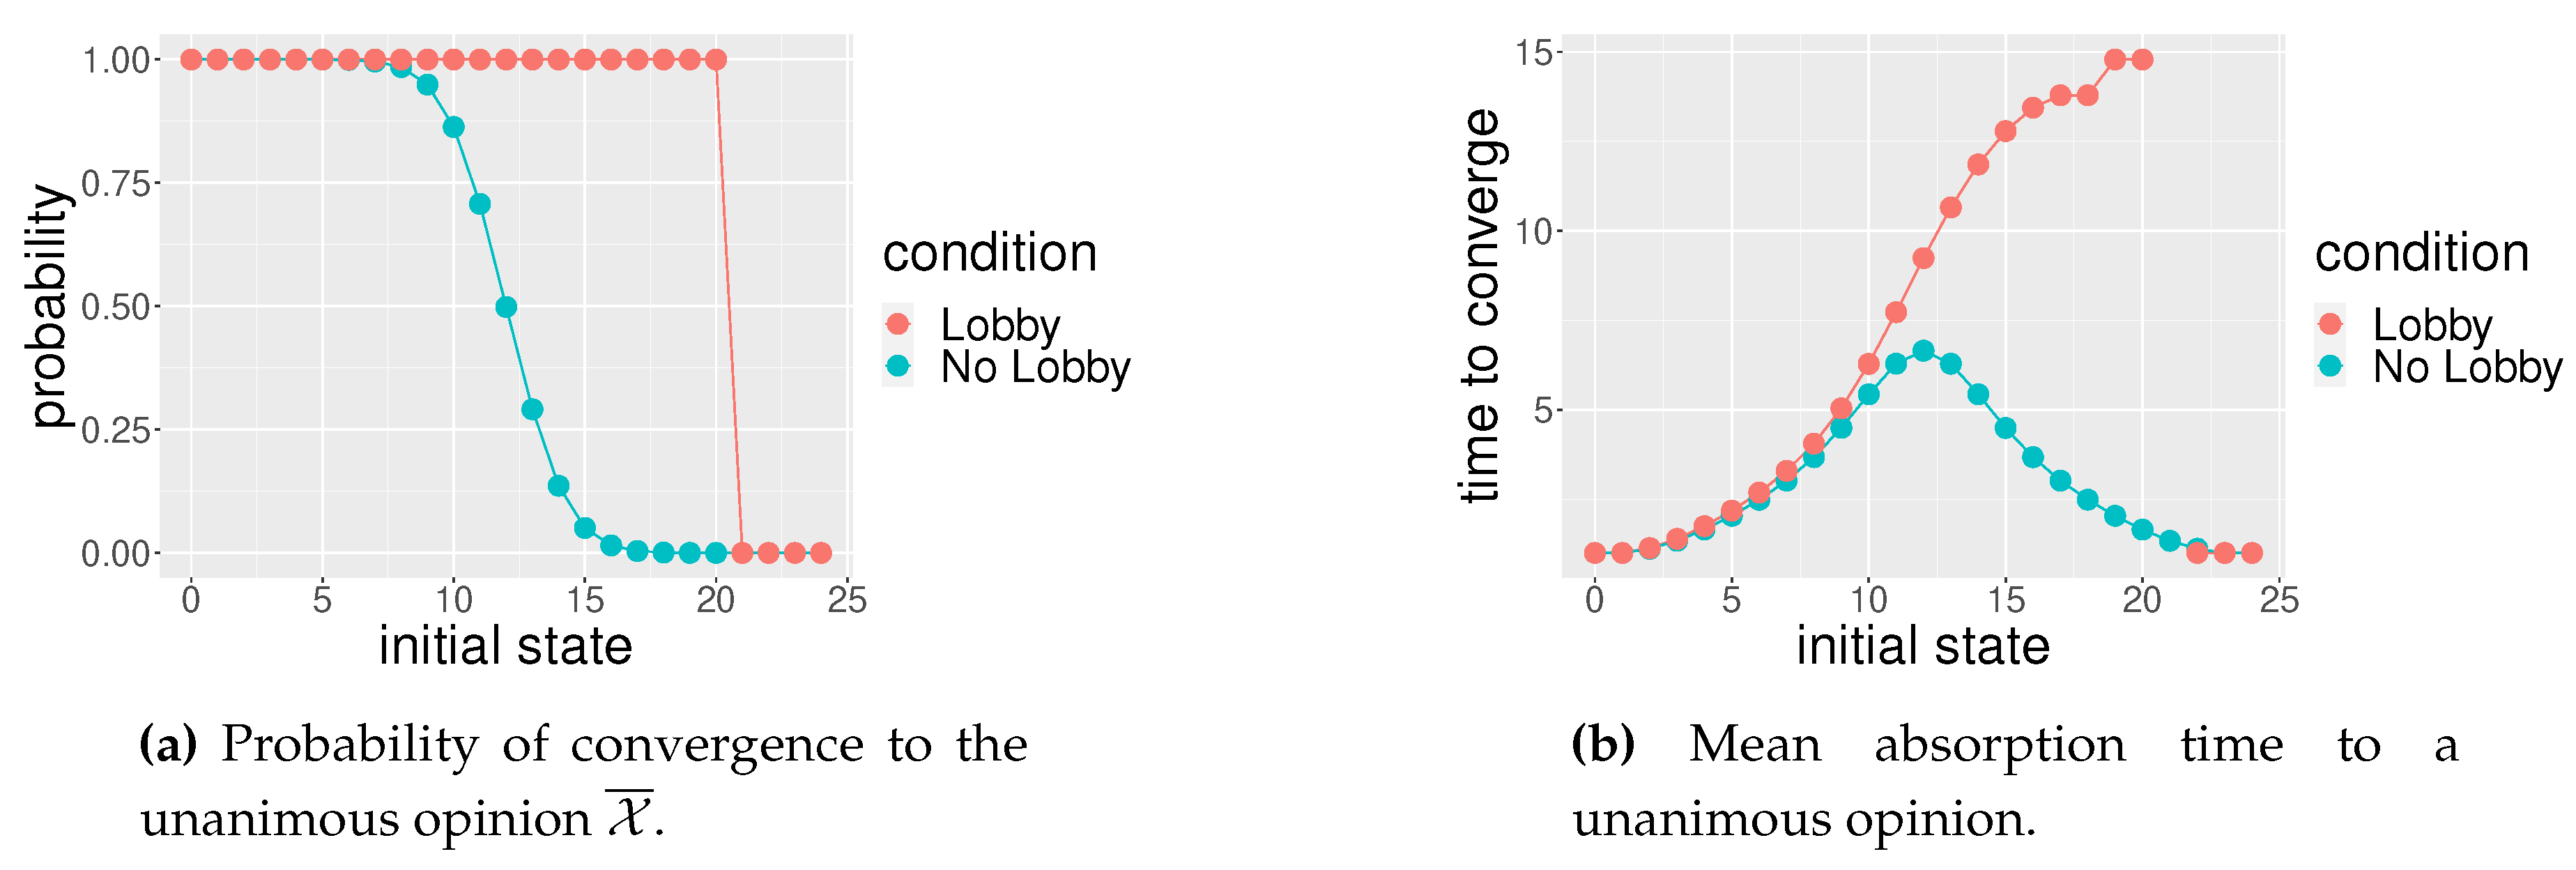
The social space S 2 exhibits a new absorbing state that can be deducted from Figure 2b when the initial state of the population has a lobby with three members. Two of these members will strategically seat at the same table, leaving the other member alone in a different table. According to the table majority rule, the couple of lobbyists will convince the third individual at the table in favor of opinion X ¯ , while the lonely lobby’s member will be convinced in favor of opinion X , maintaining the size of the lobby to three members as initially; this is an impasse situation similar to those discussed in [34]. However, it must be noted that, in this social space, the impasse can occur only when the lobby is active. In Figure 4b the mean time of convergence to this new absorbing state is not reported as it is not a unanimous state. According to Galam’s definition (see [21, p. 577] for details), a killing point is the unstable fixed point, producing the flow and its direction, determined by the stochastic dynamical system describing the time evolution of the hoax support. In S 2 , from Figure 4a, we can see that state x = 12 is the killing point when there is no lobby; by contrast, in this social space when the lobby is present there is no killing point and this case suggests a bang-bang result [44]. The mean absorption time of the unanimity is higher around the killing point; the process is even slower when produced by the lobby, as illustrated in Figure 4b.
The social space S 3 has a killing point at state x = 18 , that is, at the initial state with eighteen individuals with opinion X against a lobby of six members. As for space S 2 , the mean time of absorption to a unanimous opinion increases when the initial number of individuals in favor of X is near the killing point. However, unlike space S 2 , the process produced by lobbyists near the killing point is faster than in the case without lobby. Only a further reduction of the lobby’s size determines a slowdown in the process of convergence to unanimity. This is due to the fact that, for initial states smaller than the killing point, the lobby’s strategy favors the preservation of their opinion over its diffusion; that is, we have sorts of echo chambers defined as “environments in which the opinion, political leaning, or belief of users about a topic gets reinforced due to repeated interactions with peers or sources having similar tendencies and attitudes” [45]. Obviously these instances of social influence generate opinion cascades [46] which reduce individual noise at the expense of group noise [47].
In the social spaces S 4 , S 5 , and S 6 , the average absorption times are uniformely higher in the case with lobby than without; that is, the process of absorption is globally slower, independently of the killing points (see Figure 6, Figure 7, and Figure 8). In other words, except the particular case of the social space S 1 , generally the lobby makes a hoax prevalent even in situations where it would be impossible; however, the mean time of this process is longer.
Uniformely, in every social spaces we examined except S 1 that is trivial, the killing point of the case without lobby is lower than the point of the case with lobby. This means that with the lobby, in order for the hoax not to spread, many more people are needed who do not believe it. This is not costless; we observe almost in every case an increasing in the mean time of absorption to a unanimous opinion. Without lobby, when the number of individuals in favor of opinion X is larger than the number in the killing point, the entire population will be in favor too; on the other hand, with lobby the attractor changes and the population will end up believing opinion X ¯ but at a slower rate of convergence. This is always true, except in the social space S 3 as we have already discussed. Summarizing we have seen that the lobby increases the killing point and make the opinion dynamics a sort of a bang-bang result. However, in general the lobby increases the mean time to reach unanimity because the strategic seating priority is to preserve the lobbyists’ opinion rather than riskily disseminating it. Finally, in some special cases, the lobby can generate some impasses.

5. Conclusions

In this paper, we addressed the influence of lobbies on opinion dynamics considering a population of individuals in different social gatherings. In particular, we considered a lobby able to interact in strategic positions. Extending a well known sociophysics model of opinion spreading [21], we introduced lobbies in order to understand when and how they could be effective across different social spaces. Also on this case the opinion dynamics can be studied as a Markov chain and, since computing the transition probabilities may become cumbersome, the latter were computed using simulation. The results show that, with the specific strategy investigated, lobbies are able to overturn the majority opinions although this occurs with some cost in the time to reach its consensus.
The limitations of the results we obtained highlight the well known impossibility of a theory of social behavior to be simultaneously general, accurate, and simple [48]; in particular, in order to have a more accurate model of opinion diffusion in a group, agents should be modeled as heterogeneous entities rather than atoms [49, p.29]. However, when considering the “quiet methodological revolution” discussed in [31], the sociophysics perspective [22] should be considered as another possible way to overcome the problem of replicability in psychology mentioned in the introduction.
The model and the analysis of the influence of lobbies can be extended in several ways. First, we considered a specific strategy of a lobby and a specific decision rule (i.e., local majority). Future research will need to investigate alternative strategy and decision rules to further understanding how opinions can spread on social spaces. Second, we considered different 24-individual social spaces consisting of separate tables; these are special kinds of networks in which each component is a clique. In future research we will consider more general social networks as in [50]. In particular, it will be interesting to study whether the influence of the lobbies remains the same and how the time of convergence to unanimity is affected by their presence.

Author Contributions

The following statements should be used “Conceptualization, U.M. and A.D.; methodology, U.M. and A.D.; software, U.M.; validation, U.M. and A.D.; formal analysis, A.D.; investigation, U.M. and A.D; writing—original draft preparation, U.M. and A.D.; writing—review and editing, U.M. and A.D.; visualization, U.M. and A.D.; supervision, A.D. All authors have read and agreed to the published version of the manuscript.

Funding

This research received no external funding.

Institutional Review Board Statement

Not applicable.

Data Availability Statement

The simulated transition matrices M i , M ¯ i , the R code and the libraries for replicating our results are available from the authors upon request.

Conflicts of Interest

The authors declare no conflict of interest.

Appendix A

The pseudocode for computing the transition matrices M i without lobby is reported in Algorithm A1, the pseudocode for computing the transition matrices M ¯ i of the population with the lobby is reported in Algorithm A2, for each social space S i .
The parameters we considered for the simulations in Section 3.3 and the results discussed in Section 4 are the following:
  • NumAgents : = N = 24 ;
  • LobbySize : = N * = 6 ;
  • NumberSimulations : = 1 , 000 , 000 .
Algorithm A1 Compute transition frequencies with no lobby
1:
procedureTransition  
2:
     M 0  
3:
    for InitialState:=0 to NumAgents do  
4:
        repeat 
5:
           randomly choose InitialState agents  
6:
           set their opinion ‘in favor of X  
7:
           set remaining agents opinion to ’against X  
8:
           agents take seats  
9:
           agents discuss according to the local majority rule  
10:
           compute new state  
11:
           update  M  
12:
        until NumberSimulations  
Algorithm A2 Compute transition frequencies with lobby
1:
procedureTransitionLobby  
2:
     M ¯ 0  
3:
    for InitialState:=0 to NumAgents do  
4:
        repeat 
5:
           if InitialState < NumAgents − LobbySize then  
6:
               set lobby opinions to ’against X  
7:
               randomly choose InitialState − LobbySize agents  
8:
               set their opinion ‘in favor of X  
9:
               set remaining agents opinion to ’against X  
10:
           else 
11:
               set first NumAgents − InitialState lobby opinions to ’against X  
12:
               set remaining lobby opinions to ’in favor of X  
13:
               set remaining opinions to ’in favor of X  
14:
           lobby agents take seats  
15:
           other agents take seats  
16:
           all agents discuss according to the local majority rule  
17:
           compute new state  
18:
           update  M ¯  
19:
        until NumberSimulations  

References

  1. Dominus, S. When the Revolution Came for Amy Cuddy. The New York Times, 18 October 2017. [Google Scholar]
  2. Jack, A.; Hill, A. Harvard fraud claims fuel doubts over science of behaviour. Financial Times, 30 June 2023. [Google Scholar]
  3. Open Science Collaboration. Estimating the reproducibility of psychological science. Science 2015, 349, aac4716. [Google Scholar] [CrossRef] [PubMed]
  4. Cialdini, R.B.; Goldstein, N.J. SOCIAL INFLUENCE: Compliance and Conformity. Annual Review of Psychology 2004, 55, 591–621. [Google Scholar] [CrossRef] [PubMed]
  5. Sunstein, C.R. What’s Available - Social Influences and Behavioral Economics Empirical Legal Realism: A New Social Scientific Assessment of Law and Human Behavior. Northwestern University Law Review 2002, 97, 1295–1314. [Google Scholar]
  6. Asch, S.E. Studies of independence and conformity: I. A minority of one against a unanimous majority. Psychological monographs: General and applied 1956, 70, 1–70. [Google Scholar] [CrossRef]
  7. Wood, W.; Lundgren, S.; Ouellette, J.A.; Busceme, S.; Blackstone, T. Minority influence: a meta-analytic review of social influence processes. Psychological bulletin 1994, 115, 323–345. [Google Scholar] [CrossRef]
  8. Paichler, G. Norms and attitude change I: Polarization and styles of behaviour. European Journal of Social Psychology 1976, 6, 405–427. [Google Scholar] [CrossRef]
  9. Moscovici, S.; Personnaz, B. Studies in social influence. Journal of Experimental Social Psychology 1980, 16, 270–282. [Google Scholar] [CrossRef]
  10. Moscovici, S.; Lage, E.; Naffrechoux, M. Influence of a consistent minority on the responses of a majority in a color perception task. Sociometry 1969, 32, 365–380. [Google Scholar] [CrossRef]
  11. Mugny, G.; Papastamou, S. When rigidity does not fail: Individualization and psychologization as resistances to the diffusion of minority innovations. European Journal of Social Psychology 1980, 10, 43–61. [Google Scholar] [CrossRef]
  12. Crano, W.D.; Seyranian, V. Majority and minority influence. Social and Personality Psychology Compass 2007, 1, 572–589. [Google Scholar] [CrossRef]
  13. Maass, A.; Clark, R.D. Hidden impact of minorities: Fifteen years of minority influence research. Psychological Bulletin 1984, 95, 428–450. [Google Scholar] [CrossRef]
  14. Butera, F.; Mugny, G.; Legrenzi, P.; Perez, J.a. Majority and minority influence, task representation and inductive reasoning. British Journal of Social Psychology 1996, 35, 123–136. [Google Scholar] [CrossRef]
  15. Mugny, G. Negotiations, image of the other and the process of minority influence. European Journal of Social Psychology 1975, 5, 209–228. [Google Scholar] [CrossRef]
  16. Heft, A.; Buehling, K. Measuring the diffusion of conspiracy theories in digital information ecologies. Convergence 2022, 28, 940–961. [Google Scholar] [CrossRef]
  17. Dentith, M.R.X. Conspiracies and Conspiracy Theories. In The Philosophy of Conspiracy Theories; Palgrave Macmillan UK: London, 2014; pp. 23–38. [Google Scholar] [CrossRef]
  18. Furini, M. Identifying the features of ProVax and NoVax groups from social media conversations. Computers in Human Behavior 2021, 120, 106751. [Google Scholar] [CrossRef]
  19. Rutjens, B.T.; Većkalov, B. Conspiracy beliefs and science rejection. Current Opinion in Psychology 2022, 46, 101392. [Google Scholar] [CrossRef] [PubMed]
  20. Albarracín, D. Processes of persuasion and social influence in conspiracy beliefs. Current Opinion in Psychology 2022, 48, 101463. [Google Scholar] [CrossRef] [PubMed]
  21. Galam, S. Modelling rumors: the no plane Pentagon French hoax case. Physica A: Statistical Mechanics and Its Applications 2003, 320, 571–580. [Google Scholar] [CrossRef]
  22. Galam, S. Sociophysics, A Physicist’s Modeling of Psycho-political Phenomena. Understanding Complex Systems, Springer, 2012. [Google Scholar]
  23. Galam, S.; Moscovici, S. Towards a theory of collective phenomena: Consensus and attitude changes in groups. European Journal of Social Psychology 1991, 21, 49–74. [Google Scholar] [CrossRef]
  24. Berger, L.R. A necessary and sufficient condition for reaching a consensus using DeGroot’s method. Journal of the American Statistical Association 1981, 76, 415–418. [Google Scholar] [CrossRef]
  25. DeGroot, M.H. Reaching a Consensus. Journal of the American Statistical Association 1974, 69, 118–121. [Google Scholar] [CrossRef]
  26. Potters, J.; van Winden, F. Lobbying and Asymmetric Information. Public choice 1992, 74, 269–292. [Google Scholar] [CrossRef]
  27. Nyczka, P.; Sznajd-Weron, K. Anticonformity or Independence?–Insights from Statistical Physics. Journal of Statistical Physics 2013, 151, 174–202. [Google Scholar] [CrossRef]
  28. Rouchier, J.; Thoyer, S. Modelling a European Decision Making Process with Heterogeneous Public Opinion and Lobbying: The Case of the Authorization Procedure for Placing Genetically Modified Organisms on the Market. In Proceedings of the Multi-Agent-Based Simulation III; Hales, D., Edmonds, B., Norling, E., Rouchier, J., Eds.; Berlin, Heidelberg, 2003; pp. 149–166. [Google Scholar]
  29. Jackson, J.C.; Rand, D.; Lewis, K.; Norton, M.I.; Gray, K. Agent-Based Modeling: A Guide for Social Psychologists. Social Psychological and Personality Science 2017, 8, 387–395. [Google Scholar] [CrossRef]
  30. Smith, E.R.; Conrey, F.R. Agent-Based Modeling: A New Approach for Theory Building in Social Psychology. Personality and social psychology review 2007, 11, 87–104. [Google Scholar] [CrossRef]
  31. Rodgers, J.L. The Epistemology of Mathematical and Statistical Modeling: A Quiet Methodological Revolution. The American psychologist 2010, 65, 1–12. [Google Scholar] [CrossRef] [PubMed]
  32. Galam, S.; Gefen, Y.; Shapir, Y. Sociophysics: A new approach of sociological collective behaviour. 1. Mean-behaviour description of a strike. The Journal of Mathematical Sociology 1982, 9, 1–13. [Google Scholar] [CrossRef]
  33. Stauffer, D. A biased review of sociophysics. Journal of Statistical Physics 2012, 151, 9–20. [Google Scholar] [CrossRef]
  34. Merlone, U.; Radi, D. Reaching consensus on rumors. Physica A: Statistical Mechanics and its Applications 2014, 406, 260–271. [Google Scholar] [CrossRef]
  35. Ellero, A.; Fasano, G.; Sorato, A. Stochastic model of agent interaction with opinion leaders. Physical Review E 2013, 87, 042806. [Google Scholar] [CrossRef]
  36. Hare, I.P.; Bales, R.F. Seating position and small group interaction. Sociometry 1963, 26, 480–486. [Google Scholar] [CrossRef]
  37. Sommer, R. Leadership and group geography. Sociometry 1961, 24, 99–110. [Google Scholar] [CrossRef]
  38. Strodtbeck, F.L.; Hook, L.H. The social dimensions of a twelve man jury table. Sociometry 1961, 24, 397–415. [Google Scholar] [CrossRef]
  39. Oestereich, A.L.; Pires, M.A.; Queiròs, S.M.D.; Crokidakis, N. Phase Transition in the Galam’s Majority-Rule Model with Information-Mediated Independence. Phisics 2023, 911–922. [Google Scholar] [CrossRef]
  40. Newmark, A.; Nownes, A.J. All of the Above: Lobbying Allied, Undecided, and Opposing Lawmakers in Committee and on the Floor. Political Research Quarterly 2022, 76, 578–592. [Google Scholar] [CrossRef]
  41. Kemeny, J.G.; Laurie, S.J. Finite markov chains; Springer Verlag: New York, NY, USA, 1968. [Google Scholar]
  42. Feller, W. An introduction to probability theory and its applications, third ed.; John Wiley & Sons: New York, NY, USA, 1968; Vol. 1. [Google Scholar]
  43. OEIS Foundation Inc. The On-Line Encyclopedia of Integer Sequences, 2023. Published electronically at. Available online: http://oeis.org.
  44. Bouvier, J.B.; Xu, K.; Ornik, M. Quantitative Resilience of Linear Driftless Systems. In Proceedings of the SIAM Conference on Control and Its Applications; 2021; pp. 32–39. [Google Scholar]
  45. Cinelli, M.; De Francisci Morales, G.; Galeazzi, A.; Quattrociocchi, W.; Starnini, M. The echo chamber effect on social media. Proceedings of the National Academy of Sciences of the United States of America 118. [CrossRef]
  46. Macy, M.; Deri, S.; Ruch, A.; Tong, N. Opinion cascades and the unpredictability of partisan polarization. Science Advances 2019, 5, eaax0754. [Google Scholar] [CrossRef]
  47. Daniel, K.; Olivier, S.; Cass R., S. Noise: A Flaw in Human Judgment; Hachette Book Group: New York, NY, USA, 2021. [Google Scholar]
  48. Thorngate, W. “In General” vs. “It Depends”: Some Comments of the Gergen-Schlenker Debate. Personality and Social Psychology Bulletin 1976, 2, 404–410. [Google Scholar] [CrossRef]
  49. Galam, S. The Question: Do Humans Behave like Atoms? In Sociophysics: A Physicist’s Modeling of Psycho-political Phenomena; Springer US: Boston, MA, USA, 2012; pp. 21–39. [Google Scholar] [CrossRef]
  50. Merlone, U.; Radi, D.; Romano, A. Opinion dynamics on networks. In Complex Networks and Nonlinear Dynamics: Social and Economic Interactions; Commendatore, P., Matilla-Garcìa, M., Varela, L.M., Cánovas, J., Eds.; Springer Verlag, 2016; Vol. 683, pp. 49–63. [Google Scholar]
1
The case L = N , i.e. all table of dimension 1, is trivial and therefore will not be considered.
2
The R code and the libraries for replicating our results are available from the authors upon request.
Figure 1. An exemplification of Galam’s model. A one step opinion dynamics. First stage, individuals sharing the two opinions are moving around. Gray have opinion ‘in favor of X ’ while black have opinion ‘against X ’. No discussion is occurring (11 gray and 13 black). Second stage, individuals are partitioned into groups of various size and no change of opinion occurs. Third stage, within each group consensus has been reached. As a result, they are now 12 gray and 12 black. Last stage, people are again moving around with no discussion.
Preprints 95263 g001
Figure 2. Population of 24 people seated in different social spaces. Lobby consists of at most 6 people (black dots) having opinion ‘against X ’ seating at prefixed strategic tables. (a) S 1 : 12 tables with two seats each; lobby members seat individually at six tables. (b) S 2 : 8 tables with three seats each; lobby members seat in couples at three tables. (c) S 3 : 6 tables with 4 seats each; again lobby members seat in couples at three tables. (d) S 4 : 4 tables with six seats each; lobby members seat in triplets at two tables. (e) S 5 : 4 tables with six seats each; four lobby members sit at one table and are always able to influence, the two remaining seat at another table. (f) S 6 : 2 tables with twelve seats each; lobby members seat all together at the same table.
Preprints 95263 g002
Figure 3. S 1 : twelve tables with two seats each; lobby members strategically sit as illustrated in Figure 2a. The horizontal axis represents the initial number of individuals with opinion X . The red line represents the case with lobby while the blue line represents the case without lobby. In the vertical axis of (a) there is the probability of converging to the unanimous opinion X ¯ ; in (b) on the vertical axis there is the mean time of convergence to unanimity.
Preprints 95263 g003
Figure 4. S 2 : eight tables with three seats each; lobby members strategically sit as illustrated in Figure 2b. The horizontal axis represents the number of individuals with opinion in favor of X . The red line represents the case of that specific social space with lobby while the blue blue line represents the case of the social space without the lobby. In (a) the vertical axis represents the probability to converge to unanimous opinion against X ; in (b) vertical axis represents the mean time of convergence to unanimity.
Preprints 95263 g004
Figure 5. S 3 : six tables with four seats each; lobby members strategically sit as illustrated in Figure 2c. The horizontal axis represents the number of individuals with opinion in favor of X . The red line represents the case of that specific social space with lobby while the blue blue line represents the case of the social space without the lobby. In (a) the vertical axis represents the probability to converge to unanimous opinion against X ; in (b) vertical axis represents the mean time of convergence to unanimity.
Preprints 95263 g005
Figure 6. S 4 : four tables with six seats each; lobby members strategically sit as illustrated in Figure 2d. The horizontal axis represents the number of individuals with opinion in favor of X . The red line represents the case of that specific social space with lobby while the blue blue line represents the case of the social space without the lobby. In (a) the vertical axis represents the probability to converge to unanimous opinion against X ; in (b) vertical axis represents the mean time of convergence to unanimity.
Preprints 95263 g006
Figure 7. S 5 : three tables with eight seats each; lobby members strategically sit as illustrated in Figure 2e. The horizontal axis represents the number of individuals with opinion in favor of X . The red line represents the case of that specific social space with lobby while the blue blue line represents the case of the social space without the lobby. In (a) the vertical axis represents the probability to converge to unanimous opinion against X ; in (b) vertical axis represents the mean time of convergence to unanimity.
Preprints 95263 g007
Figure 8. S 6 : two tables with twelve seats each; lobby members strategically sit as illustrated in Figure 2f. The horizontal axis represents the number of individuals with opinion in favor of X . The red line represents the case of that specific social space with lobby while the blue blue line represents the case of the social space without the lobby. In (a) the vertical axis represents the probability to converge to unanimous opinion against X ; in (b) vertical axis represents the mean time of convergence to unanimity.
Preprints 95263 g008
Disclaimer/Publisher’s Note: The statements, opinions and data contained in all publications are solely those of the individual author(s) and contributor(s) and not of MDPI and/or the editor(s). MDPI and/or the editor(s) disclaim responsibility for any injury to people or property resulting from any ideas, methods, instructions or products referred to in the content.
Copyright: This open access article is published under a Creative Commons CC BY 4.0 license, which permit the free download, distribution, and reuse, provided that the author and preprint are cited in any reuse.
Prerpints.org logo

Preprints.org is a free preprint server supported by MDPI in Basel, Switzerland.

Subscribe

© 2024 MDPI (Basel, Switzerland) unless otherwise stated