1. Introduction
Clean alternative energies have drawn interest to prevent air pollution and climate change. One of the clean alternative energies is hydrogen energy, which is the energy produced by the reaction of hydrogen with oxygen, producing water as a by-product. The problems to be solved for applying the hydrogen energy to practical use are hydrogen production and storage. One of the methods to store hydrogen is using metal hydrides. We are interested in synthesizing Mg-based hydrides with high reaction rates and high hydrogen storage capacities.
Many works were performed to improve the hydriding and dehydriding kinetics of Mg [
1,
2,
3,
4,
5,
6]. Researchers were interested in improving the hydrogen storage properties of MgH
2 by adding NaAlH
4 with a high hydrogen-storage capacity [
7,
8,
9,
10,
11]. Ali and Ismail [
7] reviewed the hydrogen storage properties of the Mg–Na–Al system. The complex hydride NaAlH
4 releases hydrogen via three step reactions:
Ali and Ismail [
7] reported that addition of NaAlH4 could destabilize the MgH2 effectively and the hydrogen storage properties of NaAlH4 has could also be improved by adding MgH
2. The MgH
2–NaAlH
4 system exhibited much better dehydriding properties than unary MgH
2 and NaAlH
4.
Ismail et al. [
10] reported that the following reaction takes place within the temperature range from 443 to 485 K:
A mixing decomposition of (4) the reaction of MgH
2 with Al and (5) the decomposition of the excessive MgH
2 occurs reversibly between 553 K and 603 K [
10].
They also reported that NaMgH
3 decomposes between 603 K and 633 K by the following reversible reaction:
NaH decomposes between 633 K and 648 K by the following reversible reaction [
10]:
In this work, milled MgH2, NaAlH4, MgH2–10NaAlH4 (with a composition of 90 wt% MgH2 + 10 wt% NaAlH4), MgH2–30NaAlH4 (70 wt% MgH2 + 30 wt% NaAlH4), MgH2–50NaAlH4 (50 wt% MgH2 + 50 wt% NaAlH4), and MgH2–2Ni-10NaAlH4 (88 wt% MgH2 + 2 wt% Ni + 10wt% NaAlH4) samples were prepared by milling in hydrogen atmosphere (reactive mechanical milling, RMM). Decomposition temperatures of milled MgH2, NaAlH4, MgH2–10NaAlH4, and MgH2–30NaAlH4 were examined heating at a rate of 5 ∼ 6 K in a Sieverts-type hydrogen-absorption and release apparatus and phase formation in cycled MgH2–50NaAlH4 were investigated.
2. Experimental Procedures
As starting materials, were used MgH2 (magnesium hydride, purity 98%, Alfa Aesar), NaAlH4 (Hydrogen-storage grade, Aldrich), and Ni (average particle size 2.2–3.0 μm, purity 99.9 % metal basis, C typically < 0.1%, Alfa Aesar).
Reactive mechanical milling (RMM) was carried out in a planetary ball mill (Planetary Mono Mill; Pulverisette 6, Fritsch). A mixture with the planned composition (total weight = 8 g) was mixed in a stainless-steel container (with 105 hardened steel balls, total weight = 360 g) sealed hermetically, the sample to ball weight ratio being 1/45. All samples were handled in a glove box in argon atmosphere. The disc revolution speed was 400 rpm. The mill container (volume of 250 ml) was then filled with high purity hydrogen gas of about 12 bar. The RMM was performed for 6 h (by repeating milling for 15 min and pause for 5 min 24 times). Hydrogen was refilled every 2 h milling (every eight milling times).
The absorbed or released hydrogen quantity was measured as a function of time by a volumetric method, using Siverts-type hydrogen-absorption and release apparatus previously described [21]. The hydrogen pressure in the reactor was kept as 12 bar during hydriding by dosing the quantity of hydrogen absorbed from a reservoir of known volume. The hydrogen pressure in the reactor was kept as 1.0 bar during dehydriding by removing the quantity of hydrogen released from the reactor to a reservoir of known volume. 0.5 g of the samples was used for these measurements. Samples after hydrogen absorption-release cycling were characterized by X-ray diffraction (XRD) with Cu Ka radiation, using a Bruker D8 Advance (Karlsruhe, Germany) powder diffractometer.
3. Results
The quantity of released hydrogen, Hr (wt% H), was calculated using the sample weight as a standard.
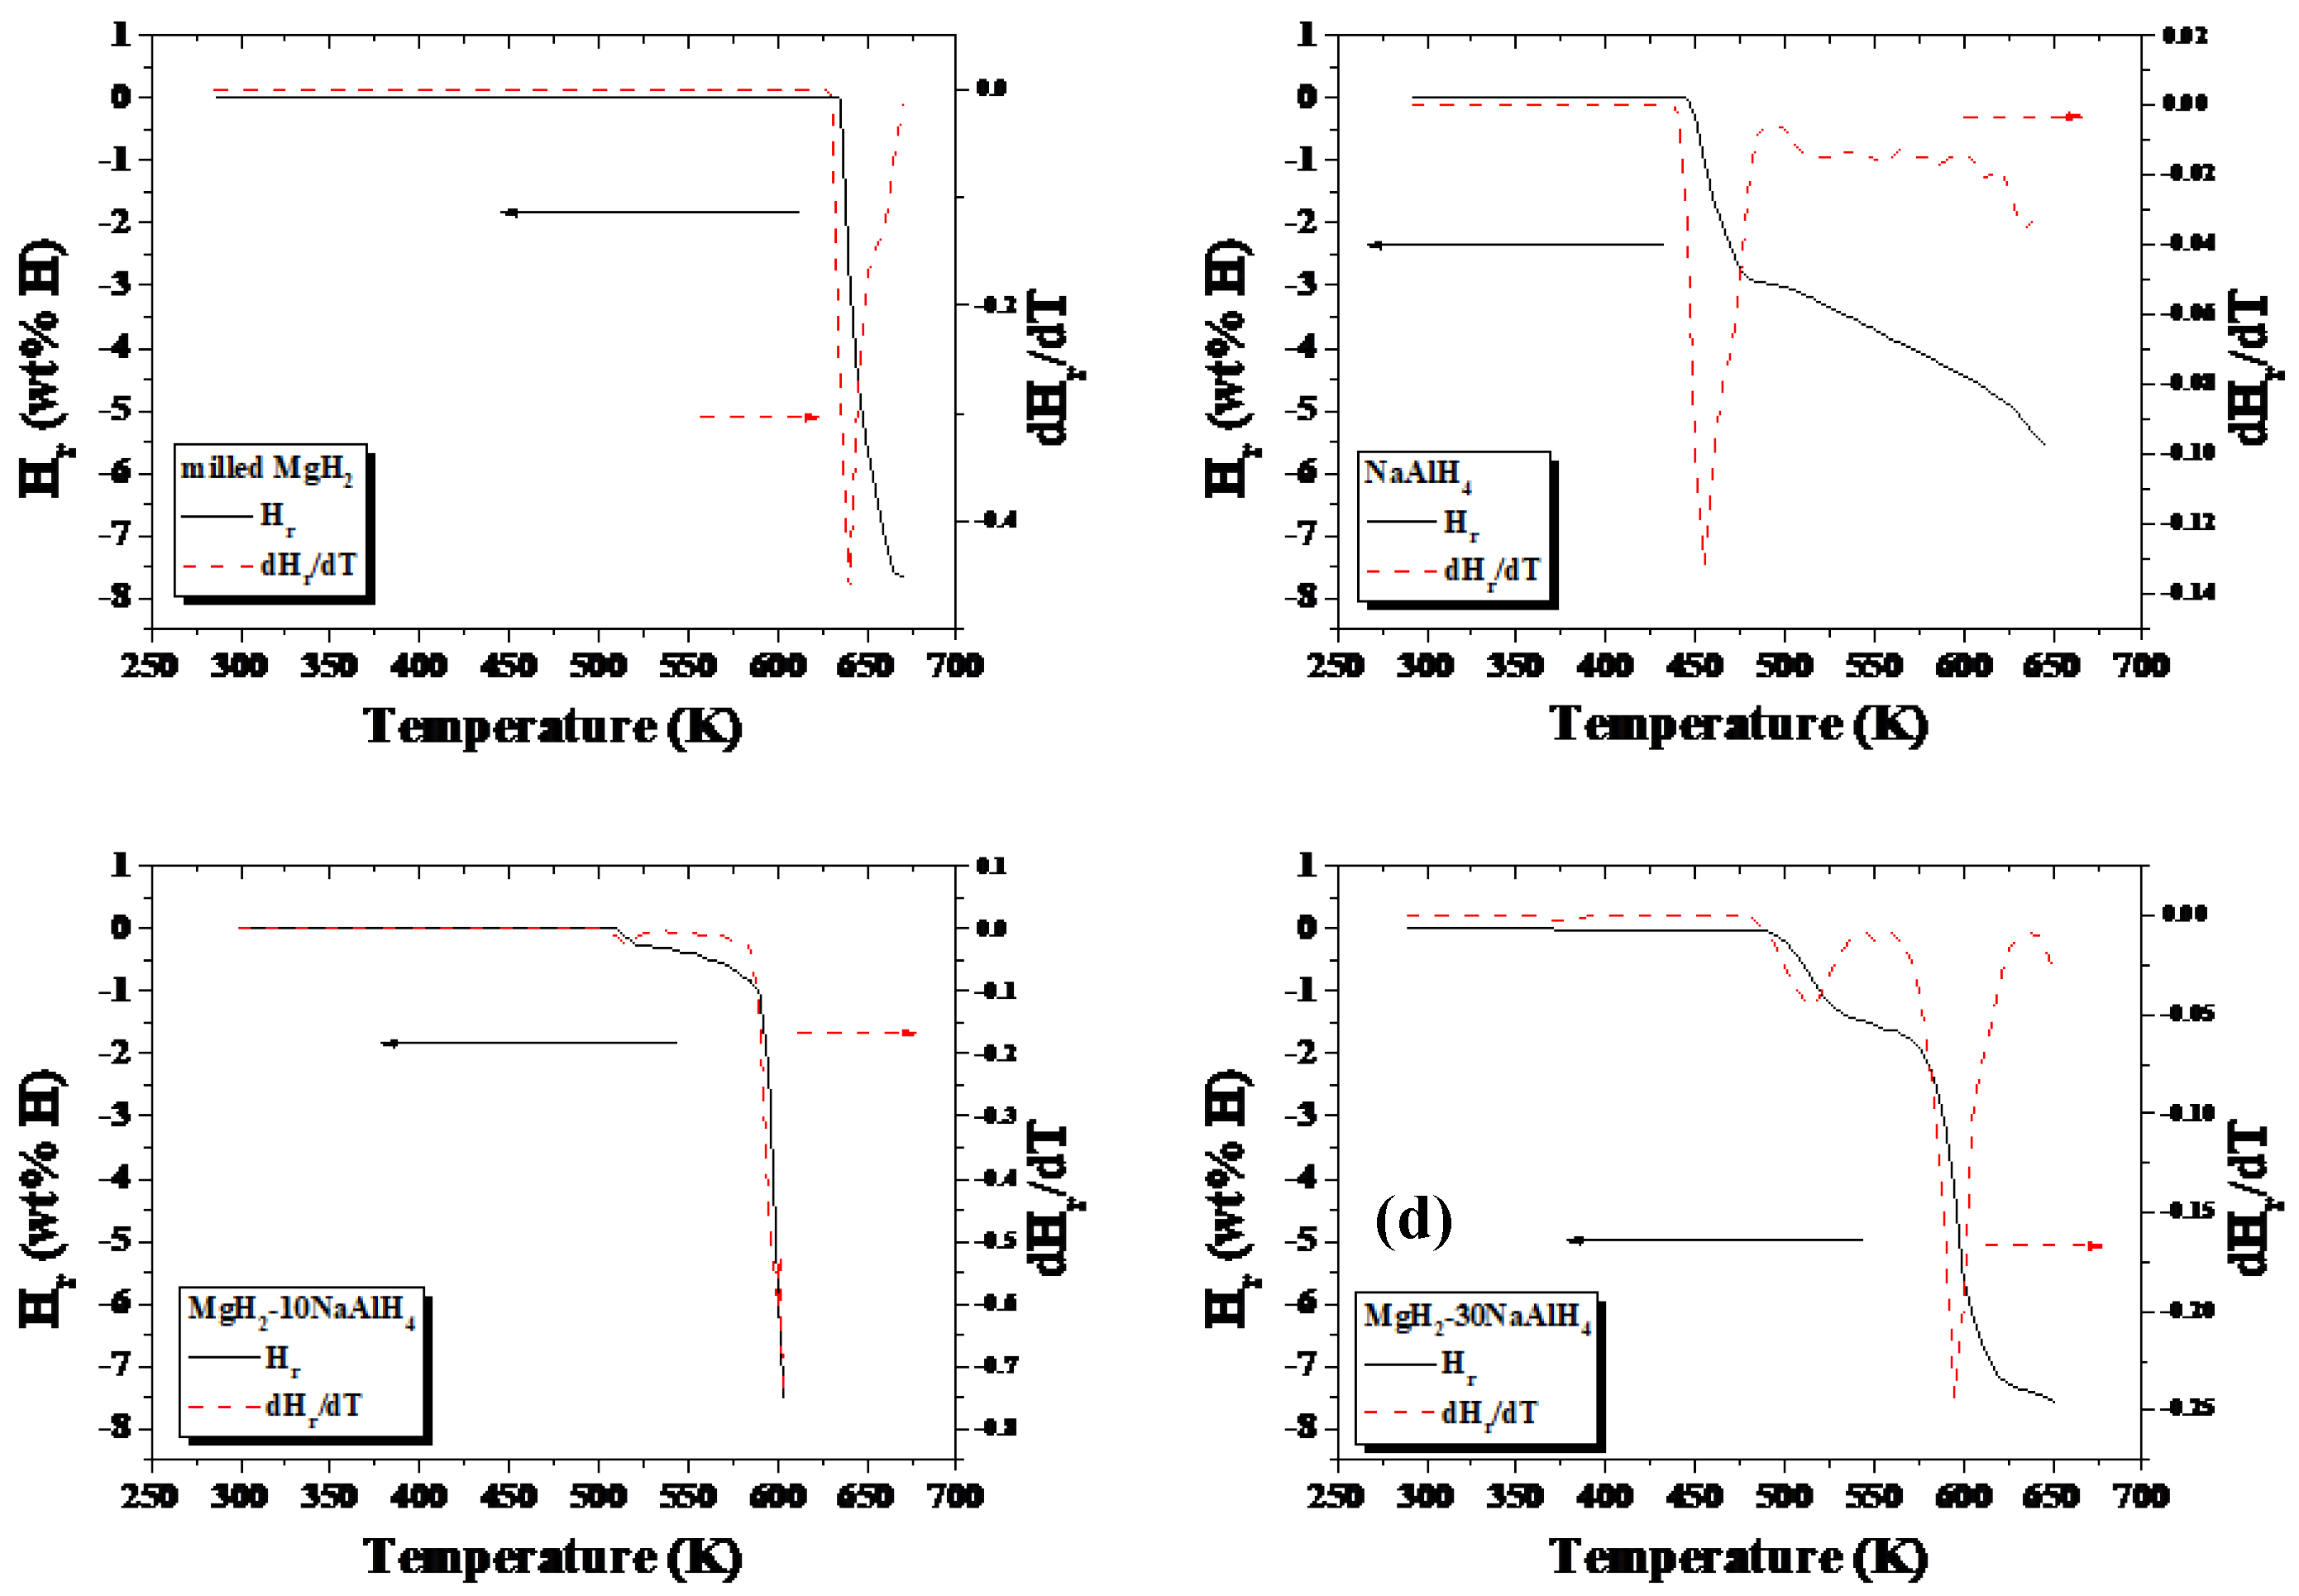
Figure 1 shows quantity of released hydrogen (H
r) versus temperature T curves and the ratio of increase in H
r to increase in T, dH
r/dT, versus T curves for milled MgH
2, MgH
2-10NaAlH
4, MgH
2-30NaAlH
4, and NaAlH
4 samples. The samples were heated at a heating rate of 5 ∼ 6 K in 1.0 bar hydrogen.
Table 1 presents the temperatures (K) at peaks in the dH
r/dT versus T curves for milled MgH
2, MgH
2-10NaAlH
4, MgH
2-30NaAlH
4, and NaAlH4 samples. The highest peaks appear at 638, 600, 592, and 455 K, respectively, for milled MgH
2, MgH
2-10NaAlH
4, MgH
2-30NaAlH
4, and NaAlH
4.
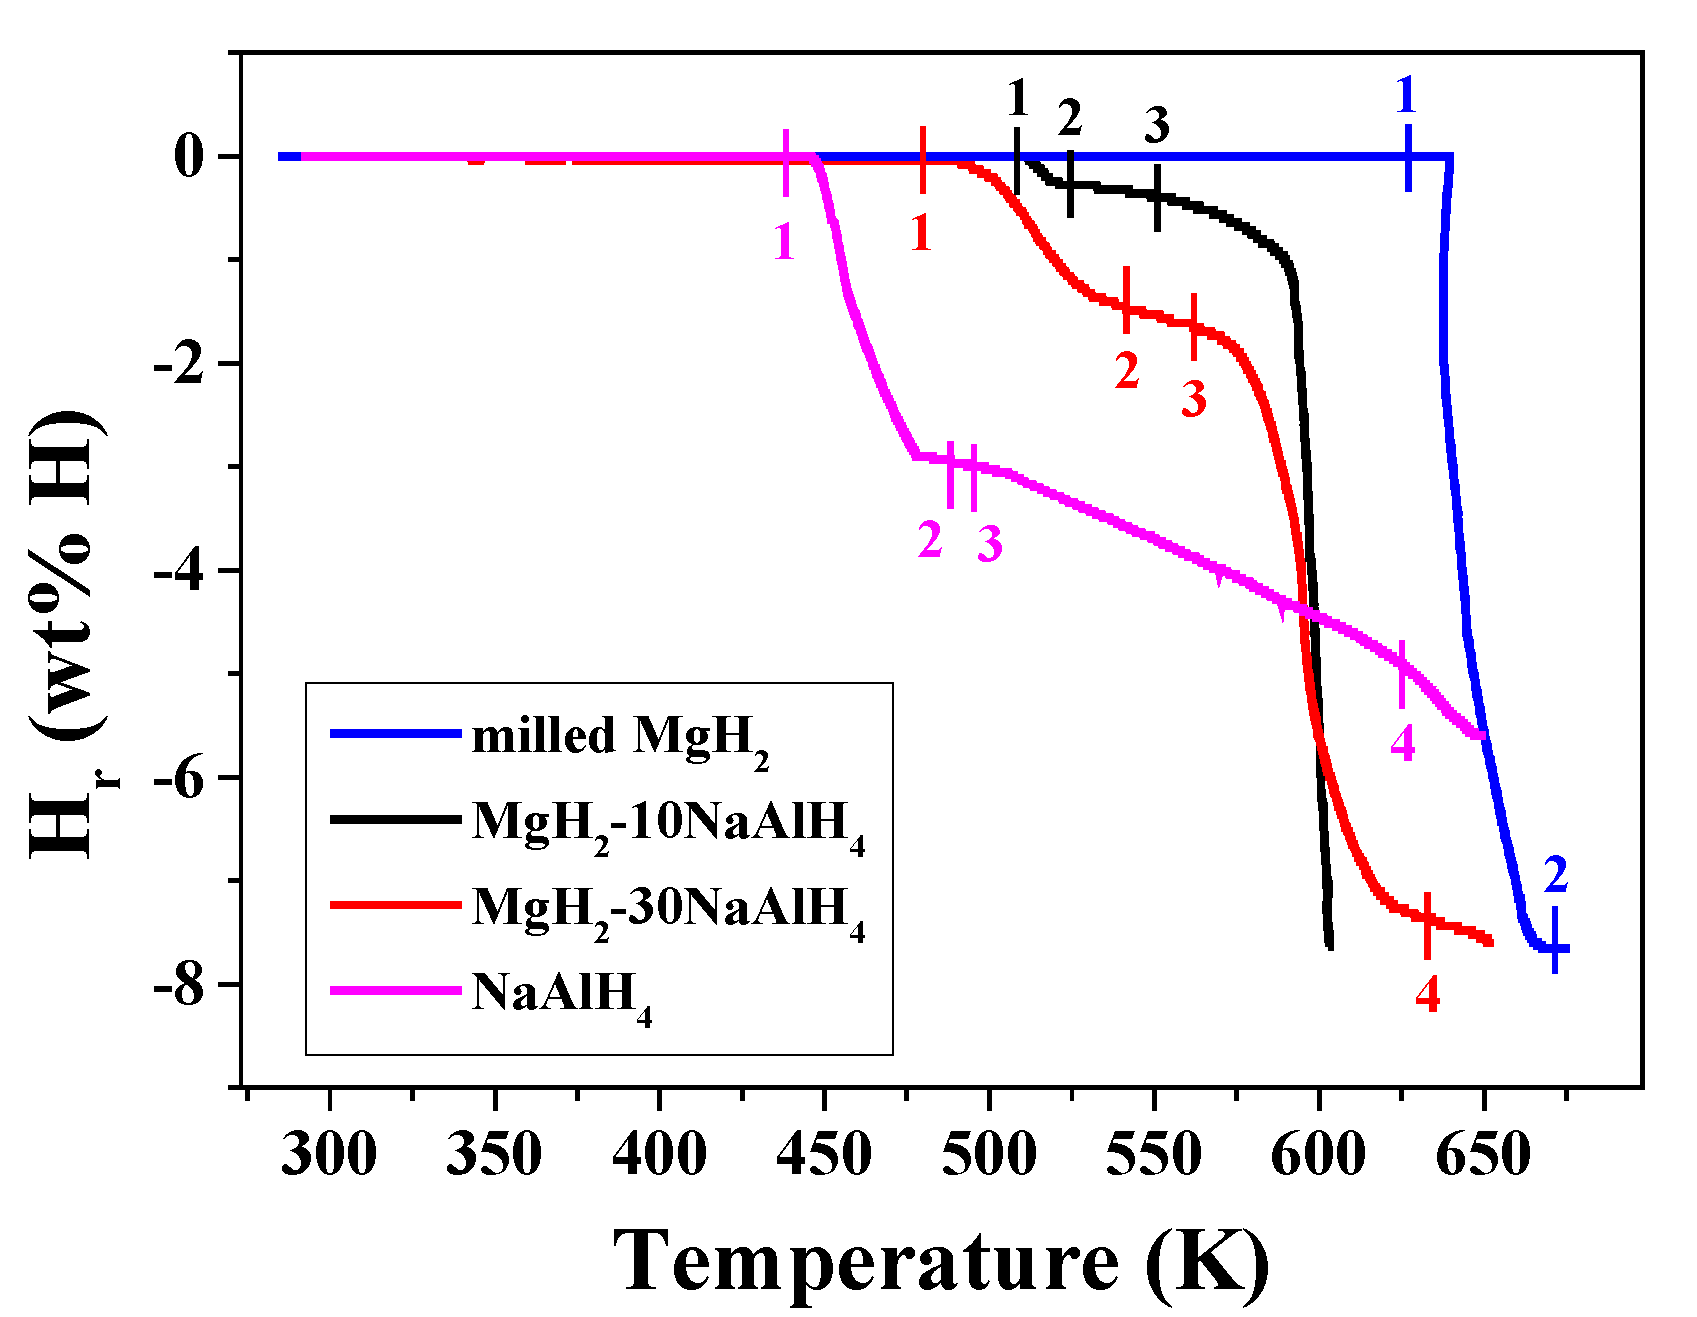
Figure 2 shows the quantity of released hydrogen (H
r) versus temperature curves for milled MgH
2, MgH
2-10NaAlH
4, MgH
2-30NaAlH
4, and NaAlH
4 samples. The samples were heated at a heating rate of 5 ∼ 6 K in 1.0 bar hydrogen. The points were marked so that they correspond to the beginning and ending points of the peaks in
Figure 1.
Table 2 presents the temperatures (K) at the marked points in the H
r versus T curves for milled MgH
2, MgH
2-10NaAlH
4, MgH
2-30NaAlH
4, and NaAlH
4 samples.
Hydrogen release begins at 627 K for the as-milled MgH2. Hydrogen release from the NaAlH4 begins at 438 K and the slope of the Hr versus temperature curve then changes at 488, 495, and 625 K. MgH2-10NaAlH4 begins to release hydrogen at 508 K and slopes of the Hr versus temperature curves change at 525 K and 550 K. MgH2-30NaAlH4 begins to release hydrogen at 480 K and slopes of the Hr versus temperature curves change at 541, 562, and 633 K.
As the content of NaAlH4 in the sample increases, the temperature at the highest peak decreases. The higher content of NaAlH4 is believed to have made effects of reactive mechanical grinding stronger, lowering the temperatures for the reaction. The effects of reactive mechanical grinding are thought to be creation of defects, making cracks and clean surfaces, and decreasing particle sizes.
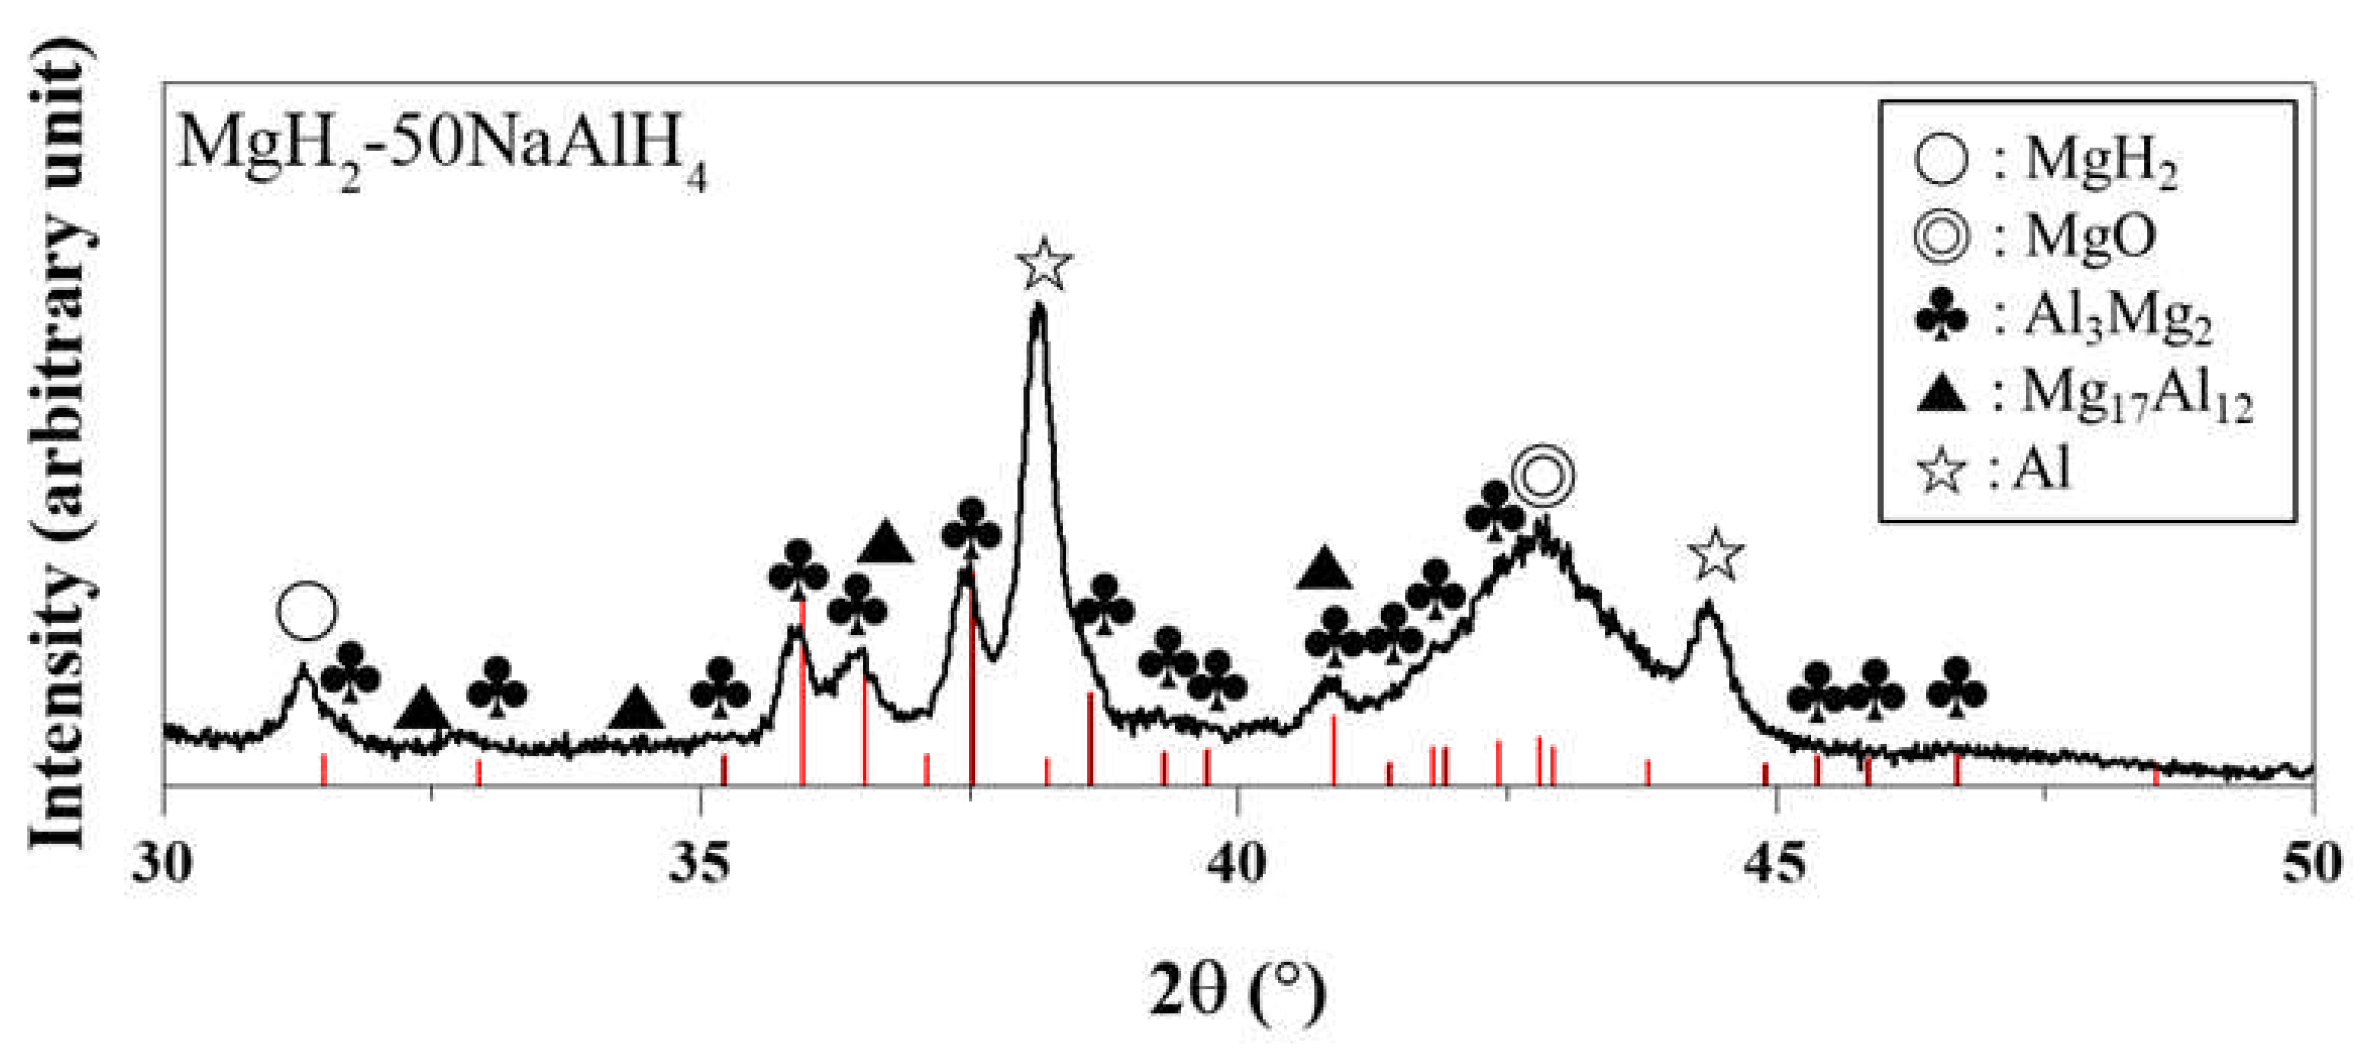
The XRD pattern of MgH
2-50NaAlH
4 dehydrided after number of cycles, n, of 4 at 593 K is shown in
Figure 3. The sample contains Al, MgO, Al
3Mg
2, MgH
2, and Mg
17Al
12. Even though the sample was dehydrided, a small amount of MgH
2 remains. Al, formed from the reactions (4), is believed to react with Mg (formed by decomposition of MgH
2) and form Al
3Mg
2 and Mg
17Al
12 by the following reactions:
Liu et al. [
12] reported that when the temperature is increased to 633 K, a large amount of hydrogen has been released and two new phases, Mg
17Al
12 and Mg, are formed while the preformed Al and Al
3Mg
2 disappear. Samples were easily ignited and combusted during treatment, making difficult the obtention of XRD patterns and leading to the formation of a strong peak of MgO and relatively weak peaks of other phases.
Figure 3.
XRD pattern of MgH2-50NaAlH4 dehydrided after number of cycles, n, of 4 at 593 K.
Figure 3.
XRD pattern of MgH2-50NaAlH4 dehydrided after number of cycles, n, of 4 at 593 K.
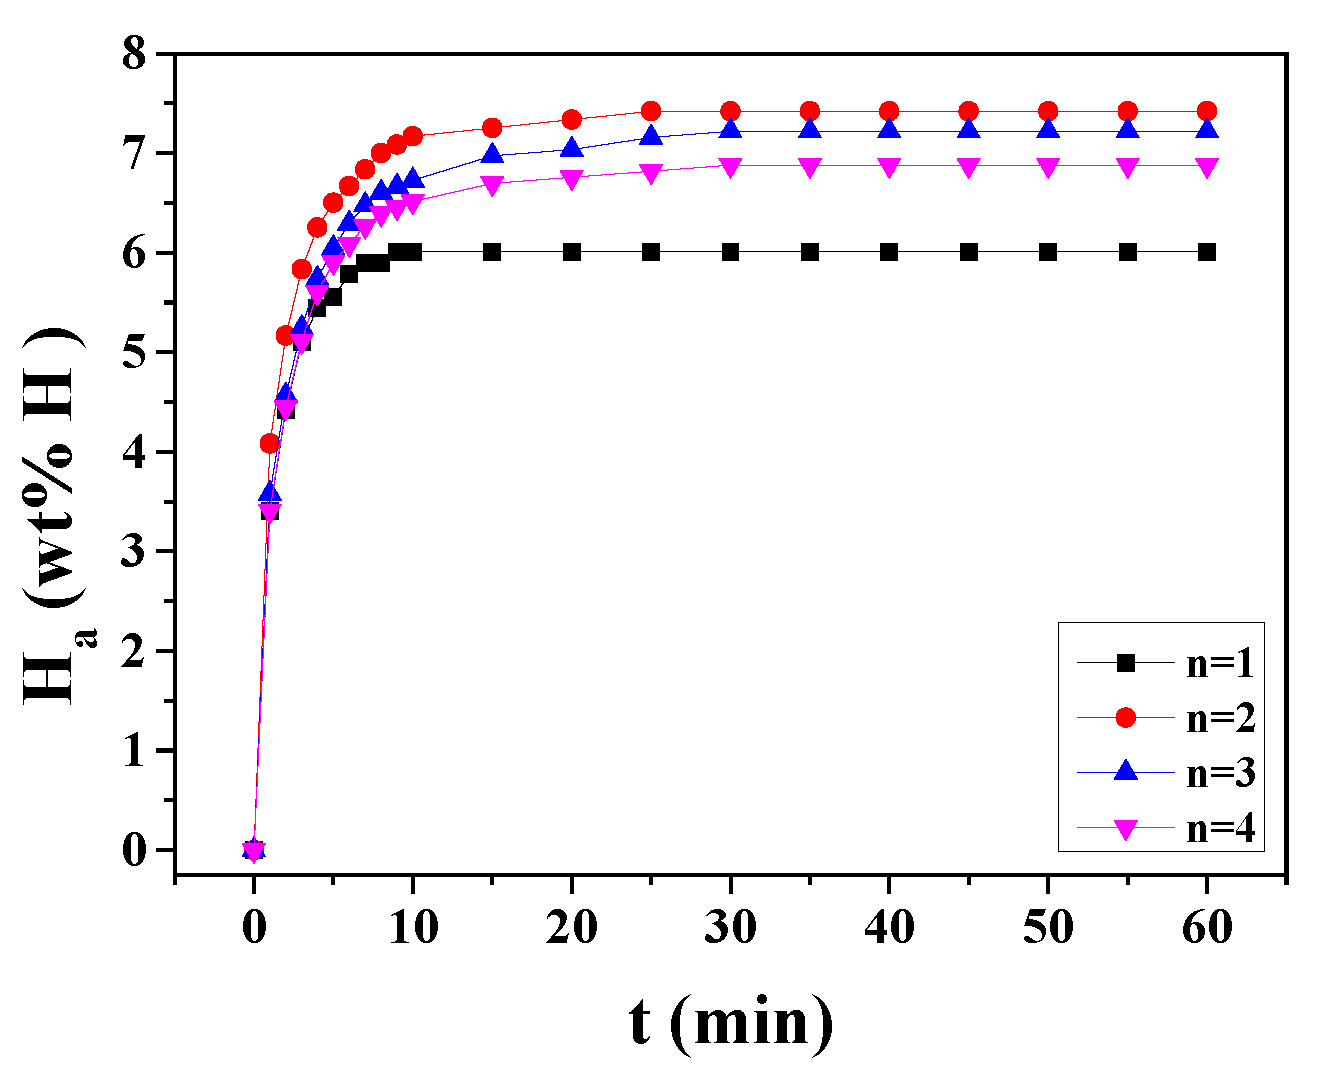
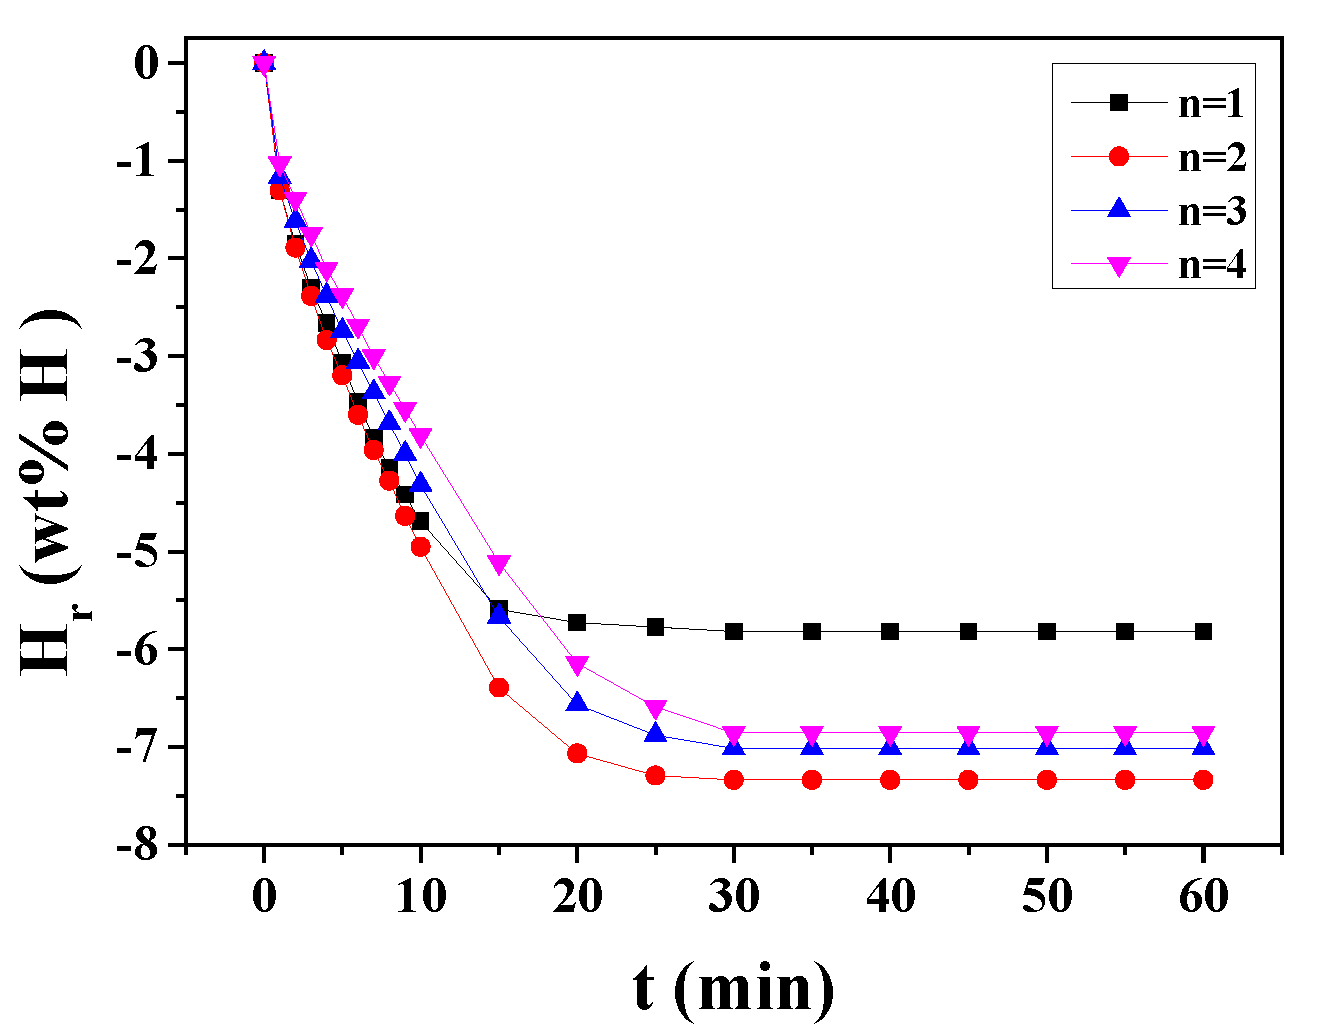
Figure 4 shows the change of H
a versus time t curve at 593 K in 12 bar hydrogen with cycle number, n, for MgH
2-30NaAlH
4. The effective hydrogen-storage capacity is defined as the quantity of hydrogen absorbed for 60 min (wt% H). As n increases from one to two, the hydrogen-absorption rate for 1 min increases, and from n = 2 to n =4 the initial hydriding rate decreases. In a similar way, the effective hydrogen-storage capacity increases as n increases from one to two, and from n = 2 to n = 4 the effective hydrogen-storage capacity decreases. The activation is considered to have been completed after n = 2. At n = 2, MgH
2-30NaAlH
4 absorbs 4.09 wt% H for 1 min, 7.17 wt% H for 10 min, and 7.42 wt% H for 60 min.
The change of H
r versus t curve at 593 K in 1.0 bar hydrogen with n for MgH
2-30NaAlH
4 is shown in
Figure 5. As the number of cycles (n) increases from one to four, the hydrogen-release rate for 1 min decreases. The hydrogen-release rate for 1 min at n = 1 and n = 2 are very similar. The quantity of hydrogen released for 60 min increases as n increases from one to two, and from n = 2 to n =4 the quantity of hydrogen released for 60 min decreases. At n = 2, MgH
2-30NaAlH
4 releases 1.31 wt% H for 1 min, 4.95 wt% H for 10 min, and 7.34 wt% H for 60 min.
During hydrogen absorption (
Figure 3) and release (
Figure 4), the reactions (5) and (6) are believed to occur.
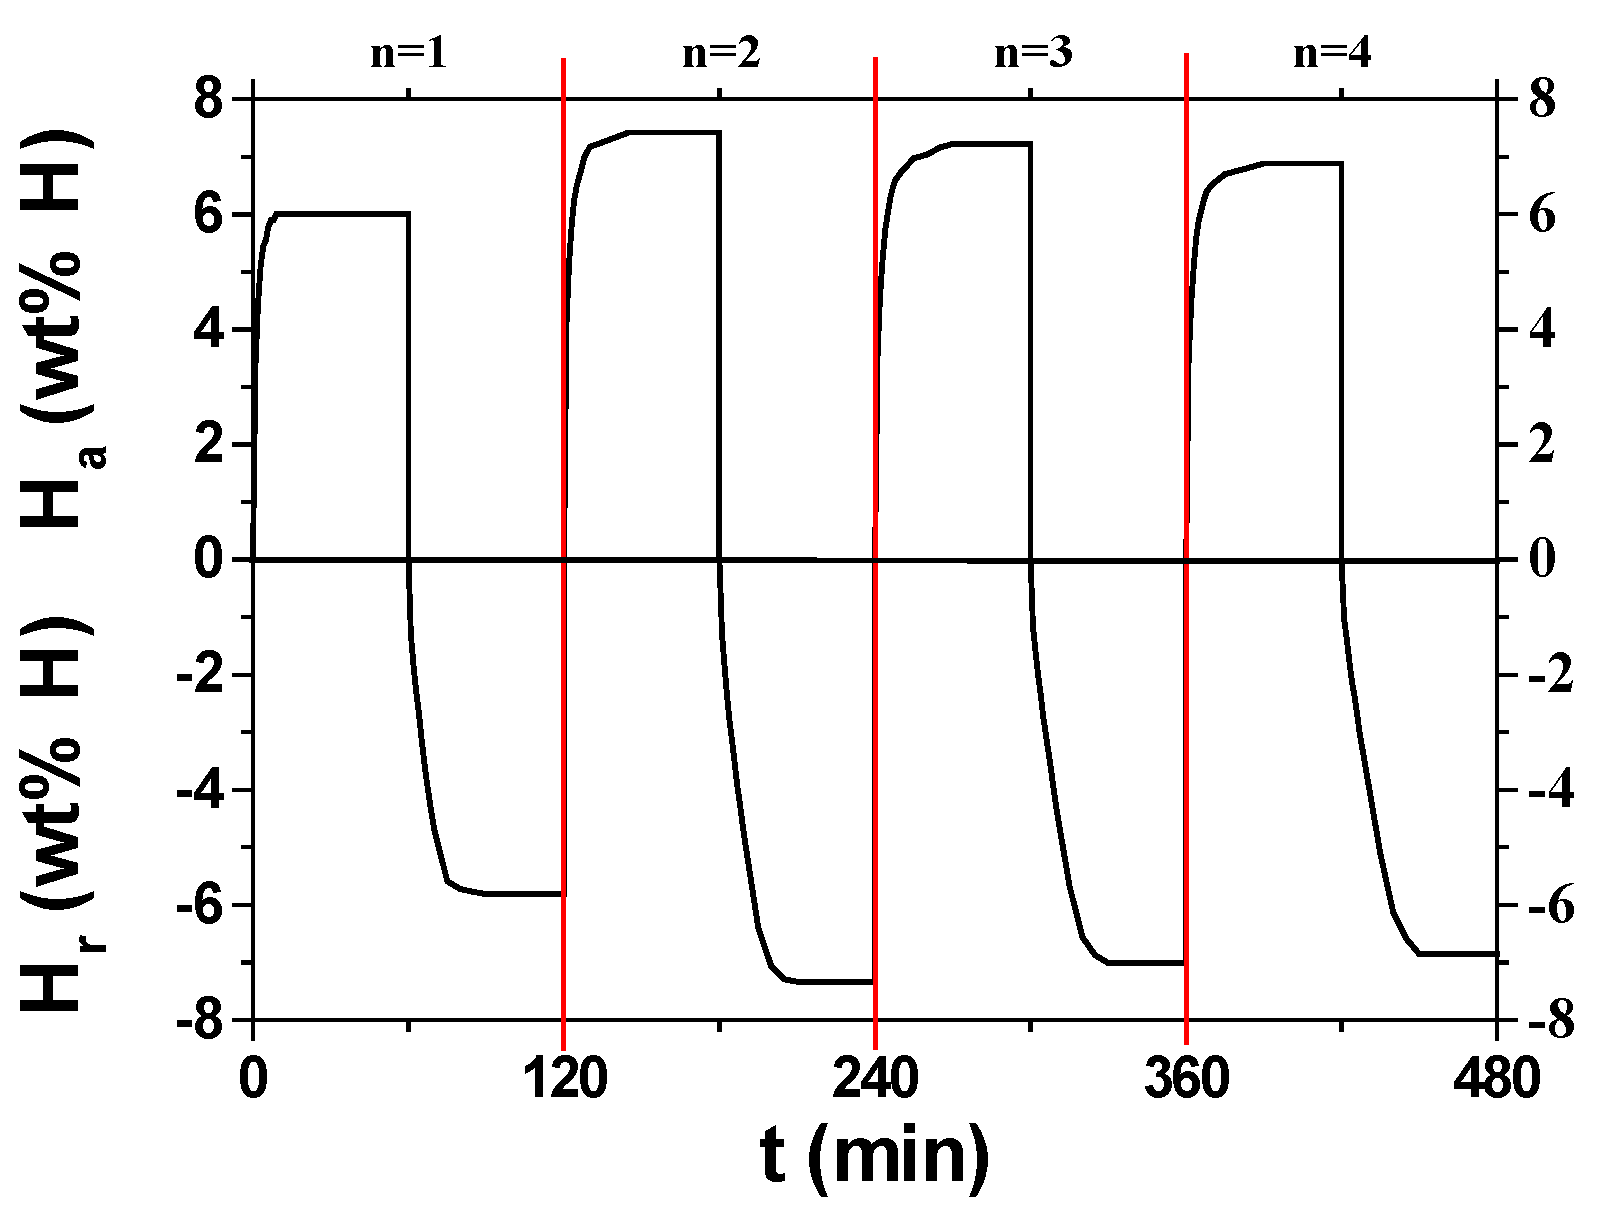
Figure 6 shows changes in H
a versus time t curve at 593 K in 12 bar hydrogen and H
r versus t curve at 593 K in 1.0 bar hydrogen with cycle number, n, for MgH
2-30NaAlH
4. The curves show that activation is completed after n = 2, showing the highest hydrogen-absorption rate, the highest hydrogen-release rate, the largest effective hydrogen-storage capacity, and the largest quantity of hydrogen released for 60 min.
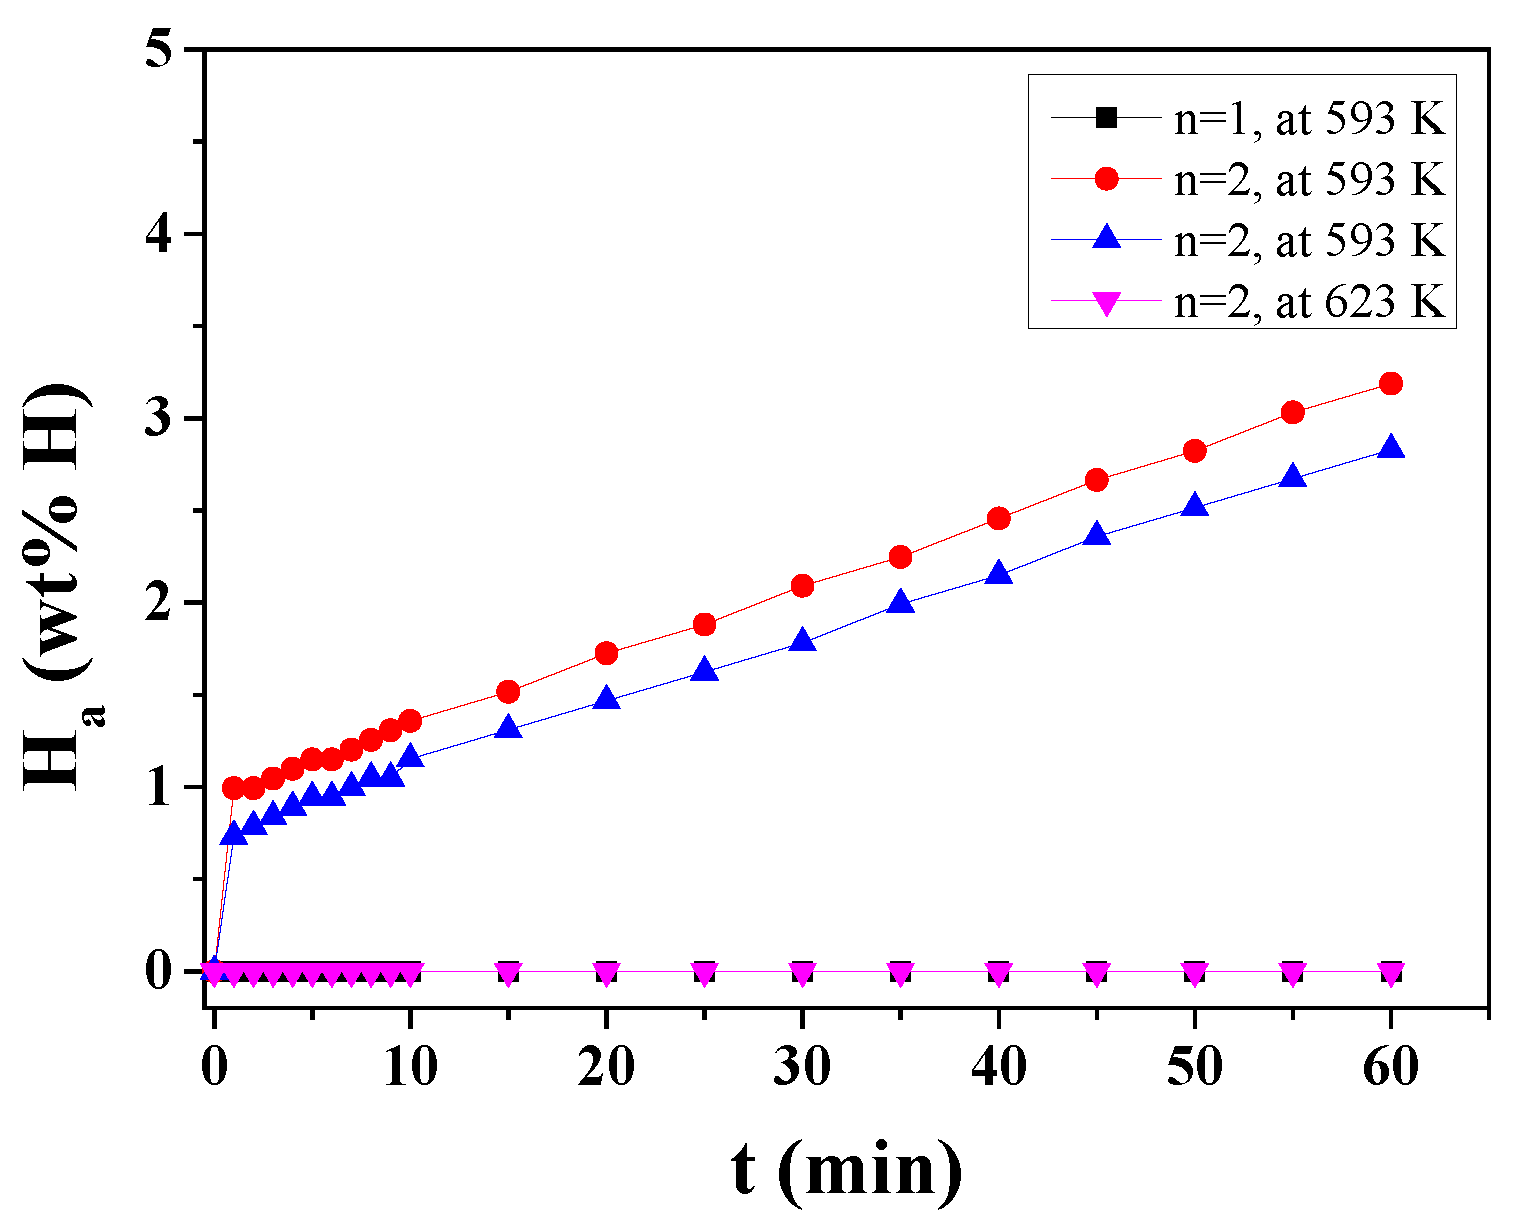
The H
a versus t curves in 12 bar hydrogen at 593 K or 623 K at n = 1 and n = 2 for MgH
2-50NaAlH
4 are shown in
Figure 7. Because the hydrogen-absorption rate was low, experiments were performed several times. Even though the samples were handled in an Ar atmosphere, the samples were ignited and combusted partly, leading to low hydrogen-absorption rates and low effective hydrogen storage capacities. For n = 1 at 593 K, the MgH
2-50NaAlH
4 sample does not absorb hydrogen. For n = 2 at 623 K, the MgH
2-50NaAlH
4 sample does not absorb hydrogen either, probably because the difference between the applied hydrogen pressure (12 bar) and the equilibrium plateau pressure at 623 K (6.38 bar [
13]) of the Mg-H system is small. At n = 2, the MgH
2-50NaAlH
4 sample absorbs 0.99 wt% H for 1 min, 1.36 wt% H for 10 min, and 3.19 wt% H for 60 min at 593 K.
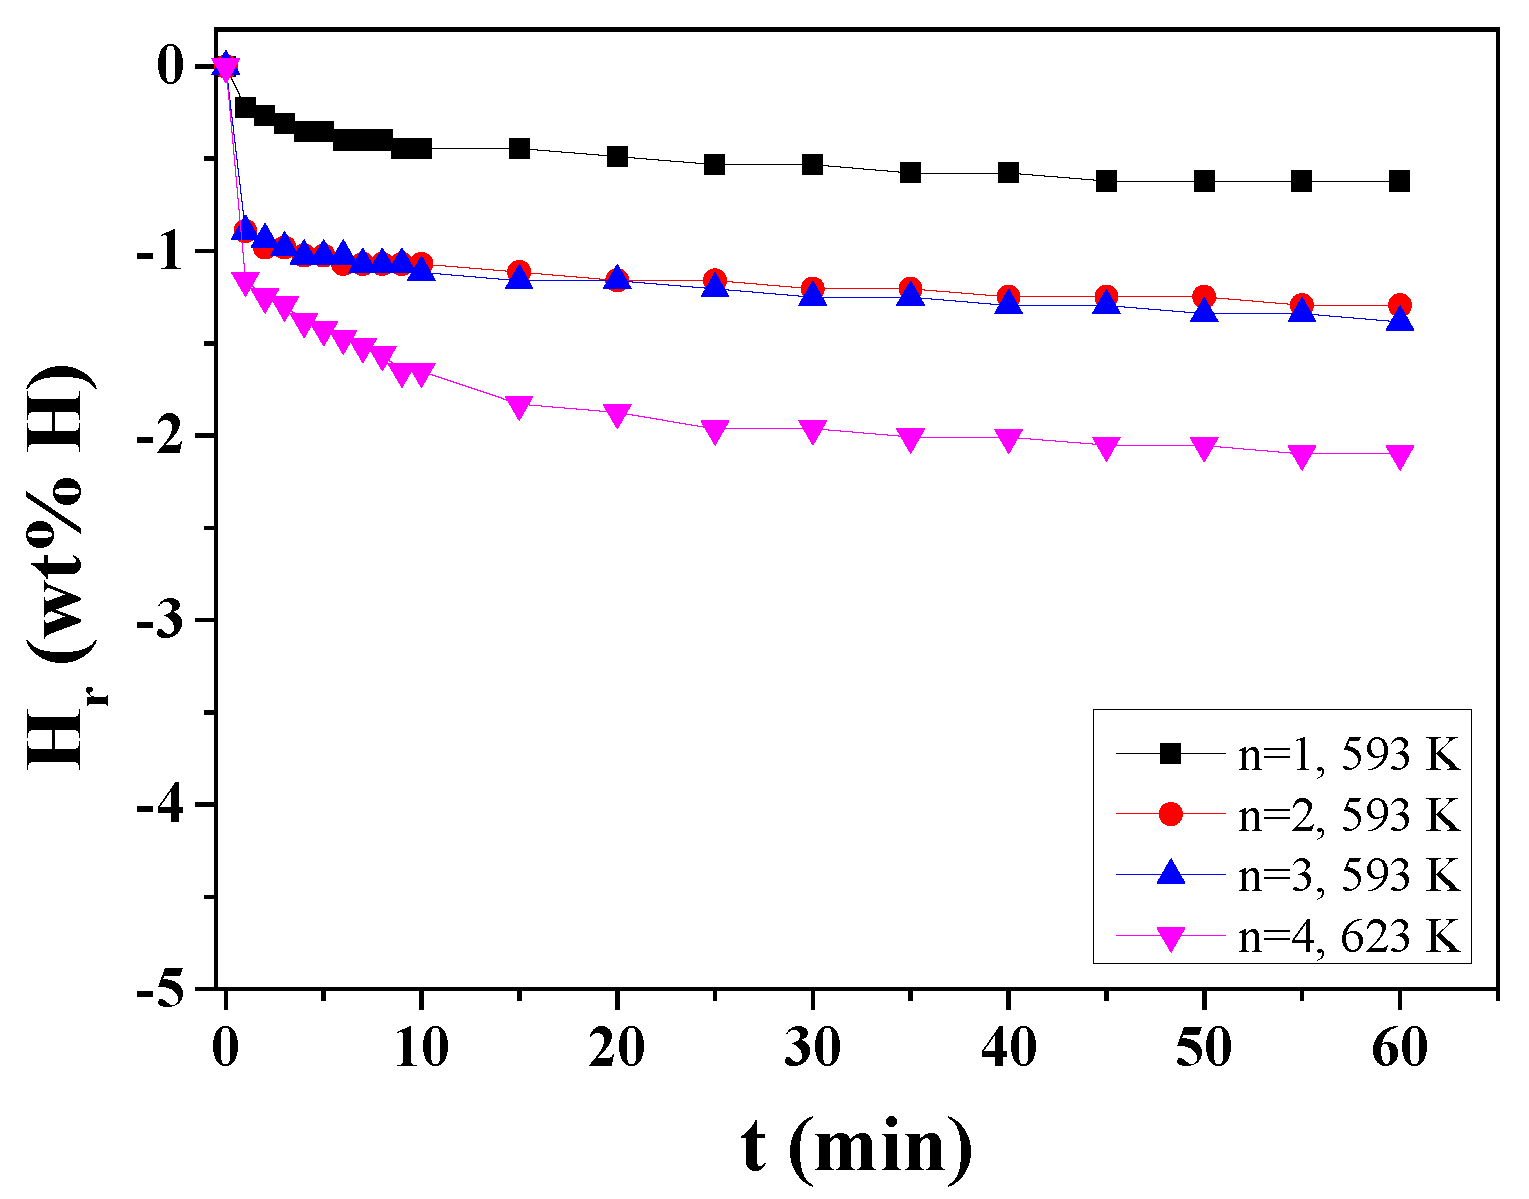
Figure 8 shows the H
r versus t curves in 1.0 bar hydrogen at 593 K or 623 K at n = 1 ∼ 4 for MgH
2-50NaAlH
4. Hydrogen-release rates are low and the quantities of hydrogen released for 60 min are small. As n increases, the initial hydrogen-release rate and the quantity of hydrogen released for 60 min increase slightly. At n = 2, the MgH
2-50NaAlH
4 sample releases 1.03 wt% H for 5 min and 1.29 wt% H for 60 min at 593 K. When the temperature increases from 593 K to 623 K, the initial hydrogen-release rate and the quantity of hydrogen released for 60 min increase slightly. Partial ignition and combustion in the samples led to low initial hydrogen-release rates and small quantities of hydrogen released for 60 min.
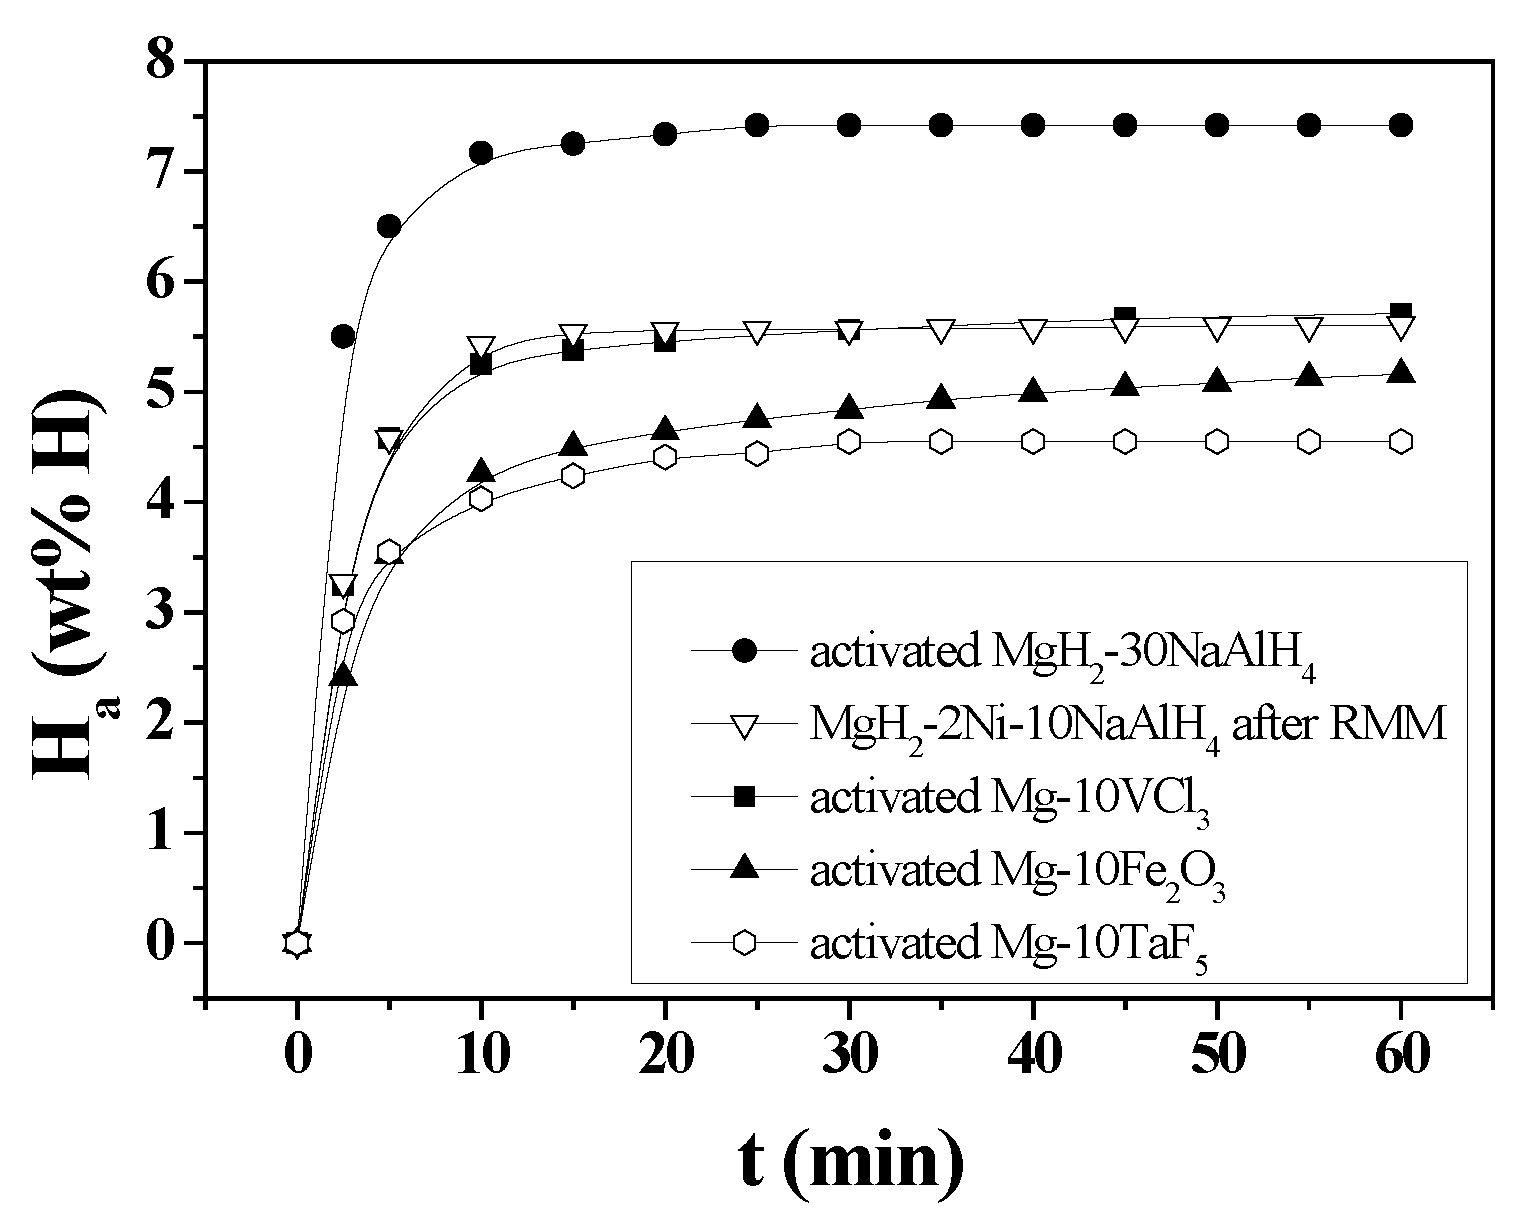
H
a versus t curves in 12 bar hydrogen at 593 K for activated MgH
2-30NaAlH
4, MgH
2-2Ni-10NaAlH
4 after RMM, activated Mg-10Fe
2O
3 [
14,
15], activated Mg-10TaF
5 [
16,
17], and activated Mg-10VCl
3 [
18] are shown in
Figure 9. The Mg-10Fe
2O
3 [
14,
15], Mg-10TaF
5 [
16,
17], and Mg-10VCl
3 [
18] samples were also prepared by RMM under the conditions similar to those for preparing MgH
2-30NaAlH
4, MgH
2-2Ni-10NaAlH
4. MgH
2-2Ni-10NaAlH
4 did not require activation after reactive mechanical milling (RMM). The H
a versus t curve of MgH
2-2Ni-10NaAlH
4 after RMM is used for comparison with the H
a versus t curves of other activated samples. Activated MgH
2-30NaAlH
4 has the highest hydrogen-absorption rate for 2.5 min, followed in order by MgH
2-2Ni-10NaAlH
4 after RMM, activated Mg-10VCl
3, activated Mg-10TaF
5, and activated Mg-10Fe
2O
3. Activated MgH
2-30NaAlH
4 has the highest effective hydrogen-storage capacity, followed in order by activated Mg-10VCl
3, MgH
2-2Ni-10NaAlH
4 after RMM, activated Mg-10Fe
2O
3, and activated Mg-10TaF
5. MgH
2-30NaAlH
4 has much higher hydrogen-absorption rate for 2.5 min (2.20 wt% H/min) and much larger effective hydrogen-storage capacity (7.42 wt% H) than the other samples.
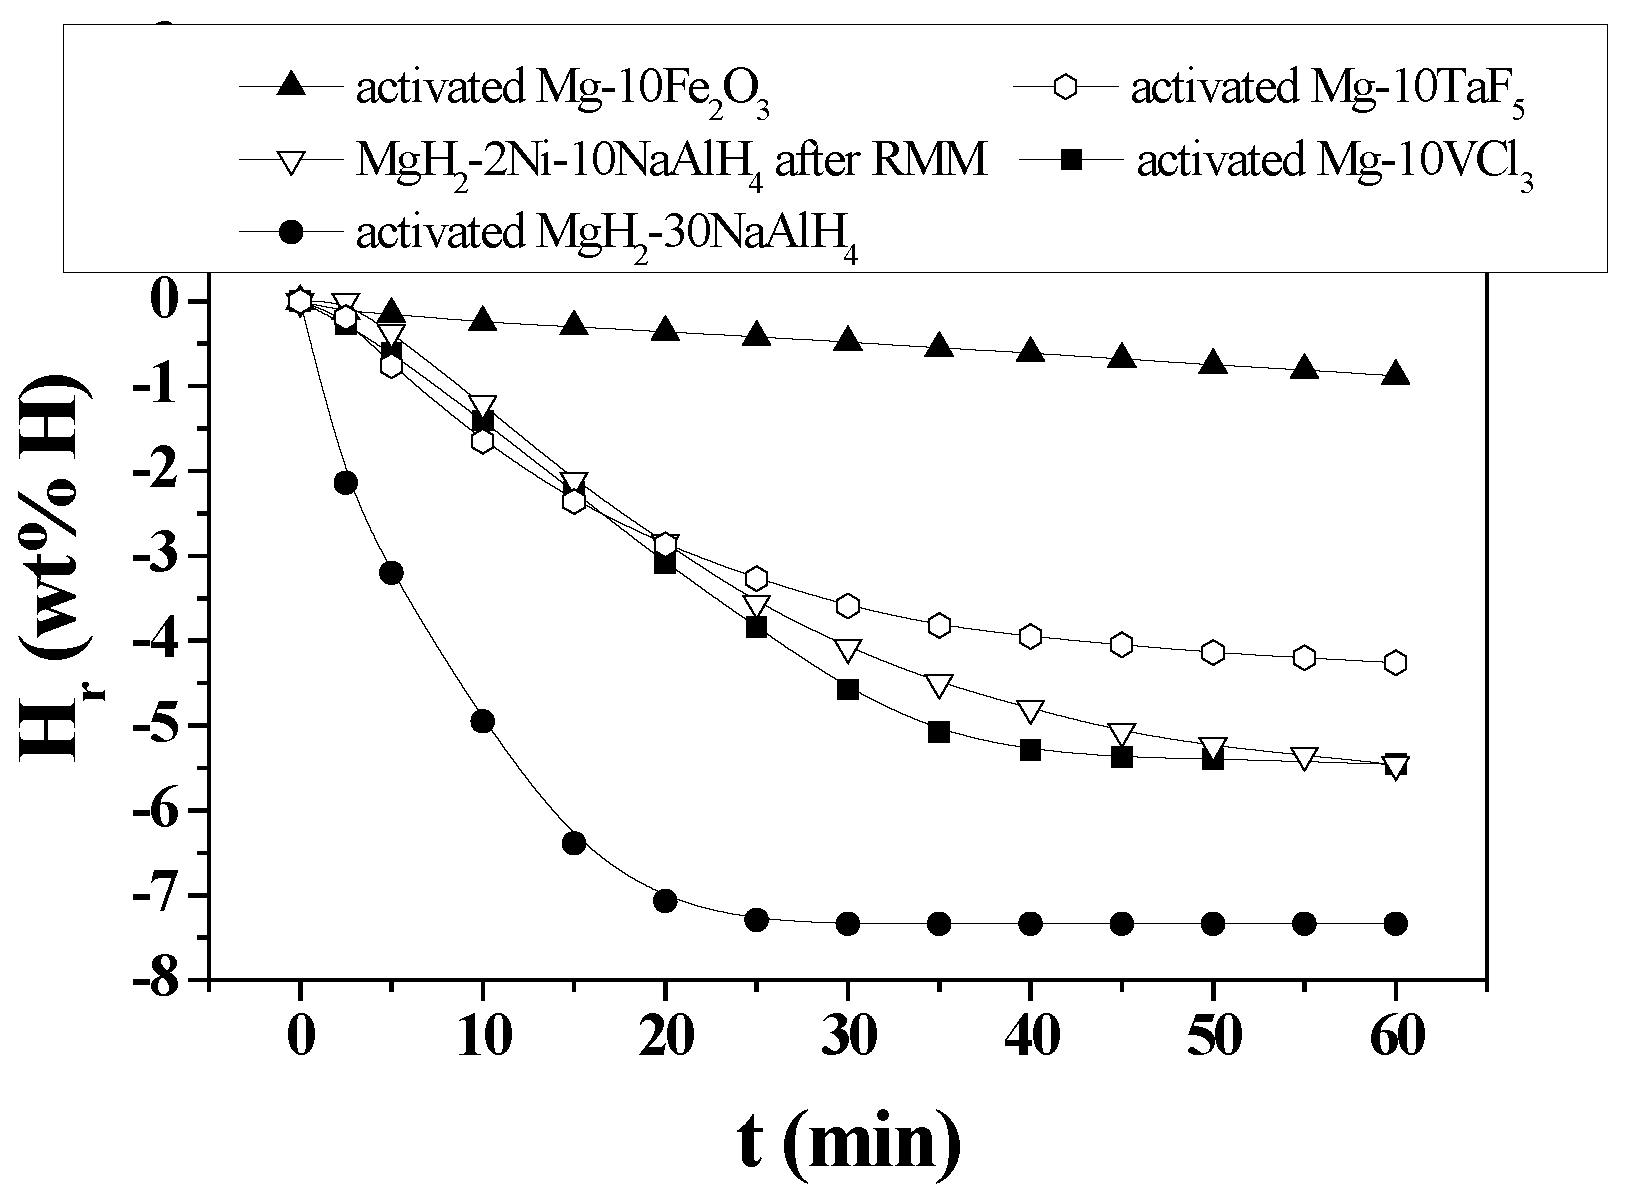
Figure 10 shows H
r versus t curves in 1.0 bar hydrogen at 593 K for activated MgH
2-30NaAlH
4, MgH
2-2Ni-10NaAlH
4 after RMM, activated Mg-10Fe
2O
3, activated Mg-10TaF
5, and activated Mg-10VCl
3. Activated MgH
2-30NaAlH
4 has the highest hydrogen-release rate for 2.5 min, followed in order by activated Mg-10VCl
3, activated Mg-10TaF
5, MgH
2-2Ni-10NaAlH
4 after RMM, and activated Mg-10Fe
2O
3. Activated MgH
2-30NaAlH
4 has the largest quantity of hydrogen released for 60 min, followed in order by activated Mg-10VCl
3, MgH
2-2Ni-10NaAlH
4 after RMM, activated Mg-10TaF
5, and activated Mg-10Fe
2O
3, and activated. MgH
2-30NaAlH
4 has much higher hydrogen-release rate for 2.5 min (0.86 wt%/min) and much larger quantity of hydrogen released for 60 min (7.34 wt% H) than the other samples.
4. Discussion
From the results of Fig. 2, it is believed that for the NaAlH4, the reaction (1) [decomposition of NaAlH4] begins to occur at 438 K and the reaction (2) [decomposition of Na3AlH6] begins to occur at 495 K. For the MgH2-10NaAlH4 sample, it is believed that the reaction (4) occurs between the point 1 (508 K) and the point 2 (525 K), the reactions (5) and (6) begins to occur after the point 3 (550 K), and then the reaction (7) and the reaction (8) occur consecutively. For the MgH2-30NaAlH4 sample, it is believed that the reaction (4) occurs between the point 1 (480 K) and the point 2 (541 K), the reactions (5) and (6) begins to occur after the point 3 (562 K), and then the reaction (7) and the reaction (8) occur consecutively. The reaction (4) for the MgH2-30NaAlH4 begins to occur at 28 K lower temperature than that for the MgH2-10NaAlH4.
Samples were easily ignited and combusted during treatment, making difficult the obtention of XRD patterns and leading to the formation of a strong peak of MgO and relatively weak peaks of other phases. Liu et al. [
12] reported that when the temperature is increased to 633 K, the preformed Al and Al
3Mg
2 disappear. In Fig. 3 (the XRD pattern of MgH
2-50NaAlH
4 dehydrided after number of cycles, n, of 4 at 593 K), the Al
3Mg
2 phase is observed. The dehydriding temperature (593 K) lower than that in the work of Liu et al. [
12] is believed to have led to this result.
As the content of NaAlH4 in the sample increases, the temperature at the highest peak in the ratio of increase in Hr to increase in T, dHr/dT, versus T curve decreases. The higher content of NaAlH4 is believed to have made effects of reactive mechanical milling stronger. However, too much content of NaAlH4 (as in MgH2-50NaAlH4) leads to worse hydrogen-storage properties (hydrogen-absorption rate, hydrogen-release rate, and hydrogen-storage capacity).
RMM creates defects and cracks. The propagation of cracks makes the particles finer. Defects can be used as the sites active for nucleation. Decrease in particle size reduces the diffusion distance of hydrogen atoms. The added materials and formed phases are believed to make the effects of RMM stronger. The expansion of lattice due to hydrogen absorption and the contraction of lattice due to hydrogen release causes the effects similar to those of RMM. However, the effects of lattice expansion and contraction will be weaker than those of RMM. The MgH
2-30NaAlH
4 sample has a higher hydrogen-absorption rate for 2.5 min, a larger effective hydrogen-storage capacity, a higher hydrogen-release rate for 2.5 min, and a larger quantity of hydrogen released for 60 min than the other samples, showing that the effects of RMM and hydrogen absorption-release cycling are stronger in the MgH
2-30NaAlH
4 sample, compared with those for the other samples. Reportedly, nucleation can be facilitated by creating active nucleation sites by mechanical treatment and/or alloying with additives [
19]; the diffusion distance of hydrogen can also be decreased by the mechanical treatment and/or alloying of Mg with additives, thereby reducing the magnesium particle size [
20]; in addition, the hydrogen mobility can be improved by additives that create microscopic paths of hydrogen [
20]; a rough surface of magnesium particles having many cracks and defects is thus considered more advantageous for hydrogen absorption [
21].
In our future work, milled NaAlH4 will be prepared by reactive mechanical milling. The quantity of released hydrogen (Hr) versus temperature T curve and the ratio of increase in Hr to increase in T, dHr/dT, versus T curve for the milled NaAlH4 will be obtained and studied in detail. Behaviors of the milled NaAlH4, which are different from those of NaAlH4, are expected.
As shown in
Figure 9 and
Figure 10, addition effects of NaAlH
4, oxide, halides, or fluoride to MgH
2 or Mg are different. Which kinds of properties such as physical properties (hardness, toughness, surface area, and microstructure, etc.) and chemical properties affect the hydrogen-storage properties will be investigated.
5. Conclusions
In this work, milled MgH2, NaAlH4, MgH2–10NaAlH4 (with a composition of 90 wt% MgH2 + 10 wt% NaAlH4), MgH2–30NaAlH4 (70 wt% MgH2 + 30 wt% NaAlH4), MgH2–50NaAlH4 (50 wt% MgH2 + 50 wt% NaAlH4), and MgH2–2Ni-10NaAlH4 (88 wt% MgH2 + 2 wt% Ni + 10wt% NaAlH4) samples were prepared by reactive mechanical milling (RMM). As the content of NaAlH4 in the sample increased, the temperature at the highest peak in the ratio of increase in Hr to increase in T, dHr/dT, versus T curve decreased. The higher content of NaAlH4 is believed to have made effects of reactive mechanical milling stronger. MgH2-50NaAlH4 dehydrided after four cycles contained Al, MgO, Al3Mg2, MgH2, and Mg17Al12. Hydriding in 12 bar hydrogen and dehydriding in 1.0 bar hydrogen at 593 K of MgH2-30NaAlH4 are performed by the reversible reactions MgH2 ⇔ Mg + H2 and 17MgH2 + 12Al ⇔ Mg17Al12 + 17H2. Activation of MgH2–30NaAlH4 was completed after two hydrogen absorption-release cycles. MgH2–30NaAlH4 was the best Mg-based composite among Mg-based alloys in which an oxide, a halide, a fluoride, or a complex hydride was added, with a high hydrogen-absorption rate for 2.5 min (2.20 wt% H/min) and a large effective hydrogen-storage capacity (7.42 wt% H).
Author Contributions
Conceptualization, Kwak, Y.J.; Song, M.Y.; Lee, K.-T.; methodology, Kwak, Y.J.; Song, M.Y.; Lee, K.-T.; formal analysis, Kwak, Y.J.; Song, M.Y.; Lee, K.-T.; investigation, Kwak, Y.J.; Song, M.Y.; Lee, K.-T.; data curation, Kwak, Y.J.; writing—original draft preparation, Kwak, Y.J.; Song, M.Y.; writing—review and editing—Kwak, Y.J.; Song, M.Y.; Lee, K.-T.; project administration, Kwak, Y.J.; Lee, K.-T.; funding acquisition, Kwak, Y.J.; All authors have read and agreed to the published version of the manuscript.
Funding
This work was supported by the National Research Foundation of Korea (NRF) grant funded by the Korean government (MSIT) (No. 2021R1C1C2009103). This work was supported by Korea Institute of Energy Technology Evaluation and Planning (KETEP) grant funded by the Korea government (MOTIE) (20213030040110).
Data Availability Statement
The data that support the findings of this study are available on request from the corresponding author, [M Y S].
Conflicts of Interest
The authors declare no conflict of interest.
References
- Reilly, J.J.; Wiswall, R.H. Reaction of hydrogen with alloys of magnesium and nickel and the formation of Mg2NiH4. Inorg. Chem. 1968, 7, 2254–2256. [Google Scholar] [CrossRef]
- Karty, A.; Genossar, J.G.; Rudman, P.S. Hydriding and dehydriding kinetics of Mg in a Mg/Mg2Cu eutectic alloy: Pressure sweep method. J. Appl. Physics 1979, 50, 7200–7209. [Google Scholar] [CrossRef]
- Akiba, E.; Nomura, K.; Ono, S.; Suda, S. Kinetics of the reaction between Mg-Ni alloys and H2. Int J. Hydrogen Energy 1982, 7, 787–791. [Google Scholar] [CrossRef]
- Bobet, J.-L.; Akiba, E.; Nakamura, Y.; Darriet, B. Study of Mg–M (M = Co, Ni and Fe) mixture elaborated by reactive mechanical alloying-hydrogen sorption properties. Int. J. Hydrogen Energy 2000, 25, 987–996. [Google Scholar] [CrossRef]
- Huot, J.; Ravnsbæk, D.B.; Zhang, J.; Cuevas, F.; Latroche, M.; Jensen, T.R. Mechanochemical synthesis of hydrogen storage materials. Prog. Mater. Sci. 2013, 58, 30–75. [Google Scholar] [CrossRef]
- Song, M.Y.; Ahn, D.S.; Kwon, I.H.; Ahn, H.J. Development of Hydrogen storage Alloys by Mechanical Alloying Mg with Fe and Co. Met. Mater. Int. 1999, 5, 485–490. [Google Scholar] [CrossRef]
- Ali, N.A.; Ismail, M. Advanced hydrogen storage of the Mg–Na–Al system: A review. J. Magnesium Alloys 2021, 9, 1111–1122. [Google Scholar] [CrossRef]
- Plerdsranoy, P.; Meethom, S.; Utke, R. Dehydrogenation kinetics, reversibility, and reaction mechanisms of reversible hydrogen storage material based on nanoconfined MgH2−NaAlH4. J. Phys. Chem. Solids 2015, 87, 16–22. [Google Scholar] [CrossRef]
- Rafi-ud-din; Xuanhui, Q.; Ping, L.; Zhang, L.; Ahmad, M.; Iqbal, M.Z.; Rafique, M.Y.; Farooq, M.H. Enhanced hydrogen storage performance for MgH2–NaAlH4 system—The effects of stoichiometry and Nb2O5 nanoparticles on cycling behaviour. RSC Adv. 2012, 2, 4891–4903. [Google Scholar] [CrossRef]
- Ismail, M.; Zhao, Y.; Yu, X.B.; Mao, J.F.; Dou, S.X. The hydrogen storage properties and reaction mechanism of the MgH2–NaAlH4 composite system. Int. J. Hydrogen Energy 2011, 36, 9045–9050. [Google Scholar] [CrossRef]
- Bendyna, J.K.; Dyjak, S.; Notten, P.H.L. The influence of ball-milling time on the dehydrogenation properties of the NaAlH4–MgH2 composite. Int. J. Hydrogen Energy 2015, 40, 4200–4206. [Google Scholar] [CrossRef]
- Liu, H.; Wang, X.; Liu, Y.; Dong, Z.; Ge, H.; Li, S.; Yan, M. Hydrogen Desorption Properties of the MgH2–AlH3 Composites. J. Phys. Chem.C 2014, 118, 37–45. [Google Scholar] [CrossRef]
- Stampfer, J.F.; Molley, C.E.; Suttle, J.F. The Magnesium-Hydrogen System1-3. J. Am. Chem. Soc. 1960, 82, 3504–3508. [Google Scholar] [CrossRef]
- Song, M.Y.; Kwon, I.H.; Kwon, S.N.; Park, C.G.; Hong, S.-H.; Bae, J.-S.; Mumm, D.R. Hydrogen-storage properties of Mg–oxide alloys prepared by reactive mechanical grinding. J. Alloys Compd. 2006, 415, 266–270. [Google Scholar] [CrossRef]
- Song, M.Y.; Kwon, S.N.; Park, H.R. Pressure-Composition Isotherms and Cycling Properties of Mg-xFe2O3-yNi Alloys. Korean J. Met. Mater. 2013, 51, 455–460. [Google Scholar] [CrossRef]
- Kwak, Y.J.; Lee, S.H.; Park, H.R.; Song, M.Y. Review Paper : Hydriding and Dehydriding Reactions of Mg-xTaF5 (x=0, 5, and 10) Prepared via Reactive Mechanical Grinding. Korean J. Met. Mater. 2014, 52, 957–962. [Google Scholar] [CrossRef]
- Kwak, Y.J.; Lee, S.H.; Park, H.R.; Song, M.Y. Hydrogen Storage Characteristics of Mg, Mg-5TaF5, and Mg-5NbF5 Prepared via Grinding in a Hydrogen Atmosphere. J. Nanoscience and Nanotechnology 2016, 16, 10508–10514. [Google Scholar] [CrossRef]
- Song, M.Y.; Lee, S.H.; Mumm, D.R. Fe2O3, MnO, and VCl3-added Mg composites by reactioninvolving grinding processing for hydrogen storage. J. Cer. Proc. Res 2018, 19(3), 211–217. [Google Scholar] [CrossRef]
- Hjort, P.; Krozer, A.; Kasemo, B. Hydrogen sorption kinetics in partly oxidized Mg films. J. Alloys Comp. 1996, 237(1-2), 74–80. [Google Scholar] [CrossRef]
- Zaluska, A.; Zaluski, L.; Ström-Olsen, J.O. Nanocrystalline magnesium for hydrogen storage. J. Alloys Comp. 1999, 288, 217–225. [Google Scholar] [CrossRef]
- Vigeholm, B.; Kjoller, J.; Larsen, B.; Pedersen, A.S. Formation and decomposition of magnesium hydride. J. Less-Common Met. 1983, 89(1), 135–144. [Google Scholar] [CrossRef]
Figure 1.
Quantity of released hydrogen (Hr) versus temperature T curves and dHr/dT versus T curves for milled MgH2, MgH2-10NaAlH4, MgH2-30NaAlH4, and NaAlH4 samples. The samples were heated at a heating rate of 5 ∼ 6 K in 1.0 bar hydrogen.
Figure 1.
Quantity of released hydrogen (Hr) versus temperature T curves and dHr/dT versus T curves for milled MgH2, MgH2-10NaAlH4, MgH2-30NaAlH4, and NaAlH4 samples. The samples were heated at a heating rate of 5 ∼ 6 K in 1.0 bar hydrogen.
Figure 2.
Quantity of released hydrogen (Hr) versus temperature T curves for milled MgH2, MgH2-10NaAlH4, MgH2-30NaAlH4, and NaAlH4 samples. The samples were heated at a heating rate of 5 ∼ 6 K in 1.0 bar hydrogen.
Figure 2.
Quantity of released hydrogen (Hr) versus temperature T curves for milled MgH2, MgH2-10NaAlH4, MgH2-30NaAlH4, and NaAlH4 samples. The samples were heated at a heating rate of 5 ∼ 6 K in 1.0 bar hydrogen.
Figure 4.
Change in quantity of absorbed hydrogen (Ha) versus time t curve at 593 K in 12 bar hydrogen with cycle number, n, for MgH2-30NaAlH4.
Figure 4.
Change in quantity of absorbed hydrogen (Ha) versus time t curve at 593 K in 12 bar hydrogen with cycle number, n, for MgH2-30NaAlH4.
Figure 5.
Change in quantity of released hydrogen (Hr) versus t curve at 593 K in 1.0 bar hydrogen with cycle number, n, for MgH2-30NaAlH4.
Figure 5.
Change in quantity of released hydrogen (Hr) versus t curve at 593 K in 1.0 bar hydrogen with cycle number, n, for MgH2-30NaAlH4.
Figure 6.
Changes in Ha versus t curve at 593 K in 12 bar hydrogen and Hr versus t curve at 593 K in 1.0 bar hydrogen with cycle number, n, for MgH2-30NaAlH4.
Figure 6.
Changes in Ha versus t curve at 593 K in 12 bar hydrogen and Hr versus t curve at 593 K in 1.0 bar hydrogen with cycle number, n, for MgH2-30NaAlH4.
Figure 7.
Ha versus t curves in 12 bar hydrogen at 593 K or 623 K at n = 1 and n = 2 for MgH2-50NaAlH4.
Figure 7.
Ha versus t curves in 12 bar hydrogen at 593 K or 623 K at n = 1 and n = 2 for MgH2-50NaAlH4.
Figure 8.
Hr versus t curves in 1.0 bar hydrogen at 593 K or 623 K at n = 1 ∼ 4 for MgH2-50NaAlH4.
Figure 8.
Hr versus t curves in 1.0 bar hydrogen at 593 K or 623 K at n = 1 ∼ 4 for MgH2-50NaAlH4.
Figure 9.
Ha versus t curves in 12 bar hydrogen at 593 K for activated MgH2-30NaAlH4, MgH2-2Ni-10NaAlH4 after RMM, activated Mg-10Fe2O3, activated Mg-10TaF5, and activated Mg-10VCl3.
Figure 9.
Ha versus t curves in 12 bar hydrogen at 593 K for activated MgH2-30NaAlH4, MgH2-2Ni-10NaAlH4 after RMM, activated Mg-10Fe2O3, activated Mg-10TaF5, and activated Mg-10VCl3.
Figure 10.
Hr versus t curves in 1.0 bar hydrogen at 593 K for activated MgH2-30NaAlH4, MgH2-2Ni-10NaAlH4 after RMM, activated Mg-10Fe2O3, activated Mg-10TaF5, and activated Mg-10VCl3.
Figure 10.
Hr versus t curves in 1.0 bar hydrogen at 593 K for activated MgH2-30NaAlH4, MgH2-2Ni-10NaAlH4 after RMM, activated Mg-10Fe2O3, activated Mg-10TaF5, and activated Mg-10VCl3.
Table 1.
Temperatures (K) at peaks in the dHr/dT versus T curves for milled MgH2, MgH2-10NaAlH4, MgH2-30NaAlH4, and NaAlH4 samples.
Table 1.
Temperatures (K) at peaks in the dHr/dT versus T curves for milled MgH2, MgH2-10NaAlH4, MgH2-30NaAlH4, and NaAlH4 samples.
| |
Peak |
Highest Peak |
Peak |
Peak |
| milled MgH2
|
|
638 |
|
|
| MgH2-10NaAlH4
|
513 |
600 |
|
|
| MgH2-30NaAlH4
|
512 |
592 |
|
|
| NaAlH4
|
|
455 |
552 |
631 |
Table 2.
Temperatures (K) at the marked points in the Hr versus T curves for milled MgH2, MgH2-10NaAlH4, MgH2-30NaAlH4, and NaAlH4 samples.
Table 2.
Temperatures (K) at the marked points in the Hr versus T curves for milled MgH2, MgH2-10NaAlH4, MgH2-30NaAlH4, and NaAlH4 samples.
| Marked Points |
1 |
2 |
3 |
4 |
| milled MgH2
|
627 |
673 |
|
|
| MgH2-10NaAlH4
|
508 |
525 |
550 |
|
| MgH2-30NaAlH4
|
480 |
541 |
562 |
633 |
| NaAlH4
|
438 |
488 |
495 |
625 |
|
Disclaimer/Publisher’s Note: The statements, opinions and data contained in all publications are solely those of the individual author(s) and contributor(s) and not of MDPI and/or the editor(s). MDPI and/or the editor(s) disclaim responsibility for any injury to people or property resulting from any ideas, methods, instructions or products referred to in the content. |
© 2024 by the authors. Licensee MDPI, Basel, Switzerland. This article is an open access article distributed under the terms and conditions of the Creative Commons Attribution (CC BY) license (http://creativecommons.org/licenses/by/4.0/).
