Preprint
Article

Assessment of Ecosystem Service Value and Social Costs of Carbon Emissions in Island Ecosystems: A Case Study of Zhoushan Archipelago

Altmetrics

Downloads

110

Views

43

Comments

0

A peer-reviewed article of this preprint also exists.

Submitted:

18 December 2023

Posted:

03 January 2024

You are already at the latest version

Alerts
Abstract
Addressing the contemporary challenges of mitigating and adapting to climate change, conserving biodiversity, and ensuring human well-being constitutes a central focus for humanity. These challenges, though often treated in isolation, are intricately interconnected, sharing common drivers. Current and future research emphasizes the pursuit of an integrated approach that minimizes trade-offs and fosters synergies among the Sustainable Development Goals (SDGs). The nexus between ecosystem service value (ESV) and the social cost of carbon (SCC) is pivotal in informing national and governmental decisions regarding human well-being and climate change mitigation and adaptation, respectively. This study employs the Zhoushan Archipelago as a case study, exploring ESV and SCC dynamics from 2010 to 2020. An in-depth analysis of spatial development characteristics and the temporal and spatial correlation between ESV and SCC is conducted. The findings reveal an increase in Zhoushan Archipelago's land area from 2010 to 2015, stabilizing thereafter, with construction land exhibiting the most notable proportional growth. Carbon emissions were observed during the study period, with forests identified as the primary carbon sink, followed by mudflat and waterbody, while construction land contributed significantly to carbon emissions. Notably, the SCC in Zhoushan Archipelago increased by 2452%, contrasting with a modest 1.5% decrease in ESV during the study period. Global spatial correlation analysis demonstrated a significant positive correlation between ESV and SCC in Zhoushan Archipelago throughout the study period, validated by passing the P-value test. However, local spatial correlation analysis revealed a specific nature of the global spatial correlation between ESV and SCC in the island area. This nuanced understanding enhances our comprehension of the intricacies surrounding ESV and SCC dynamics, contributing valuable insights to the broader discourse on sustainable regional development, economic decarbonization, and human well-being improvement.
Keywords: 
Subject: Environmental and Earth Sciences  -   Environmental Science

1. Introduction

The escalating trajectory of carbon emissions, leading to global warming, has garnered widespread concern, compelling the international community to prioritize the development of a green and low-carbon economy as a consensus strategy to effectively address and mitigate climate change[1]. Predominantly originating from human activities, greenhouse gas emissions pose a considerable threat. In comparison to carbon emissions stemming from industrial production and the combustion of fossil fuels, the introduction of land-use change injects heightened uncertainty into the carbon emission equation[2]. The Intergovernmental Panel on Climate Change's (IPCC) report on climate change and land underscores that all scenarios restraining global warming to 1.5 degrees Celsius hinge significantly on methodologies that effectively mitigate land-use change and facilitate the decarbonization of the economy[3]. Beyond the direct impact on carbon emissions, land-use change significantly disrupts the stability of terrestrial ecosystems by altering their structure and function[4]. This alteration is pivotal for maintaining ecosystem services, which play a critical role in ecological equilibrium[5]. Within the realm of land-use optimization, a primary objective is to maximize environmental benefits. The valuation of ecosystem services stands out as a crucial metric, providing a quantitative measure of these environmental benefits[6]. Emphasizing the explicit comparison of economic costs and environmental benefits, economists play a crucial role in shaping sustainable policies[7]. The Social Cost of Carbon (SCC), estimating the economic loss incurred by emitting an additional tonne of carbon dioxide, serves as a valuable tool for evaluating environmental policies and green investment projects[8]. The joint valuation of ecosystem service values and carbon emissions establishes the foundational basis for national and governmental management decisions. This encompasses endeavors to ensure human well-being and implement measures for mitigating and adapting to climate change[9]. In the context of China's dual carbon policy and simultaneous emphasis on enhancing the ecological environment, an in-depth exploration of the spatial patterns of carbon emissions and ecosystem service values assumes paramount importance. This investigation becomes pivotal in addressing the formidable challenge of harmonizing economic growth with environmental protection within the trajectory of societal development.
Ecosystem services encompass the diverse range of benefits that humans derive directly or indirectly from the environment[10]. The Millennium Ecosystem Assessment report systematically categorizes these services into supporting, regulating, provisioning, and cultural functions[11]. The valuation of ecosystem services involves a meticulous quantification of the benefits accruing to humans from these services, thereby providing a robust foundation for informed decision-making[12]. Various methodologies are employed to estimate the value of ecosystem services, including energy value analysis, ecological space valuation, material quality valuation, and value quantity valuation[13]. Notably, the value quantity evaluation method, grounded in the area of each land use type and its corresponding factor value coefficient, has gained widespread application due to its ease of data collection and low estimation cost[14]. The ESV estimation model introduced by Costanza et al. in 1997 has garnered extensive recognition and usage[15]. Subsequently, Xie et al. revised ecosystem service types, aligning them with China's ecological characteristics, and enhanced the ESV equivalent factor for various land use types[16]. Given China's considerable geographical diversity and complex ecosystems, the application of ESV assessment necessitates a comprehensive consideration of the scale, natural environment, and socio-economic conditions of the study area. This demands the adjustment of ESV equivalent factors per unit area to establish a bespoke ESV assessment system[17].
Land-use carbon emissions encompass the intricate processes, activities, and mechanisms through which land, altered by the human production activities it supports, releases carbon dioxide into the atmosphere. This multifaceted process involves both direct and indirect carbon emissions[2]. Land-use change directly influences the carbon balance of terrestrial ecosystems, subsequently impacting regional carbon emission levels[18], and exerting a substantial influence on global carbon cycling processes[19]. Various methodologies are employed to account for carbon emissions, including the land inventory method, mechanism model simulation method, and carbon emission coefficient method. Among these, the emission coefficient method stands out for its simplicity and broad applicability across different scales[20]. The assessment of land-use carbon emissions in the study area not only serves as a scientific reference for mitigating global warming but also holds practical value for adaptive planning and management of land use[21]. The optimization of land-use carbon emissions and its regulated control [22] , along with regulation [23], carry crucial practical significance.
The impacts of land use change on carbon emissions and ecosystem service values have undergone extensive scrutiny and validation [24,25,26]. Current studies consistently integrate both aspects, providing empirical support for sustainable environmental management. For instance, Soumik Saha et al.[27] conducted a comprehensive assessment in the Chota Nagpur Plateau (India), quantifying carbon stocks, evaluating the status of ecosystem service values, and measuring total primary productivity. Similarly, Chen et al. [28] delved into the spatial and temporal variations in carbon emissions and ecosystem service values induced by land use cover changes within the Chengdu-Chongqing urban agglomeration in China. Scholars have explored both quantitative [29] and spatial[30] relationships between carbon emissions based on land use and the value of ecosystem services. Notably, du et al. [31] calculated and analyzed the ecological and environmental impacts of land use change in Hangzhou, encompassing ESV and carbon emissions. In the context of the Guanzhong Plain urban agglomeration in China from 2000 to 2020, Yang et al. [32] evaluated the carbon emission intensity and ESV intensity, revealing a significant negative spatial correlation [33]. The utilization of the SCC to depict the correlation between carbon emissions and ESV is compelling and comparable, as both methods involve quantitative evaluation from a monetary value perspective[24]. The SCC accounting serves as pivotal evidence for future climate policies and optimizing carbon emissions structures [34]. For instance, Wilfried Rickels et al. [35] estimated a historical time series of the social cost of carbon, assessing the global wealth reduction attributable to individual countries' CO2 emissions from fossil fuels and industrial processes from 1950 to 2018. While payments for carbon and ecosystem services have been assessed to compensate for the loss of livestock income due to reduced grazing regimes and provide carbon sequestration and other benefits[36], there exists a dearth of studies exploring the relationship between carbon emissions and the value of ecosystem services in island ecosystems.
The island ecosystem, positioned at the juncture of the ocean and land, represents a distinctive and intricate geographical region. Marked by a simplified ecological structure, constrained land resources, diminished species richness, and inherent ecological fragility[37], island ecosystems nonetheless exert substantial influence on the global carbon cycle[38]. Presently, a noticeable gap exists in the scholarly landscape regarding comprehensive assessments encompassing both carbon emissions[39] and ESV[40,41] specific to island ecosystems.
This study seeks to elucidate the spatial and temporal dynamics and distribution patterns of ESV and SCC within island ecosystems, as influenced by land use changes. The overarching objective is to contribute valuable insights supporting the formulation and implementation of integrated policies for both land use management and carbon emission control. Utilizing the Zhoushan Islands as a case study, we systematically quantify ESV and SCC across the temporal spectrum from 2010 to 2020. Subsequently, we meticulously analyze their spatial and temporal distribution characteristics and evolution patterns. The investigation extends to a spatial correlation analysis of ESV and SCC at the grid level, aiming to ascertain the existence of a spatial correlation relationship between the two metrics. This analysis further explores their spatial interaction characteristics and local clustering patterns. The findings of this research hold substantial theoretical significance and offer practical implications for advancing objectives related to low-carbon initiatives, green practices, and the pursuit of high-quality regional development.

2. Materials and Methods

2.1. Study Area

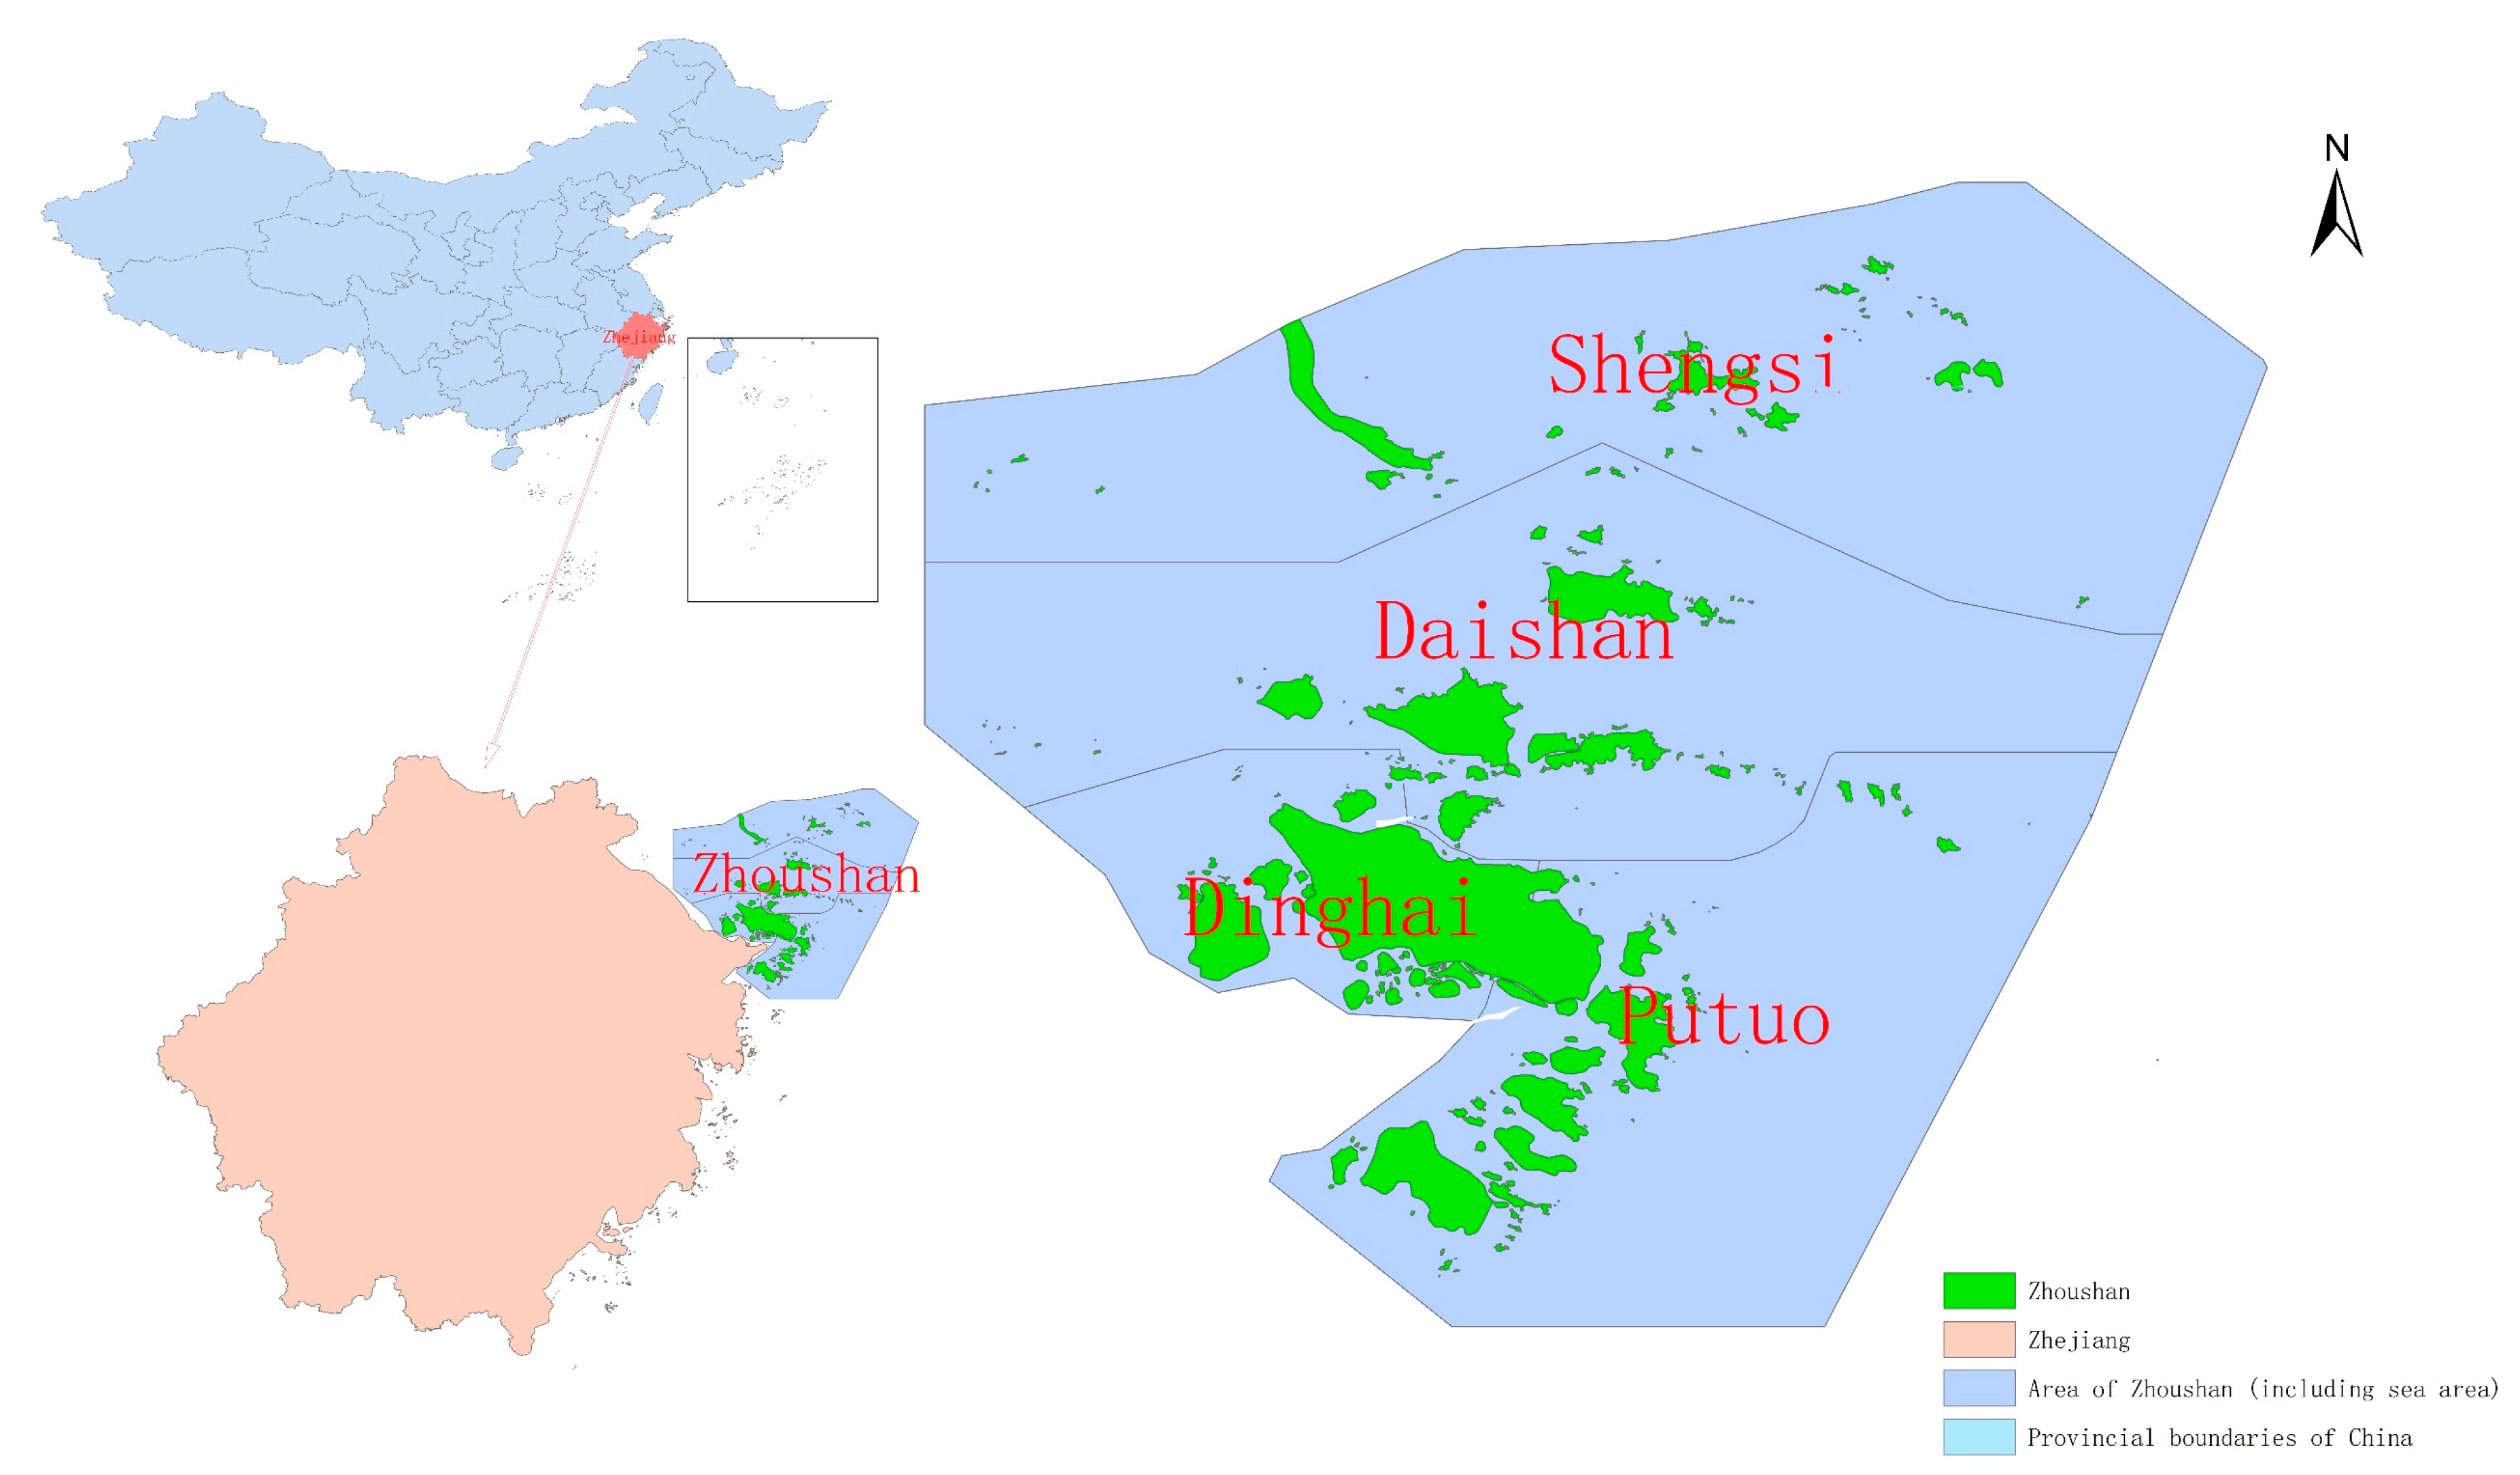
The Zhoushan Archipelago is located in the southeastern coastal region of China, south of the Yangtze River estuary, in the East China Sea at the outer edge of Hangzhou Bay. Zhoushan is the first prefecture-level city in China to be organised as an archipelago, comprising 2085 islands, of which 141 are inhabited. It consists of Dinghai and Putuo districts, and Daishan and Shengsi counties. With a marine area of 20,800 square kilome-tres and a total land area of 1458.76 square kilometres[42], the Zhoushan Cross-Sea Bridge was officially opened in late 2009, and the Zhoushan Archipelago New Area in Zhejiang was established in mid-2011, accelerating the process of urbanisation and industrialisa-tion in the Zhoushan Archipelago. Rapid industrial and economic development, coupled with constraints such as limited land resources and natural disasters, underscore the im-portance of assessing and protecting the fragile ecosystems of these islands.
Figure 1. Geographical location map of Zhoushan Archipelago.
Preprints 93632 g001

2.2. Data Sources and Processing

The datasets employed in this study encompassed land use data, Ecosystem Service Value (ESV) coefficients, and carbon emission coefficients. The land use data and administrative division data for Zhoushan City were acquired from the Chinese Academy of Sciences Resource and Environmental Science and Data Center[43] and the Zhejiang Provincial Geographic Information Public Service Platform[44], respectively. Within the study area, land classes underwent reclassification into eight distinct categories for analytical purposes: farmland, forest, shrubland, grassland, waterbody, construction land, unused land, and mudflat. ESV coefficients, carbon emission coefficients, and correction factors were sourced from the Zhoushan Archipelago Bureau of Statistics [42], the National Bureau of Statistics [45], and relevant literature published in Section 2.3, respectively.

2.3. Research Methods

2.3.1. Carbon Emission Calculation

Within the spectrum of the eight land-use types in the Zhoushan Archipelago, forest, shrubland, grassland, waterbody, unused land, and mudflat function as carbon sinks, whereas farmland and construction land operate as carbon sources. The quantification of carbon emissions for the Zhoushan Archipelago entails computing the summation of products resulting from multiplying the area of each land-use type by its respective carbon emission coefficient. The calculation formula is articulated as follows:
C i = A i × C E C i
In the formulas, i is the land use type, C i is the carbon emission (t/t) of class i land in Zhoushan Archipelago, A i is the land area (ha), and C E C i is the carbon emission coefficient (t/ha). The carbon emission coefficients for various land-use types were obtained from relevant published literature, with values as follows: farmland (0.422)[46], forest (-0.581)[47], shrubland (-0.161)[48], grassland (-0.021)[49], waterbody (-0.253)[46], unused land (-0.005)[50], and mudflat (-1.538)[51].
It is noteworthy to consider construction land. The carbon emissions from construction land primarily result from human production and daily life processes, and indirect estimation methods can be employed for calculation. Considering data availability, the carbon emissions for construction land were computed by multiplying the gross output value of the secondary and tertiary industries in Zhoushan Archipelago by their unit Gross Domestic Product(GDP)energy consumption[52]. The calculation formula is as follows:
C S = G D P 2,3 × I × K
In the equation, C S is the carbon emission of building land (t), G D P 2,3 is the output value of the second and third industries of Zhoushan Archipelago (10,000 yuan). I is the energy consumption of 10,000 yuan of GDP (t standard coal per 10,000 yuan). K is the carbon emission coefficient for coal consumption, set at 0.7476 (t/t)[53].
As of now, the average transaction price in China's eight major carbon market pilot cities was about 29.37 yuan per ton of carbon dioxide[54]. The SCC of the study area can be obtained by calculating the carbon emissions of the study area as in equation (3).
S C C = C i × 29.37

2.3.2. Ecosystem Service Value Accounting

(1) ESV Accounting Coefficients
Building upon the groundwork laid by Xie et al. [14], this study classifies ecosystem services into four principal categories: provisioning services, regulating services, supporting services, and cultural services, each further delineated into 11 subcategories. Provisioning services encompass food production, raw material production, and water supply. Regulating services include gas regulation, climate regulation, environmental purification, and hydrological regulation. Supporting services comprise soil conservation, nutrient cycling maintenance, and biodiversity maintenance. Cultural services primarily encompass the provision of aesthetic landscape services.
The Zhoushan Archipelago Ecosystem Service Value Equivalence Factor Table is derived from the research conducted by Xie et al.[55]. Considering the specific land use conditions in the study area and drawing parallels between landscape types and ecosystem types in the equivalence table, estimates for the ecosystem service values associated with each land type are computed. Accordingly, in the Chinese table of equivalent coefficients for ecosystem service values per unit area, farmland is linked to 'Dry land', forest corresponds to 'Mixed forest', shrubland aligns with 'Shrubland', grassland is paired with 'Meadow', waterbody is associated with 'Water', unused land corresponds to 'Barren', and mudflat is linked to 'Wetland'. Notably, construction land does not contribute to the provisioning of ecosystem service values. The resulting table of base equivalent coefficients for ecosystem service values per unit area is presented and detailed in Table 1.
(2) ESV Coefficient Adjustment
The reference equivalent factor signifies the ecosystem service value per unit area at the national level in China. To enhance adaptability, it is imperative to convert these equivalent factor values from the national scale to the regional scale when applying them to specific events. During the application of these coefficients, adjustments are meticulously executed, taking into account the actual conditions of the study area and incorporating correction factors related to crop yield, socio-economic development, and resource scarcity.
The equivalent factor values employed are based on the economic value of annual cereal production per hectare in regions with the national average yield. These values serve as pivotal benchmarks and form the basis for regional corrections pertaining to other land use types. The correction for cereal yield is contingent upon the ratio of the average cereal yield in the study area to the national average cereal yield. This correction, rooted in cereal yield ratios, reflects regional disparities in the overall ecological service value compared to the national average[56]. The correction formula is articulated as follows:
A = Q Z S Q
Here, A is the Zhoushan Archipelago grain yield correction coefficient, Q Z S and Q represent the per-unit area grain yield in Zhoushan Archipelago and the national average, respectively. According to statistical yearbooks, A is calculated as 0.94 for the years 2005-2020.
The calculation of the socio-economic development coefficient takes into account both willingness and ability to pay. The Engel coefficient represents the share of food expenditure in total personal consumption expenditure. A lower Engel coefficient indicates a lower cost of living, a higher willingness to consume non-food items and a higher willingness to pay. Therefore, the Engel coefficient is used to measure the willingness to pay and GDP per capita represents the ability to pay. The formula for adjusting the ecosystem service value based on the socio-economic development coefficient is as follows:
S = E L Z S E L × G D P ¯ Z S G D P ¯
Here, S is the socioeconomic development correction coefficient, E L Z S and E L represent the Engel coefficients for Zhoushan Archipelago and the national average, respectively, and G D P ¯ Z S and G D P ¯ represent the per capita GDP for Zhoushan Archipelago and the national average, respectively. According to statistical yearbooks, S is calculated as 1.89 for the years 2005-2020.
The resource scarcity coefficient reflects the relationship between supply and demand for ecosystem services, with higher scarcity indicating greater demand for services than supply. This coefficient is determined by measuring resource scarcity using population density. The adjustment formula is:
R = ln P Z S ln P
Here, R is the resource scarcity correction coefficient, ln P Z S and ln P represent the population density in Zhoushan Archipelago and the national average, respectively. According to statistical yearbooks, R is calculated as 0.86 for the years 2005-2020.
The calculation formula for the Zhoushan Archipelago standard equivalent factor correction coefficient ( E F Z S ) is:
E F Z S = A × S × R
The harsh climate and soil conditions on islands limit the development of island vegetation, resulting in differences in vegetation biomass between island and mainland ecosystems. Further adjustments are made to the ecosystem service equivalent of Zhoushan Archipelago's forests.:
E F f o r s e t z s = b B × E F f o r s e t
Here, E F f o r s e t z s is the adjusted per-unit area forest ESV equivalent, b is the forest biomass in Zhoushan Archipelago, B is the average biomass of forest ecosystems per unit area in China, and E F f o r s e t is the ecosystem service equivalent for Chinese forests.
(3) ESV for Various Land Use Types in Zhoushan Archipelago
Ecosystem service value equivalent (ESVE) refers to the potential capacity of ecosystems to generate the relative contribution of ecosystem services, with a factor of 1 standard unit of ESVE, i.e., the economic value of the annual natural food production of 1 hectare of farmland with a national average yield of 1/7th of the market value of the average local food yield[57]. The formula is:
E V = 1 7 × P × Q
Here, E V is the ESV for one standard equivalent factor, P is the average price of grain (yuan/kg), and Q is the per-unit area grain yield (kg/ha). According to the Zhoushan Archipelago Statistical Yearbook, the average grain yield per unit area during the study period was 4939.81 kg/ha. Additionally, the average price of grain in Zhoushan Archipelago was 2.1 yuan/kg. Through calculations, the ecosystem service value for one standard equivalent factor in Zhoushan Archipelago is determined to be 1481.94 yuan/ha.
The basis ESV equivalent factor was corrected according to Equation (7), and then the forest ESV equivalent factor was further corrected by Equation (8). The ESV per unit area of ecosystem in Zhoushan Archipelago ( E S V Z S ) was calculated based on the ESV of 1 standard equivalent factor in Zhoushan Archipelago, and the results were displayed in Table 2.
E S V Z S = A R E A × E V

2.4. Bivariate Spatial Correlation Analysis

To visually analyse the spatio-temporal patterns of ESV and SCC in Zhoushan Archipelago, a fishnet analysis tool was used. The city was divided into a grid of 3 km × 3 km using kilometre grids. By calculating the ESV and SCC for each grid, the spatio-temporal variations of ESV and SCC for Zhoushan Archipelago were obtained. This stage was carried out using ArcGIS 10.4.
Subsequently, the bivariate Moran's index was used to explore the spatial clustering and dispersion between ESV and SCC. The global bivariate Moran's I examined whether there was spatial correlation and the degree of spatial correlation between carbon emission social cost intensity and ESV intensity across the region. Meanwhile, the local bivariate Moran's I showed spatial correlations at specific grid cells[58]. The analysis was carried out using Geoda.

3. Results

3.1. Spatiotemporal Evolution of Land Use Structure in Zhoushan Archipelago

The area of each land-use type was systematically recorded, as detailed in Table 3. The unit is hectare.
The results of our land use classification reveal a distinct trend in the total land area of the Zhoushan Archipelago from 2010 to 2015, primarily attributed to human reclamation activities. Subsequently, there was a modest reduction in area from 2015 to 2020, with relatively minor changes. Specifically, the areas designated for forest and water experienced a gradual annual decline, while the land allocated for construction witnessed a consistent increase. Human reclamation activities on mudflats influenced an overall expansion in both grassland and mudflat areas. In contrast, other land use types exhibited relatively stable patterns, characterized by small fluctuations in their respective contribution rates.

3.2. Spatiotemporal Evolution of SCC

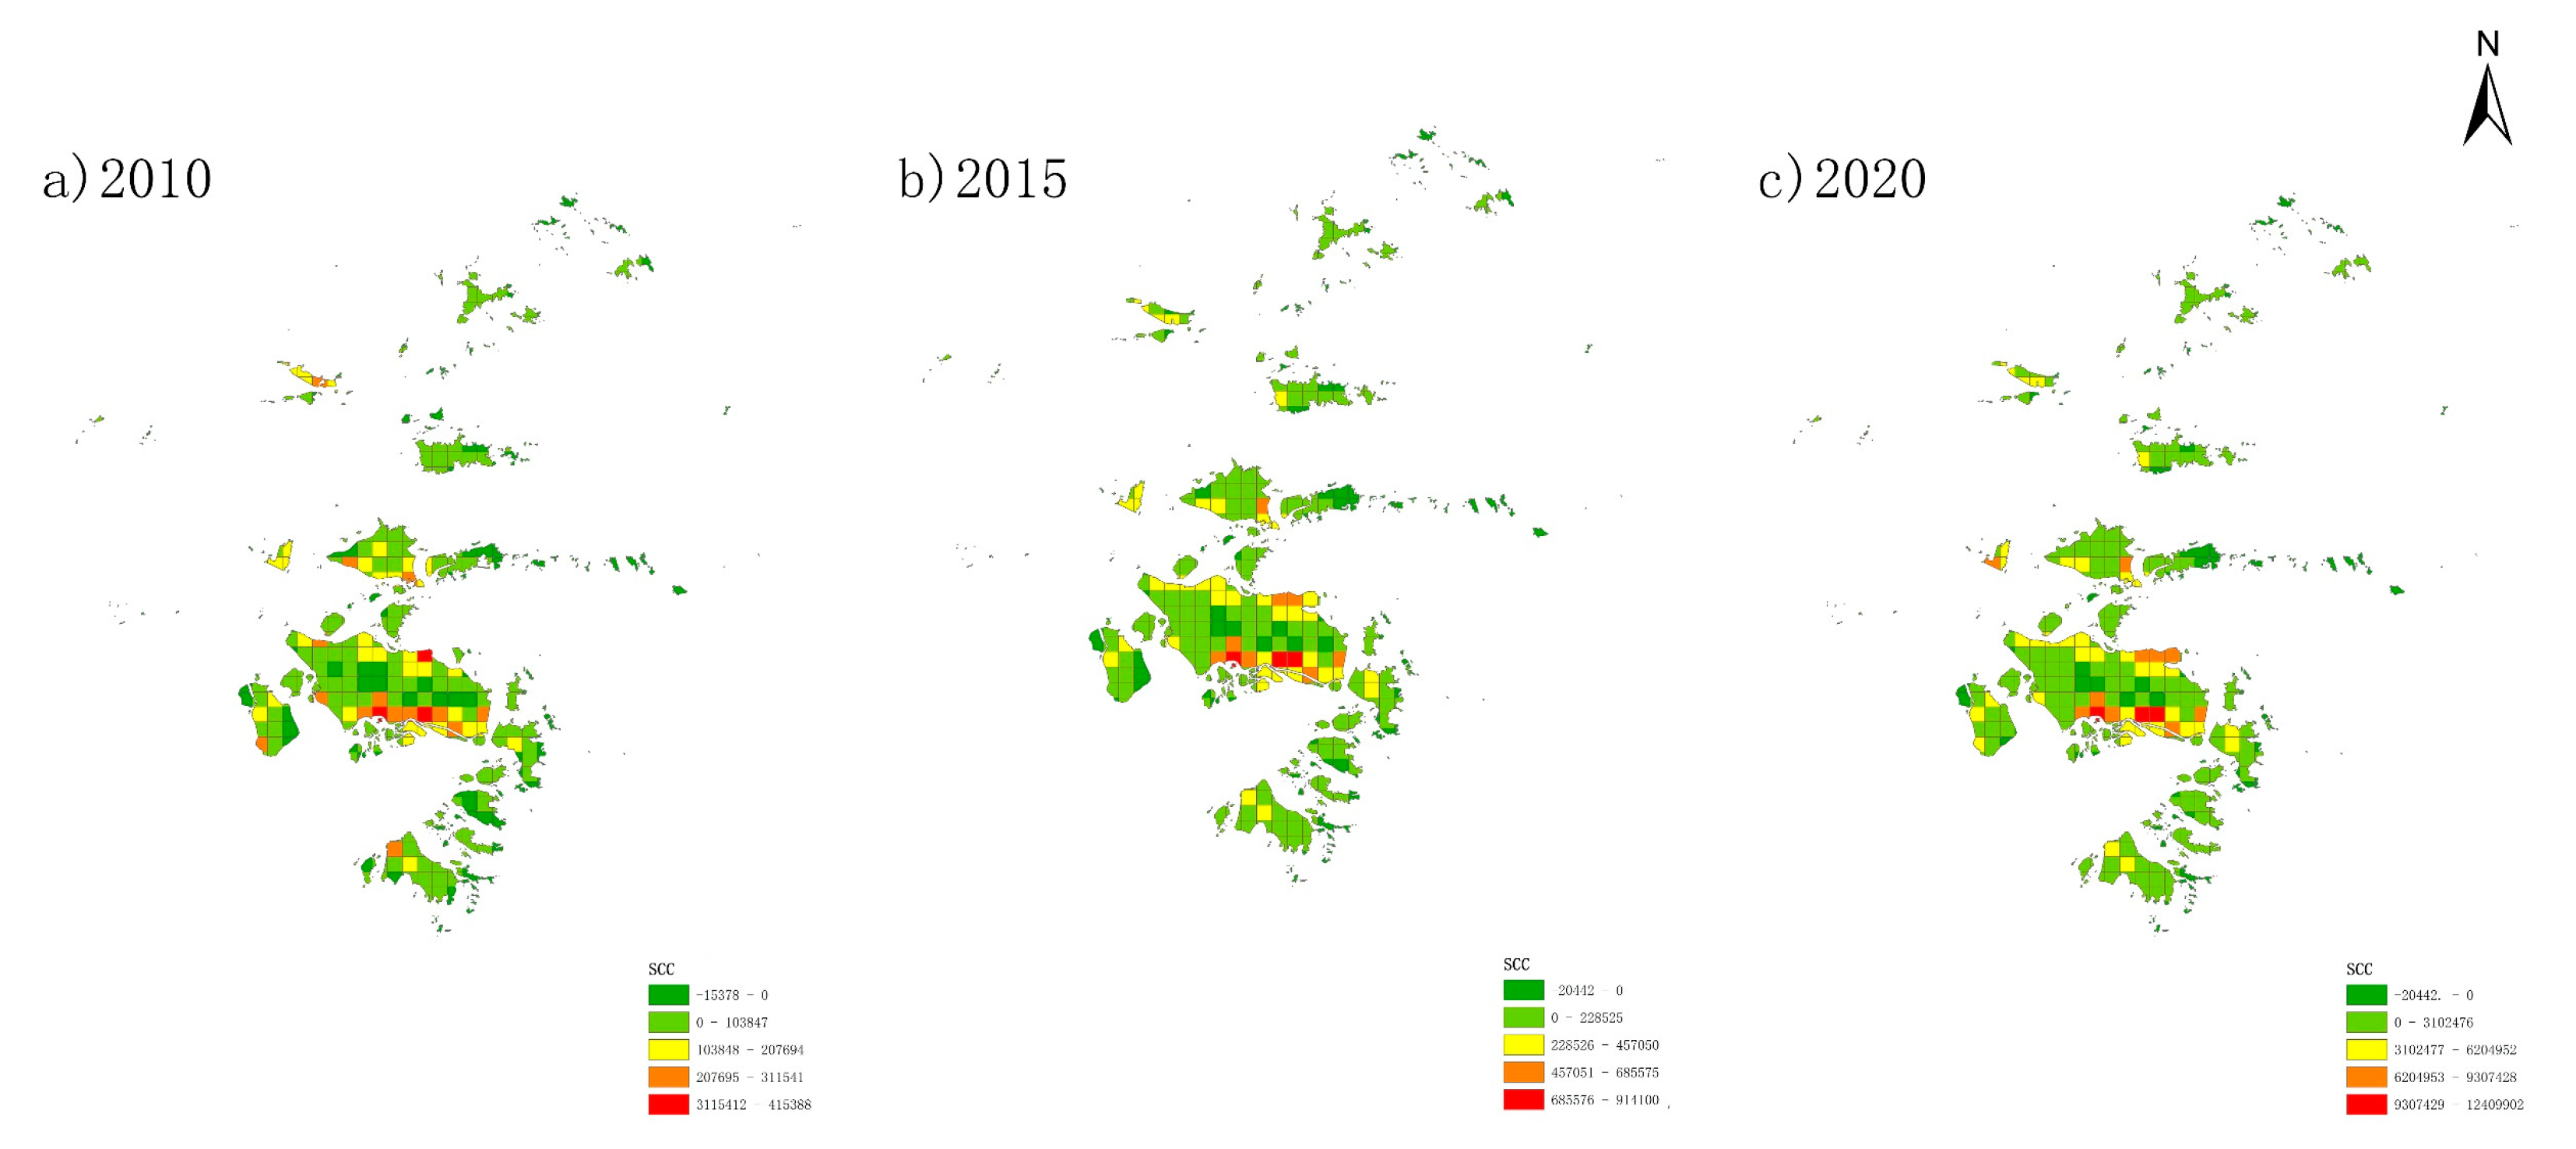
By utilizing the area of each land-use type and carbon emission coefficients specific to the Zhoushan Archipelago, we calculated carbon emissions for each land type during the period 2010–2020 using formulas (1) and (2), as detailed in Table 4. Subsequently, in accordance with Equation (3), carbon emissions were used to determine the SCC. The SCC values were categorized into five levels, representing a spectrum from low to high, and the results showcasing its spatial and temporal variations are illustrated in Figure 2.
The findings on carbon emissions reveal a consistent upward trajectory in net carbon emissions throughout Zhoushan Archipelago from 2010 to 2020, indicating an overall increase. The period spanning 2010 to 2015 experienced a substantial surge in net carbon emissions, escalating from 53.21 × 10⁴ t to 1604.01 × 104 t by 2020. The growth rate moderated between 2015 and 2020. Carbon sources exhibited a parallel trend to net carbon emissions, accompanied by a slight decline in carbon sinks. Examining the composition of carbon sources, emissions from construction land surged from 1,057.91×104 t to 4,125.12 × 104 t, emerging as the primary carbon source. This surge was primarily attributed to the rapid urbanization and industrialization of Zhoushan Archipelago post-2010, leading to a substantial increase in emissions from construction land. Per capita carbon emissions from construction land, indicative of carbon emission intensity and regional energy consumption structure, witnessed a pronounced upswing since 2015. Per capita carbon emissions from construction land for the respective years were 22.21, 40.79, and 546.13 t/ha. Examining the composition of carbon sinks, forests emerged as the predominant carbon sink, closely followed by mudflats. The distribution across different land categories remained relatively stable.
Figure 3 illustrates significant spatiotemporal variations in the carbon emission intensity of land use in the urban cluster from 2010 to 2015. The lowest intensity manifests as a carbon sink, primarily situated in the central area of Zhoushan Island, the coastal fringe of larger islands, and some isolated small islands distanced from the mainland. Conversely, all other levels manifest as carbon sources. Regions with higher social cost intensity of carbon emissions are concentrated in Zhoushan Island, Daishan Island, Liuhang Island, and Jintang Township – regions characterized by substantial land areas and concentrated populations. Yuoshan Island, situated to the left of Daishan Island, exemplifies a typical industrial island, witnessing a steady increase in carbon emissions over the study period. Peripheral scattered islands, distant from the mainland, exhibit low carbon emissions, attributed to their smaller size, challenging development prospects, and sparse human activities.

3.3. Spatiotemporal Evolution of Ecosystem Service Value

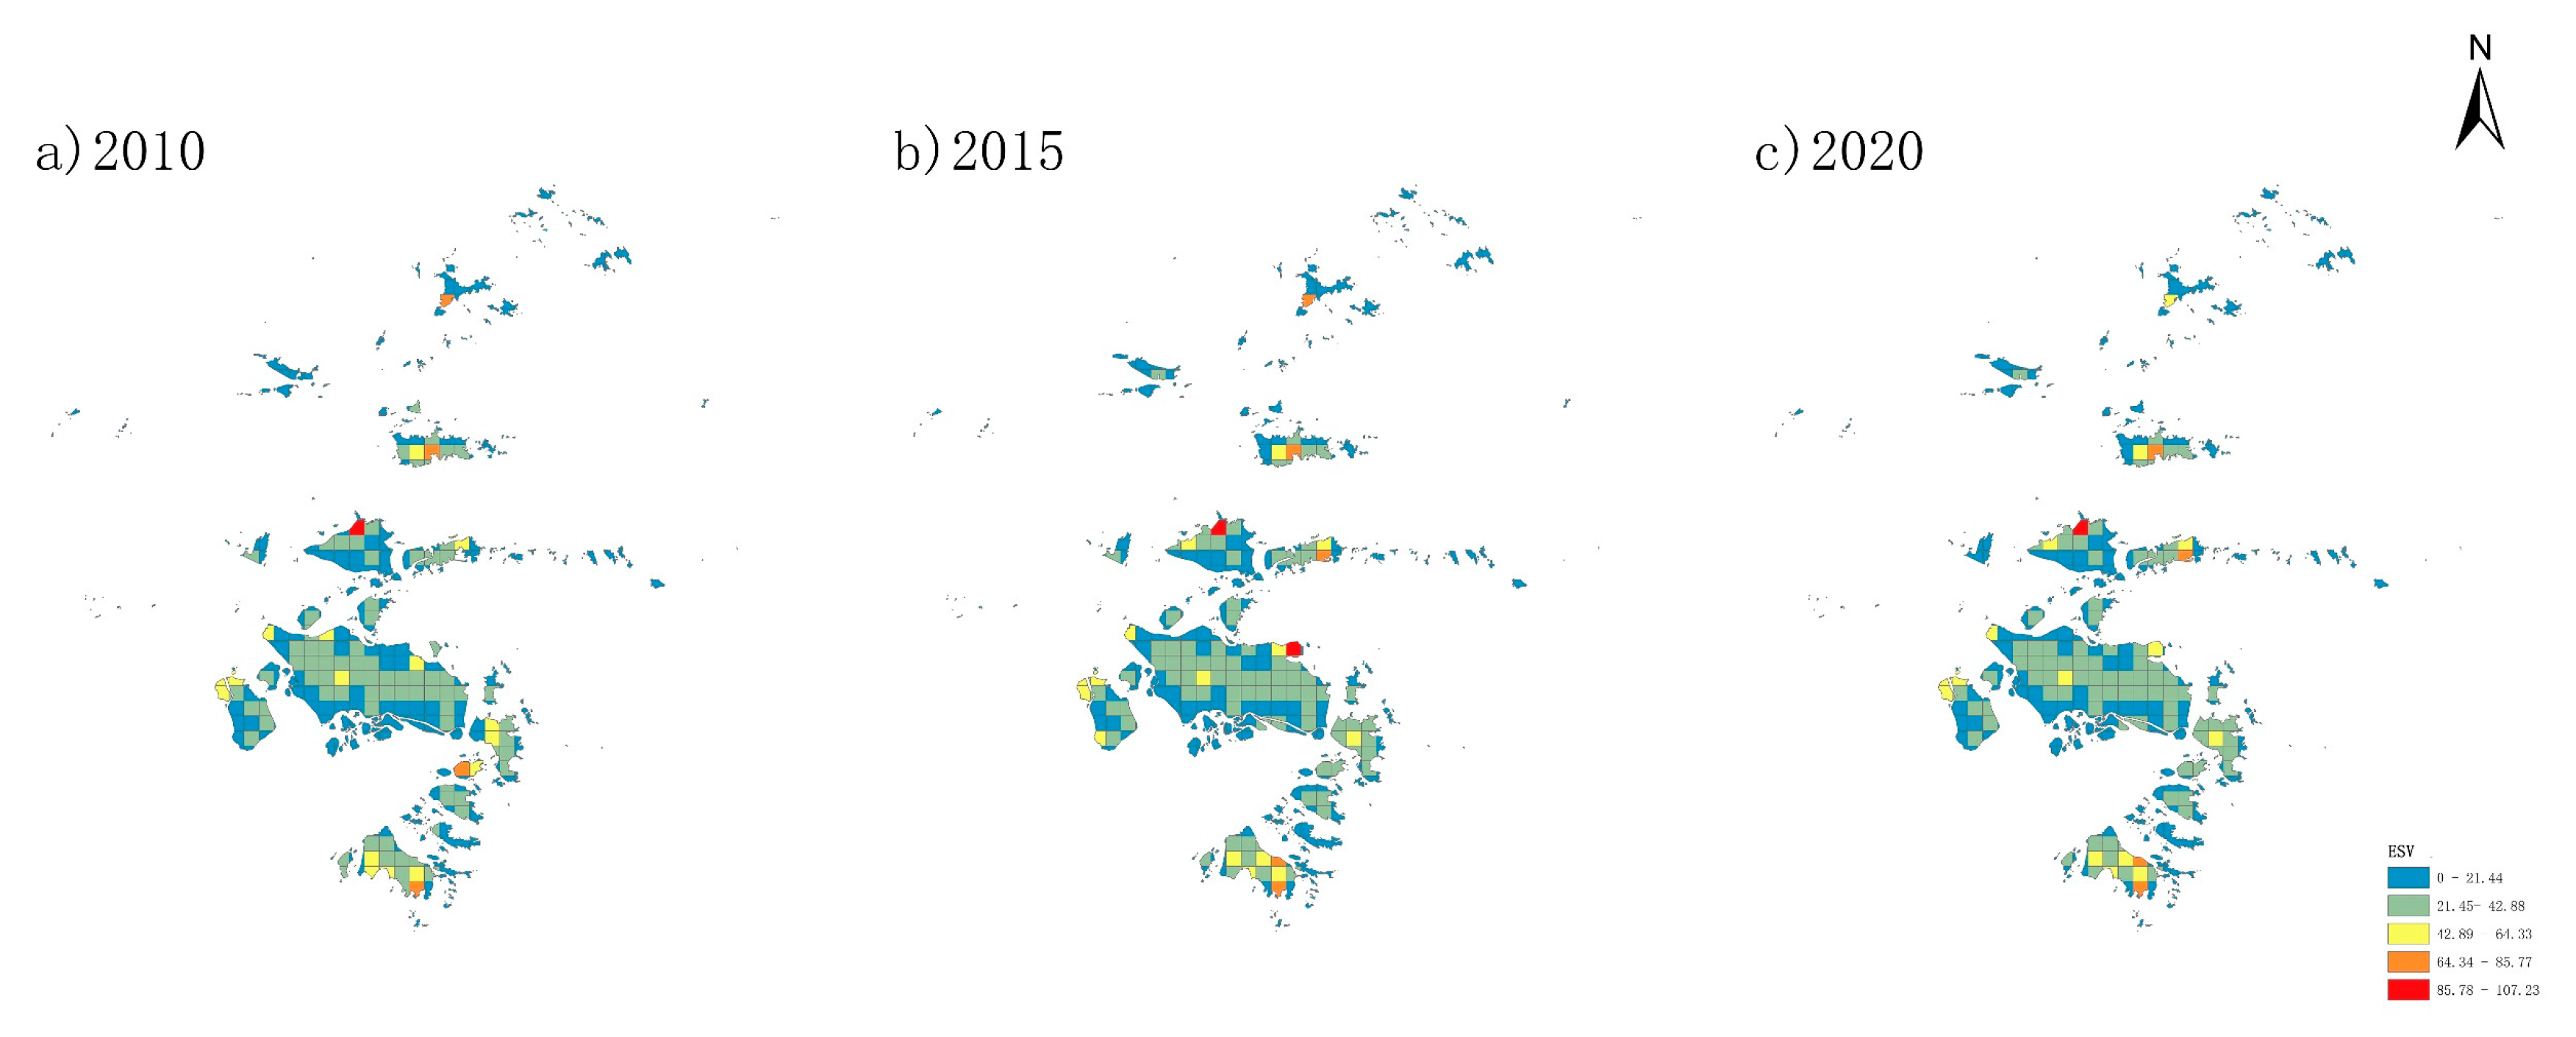
Employing Formula (9), we computed the spatiotemporal changes in ESV across Zhoushan Archipelago from 2010 to 2020, considering the area of each land type and its corresponding ESV, as detailed in Table 5. The temporal shifts in ESV, categorized by land-use type, are outlined in Table 6. ESV intensity changes were stratified into five levels, and the outcomes are depicted in Figure 3.
The findings indicate a dynamic trend in the total ESV within Zhoushan Archipelago from 2010 to 2020, characterized by an initial ascent followed by a subsequent decline. Overall, a diminishing trend is observed, with a decrease from 5565.04 million yuan in 2010 to 5484.88 million yuan in 2020, representing a 1.5% reduction. In terms of individual ESV functionalities, hydrological regulation and climate regulation emerged as principal contributors, jointly constituting 57% of the total. Climate regulation experienced an increase, while hydrological regulation witnessed a decrease, with other functions remaining relatively stable. Analyzing different land-use types, woodland and watershed proved to be the primary contributors to ESV, collectively accounting for 83% of the total, closely followed by mudflat. Grassland exhibited an increase, watershed experienced a decrease, and other types fluctuated within a 1% range.
Figure 4 illustrates slight spatial and temporal variations in ESV intensity across Zhoushan Archipelago during the study period, predominantly reflecting an overall decreasing trend. Regions with low ESV values are primarily distributed in coastal areas near large islands, which coincide with aggregations of built-up areas. Conversely, regions with high ESV values are concentrated in areas abundant with forest, water, and mudflat expanses, aligning with the distribution of different land-use types and their respective ESV contribution rates.

3.4. Spatial Correlation Analysis between ESV and SCC

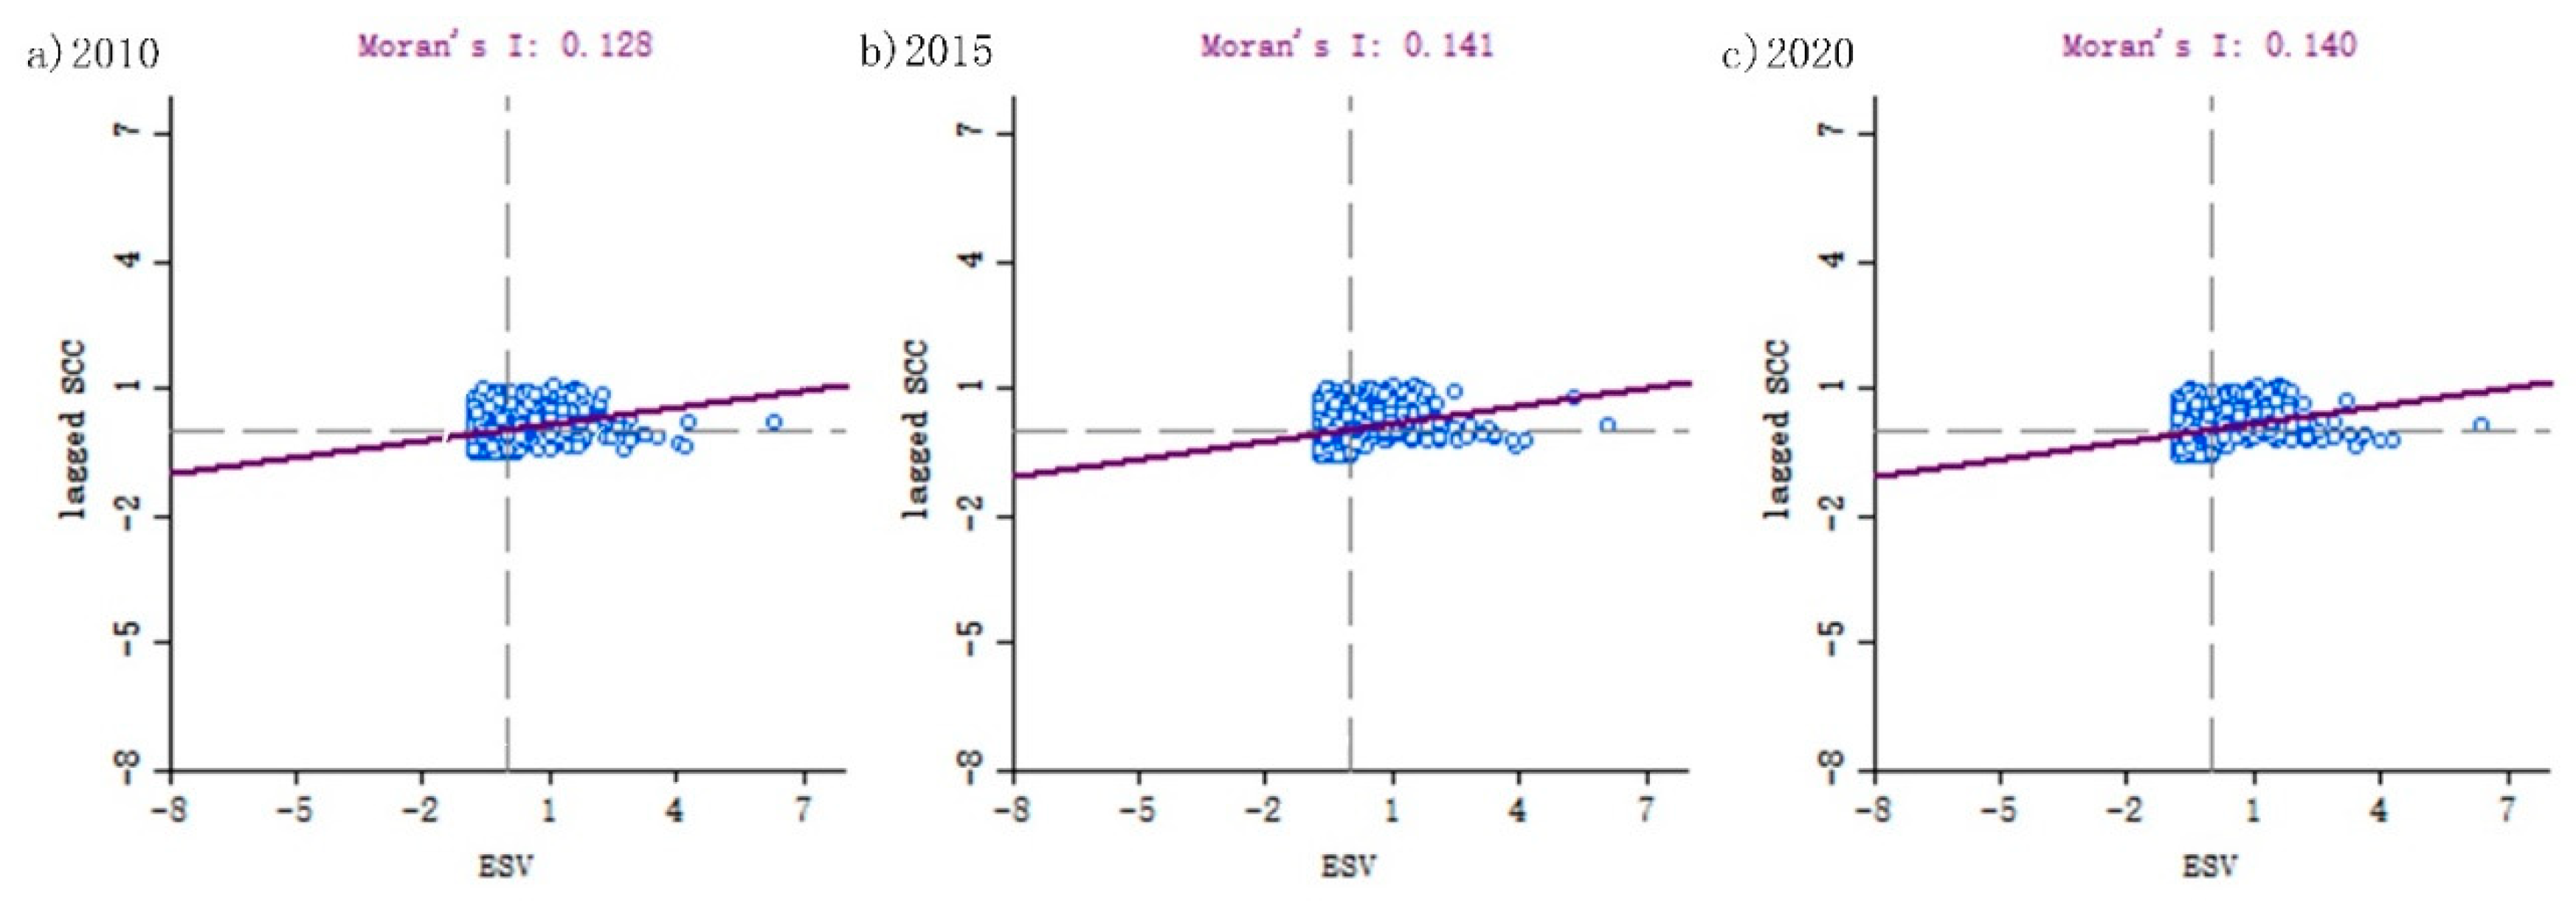
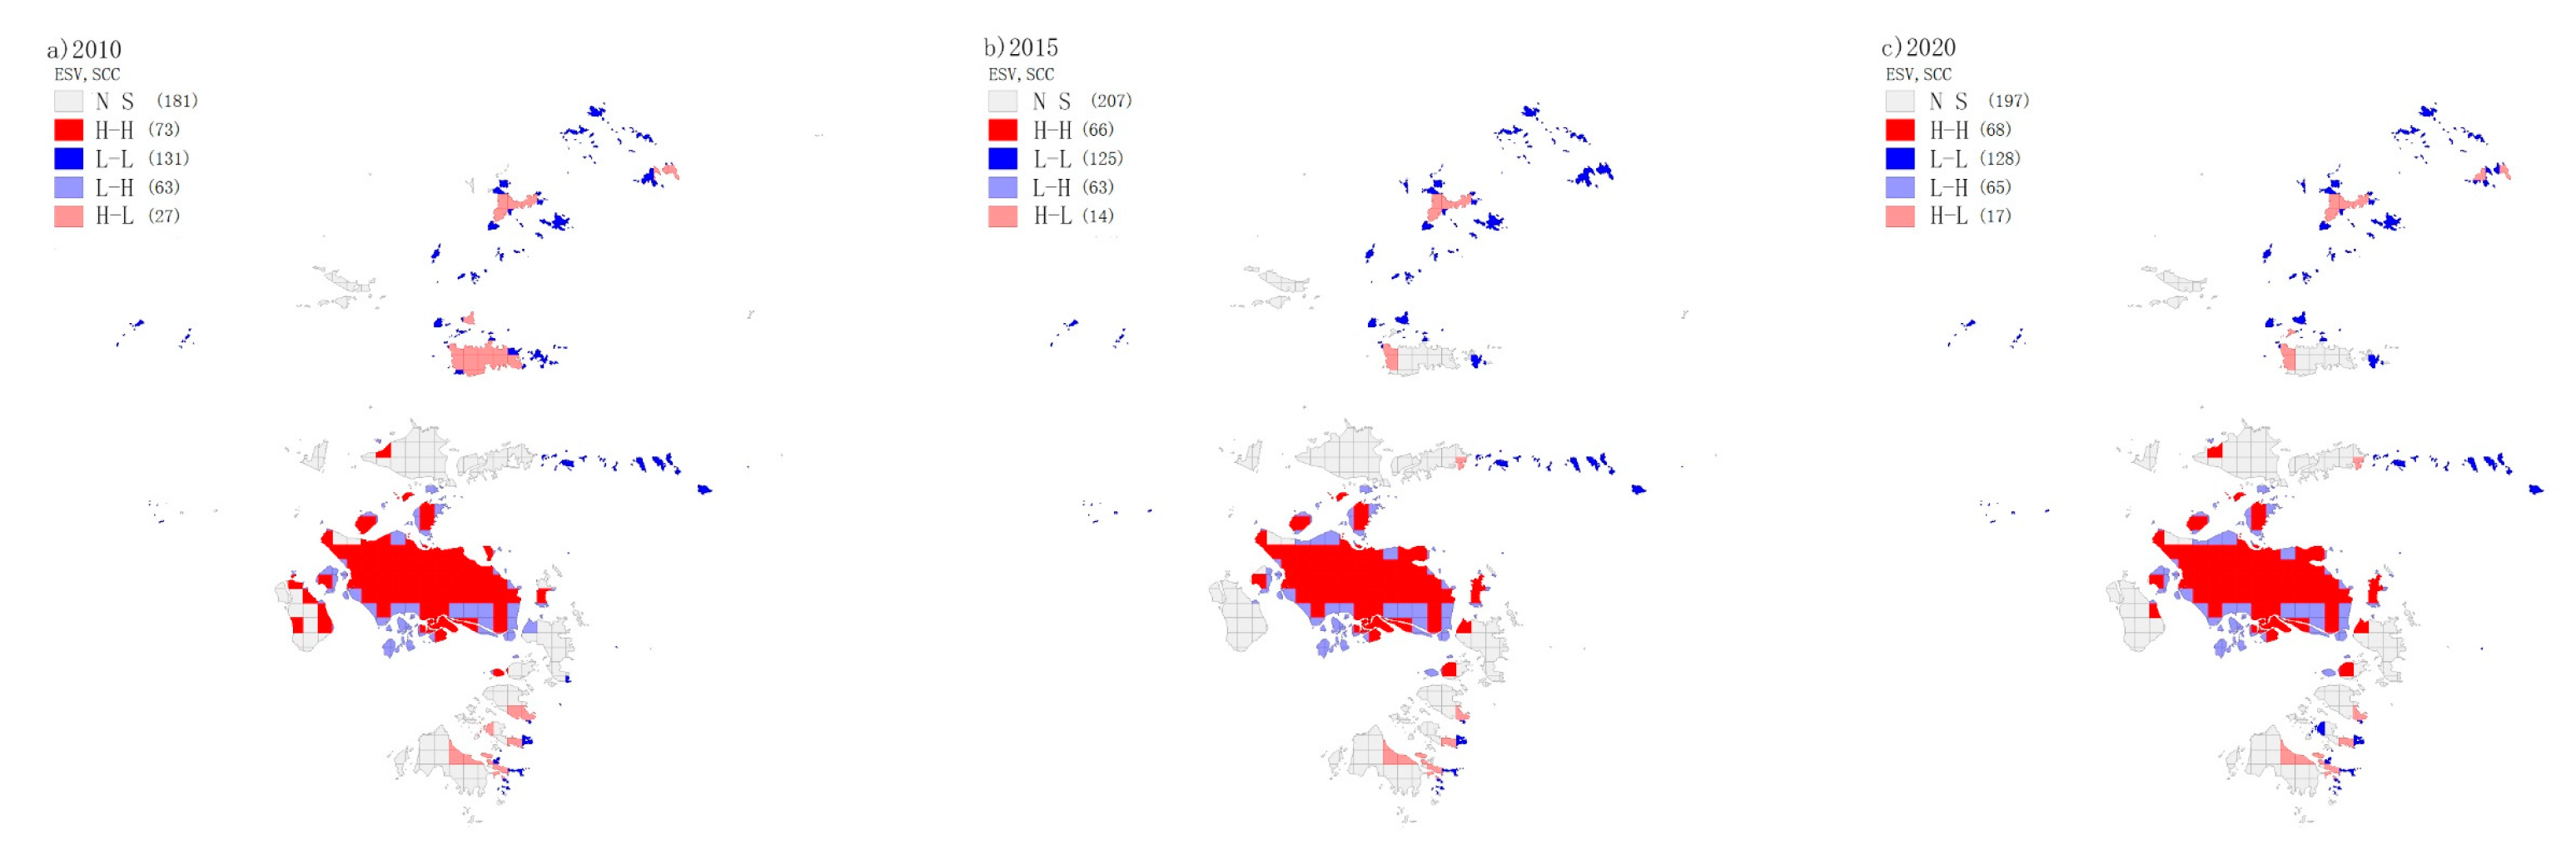
Utilizing Geoda software, a bivariate global Moran's I index analysis was executed for both the ESV and SCC of carbon emissions in Zhoushan Archipelago from 2010 to 2020. The analysis comprised 999 randomizations for testing, and the results are detailed in Table 7. The Moran scatterplot, presented in Figure 4, delineates each quadrant as High-High (H-H), Low-High (L-H), Low-Low (L-L), and High-Low (H-L) clustering types. Additionally, bivariate local Moran's I analysis was employed to scrutinize the spatial clustering relationship within individual grid cells for ESV intensity and social cost intensity of carbon emissions, as depicted in Figure 5.
The results reveal correlation coefficients between ESV and SCC in Zhoushan Archipelago from 2010 to 2020 of 0.142, 0.136, and 0.134, respectively. The positive Moran's I value, with p-values < 0.01 and z-values > 2.58, indicates a statistically significant spatial correlation between ESV and SCC at a 99% confidence level. Surprisingly, regions with high ESV tend to exhibit high SCC, which contradicts conventional expectations where high ESV correlates with low SCC. To better understand this result, a bivariate local analysis was conducted, as depicted in Figure 5. The analysis reveals clustering in the first and third quadrants, indicating that H-H and L-L types are spatially clustered, while L-H and H-L types are dispersed.
Figure 6 illustrates minimal changes in clustering types in Zhoushan Archipelago over time. During the study period, the number of grids in H-L and L-H increased, while H-H and L-L grids decreased. H-H and L-L regions exhibit a positive correlation between ESV and SCC, while L-H and H-L regions display a negative correlation. The proportion of networks with a positive correlation is 24% higher than those with a negative correlation. H-H is predominantly concentrated in economically active regions with significant carbon emissions, such as Zhoushan Island, Putuoshan Island, and Daishan Island. These areas prioritize environmental protection, resulting in higher ESV. Islands like Shengsi Archipelago and Dongji Archipelago, characterized by their distance from the mainland, limited human activities, and lower carbon emissions, exhibit L-L characteristics. Meanwhile, L-H is distributed in areas where construction land is accumulating on Zhoushan Island, reflecting the impact of urbanization on ecological resources and resulting in lower ESV and higher carbon emissions. H-L is mainly found on Qushan Island, some islands in Shengsi County, and certain islands in the eastern part of Putuo District. Local correlations in other regions are not statistically significant (NS).

4. Discussion

The analysis of land use changes reveals that, during the study period, alterations in the total land area were primarily propelled by reclamation and the development of the Wadden Sea. The growth of land resources on the islands remained limited overall, with construction land steadily increasing while other land types, like farmland, experienced proportional decreases. The development of cross-sea bridges in Zhoushan after 2010 significantly accelerated island development, contributing to rapid economic growth, urbanization, and industrialization. These factors led to heightened human activities on built-up areas, resulting in increased carbon emissions. From 2010 to 2020, Zhoushan's net carbon emissions rose by 1550.8 × 104 t, and the SCC surged by 2452%. Despite this, the total ESV of Zhoushan Archipelago exhibited a slight downward trend during the study period, with a marginal change of 1.5%. This trend is attributed to the high ESV of land types such as forests and water bodies, which possess robust ecological compensation capabilities. The importance of mudflats, a characteristic land type of islands, should not be overlooked. Therefore, future development strategies should prioritize the protection of forests, water bodies, and mudflats to enhance regional ESV and foster high-quality development.
This study was motivated by two main considerations. Firstly, previous research has often treated carbon emissions and ecosystem service values as separate evaluation units for assessing environmental benefits, with limited exploration of their correlation[28,29,31,59]. Secondly, scholarly attention has predominantly focused on the provincial level or higher administrative divisions, with coastal and island areas receiving less consideration[60]. A study by Wang [30] on the urban agglomeration of the Central Plains identified a significant negative spatial correlation between carbon emissions and ESV, passing the p-value test. In contrast, our study focuses on island cities, examining two distinct indicators—ESV and SCC—to assess environmental benefits. It concludes that there exists a robust positive spatial correlation at the 99% confidence level between Zhoushan Archipelago's ESV and SCC, contradicting previous research. Examining the rationales behind the observed variations, several factors contribute to the disparities. Firstly, a noteworthy observation is that the quantity of grid cells exhibiting a positive correlation between ESV and SCC – denoting the percentage of regions manifesting a positive correlation – surpasses those demonstrating a negative correlation. Secondly, the emphasis placed by the government on conserving areas of high ESV, such as forests, waters, and mudflats, is accentuated by the intrinsic scarcity of freshwater resources and ecological vulnerability of the islands. Thirdly, the islands exhibit a significantly lower population density compared to inland cities. Coupled with limited land resources, this restricts the potential for unrestrained expansion of construction land. Consequently, the proportion of construction land is dwarfed by that of forested and other natural areas. Fourthly, the archipelagic nature of the region introduces a unique spatial configuration characterized by scattered land masses, low adjacency between grid cells, and considerable distances between them. This spatial arrangement exerts a discernible impact on the outcomes, leading to statistically insignificant correlations in numerous instances. Notably, the archipelago's dispersed land distribution contributes to the presence of only a limited number of regions where ESV and SCC exhibit a negative correlation, coinciding with areas earmarked for construction land.
Despite providing valuable insights into the spatial distribution characteristics of social costs related to land carbon emissions and ecosystem service values during rapid urbanization, this study has potential limitations that necessitate further refinement. Firstly, the definition of farmland as a carbon source could be re-evaluated, considering that it might also act as a carbon sink.[61]. Additionally, carbon emissions from construction land in Zhoushan Archipelago were based on output values of secondary and tertiary industries due to data availability issues, potentially leading to inaccuracies in carbon accounting. Hence, future studies should determine carbon emission coefficients more scientifically based on the actual situation of the region.

5. Conclusions

Land Use Change Analysis: From 2010 to 2015, the land area of Zhoushan Archipelago experienced an expansion primarily driven by tidal flat reclamation and land reclamation activities, with construction land exhibiting the most substantial growth among all land types. However, stringent policies governing land reclamation, coupled with limited island land resources, curtailed the unrestrained expansion of construction land. Post-2015, the total island area began to stabilize.
Spatial and Temporal Evolution of Carbon Emissions and Their Social Costs: Over the study period, Zhoushan Archipelago exhibited a discernible trend in carbon emissions. Forests emerged as the primary carbon sink, succeeded by mudflats and waterbodies. Conversely, construction land stood out as the principal contributor to carbon emissions. The period of accelerated industrialization between 2010 and 2015 fostered rapid growth in secondary and tertiary industries, resulting in a substantial increase in carbon emissions. Throughout the study, the SCC in Zhoushan Archipelago experienced an extraordinary surge, rising by 2452%.
Spatial and Temporal Evolution of ESV: The analysis of the temporal and spatial evolution of ESV during the study period revealed an overall decline, attributed to the expansion of construction land. This change, however, was marginal, with a mere 1.5% decrease. Global spatial correlation analysis of ESV and SCC unveiled a noteworthy positive spatial correlation between ESV and the social cost of carbon emissions in Zhoushan Archipelago from 2010 to 2020. The Moran's I passed the p-value test. The examination of local spatial correlation between ESV and SCC indicated that the contribution rate of areas exhibiting a positive correlation was 24% higher than areas displaying a negative correlation. Notably, land with carbon sinks, such as forests, demonstrated high retention levels and accounted for a greater proportion of land use compared to areas acting as carbon sources, such as construction land. The global spatial correlation of ESV and SCC in the island region displayed distinct characteristics.
References

  1. Seddon, N.; Chausson, A.; Berry, P.; Girardin, C.A.J.; Smith, A.; Turner, B. Understanding the Value and Limits of Nature-Based Solutions to Climate Change and Other Global Challenges. Philos. Trans. R. Soc. B: Biol. Sci. 2020, 375, 20190120. [Google Scholar] [CrossRef] [PubMed]
  2. Shi, X.; Zhang, J.; Lu, S.; Wang, T.; Zhang, X. China Carbon Neutralization Research Status and Research Frontier Tracking. Front. Environ. Sci. 2022, 10, 896524. [Google Scholar] [CrossRef]
  3. Liu, M.; Chen, Y.; Chen, K.; Chen, Y. Progress and Hotspots of Research on Land-Use Carbon Emissions: A Global Perspective. Sustainability 2023, 15, 7245. [Google Scholar] [CrossRef]
  4. Special Report on Climate Change and Land — IPCC Site. Available online: https://www.ipcc.ch/srccl/ (accessed on 8 December 2023).
  5. Canelas, J.V.; Pereira, H.M. Impacts of Land-Use Intensity on Ecosystems Stability. Ecol. Model. 2022, 472, 110093. [Google Scholar] [CrossRef]
  6. Hasan, S.S.; Zhen, L.; Miah, Md.G.; Ahamed, T.; Samie, A. Impact of Land Use Change on Ecosystem Services: A Review. Environ. Dev. 2020, 34, 100527. [Google Scholar] [CrossRef]
  7. Rahman, M.M.; Szabó, G. A Novel Composite Index to Measure Environmental Benefits in Urban Land Use Optimization Problems. ISPRS Int. J. Geo-Inf. 2022, 11, 220. [Google Scholar] [CrossRef]
  8. Alpino, M.; Citino, L.; Zeni, F. Costs and Benefits of the Green Transitionenvisaged in the Italian NRRP - An Evaluation Using the Social Cost of Carbon. Energy Policy 2023, 182, 113744. [Google Scholar] [CrossRef]
  9. Accounting for Ecosystem Service Values in Climate Policy|Nature Climate Change. Available online: https://www.nature.com/articles/s41558-022-01362-0 (accessed on 8 December 2023).
  10. Jeffers, E.S.; Nogué, S.; Willis, K.J. The Role of Palaeoecological Records in Assessing Ecosystem Services. Quat. Sci. Rev. 2015, 112, 17–32. [Google Scholar] [CrossRef]
  11. Reid, W.; Mooney, H.; Cropper, A.; Capistrano, D.; Carpenter, S.; Chopra, K. Millennium Ecosystem Assessment. Ecosystems and Human Well-Being: Synthesis; 2005.
  12. Costanza, R. Valuing Natural Capital and Ecosystem Services toward the Goals of Efficiency, Fairness, and Sustainability. Ecosyst. Serv. 2020, 43, 101096. [Google Scholar] [CrossRef]
  13. Li L; Wang XY; Luo L; Ji XY; Zhao Y; Zhao YC; Nabil Bachagha A review of ecosystem service valuation methods. J. Ecol. 2018, 37, 1233–1245. [CrossRef]
  14. Xie, Gao Di; Zhang, Caixia; Zhang, Changshun; Xiao, Yu; Lu, Chunxia The value of ecosystem services in China. Resour. Sci. 2015, 37, 1740–1746.
  15. The Value of the World’s Ecosystem Services and Natural Capita. [CrossRef]
  16. Xie, Gao Di; Zhen, Lin; Lu, Chunxia; Xiao, Yu; Chen, Cao An expert knowledge-based approach to ecosystem service valorisation. J. Nat. Resour. 2008, 23, 911–919.
  17. Liu, L.; Zhang, H.; Zhang, Y.; Li, F.; Chen, X.; Wang, Y.; Wang, Y. Spatiotemporal Heterogeneity Correction in Land Ecosystem Services and Its Value Assessment: A Case Study of the Loess Plateau of China; In Review, 2022. [CrossRef]
  18. Chuai, X.; Huang, X.; Wang, W.; Zhao, R.; Zhang, M.; Wu, C. Land Use, Total Carbon Emissions Change and Low Carbon Land Management in Coastal Jiangsu, China. J. Clean. Prod. 2015, 103, 77–86. [Google Scholar] [CrossRef]
  19. Houghton, R.A. Interactions Between Land-Use Change and Climate-Carbon Cycle Feedbacks. Curr Clim Change Rep 2018, 4, 115–127. [Google Scholar] [CrossRef]
  20. Cai, C.; Fan, M.; Yao, J.; Zhou, L.; Wang, Y.; Liang, X.; Liu, Z.; Chen, S. Spatial-Temporal Characteristics of Carbon Emissions Corrected by Socio-Economic Driving Factors under Land Use Changes in Sichuan Province, Southwestern China. Ecol. Inform. 2023, 77, 102164. [Google Scholar] [CrossRef]
  21. Zhang, F.; Xu, N.; Wang, C.; Wu, F.; Chu, X. Effects of Land Use and Land Cover Change on Carbon Sequestration and Adaptive Management in Shanghai, China. Phys. Chem. Earth Parts A/B/C 2020, 120, 102948. [Google Scholar] [CrossRef]
  22. Xia, C.; Zhang, J.; Zhao, J.; Xue, F.; Li, Q.; Fang, K.; Shao, Z.; Zhang, J.; Li, S.; Zhou, J. Exploring Potential of Urban Land-Use Management on Carbon Emissions—— A Case of Hangzhou, China. Ecol. Indic. 2023, 146, 109902. [Google Scholar] [CrossRef]
  23. Wu, H.; Qiu, Y.; Yin, L.; Liu, S.; Zhao, D.; Zhang, M. Effects of China’s Land-Intensive Use on Carbon Emission Reduction: A New Perspective of Industrial Structure Upgrading. Front. Environ. Sci. 2022, 10, 1073565. [Google Scholar] [CrossRef]
  24. Tian, L.; Ye, Q.; Zhen, Z. A New Assessment Model of Social Cost of Carbon and Its Situation Analysis in China. J. Clean. Prod. 2019, 211, 1434–1443. [Google Scholar] [CrossRef]
  25. Zhang, G.; Zheng, D.; Xie, L.; Zhang, X.; Wu, H.; Li, S. Mapping Changes in the Value of Ecosystem Services in the Yangtze River Middle Reaches Megalopolis, China. Ecosyst. Serv. 2021, 48, 101252. [Google Scholar] [CrossRef]
  26. Bao, J.; Wang, W.; Zhao, T. Spatiotemporal Changes of Ecosystem Service Values in Response to Land Cover Dynamics in China from 1992 to 2020. Sustainability 2023, 15. [Google Scholar] [CrossRef]
  27. Saha, S.; Bera, B.; Shit, P.K.; Bhattacharjee, S.; Sengupta, N. Estimation of Carbon Budget through Carbon Emission-Sequestration and Valuation of Ecosystem Services in the Extended Part of Chota Nagpur Plateau (India). J. Clean. Prod. 2022, 380, 135054. [Google Scholar] [CrossRef]
  28. Effects of Land Use Cover Change on Carbon Emissions and Ecosystem Services in Chengyu Urban Agglomeration, China|Stochastic Environmental Research and Risk Assessment. Available online: https://link.springer.com/article/10.1007/s00477-020-01819-8 (accessed on 2 December 2023).
  29. Tang, F.; Yin, Y. L.; Zhang, P. T.; Bai, N. Study on the value of ecosystem services and carbon emission risk in Gaoyang County based on land use change. Soil Water Conserv. Res. 2019, 26, 265–271. [Google Scholar] [CrossRef]
  30. Wang Boyang, B. Spatial relationship between land use carbon emissions and ecosystem service value. China Water Transport (2nd half) 2021, 21, 77–78. [Google Scholar]
  31. Du, X.; Huang, Z. Ecological and Environmental Effects of Land Use Change in Rapid Urbanization: The Case of Hangzhou, China. Ecol. Indic. 2017, 81, 243–251. [Google Scholar] [CrossRef]
  32. Yang, S.; Zheng, X. Spatio-Temporal Relationship between Carbon Emission and Ecosystem Service Value under Land Use Change: A Case Study of the Guanzhong Plain Urban Agglomeration, China. Front. Environ. Sci. 2023, 11, 1241781. [Google Scholar] [CrossRef]
  33. van den Bergh, J.C.J.M.; Botzen, W.J.W. Monetary Valuation of the Social Cost of CO2 Emissions: A Critical Survey. Ecol. Econ. 2015, 114, 33–46. [Google Scholar] [CrossRef]
  34. Comprehensive Evidence Implies a Higher Social Cost of CO2 | Nature. Available online: https://www.nature.com/articles/s41586-022-05224-9 (accessed on 8 December 2023).
  35. Rickels, W.; Meier, F.; Quaas, M. The Historical Social Cost of Fossil and Industrial CO2 Emissions. Nat. Clim. Chang. 2023, 13, 742–747. [Google Scholar] [CrossRef]
  36. Muenzel, D.; Martino, S. Assessing the Feasibility of Carbon Payments and Payments for Ecosystem Services to Reduce Livestock Grazing Pressure on Saltmarshes. J. Environ. Manag. 2018, 225, 46–61. [Google Scholar] [CrossRef]
  37. Li L; Ma YC A review and outlook of ecological vulnerability studies on sea islands. Ocean. Dev. Manag. 2018, 35, 60–67.
  38. Wang, Xiaoli; Wang Ooi; Shi, Honghua; Zheng, Wei; Zhou, R. A method for estimating carbon sequestration in island terrestrial ecosystems. J. Ecol. 2014, 34, 88–96.
  39. Doorga, J.R.S.; Deenapanray, P.N.K.; Rughooputh, S.D.D.V. Geographic Carbon Accounting: The Roadmap for Achieving Net-Zero Emissions in Mauritius Island. J. Environ. Manag. 2023, 333, 117434. [Google Scholar] [CrossRef] [PubMed]
  40. Zhao, Sheng; Li, Mengna; Wu, Changwen Assessing the energetic value of ecosystem services in Zhoushan Sea. J. Ecol. 2015, 35, 678–685.
  41. Xu, C.; Jiang, W.; Huang, Q.; Wang, Y. Ecosystem Services Response to Rural-Urban Transitions in Coastal and Island Cities: A Comparison between Shenzhen and Hong Kong, China. J. Clean. Prod. 2020, 260, 121033. [Google Scholar] [CrossRef]
  42. Zhoushan Statistics Bureau. Available online: http://zstj.zhoushan.gov.cn/ (accessed on 2 December 2023).
  43. Centre for Resource and Environmental Sciences and Data, Chinese Academy of Sciences. Available online: https://www.resdc.cn/ (accessed on 2 December 2023).
  44. Zhejiang Province Geographic Information Public Service Platform. Available online: https://ditu.zjzwfw.gov.cn/ (accessed on 2 December 2023).
  45. Data - National Statistical Office. Available online: https://www.stats.gov.cn/sj/ (accessed on 2 December 2023).
  46. Sun, H.; Liang, H.; Chang, X. L.; Cui, Z.; Tao, Y. Carbon emissions from land use and their spatial correlation in China. Econ. Geogr. 2015, 35, 154–162. [Google Scholar] [CrossRef]
  47. Chen, L.; Hang, Y.; Li, Q. Spatial-Temporal Characteristics and Influencing Factors of Carbon Emissions from Land Use and Land Cover in Black Soil Region of Northeast China Based on LMDI Simulation. Sustainability 2023, 15, 9334. [Google Scholar] [CrossRef]
  48. Fang, Jingyun; Guo, Zhaodi; Park, Shilong; Chen, Anping Estimation of carbon sinks in terrestrial vegetation in China from 1981 to 2000. Science China (Series D: Earth Sciences) 2007, 804-812.
  49. Xu, Ying; Guo, Nan; Ru, Kaili; Fan, Shenglong Characteristics and optimisation strategies of spatial zoning of land in Fujian Province under the perspective of carbon neutrality. J. Appl. Ecol. 2022, 33, 500–508. [CrossRef] [PubMed]
  50. Lai Li Carbon Emission Effects of Land Use in China. PhD, Nanjing University, 2011.
  51. The Carbon Stock and Sequestration Rate in Tidal Flats From Coastal China. Available online: https://agupubs.onlinelibrary.wiley.com/doi/epdf/10.1029/2020GB006772 (accessed on 2 December 2023).
  52. Wang, Guibo; Nan, Ling Analysis of spatial and temporal differences in the carbon emission effects of land use in Shaanxi Province. Resour. Ind. 2012, 14, 124–130. [CrossRef]
  53. Xu, G.Q.; Liu, Z.Y.; Jiang, Z.H. Factor decomposition modelling and empirical analysis of carbon emissions in China: 1995-2004. China Population-Resources and Environment 2006, 158-161.
  54. Construction of a Carbon Price Benchmark in China—Analysis of Eight Pilot Markets | Environmental Science and Pollution Research. Available online: https://link.springer.com/article/10.1007/s11356-021-18137-3 (accessed on 8 December 2023).
  55. Xie, G.; Zhang, C.; Zhen, L.; Zhang, L. Dynamic Changes in the Value of China’s Ecosystem Services. Ecosyst. Serv. 2017, 26, 146–154. [Google Scholar] [CrossRef]
  56. Xu, Li-Fen; Xu, Xue-Gong; Luo, Tao; Zhu, Gao-Ru; Ma, Zong-Wen A land use-based method for revising the equivalent value of ecosystem services - A case study of the Bohai Bay coast. Geogr. Res. 2012, 31, 1775–1784.
  57. Xie, Gao Di; Zhang, Caixia; Zhang, Leiming; Chen, Wenhui; Li, Shimei Improvement of ecosystem service valorisation method based on unit area value equivalent factor. J. Nat. Resour. 2015, 30, 1243–1254.
  58. Wang, Dan; Jing, Yande; Han, Shanmei; Gao, Mingxiu A grid-based analysis of spatial and temporal relationships between land use carbon emissions and their ecosystem service values in the Nansihu Basin. J. Ecol. 2022, 42, 9604–9614.
  59. Wang Boyang Research on the spatial and temporal evolution of ecosystem service value and carbon emission based on LUCC. Master, Kunming University of Science and Technology, 2022.
  60. Zhao, Xianchao; Tian, Yidou; Zhang, Xiaoxiang Analysis of spatial and temporal relationship between carbon emissions from land use and ecosystem service value in ChangZhuTan urban agglomeration. J. Soil Water Conserv. 2023, 37, 215–225. [CrossRef]
  61. Ma, T. Assessment of the current status of agricultural carbon sources and analysis of the potential for increasing carbon sinks in Shanghai. Agric. Environ. Dev. 2011, 28, 38–41. [Google Scholar]
Figure 2. Temporal and spatial changes of SCC in Zhoushan Archipelago.
Preprints 93632 g002
Figure 3. Temporal and spatial variation of ESV in Zhoushan Archipelago.
Preprints 93632 g003
Figure 4. Moran scatter plot 2010-2020.
Preprints 93632 g004
Figure 5. Spatial correlation between ESV and SCC.
Preprints 93632 g005
Table 1. Ecosystem service basis equivalent value per unit area.
Ecosystem classification Secondary type Farmland Forest Shrubland Grassland Waterbody Construction land Unused land Mudflat
Provisioning services Food production 0.85 0.31 0.19 0.38 0.8 0 0 0.51
Raw material production 0.4 0.71 0.43 0.56 0.23 0 0 0.5
Water supply 0.02 0.37 0.22 0.31 8.29 0 0 2.59
Regulating services Gas regulation 0.67 2.35 1.41 1.97 0.77 0 0.02 1.9
Climate regulation 0.36 7.03 4.23 5.21 2.29 0 0 3.6
Environmental purification 0.1 1.99 1.28 1.72 5.55 0 0.1 3.6
Hydrological regulation 0.27 3.51 3.35 3.82 102.24 0 0.03 24.23
Supporting services Soil conservation 1.03 2.85 1.72 2.4 0.93 0 0.02 2.31
Nutrient cycling maintenance 0.12 0.22 0.13 0.18 0.07 0 0 0.18
Biodiversity maintenance 0.13 2.6 1.57 2.18 2.55 0 0.02 7.87
Cultural services Providing aesthetic landscape 0.06 1.14 0.69 0.96 1.89 0 0.01 4.73
Table 2. Ecosystem service value coefficient of Zhoushan Archipelago (unit: yuan /ha).
Ecosystem classification Secondary type Farmland Forest Shrubland Grassland Waterbody Construction land Unused land Mudflat
Provisioning services Food production 1924.59 540.47 430.2 860.4 1811.38 0 0 1154.75
Raw material production 905.69 1237.85 973.61 1267.96 520.77 0 0 1132.11
Water supply 45.28 645.08 498.13 701.91 18770.39 0 0 5864.33
Regulating services Gas regulation 1517.03 4097.11 3192.55 4460.51 1743.45 0 45.28 4302.02
Climate regulation 815.12 12256.45 9577.65 11796.59 5185.07 0 0 8151.19
Environmental purification 226.42 3469.47 2898.2 3894.46 12566.42 0 226.42 8151.19
Hydrological regulation 611.34 6119.51 7585.14 8649.32 231493.9 0 67.93 54862.06
Supporting services Soil conservation 2332.15 4968.83 3894.46 5434.13 2105.73 0 45.28 5230.35
Nutrient cycling maintenance 271.71 383.56 294.35 407.56 158.5 0 0 407.56
Biodiversity maintenance 294.35 4532.97 3554.83 4936 5773.76 0 45.28 17819.42
Cultural services Providing aesthetic landscape 135.85 1987.53 1562.31 2173.65 4279.38 0 22.64 10709.76
Table 3. Temporal changes of land type area in Zhoushan Archipelago, 2010-2020 (unit: hectare).
Land use type Year
2010 2015 2020
Farmland 25445.86 25694.56 25609.90
Forest 71758.81 70961.86 70919.01
Shrubland 3660.83 3763.73 3763.66
Grassland 1270.99 2302.81 2302.81
Waterbody 6270.76 6342.48 5904.85
Construction land 25728.66 28599.03 29441.51
Unused land 20.50 20.91 20.91
Mudflat 4077.15 4411.54 4133.77
Total land area 138233.57 142096.94 142096.42
Table 4. Temporal changes of carbon emissions in Zhoushan Archipelago,2010-2020 (unit: t).
Land use type Year
2010 2015 2020
Farmland 10738.15 10843.11 10807.38
Forest -41691.87 -41228.84 -41203.95
Shrubland -589.39 -605.96 -605.95
Grassland -26.69 -48.36 -48.36
Waterbody -1586.50 -1604.65 -1493.93
Construction land 571493.23 1166625.60 16078977.24
Unused land -0.10 -0.10 -0.10
Mudflat -6270.65 -6784.95 -6357.74
Total
Sink 50165.21 50272.87 49710.03
Source 582231.38 1177468.70 16089784.62
Net carbon emission 532066.17 1127195.83 16040074.59
Table 5. Temporal changes of ESV for functional division,2010-2020 (unit: million yuan).
Secondary ecosystem classification Year
2010 2015 2020
Food supply 106.49 107.99 106.69
Raw material 124.93 125.99 125.32
Water supply 191.77 195.35 185.48
Gas regulation 378.44 382.04 379.78
Climate regulation 1016.05 1022.74 1017.62
Purifying environment 382.33 387.56 379.63
Hydrology adjustment 2168.77 2208.70 2091.84
Soil conservation 471.60 476.12 473.34
Nutrient cycling 38.69 39.05 38.83
Biodiversity protection 460.92 469.21 461.51
Cultural & amenity services 225.06 229.80 224.86
Total 5565.04 5644.56 5484.88
Table 6. Temporal Changes of ESV by land use type division,2010-2020 (unit: million yuan).
Land use type Year
2010 2015 2020
Farmland 231.04 233.29 232.53
Forest 2887.49 2855.42 2853.70
Shrubland 126.16 129.70 129.70
Grassland 56.66 102.67 102.67
Waterbody 1783.46 1803.86 1679.39
Construction land 0.00 0.00 0.00
Unused land 0.01 0.01 0.01
Mudflat 480.23 519.61 486.90
Total 5565.04 5644.56 5484.88
Table 7. Bivariate global Moran 'I index of Zhoushan Archipelago from 2010 to 2020.
Year Moran 'I P-value z-value
2010 0.128 0.001 13.3427
2015 0.141 0.001 14.7151
2020 0.14 0.001 14.3616
Disclaimer/Publisher’s Note: The statements, opinions and data contained in all publications are solely those of the individual author(s) and contributor(s) and not of MDPI and/or the editor(s). MDPI and/or the editor(s) disclaim responsibility for any injury to people or property resulting from any ideas, methods, instructions or products referred to in the content.
Copyright: This open access article is published under a Creative Commons CC BY 4.0 license, which permit the free download, distribution, and reuse, provided that the author and preprint are cited in any reuse.
Prerpints.org logo

Preprints.org is a free preprint server supported by MDPI in Basel, Switzerland.

Subscribe

© 2024 MDPI (Basel, Switzerland) unless otherwise stated