Submitted:
02 January 2024
Posted:
03 January 2024
You are already at the latest version
Abstract
Keywords:
1. Introduction
2. Results
2.1. ErMs Predominantly Harbor blaCTX-M with E. coli Leading the Phenotype among NCPE
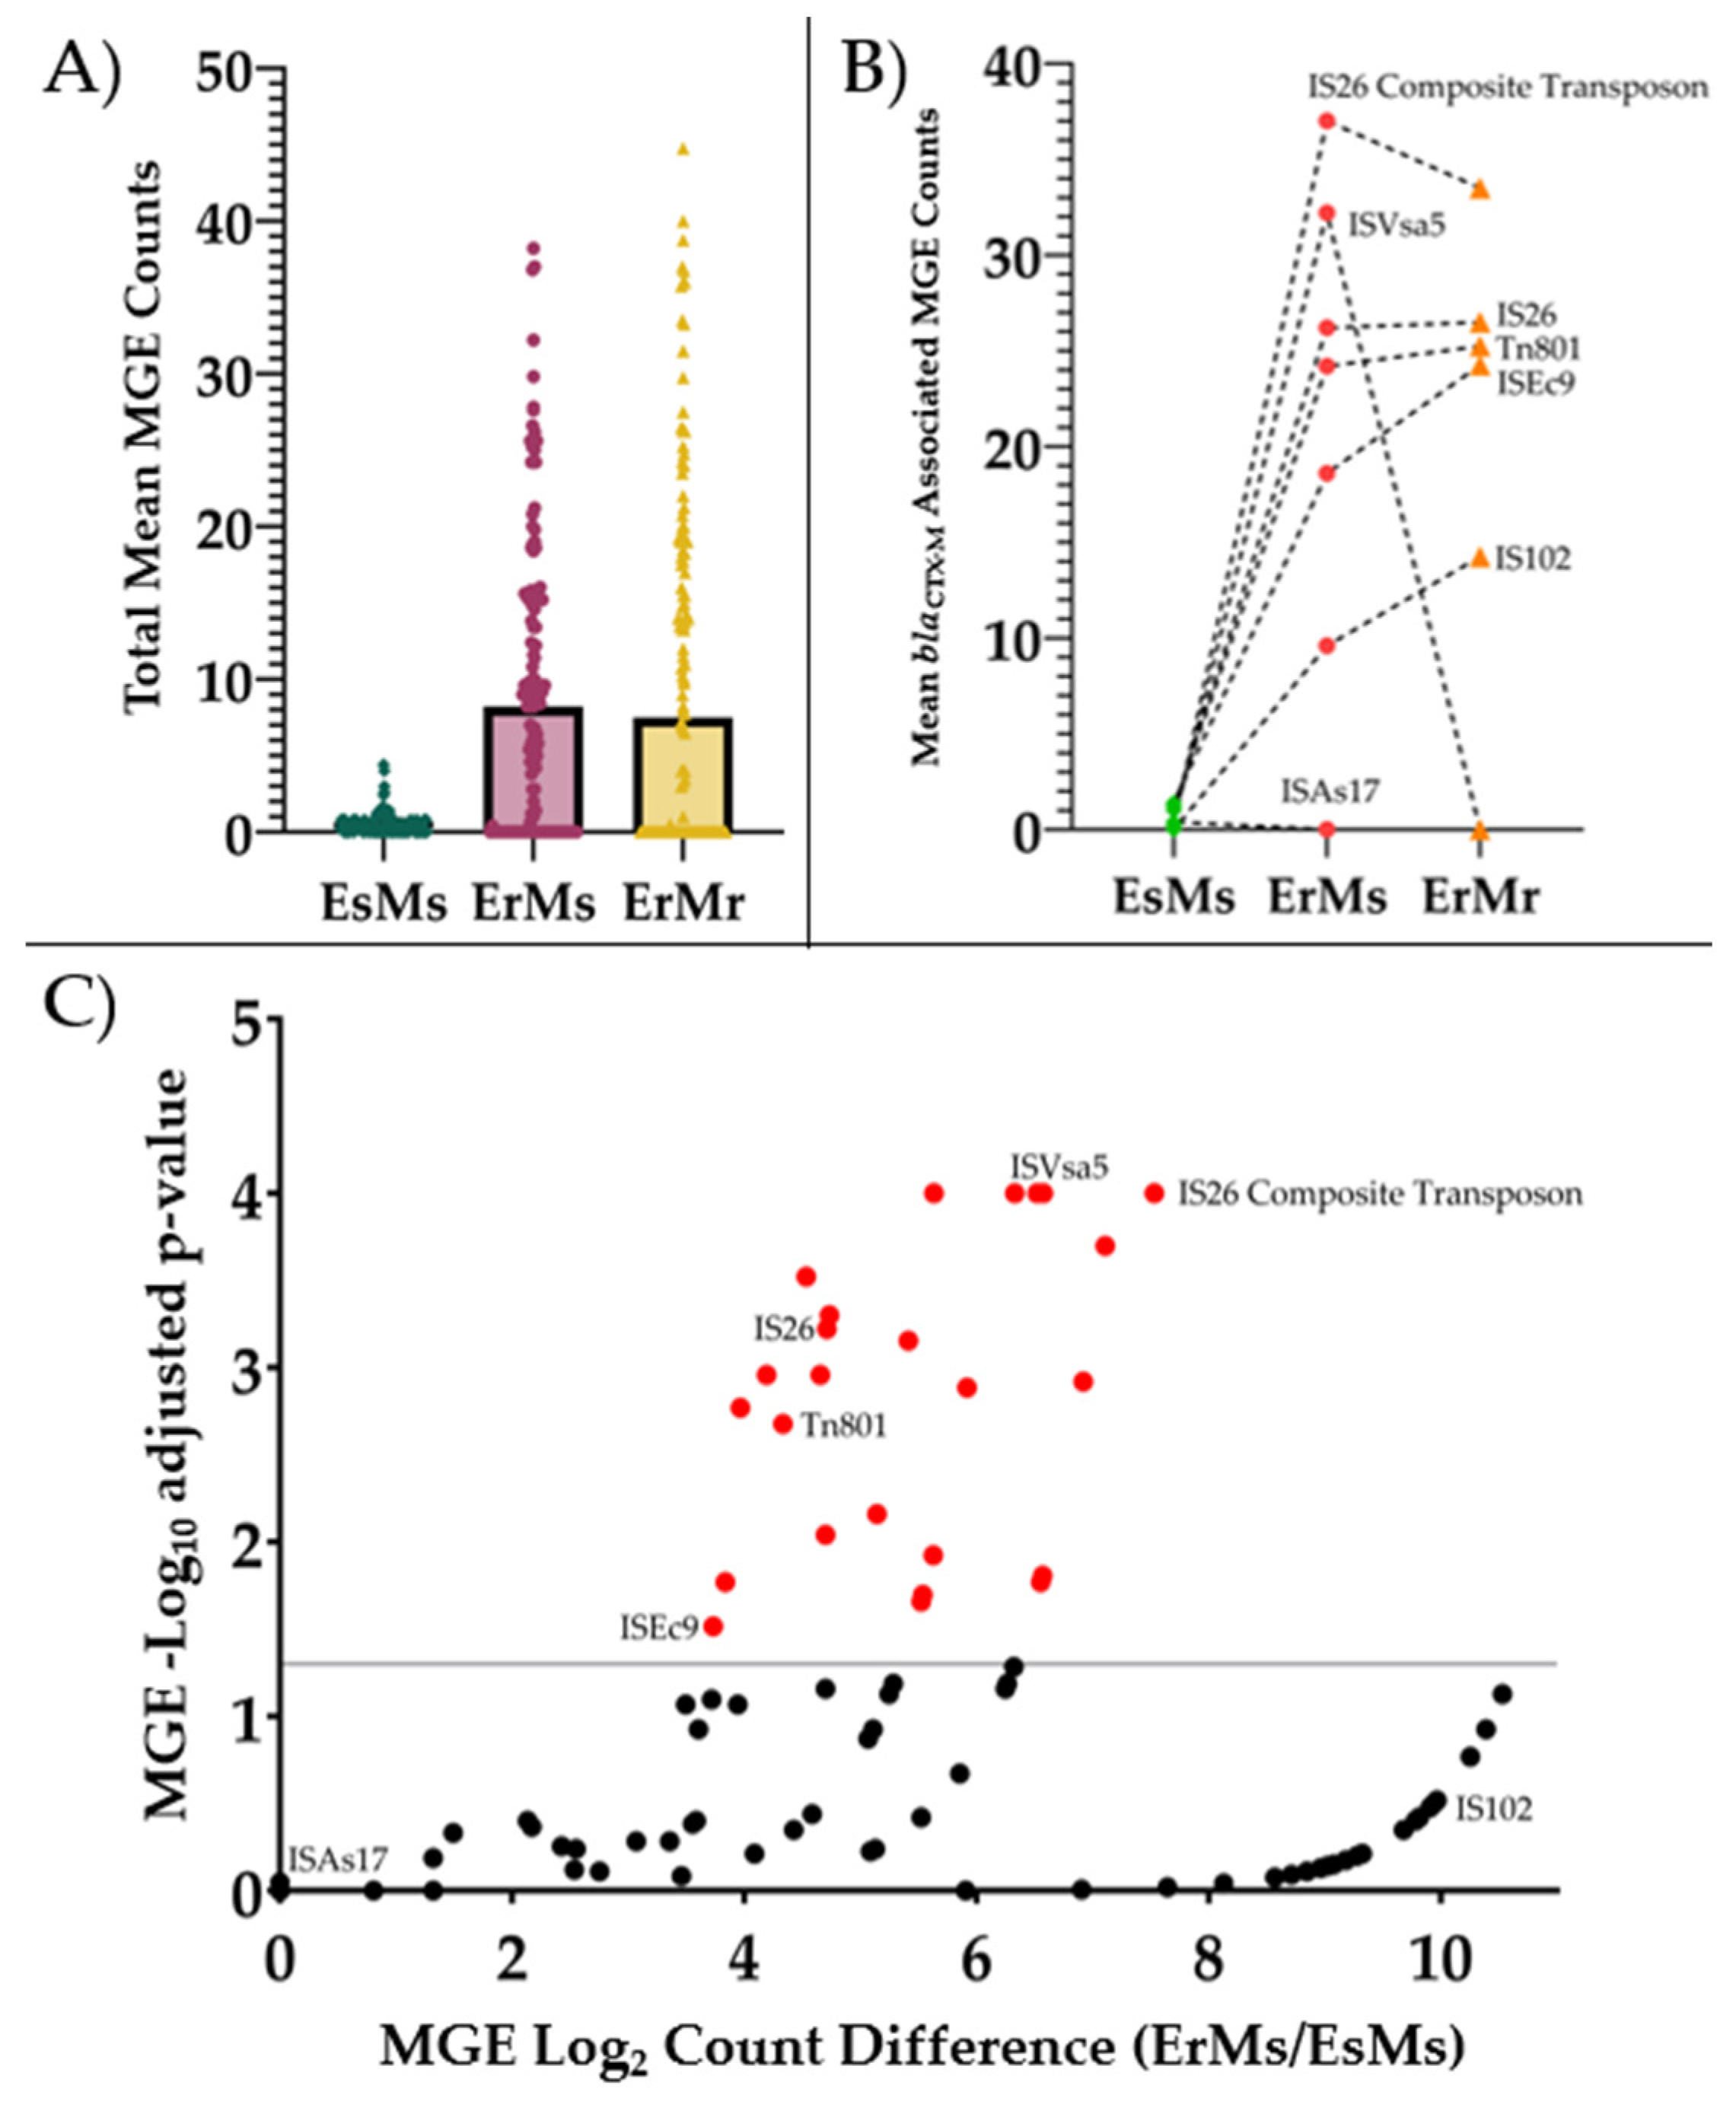
2.2. ErMs E. coli Have High Abundance of Mobile Genetic Elements Interposed by blaCTX-M
2.3. Carbapenemase and blaCTX-M Hasten Meropenem Hydrolysis in CPE and NCPE
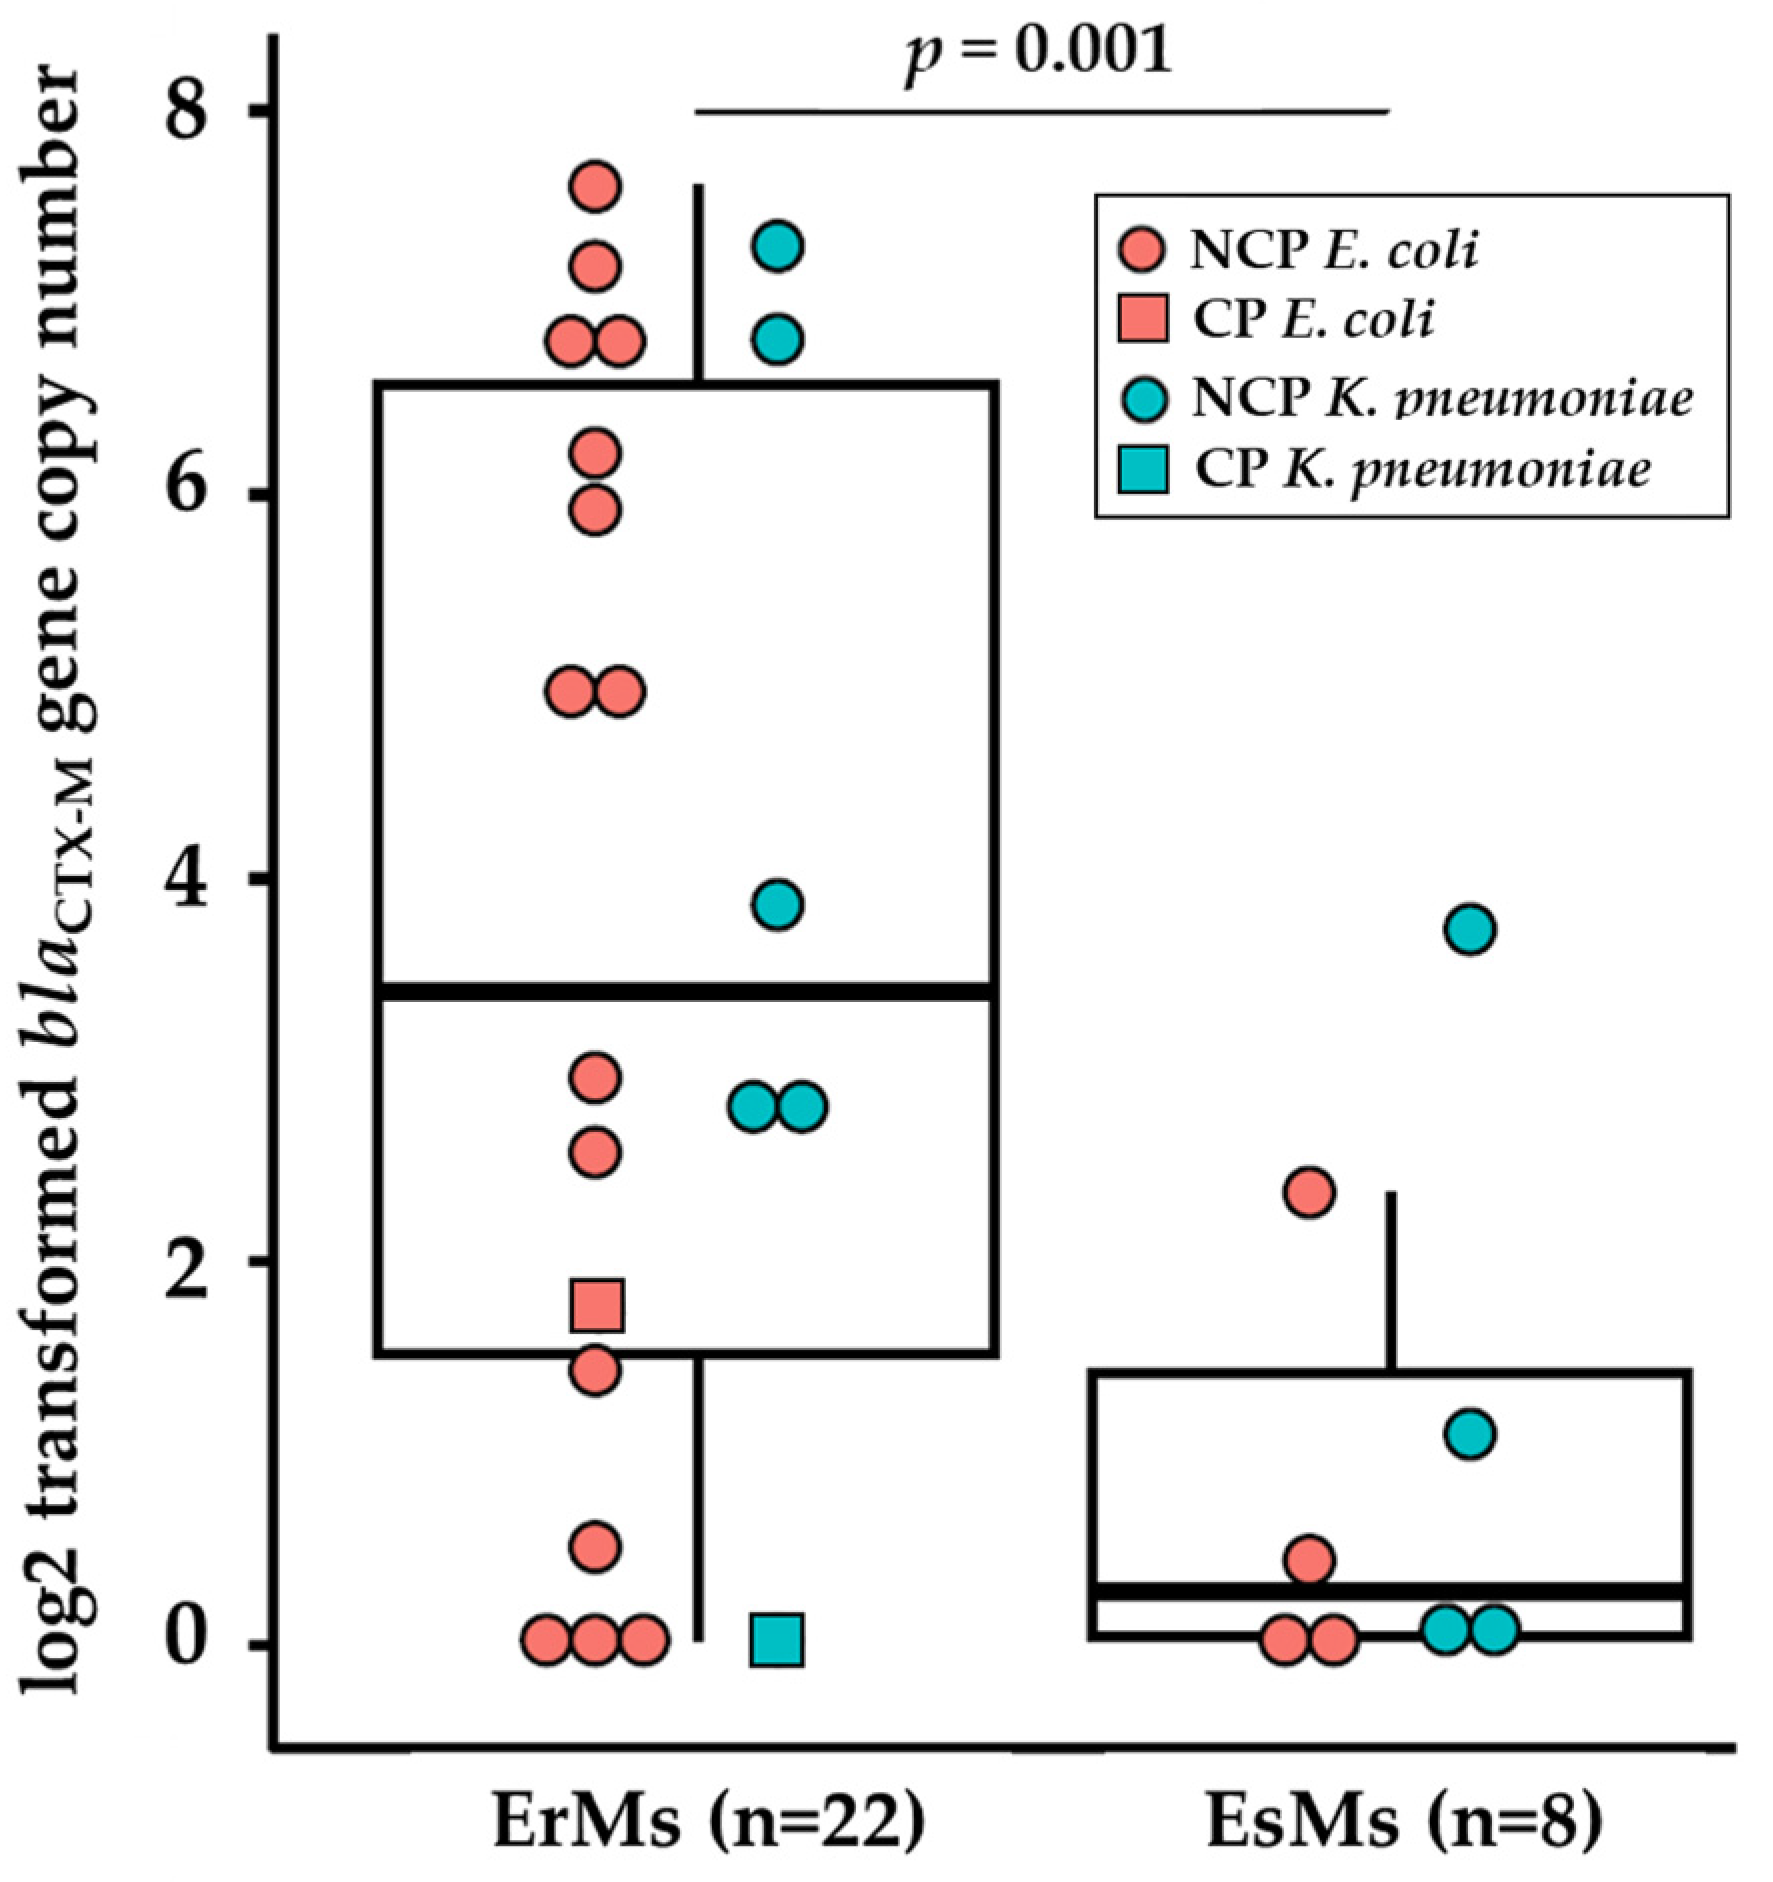
2.4. Ertapenem Resistant E. coli and K. pneumoniae Carry Elevated Copies of blaCTX-M Genes
2.5. ompC Frameshifts Are Frequent among Ertapenem Resistant NCPE E. coli
| E. coli | K. pneumoniae | ||||||
|---|---|---|---|---|---|---|---|
| CP-ErMr (n = 2) |
NCP-ErMs (n = 16) |
P-value | CP-ErMr (n = 28) |
NCP-ErMs (n = 8) |
P-value | ||
| No major alteration(s) | 2 (100) | 0 (0) | 0.002 | 1 (3.6) | 0 (0) | 1.00 | |
| Any major alteration(s) | 0 (0) | 16 (100) | 0.002 | 27 (96) | 8 (100) | 1.00 | |
| ompC/ompK35 | 0 (0) | 14 (88) | 0.05 | 27 (96) | 8 (100) | 1.00 | |
| ompF/ompK36 | 0 (0) | 8 (50) | 0.55 | 20 (71) | 4 (50) | 0.47 | |
| Insertion/Deletion | 0 (0) | 10 (63) | 0.85 | 27 (96) | 8 (100) | 1.00 | |
| ompC/ompK35 | 0 (0) | 10 (63) | 0.85 | 27 (96) | 8 (100) | 1.00 | |
| ompF/ompK36 | 0 (0) | 0 (0) | ND | 0 (0) | 0 (0) | ND | |
| Frameshift | 0 (0) | 16 (100) | 0.002 | 27 (96) | 8 (100) | 1.00 | |
| ompC/ompK35 | 0 (0) | 14 (88) | 0.05 | 24 (85) | 8 (100) | 0.62 | |
| ompF/ompK36 | 0 (0) | 8 (50) | 0.55 | 0 (0) | 0 (0) | ND | |
| Premature Stop | 0 (0) | 1 (6.2) | 1.00 | 25 (89) | 8 (100) | 0.80 | |
| ompC/ompK35 | 0 (0) | 1 (6.2) | 1.00 | 23 (82) | 7 (87) | 1.00 | |
| ompF/ompK36 | 0 (0) | 0 (0) | ND | 20 (71) | 4 (50) | 0.47 | |
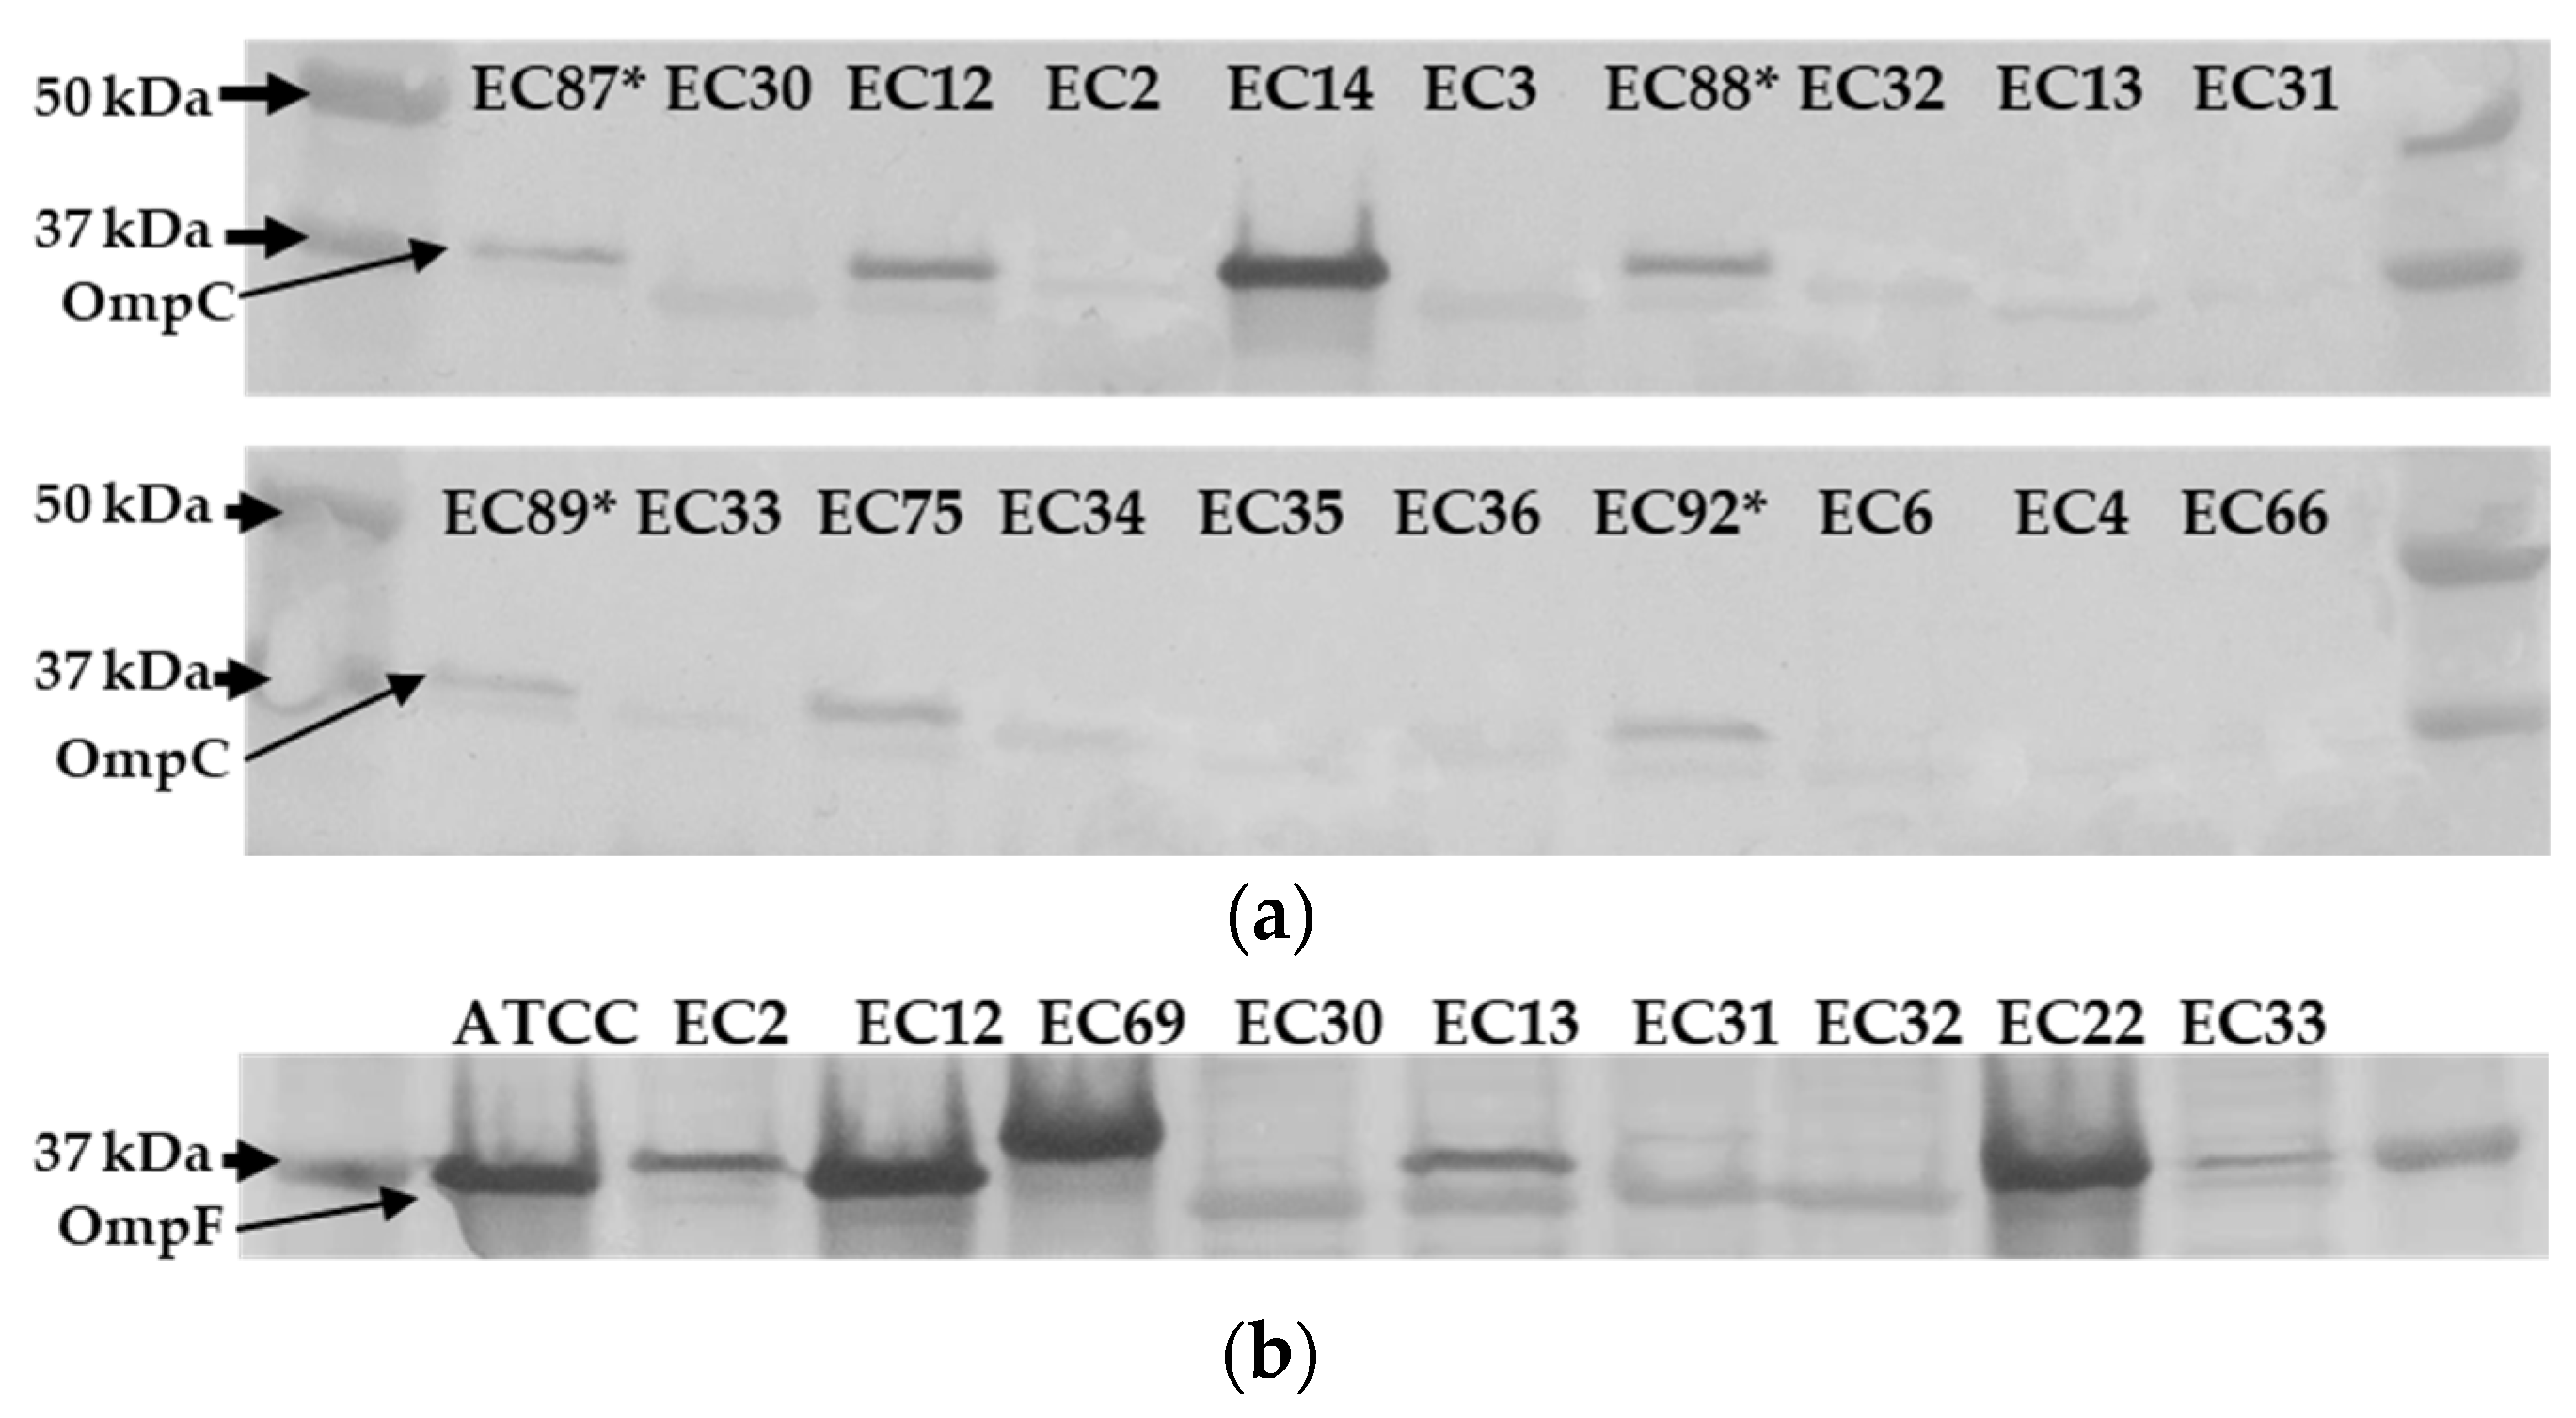
2.6. Ertapenem Resistant E. coli Lack OmpC Outer Membrane Protein
| ID | Carbapenemase Status |
blaCTX-M Δ∆CtA | Contig CoverageB at K12 ompC |
OmpC BandC |
|---|---|---|---|---|
| EC12 | CP (blaKPC) |
+ 1.7 |
No gap (Full coverage) |
Detected |
| EC14 | CP (blaKPC) |
+ 0.5 |
No gap (Low at c.539 – c.545) |
Detected |
| EC13 | CP (blaKPC) |
+ 5.0 |
No gap (Full coverage) |
ND |
| EC75 | CP (blaKPC) |
ND |
No gap (Full coverage) |
Detected |
| EC30 | NCP | + 6.2 |
149 bp gap (c.424 - c.531) |
ND |
| EC31 | NCP | + 2.9 |
29 bp gap (c.544 – c.531) |
ND |
| EC35 | NCP | + 5.9 |
144 bp gap (c.429 – c.531) |
ND |
| EC2 | NCP | + 4.9 |
149 bp gap (c.424 – c.531) |
ND |
| EC3 | NCP | + 6.6 |
173 bp gap (c.416 – c.515) |
ND |
| EC32 | NCP | + 1.4 |
150 bp gap (c.424 – c.530) |
ND |
| EC33 | NCP | + 7.5 |
149 bp gap (c.424 – c.530) |
ND |
| EC34 | NCP | ND | 139 bp gapD(c.434 – c.531) | ND |
| EC36 | NCP | + 7.1 |
140 bp gap (c.434 – c.530) |
ND |
| EC4 | NCP | + 6.8 |
No gap (Full coverage) |
ND |
| EC6 | NCP | + 2.5 |
141 bp gap (c.431 – c.532) |
ND |
| EC66 | NCP | ND |
149 bp gap (c.424 – c.531) |
ND |
3. Discussion
4. Materials and Methods
4.1. Bacterial Isolates and Antimicrobial Susceptibility Testing
4.2. Whole Genome Sequencing
4.3. Immunodetection and Sample Preperation
4.4. qPCR of β-lactamase Genes
4.5. Sample Preparation for LC-MS/MS Analysis
4.6. Statistical Analyses
Supplementary Materials
Author Contributions
Funding
Institutional Review Board Statement
Informed Consent Statement
Data Availability Statement
Conflicts of Interest
References
- World Health Organization Implementation Manual to Prevent and Control the Spread of Carbapenem-Resistant Organisms at the National and Health Care Facility Level: Interim Practical Manual Supporting Implementation of the Guidelines for the Prevention and Control of Carbapenem-Resistant Enterobacteriaceae, Acinetobacter Baumannii and Pseudomonas Aeruginosa in Health Care Facilities; World Health Organization, 2019. I.
- Lasko, M.J.; Nicolau, D.P. Carbapenem-Resistant Enterobacterales: Considerations for Treatment in the Era of New Antimicrobials and Evolving Enzymology. Curr Infect Dis Rep 2020, 22, 6. [Google Scholar] [CrossRef] [PubMed]
- Tracking CRE in the United States| HAI | CDC. Available online: https://www.cdc.gov/hai/organisms/cre/trackingcre.html (accessed on 31 January 2023).
- Karlsson, M.; Lutgring, J.D.; Ansari, U.; Lawsin, A.; Albrecht, V.; McAllister, G.; Daniels, J.; Lonsway, D.; McKay, S.; Beldavs, Z.; et al. Molecular Characterization of Carbapenem-Resistant Enterobacterales Collected in the United States. Microb Drug Resist 2022, 28, 389–397. [Google Scholar] [CrossRef] [PubMed]
- Lee, Y.Q.; Sri La Sri Ponnampalavanar, S.; Chong, C.W.; Karunakaran, R.; Vellasamy, K.M.; Abdul Jabar, K.; Kong, Z.X.; Lau, M.Y.; Teh, C.S.J. Characterisation of Non-Carbapenemase-Producing Carbapenem-Resistant Klebsiella Pneumoniae Based on Their Clinical and Molecular Profile in Malaysia. Antibiotics (Basel) 2022, 11, 1670. [Google Scholar] [CrossRef] [PubMed]
- Chea, N.; Bulens, S.N.; Kongphet-Tran, T.; Lynfield, R.; Shaw, K.M.; Vagnone, P.S.; Kainer, M.A.; Muleta, D.B.; Wilson, L.; Vaeth, E.; et al. Improved Phenotype-Based Definition for Identifying Carbapenemase Producers among Carbapenem-Resistant Enterobacteriaceae. Emerg Infect Dis 2015, 21, 1611–1616. [Google Scholar] [CrossRef] [PubMed]
- Black, C.A.; So, W.; Dallas, S.S.; Gawrys, G.; Benavides, R.; Aguilar, S.; Chen, C.-J.; Shurko, J.F.; Lee, G.C. Predominance of Non-Carbapenemase Producing Carbapenem-Resistant Enterobacterales in South Texas. Front. Microbiol. 2021, 11. [Google Scholar] [CrossRef] [PubMed]
- Tamma PD, Aitken SL, Bonomo RA, Mathers AJ, van Duin D, Clancy CJ. Infectious Diseases Society of America Antimicrobial-Resistant Treatment Guidance: Gram-Negative Bacterial Infections. Infectious Diseases Society of America 2023; Version 3.0. Available at https://www.idsociety.org/practice-guideline/amr-guidance/. Accessed 12/09/2023.
- Ma, P.; He, L.L.; Pironti, A.; Laibinis, H.H.; Ernst, C.M.; Manson, A.L.; Bhattacharyya, R.P.; Earl, A.M.; Livny, J.; Hung, D.T. Genetic Determinants Facilitating the Evolution of Resistance to Carbapenem Antibiotics. eLife 2021, 10, e67310. [Google Scholar] [CrossRef]
- Shropshire, W.C.; Aitken, S.L.; Pifer, R.; Kim, J.; Bhatti, M.M.; Li, X.; Kalia, A.; Galloway-Peña, J.; Sahasrabhojane, P.; Arias, C.A.; et al. IS26-Mediated Amplification of blaOXA-1 and blaCTX-M-15 with Concurrent Outer Membrane Porin Disruption Associated with de Novo Carbapenem Resistance in a Recurrent Bacteraemia Cohort. Journal of Antimicrobial Chemotherapy 2021, 76, 385–395. [Google Scholar] [CrossRef]
- Zankari, E.; Allesøe, R.; Joensen, K.G.; Cavaco, L.M.; Lund, O.; Aarestrup, F.M. PointFinder: A Novel Web Tool for WGS-Based Detection of Antimicrobial Resistance Associated with Chromosomal Point Mutations in Bacterial Pathogens. J Antimicrob Chemother 2017, 72, 2764–2768. [Google Scholar] [CrossRef]
- Bortolaia, V.; Kaas, R.S.; Ruppe, E.; Roberts, M.C.; Schwarz, S.; Cattoir, V.; Philippon, A.; Allesoe, R.L.; Rebelo, A.R.; Florensa, A.F.; et al. ResFinder 4.0 for Predictions of Phenotypes from Genotypes. J Antimicrob Chemother 2020, 75, 3491–3500. [Google Scholar] [CrossRef]
- Clausen, P.T.L.C.; Aarestrup, F.M.; Lund, O. Rapid and Precise Alignment of Raw Reads against Redundant Databases with KMA. BMC Bioinformatics 2018, 19, 307. [Google Scholar] [CrossRef]
- Pinet, E.; Franceschi, C.; Davin-Regli, A.; Zambardi, G.; Pagès, J.-M. 2015 Role of the Culture Medium in Porin Expression and Piperacillin-Tazobactam Susceptibility in Escherichia Coli. Journal of Medical Microbiology 64, 1305–1314. [CrossRef]
- Boxtel, R. van; Wattel, A.A.; Arenas, J.; Goessens, W.H.F.; Tommassen, J. Acquisition of Carbapenem Resistance by Plasmid-Encoded-AmpC-Expressing Escherichia Coli. Antimicrobial Agents and Chemotherapy 2017, 61. [Google Scholar] [CrossRef]
- Shropshire, W.C.; Dinh, A.Q.; Earley, M.; Komarow, L.; Panesso, D.; Rydell, K.; Gómez-Villegas, S.I.; Miao, H.; Hill, C.; Chen, L.; et al. Accessory Genomes Drive Independent Spread of Carbapenem-Resistant Klebsiella Pneumoniae Clonal Groups 258 and 307 in Houston, TX. mBio 2022, 13, e00497-22. [Google Scholar] [CrossRef]
- Livermore, D.M.; Day, M.; Cleary, P.; Hopkins, K.L.; Toleman, M.A.; Wareham, D.W.; Wiuff, C.; Doumith, M.; Woodford, N. OXA-1 β-Lactamase and Non-Susceptibility to Penicillin/β-Lactamase Inhibitor Combinations among ESBL-Producing Escherichia Coli. Journal of Antimicrobial Chemotherapy 2019, 74, 326–333. [Google Scholar] [CrossRef]
- Hasman, H.; Saputra, D.; Sicheritz-Ponten, T.; Lund, O.; Svendsen, C.A.; Frimodt-Møller, N.; Aarestrup, F.M. Rapid Whole-Genome Sequencing for Detection and Characterization of Microorganisms Directly from Clinical Samples. J Clin Microbiol 2014, 52, 139–146. [Google Scholar] [CrossRef]
- Larsen, M.V.; Cosentino, S.; Lukjancenko, O.; Saputra, D.; Rasmussen, S.; Hasman, H.; Sicheritz-Pontén, T.; Aarestrup, F.M.; Ussery, D.W.; Lund, O. Benchmarking of Methods for Genomic Taxonomy. J Clin Microbiol 2014, 52, 1529–1539. [Google Scholar] [CrossRef] [PubMed]
- Clausen, P.T.L.C.; Aarestrup, F.M.; Lund, O. Rapid and Precise Alignment of Raw Reads against Redundant Databases with KMA. BMC Bioinformatics 2018, 19, 307. [Google Scholar] [CrossRef] [PubMed]
- Larsen, M.V.; Cosentino, S.; Rasmussen, S.; Friis, C.; Hasman, H.; Marvig, R.L.; Jelsbak, L.; Sicheritz-Pontén, T.; Ussery, D.W.; Aarestrup, F.M.; et al. Multilocus Sequence Typing of Total-Genome-Sequenced Bacteria. J Clin Microbiol 2012, 50, 1355–1361. [Google Scholar] [CrossRef] [PubMed]
- Bartual, S.G.; Seifert, H.; Hippler, C.; Luzon, M.A.D.; Wisplinghoff, H.; Rodríguez-Valera, F. Development of a Multilocus Sequence Typing Scheme for Characterization of Clinical Isolates of Acinetobacter Baumannii. J Clin Microbiol 2005, 43, 4382–4390. [Google Scholar] [CrossRef] [PubMed]
- Griffiths, D.; Fawley, W.; Kachrimanidou, M.; Bowden, R.; Crook, D.W.; Fung, R.; Golubchik, T.; Harding, R.M.; Jeffery, K.J.M.; Jolley, K.A.; et al. Multilocus Sequence Typing of Clostridium Difficile. J Clin Microbiol 2010, 48, 770–778. [Google Scholar] [CrossRef] [PubMed]
- Lemee, L.; Dhalluin, A.; Pestel-Caron, M.; Lemeland, J.-F.; Pons, J.-L. Multilocus Sequence Typing Analysis of Human and Animal Clostridium Difficile Isolates of Various Toxigenic Types. J Clin Microbiol 2004, 42, 2609–2617. [Google Scholar] [CrossRef] [PubMed]
- Wirth, T.; Falush, D.; Lan, R.; Colles, F.; Mensa, P.; Wieler, L.H.; Karch, H.; Reeves, P.R.; Maiden, M.C.J.; Ochman, H.; et al. Sex and Virulence in Escherichia Coli: An Evolutionary Perspective. Mol Microbiol 2006, 60, 1136–1151. [Google Scholar] [CrossRef] [PubMed]
- Jaureguy, F.; Landraud, L.; Passet, V.; Diancourt, L.; Frapy, E.; Guigon, G.; Carbonnelle, E.; Lortholary, O.; Clermont, O.; Denamur, E.; et al. Phylogenetic and Genomic Diversity of Human Bacteremic Escherichia Coli Strains. BMC Genomics 2008, 9, 560. [Google Scholar] [CrossRef] [PubMed]
- Camacho, C.; Coulouris, G.; Avagyan, V.; Ma, N.; Papadopoulos, J.; Bealer, K.; Madden, T.L. BLAST+: Architecture and Applications. BMC Bioinformatics 2009, 10, 421. [Google Scholar] [CrossRef] [PubMed]
- Humphrey, W.; Dalke, A.; Schulten, K. VMD: Visual Molecular Dynamics. Journal of Molecular Graphics 1996, 14, 33–38. [Google Scholar] [CrossRef] [PubMed]
- Adler, M.; Anjum, M.; Andersson, D.I.; Sandegren, L. Influence of Acquired β-Lactamases on the Evolution of Spontaneous Carbapenem Resistance in Escherichia Coli. Journal of Antimicrobial Chemotherapy 2013, 68, 51–59. [Google Scholar] [CrossRef]
- Rivoarilala, O.L.; Garin, B.; Andriamahery, F.; Collard, J.M. Rapid in Vitro Detection of CTX-M Groups 1, 2, 8, 9 Resistance Genes by LAMP Assays. PLoS One 2018, 13, e0200421. [Google Scholar] [CrossRef]
- Martínez-García, E.; Navarro-Lloréns, J.M.; Tormo, A. Identification of an Unknown Promoter, OUTIIp, within the IS10R Element. J Bacteriol 2003, 185, 2046-50. [Google Scholar] [CrossRef]


| Name | Overall (%) | ErMs(%) |
|---|---|---|
| Amikacin | 91 | 65 |
| Aztreonam | 9 | 12 |
| Ceftazidime-avibactam | 77 | 88 |
| Ciprofloxacin | 9 | 12 |
| Colistin | 95 | 96 |
| Doripenem | 53 | 88 |
| Doxycycline | 44 | 38 |
| Ertapenem | 4 | 0 |
| Cefepime | 16 | 23 |
| Cefotaxime | 9 | 12 |
| Gentamicin | 39 | 48 |
| Imipenem | 46 | 73 |
| Imipenem-relebactam | 98 | 96 |
| Levofloxacin | 16 | 0 |
| Meropenem | 44 | 100 |
| Meropenem-vaborbactam | 88 | 88 |
| Minocycline | 63 | 68 |
| Polymixin B | 95 | 96 |
| Piperacillin-tazobactam | 19 | 35 |
| Trimethoprim-sulfamethoxazole | 23 | 15 |
| Ceftazidime | 14 | 19 |
| Tigecycline | 98 | 96 |
| Ticarcillin-clavulanic acid | 11 | 15 |
| Tobramycin | 30 | 23 |
| Species | Carbapenem Phenotype |
Carbapenemase Status |
||||||||
|---|---|---|---|---|---|---|---|---|---|---|
| n (%) | Overall (N = 76) |
K. pneumoniae (n = 47) |
E. coli (n = 29) |
P-value | ErMr (n = 47) |
ErMs (n = 29) |
P-Value | CPE (n = 35) |
NCPE (n = 41) |
P-value |
| ErMs | 29 (38) | 8 (17) | 21 (72) | <0.001 | 5 (14) | 24 (59) | <0.001 | |||
| NCPE | 41 (54) | 19 (40) | 22 (76) | 0.01 | 17 (36) | 24 (83) | <0.001 | |||
| CPE | 35 (46) | 28 (60) | 7 (24) | 0.01 | 30 (64) | 5 (17) | <0.001 | |||
| blaMBLA | 5 (7) | 3 (6) | 2 (7) | 1.00 | 4 (9) | 1 (3) | 0.70 | 5 (14) | 0 (0) | 0.04 |
| blaKPCB | 28 (37) | 23 (49) | 5 (17) | 0.01 | 24 (51) | 4 (14) | 0.002 | 28 (80) | 0 (0) | <0.001 |
| blaOXA-48C | 2 (3) | 2 (4) | 0 (0) | 0.70 | 2 (4) | 0 (0) | 0.70 | 2 (6) | 0 (0) | 0.41 |
| blaOXA-1/-9 | 33 (43) | 22 (47) | 11 (38) | 0.60 | 22 (47) | 11 (38) | 0.60 | 21 (60) | 12 (29) | 0.01 |
| blaESBLD | 52 (68) | 32 (68) | 20 (69) | 1.00 | 28 (60) | 24 (83) | 0.06 | 21 (60) | 31 (76) | 0.23 |
| blaCTX-ME | 47 (62) | 27 (57) | 20 (69) | 0.45 | 23 (49) | 24 (83) | 0.01 | 16 (46) | 31 (76) | 0.02 |
| blaCTX-M-15 | 43 (57) | 27 (57) | 16 (55) | 1.00 | 22 (47) | 21 (72) | 0.05 | 16 (46) | 27 (66) | 0.13 |
| blaSHV-12 | 7 (9) | 7 (15) | 0 (0) | 0.08 | 4 (9) | 3 (10) | 1.00 | 4 (11) | 3 (7) | 0.83 |
| blapenicillinaseF | 60 (79) | 42 (89) | 18 (62) | 0.01 | 40 (85) | 20 (69) | 0.17 | 30 (86) | 30 (73) | 0.29 |
| blaAmpCG | 12 (16) | 5 (11) | 7 (24) | 0.21 | 7 (15) | 5 (17) | 1.00 | 3 (8) | 9 (22) | 0.20 |
| ID | β-Lactamase ProfileA | Meropenem Hydrolysis (ng/mL-hour) |
Vaborbactam Hydrolysis (ng/mL-hour)B |
|
|---|---|---|---|---|
| Carbapenemase | Non-Carbapenemase β-Lactamase |
|||
| EC68 | none | blaCMY-133, blaTEM-1 | -0.5 | -0.1 |
| EC5 | none | blaCTX-M-15, blaOXA-1 | -0.8 | No loss |
| EC201 | none | blaCTX-M-15, blaOXA-1 | -1.0 | No loss |
| KP56 | blaKPC-2 | blaOXA-9,blaTEM-1, blaSHV-182 | -1.0 | No loss |
| EC74 | blaKPC-3 | none | -1.3 | No loss |
| KP15 | blaKPC-2 | blaCTX-M-15, blaOXA-9,blaTEM-1, blaSHV-100 | -2.0 | No loss |
| EC23 | blaNDM-5 | blaCTX-M-15, blaOXA-1, blaTEM-1, blaSHV-27 | -2.8 | No loss |
| EC22 | blaNDM-5 | blaCTX-M-15, blaOXA-1, blaTEM-1, blaSHV-27 | LLQ at t1 | No loss |
| KP26 | blaNDM-1 | blaCTX-M-15, blaCMY-6, blaOXA-1, blaTEM-1, blaSHV-155 | LLQ at t1 | No loss |
| Phenotype | ID | rpsL |
ompC/ ompK36 |
ompF/ ompK35 |
tolC/ oqxA |
blaCTX-M | blaCMY | blaOXA-1/9 | blaKPC | blaSHV | blaTEM |
|---|---|---|---|---|---|---|---|---|---|---|---|
| ErMs | EC12 | 1.0 | 0.5 | 0.4 | 0.4 | 2.3 | 0.6 | 1.6 | 0.4 | ||
| EC30 | 1.4 | 1.3 | 1.7 | 48.8 | 2.8 | ||||||
| EC31 | 0.6 | 0.6 | 0.8 | 5.2 | 0.9 | ||||||
| EC35 | 0.7 | 0.9 | 1.0 | 39.9 | 0.1 | 1.2 | |||||
| KP10 | 1.0 | 0.6 | 0.7 | 0.7 | 10.7 | 4.3 | 0.5 | 4.7 | |||
| KP38 | 1.7 | 1.8 | 1.9 | 20.4 | 1.6 | 4.3 | |||||
| KP45 | 1.2 | 1.3 | 1.0 | 9.1 | 9.2 | 4.9 | |||||
| KP54 | 0.2 | 0.3 | 0.2 | 0.2 | 0.2 | 0.2 | 0.2 | ||||
| EsMs | EC87 | 1.0 | 0.6 | 0.5 | 0.6 | 1.6 | 0.7 | ||||
| EC88 | 0.8 | 0.6 | 1.9 | 8.1 | |||||||
| EC89 | 0.6 | 0.7 | 1.5 | 2.1 | 2.0 | ||||||
| EC92 | 0.5 | 0.4 | 1.2 | 1.4 | 0.6 | ||||||
| KP85 | 1.0 | 0.5 | 0.5 | 1.3 | 0.5 | 0.8 | 1.2 | ||||
| KP86 | 0.4 | 0.6 | 2.7 | 0.3 | 0.7 | ||||||
| KP90 | 0.8 | 1.0 | 1.6 | 20 | 3.6 | 1.0 | 8.6 | ||||
| KP91 | 0.4 | 0.4 | 1.1 | 0.1 |
Disclaimer/Publisher’s Note: The statements, opinions and data contained in all publications are solely those of the individual author(s) and contributor(s) and not of MDPI and/or the editor(s). MDPI and/or the editor(s) disclaim responsibility for any injury to people or property resulting from any ideas, methods, instructions or products referred to in the content. |
© 2024 by the authors. Licensee MDPI, Basel, Switzerland. This article is an open access article distributed under the terms and conditions of the Creative Commons Attribution (CC BY) license (http://creativecommons.org/licenses/by/4.0/).


