1. Introduction
Bio-based polymers, biodegradable polymers and natural fillers like natural fibers, cellulose and wood have gained enormous attention and interests due to the increasing environmental pressure on global warming. Bio-based polymers and biocomposites exhibit distinctive properties that have propelled their widespread utilization across various sectors including automotive, aerospace, and medical sectors. PLA is a thermoplastic and biodegradable polymer which has been used in several fields of application. It is widely considered in the medical field due to its biologically compactible and nontoxicity [
1]. Wood is also a biodegradable and ecofriendly material like PLA which when milled into small pieces can yield wood flour. This wood flour can be blended with PLA, extruded into filaments, and utilized for 3D printing [
2]. Wood flour is added to PLA to reduce the cost while increasing the mechanical performance of the wood/PLA composite [
3]. The development and manufacturing of polymers products plays a pivotal role in the modern world. Additive manufacturing has gained a lot of space in the manufacturing industry especially in the R&Ds of the above-mentioned sectors (aerospace, automotive and medical). Fused deposition modelling (FDM)/3D printing is one of the most common additive manufacturing methods used to manufacture a component by adding material in layers. The mechanical properties of a 3D printed component will depend on several printing and manufacturing parameters. Examples of such parameters include the printing layer thickness, the raster angle, the infill percentage, the printing speed, the printing temperature, the bed temperature, and the printing layer thickness [
4]. The printing layer thickness is a major influencing parameter because a smaller layer height provides improved bonding and adhesion between the layers, this increase in contact area makes the cohesion stronger and stiffens the material [
5]. The printing layer thickness will also have a huge effect on the water absorption property of the printed part.
Selecting the manufacturing method for producing a part or component is a complex decision influenced by numerous factors. Across various fields of polymer application, different manufacturing methods are used to produce products tailored to meet specific design performance requirements. Over the years, 3D printing, and rapid prototyping have revolutionized several industries due to their cost-effectiveness and ability to manufacture parts with complex geometries. The printing layer thickness of the component becomes a critical factor to maintain uniform properties across all the components. Knowledge on the influence of layer thickness is also important in order to switch between manufacturing methods as successful prototypes are often mass produced using different manufacturing methods. Extrusion and injection molding are two most commonly used methods for assembly-line production in polymer industry.
Injection molding accounts for 32.5% of the polymer processing processes and it is an excellent method for mass production [
6]. However, this method needs large investment, space and high competence, and largely not used for prototyping [
7]. The product development and prototyping are performed using simpler and cost-effective methods such as 3D printing. 3D printing produces a three-dimensional component from a virtual model that has been designed using Computer Aided Design (CAD) software. This facilitates quick and necessary changes to virtual models during the development phase, enabling the production of cost-effective prototypes quickly. This also allows us to quickly develop the existing product. However, switching between the manufacturing methods needs a thorough understanding of the shortcomings. This work intends to provide knowledge on one of the important factors, layer thickness, that affects the shift between manufacturing methods.
This work provides a comparative study of the properties of 3D printed and injection molded PLA, ABS and wood/PLA composite specimens to gain knowledge on the differences in manufacturing methods through qualitative testing. Layer thickness was considered during 3D printing while parameters such as the mold temperature, cylinder temperature, injection pressure and post injection pressure are optimized for injection molding. The specimens produced by 3D printing and injection molding undergo water absorption and these specimens were tested for mechanical properties through tensile, flexural and impact testing. Thermal analyses were performed using differential scanning calorimetry (DSC) and thermogravimetric analysis (TGA). Dynamic mechanical analysis and microscopy were used to validate the outcomes from the above tests.
2. Materials and Methods
2.1. Materials
The filaments used for 3D printing of specimens were supplied by 3D Prima, Sweden. Poly(lactic acid) (PrimaSelect™, Article Id: 21870, 2.85 mm diameter, Primacreator), wood/PLA (PrimaSelect™, Article Id: 21903, 2.85 mm diameter, Primacreator) and Acrylonitrile butadiene styrene (PrimaSelect™, Article Id: 21720, 2.85 mm diameter, Primacreator) filaments were used directly without any modifications. The same filaments that were used for 3D printing were pelletized and used for injection molding. Pellets for injection molding were prepared using a pelletizer supplied by Thermo Fisher Scientific GmbH (Varicut pelletizer, Germany).
2.2. Methods
2.2.1. 3D Printing
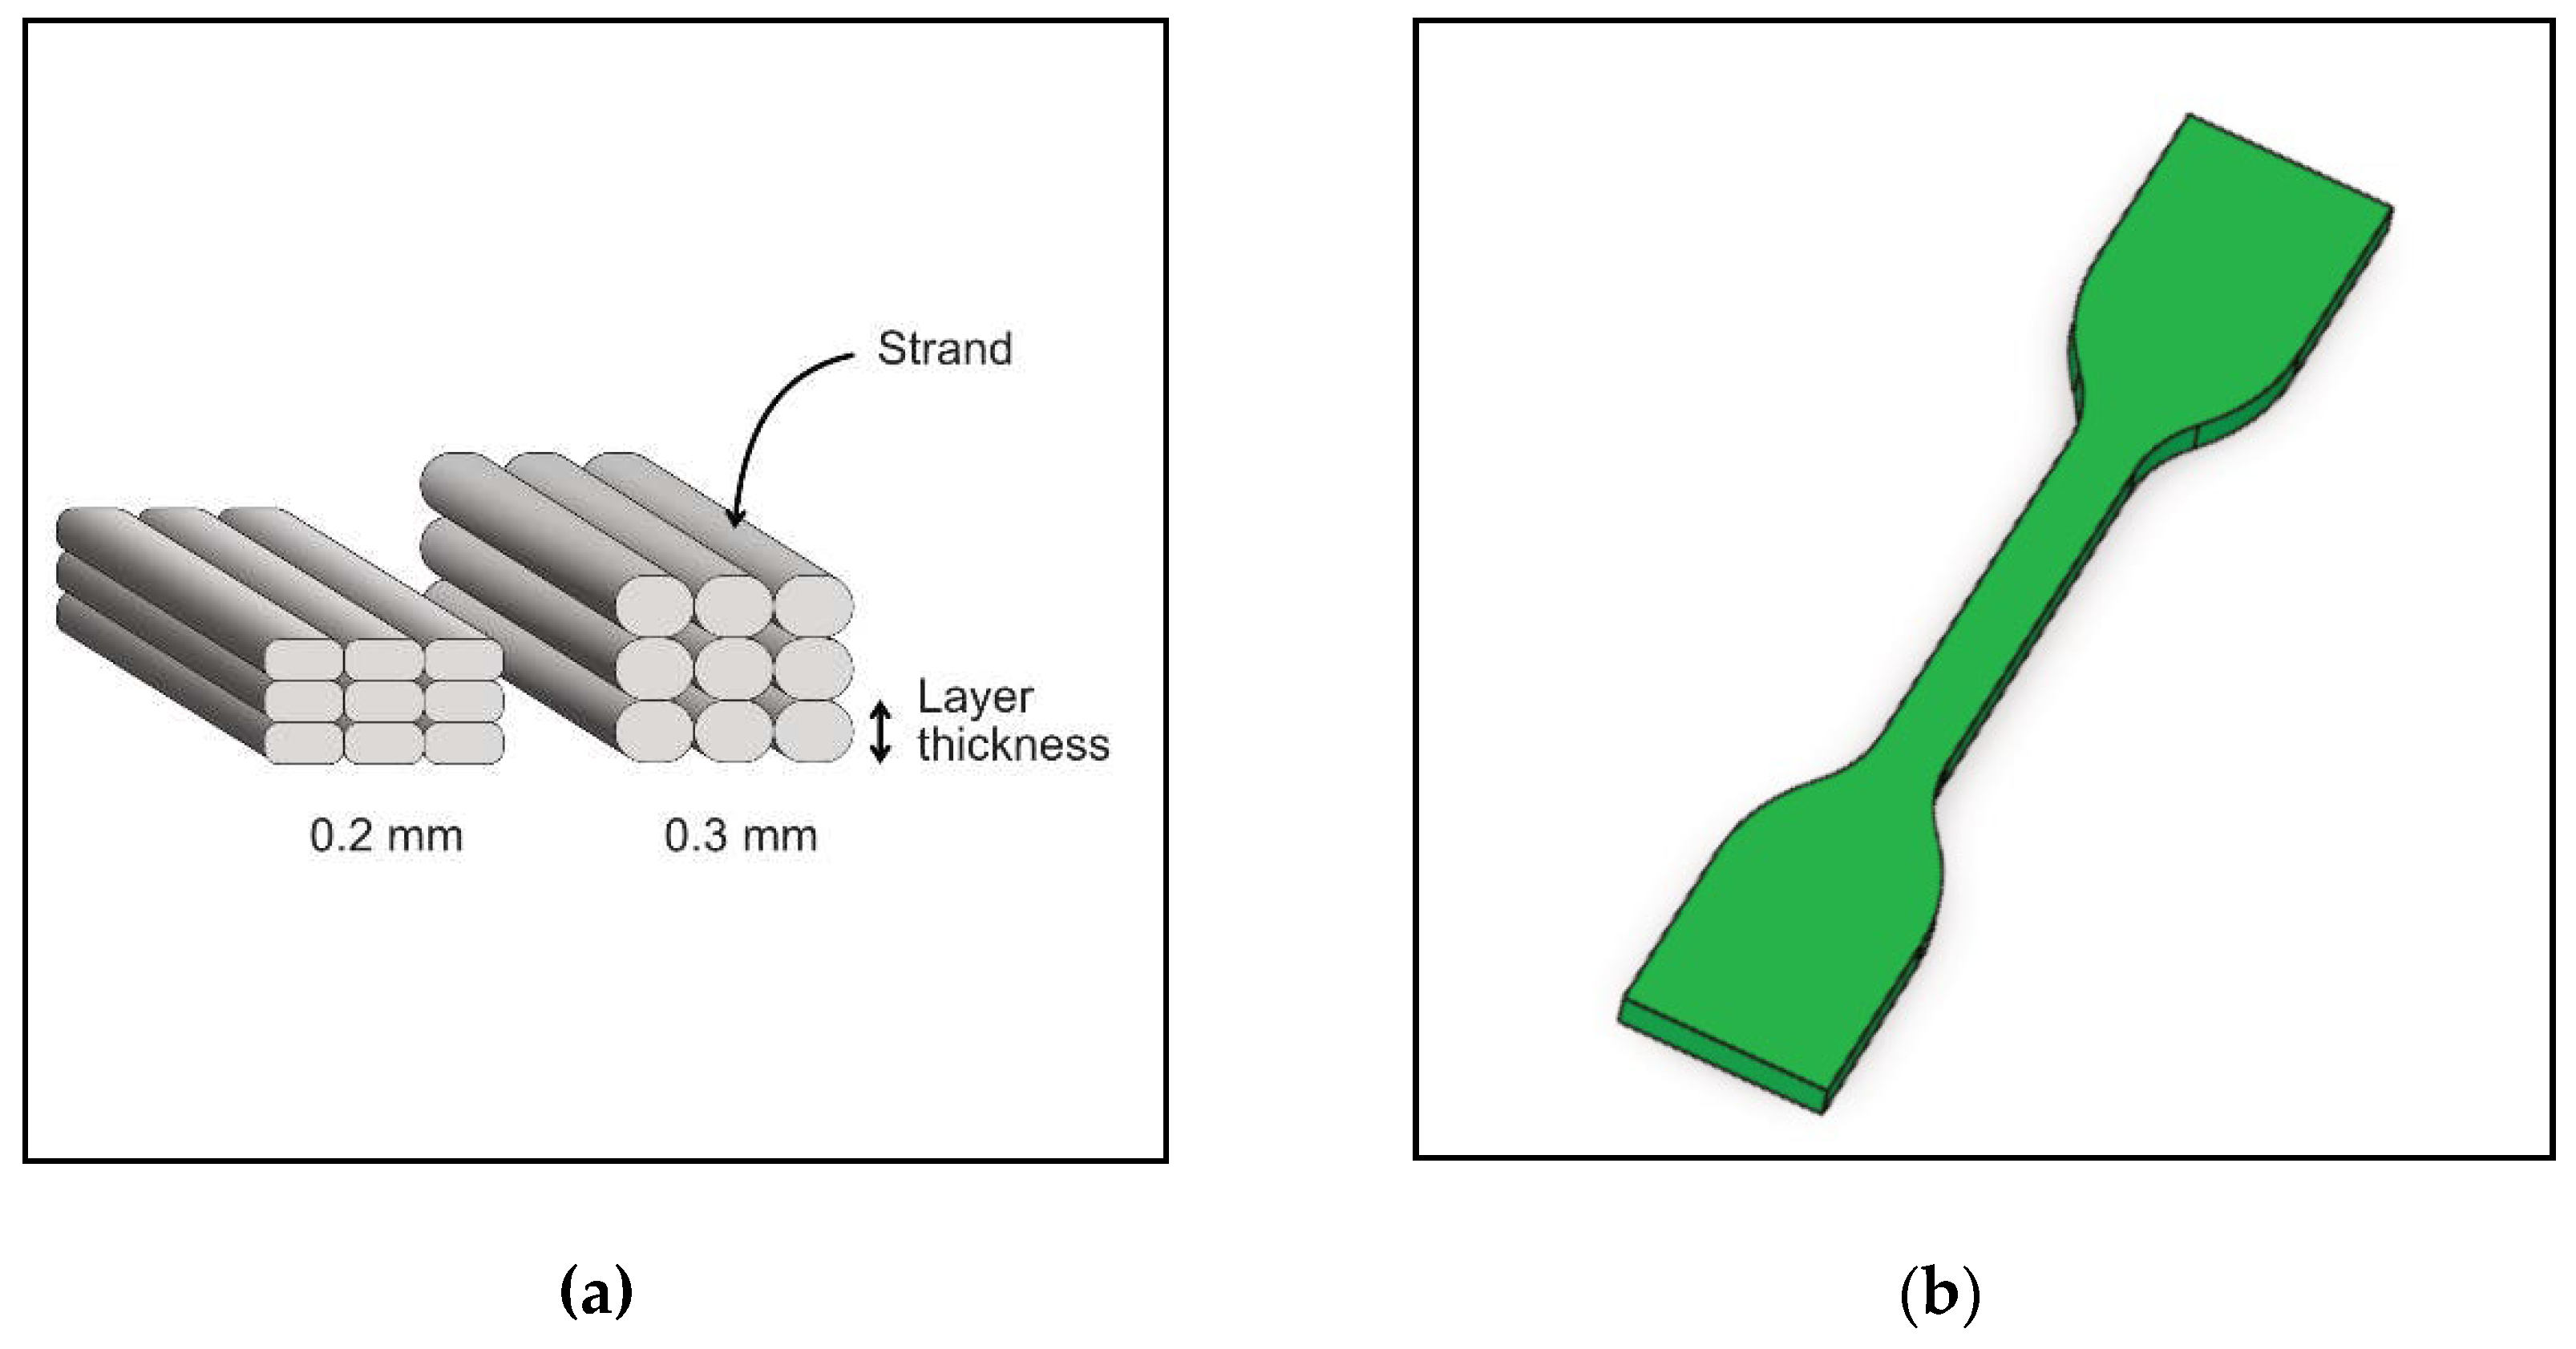
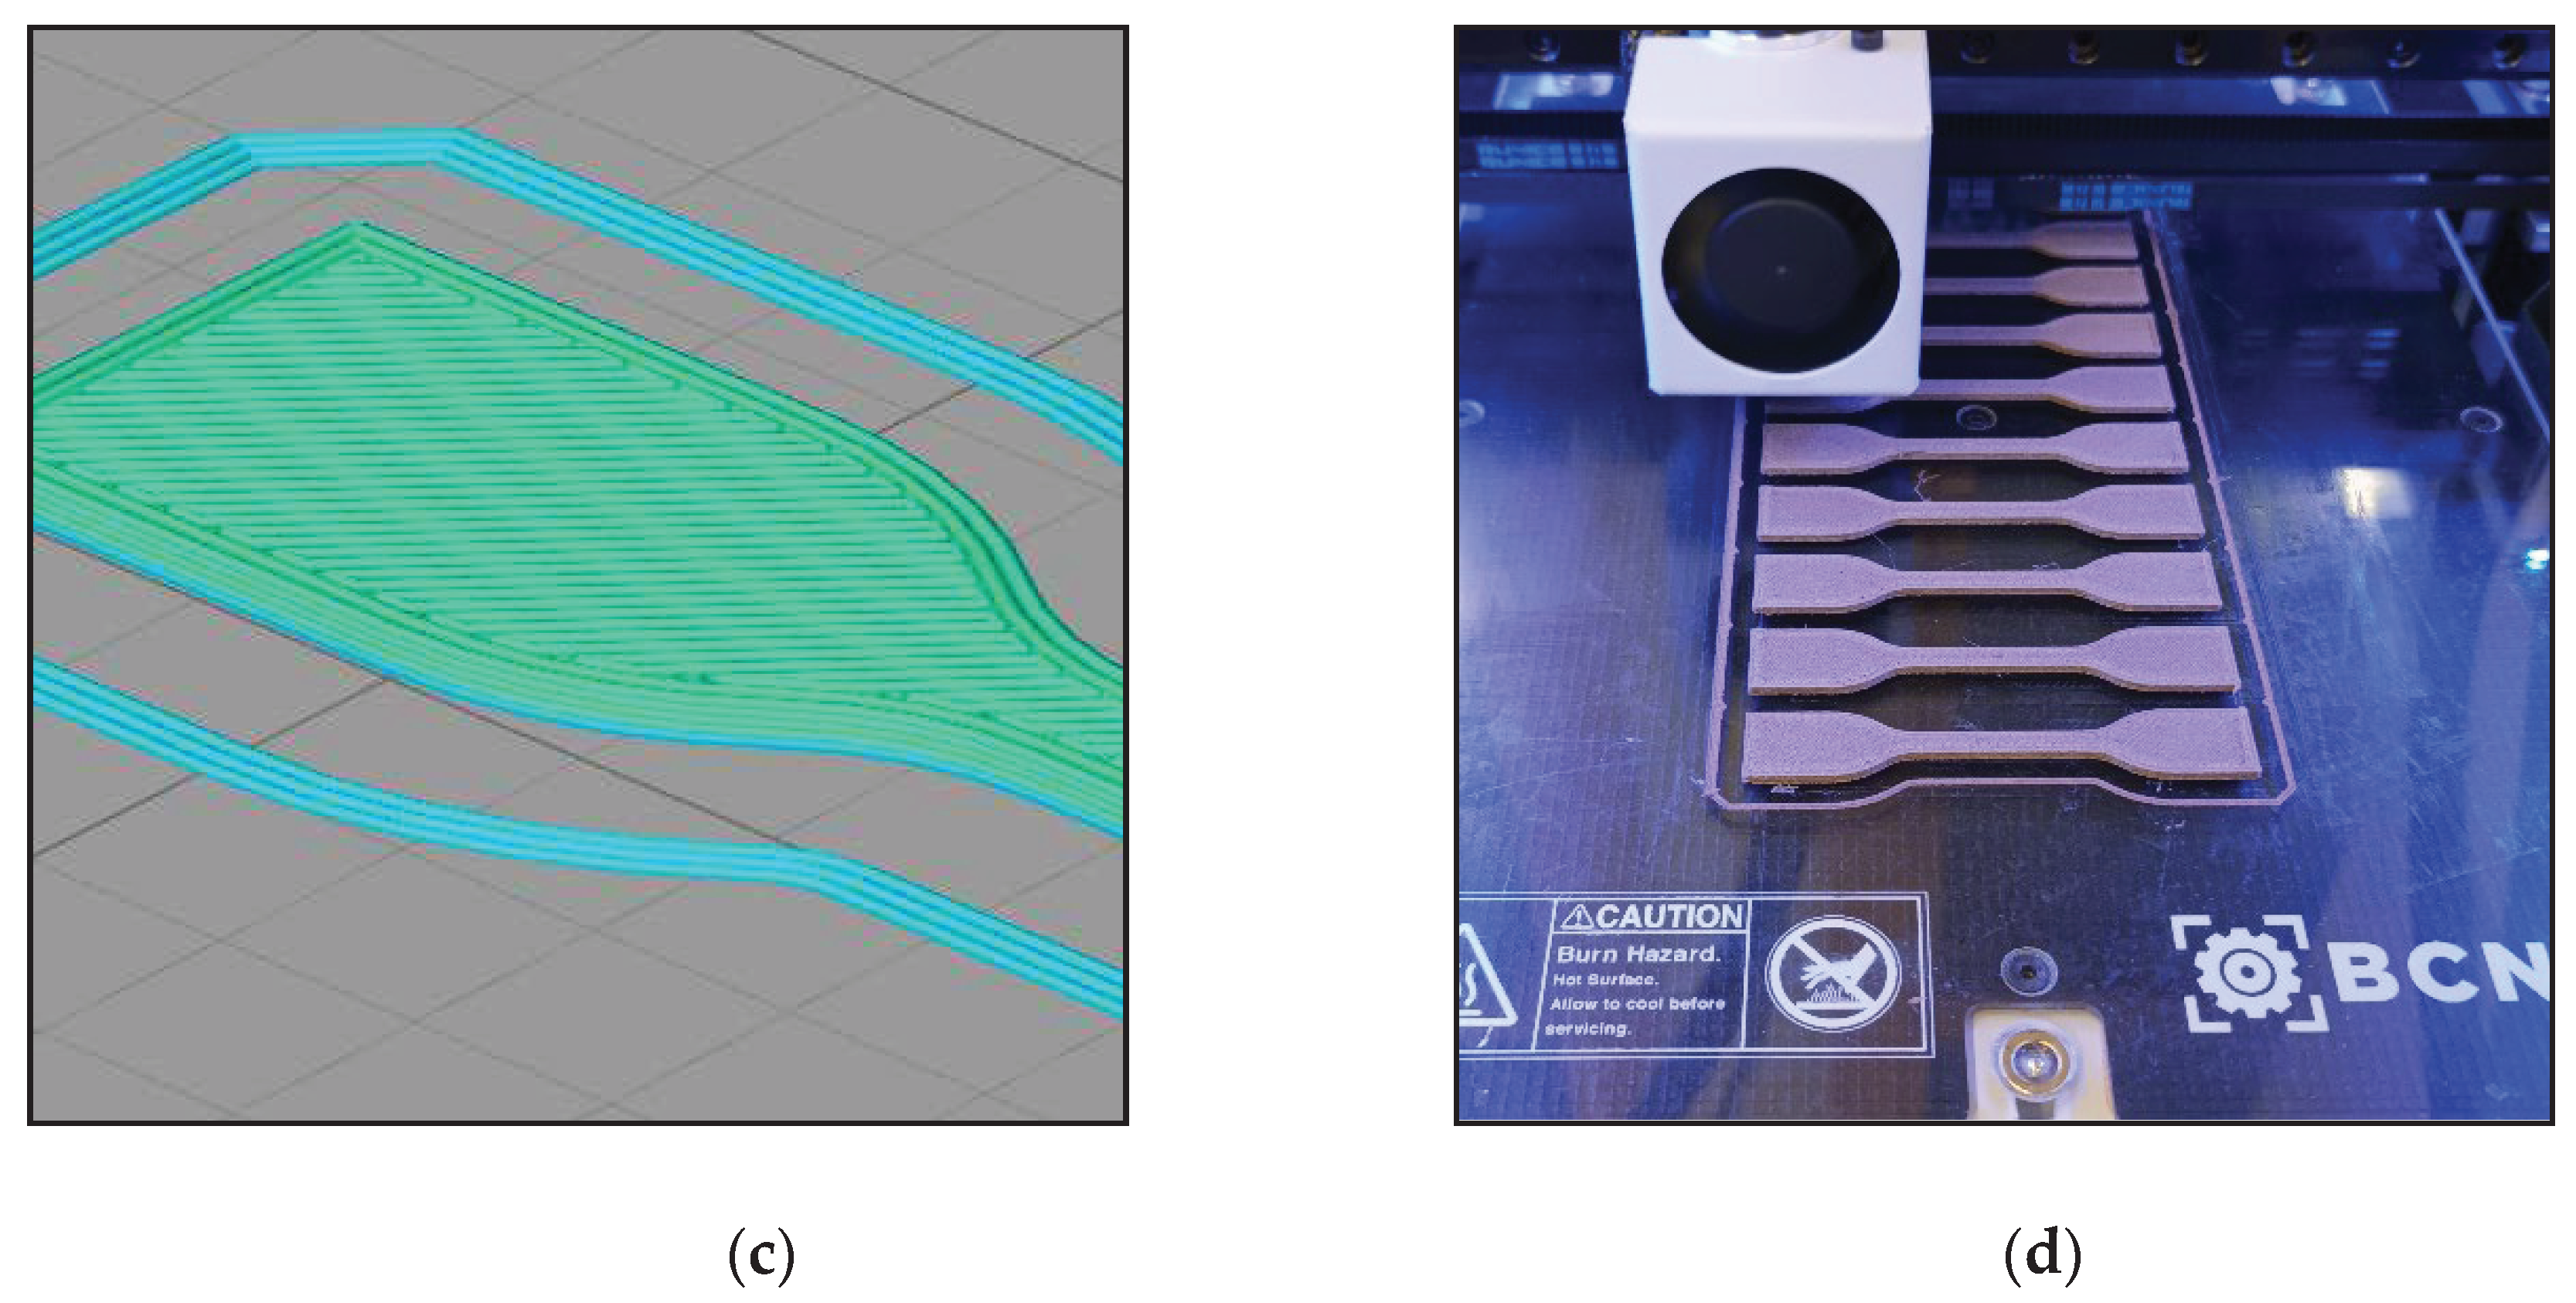
According to ISO standards (tensile test – ISO 527/2-5A, flexural test – ISO 14125 and impact test – ISO 179-1), the dog-bone and the rectangular shaped bars with standard dimensions were designed using SolidWorks software. The files were exported as STL files which were then imported to slicing software, Simplify 3D. The Simplify 3D parametrization software was used to generate the G-Code for 3D printing. 3D printing of tensile, flexural and impact test specimens was done by fused deposition modelling with the help of BCN3D Sigma technologies dual extruder 3D printer. The characteristics of a 3D printed component depend on the proper selection of the print settings, as this influences the component’s surface quality and mechanical properties [
8]. All filaments were extruded through a 0.4 mm extruder, See
Figure 1.
3D printing of PLA was done at a temperature of 200 ℃ using two different layer thicknesses (0.2 mm and 0.3 mm). The bed temperature was maintained at 60 ℃, percentage infill was 100% and the print speed was 3000 mm/minute. ABS was printed with same layer thicknesses (0.2 mm and 0.3 mm) at a temperature of 250 ℃. The bed temperature was 80 ℃ while the percentage infill was 100% and the print speed was 3000 mm/minute. Wood/PLA composites were printed with same layer thicknesses of 0.2 and 0.3 mm. The print temperature of 210 ℃, the bed temperature of 50 ℃ and the print speed of 3000 mm/minute were maintained. The print settings for all specimens have been summarized in
Table 1.
2.2.2. Injection Molding
All the pellets were dried in a drying oven before injection molding. ABS pellets were dried at 80℃ for 4 hours and PLA and wood/PLA pellets were dried at 60℃ for 12 hours. Pellets produced from the filaments were injection molded using Haake™ Minijet Pro Piston injection molding system (Thermo Fisher Scientific GmbH, Germany). For PLA, the polymer melt was injected at a temperature of 195℃ and a pressure of 550 bar and the mold temperature was set to 25℃. ABS melt was injected at a temperature of 230℃ and a pressure of 600 bars, whereas the mold was set at a temperature of 60℃. Wood/PLA composite was melt injected at a temperature of 195℃ and a pressure of 600 bars while the mold was set at a temperature of 29℃. Two types of specimens were manufactured, namely the dog-bone tensile test bars according to ISO 527/2-5A and the rectangular test bars for flexural (ISO 14125, 80×10×4 mm) and impact (ISO 179-1, 80×10×4 mm) testing.
2.3. Charaterization
2.3.1. Water Absorption Test
Gravimetric water absorption tests on the specimens from 3D printing and injection molding were carried out by fully immersing the specimens in water to study the influence of manufacturing methods on hydrolytic and dimensional stability of the specimens. All the specimens were dried in a drying oven and the dry weight of the specimens (Wi) were noted before immersing in the distilled water at room temperature and pressure. The water absorption of the specimens was followed for 7 days by measuring the specimens’ weight every day. The final was noted as Wf for each specimen and the percentage water absorption (WA%) was calculated, see Equation 1. The specimens were taken out and carefully dried the surface before weighing. Thicknesses of the specimens after water absorption were also measured to determine the dimensional stability of the specimens. At least fifteen measurements were taken for each specimen and the average is reported.
2.3.2. Mechanical Tests
Tensile and flexural testing of the specimens were conducted using Tinius Olsen H10KT Elastocon multipurpose testing machine and the data was analyzed using Horizon software. The machine was used to measure tensile strength, tensile modulus, elongation at fracture, flexural strength, and flexural modulus of the materials. The tensile and flexural tests of the materials were done according to ISO 527-1 [9, 10] and ISO 178 [11] standards respectively. The tensile tests were performed by using 1 kN load cell and a 40 mm extensometer at a test speed of 5 mm/minute. At least five measurements were taken for each specimen and the average is reported. Three-point flexural tests for all specimens were performed using a 250 N load cell and the support had a span length of 64 mm. The test speed for these tests was initially 1 mm/minute and reached a speed of 10 mm/minute when the strain was at 0.4%. The tests were performed according to well-accepted standards [12].
The impact strength of a specimen is the amount of sudden energy it absorbs before fracture [13]. The Charpy impact strength of the materials was determined by using COMTECH impact testing machine according to ISO 179-1 [14]. The flat and un-notched specimens were tested both flatwise and endwise. A software, Meteorite, was used for the data analysis to obtain the impact energies of the specimens. The final value for the impact strength obtained is the mean value of five independent measurements.
Dynamic Mechanical Analysis (DMA) was carried out in a dual cantilever bending mode using DMA Q800 TA instrument. The specimens had dimensions 50×10×3.2 mm. The tests were run at frequency of 1 Hz and an amplitude of 15 μm. The temperature range was between 30 and 150 ℃. The heating rate for all specimens was 3 ℃/minute. Storage modulus which measures the energy the material stores, loss modulus which measures the dissipated energy and tan delta which is the ratio of loss modulus to storage modulus were recorded [15].
2.3.3. Thermal Analysis
Thermal analysis was carried out on the specimens by two different techniques: Differential Scanning Calorimetry (DSC) and Thermogravimetric Analysis (TGA). Differential Scanning Calorimetry was conducted using DSC Q2000 TA instrument. The DSC was done to analyze the melting, the crystallization, and the glass transition temperatures of the polymers according to ISO 11357-1 standard. Specimens that weighed 5-10 mg were cut from PLA, ABS and wood/PLA dog-bones and were used for testing. All specimens underwent three thermal cycles: two heating cycles and one cooling cycle. The first heating run was done to erase the thermal history and this run was performed in the dynamic mode from 30 ℃ to 230 ℃ at a rate of 10 ℃/minute. The specimens were then cooled down to 30 ℃ during the second run at 10 ℃/minute. The second heating run was performed at a heating rate of 10 ℃/minute from 30 ℃ to 230 ℃. The melting temperature (Tm), crystallization temperature (Tc) and glass transition temperature (Tg) of the specimens were determined from the second and the third scans. Thermogravimetric analysis (TGA) was performed using TGA Q800 TA instruments to determine the thermal stability of the specimens. 10-20 mg were cut from the specimens and were heated form 30 ℃ to 600 ℃ at a heating rate of 10 ℃/minute. The tests were performed according to well-accepted standards [16].
DMA was used to measure glass transition temperatures from onset and peaks of three different curves; storage modulus, loss modulus and tan delta curves.
2.3.4. Microscopic Analysis
The specimens’ dimensions and their internal structure were examined using Nikon polarized microscope (ECLIPSE, LV100ND POL/DS) at a magnification of 2.5x. The standard configuration involved setting the parameters to transmission darkfield with crossed polarizers. The morphology of the cracks which were developed after the mechanical test on the samples were also studied in detail using the optical microscope.
3. Results
3.1. Water Absorption Test
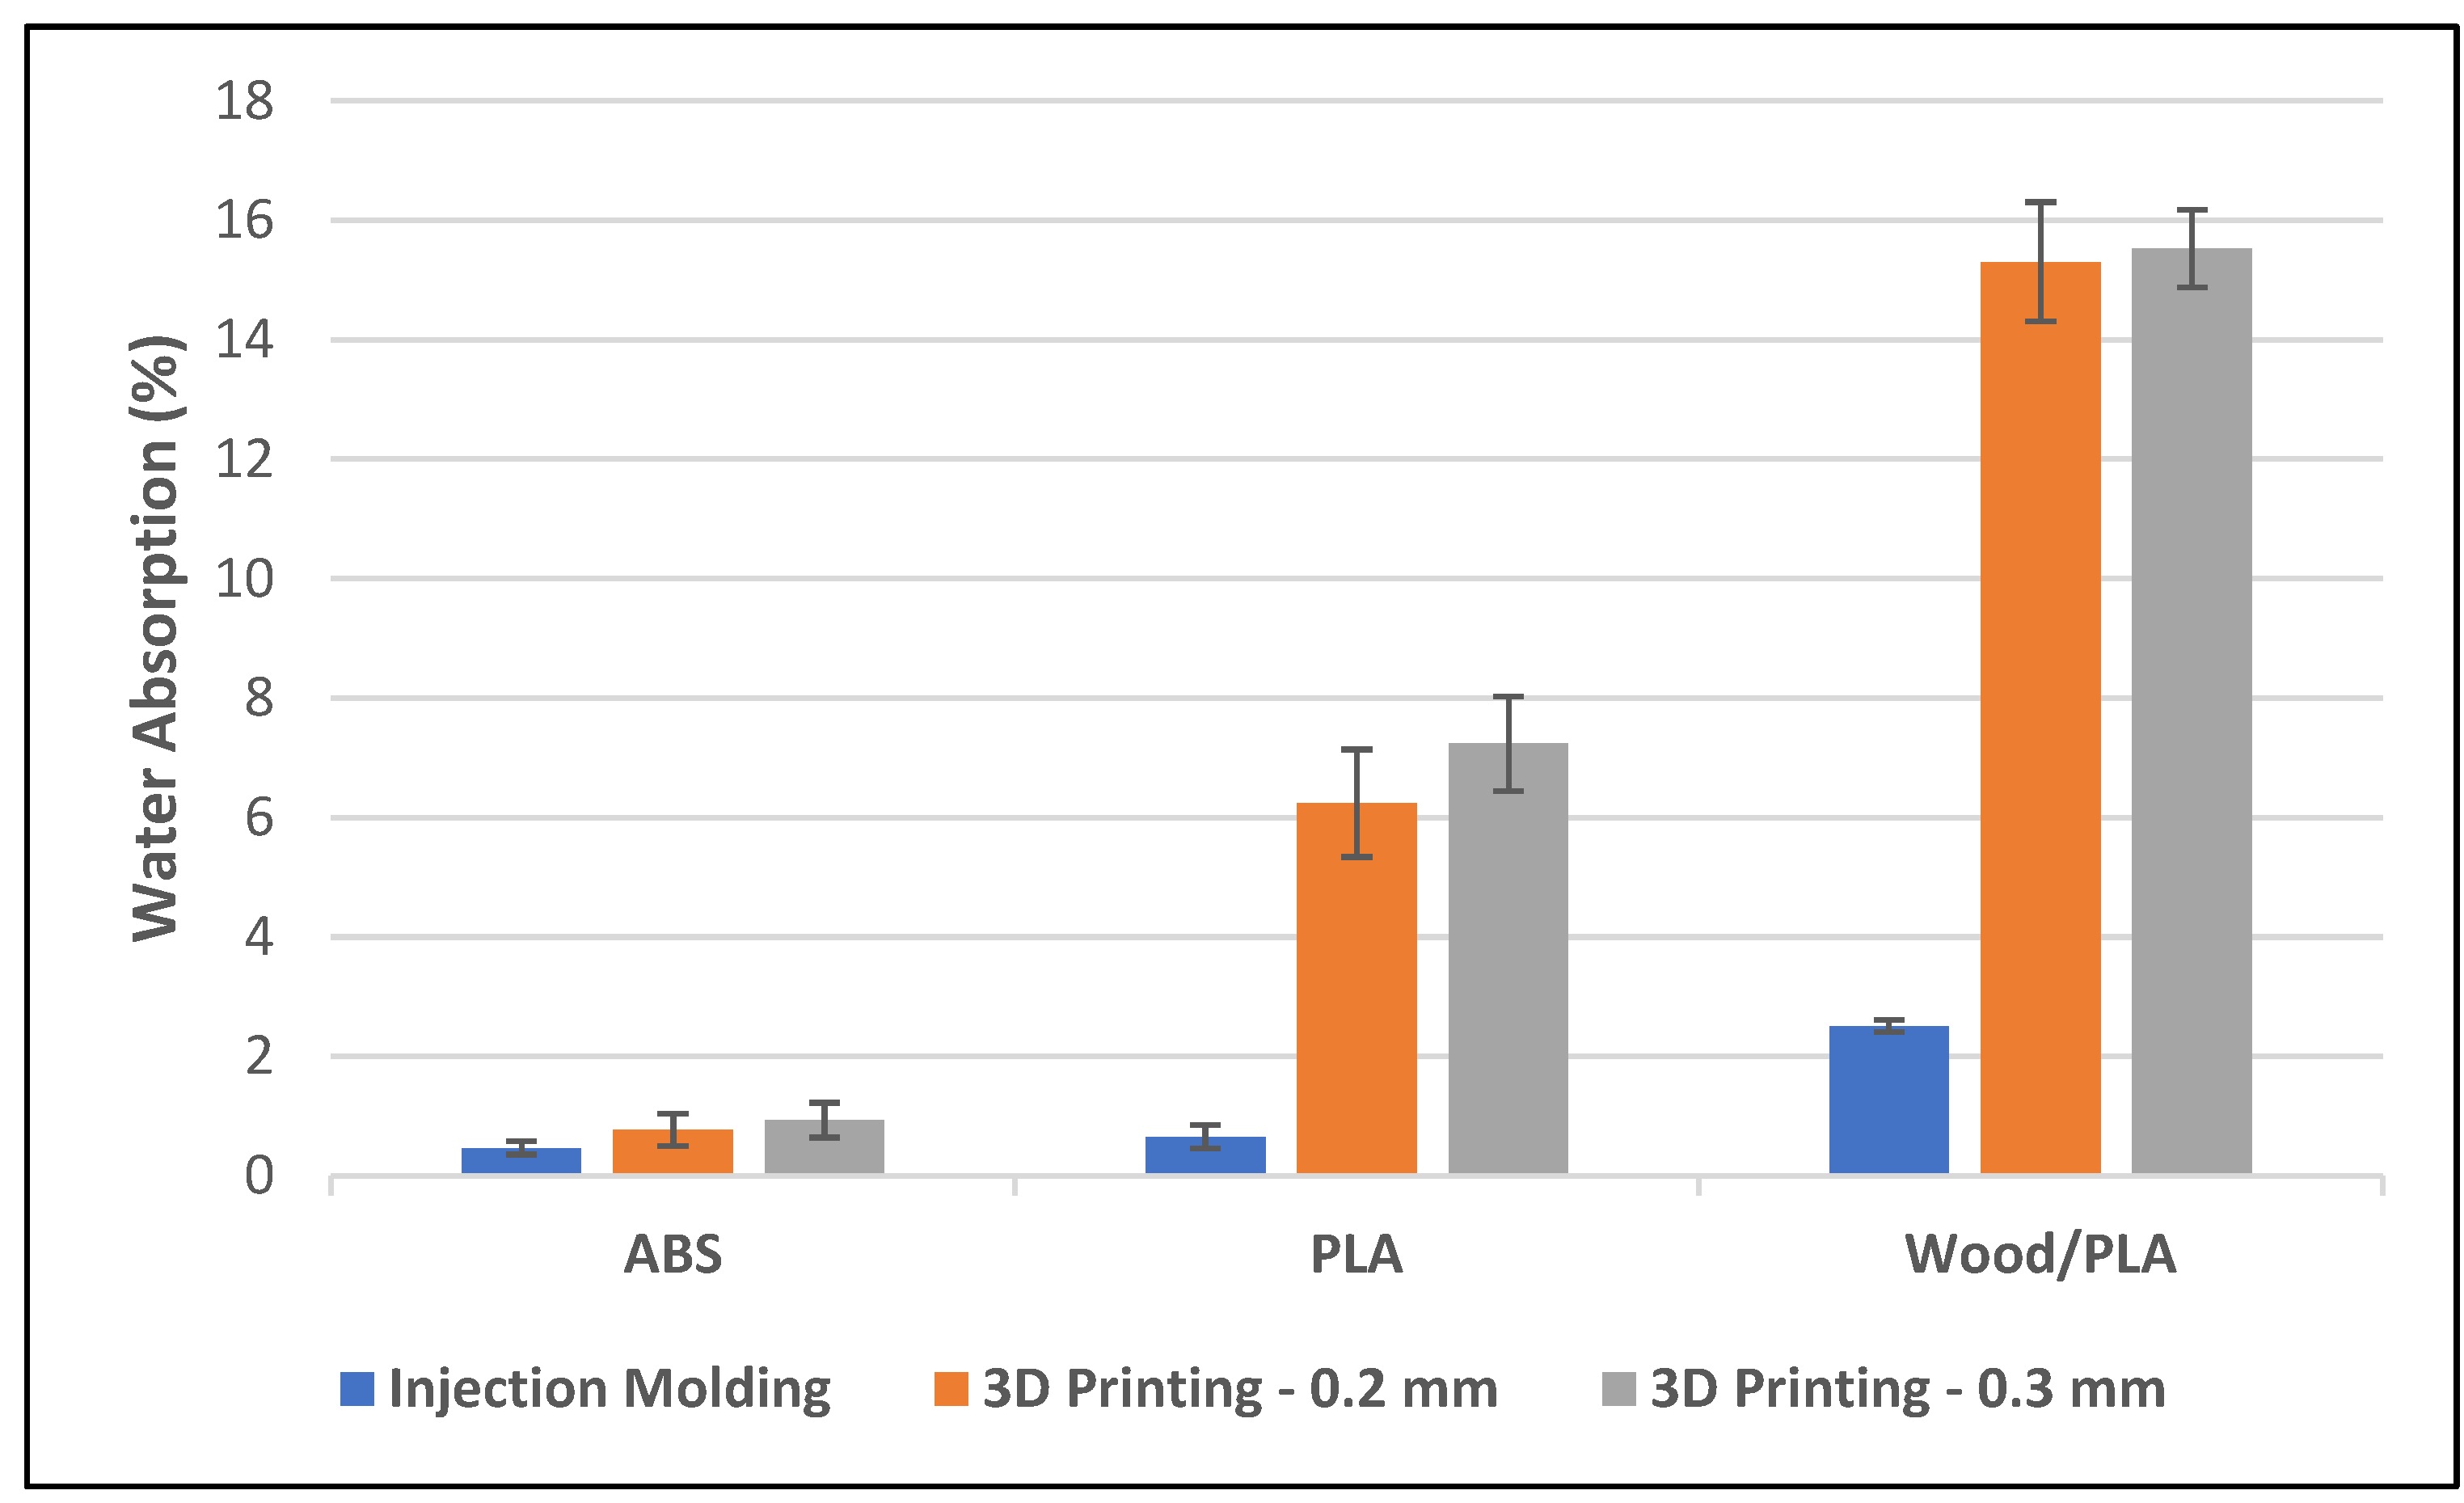
The water absorption test demonstrated the influence of manufacturing methods on water absorption of PLA, ABS and wood/PLA composite. It was noticed that the manufacturing method used to produce the samples affected the water absorption and weight increase, see
Figure 2. The injection molded samples showed a lower weight increase; for instance, injection molded PLA specimens had an average weight increase of 0.6% and the 3D printed PLA specimens had an average weight increase of 7.2%. This substantial increase in weight in 3D printed specimens is due to the high level of porosity that has been induced during 3D printing. The impact of manufacturing methods was more pronounced on wood/PLA composites. When using 3D printing instead of injection molding, the water absorption of wood/PLA specimens increased to 15% from about 2%. Even the more stable polymer, ABS, had a slight increase in water absorption demonstrating further the influence of manufacturing methods.
Increasing the layer thickness from 0.2 to 0.3 mm during 3D printing increased the water absorption. The increased water absorption can be attributed to the increased porosity within the specimens, caused by the increased printing layer thickness. The pores between the layers and the strands in the printed specimens increased on increased printing layer thickness, See
Figure 1a. Upon specimens’ immersion in water, these pores become filled with water, subsequently increasing the surface area available for water absorption into the polymer. Wood/PLA composites are more prone to these pores due to the exposure of hydrophilic wood flour present in the strands and the layers. Hydroxyl groups in the cellulose and hemicellulose readily absorb water as these groups make hydrogen bonds with water molecules. Increasing the surface thickness exposes more hydrophilic surface to the water molecules.
Moreover, the mechanical performance of the specimens that were immersed in water were compared with those of the dry samples, see
Section 3.2.
3.2. Mechanical Tests
The effect of manufacturing methods, printing layer thickness and water absorption on the mechanical properties of PLA, ABS and wood/PLA were analyzed. The results showed that the manufacturing method used significantly impacted the mechanical properties of PLA, ABS, and wood/PLA composite specimens. It was also noticed that the mechanical properties of the specimens which were immersed in water for seven days decreased. The printing layer thickness clearly affects the mechanical properties of the specimens.
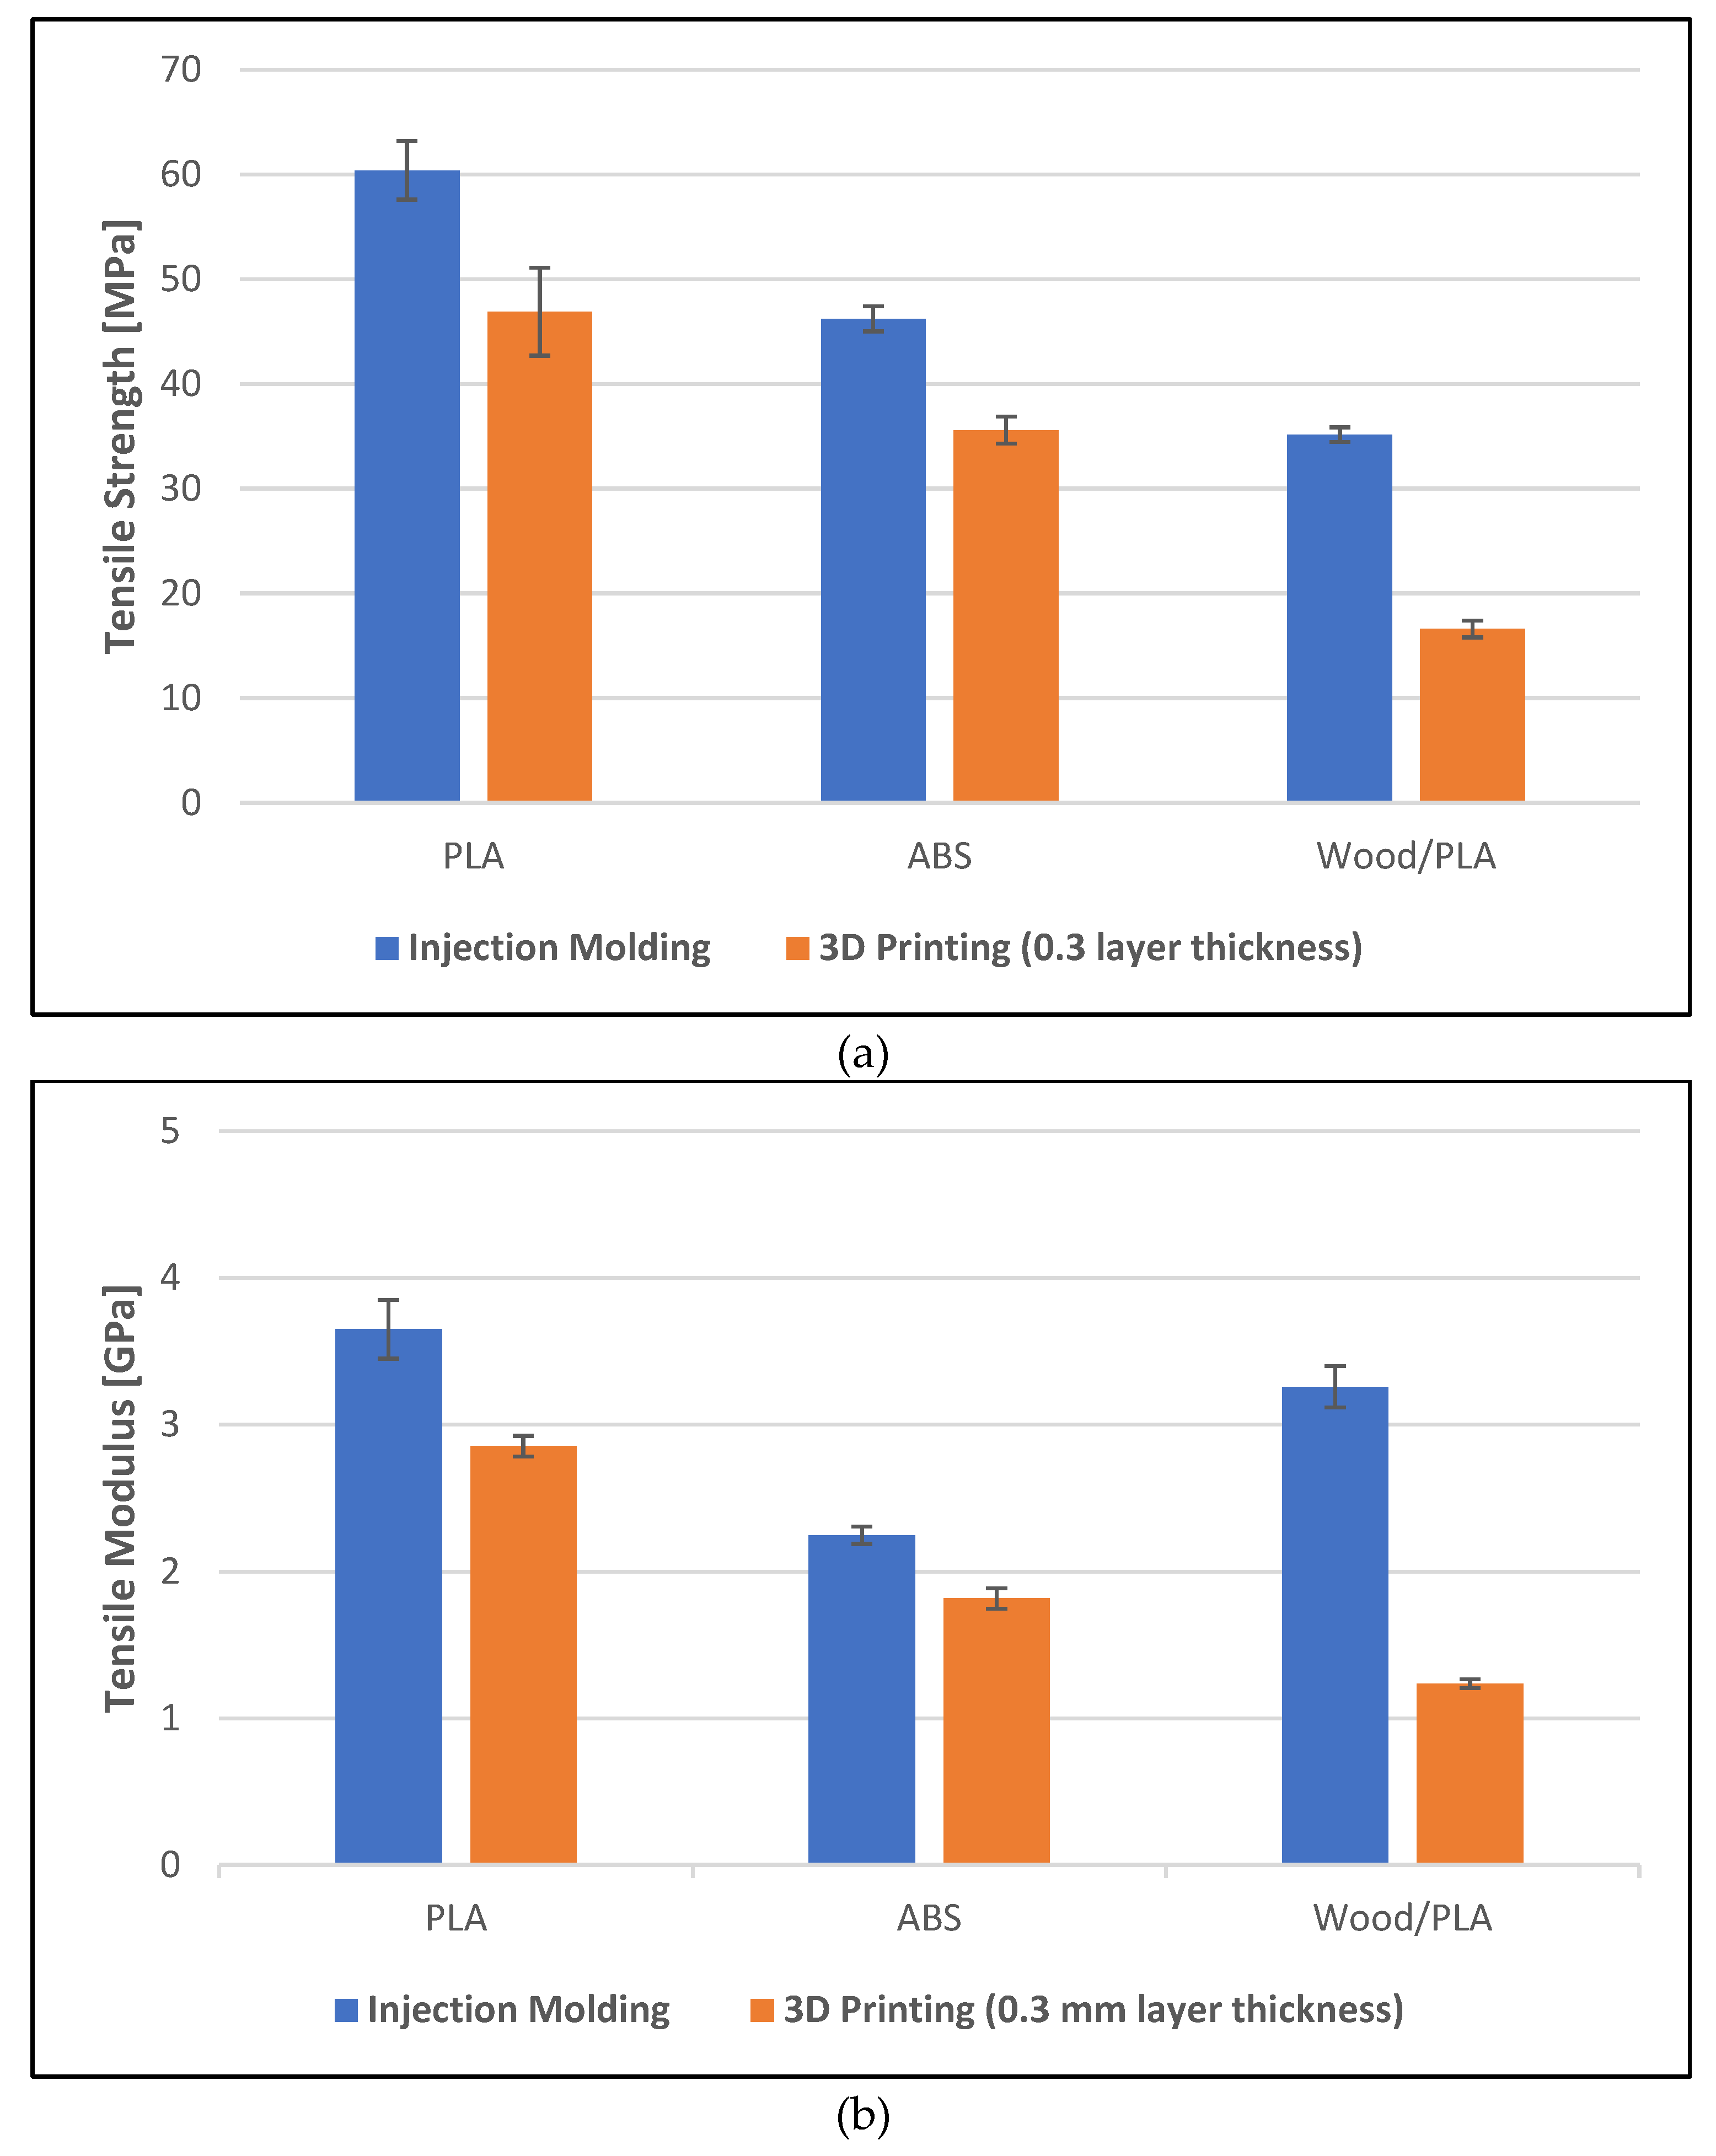
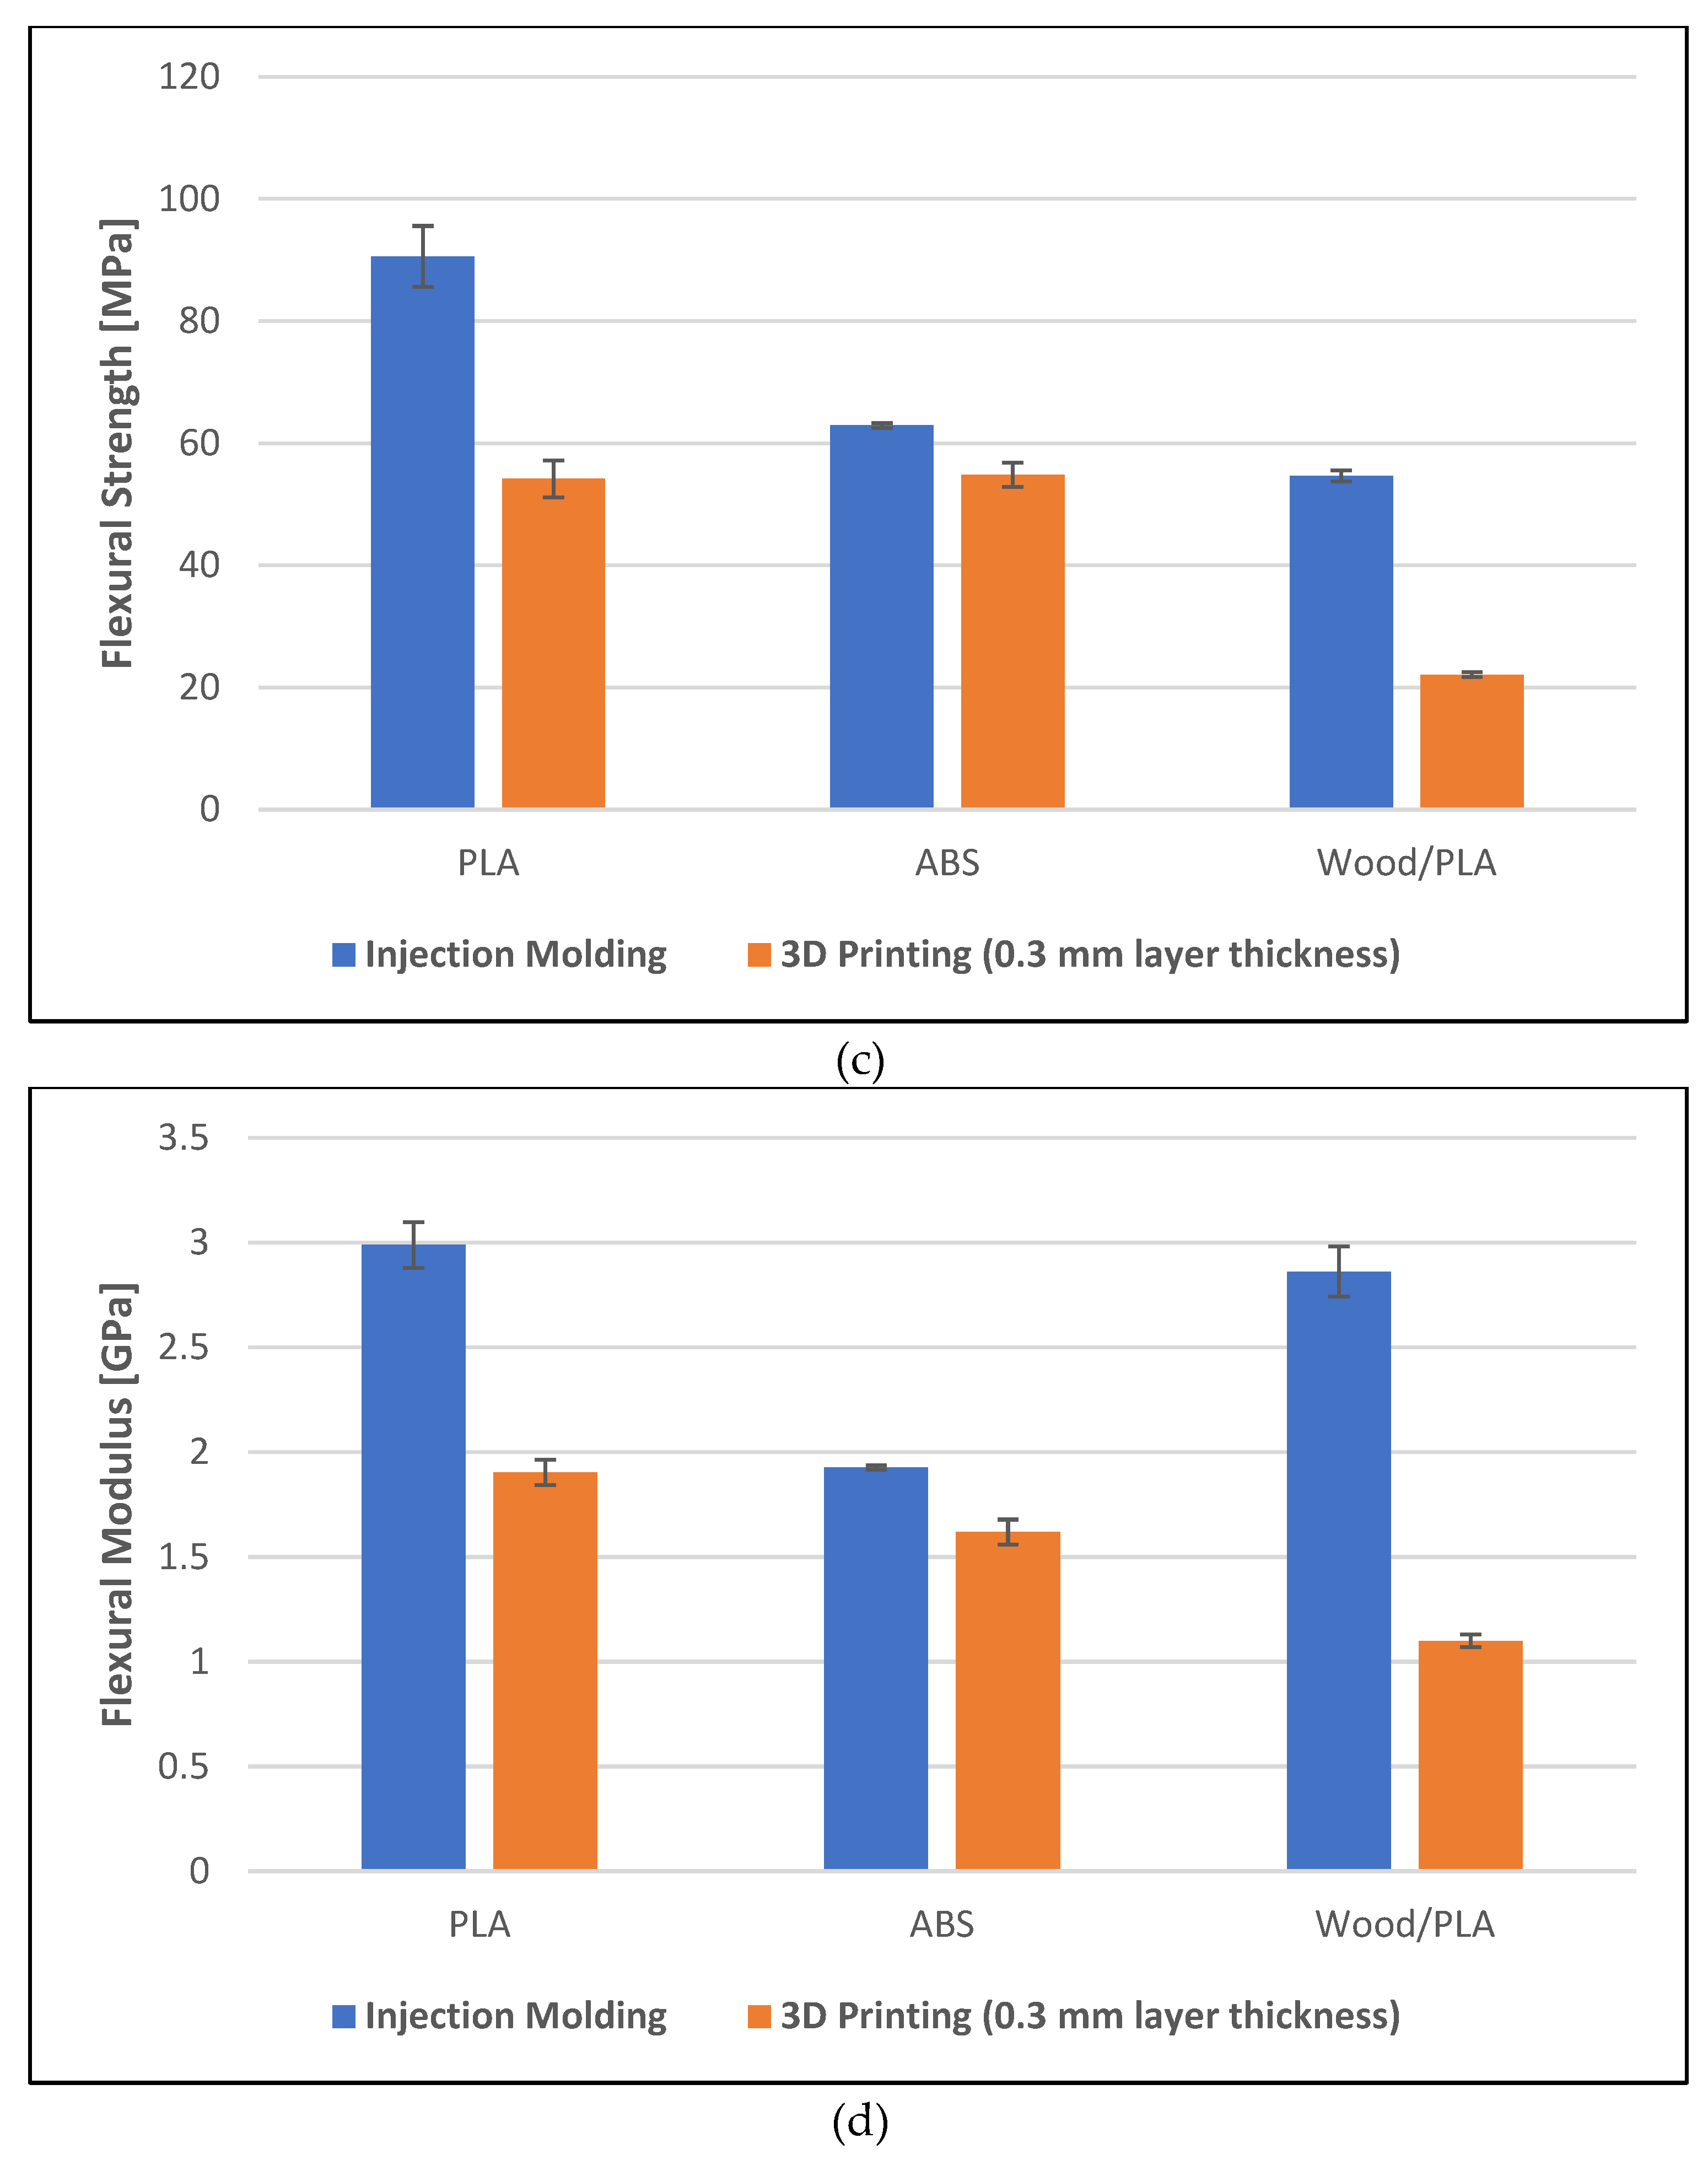
All specimens produced by injection moulding exhibited higher mechanical properties when compared to those of the 3D printed specimens of the same polymers, See
Figure 3. For example, the tensile strength of the injection molded PLA and 3D printed PLA of layer thickness 0.3 mm were 60 MPa and 46 GPa respectively. The tensile modulus of the injection molded and 3D printed (layer thickness 0.3 mm) wood/PLA were 3.2 GPa and 1.2 GPa respectively. Similarly, the flexural strength and the flexural modulus of the specimens were significantly affected by the manufacturing method, see
Figure 3c and 3d.
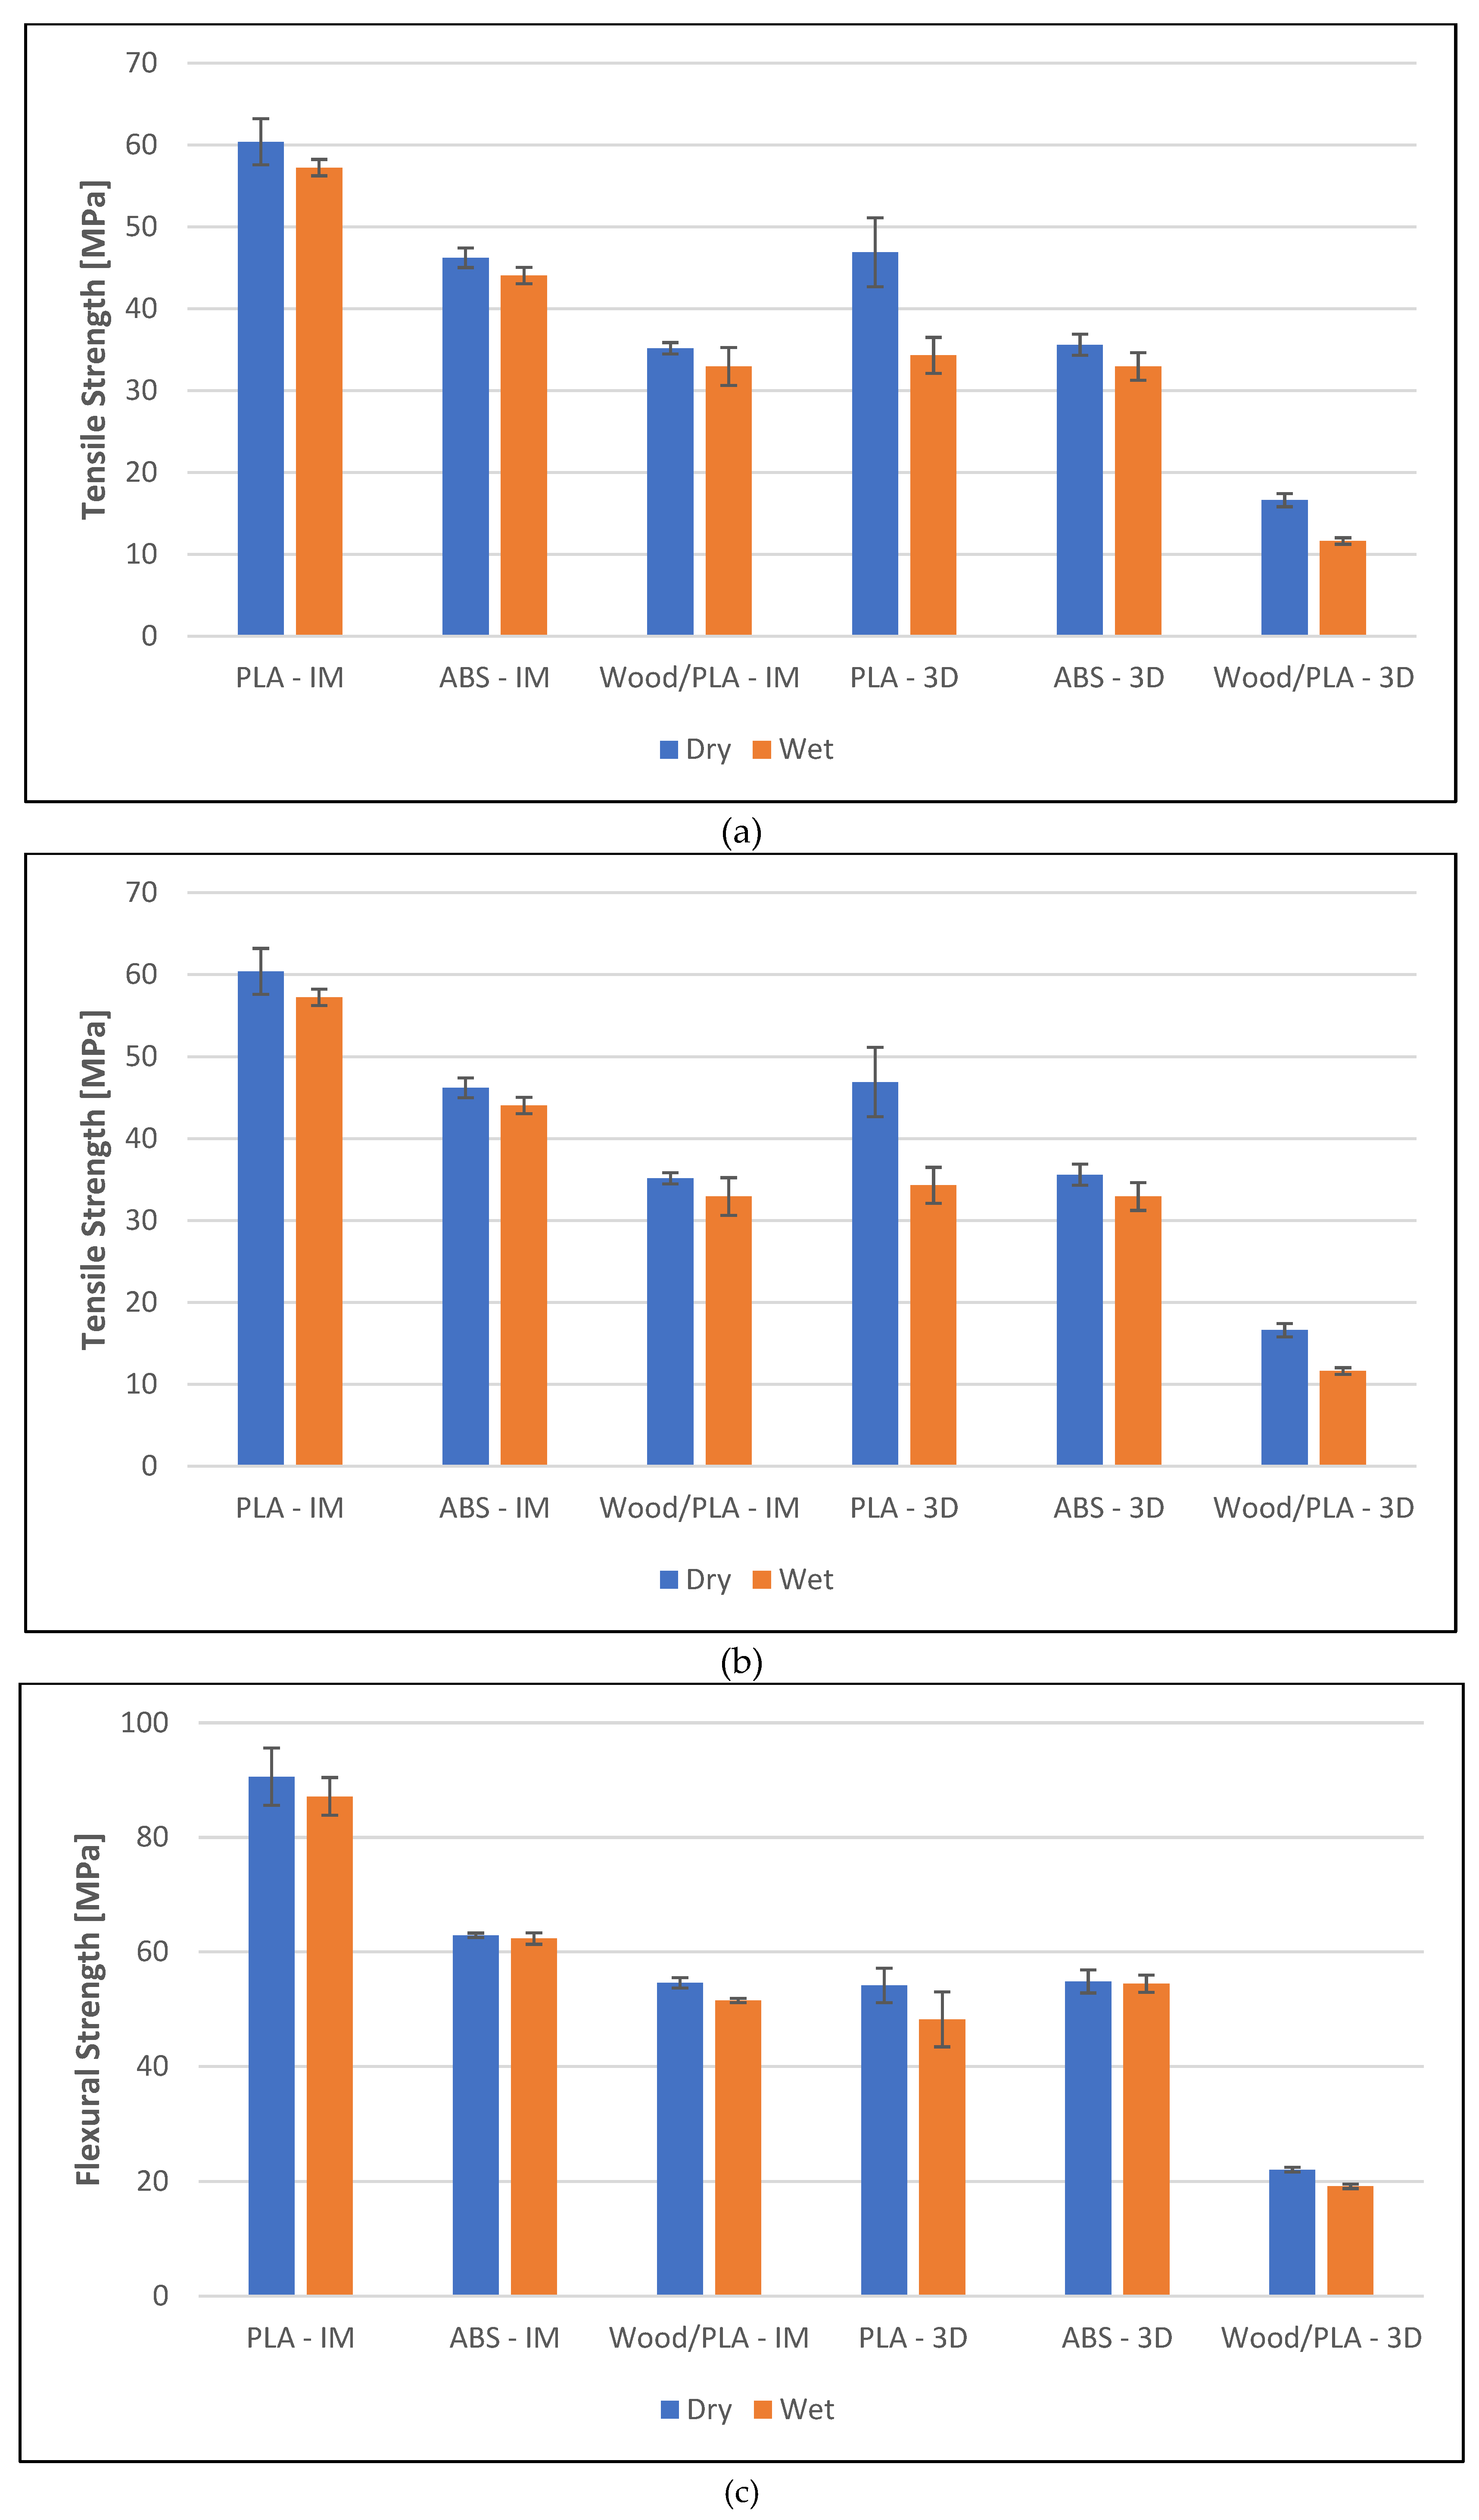
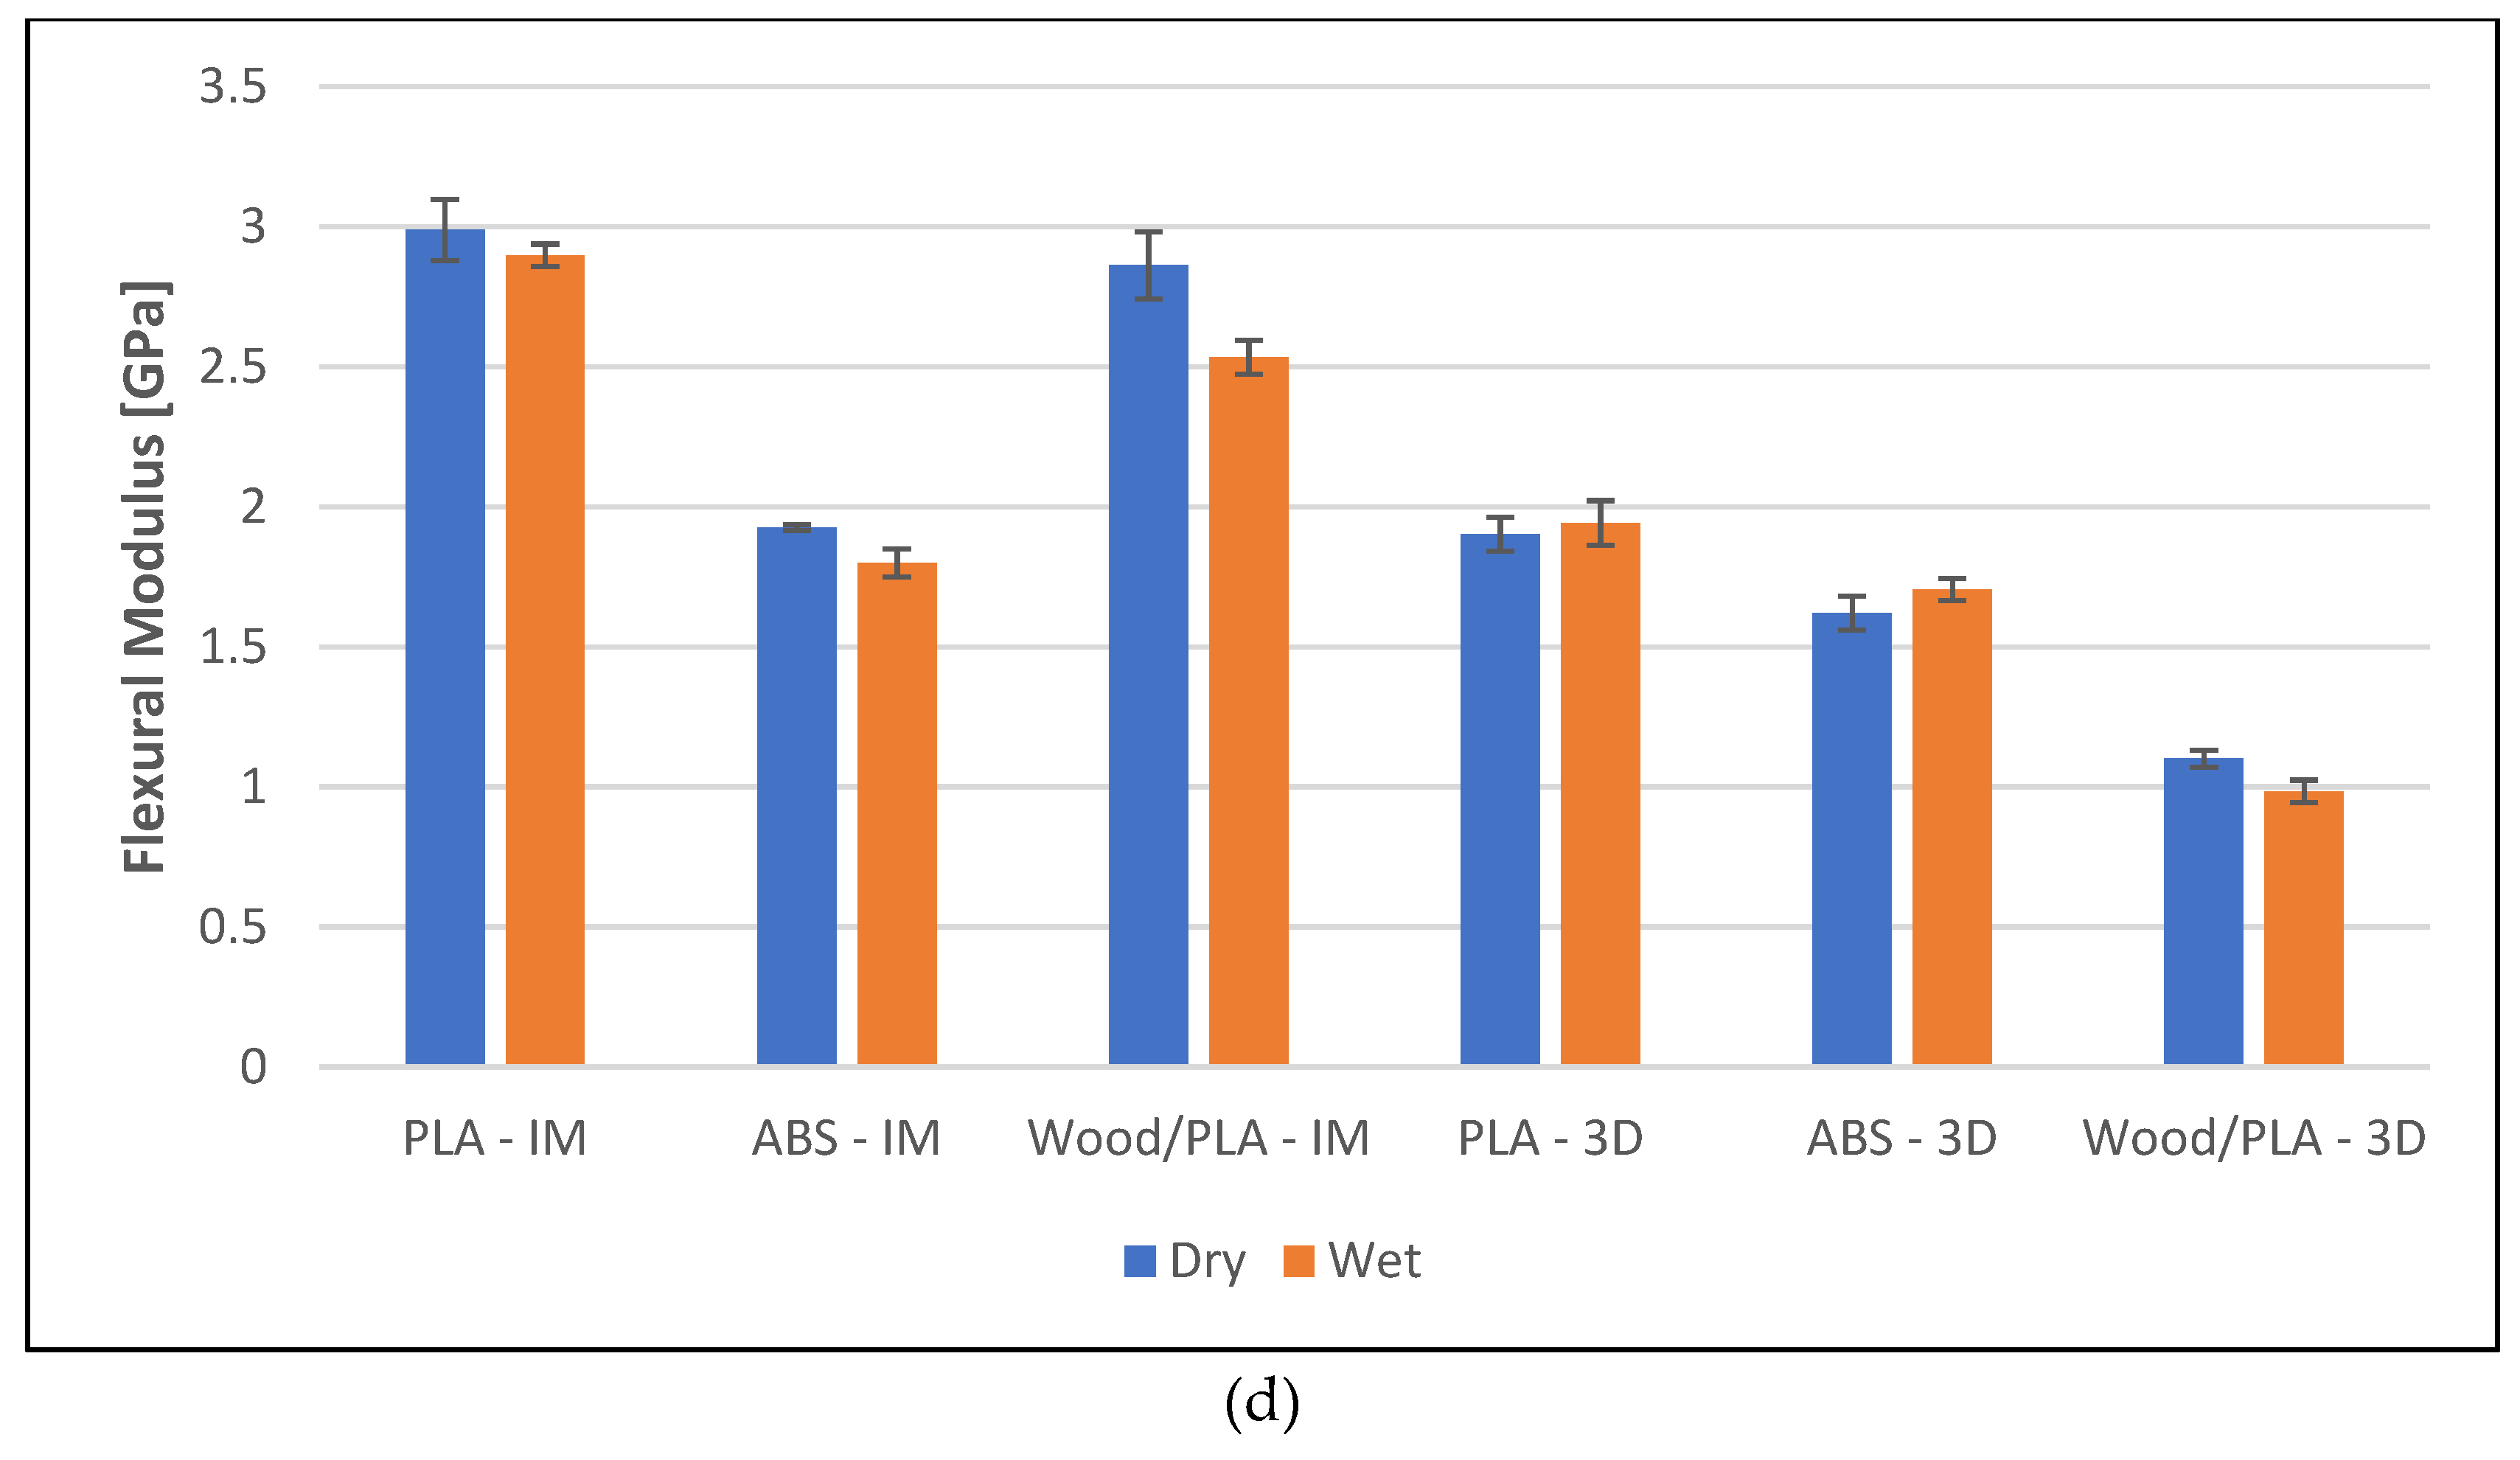
Water absorption negatively affected the mechanical properties of the specimens, See
Figure 4. However, the reduction in the tensile and flexural properties was not substantial. The limitation on the decrease of the strength and the modulus was a result of fairly stable polymers and the specimens being immersed in water for a short duration. Nevertheless, it is well known that the ageing process involving higher temperature and humidity severely affects the mechanical properties of PLA and its composites [17]. The discussion on the ageing process falls beyond the scope of this work’s focus. The results show that the manufacturing method amplifies the reduction in the mechanical properties.
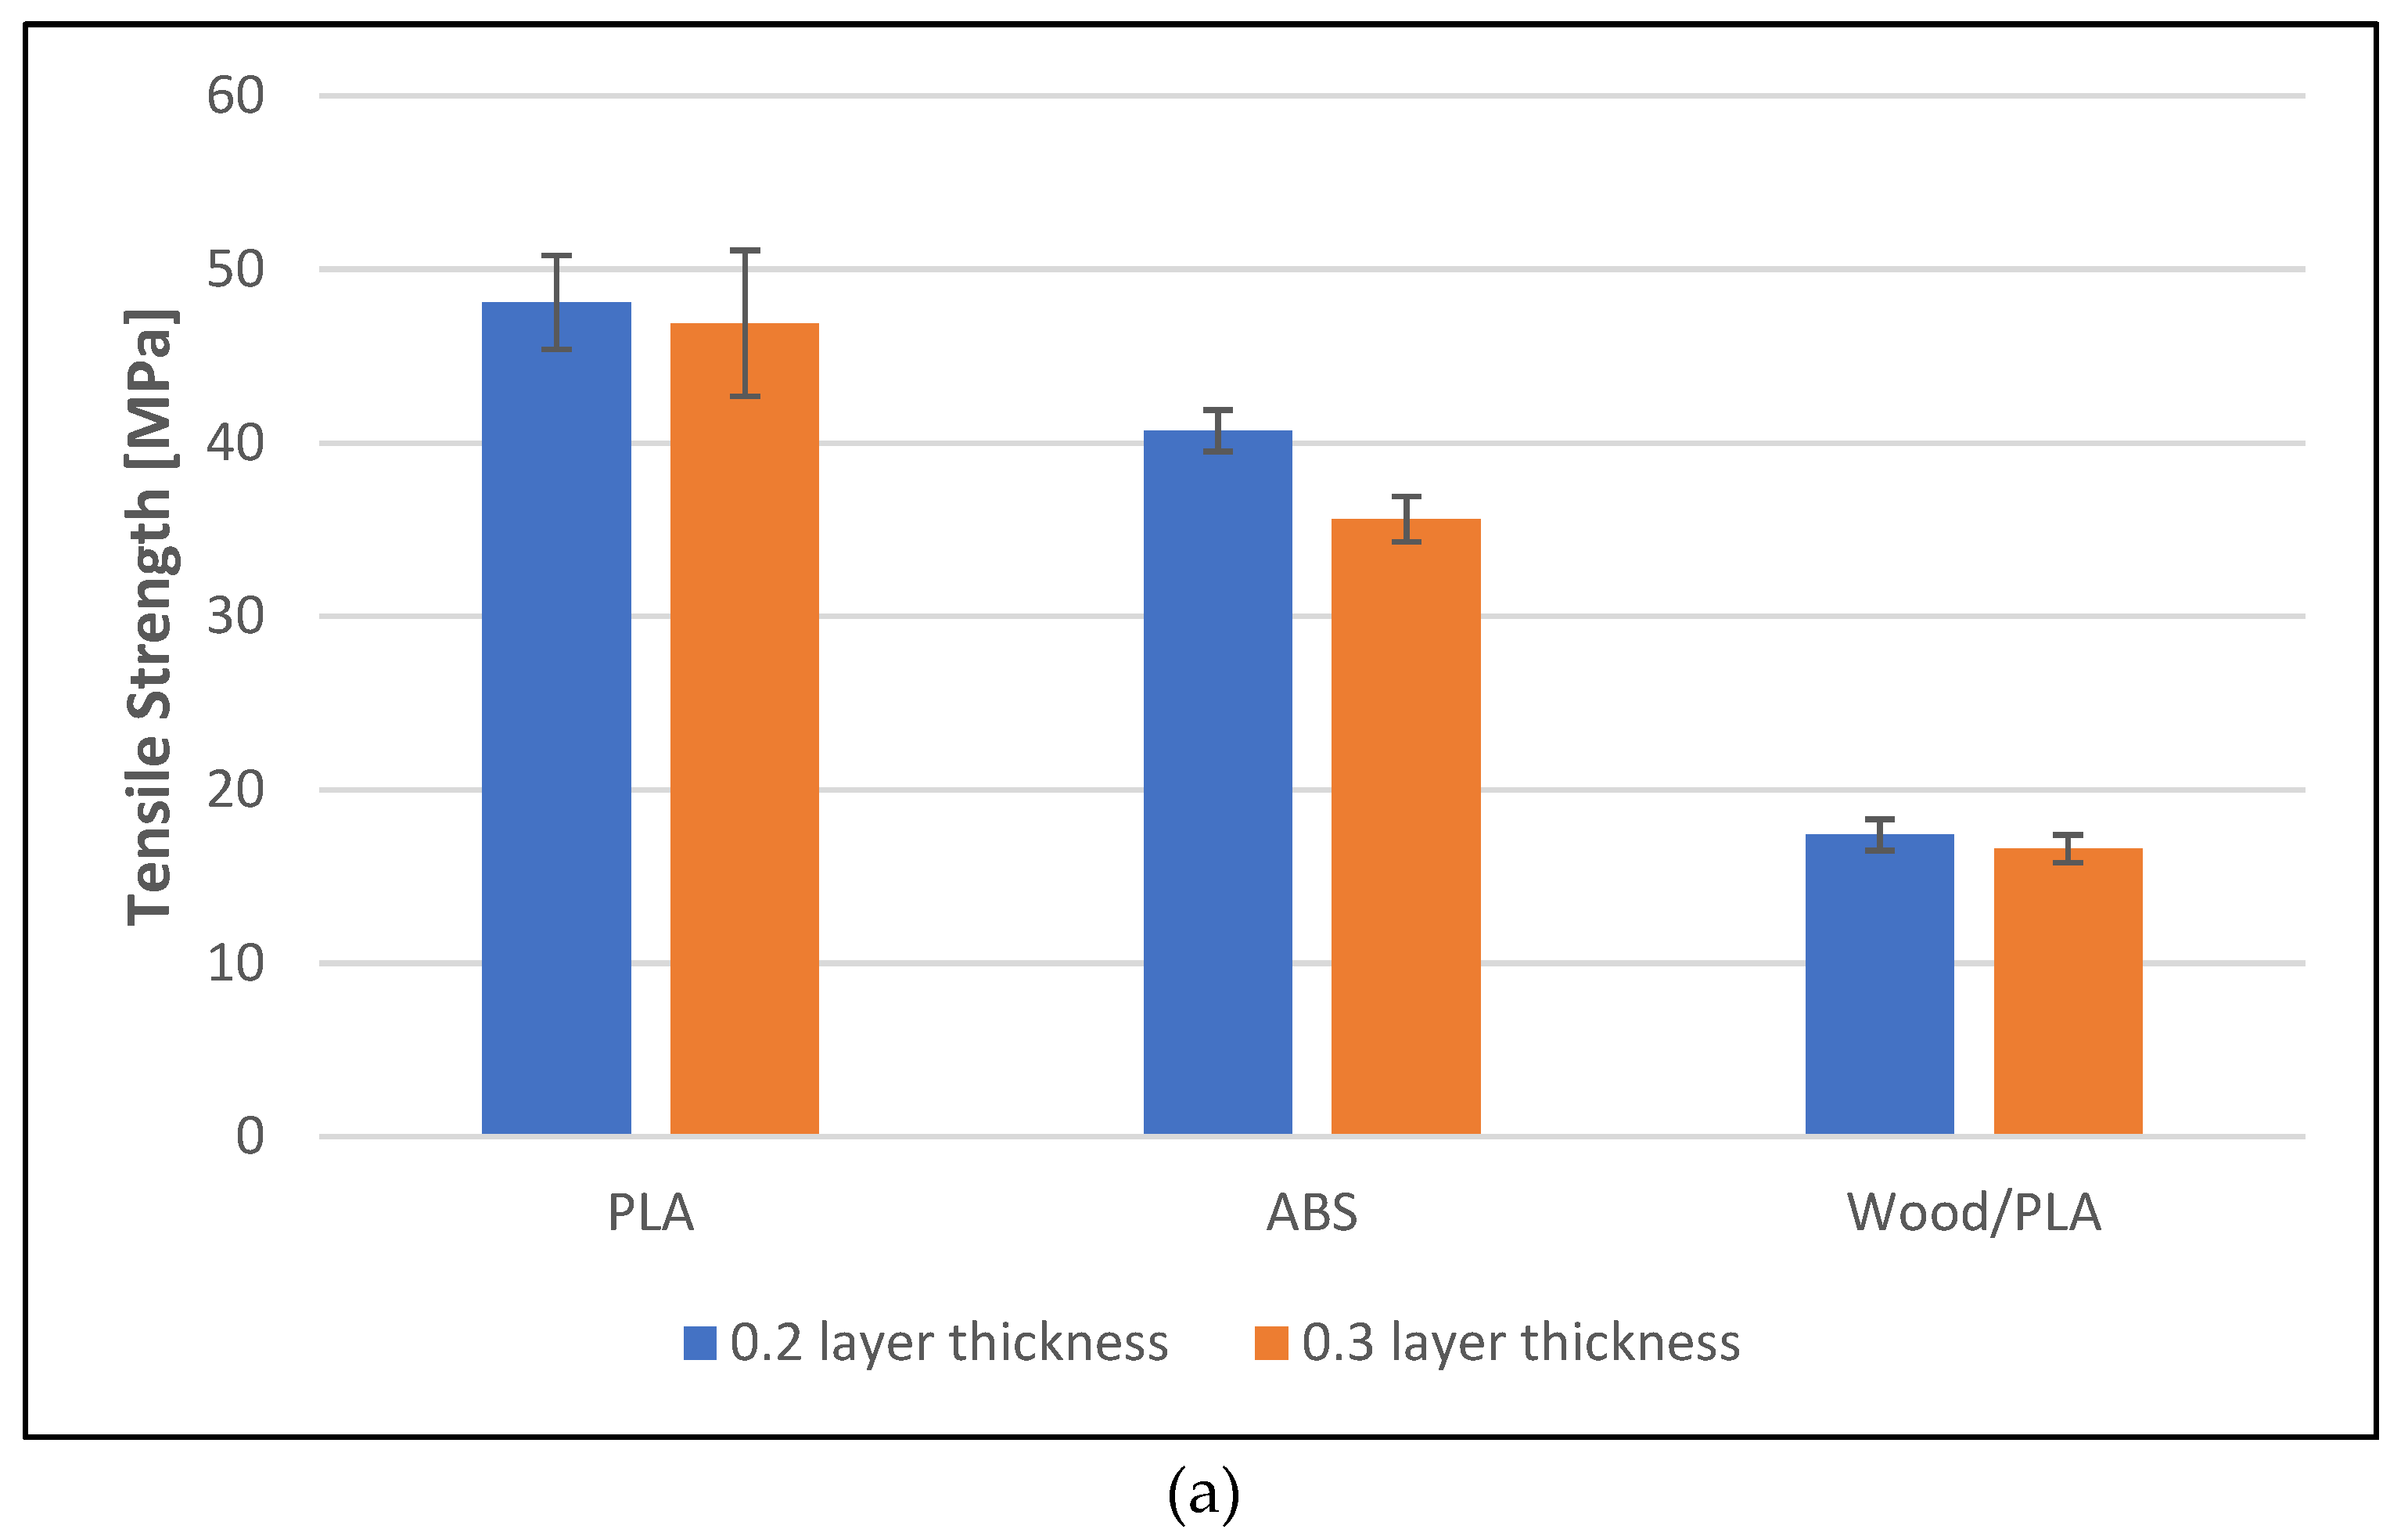
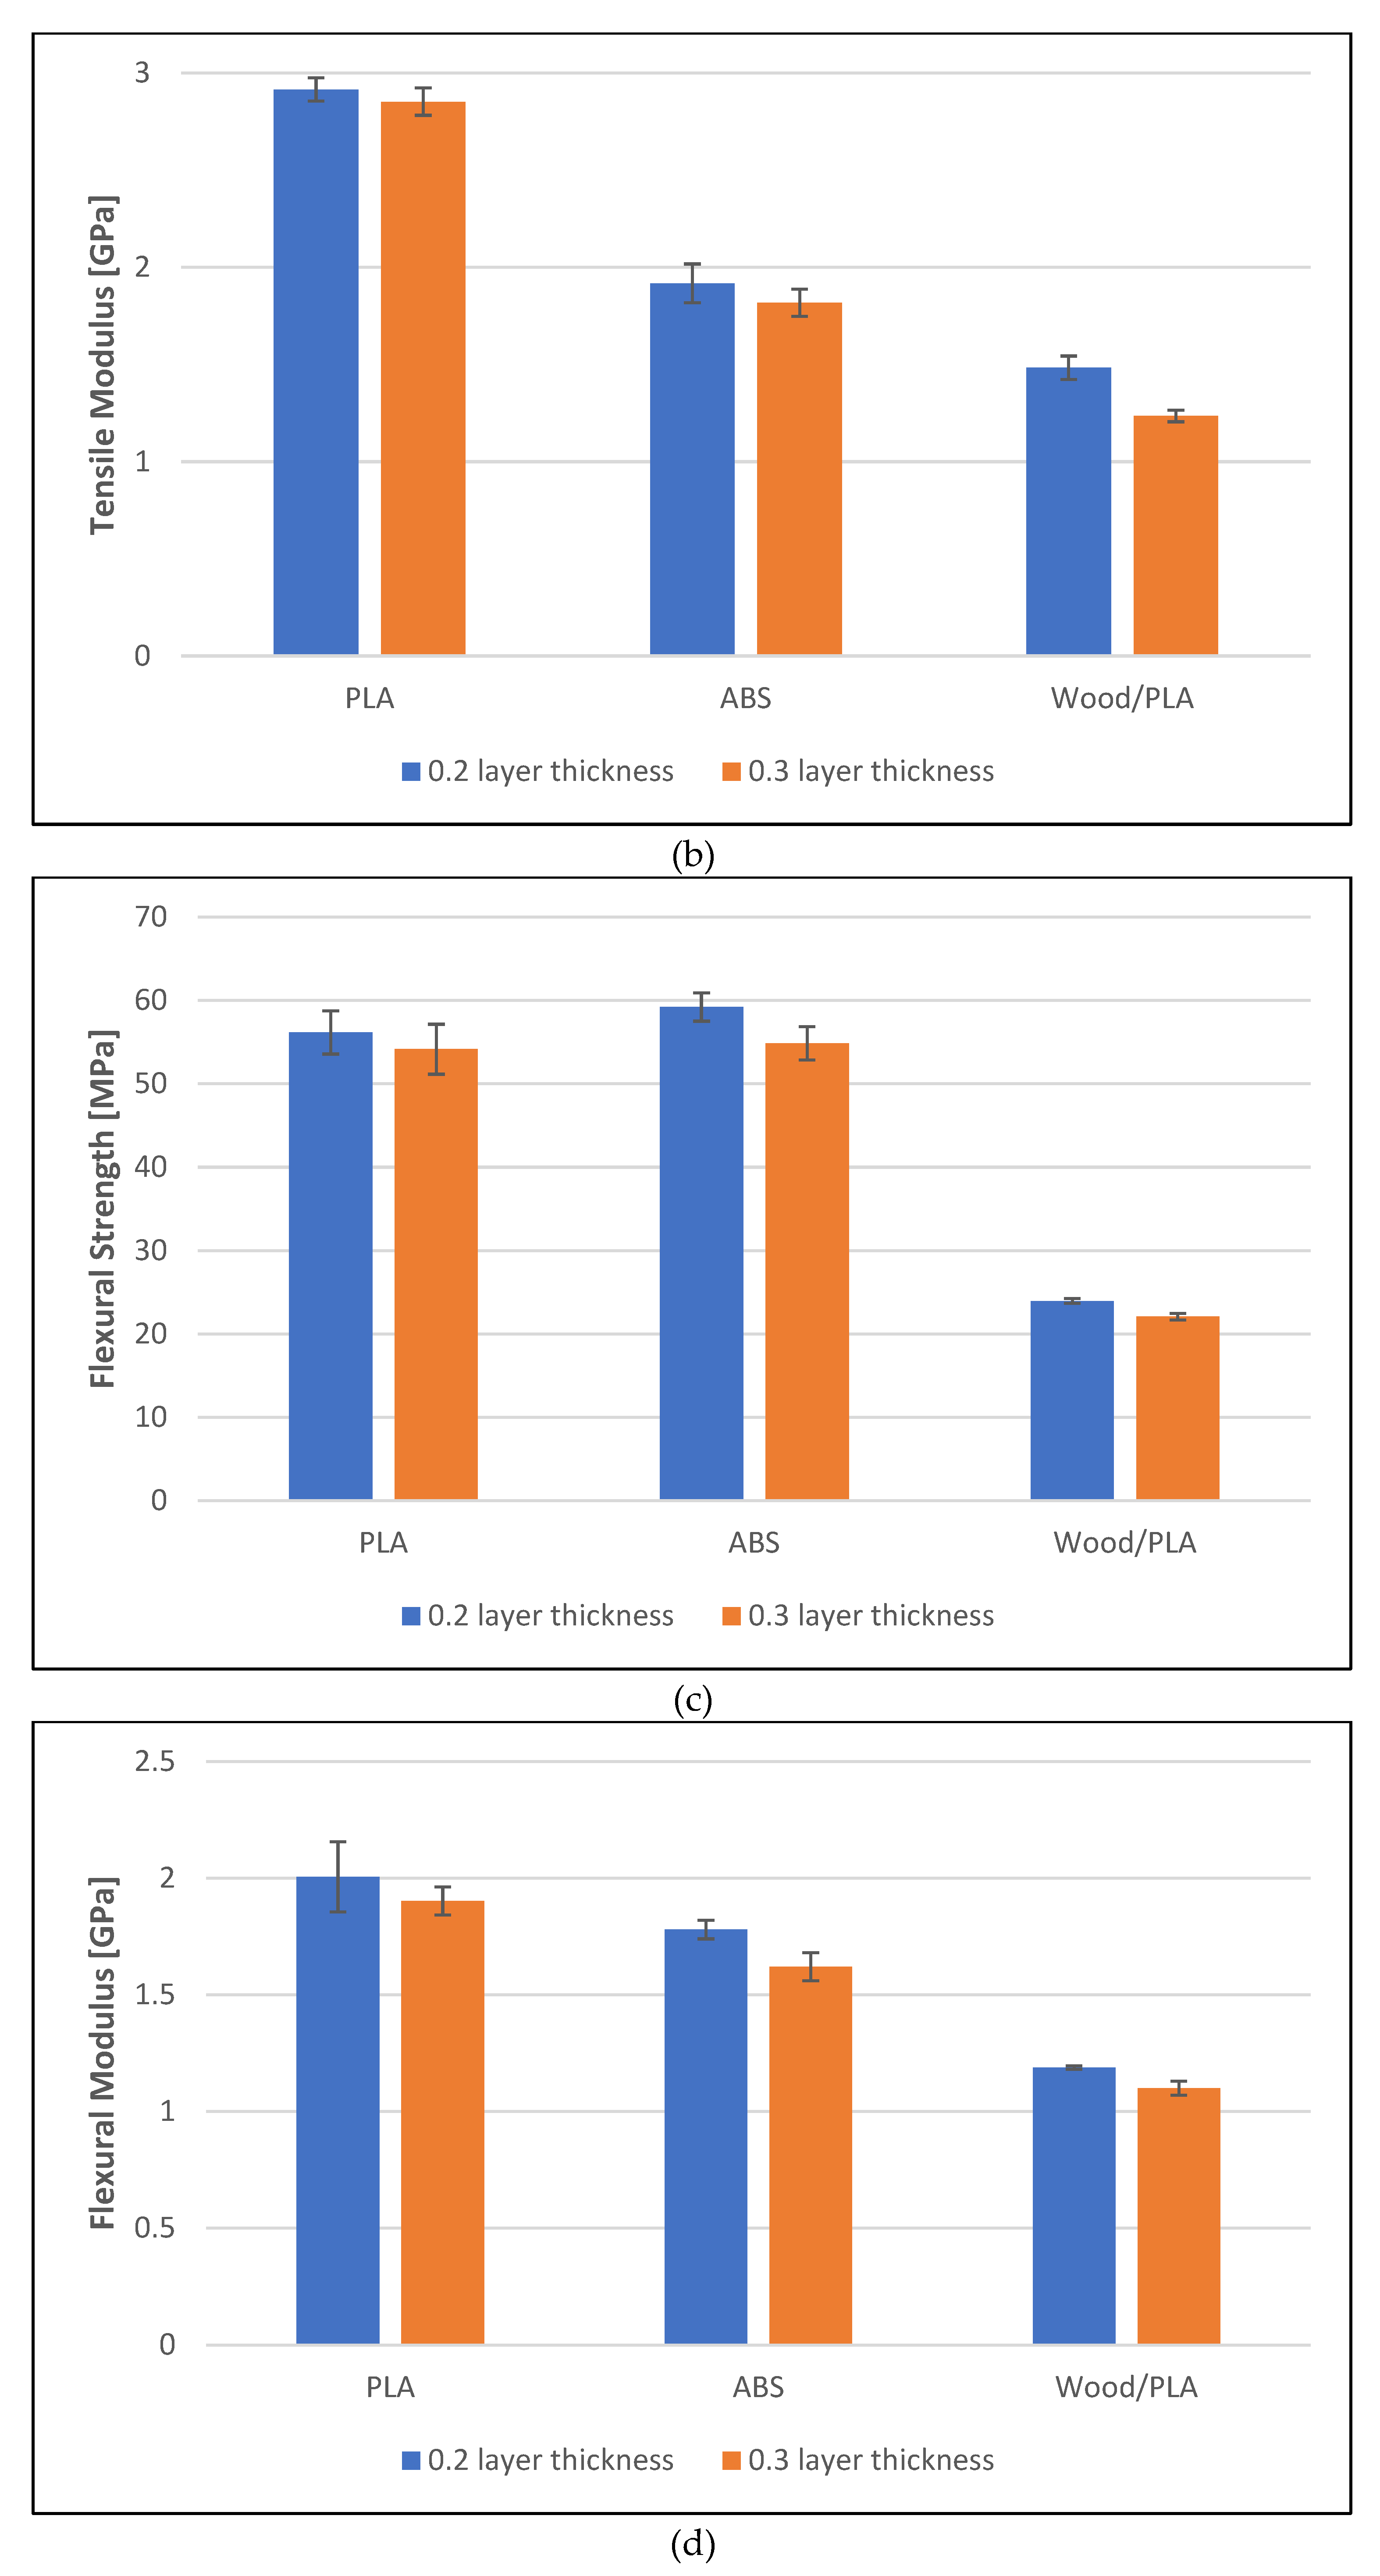
The specimens that had a printing layer thickness of 0.2 mm had higher tensile strength as compared to the samples that had a printing layer thickness of 0.3 mm. For instance, the tensile strength of dry ABS specimens that had a printing layer thicknesses of 0.2 mm and 0.3 mm were 40 MPa and 35 MPa respectively. PLA and wood/PLA specimens also had a slight decrease in the tensile strength. The trend observed in the tensile modulus, flexural strength, and flexural modulus of the specimens was consistent with the tensile strength as they were affected by the change in the layer thickness, See
Figure 5. This decrease in mechanical properties with the increase in printing layer thickness is due to the presence of pores and the presence of unfilled gaps within the specimens. These pores weaken the adhesion between the layers that leads to a weak bond strength. The increase in the printing layer thickness also reduces the time taken for the specimens to cool and this affects the adhesion between the layers, hence reducing the mechanical properties [18]. The mechanical properties were further affected when the specimens were immersed in the water, see
Table S1.
Table 2 show the charpy impact strength of the specimens and the results show the influence of the manufacturing methods, the printing layer thickness in 3D printing and the water absorption. The manufacturing method has the most significant influence on the specimens’ impact strength. The edgewise impact strength of the injection molded PLA specimen measured 67 kJ/m
2, which decreased by 80% when the manufacturing method was changed. A simliar observation was noted in wood/PLA specimens. The change in the layer thickness from 0.2 to 0.3 mm had limited effect on the impact properties. However, the water absorption of the specimens had more significant effect on the the impact strength.
Storage and loss moduli from the DMA curves show that the printing layer thickness and manufacturing methods affect the mechanical properties of the specimens, see
Table 3. This falls in line with the other mechanical test results. As mentioned earlier, there is a direct correlation between a smaller layer height and increased bond strength, as demonstrated by the results from DMA. The results also show that the damping was severaly restricted on the addition of wood flour.
3.3. Thermal Analysis
DSC results confirmed that the manufacturing methods do not have significant effect on the glass transition temperature (Tg), the crystallization temperature (Tc), and the melting temperature (Tm) of PLA and their composites,
Table 4. This was expected as the polymer processing temperatures are similar in both manufacturing methods and the molecular chains of the polymer after the injection molding and the 3D printing will be affected minimally. The effect of water absorption on thermal properties was also minor. However, the addition of wood flour to the PLA affected the glass transition and the crystallization. This is due to the restricted movements of polymer chains in the presence of reinforcement particles.
Table 5 shows the glass transition temperatures obtained from the DMA’s storage moduli, loss moduli and tan δ curves. In general, the Tg obtained from DMA was higher than the Tg from DSC. This is expected due to the sensitivity of the instruments [19]. However, the trend observed in DMA confirms the results from DSC; the addition of reinforcement particles affected the Tg of the specimens and the manufacturing method has minimal effect on Tg.
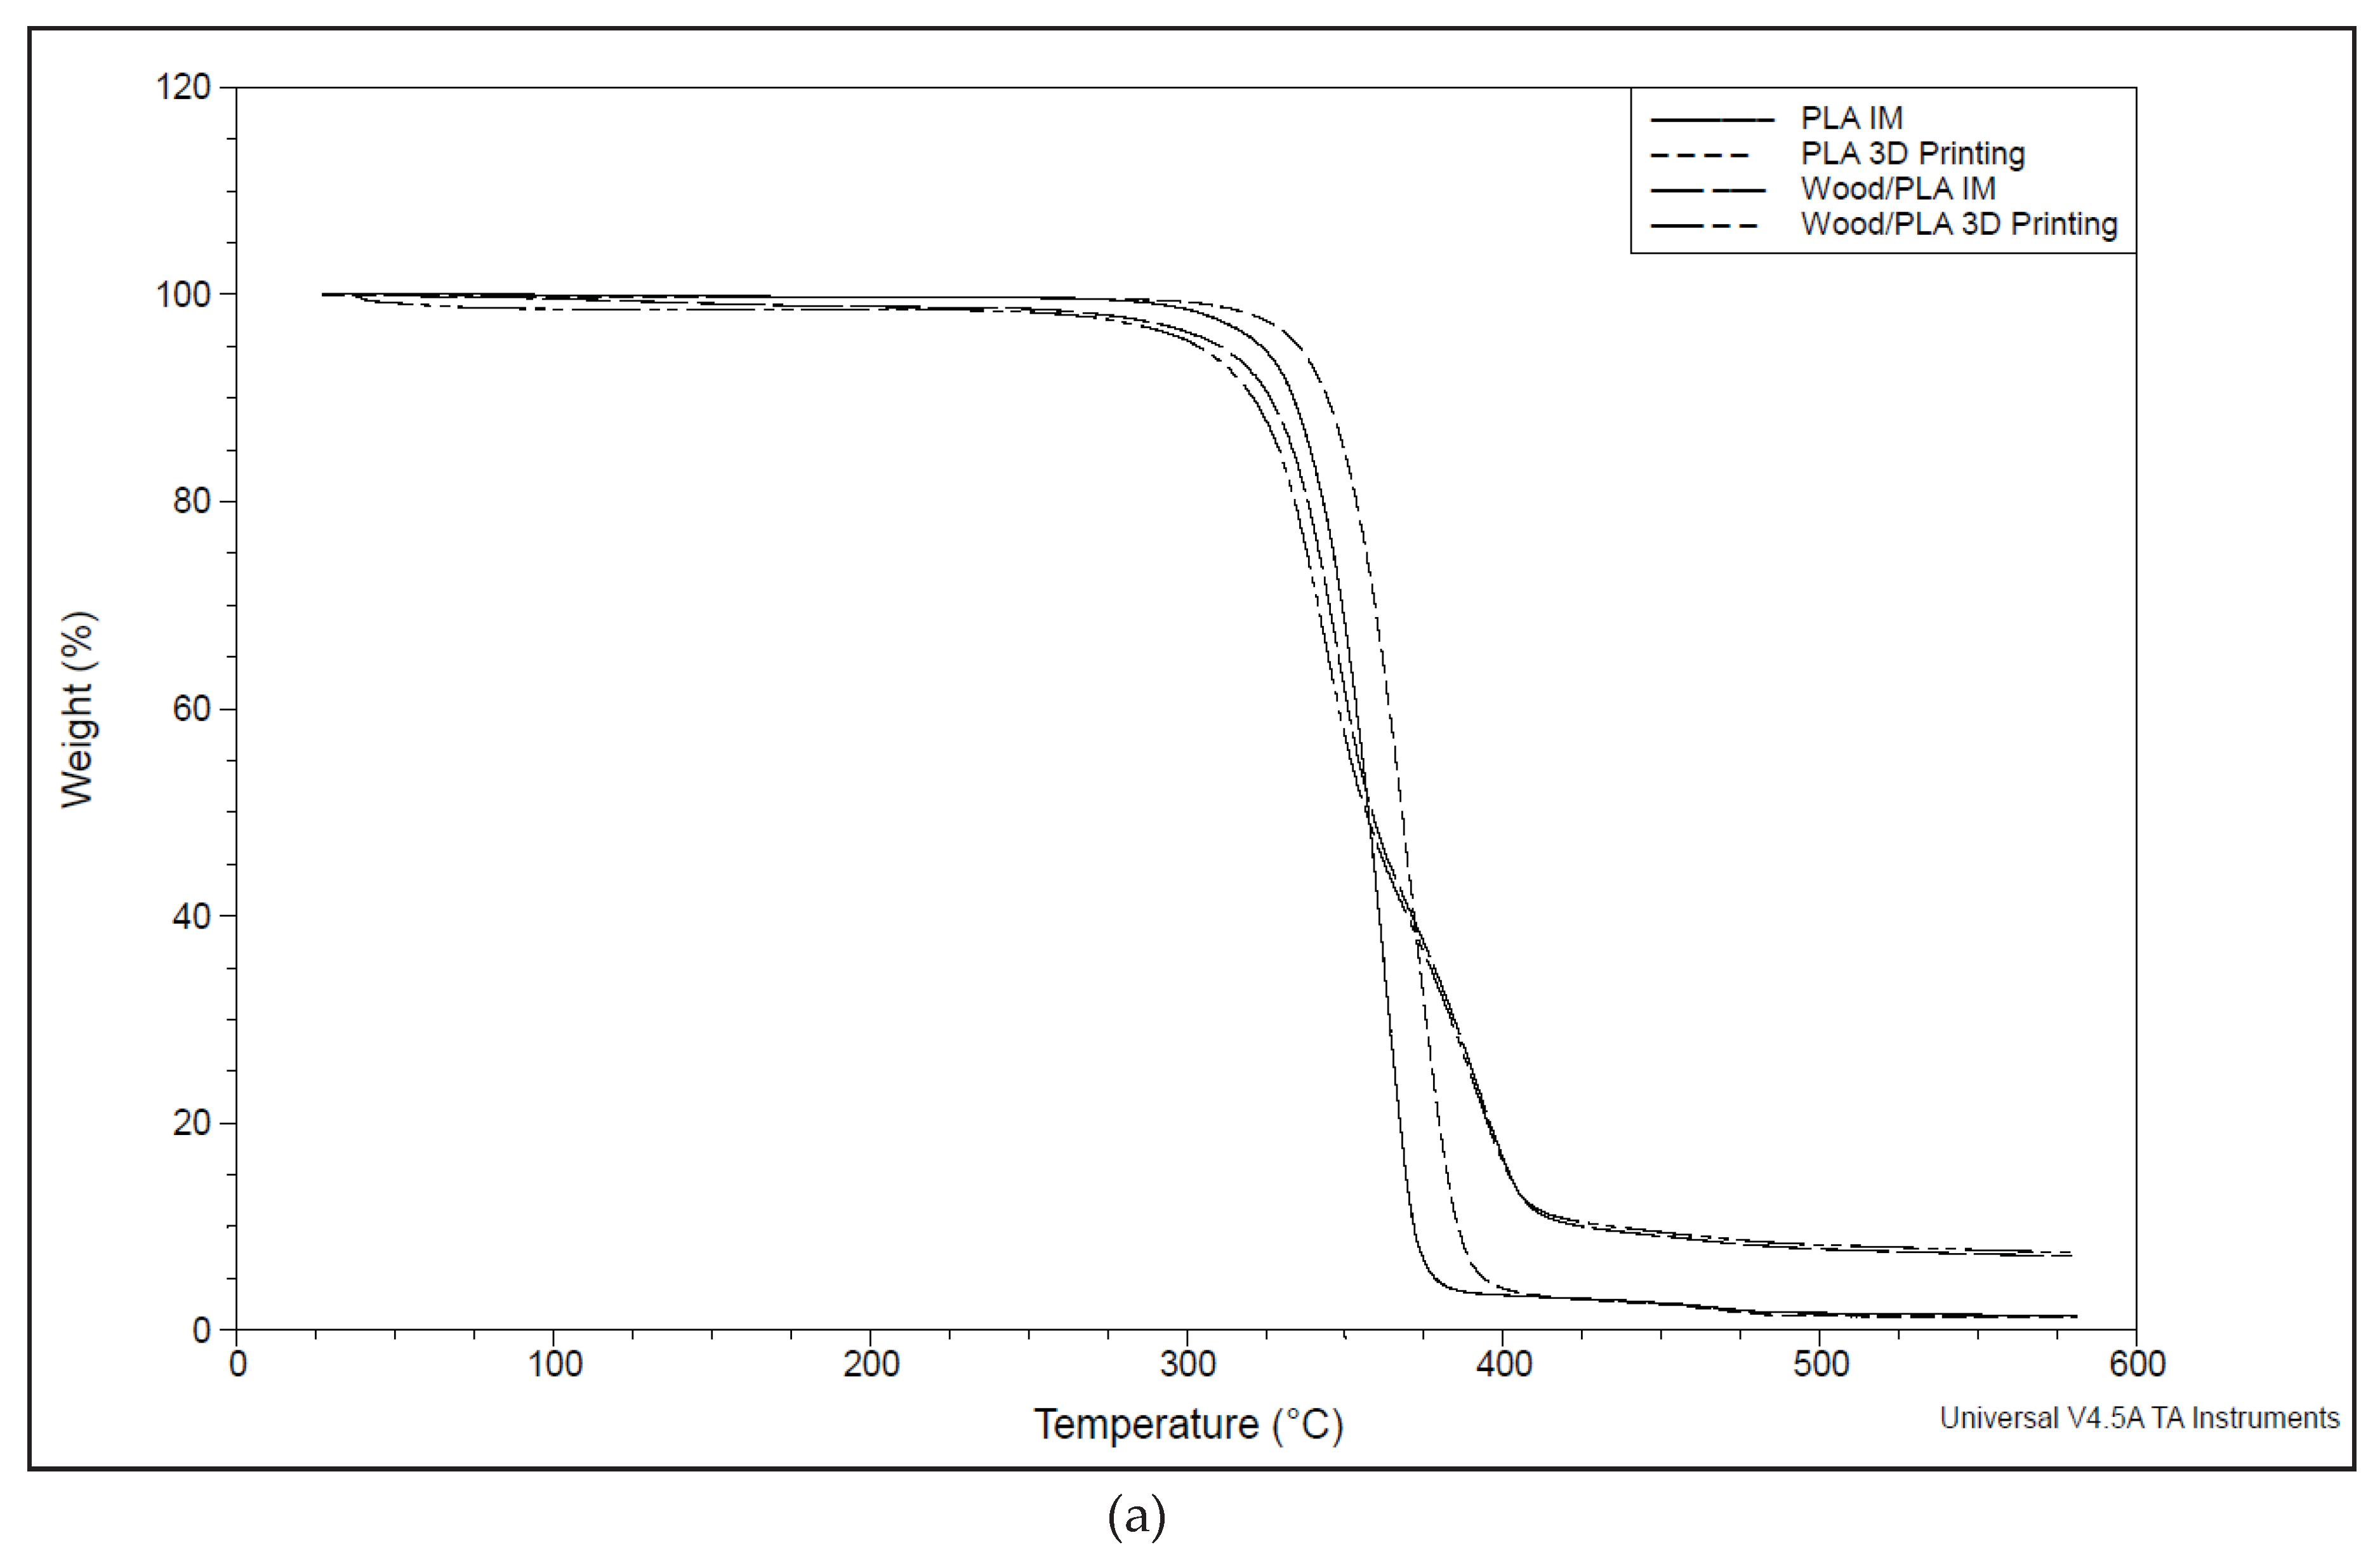
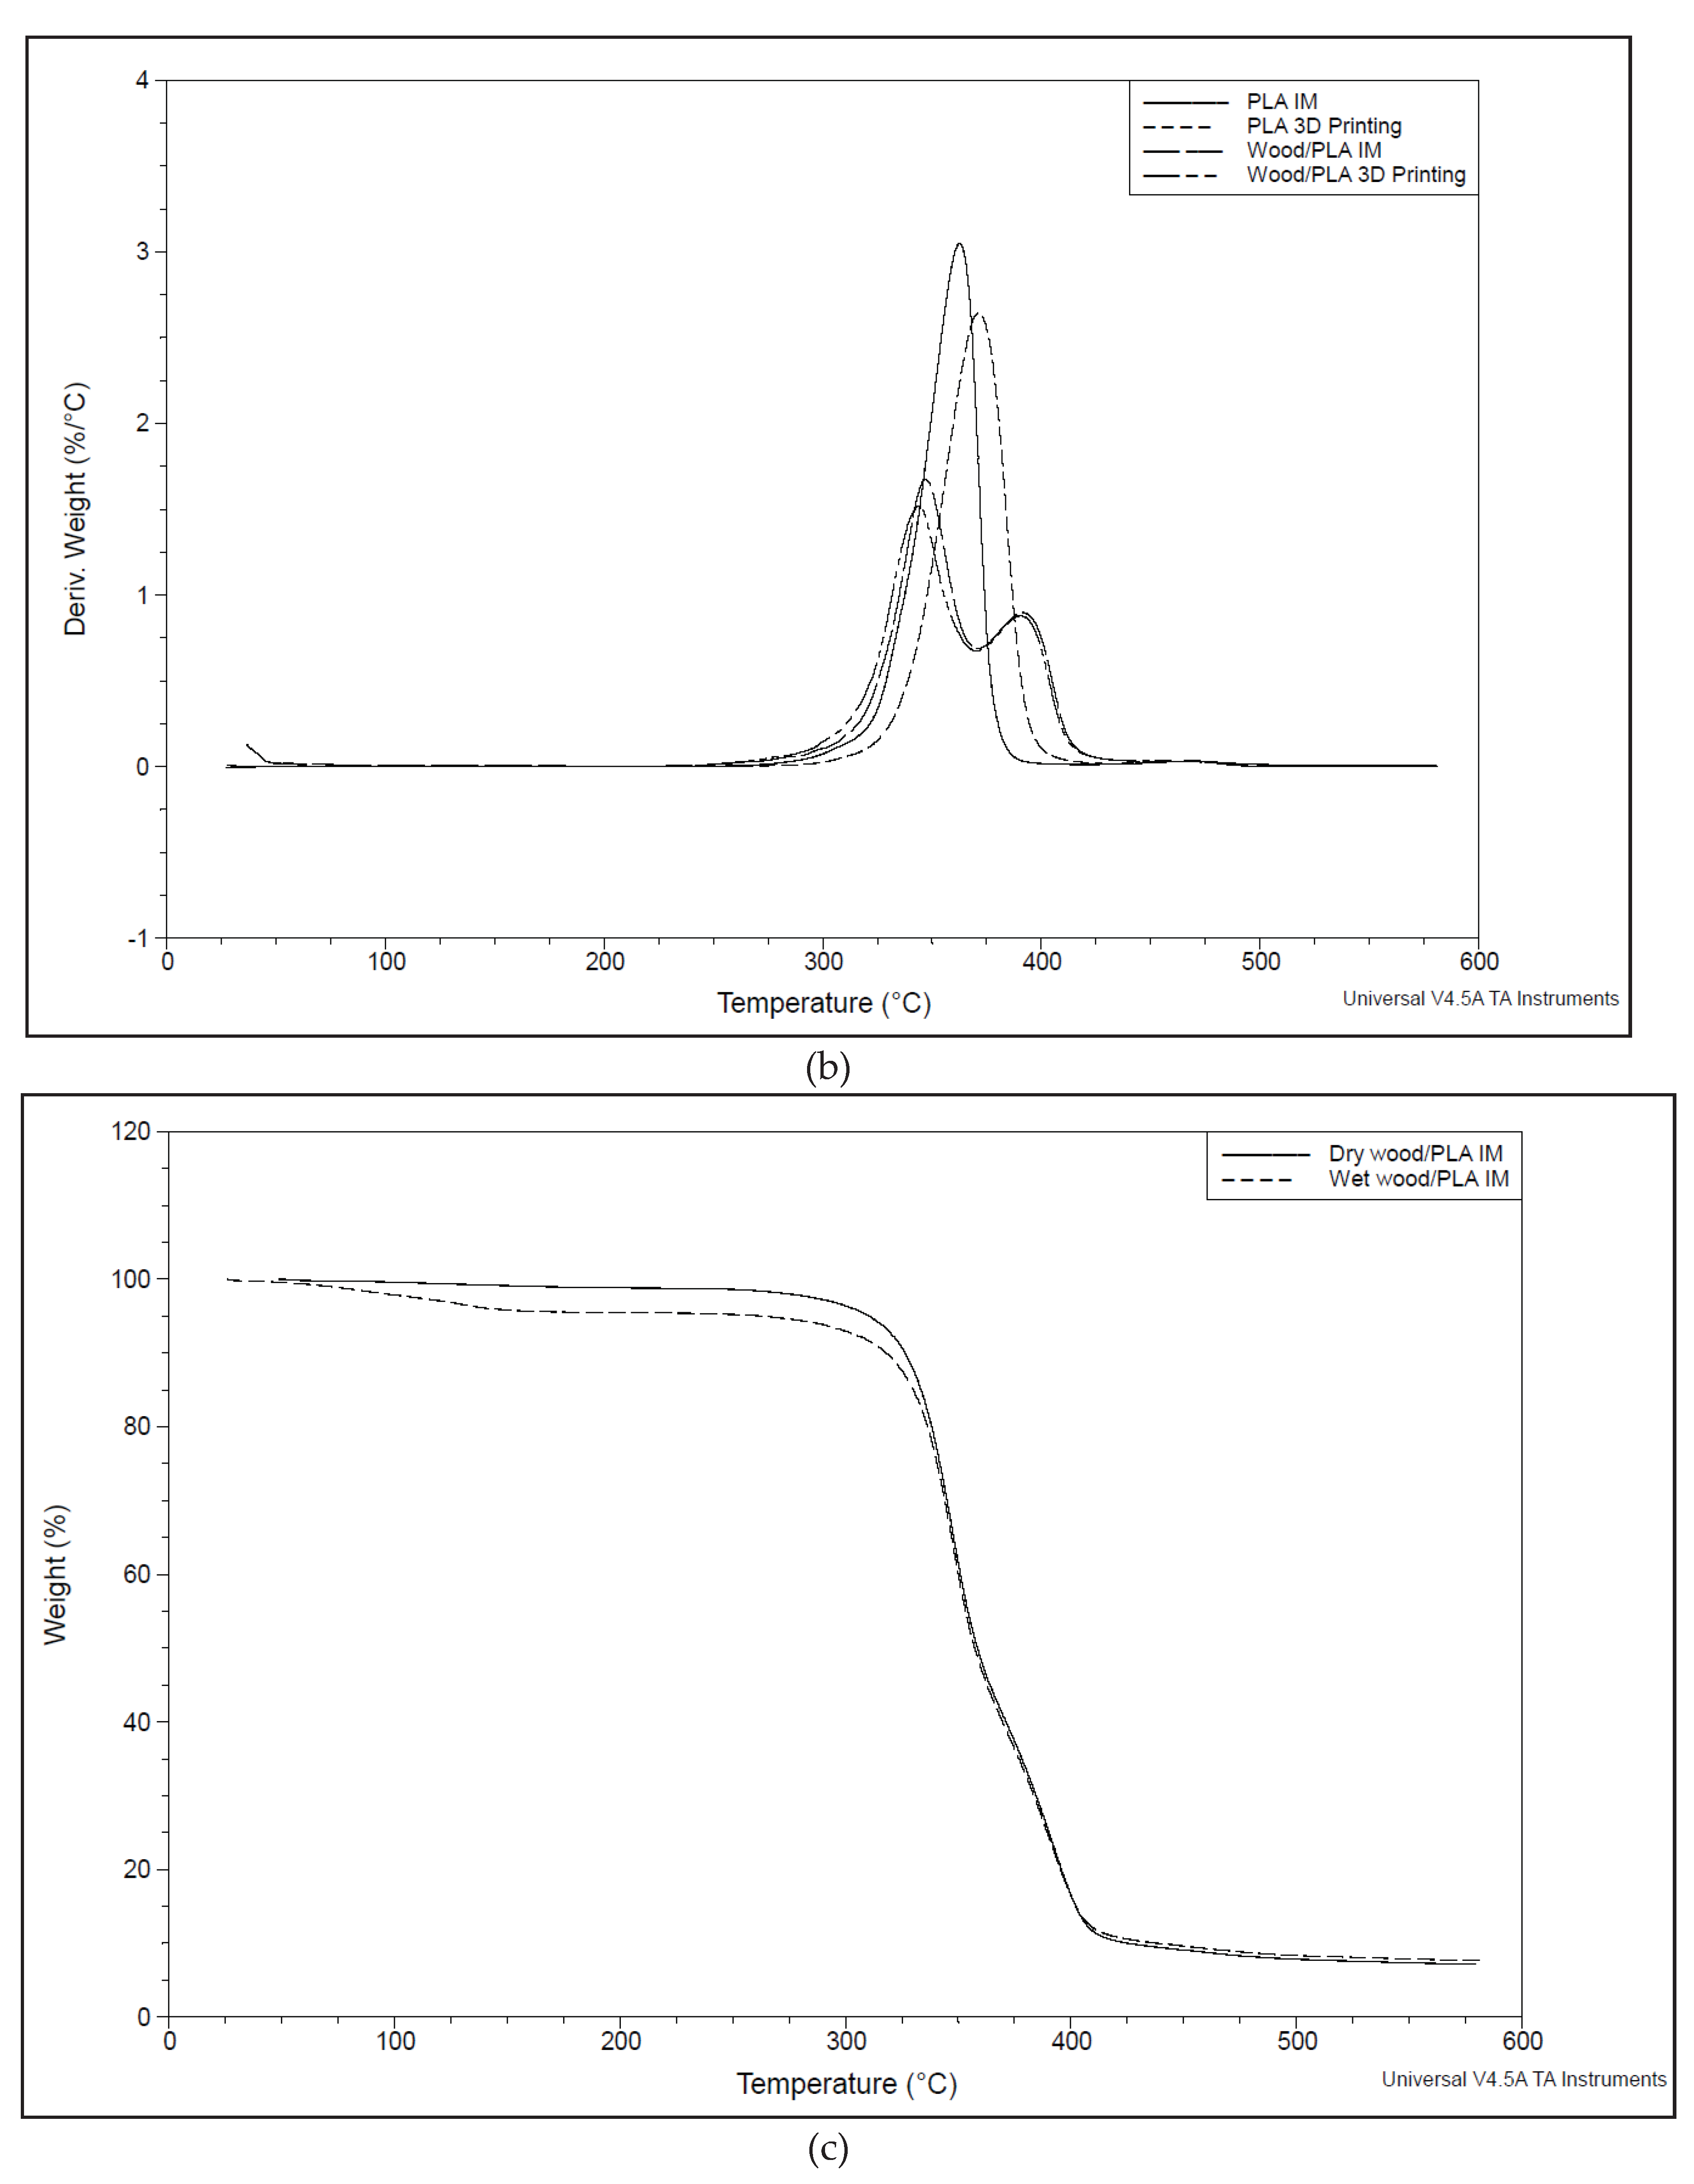
TGA curves show that the polymers underwent a single stage decomposition, and the composite (wood/PLA) underwent a multistage decomposition within the temperature range of 30 and 600 ℃. Manufacturing methods did not affect the degradation temperature of the specimens as expected. However, the water absorption of the specimens slightly lowered the degradation initiation temperature, see
Figure 6.
3.4. Microscopic Analysis
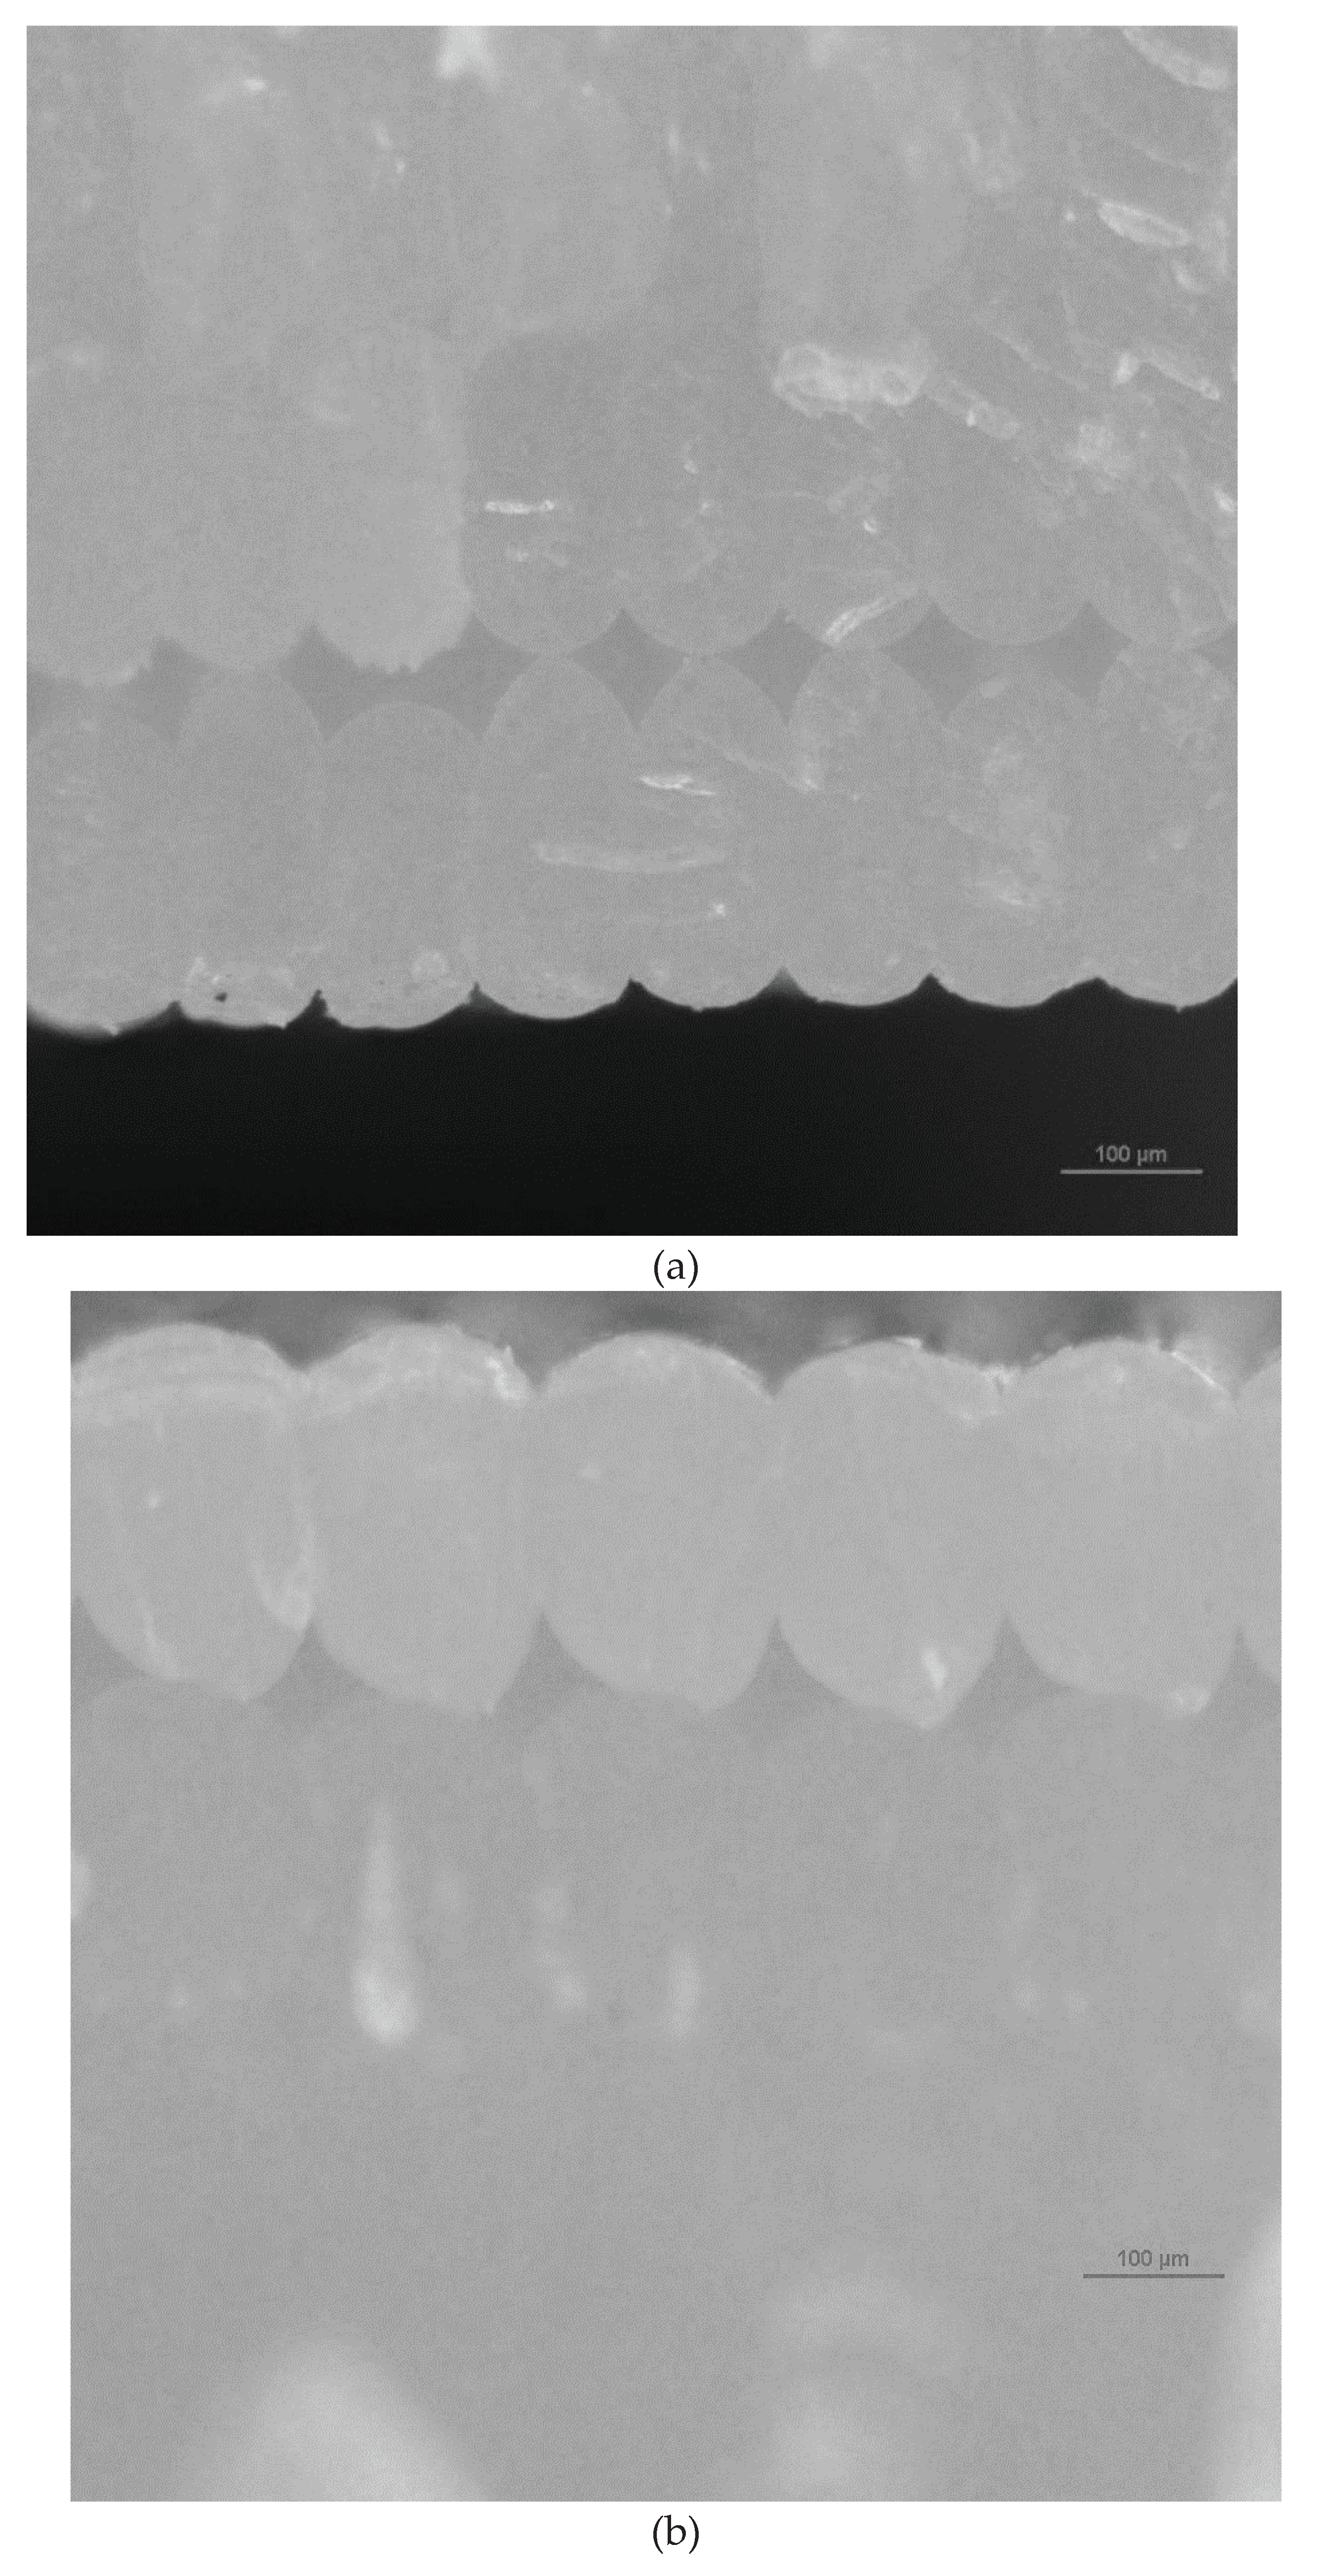
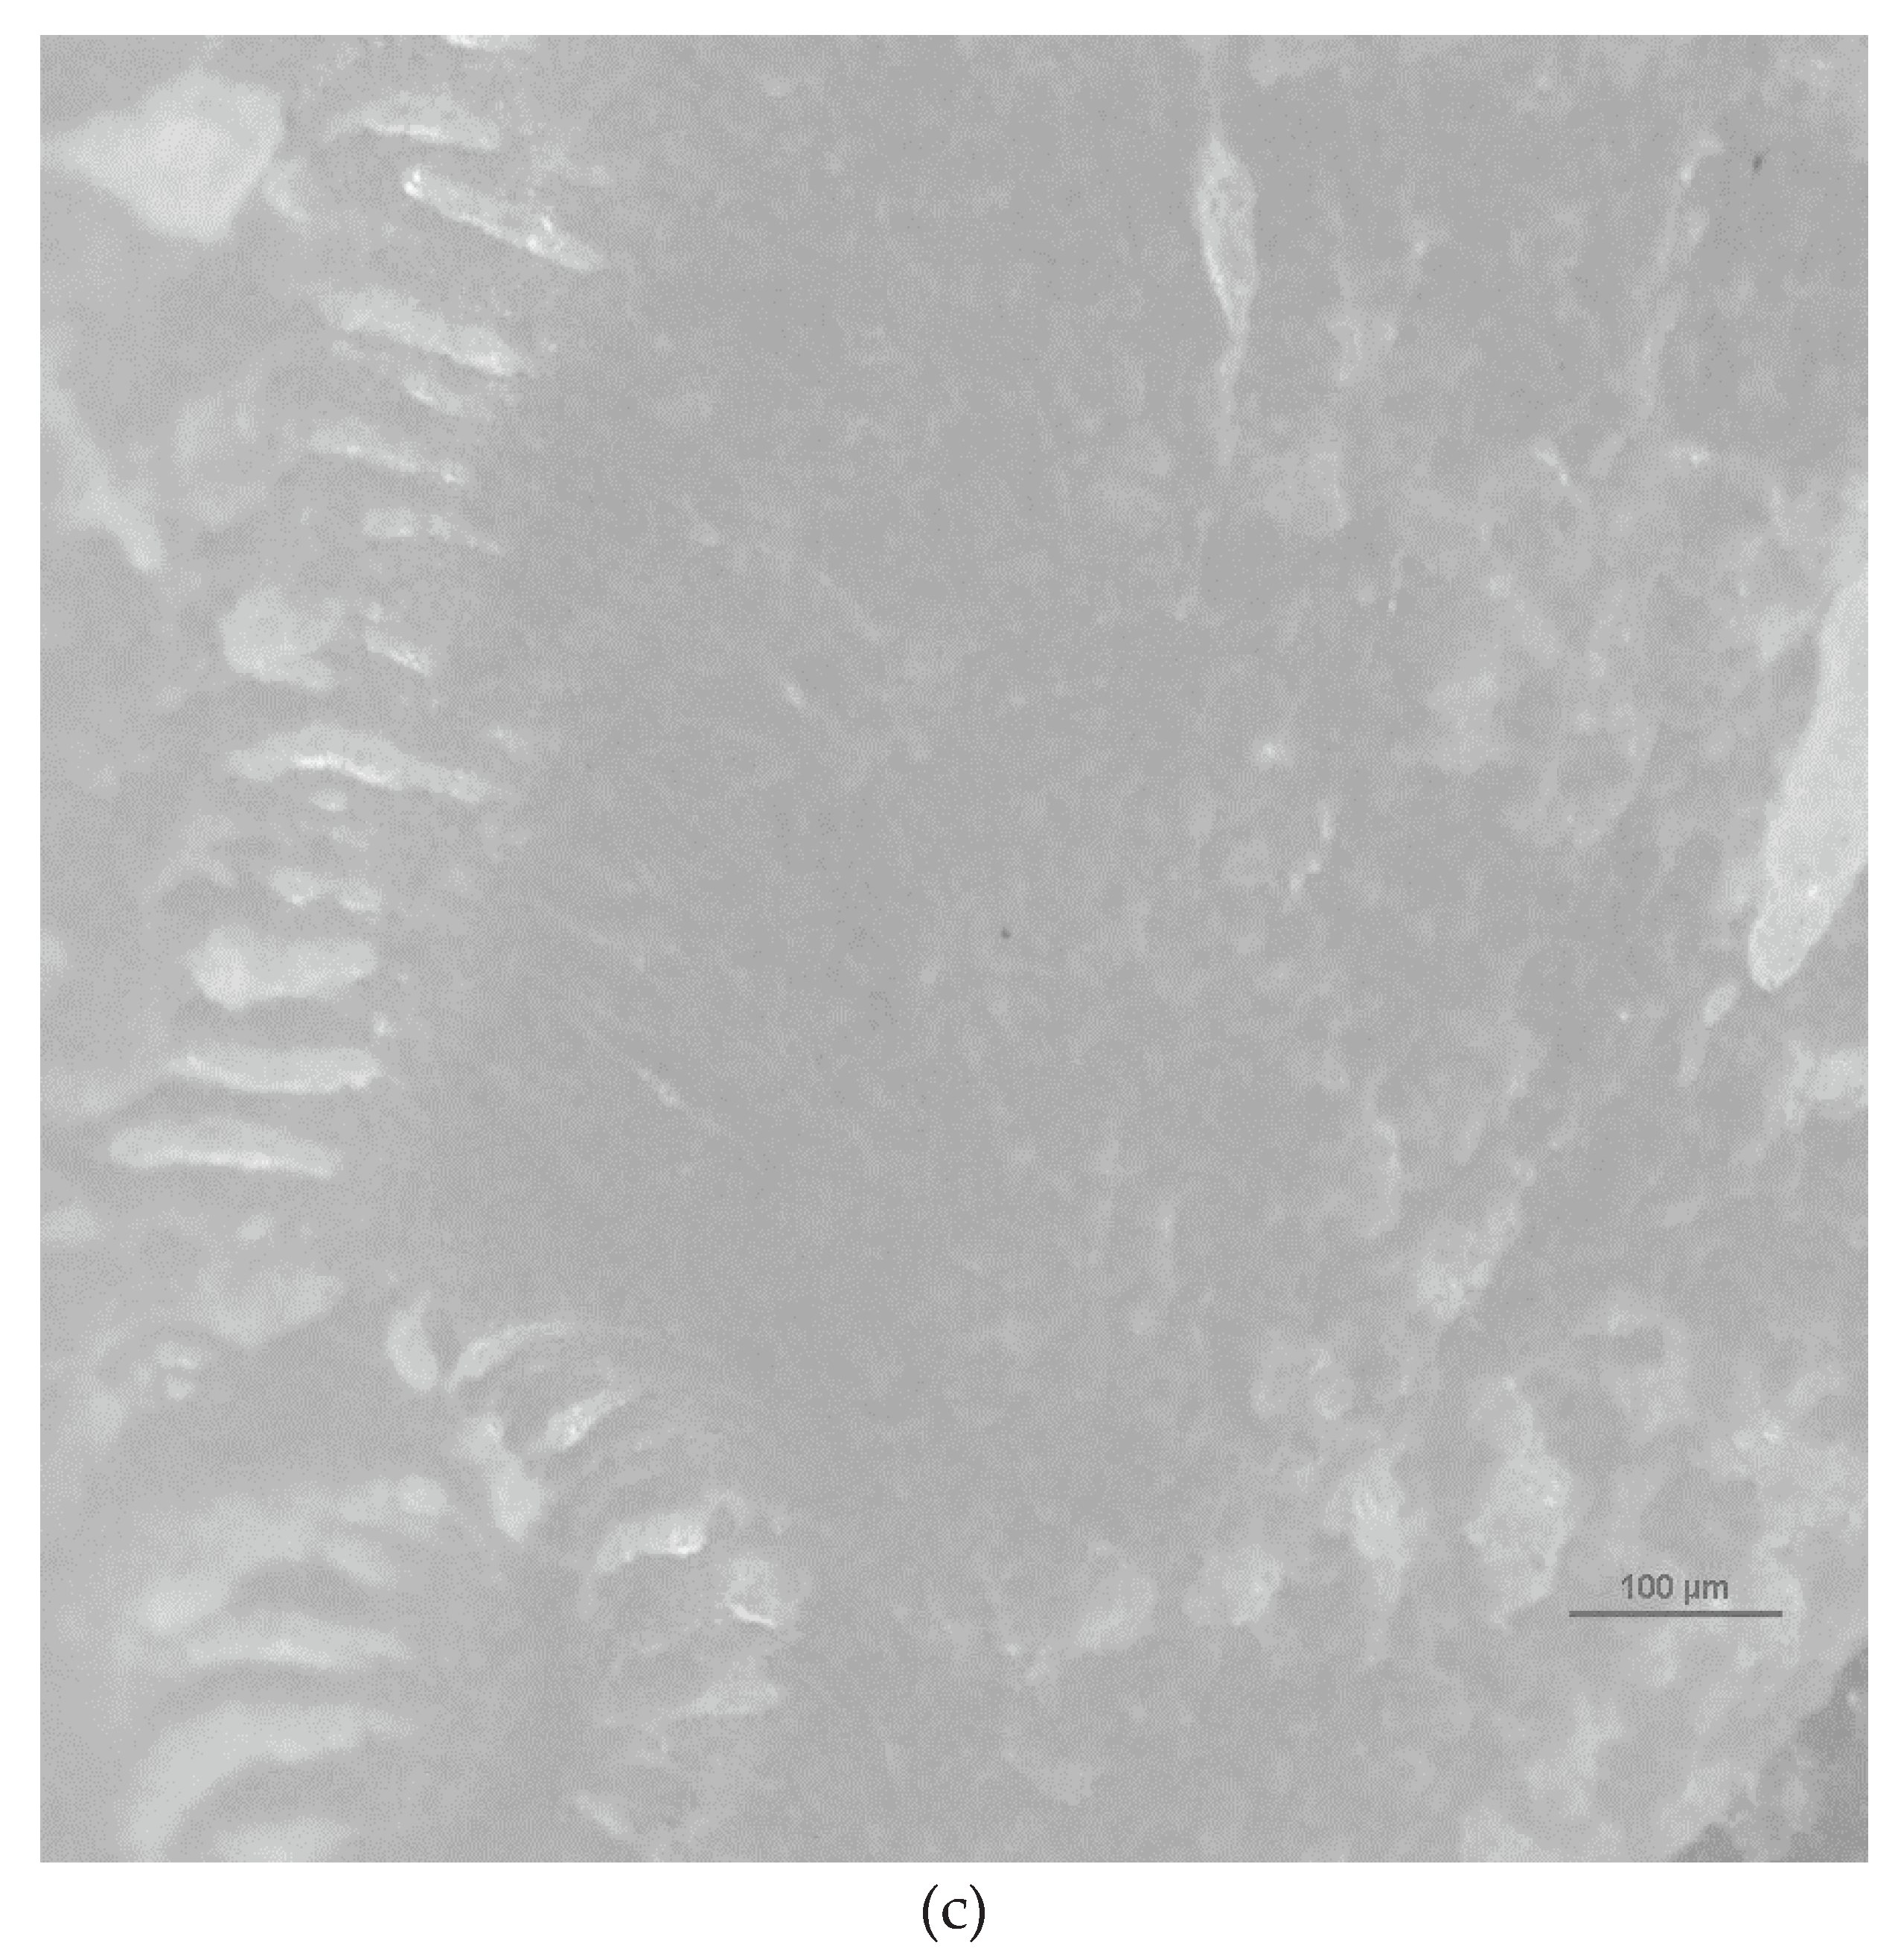
Figure 7 shows microscopic images illustrating fractured surface parts post-testing. These images were captured from the fractured areas of the specimens during the test, revealing the failure mechanisms, the layers in 3D printed specimens and the pores in the specimens. The images show that the pore size increases on increasing the layer thickness in 3D printing while the injection molded samples did not show any visible pores. The results fall in line with the results obtained from mechanical testing. Furthermore,
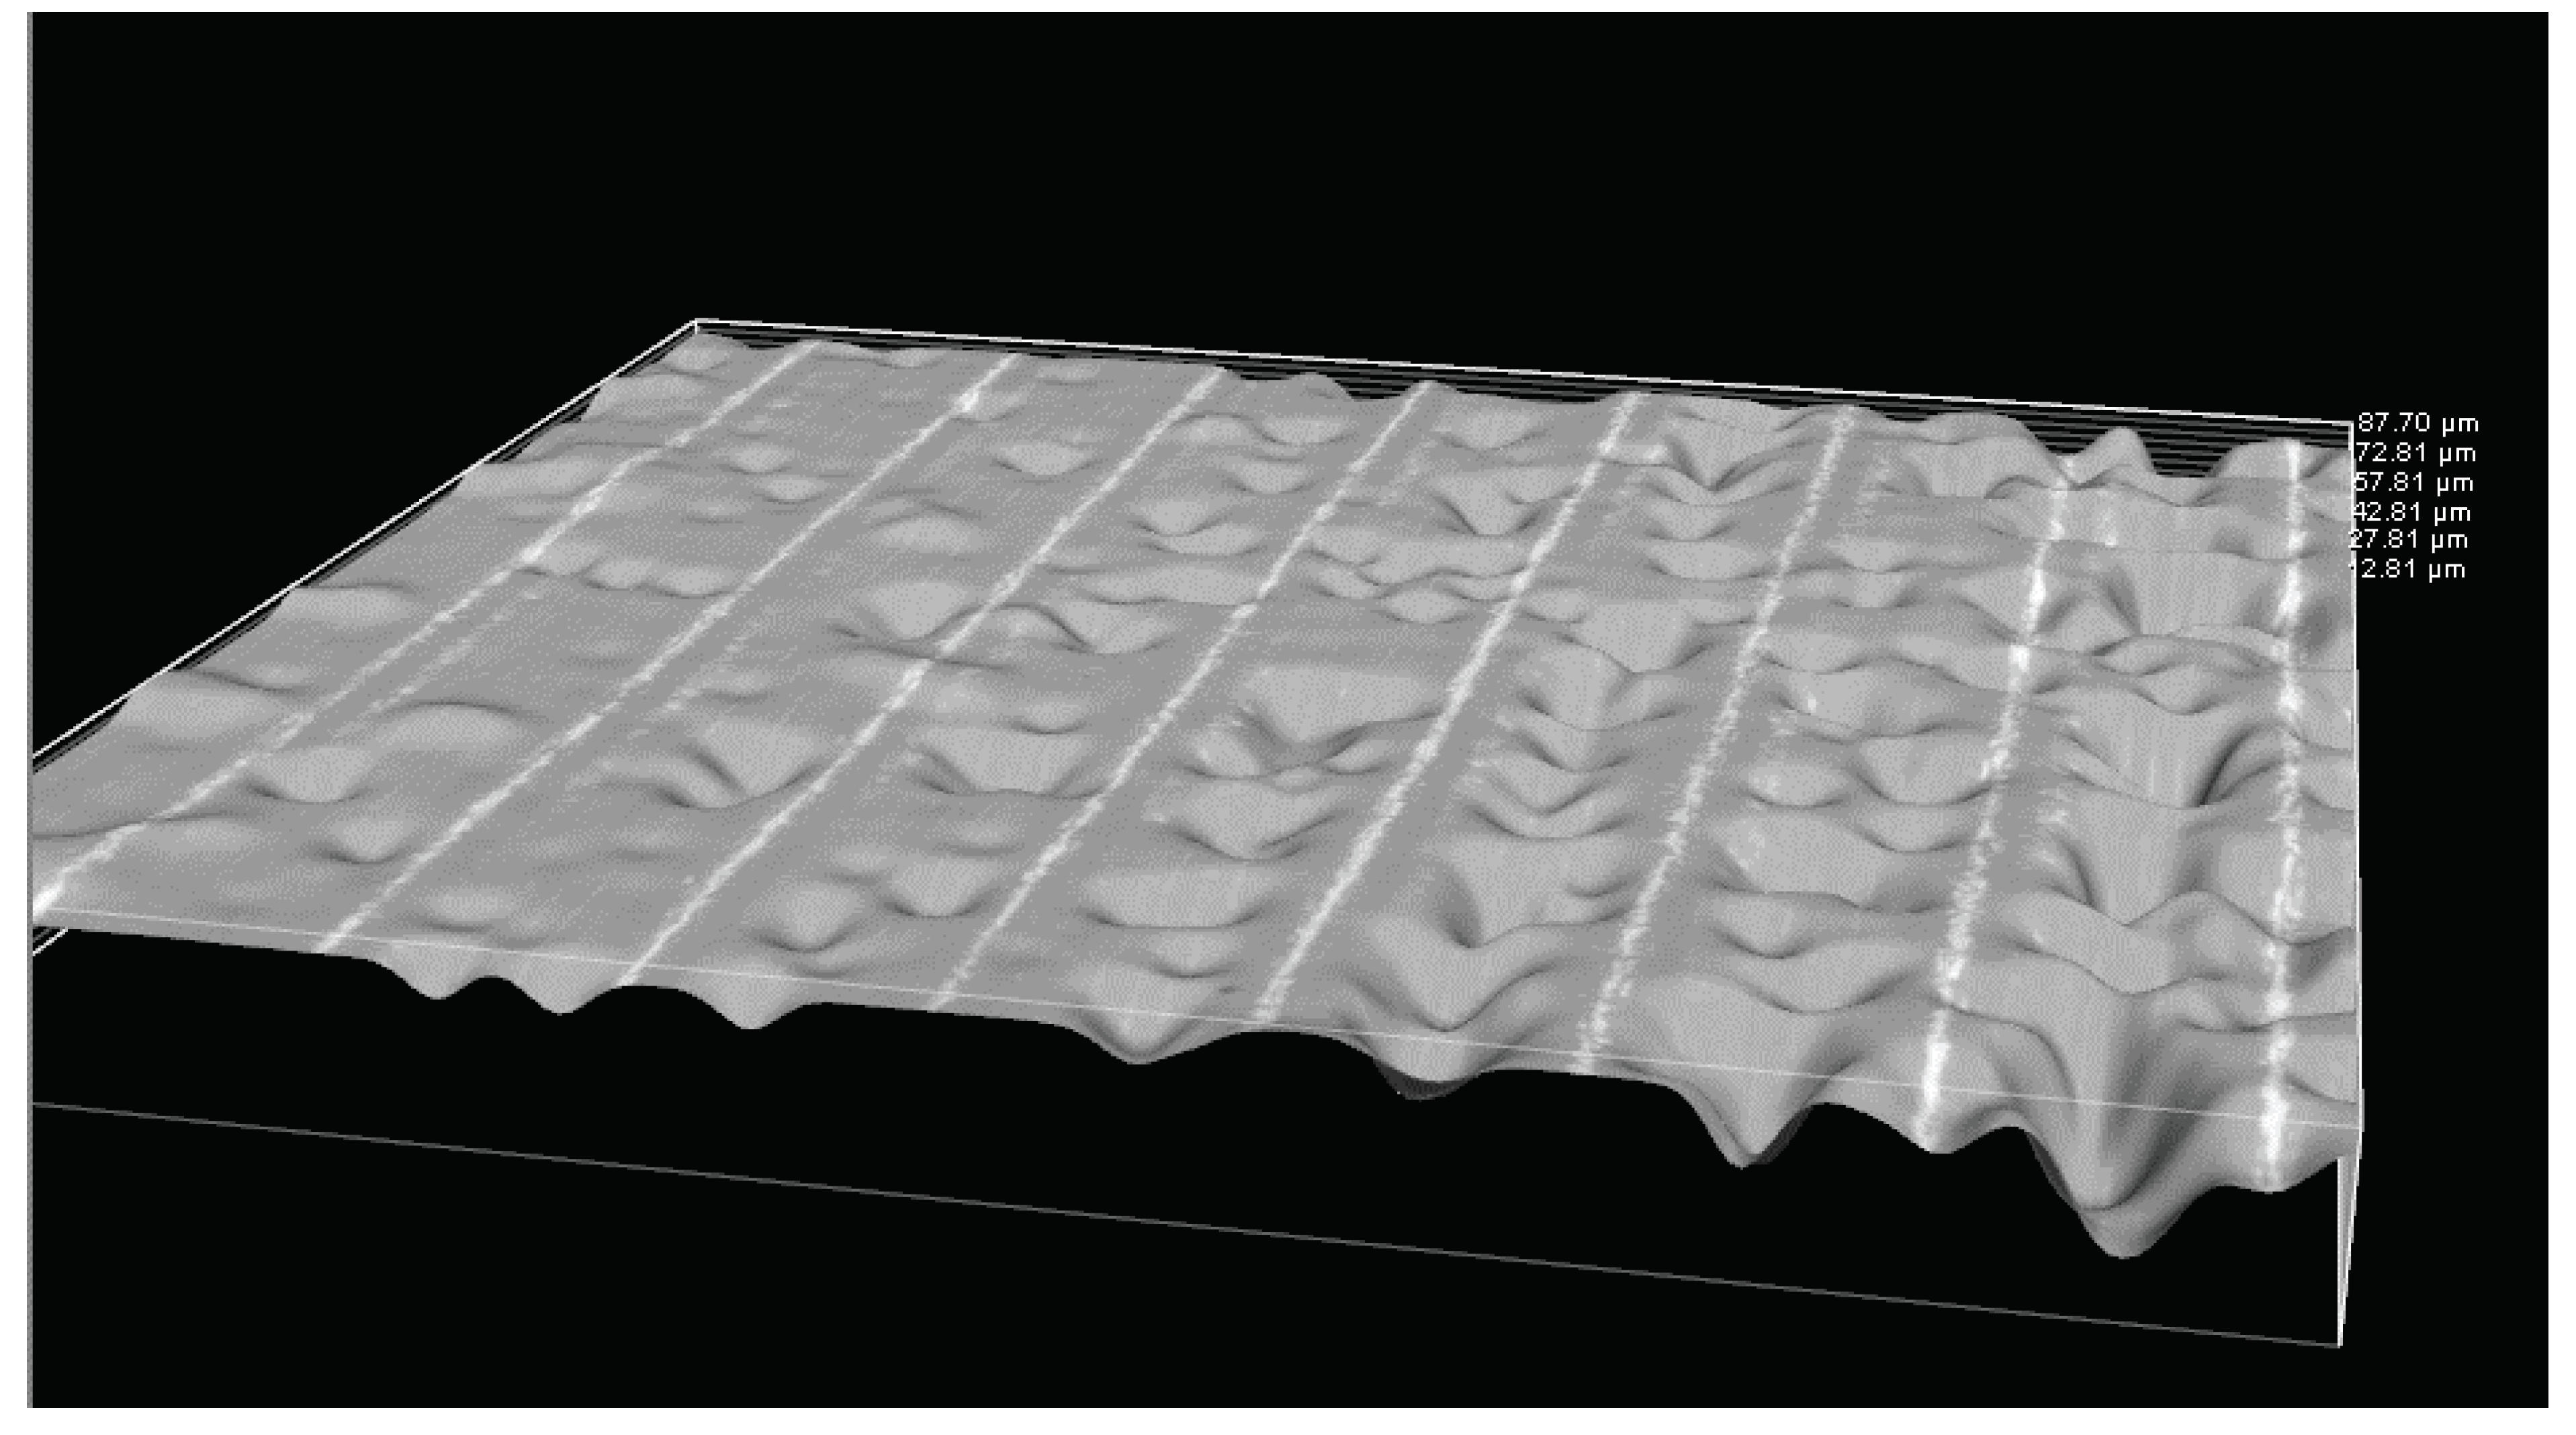
Figure 8 shows the three-dimensional image of the cross-section of unfractured surface of 3D printed PLA specimen clearly revealing the layers and the pores.
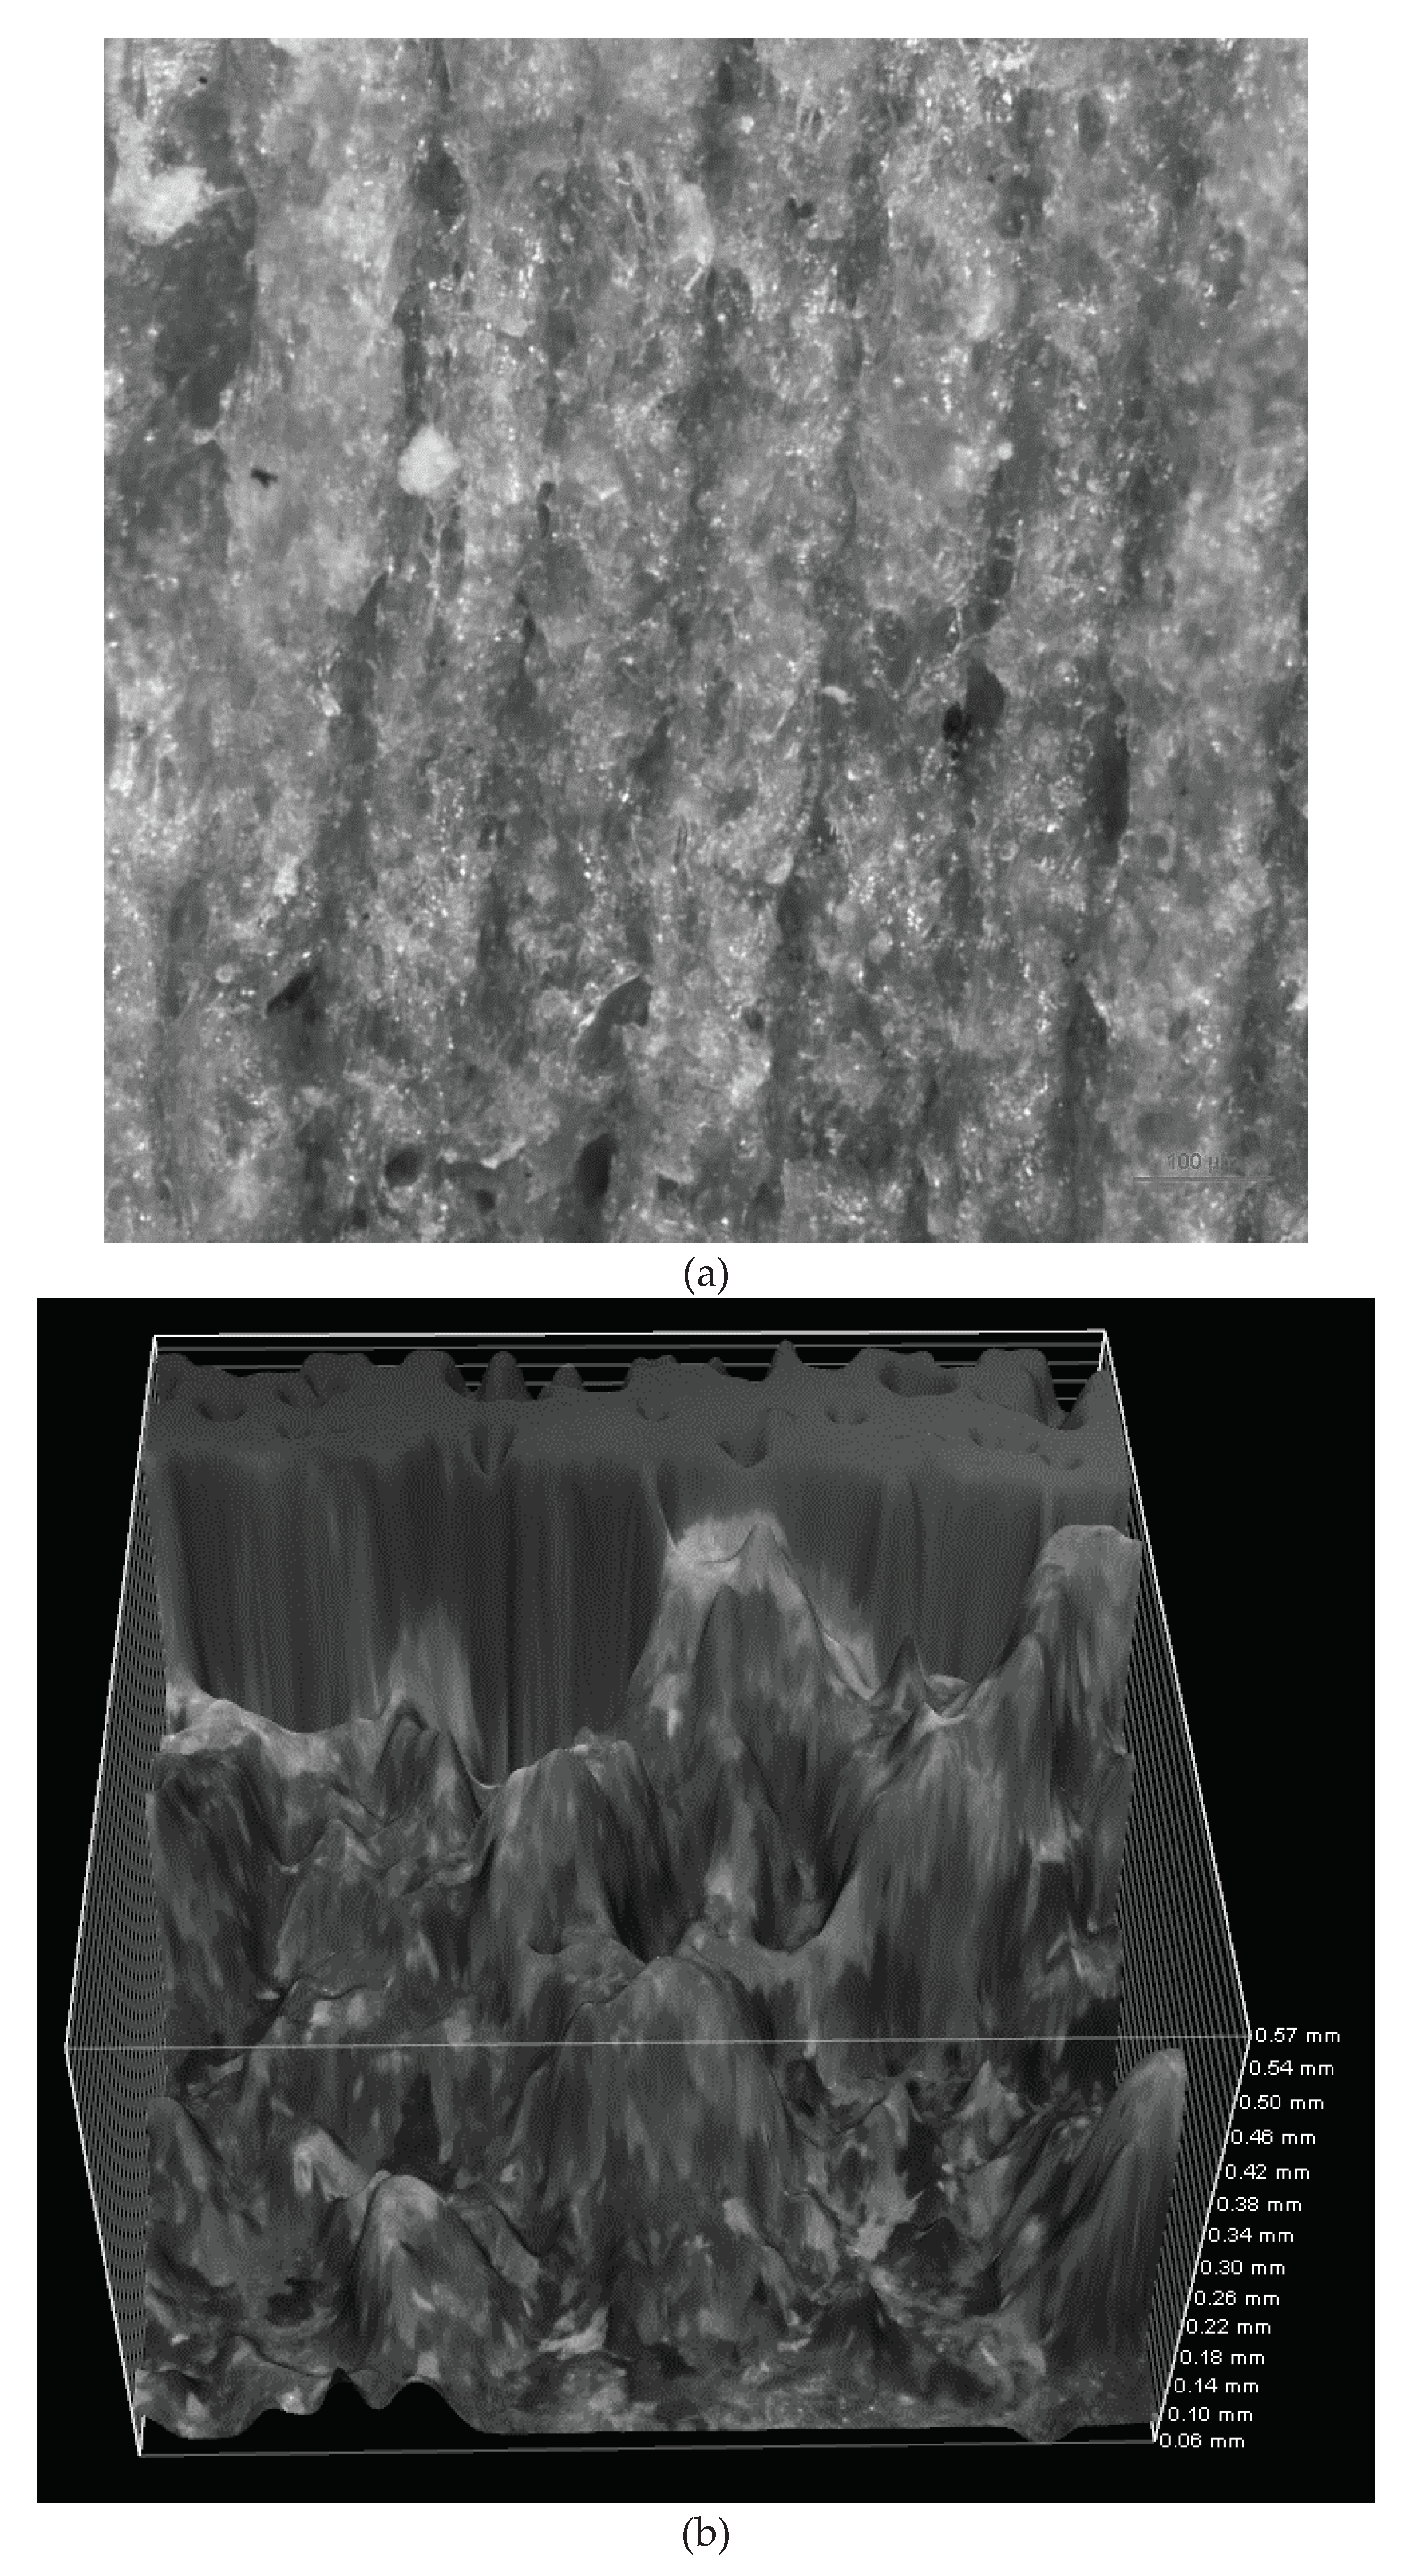
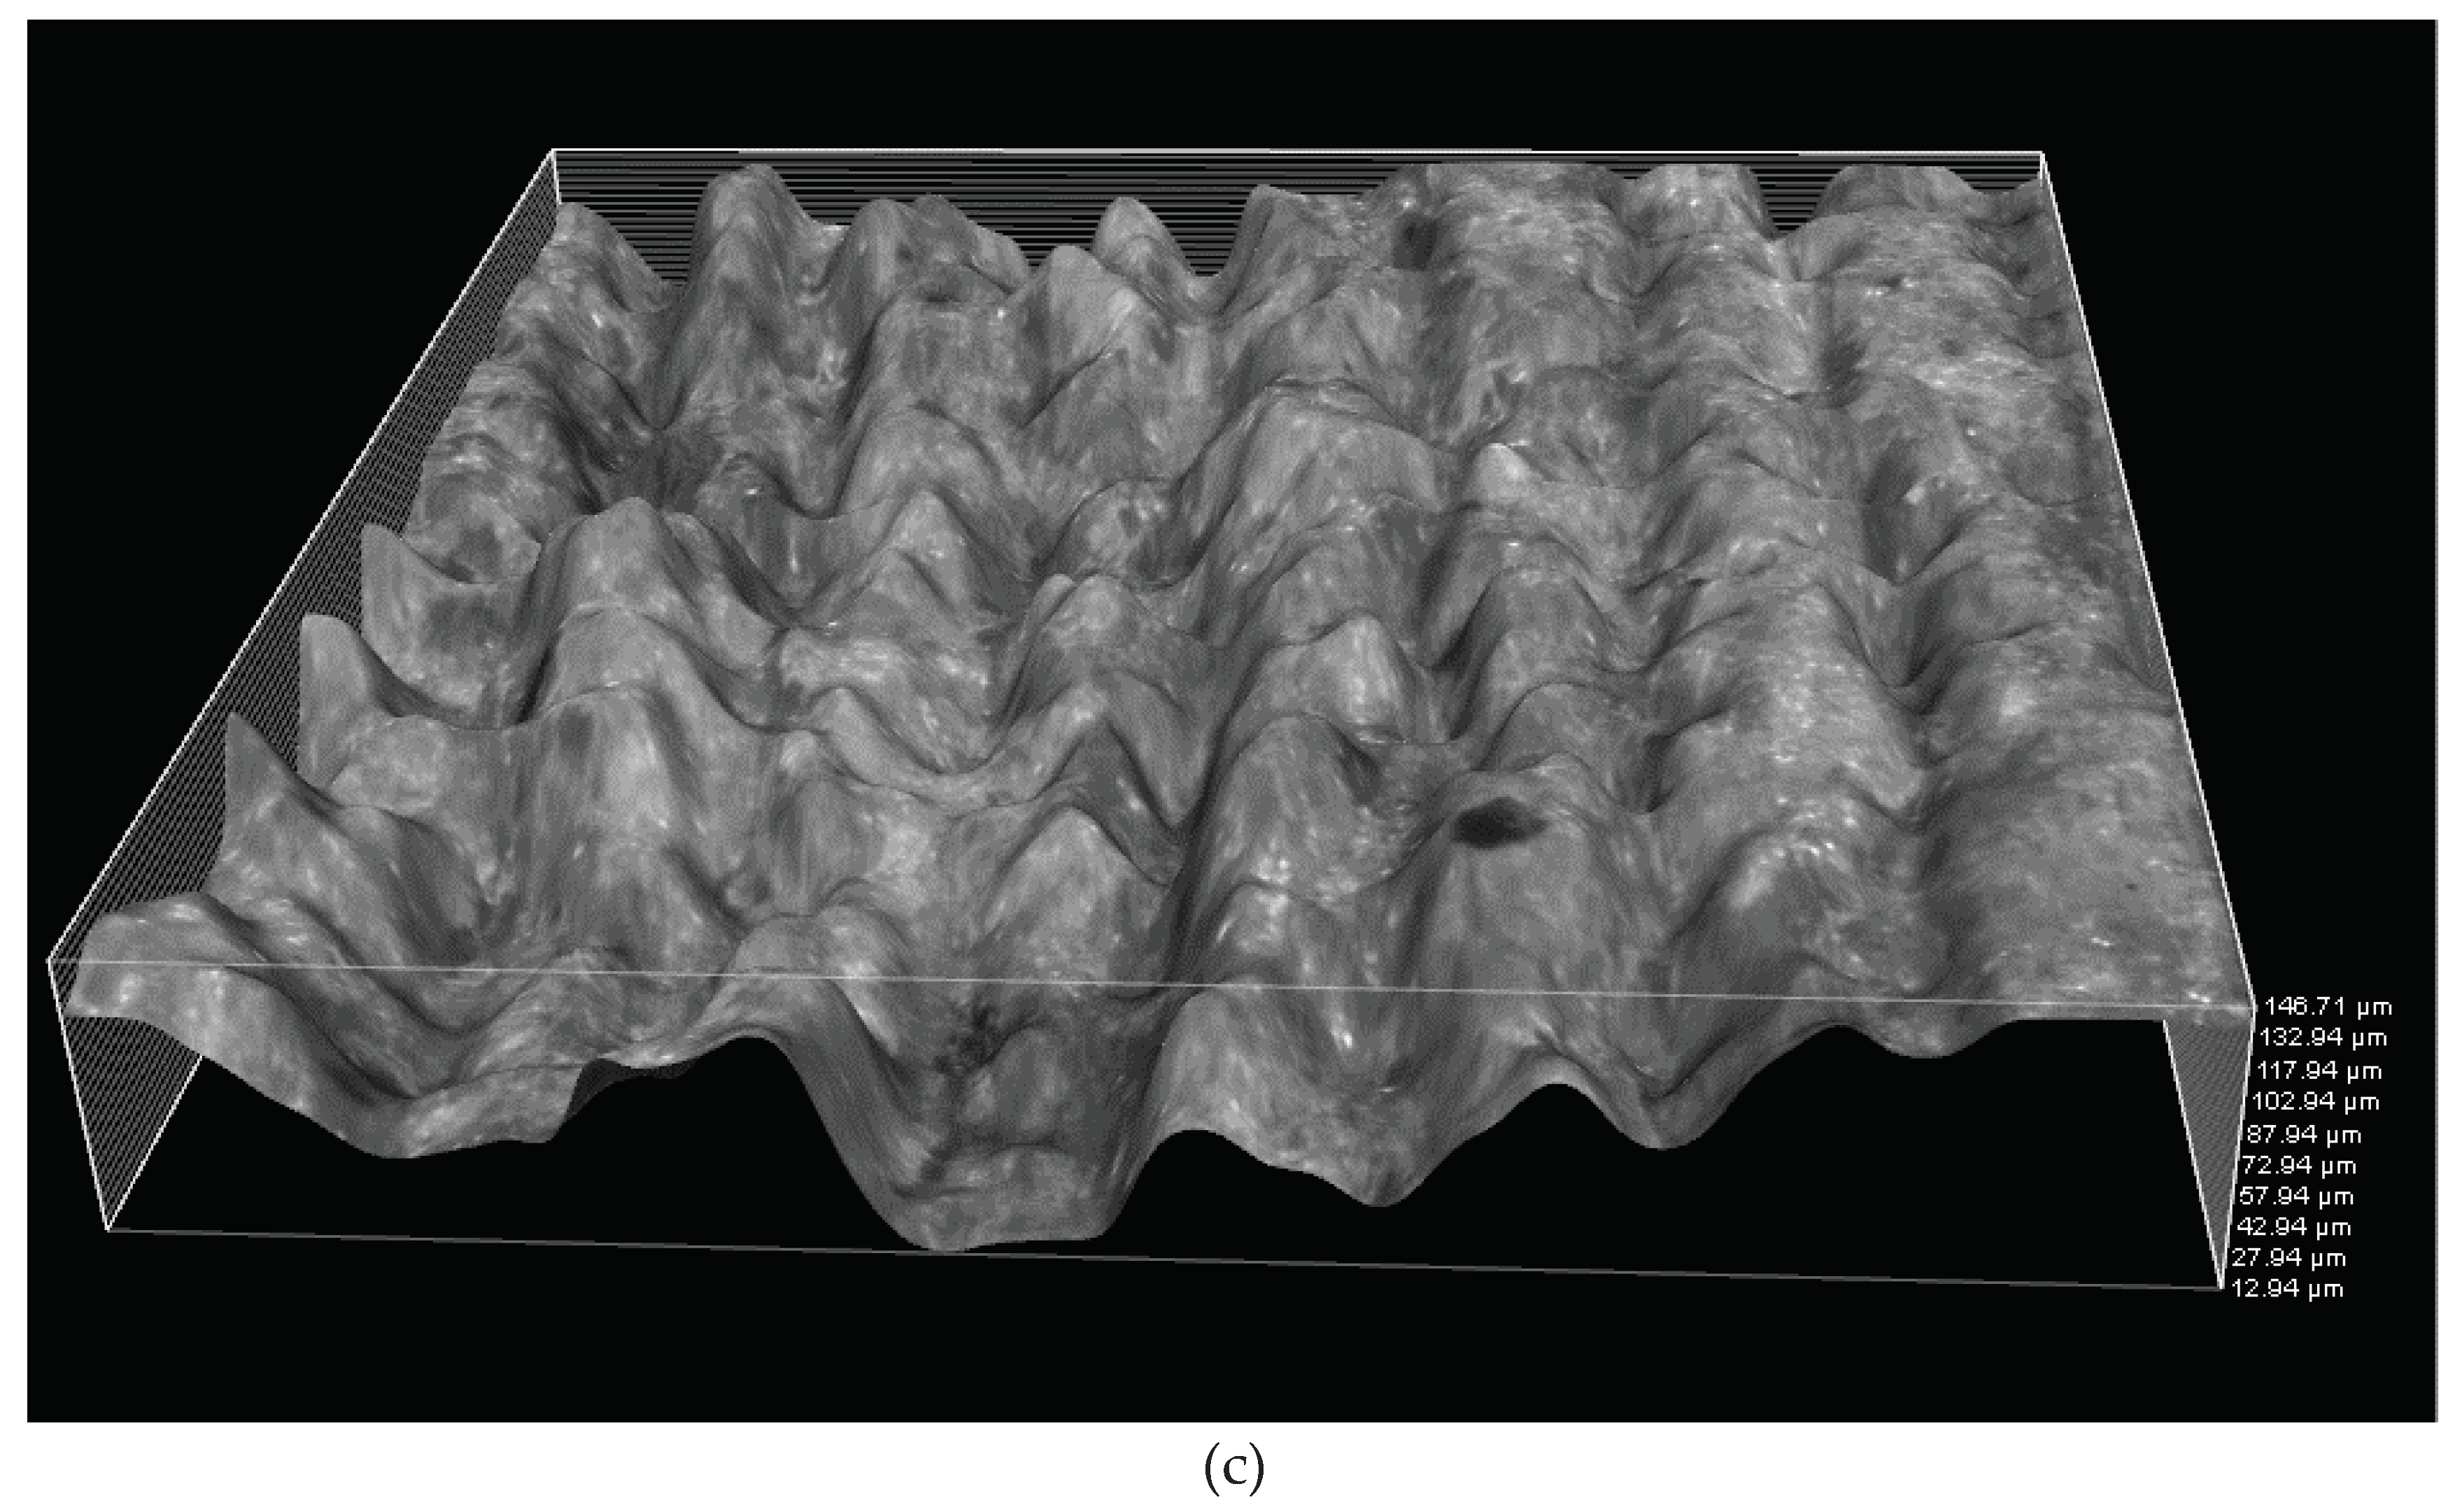
Figure 9 shows the microscopic images of the wood/PLA composites. The layers were clearly seen on the 3D printed specimens and the water absorption compromised the dimensional stability of the specimens by increasing the pore size, the layer size and the entire thickness of the sample. This effect was not as clear while using injection molding method for specimen preparation.
4. Discussion
Well established polymer processing technique, injection molding, is used for mass production of various plastic products while the recent advancements in additive manufacturing help in mass customization and rapid prototyping. The results from this work show that the specimens produced from injection molding and 3D printing vary in terms of mechanical and morphological properties. Furthermore, the parameter (layer thickness) set for the 3D printing also affected certain properties.
Water absorption of the specimens produced from these manufacturing techniques was affected by the material properties and the porosity. The water absorption of the injection molded specimens was primarily due to the material properties while the water absorption of the 3D printed specimens was due to the combination of intrinsic porosity of the 3D printing and the material properties. Water absorption in injected molded specimens is most likely due to the gradual absorption of water from surface to the core. Increasing the specimens’ surface contact with water in 3D printing increased the water absorption. Additionally, increasing the layer thickness in 3D printing increased the water absorption further.
Mechanical properties such as tensile and flexural properties were affected by the manufacturing methods. Injection molded specimens had higher density and better mechanical properties than 3D printed specimens due to solid specimens resulting in reduced failure sites. In the case of 3D printed specimens, the porosity reduced the density and increased the number of failure sites within the specimens. The manufacturing method of the specimens had a huge influence on the impact strength of the specimens. The water absorption of the specimens and the layer thickness in 3D printed specimens also affected the mechanical properties. These results from the above mechanical testing correlated closely with the results obtained from DMA.
Thermal properties of the specimens were not affected significantly on changing the manufacturing method. This was anticipated since the polymer processing temperatures in both methods were similar, and there will be minimal impact on the polymer’s molecular chains following injection molding and 3D printing. Water absorption had a negligible impact on thermal characteristics as well. Nevertheless, the glass transition and crystallization were impacted by the addition of wood flour to PLA. This results from the polymer chains’ limited mobility in the presence of reinforcing particles. TGA results conclude that there is no significant difference in thermal degradation of specimens produced by two different methods.
Morphological analysis shows the increase in the porosity on increasing the layer thickness. The different layers in 3D printing and their fusing points were also noticed. Layer distortion in 3D printed specimens was noticed on water absorption affecting the dimensional stability of the specimens. The results fall in line with the mechanical results obtained in this work.
Supplementary Materials
he following supporting information can be downloaded at the website of this paper posted on
Preprints.org. Table S1: Tensile and flexural properties of all the tested specimens in all tested conditions.
Author Contributions
Conceptualization, M.S. and S.K.R.; methodology, F.G., M.S. and S.K.R.; validation, P.F.M., M.S. and S.K.R.; investigation, P.F.M. and S.K.R.; writing—original draft preparation, P.F.M. and S.K.R..; writing—review and editing, P.F.M., F.G., M.S. and S.K.R.; supervision, S.K.R.; project administration, S.K.R. All authors have read and agreed to the published version of the manuscript.
Funding
This research received no external funding.
Institutional Review Board Statement
Not applicable.
Data Availability Statement
Data are available within the article.
Conflicts of Interest
The authors declare no conflict of interest.
References
- Kristiawan, R.B.; Imaduddin, F.; Ariawan, D.; Arifin, Z. A review on the fused deposition modeling (FDM) 3D printing: Filament processing, materials, and printing parameters. Open Eng. 2021, 11, 639–649. [Google Scholar] [CrossRef]
- Ayrilmis, N.; Kariz, M.; Kwon, J.H.; Kuzman, M. Effect of printing layer thickness on water absorption and mechanical properties of 3D-Printed wood/PLA composite materials. Int. J. Adv. Manuf. Technol. 2019, 102, 2195–2200. [Google Scholar] [CrossRef]
- Ayrilmis, N. Effect of layer thickness on surface properties of 3D printed materials produced from wood flour/PLA filament. Polym. Test. 2018, 71, 163–166. [Google Scholar] [CrossRef]
- Zandi, M.D.; Jerez-Mesa, R.; Llumà, J.; Jorba-Peiro, J.; Travieso-Rodriguez, A. A comparative study of Tensile Properties between Fused Filament Fabricated and Injection-Molded Wood-PLA composite parts. Int. J. Adv. Manuf. Technol. 2020, 108, 1725–1735. [Google Scholar] [CrossRef]
- Almansoori, K.; Pervaiz, S. Effect of layer height, print speed and cell geometry on mechanical properties of marble PLA based 3D printed parts. Smart Mater. Manuf. 2023, 1. [Google Scholar] [CrossRef]
- Tranter, J.B.; Refalo, P.; Rochman, A. Towards Sustainable Injection molding of ABS plastic products. J. Manuf. Process. 2017, 29, 399–406. [Google Scholar] [CrossRef]
- Chandran, V.; Kalman, J.; Fayazbakhsh, K.; Bougherara, H. A comparative study of tensile properties of injection molded and 3D printed PLA specimens in dry and water saturated conditions. Journal of Mech. Sci. Technol. 2020, 23, 1261–1269. [Google Scholar]
- Bhayana, M.; Singh, J.; Sharma, A.; Gupta, M. A review on optimized FDM 3D printed Wood/PLA bio composite. Mater. Today Proc. 2023, 2214–7853. [Google Scholar]
- Romero, A.; Piovan, M.; Mainetti, C.; Stechina, D.; Mendoza, S.; Martín, H.; Maggi, C. Tensile Properties of 3D printed polymeric pieces:comparison of several testing setups. Ing. E Investig. 2021, 41, 1–7. [Google Scholar]
- ISO 527-1:2019, Plastics: Determination of tensile properties, 2019.
- ISO 178:2019, Plastics: Determination of flexural properties, 2019.
- Kovan, V.; Tezel, T.; Camurlu, H.E.; Topal, E.S. Effect of printing Parameters on mechanical properties of 3D-Printed PLA/carbon fibre composites. Mater. Science. Non-Equilib. Phase Transform. 2018, 4, 126–128. [Google Scholar]
- Siva, R.; Nemali, S.S.R.; Kunchapu, S.K.; Gokul, K.; Kumar, T.A. Comparison of Mechanical Properties and Water Absorption Test on Injection Molding and Extrusion - Injection Molding Thermoplastic Hemp Fiber Composite. Mater. Today Proc. 2021, 47, 4382–4386. [Google Scholar] [CrossRef]
- ISO 179-2:2020, Plastics: Determination of Charpy impact properties, 2020.
- Mohamed, O.A.; Masood, S.H.; Bhowmik, J.L. Characterization and dynamic mechanical analysis of PC-ABS material processed by fused deposition modelling: An investigation through I-optimal response surface methodology. Measurement 2017, 107, 128–141. [Google Scholar] [CrossRef]
- Blum, F.D.; Krisanangkura, P. Comparison of differential scanning calorimetry, FTIR, and NMR to measurements of adsorbed polymers. Thermochim. Acta 2009, 492, 55–60. [Google Scholar] [CrossRef]
- Åkesson, D.; Vrignaud, T.; Tissot, C.; Skrifvars, M. Mechanical recycling of PLA filled with a high level of cellulose fibres. J. Polym. Environ. 2016, 24, 185–195. [Google Scholar] [CrossRef]
- Wang, S.; Ma, Y.; Deng, Z.; Zhang, S.; Cai, J. Effects of fused deposition modeling process parameters on tensile, dynamic mechanical properties of 3D printed polylactic acid materials. Polym. Test. 2020, 86. [Google Scholar] [CrossRef]
- Ramamoorthy, S.K.; Bakare, F.; Herrmann, R.; Skrifvars, M. Performance of biocomposites from surface modified regenerated cellulose fibers and lactic acid thermoset bioresin. Cellulose 2015, 22, 2507–2528. [Google Scholar] [CrossRef]
Figure 1.
(a) Schematic illustration of the geometry of the 3D printed specimens, (b) 3D CAD model of tensile test specimens in SolidWorks, (c) Sliced 3D model in Simplify 3D showing layers and fill, and (d) 3D printing of flexural test specimens through 0.4 mm nozzle in BCN3D Sigma 3D printer.
Figure 1.
(a) Schematic illustration of the geometry of the 3D printed specimens, (b) 3D CAD model of tensile test specimens in SolidWorks, (c) Sliced 3D model in Simplify 3D showing layers and fill, and (d) 3D printing of flexural test specimens through 0.4 mm nozzle in BCN3D Sigma 3D printer.
Figure 2.
Water absorption of specimens prepared from injection molding and 3D printing.
Figure 2.
Water absorption of specimens prepared from injection molding and 3D printing.
Figure 3.
Mechanical properties of the specimens prepared using injection molding and 3D printing (0.3 layer thickness) (a) Tensile strength, (b) Tensile modulus, (c) Flexural strength, and (d) Flexural modulus of the specimens.
Figure 3.
Mechanical properties of the specimens prepared using injection molding and 3D printing (0.3 layer thickness) (a) Tensile strength, (b) Tensile modulus, (c) Flexural strength, and (d) Flexural modulus of the specimens.
Figure 4.
Mechanical properties of the specimens prepared using injection molding (IM) and 3D printing (3D, 0.3 layer thickness), both pre- and post-water immersion (a) Tensile strength, (b) Tensile modulus, (c) Flexural strength, and (d) Flexural modulus of the specimens.
Figure 4.
Mechanical properties of the specimens prepared using injection molding (IM) and 3D printing (3D, 0.3 layer thickness), both pre- and post-water immersion (a) Tensile strength, (b) Tensile modulus, (c) Flexural strength, and (d) Flexural modulus of the specimens.
Figure 5.
Mechanical properties of the specimens prepared using 3D printing with two different layer thicknesses, 0.2 and 0.3 layer thickness, (a) Tensile strength, (b) Tensile modulus, (c) Flexural strength, and (d) Flexural modulus of the specimens.
Figure 5.
Mechanical properties of the specimens prepared using 3D printing with two different layer thicknesses, 0.2 and 0.3 layer thickness, (a) Tensile strength, (b) Tensile modulus, (c) Flexural strength, and (d) Flexural modulus of the specimens.
Figure 6.
TGA graphs of PLA and wood/PLA (a) comparison of manufacturing technologies on thermal degradation, (b) one-step degradation of PLA and two-step degradation of wood/PLA, (c) Comparison of wet and dry samples on thermal degradation.
Figure 6.
TGA graphs of PLA and wood/PLA (a) comparison of manufacturing technologies on thermal degradation, (b) one-step degradation of PLA and two-step degradation of wood/PLA, (c) Comparison of wet and dry samples on thermal degradation.
Figure 7.
Fractured surface’s microscopic images of PLA (a) 0.2 mm layer thickness 3D printed specimen, (b) 0.3 mm layer thickness 3D printed specimen, and (c) injection molded specimen.
Figure 7.
Fractured surface’s microscopic images of PLA (a) 0.2 mm layer thickness 3D printed specimen, (b) 0.3 mm layer thickness 3D printed specimen, and (c) injection molded specimen.
Figure 8.
Three dimensional image of the cross-section of unfractured surface of 3D printed PLA specimen having layer thickness 0.2 mm.
Figure 8.
Three dimensional image of the cross-section of unfractured surface of 3D printed PLA specimen having layer thickness 0.2 mm.
Figure 9.
Microscopic images of 3D printed wood/PLA specimens having 0.2 layer thickness (a) cross-section of dry unfractured surface, (b) three dimensional image of the cross-section of dry unfractured surface, and (c) three dimensional image of the cross-section of wet unfractured surface.
Figure 9.
Microscopic images of 3D printed wood/PLA specimens having 0.2 layer thickness (a) cross-section of dry unfractured surface, (b) three dimensional image of the cross-section of dry unfractured surface, and (c) three dimensional image of the cross-section of wet unfractured surface.
Table 1.
3D printer settings of polymers and composites.
Table 1.
3D printer settings of polymers and composites.
| Settings |
PLA |
ABS |
Wood/PLA |
| Nozzle diameter, mm |
0.4 |
0.4 |
0.4 |
| Infill/% |
100 |
100 |
100 |
| Layer thickness, mm |
0.2, 0.3 |
0.2, 0.3 |
0.2, 0.3 |
| Print speed, mm/s |
5 |
5 |
5 |
| Nozzle temperature, ℃ |
200 |
250 |
210 |
| Bed temperature, ℃ |
60 |
80 |
60 |
Table 2.
Charpy impact strength of the specimens tested both edgewise and flatwise.
Table 2.
Charpy impact strength of the specimens tested both edgewise and flatwise.
| |
Manufacturing Method |
Specimen |
Impact Strength,
Edgewise
(kJ/m2) |
Impact Strength,
Flatwise
(kJ/m2) |
| DRY |
IM |
PLA |
67.7 (22.8) |
15.7 (2.5) |
| ABS |
19.9 (1.6) |
84.6 (0.1) |
| Wood/PLA |
25.2 (2.5) |
17.2 (0.7) |
| 3D Printing (0.2) |
PLA |
12.3 (2.8) |
11.1 (2.0) |
| ABS |
25.5 (2.9) |
37.9 (2.5) |
| Wood/PLA |
8.3 (0.4) |
7.8 (0.1) |
| 3D Printing (0.3) |
PLA |
13.5 (1.3) |
9.9 (1.3) |
| ABS |
26.7 (3.4) |
27.9 (1.3) |
| Wood/PLA |
9.5 (1.3) |
7.3 (0.6) |
| WET |
IM |
PLA |
50.1 (20.1) |
15.9 (1.1) |
| ABS |
15.4 (1.8) |
83.3 (0.1) |
| Wood/PLA |
22.3 (0.9) |
17.2 (1.7) |
| 3D Printing (0.2) |
PLA |
13.6 (2.4) |
12.7 (2.8) |
| ABS |
22.2 (4.9) |
29.3 (3.6) |
| Wood/PLA |
9.9 (0.8) |
9.2 (0.4) |
| 3D Printing (0.3) |
PLA |
12.5 (0.4) |
9.5 (1.5) |
| ABS |
25.2 (1.9) |
23.7 (2.6) |
| Wood/PLA |
7.3 (1.2) |
7.2 (0.8) |
Table 3.
Storage moduli (E′), loss moduli (E″) and damping factors of injection molded and 3D printed Specimens.
Table 3.
Storage moduli (E′), loss moduli (E″) and damping factors of injection molded and 3D printed Specimens.
| Manufacturing Method |
Specimen |
Storage Modulus,
E’ Max
(MPa) |
Loss Modulus,
E’’ Max
(MPa) |
Damping Factor
Tan δ
(×10-2) |
| IM |
PLA |
2321 |
432 |
18.6 |
| ABS |
1236 |
172 |
13.9 |
| Wood/PLA |
1682 |
220 |
13.0 |
| 3D Printing (0.2) |
PLA |
2365 |
440 |
18.6 |
| ABS |
1450 |
195 |
13.4 |
| Wood/PLA |
1044 |
128 |
12.3 |
| 3D Printing (0.3) |
PLA |
1906 |
326 |
17.1 |
| ABS |
1247 |
163 |
13.1 |
| Wood/PLA |
928 |
117 |
12.6 |
Table 4.
Glass transition-, crystallization- and melting-temperatures of PLA and their composites obtained from DSC.
Table 4.
Glass transition-, crystallization- and melting-temperatures of PLA and their composites obtained from DSC.
| |
Manufacturing Method |
Specimen |
Tg
°C |
Tc
°C |
Tm
°C |
| DRY |
IM |
PLA |
54.0 |
109.7 |
159.4 |
| Wood/PLA |
57.3 |
86.7 |
148.8 |
| 3D Printing |
PLA |
53.9 |
109.7 |
159.9 |
| Wood/PLA |
57.1 |
86.7 |
149.2 |
| WET |
IM |
PLA |
53.3 |
109.3 |
159.2 |
| Wood/PLA |
56.4 |
86.9 |
149.0 |
| 3D Printing |
PLA |
53.8 |
109.3 |
159.2 |
| Wood/PLA |
57.7 |
86.7 |
149.5 |
Table 5.
Glass transition temperatures of PLA and their composites obtained from DMA.
Table 5.
Glass transition temperatures of PLA and their composites obtained from DMA.
| Manufacturing Method |
Specimen |
Tg from E’
°C |
Tg from E’’
°C |
Tg from tan δ
°C |
| IM |
PLA |
54.3 |
54.7 |
61.3 |
| Wood/PLA |
61.3 |
61.9 |
66.7 |
| 3D Printing (0.2) |
PLA |
53.5 |
53.9 |
60.7 |
| Wood/PLA |
60.8 |
61.1 |
67.0 |
| 3D Printing (0.3) |
PLA |
53.6 |
53.6 |
61.1 |
| Wood/PLA |
61.2 |
61.5 |
68.0 |
|
Disclaimer/Publisher’s Note: The statements, opinions and data contained in all publications are solely those of the individual author(s) and contributor(s) and not of MDPI and/or the editor(s). MDPI and/or the editor(s) disclaim responsibility for any injury to people or property resulting from any ideas, methods, instructions or products referred to in the content. |
© 2024 by the authors. Licensee MDPI, Basel, Switzerland. This article is an open access article distributed under the terms and conditions of the Creative Commons Attribution (CC BY) license (http://creativecommons.org/licenses/by/4.0/).
