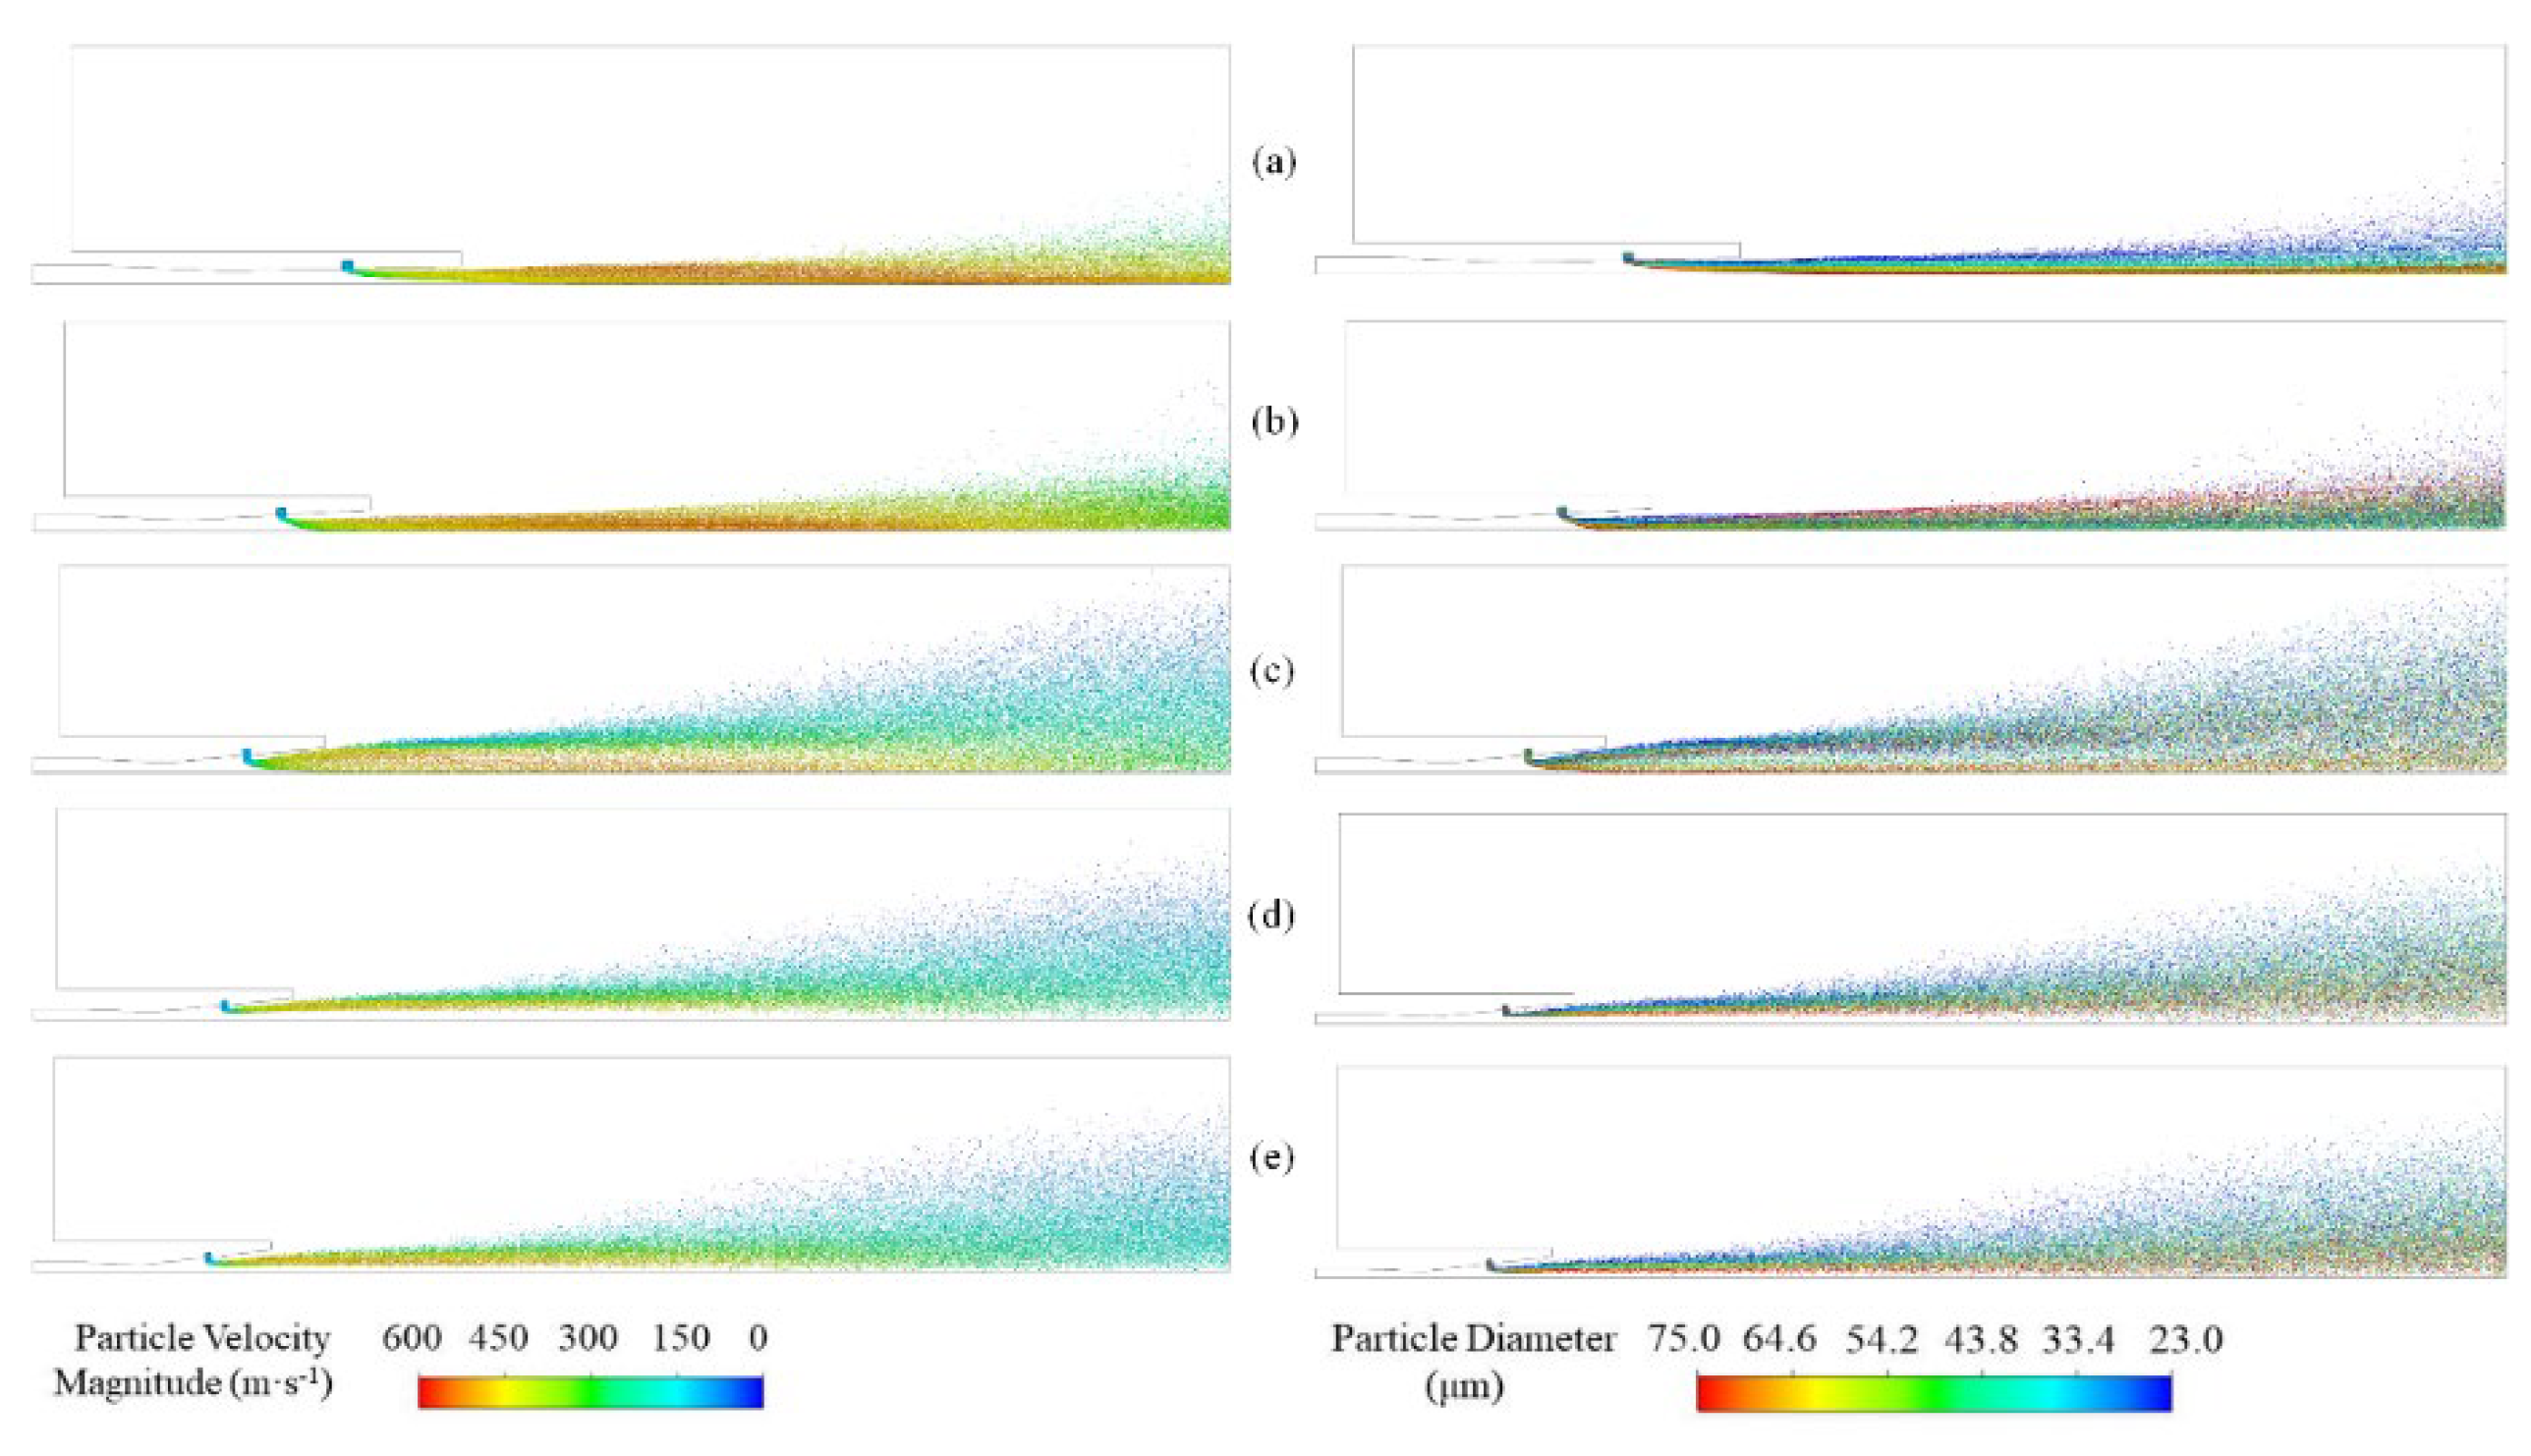
4.1. Effect of length ratio rL
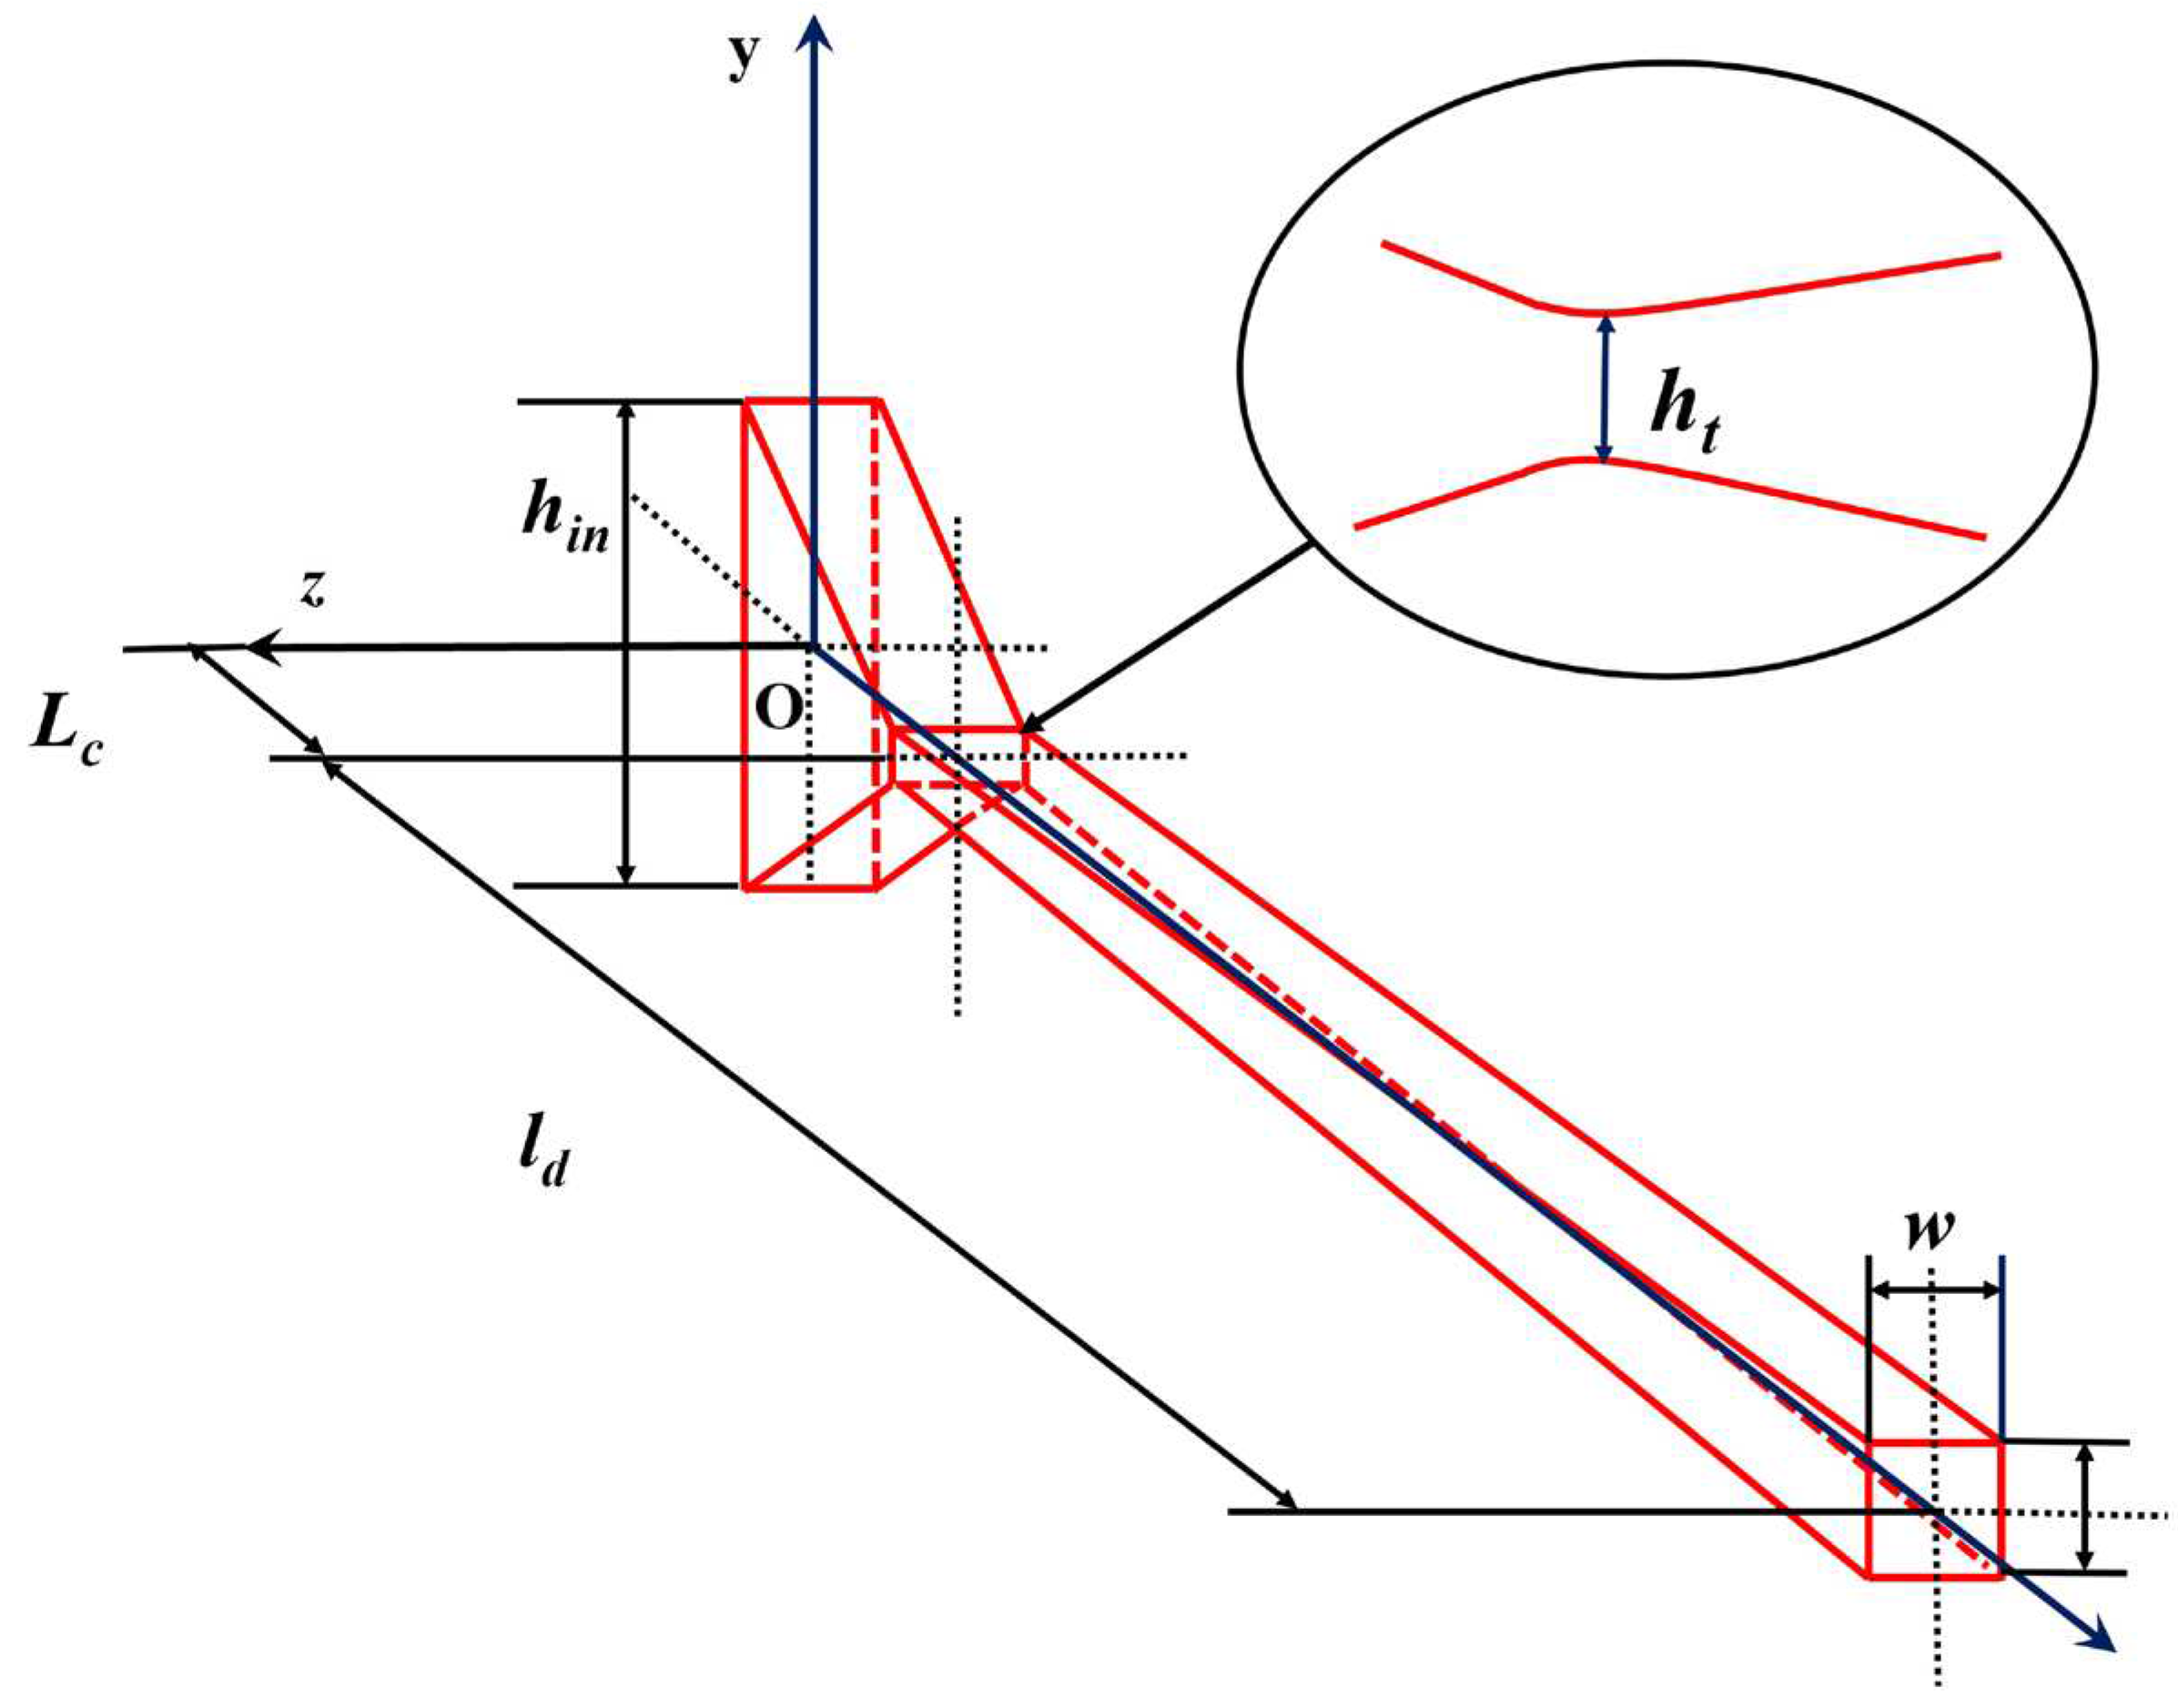
In order to study the effect of the length ratio (the ratio of the length ld of the expanding section to the length lc of the converging section) rL, the flow field was simulated for five sets of length ratios with different rL under the condition of area ratio rA=4.
In choosing the scope of the parametric study, the coordinate system used in this paper is a two-dimensional dimensionless coordinate system based on the geometrical model used. The origin of this coordinate system is set at the outlet of the nozzle with the following expressions: X=(x–ls–lc–ld)/de and Y=y/de. In this paper, two cross-sections corresponding to X = 10 (denoted as ζ10) and X = 20 (denoted as ζ20) for the jet initiation and main body segments, respectively, are selected for parametric studies. The jet main section is generally the working range of the fire extinguisher, and in combination with the jet initiation section it provides a more complete picture of the development of the jet.
The analysis reveals that
vp,a10 and
vp,a20 monotonically increase and
Φvp10,
Φvp20,
Ψp10 and
Ψp20 monotonically decrease with increasing
rL. Specifically, when
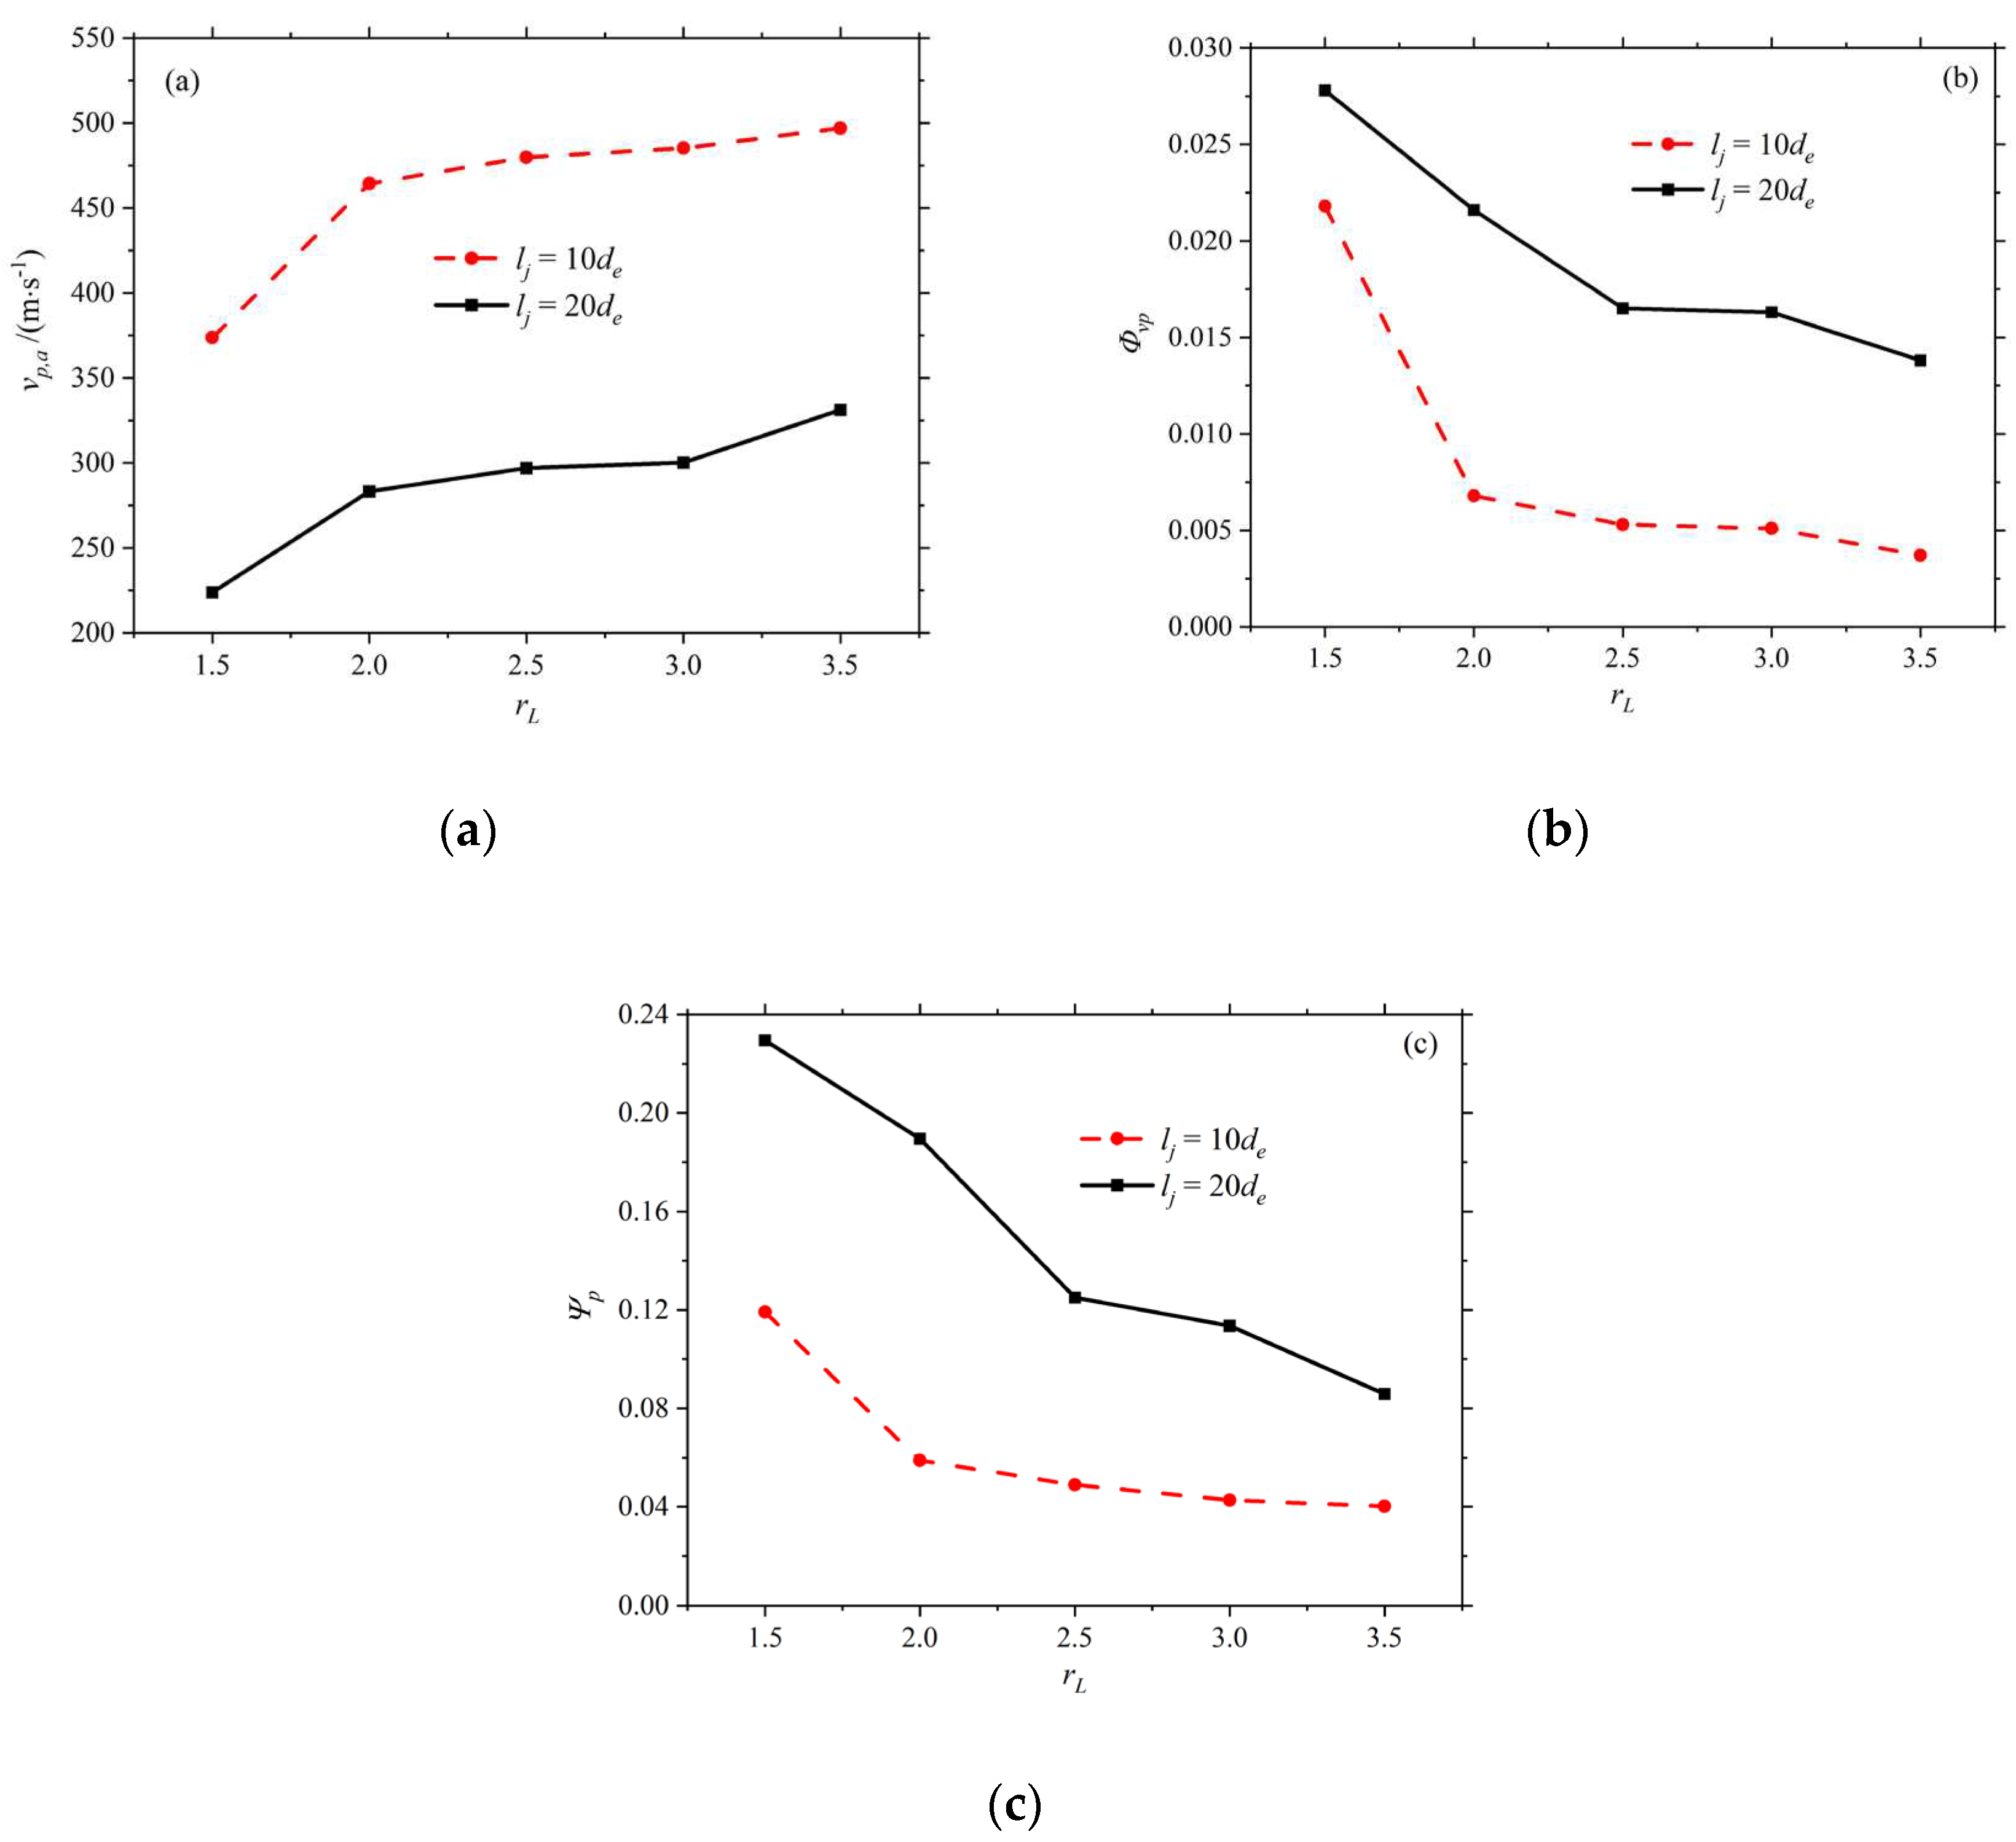
rL was increased from 1.5 to 3.5, the performance indexes of the jet were 373.71 to 497.01 m/s for
vp,a10, 223.77 to 331.16 m/s for
vp,a20, 0.0218 to 0.0037 for
Φvp10, 0.0278 to 0.0138 for
Φvp20, 0.1191 to 0.0402 for
Ψp10, and
Ψp20 was 0.2295 to 0.0858. It can be seen that the relative variation of the parameters with
rL is very significant, which, from a practical application point of view, implies that it is necessary to choose the nozzle length ratio appropriately in order to balance the fire range and the extinguishing efficiency.
Figure 8a–c show the variation of particle mean velocity
vp,a, velocity inhomogeneity
Φvp and dispersion
Ψp with length ratio
rL.
These variations arise mainly from the complex changes generated by the gas flow field that follows the variation of the length ratio.
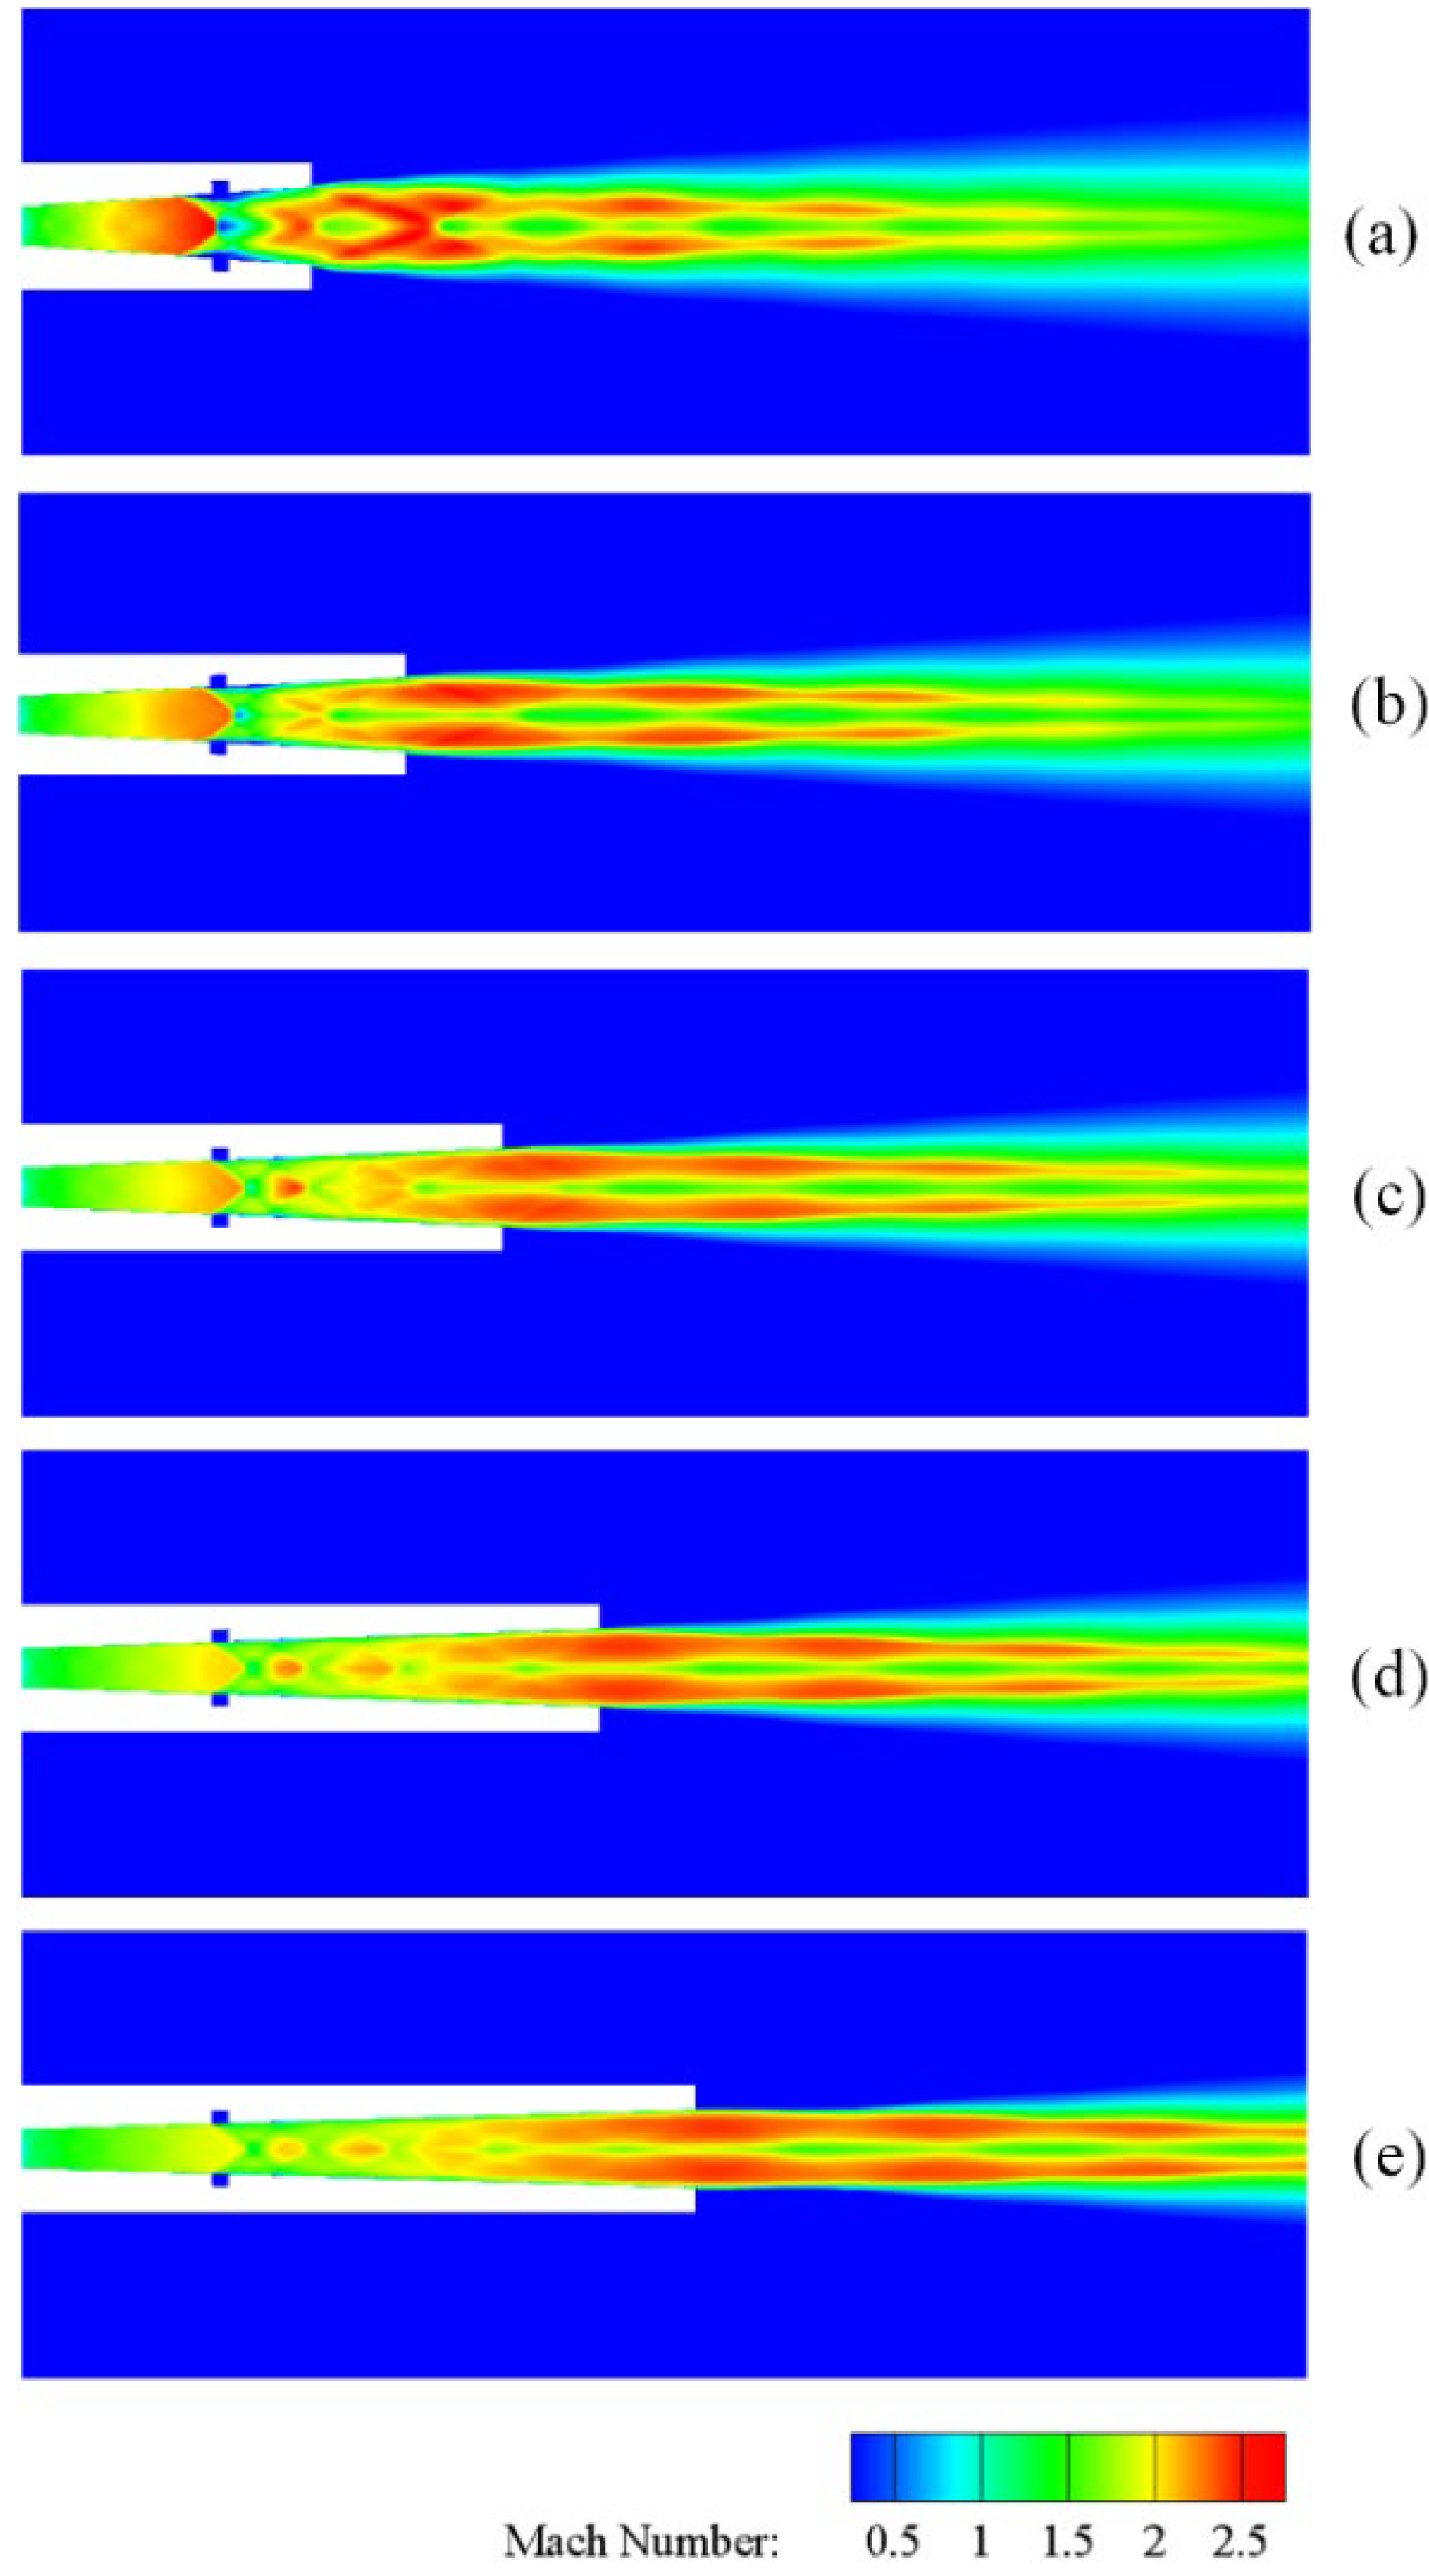
Figure 9a–e show a cloud of gas Mach number contours for different length ratios
rL. When
rL increases, the Mach reflection structure produces a significant change, with the intensity of both the incident oblique shock wave and the central Mach disk decreasing. The intensity of the shock wave of the Mach disk is closer to the positive shock wave in the case of
rL=1.5, and the position of the Mach disk is in front of the injector. The center region of the core region of the jet is gradually occupied by a subsonic region, whose radial size increases significantly while its axial size decreases. As
X increases, the expansion and oblique shock wave (or compression) waves continue to weaken, and the
Ma distribution within the jet sound line at each cross-section becomes more uniform. We analyze the
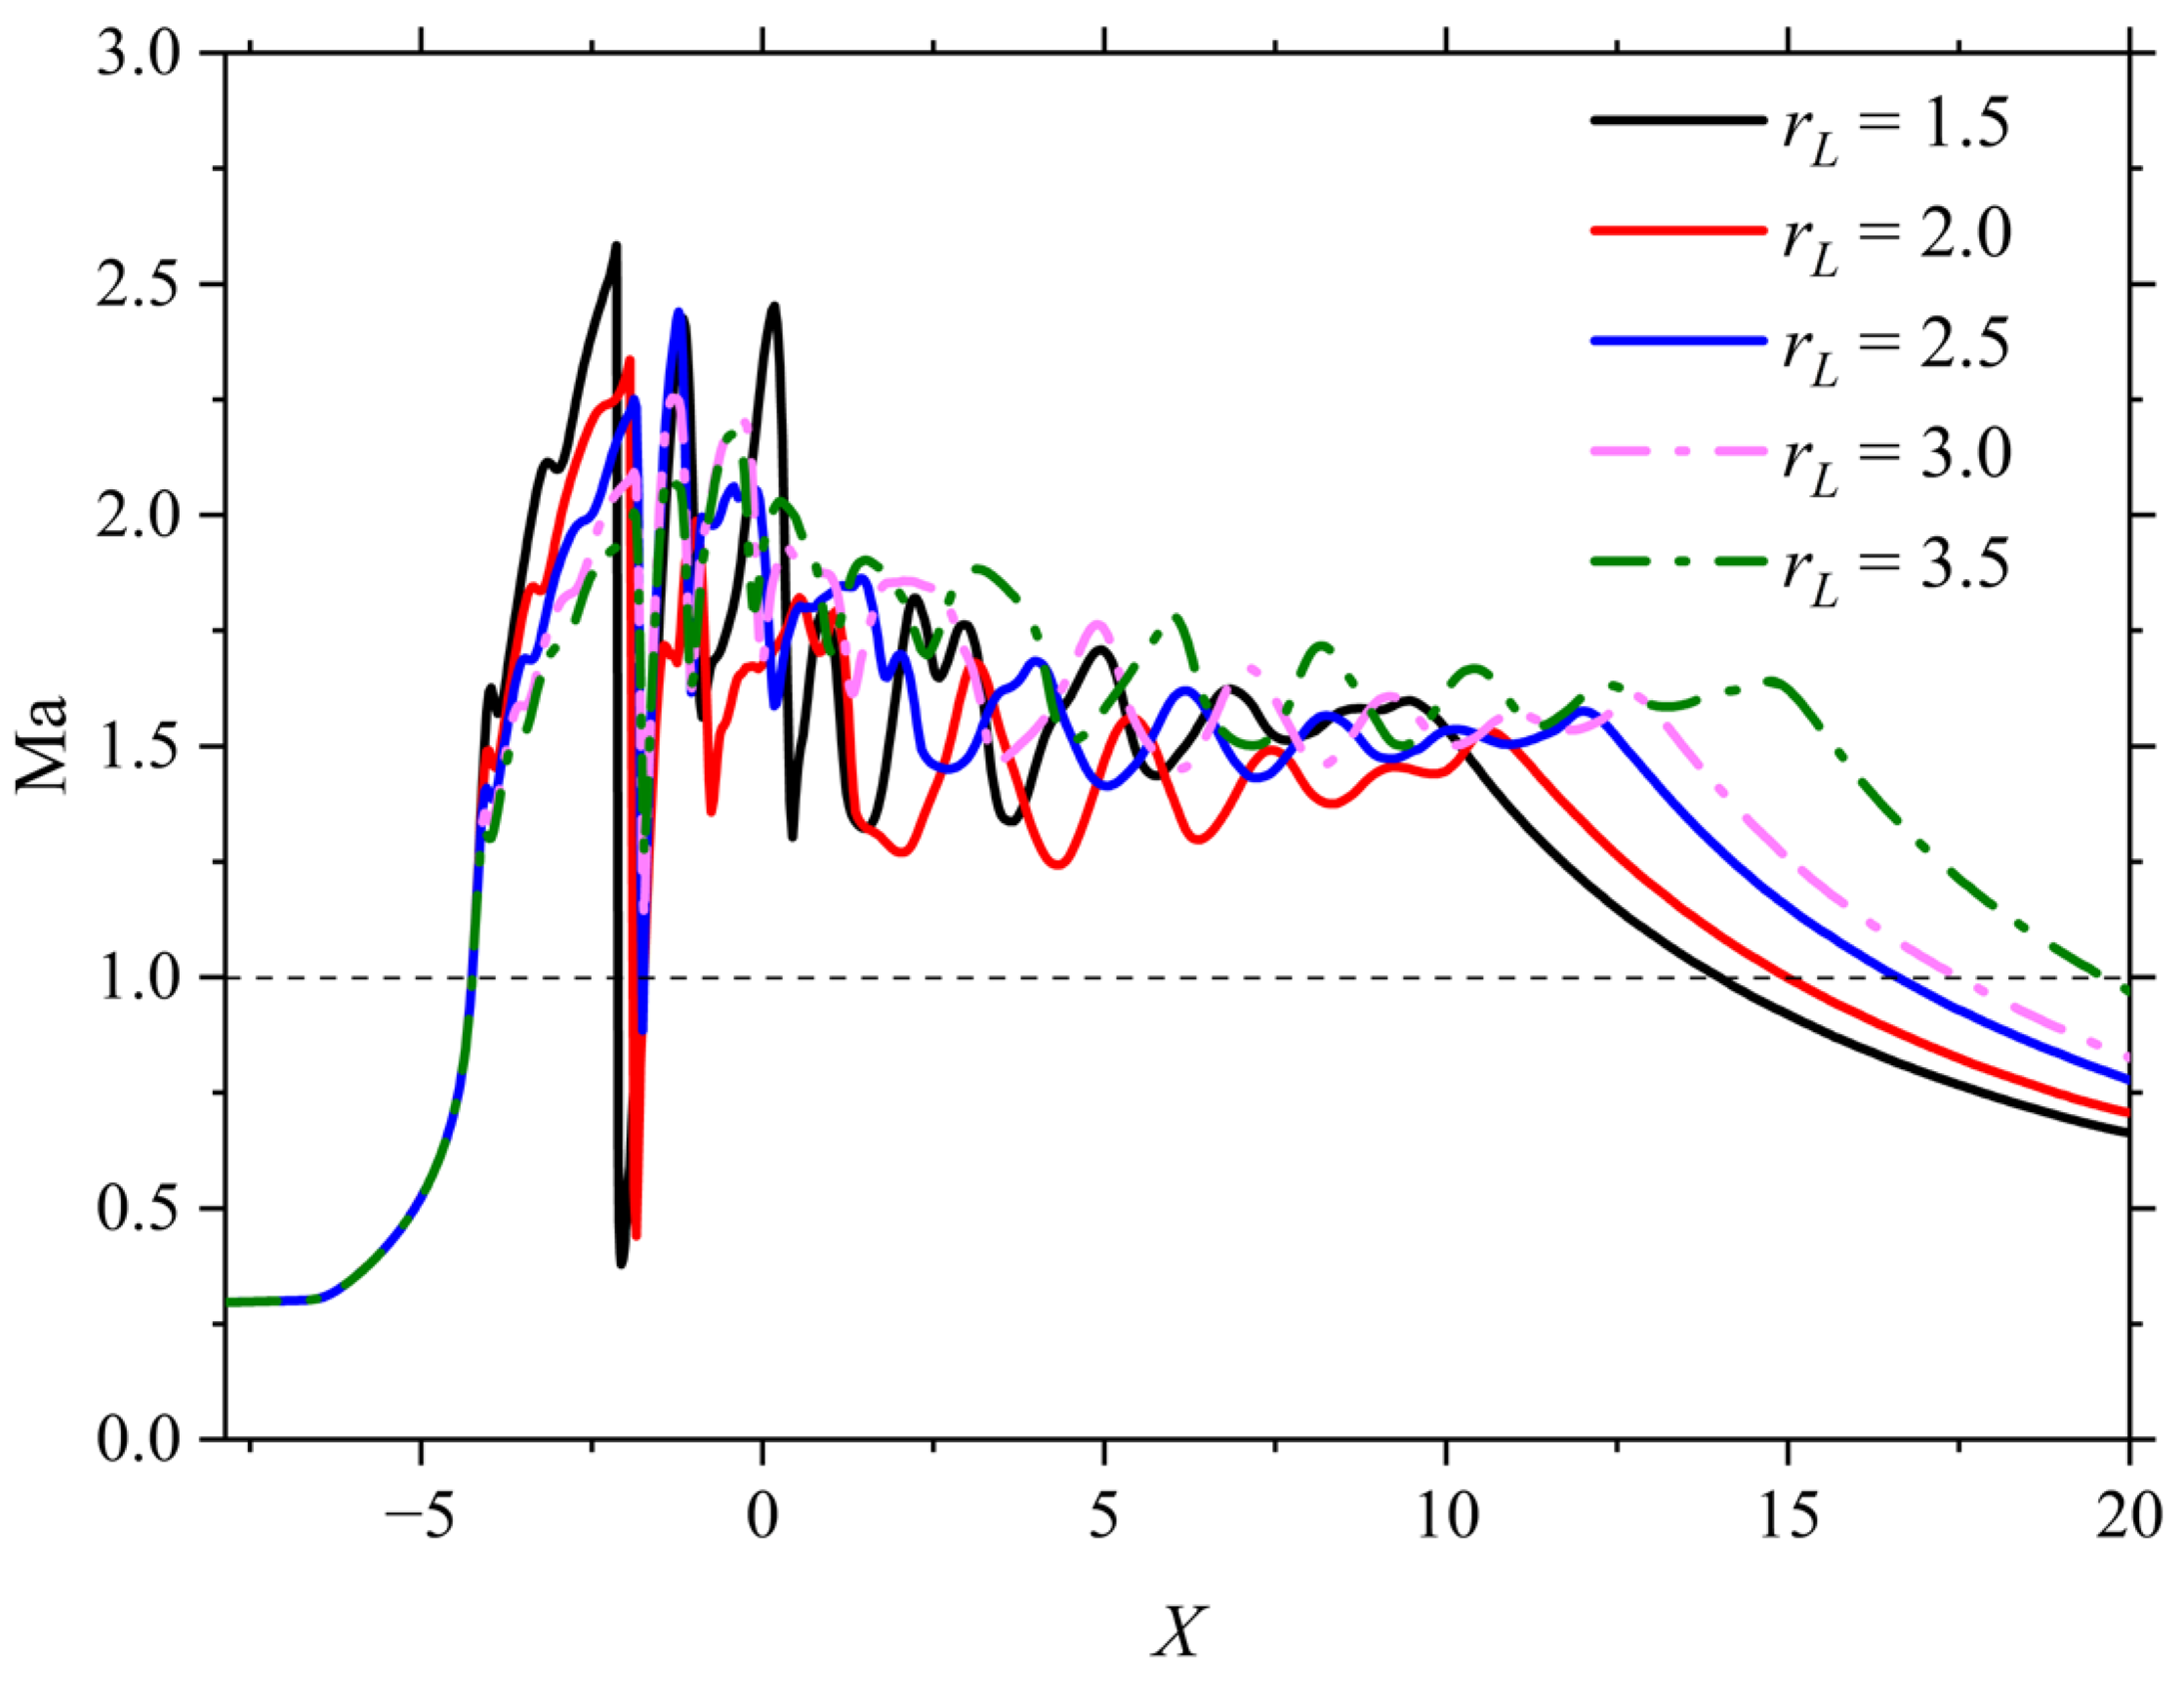
Ma change of the gas flow along the axis for different length ratios
rL (
Figure 10). It can be found that the difference in
Ma variation upstream of the Mach disk is significant, indicating that the upstream expansion of the gas is affected by the increase in the length ratio
rL. The increase in
rL leads to a decrease in the pre-shock peak and an increase in the post-shock trough of
Ma upstream and downstream of the Mach disk, indicating a simultaneous slight decrease in the localized shock wave strength of the Mach disk and the incident oblique shock wave. In addition, each curve of
Ma shows asynchronous oscillations in the subsequent part, which explains the fact that the increase of
rL affects the axial position of the expansion and oblique shock wave (or compression) waves, and to some extent also their intensity.
Changes in the structure of the Mach disk directly affect the velocity of the particles in it, with particles in different regions obtaining different accelerations. The smaller the particle diameter, the better it follows the gas flow field, and the slightly greater the acceleration.
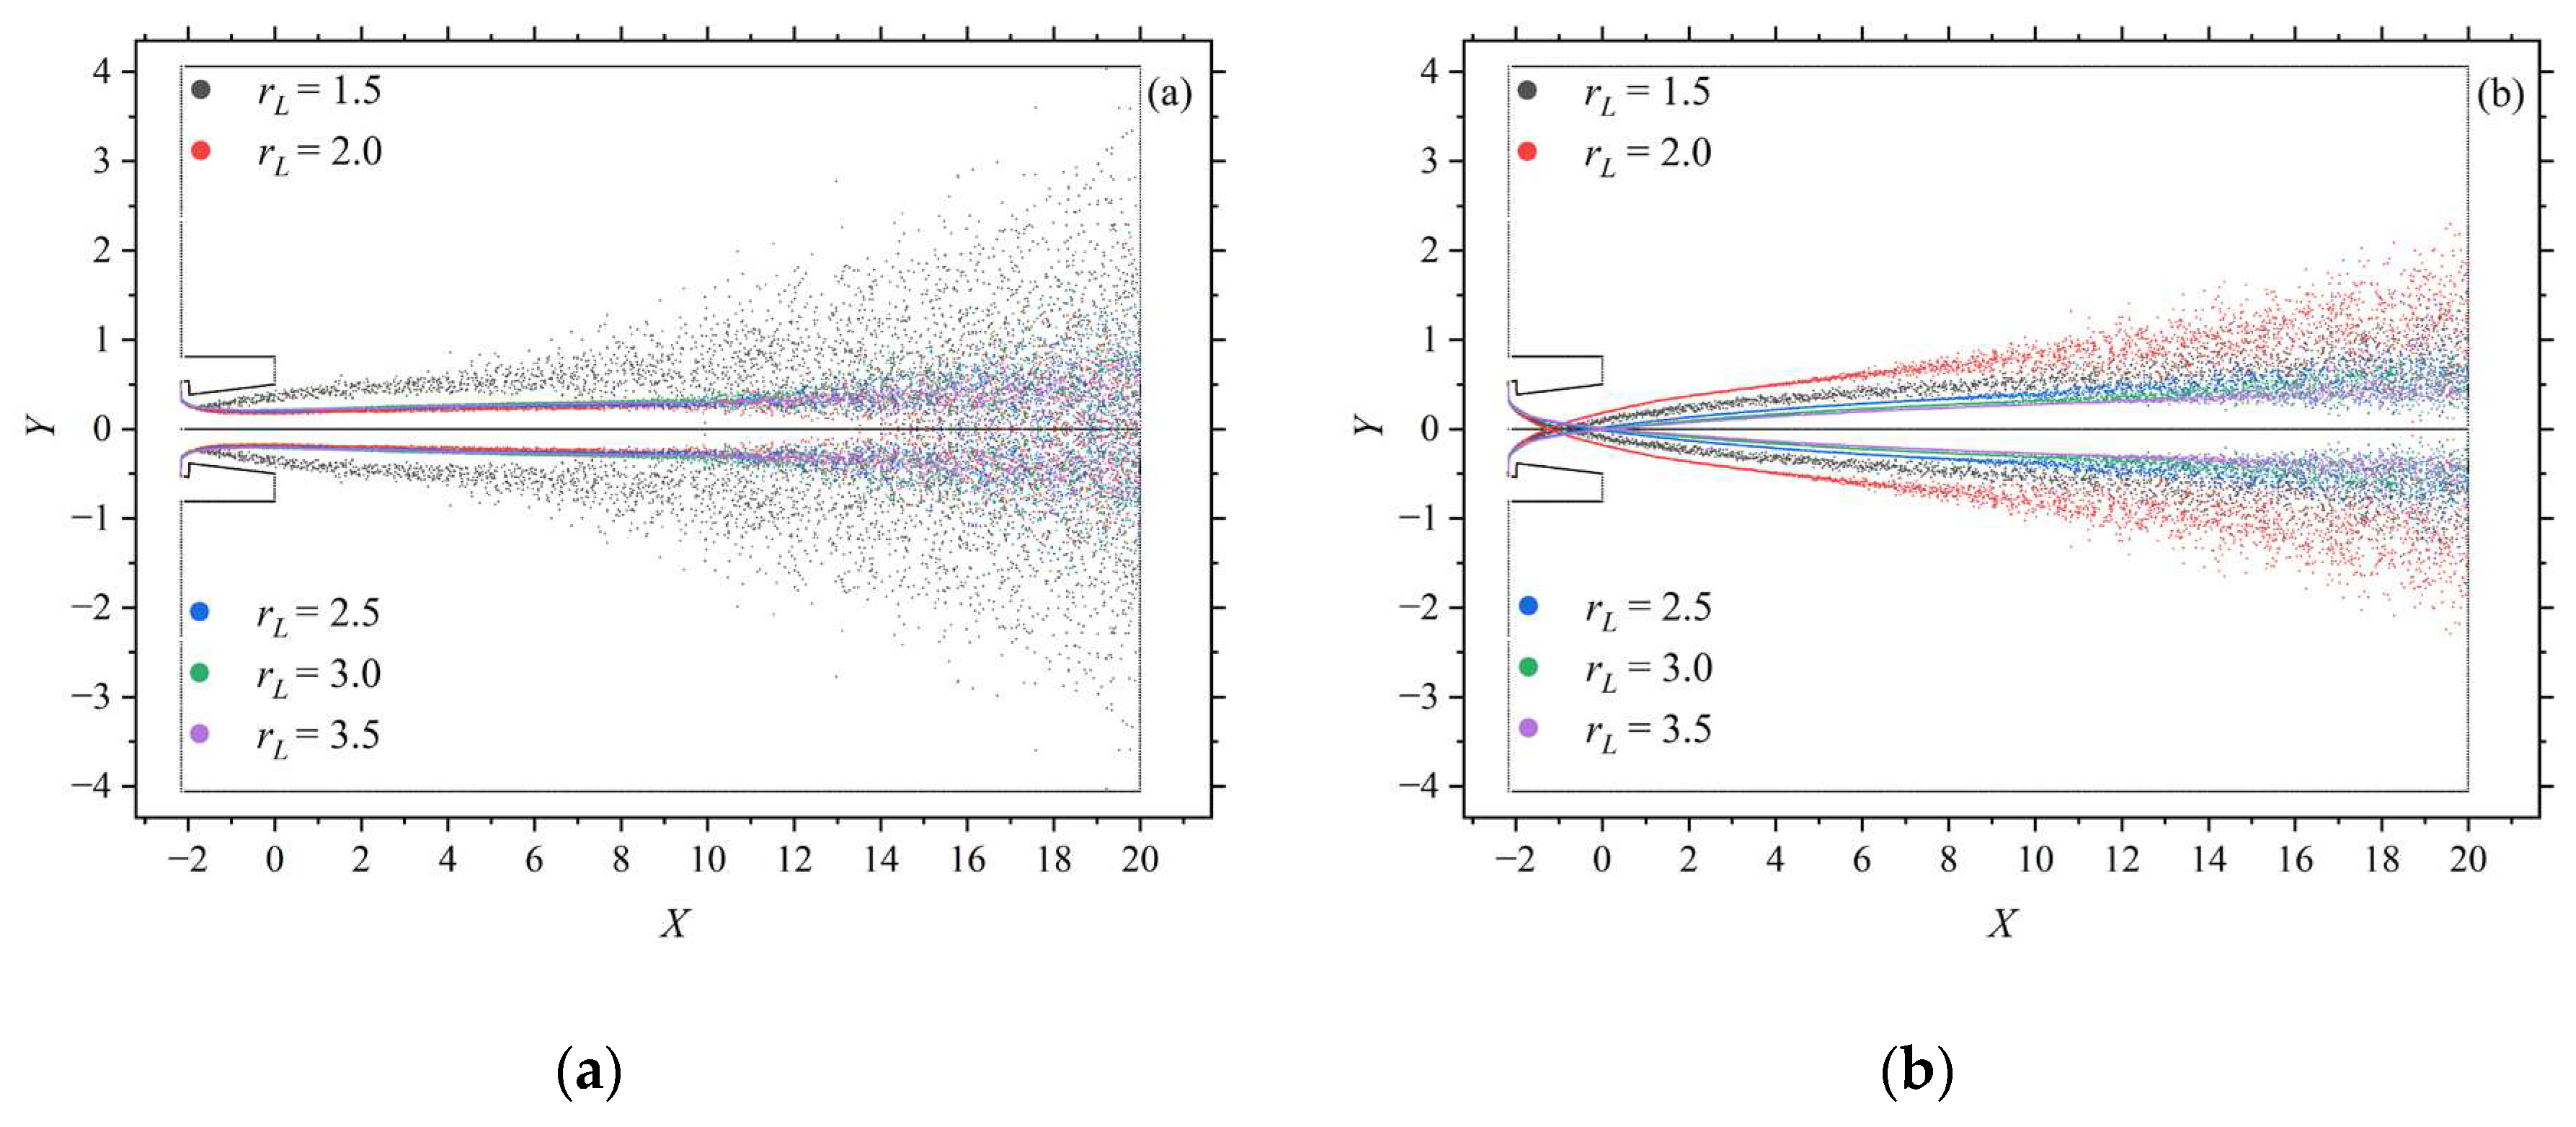
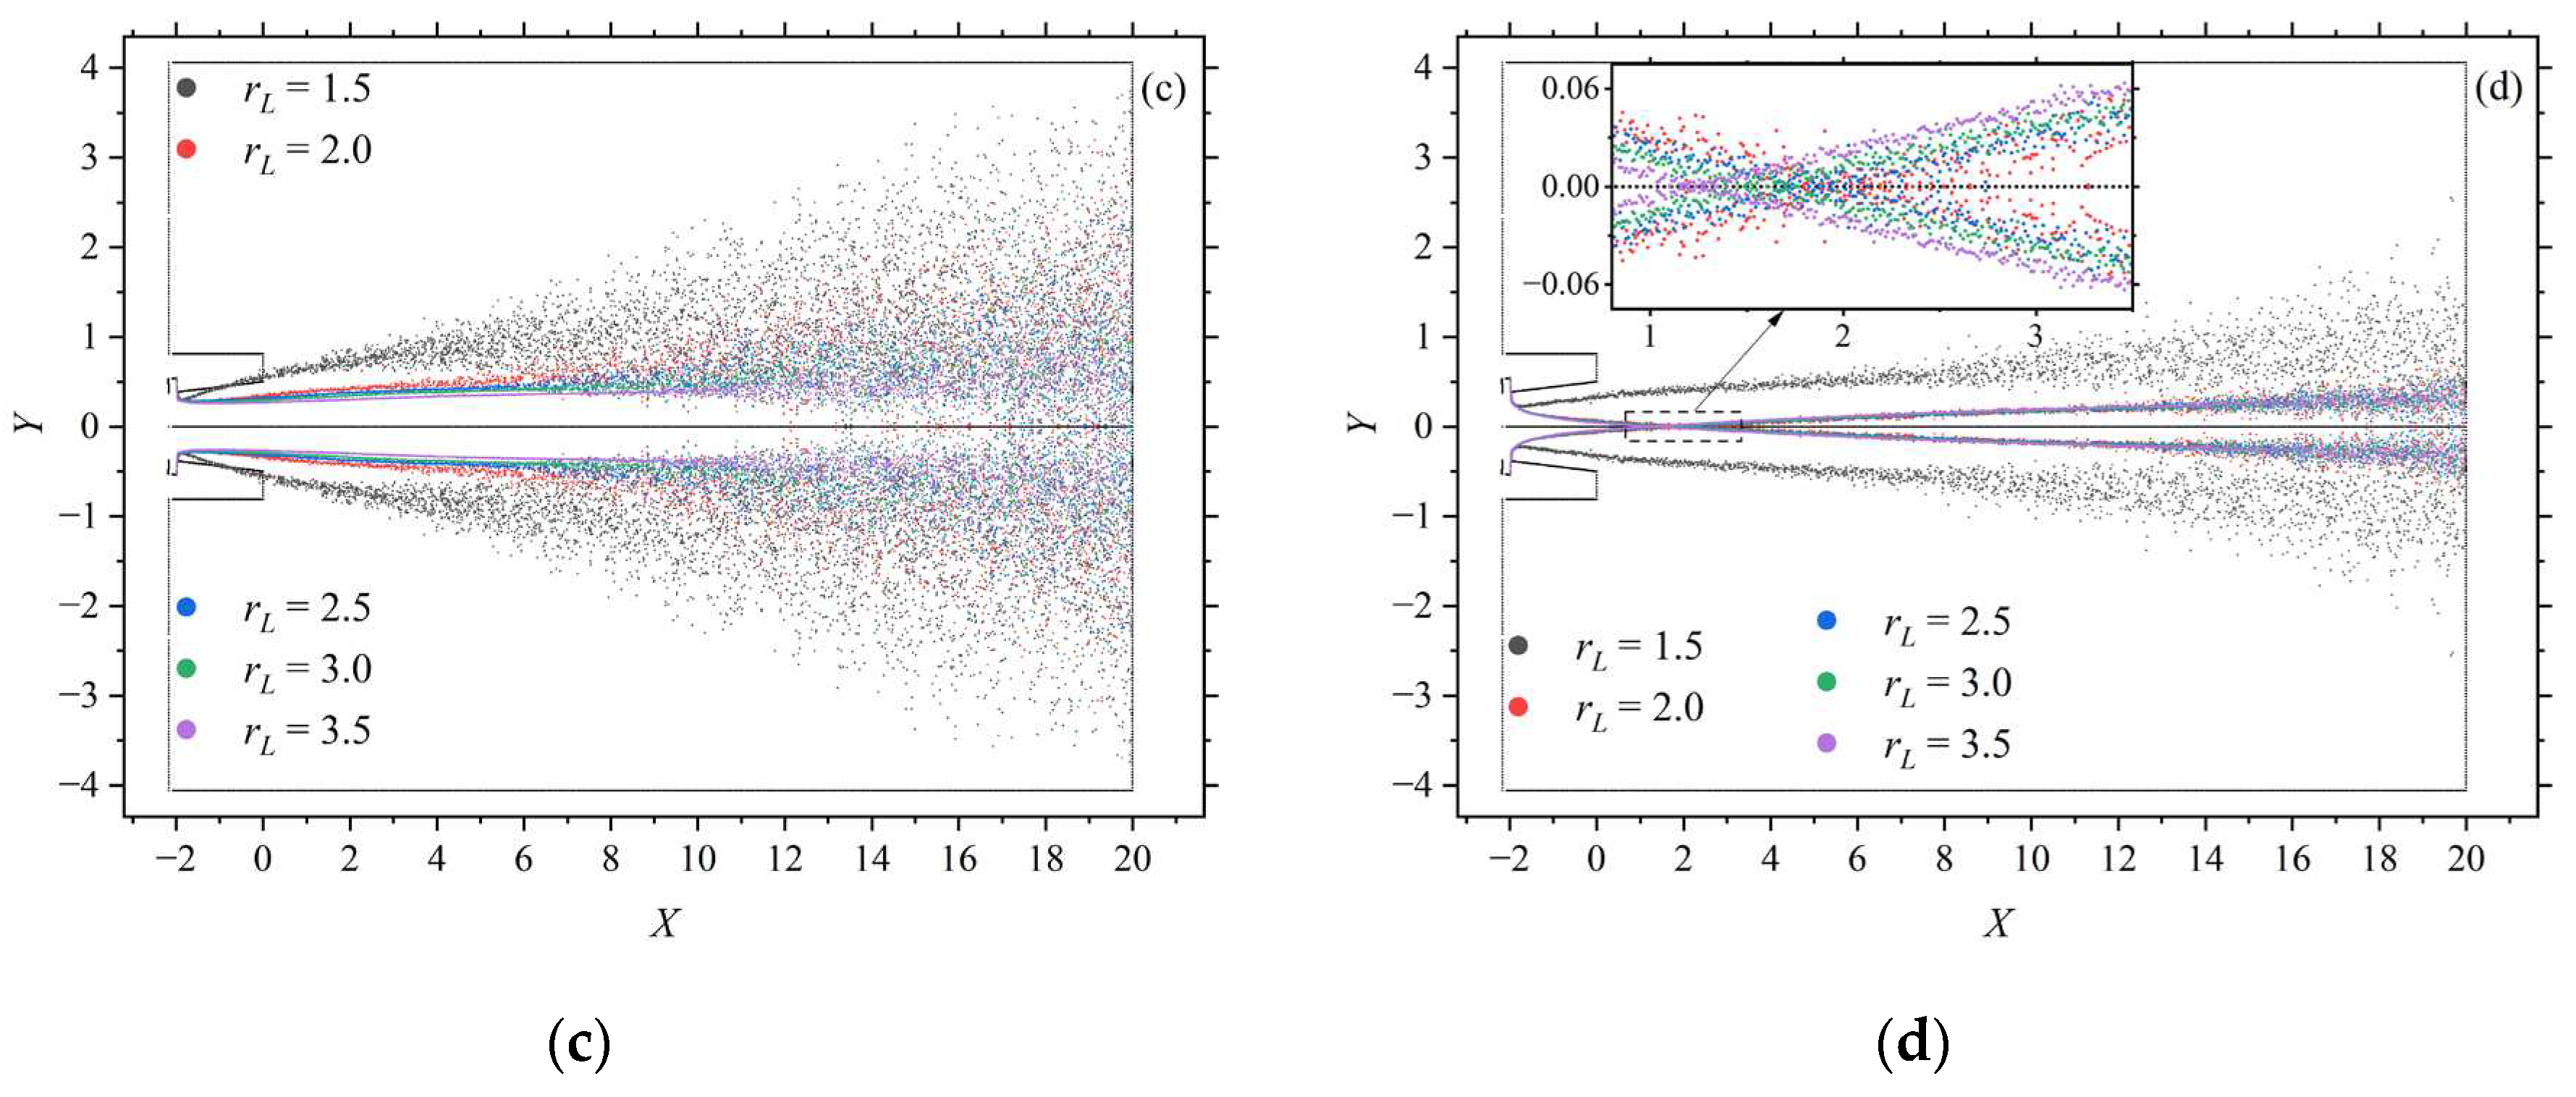
Figure 11a–d show the trajectories of the minimum and maximum mean diameter particles injected from the most upstream and downstream locations of the injector inlet at different length ratios
rL. It can be seen that the particle trajectories corresponding to the
rL=1.5 case occupy a larger radial position soon after injection. This is due to the fact that, the radial inward velocity component is reduced more significantly than the axial velocity component. None of the smaller mean diameter particles crossed the centerline. As
rL increase, particles with larger average diameters or particles ejected from relatively upstream locations of the injector inlet may cross the centerline at more downstream locations, with the one exception being that the particle trajectories corresponding to the
rL=1.5 case do not cross the centerline; Particles with smaller average diameters or particles injected from relatively downstream locations are less likely to pass the centerline, and these particles have lower velocities the farther they are from the centerline in their trajectories; On the contrary, a trajectory closer to the centerline is obtained for particles with a larger average diameter or particles ejected from a position relatively upstream of the injector inlet, with similar or even larger velocities.
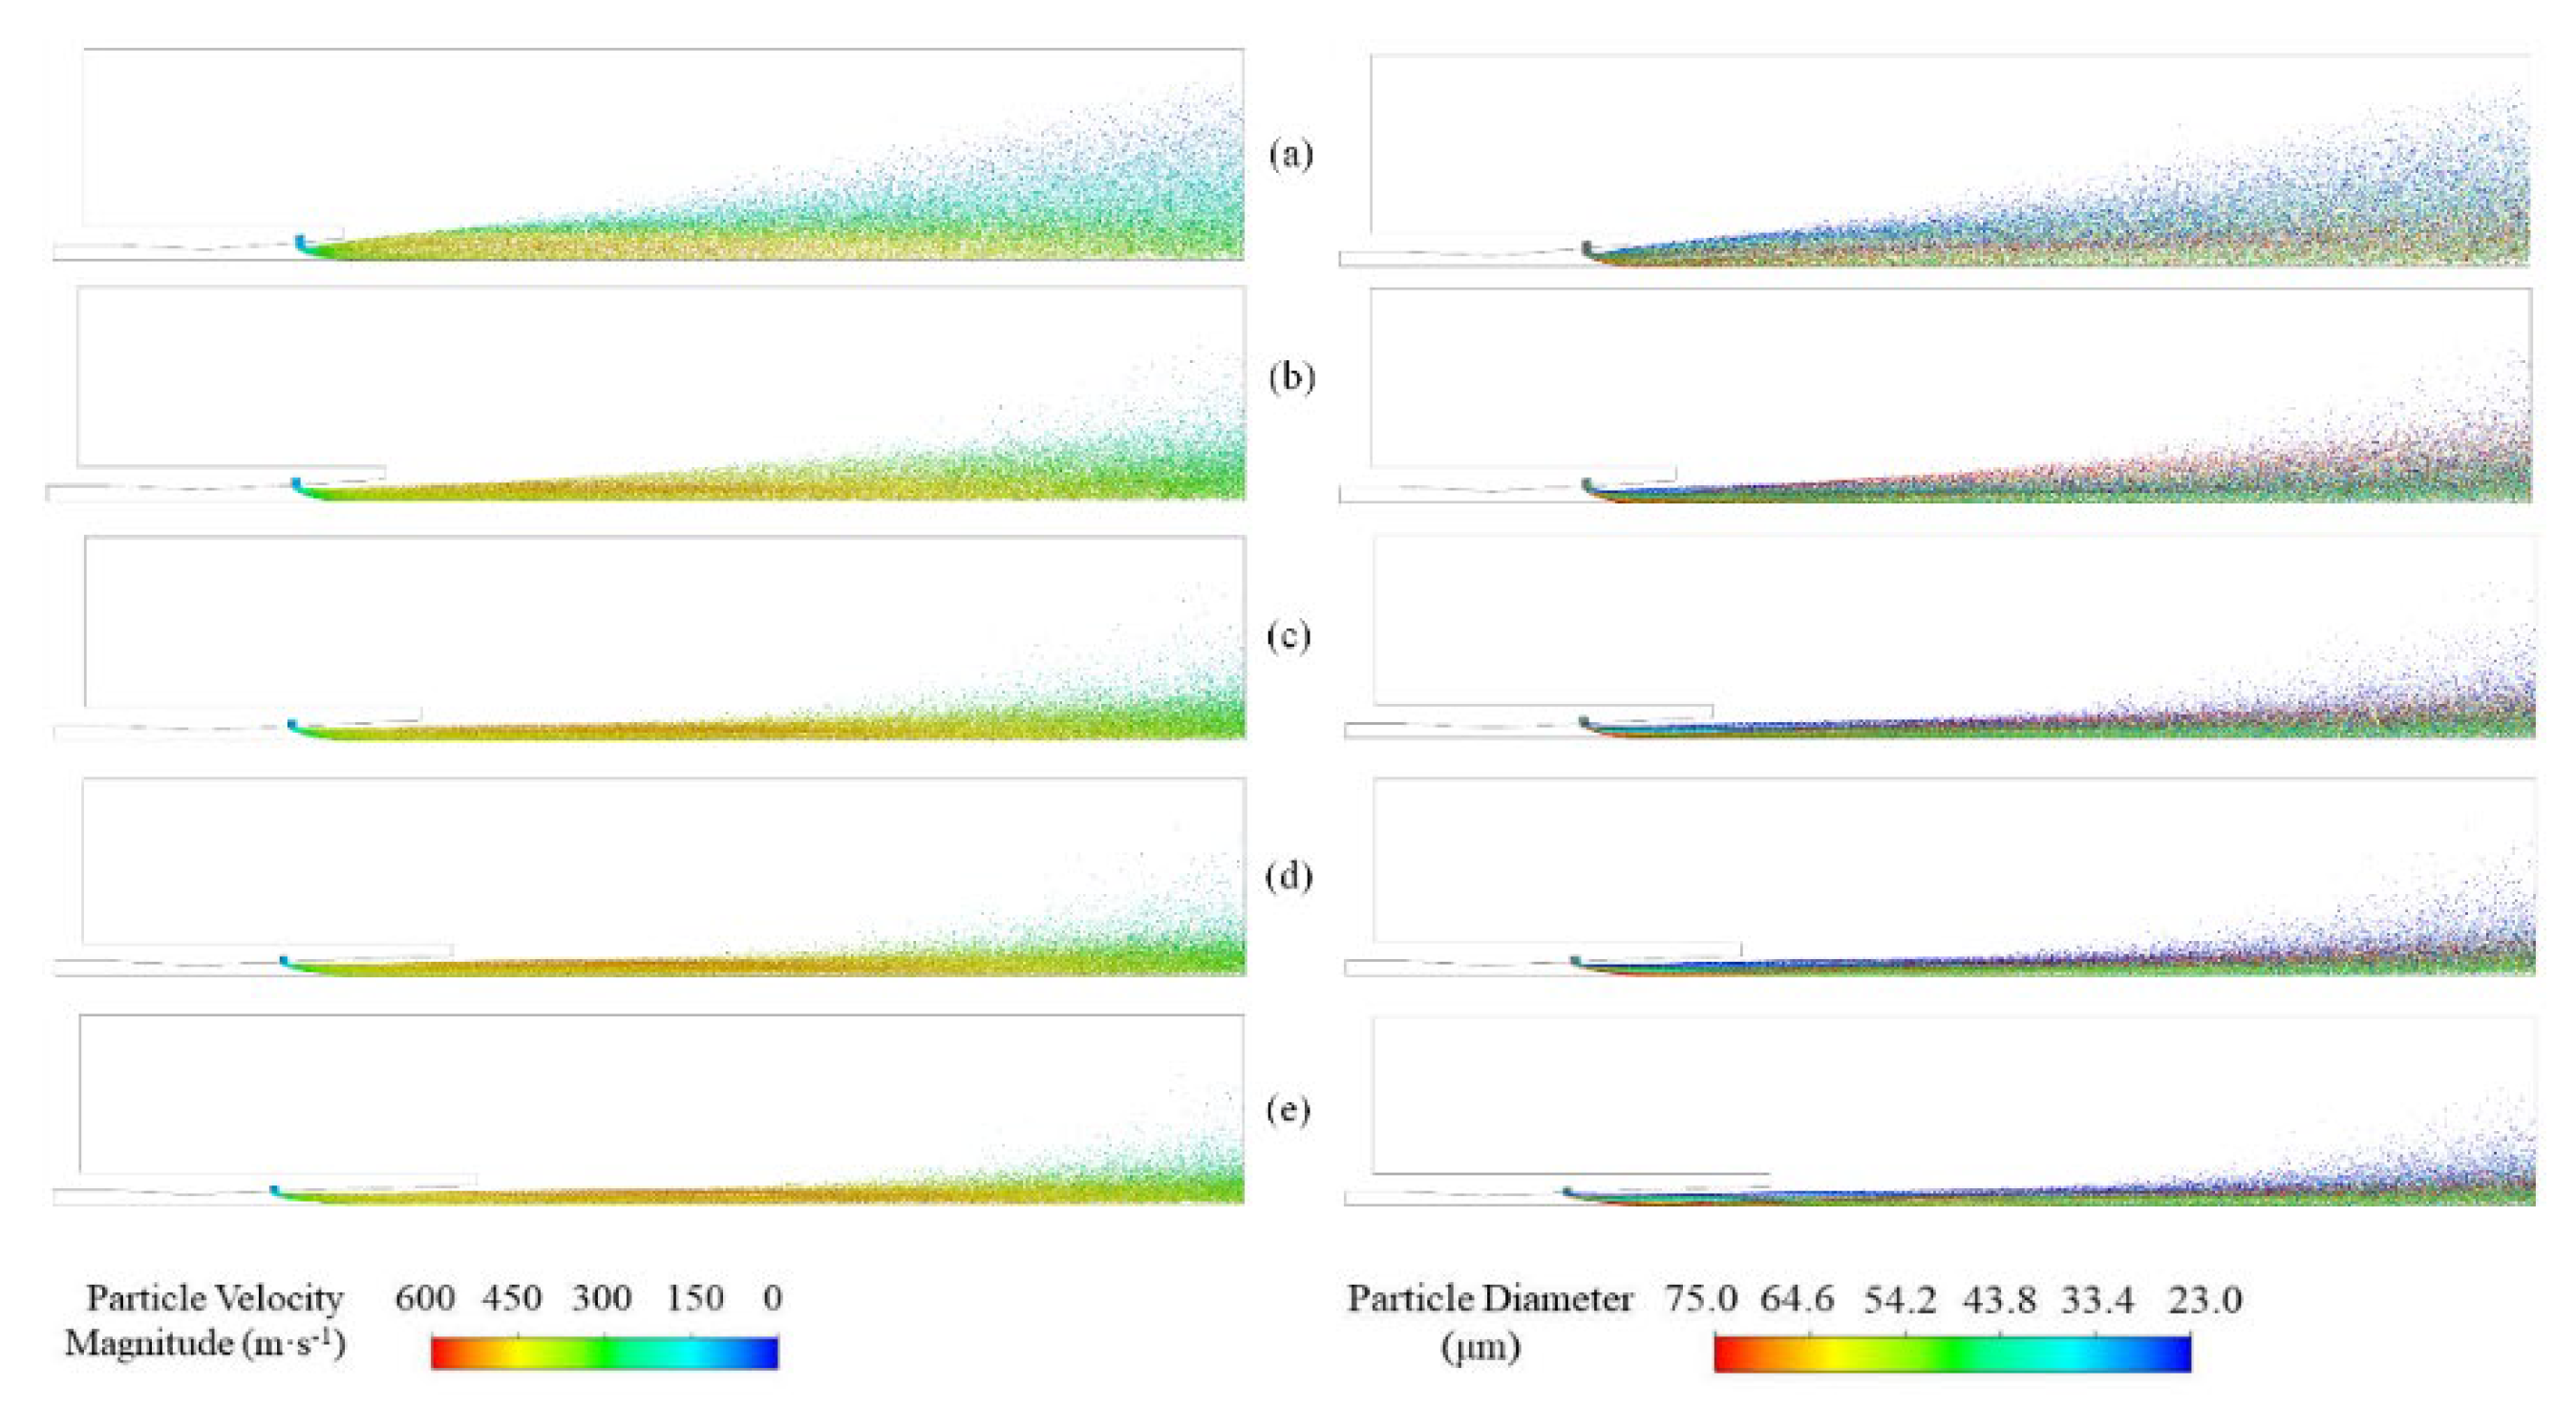
As
rL increases, the confluence moves downstream along the centerline, and the maximum particle velocity, the radial extent of the diameter distribution field, and the particle velocity difference at a given cross-section (e.g., X=10 or 20) decrease. In addition, the largest mean diameter particles move from larger radial locations toward the boundary layer region of the gas jet near the centerline, where gas and particle velocities are significantly lower. Larger and more uniform gas and particle velocities are present near the region close to the centerline(
Figure 12). In terms of the behavior of these maximum mean diameter particles, this clearly favors a simultaneous increase in
vp,a and a decrease in
Φvp and
Ψp. In practice, three different scenarios that may have conflicting effects on jet performance metrics when
rL is increased must be considered. First, the increase in
rL results in a smaller radial position and larger average velocity for all larger particles that can cross the centerline, but the mass fraction of these larger particles decreases; Second, smaller particles that would not otherwise be able to cross the centerline occupy a larger radial position and reach a smaller average velocity, and although it may be randomly affected by uncertainty in the particle trajectories, the mass fraction of these smaller particles should be nearly constant; Finally, some medium-sized particles can cross the centerline before, but not after, and the mass fraction of these particles increases. Thus,
vp,a increases monotonically with
rL, while
Φvp and
Ψp decrease monotonically with
rL.
Therefore, the performance of nozzle jets with different length ratios has significant differences, and it is necessary to consider choosing different rL for different types of flames. When rL=3.5, the average velocity of particles vp,a reaches the maximum value of 331.16 m/s, and the dispersion Ψp is the minimum value of 0.0858, which gives the nozzle structure a stronger ability to penetrate the target of combustibles, and it is more suitable for penetrating flames; When vp,a is close to 287.05 m/s and Ψp is greater than 0.1487, rL=2.0 is chosen to be more effective for spread flames; At rL=1.5, Ψp reaches a maximum value of 0.2295, and at the same time, the particle velocity inhomogeneity Φvp is 0.0278, at which time this nozzle structure is more effective for dispersive flames.
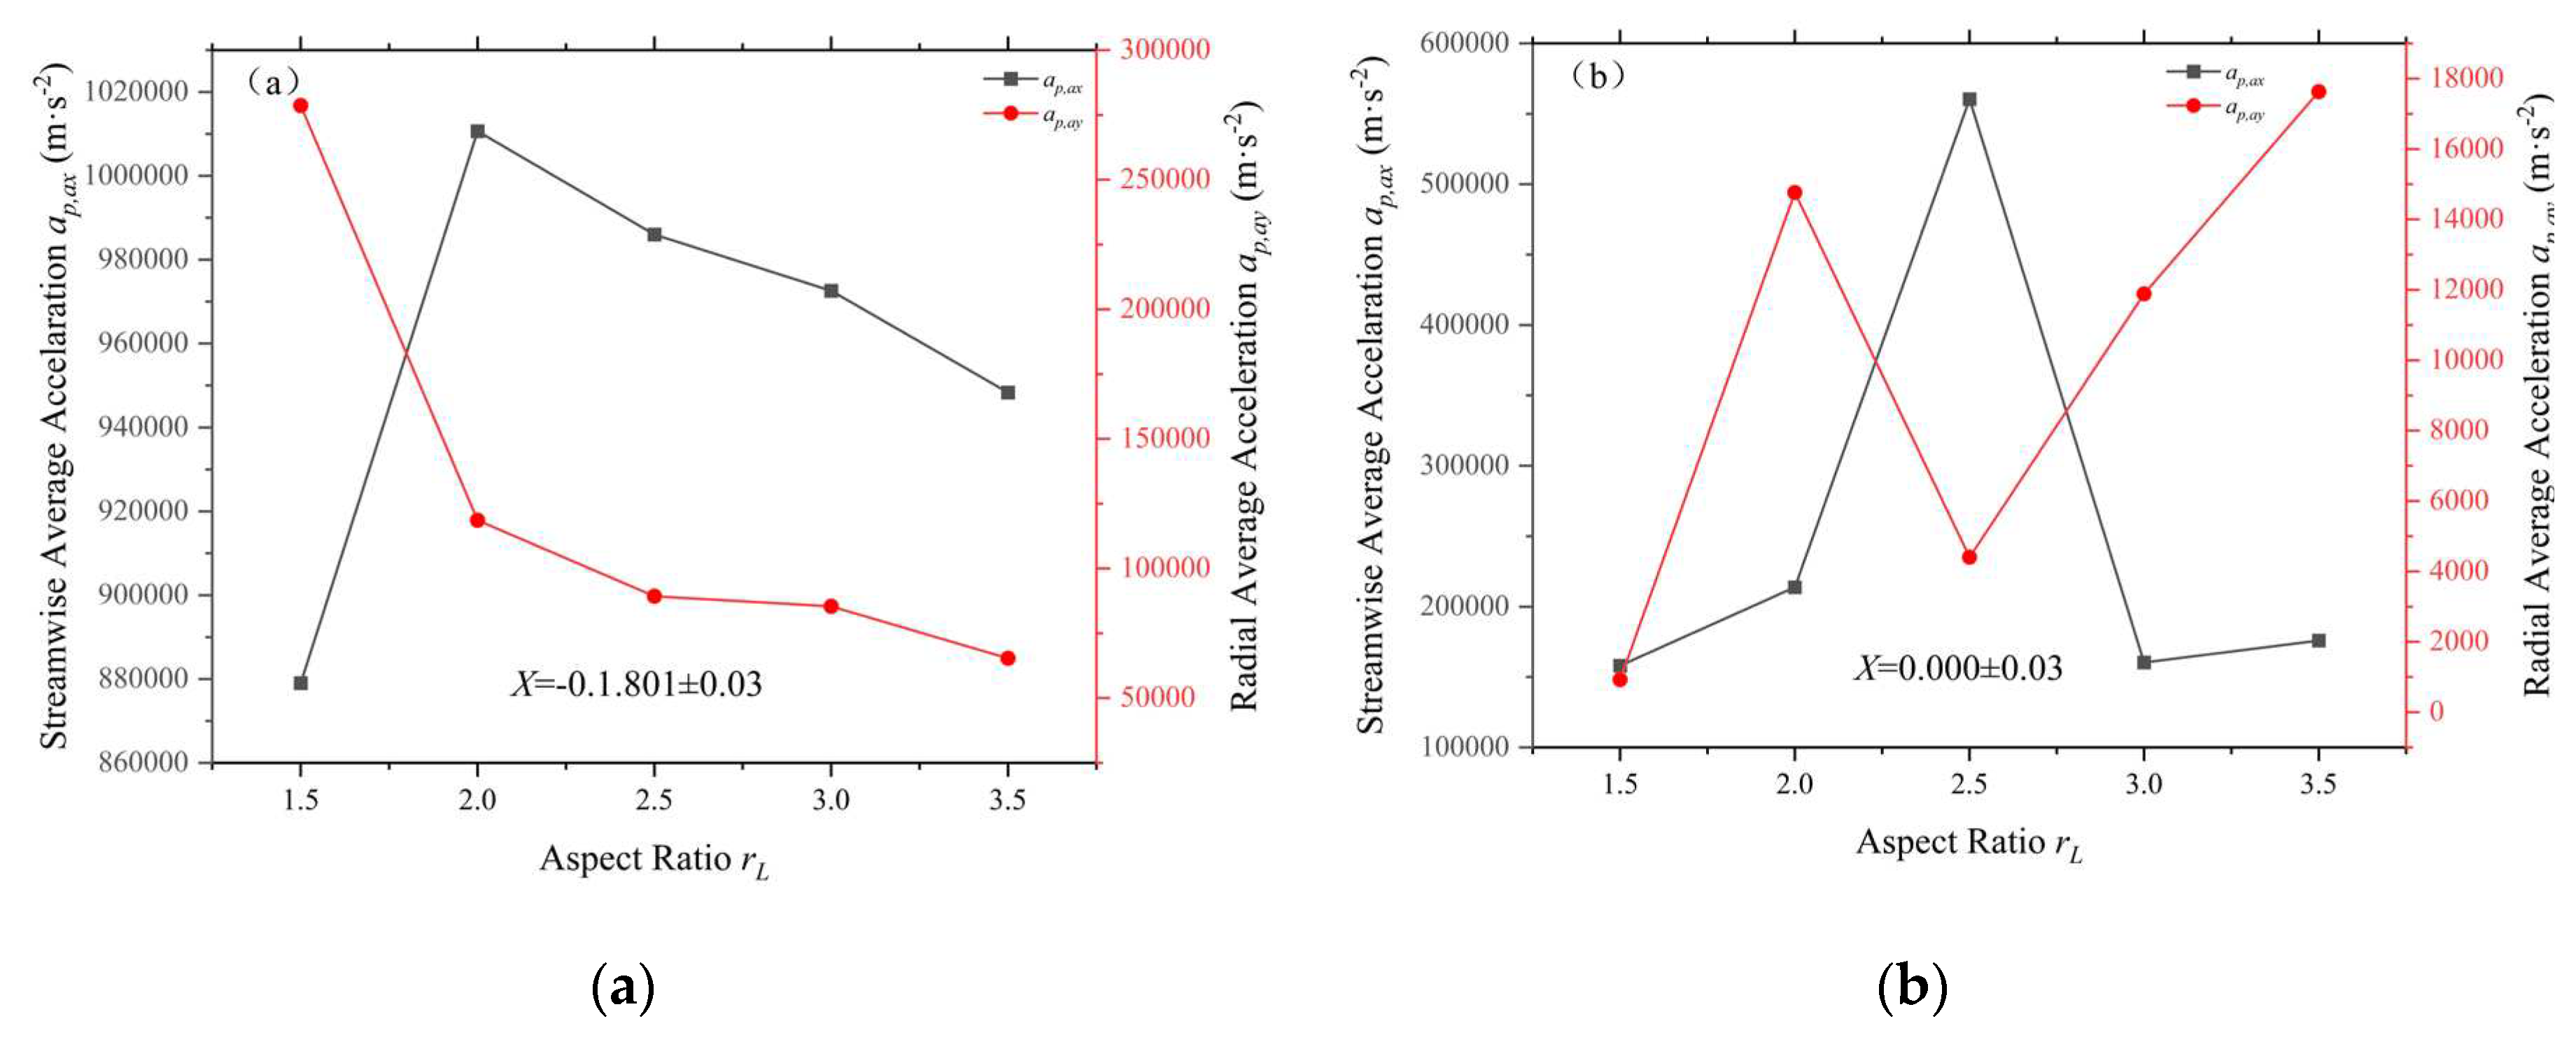
In addition, we can consider the effect of nozzle geometry features on the working performance of the jet from the perspective of particle mean acceleration pairs. We selected a narrow band region from inside the nozzle directly downstream of the particle injector as well as a narrow band region at the nozzle exit location, denoted as regions X1 and X2, and analyzed a portion of representative particles within these two regions.
In terms of particle acceleration, for the X1 region, the streamwise acceleration increases and then decreases as the length ratio rL increases, peaking at rL=2, while the radial acceleration decreases monotonically. This indicates that the relative velocity along the flow direction tends to increase and then decrease as the length ratio increases, while the relative velocity in the radial direction decreases monotonically. The situation is different at the nozzle exit, where the particle flows are all characterized by first increasing, then decreasing and finally increasing again, and peak at rL=2.5 to rL=2, respectively. This indicates that as the length ratio rL increases, the flow and radial relative velocities between phases first increase, then decrease and then increase again and there is a critical point where they peak respectively.
We can look at all the particles in the entire narrow-band region as a whole, so that the position of this imaginary particle is at the center of mass of this system of masses consisting of all the particles in the region(
Figure 13). In the X1 region, where
rL is smallest, the virtual particle is in the low velocity region near the high velocity region, when the regional gas velocity is low but there is a large velocity gradient in the radial direction, making the initial difference between
ap,ax and
ap,ay large, with
ap,ax smaller and
ap,ay larger. As the flow develops, the virtual particles move slightly toward the center out of the region of large velocity gradient at the same time that the gas velocity at their location increases, so that
ap,ax increases while
ap,ay begins to decrease. As the flow develops further, the region in which the virtual particles were originally located generates a smaller new high-speed region. But then the virtual particles once again move away from the centerline to the outer low velocity region and hover in this region, with
ap,ax and
ap,ay leveling off as
rL increases.
In the case of length ratio rL=2, the X2 region is exactly at the nozzle exit, but this varies for different length ratios, for minimum RL, the X2 region is located in the outer jet of the nozzle, whereas as rL grows the nozzle grows and the X2 regions are all inside the nozzle. At the same time the growth of rL leads to a nonlinear development of the flow field inside the nozzle in the corresponding region, which results in large fluctuations of ap,ax and ap,ay. Specifically, when rL is smallest, the dummy particles are in the region away from the centerline of the nozzle, where the gas velocity is small and uniform, and this is when both ap,ax and ap,ay are small. As rL increases, the virtual particles migrate substantially near the centerline and approach the relatively low velocity region near the centerline, but the radial velocity gradient in this region is large, so ap,ax grows slightly while ap,ay reaches an extreme value rL increases further, the imaginary particles move away from the centerline in a small way and stay, when the flow field changes causing this region to first enter the high velocity region and approach the low velocity region, which is uniform in the high velocity region and steep in the low velocity region. This explains the diametrically opposed changes in the trends of ap,ax and ap,ay in the final stage.
4.2 Effect of area ratio rA
The simulation of flow field at different area ratios (ratio of main nozzle outlet area to throat area) rA was carried out to investigate the effect of area ratio rA under the length ratio rL=2 condition.
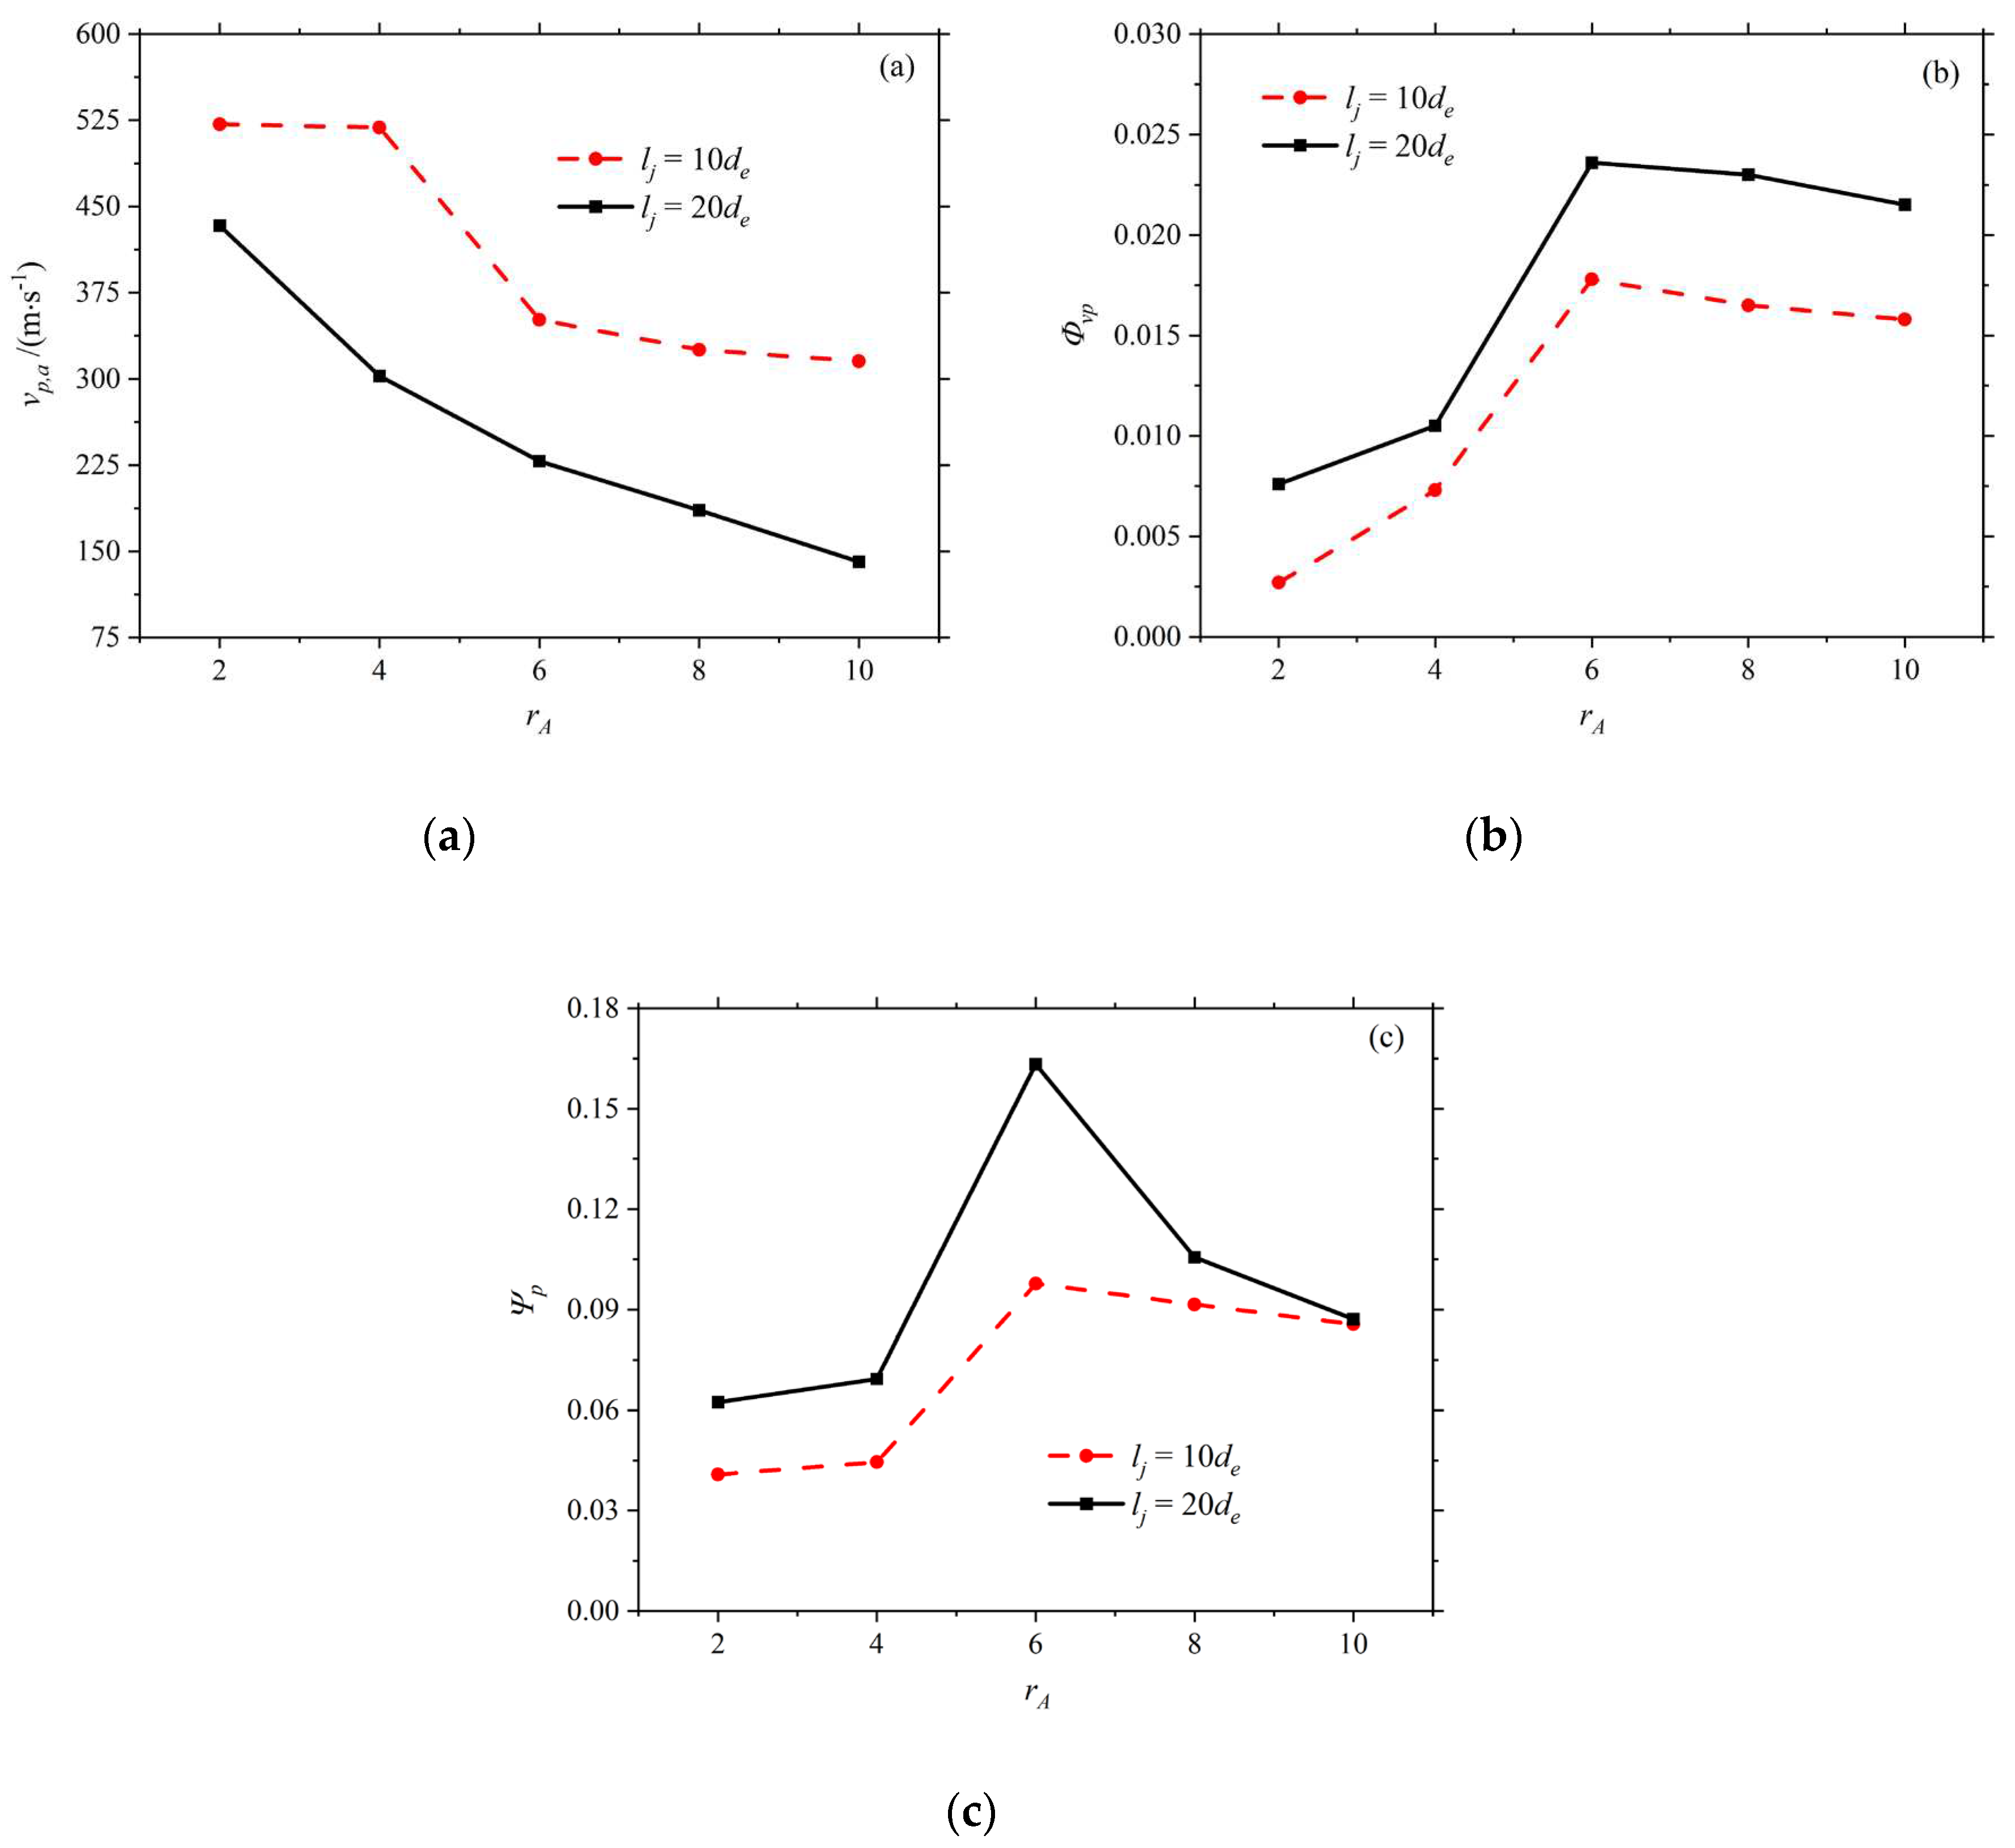
Calculations show that
vp,a10 and
vp,a20 decrease monotonically with increasing
rA, and
Φvp10,
Φvp20,
Ψp10, and
Ψp20 first increase and then decrease(
Figure 14a–c). Specifically, when
rA was increased from 2 to 10, the performance indexes of the jet were 521.65 to 315.23 m/s for
vp,a10, 433.30 to 140.68 m/s for
vp,a20, 0.0027 to 0.0158 for
Φvp10, 0.0076 to 0.0215 for
Φvp20, 0.0408 to 0.0856 for
Ψp10 and
Ψp20 was 0.0624 to 0.0871, in which
Φvp10,
Φvp20,
Ψp10 and
Ψp20 all peaked at
rA=6, with 0.0178, 0.0236, 0.0977 and 0.1633, respectively. It can be seen that the relative change of each parameter with
rA is very obvious. And from the practical application point of view, it is necessary to choose the nozzle area ratio appropriately to balance the fire extinguishing efficiency.
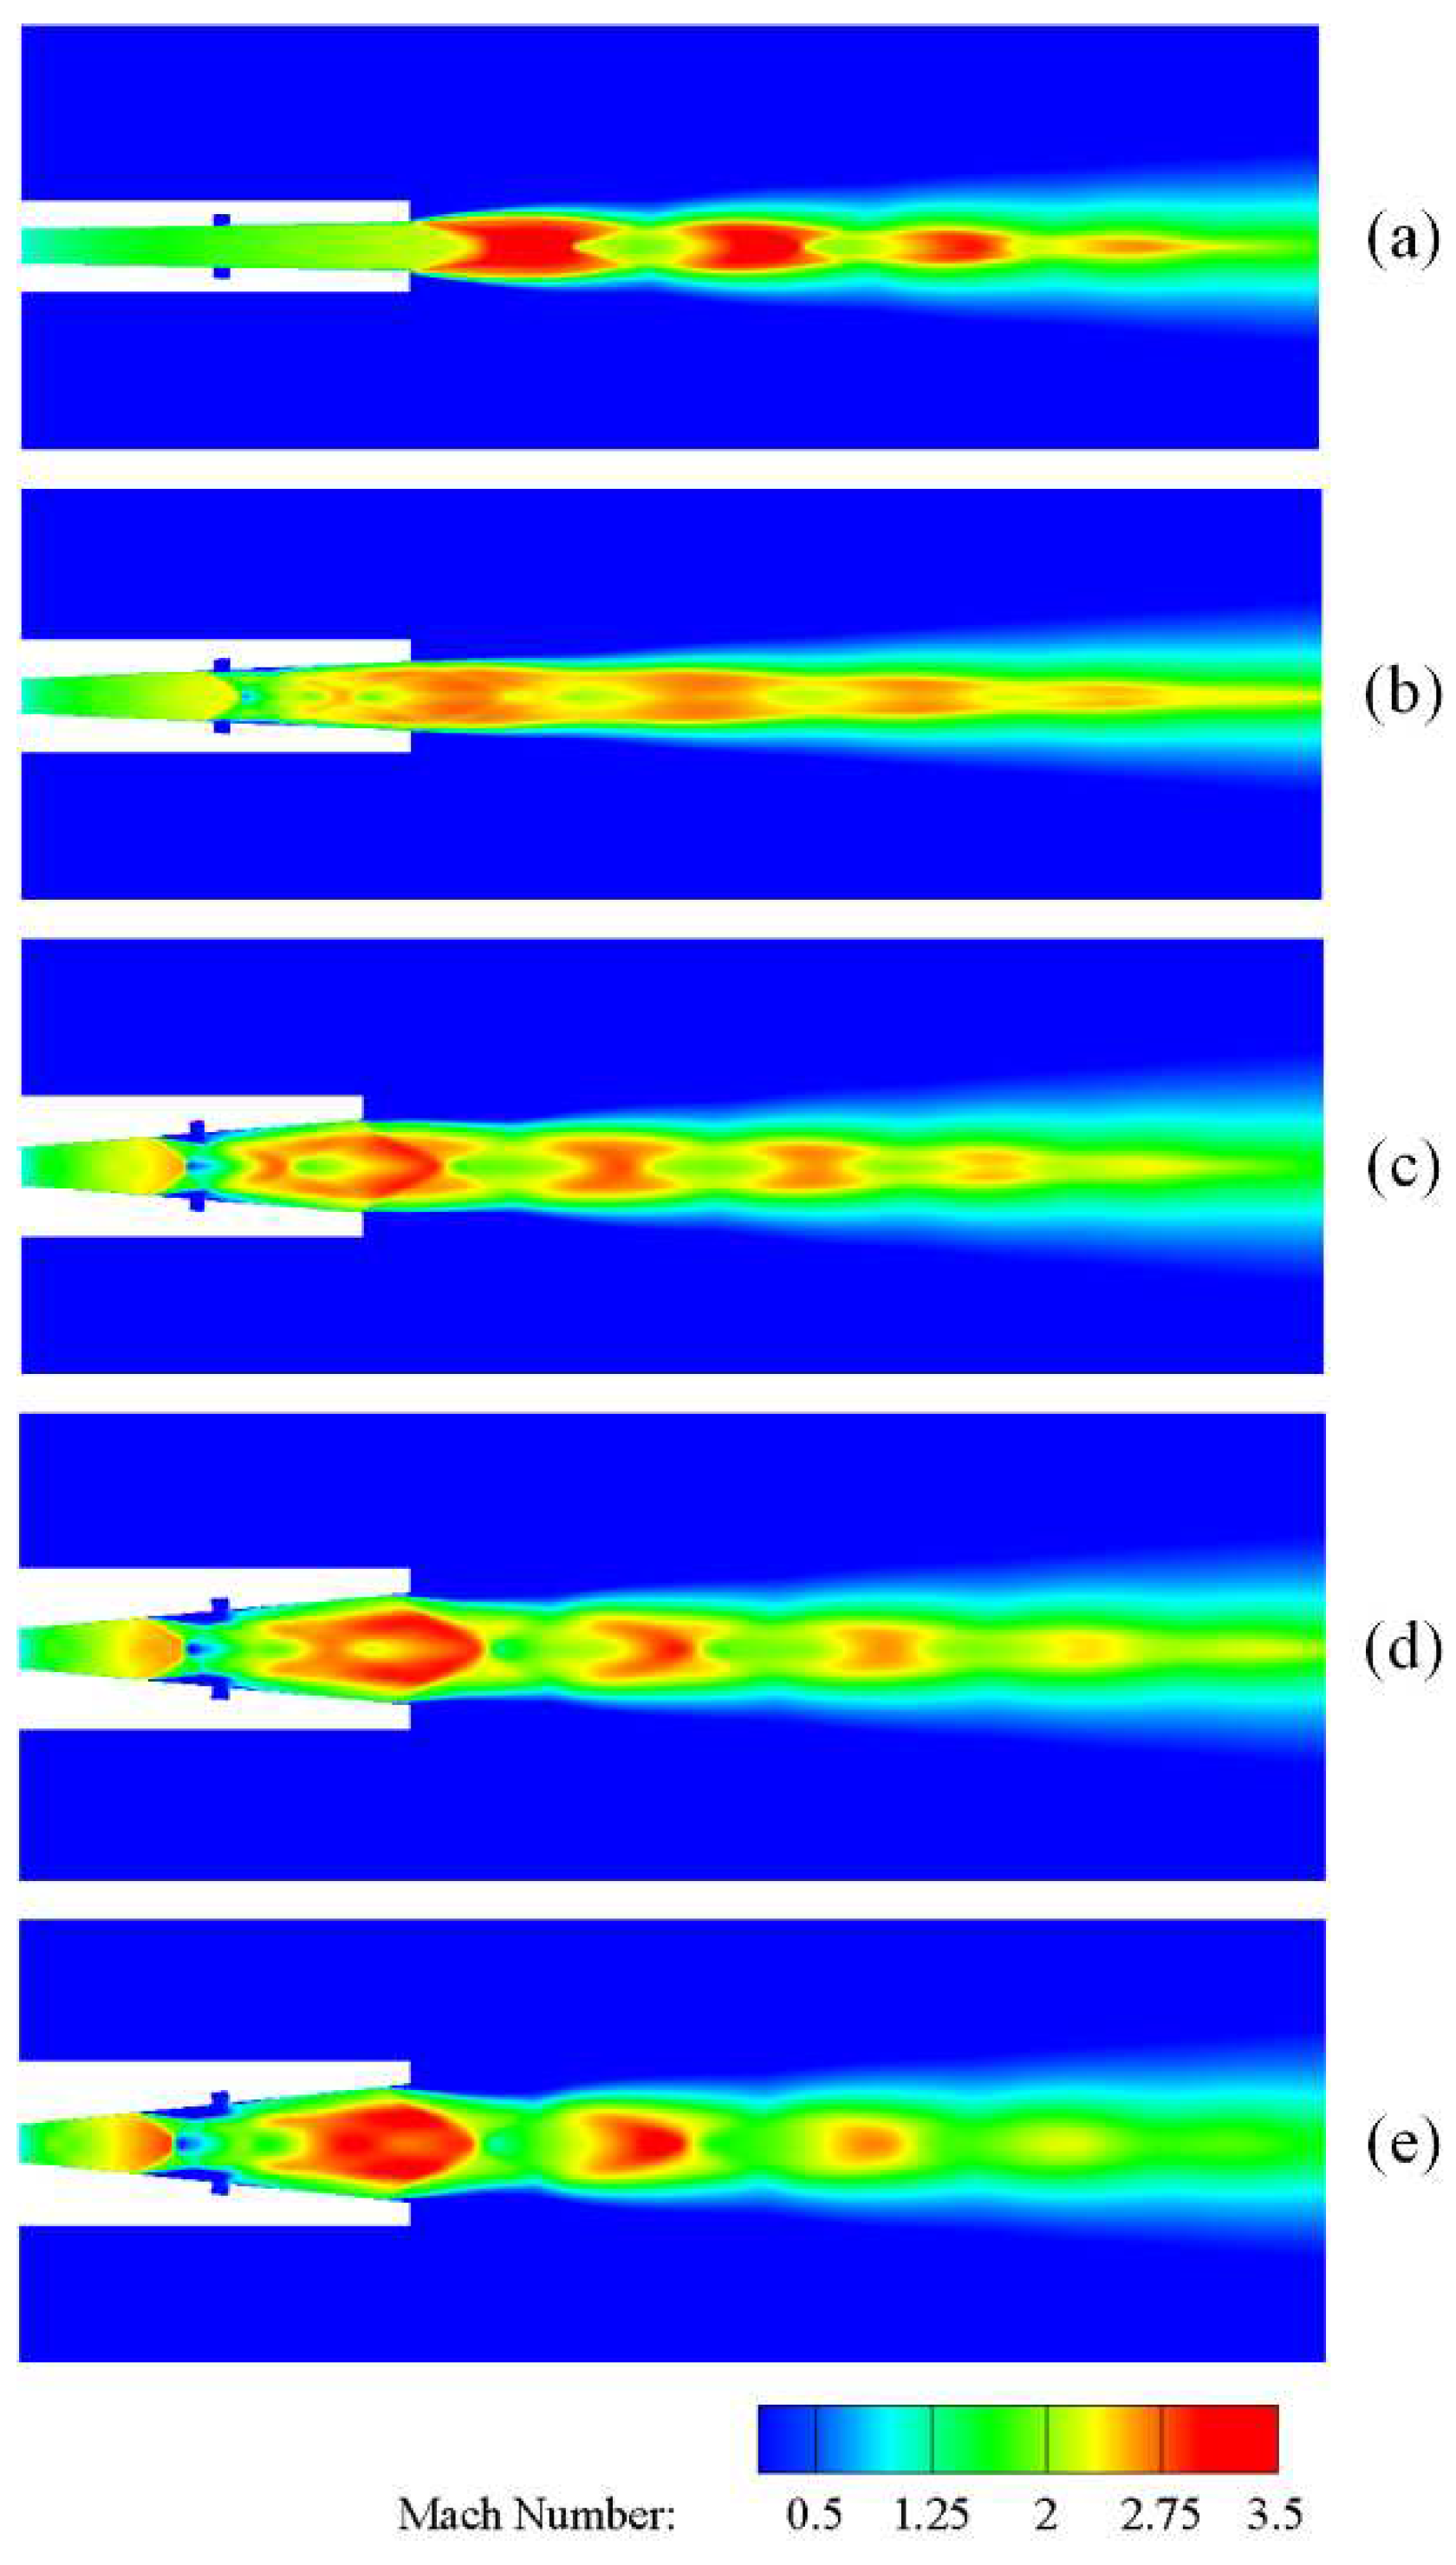
Similarly, the development of the flow can be visualized from the contour cloud plots of the Mach number of the airflow at different area ratios
rA (
Figure 15a–e). When
rA increases, a significant change in the structure of the Mach reflection can be found. The dimensions of both the incident oblique excitation and the central Mach disk increase, and the intensity of the excitation in the Mach disk is closer to that of the positive shock wave. In addition, the position of the Mach disk changes significantly, gradually moving upstream of the nozzle. The center region of the core region of the jet is gradually occupied by the subsonic region, whose radial size increases significantly while the axial size decreases. In the region along the centerline, the increase in
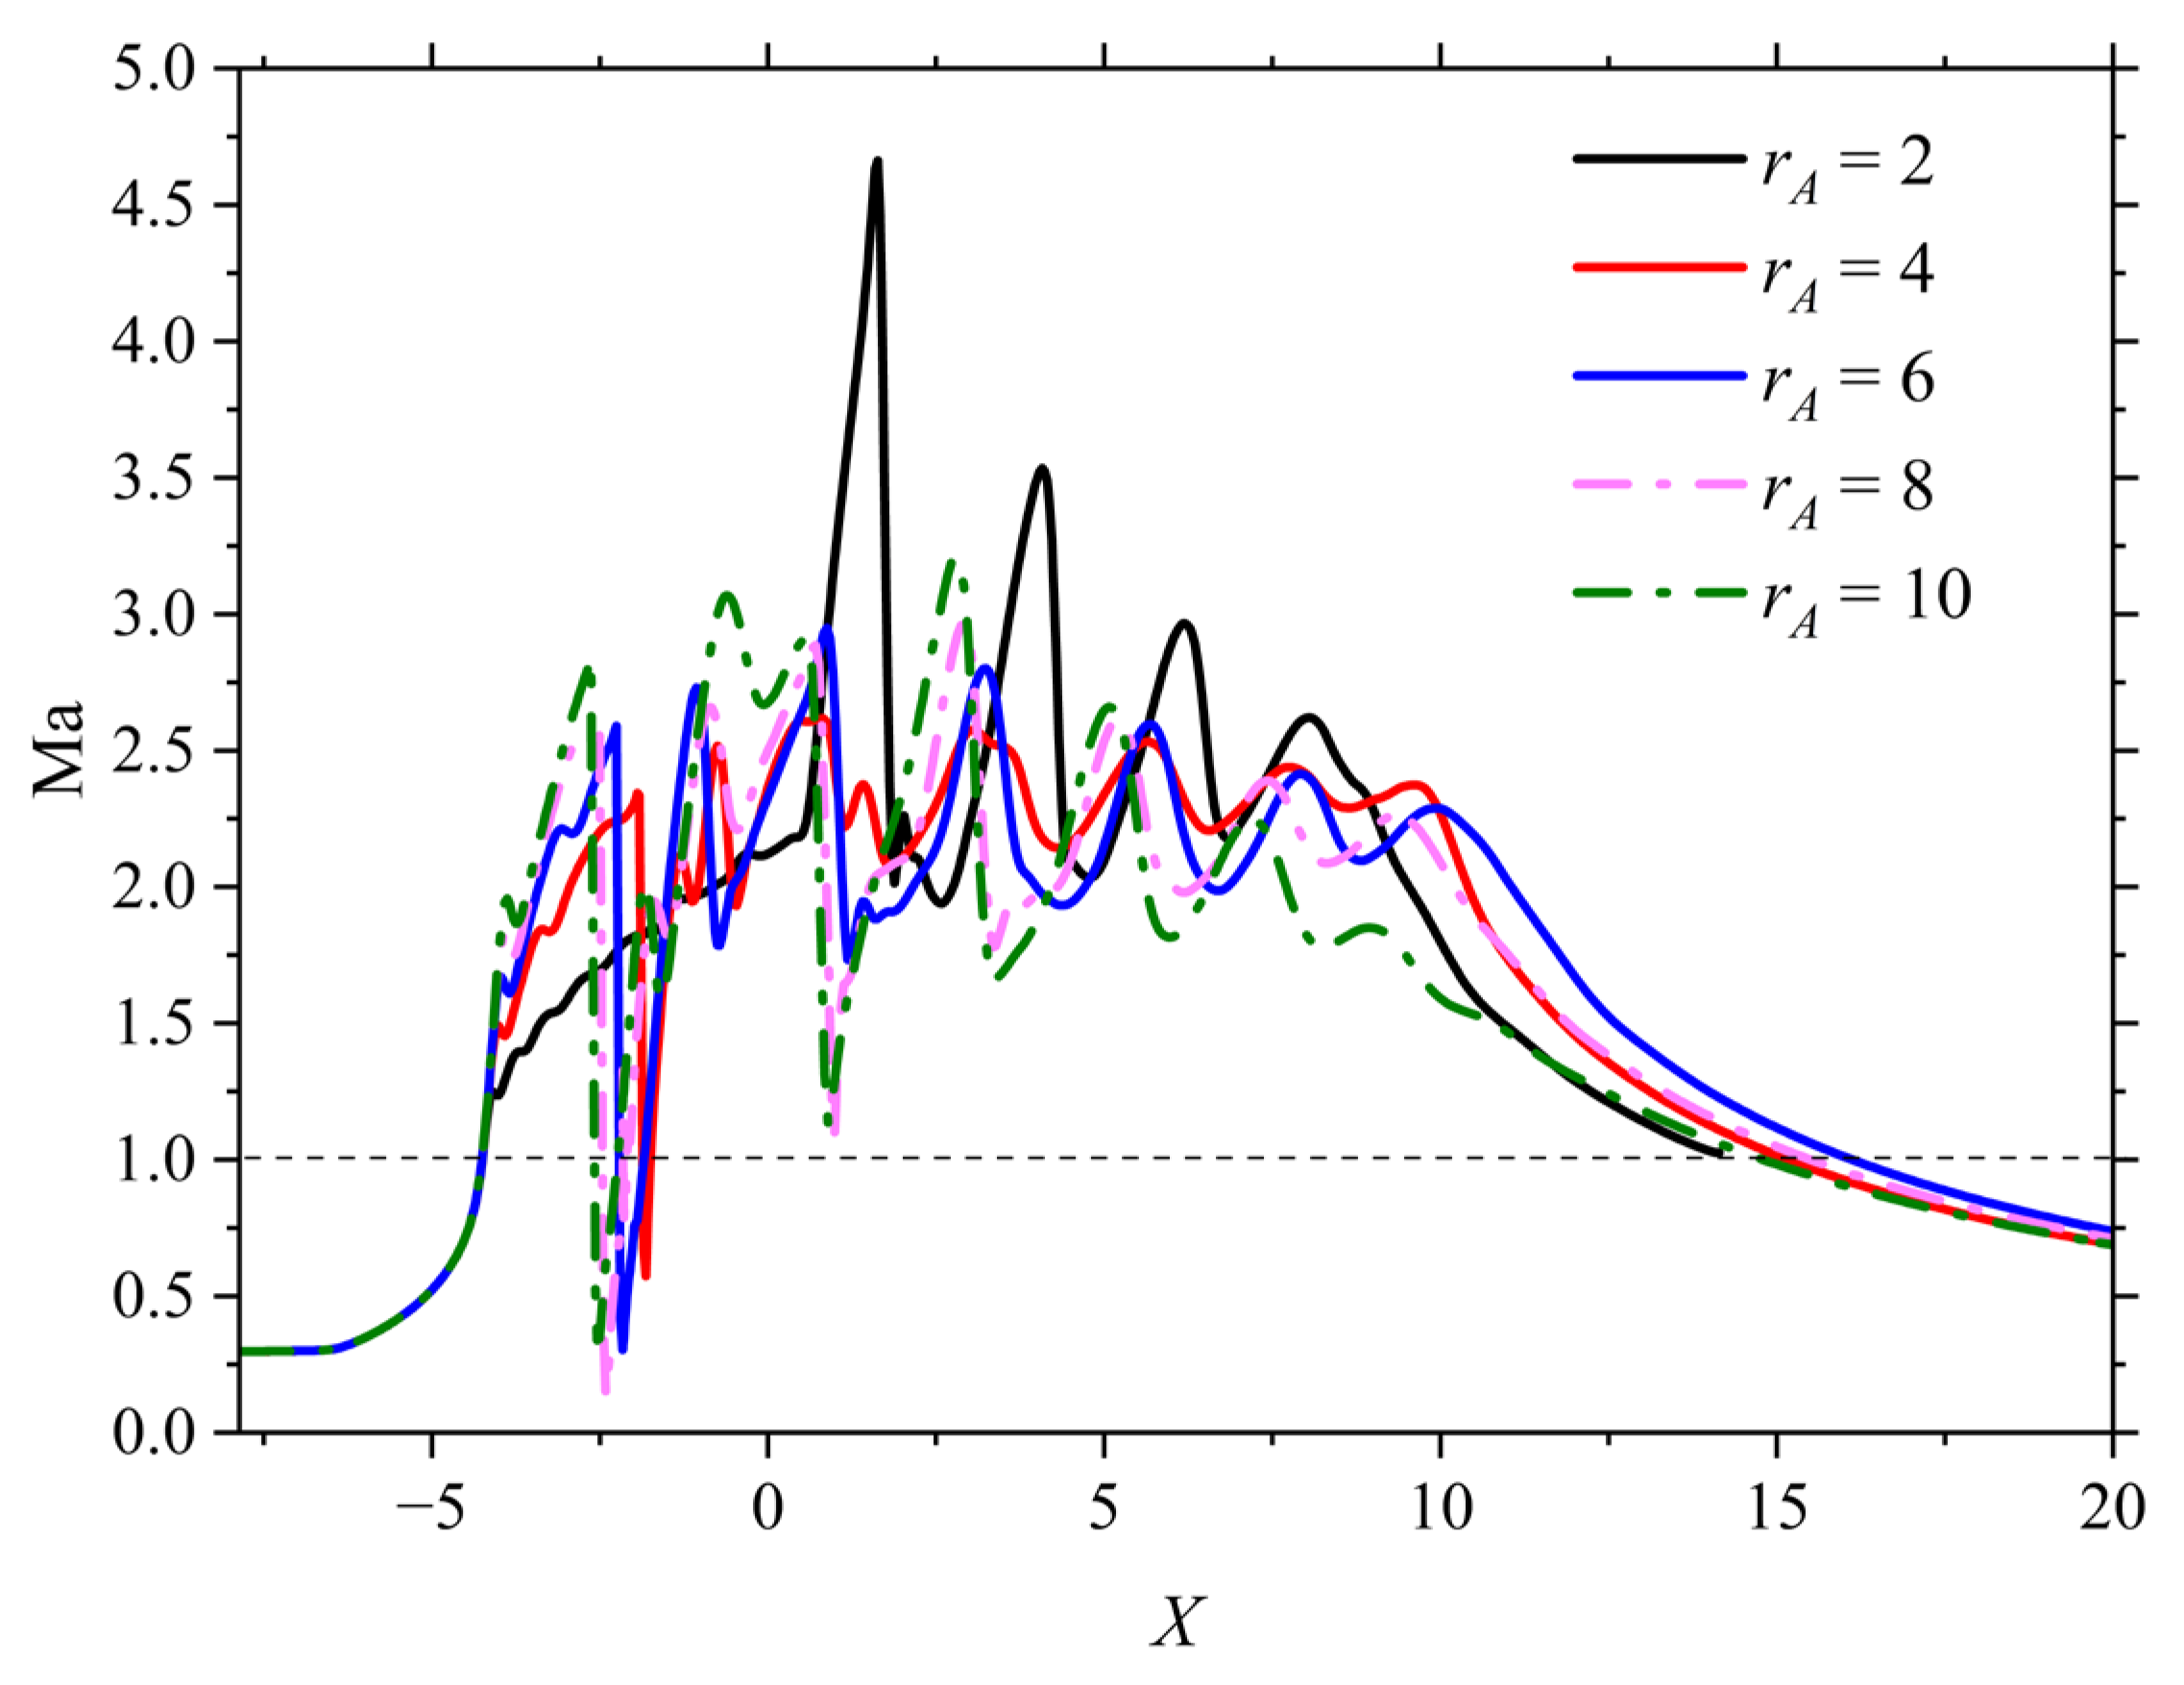
rA leads to an upstream migration of the
Ma peak located upstream of the Mach disk, with a corresponding decrease in the peak, coinciding with an increase in the
Ma valley located downstream of the Mach disk. In addition, the position and intensity of the expansion and oblique shock wave (or compression) waves changed significantly (
Figure 16). For example, one peak of
Ma reaches a very high value at
rA=2. However, in the main body section of the jet, the final difference between all
Ma values at different
rA is negligible in the final difference.
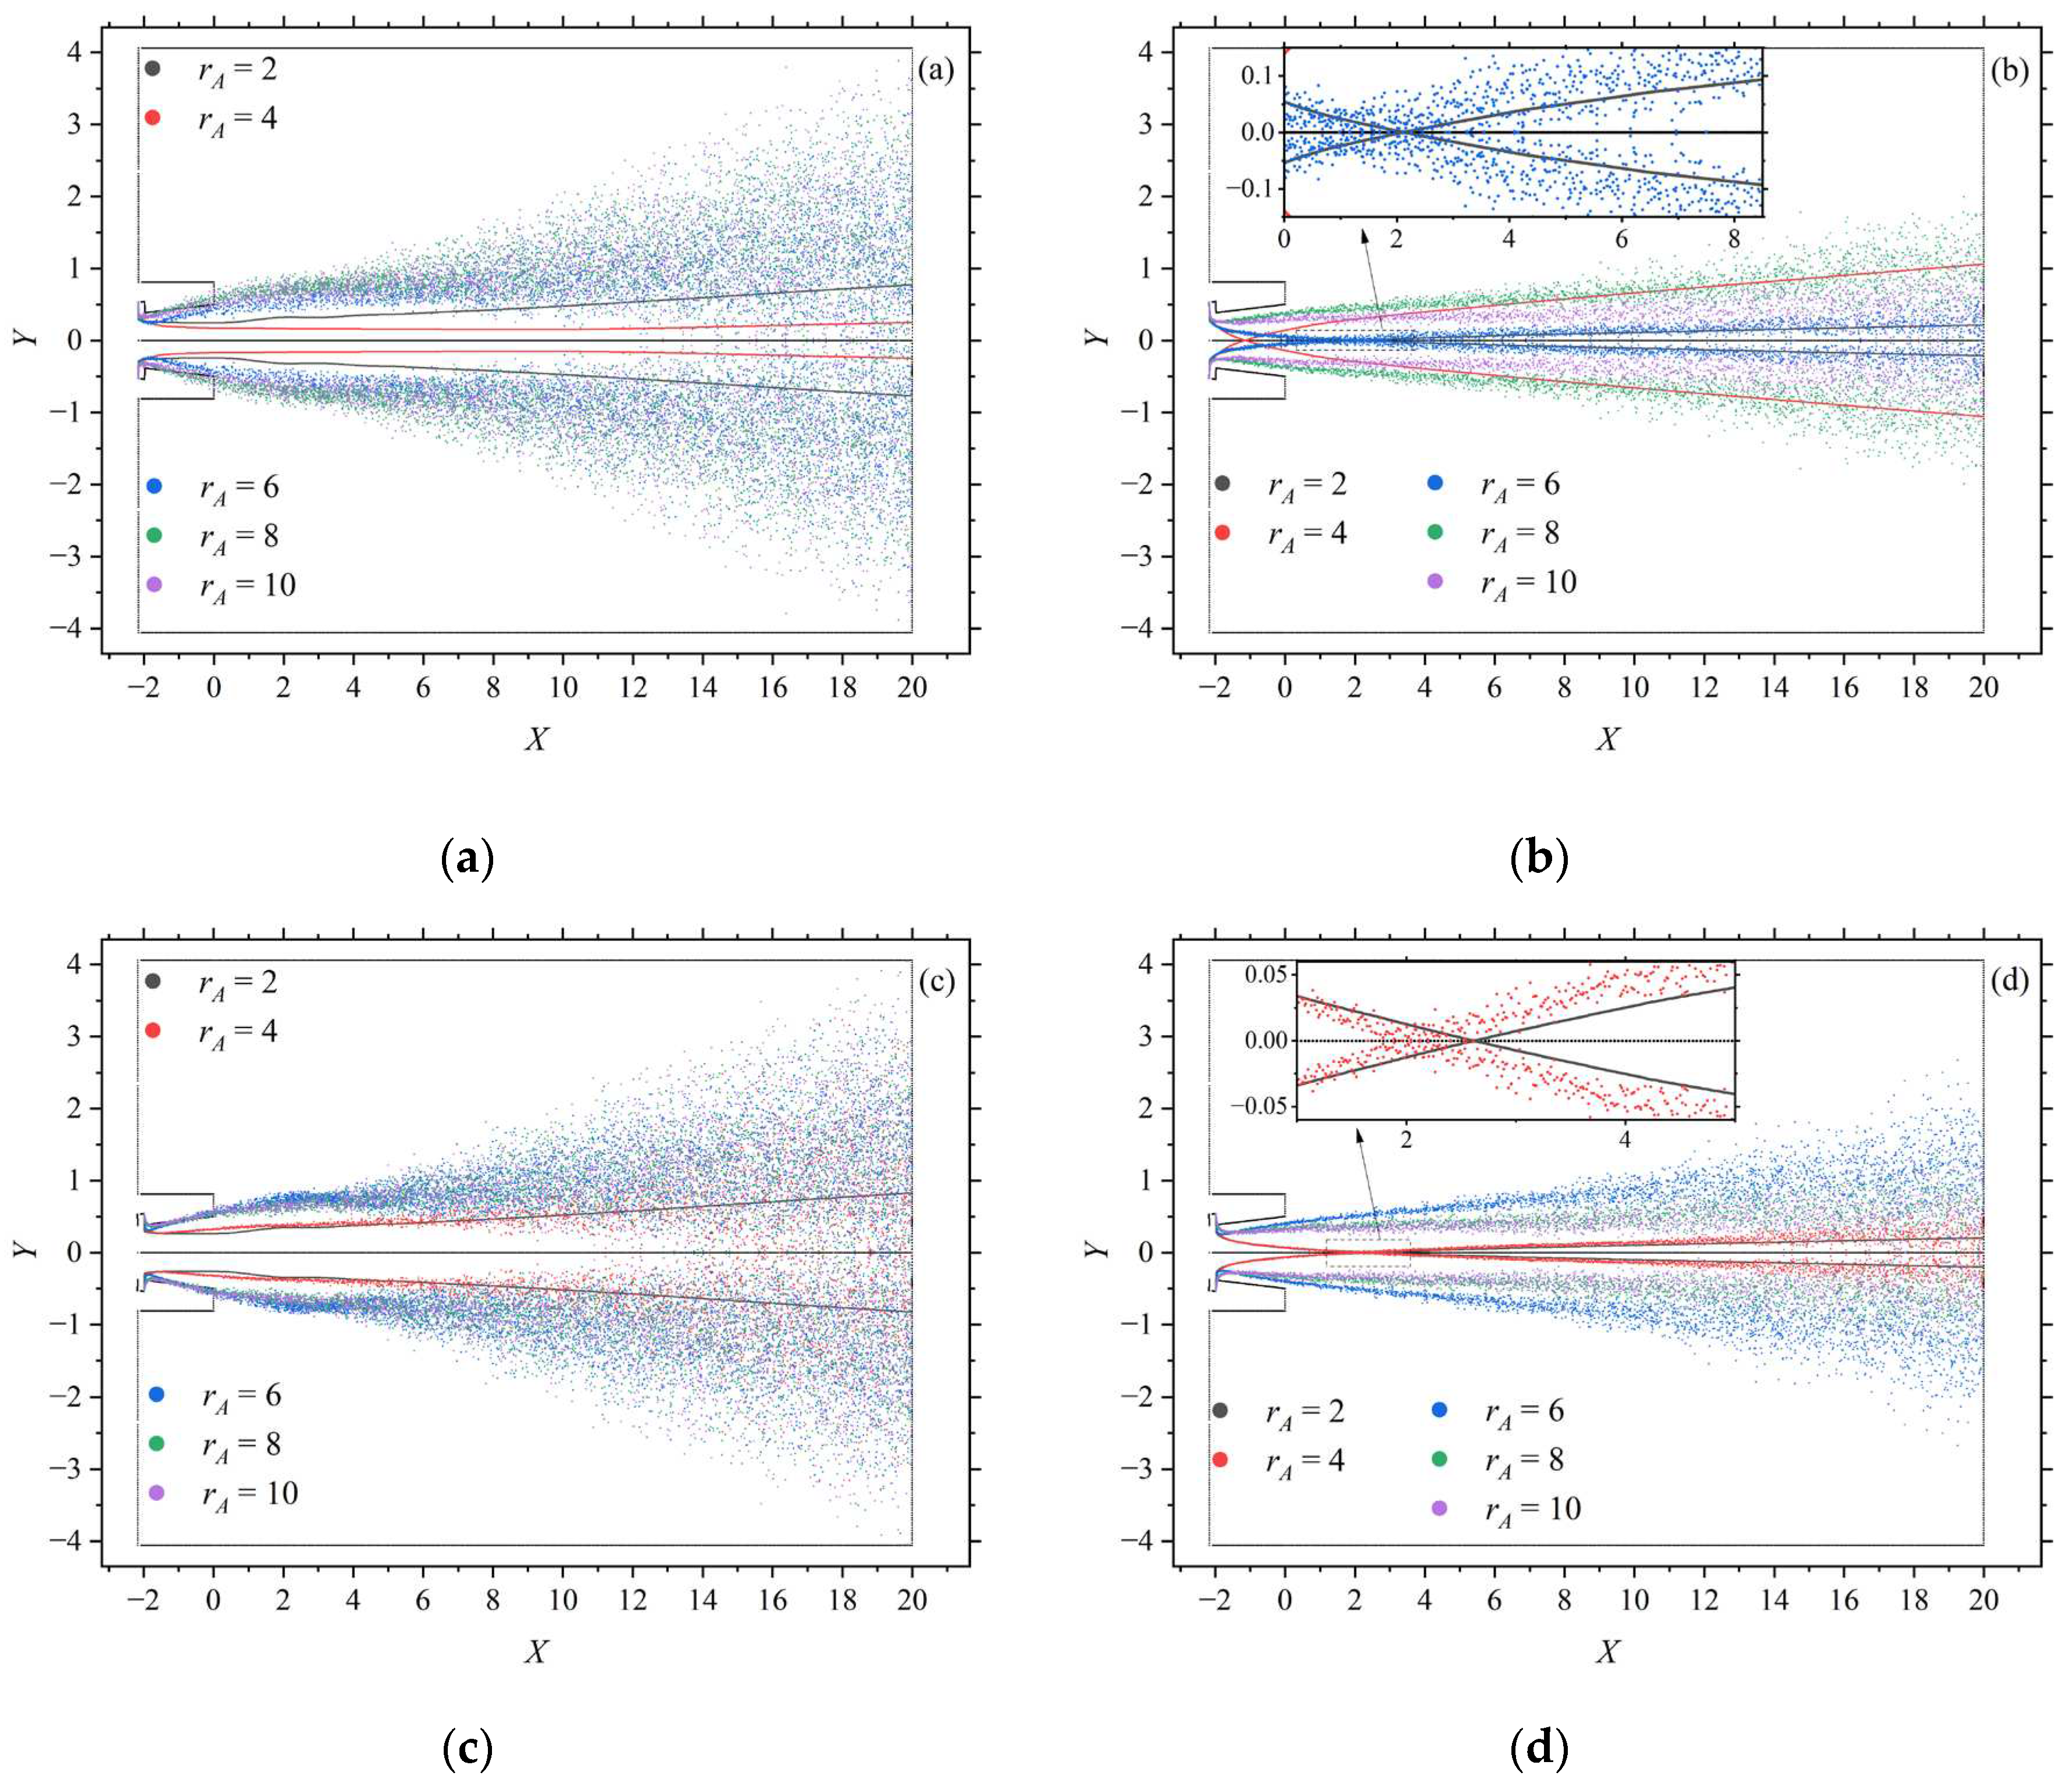
As can be seen from
Figure 17a,c, all trajectories of particles with the smallest diameter cannot pass through the center line; It can also be seen in
Figure 17b,d that as
rA increases, the trajectories of particles with larger mean diameters are likely to cross the centerline, and for particles that are able to cross the centerline, their subsequent trajectories have intersections further upstream on the centerline and occupy a position farther away from the centerline. The exception to this, as can be seen in
Figure 17b, is that the intersection of the particle trajectories corresponding to
rA=2 is at a more upstream location than the particle trajectories corresponding to
rA=6. In addition, the uncertainty in the particle trajectories increases as
rA increases.
It can be observed that the particle velocity decreases and there is no confluence in the particle distribution field for the
rA=8 and 10 cases (
Figure 18). In the case of
rA=2, the particles with larger average diameters move radially inward first and remain axially moving even after crossing the centerline; For
rA=4, particles with larger average diameters first move radially inward, and after they cross the centerline, they move outward; For
rA=6, the motion trend of particles with larger average diameter possesses the above 2 cases. At the same time, the particle distribution field corresponding to
rA=6 is in the most dispersed spatial distribution. Thus, both
Ψp10 and
Ψp20 first increase and then decrease with
rA. In addition, due to the overall decrease in gas velocity, the decrease in particle velocity naturally leads to a monotonic decrease in
vp,a10 and
vp,a20 with
rA. The two particle velocity distributions corresponding to
rA=8 and 10 are very homogeneous with only small variations in the cross sections at
X=10
de and 20
de, and the particle diameter distributions of the former have a clearer hierarchical structure than those of the latter. The particle velocity distribution corresponding to
rA=6, on the other hand, shows a very clear asymptotic change, i.e., the span of particle velocity becomes smaller with further increase in
rA. Therefore, when
rA increases,
Φvp10 and
Φvp20 first increase and then decrease.
Similarly, based on the above analysis, we can list a selection scenario for the area ratio rA for different flame types. At rA=2, the average particle velocity vp,a reaches a maximum value of 433.30 m/s, and the dispersion Ψp is a minimum value of 0.0624, which gives the nozzle structure a stronger ability to penetrate the target of combustibles and is more suitable for penetrating flames; When vp,a is close to 200 m/s and Ψp is greater than 0.0976, choosing rA=8 is more effective for spreading flames; At rA=6, Ψp reaches a maximum value of 0.1633, while the particle velocity inhomogeneity Φvp is 0.236, which is suitable for dispersive flames.
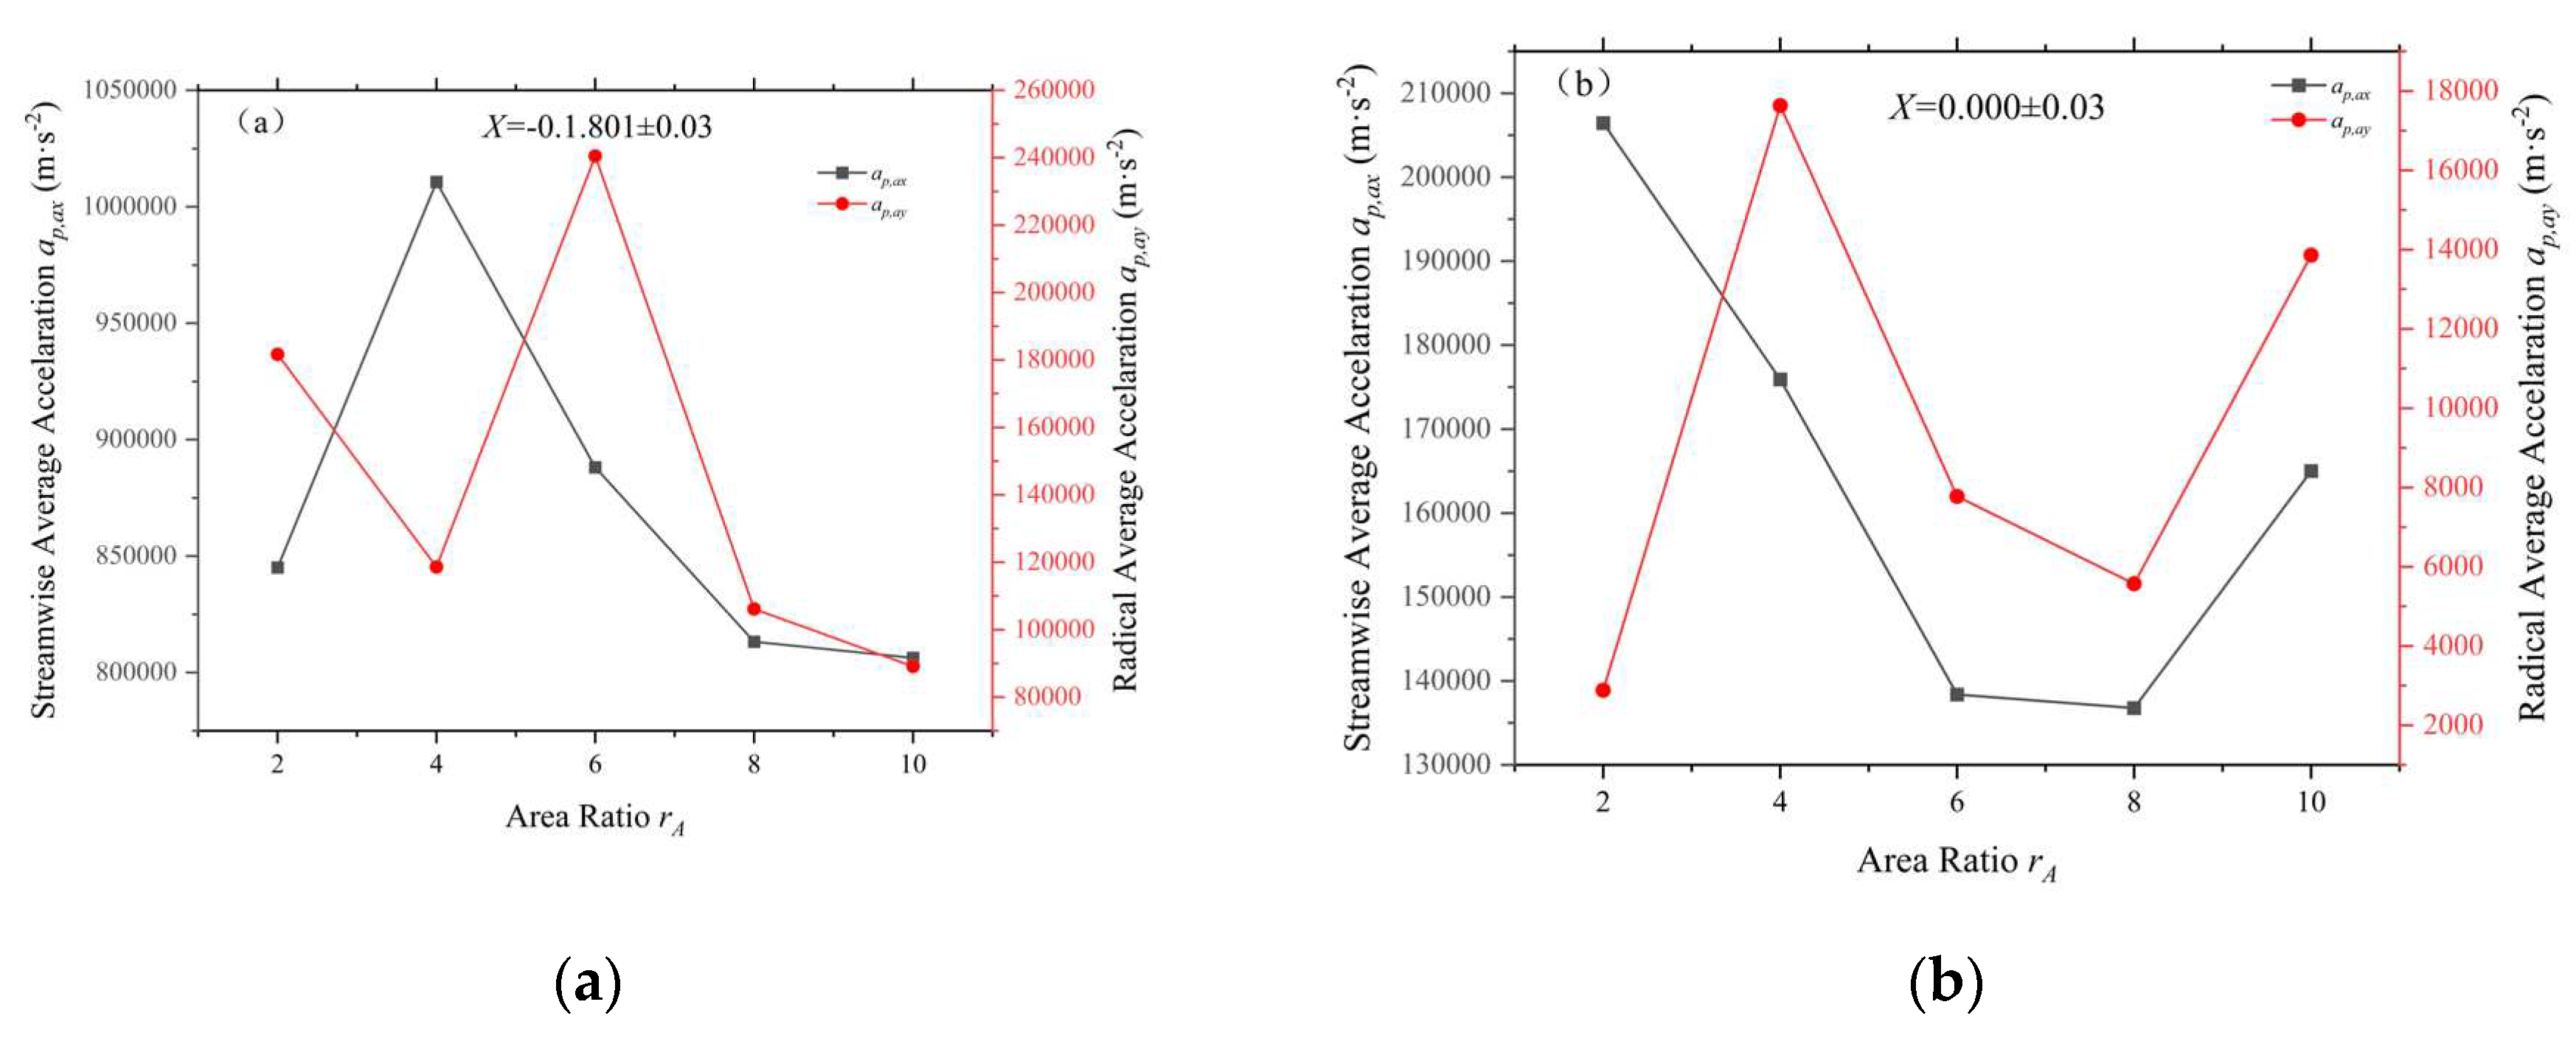
As with the analysis above, we similarly incorporate observations of the flow field development in conjunction with the change in acceleration and hence the development of the flow field (
Figure 19). As the area ratio increases, for the X1 region, neither the streamwise accelerations nor the radial accelerations of the particles show a monotonicity, but instead show a complex variation by reaching extreme values at
rA=4 and
rA=6, respectively. Among them, for the flow acceleration, it is first increasing and then decreasing with the increase of area ratio, while the radial acceleration shows some hysteresis, first decreasing and then increasing and finally decreasing with the increase of area ratio. The X2 region is relatively simple, except that the difference between
ap,ax and
ap,ay is large when
rA is smallest, and as
rA grows,
ap,ax and
ap,ay decrease and then increase almost synchronously. This reflects the situation that the relative velocities of the gas and solid phases grow first and then decrease.
Similarly, we can define a dummy particle to compare the radial position and its corresponding state at different rA. Taking the X1 region as an example, first of all, for the minimum rA, the inside of the nozzle is a more homogeneous low-velocity flow field, and the dummy particles are at a position relatively close to the center of the nozzle. As rA increases, the high-speed zone is developed inside the nozzle, at which time the radial position of the dummy particles also gradually moves outward, and a larger acceleration is obtained. However, when rA increases further, the boundary between the high-speed zone and the low-speed zone inside the nozzle becomes clearer gradually. But at this time, the dummy particles continue to move outward, and gradually pass through the high-speed zone, and then enter into the peripheral low-speed zone again, far away from the centerline, resulting in the velocity dispersion of the particles also increases with the increase in rA and the increases. Thus ap,ax shows a tendency to increase and then decrease.
In contrast, for the case of ap,ay the variation is mainly due to the fact that the flow develops further as the virtual particles move away from the centerline, and the region they pass through produces large fluctuations in the velocity gradient in the radial direction. When rA=6, the internal flow is significantly stratified, which leads to a peak in ap,ay. As rA increases, the flow develops further, the high-speed region expands, the virtual particles move away from the centerline, and the acceleration gradually falls back.
The X2 region is at the exit downstream of the nozzle, and for the smallest rA dummy particles are located almost right near the centerline, and as rA increases, the dummy particles move toward the center region in which the velocity is relatively low. At this point, although the virtual particles are closer to the centerline, the radial velocity gradient increases greatly as the flow develops, which explains the fact that ap,ax decreases to some extent along with it while at the same time ap,ay jumps up substantially. And when the flow develops further, the virtual particles suddenly leap out of the high velocity region and reach the peripheral low velocity gas region away from the centerline, resulting in a further decrease in ap,ax and a concomitant decrease in ap,ay. Only in the final phase does it move back slightly, while the exit high velocity region continues to expand and the gas velocity in this region increases slightly, which results in an increase in ap,ax and ap,ay in the final phase.

