
Submitted:
02 January 2024
Posted:
04 January 2024
You are already at the latest version
Abstract
Multispectral and 3D LiDAR remote sensing data sources are valuable tools for characterizing the 3D vegetation structure and thus understanding the relationship between forest structure, biodiversity and microclimate. This study focuses on mapping riparian forest species in the canopy strata using a fusion of Airborne LiDAR data and multispectral multi-sources and multi-resolution satellite imagery; Sentinel-2 and Pleiades at tree level. The idea is to assess the contribution of each data source in the tree species classification at the considered level. The data fusion was processed at feature-level and decision level. At feature level, LiDAR 2D attributes were derived and combined with vegetation indices. At decision level, LiDAR data was used for 3D tree crown delimitation providing unique trees or groups of trees that are used as a support for the species classification. Data augmentation techniques were used to improve the training process. Best results were obtained by the fusion of Sentinel-2 time series and LiDAR data with a Kappa of 0.66 thanks to red-edge based indices that better discriminate vegetation species and the temporal resolution of Sentinel-2 images that allows monitoring the phenological stages helping to discriminate the species.
Keywords:
Multispectral
; Sentinel-2
; Pleaides
; LiDAR
; data fusion
; forest biodiversity
; species classification
1. Introduction
Forests, which cover around one third of continental surfaces, [1,2] constitute a source of materials and renewable energy, they also provide major ecosystemic services such as soil preservation, biodiversity conservation and climate regulation [3]. In order to ensure sustainable management of forest resources, the study of their functioning and dynamics is essential. Multispectral and 3D LiDAR remote sensing data sources have proved to be valuable tools for modelling forest structure [4,5,6,7,8] and detecting vegetation strata [9] thus helping to understand the relationship between forest structure, tree species diversity, and microclimate.
The global objective of this work is to produce relevant information from multi-source LiDAR and optical multispectral data such as spectral indices, Digital Terrain Models (DTM), species classification, 3D structures and vegetation profiles in order to link them to tree biodiversity indicators. This study mainly focuses on mapping riparian forest species in the canopy strata using a fusion of Airborne LiDAR data and multispectral multi-sources satellite imagery; Sentinel-2 and Very HighResolution (VHR) Pleiades at tree level.
Previous studies [4] revealed that indices derived from Sentinel2 narrow bands located in the red edge (B6, B7 and B 8a) such as NDVIre [5] help to overcome the well-known problem of saturation of the vegetation . This has provided support for the use of such spectral indices in the forest species classification to conquer the complex spatial properties (complexity of the forest environment, variability of crown diameters, overlaps of vegetation) and very similar radiometric properties (shades of green and shadows) as well as the spatial resolution that is not sufficient to discern species with bare eye. In addition, some other studies[6,10] showed that the results of multi-date classification based on seasonal analysis[7] surpassed those of single-date classification pointing out the importance of Sentinel-2 temporal resolution for mapping forests.
As for VHR imagery, their advantage is exploiting the geometric information using oriented object methods thanks to segmentation algorithms. Individual tree crown delineation algorithms based on 2.5 D Canopy Height Models (CHM), such as itcSegment[8] , SEGMA[11] , eCognition[12] ,are faster than those based on 3D point clouds (AMS3D [13], Graph-Cut [14], Profiler[15,16]). Conversely 3D algorithms showed better crown delineation results than counting on CHM only, especially with dense 3D point clouds[12]. This paper is structured as follows; Materiels and Methods are presented in section 2 , then results and discussions are respectively given in section 3 and 4, finally conclusions are drawn in the fifth section .
2. Materials and Methods
2.1. Study Area
The study area located in southwestern France (Figure 1). The Ciron watershed and its riparian forest is a tributary of the Garonne known as a climatic refuge for the beech, on the warm margin of its European range [17]. This riparian forest is made up of an assemblage of species such as oak, beech, locust, pine, etc.Twenty-eight plots forming a gradient of three-dimensional vegetation structure are defined. They are distributed along a 30km stretch of the Ciron and along 5km tributary of the Ciron in which the riparian forest is lined with pine forests (maritime pine) in order to homogenize the potential impact of the surrounding landscape on the biodiversity of fauna and flora in the riverine.
All the measurements are carried out on each site within a 15 meter radius, including all the riparian forest as well as a part of the pine forest adjacent to the riparian forest. The data processing then requires a delimitation of the 28 sites. Square-shaped vector layers with a side of 200 meter each, are used to crop optical and LIDAR data. These layers are projected into the national coordinates system "RGF 93 Lambert 93 ".
2.2. Remote sensing data
In order to take advantage of the complementarity between the spectral information resulting from optical data and geometric information from LiDAR data for the characterization of forest species, three multi-sources and multi-resolution data were processed. They are based on Sentinel-2 image time series, Pléiades VHR images and LiDAR 3D point clouds.
2.2.1. Satellite images
2.2.1.1. Sentinel-2 images
The Sentinel-2 mission is a high-resolution optical mission of the European Space Agency (ESA). It is a constellation of two identical satellites Sentinel-2A and Sentinel-2B, for earth observation and launched since 2015.
French public institutions involved in earth observation and environmental sciences created Theia continental surface data and services hub [18]. This center provides the international scientific community with a panoply of satellite images including Sentinel-2 images with different levels of pre-processing.
Sentinel-2 sensor provides 10 spectral bands, dedicated to earth observation, at 10 m and 20 m covering Vis-NIR, red edge and SWIR domains which are useful for vegetation classification. In addition, Sentinel-2 A and B allows us to have a free and easy downloadable time series with a 5-day frequency allowing to perform classifications on multi-temporal image series.
A collection of 11 Sentinel-2 satellite images were used, ranging from January to December 2019, and processed in level 2A thus providing Top of canopy reflectances reducing the effects of slopes and shadows. Information about used scenes are provided in the Table 1. :
2.2.1.2. VHR Pleiades images
Pléiades is an environment-focused constellation consisting of two satellites (referred to as 1A and 1B) from CNES (French center of spatial studies), which were launched on 17 December 2011 (Pléiades 1A) and 2 December 2012 (Pléiades 1B). It is characterized by a very high spatial resolution of 50cm for panchromatic band and 2m for multi-spectral bands; four spectral bands B,G,R, NIR and a temporal resolution of 26 days [19].Pleiades images were processed in Top of the atmosphere reflectance (TOA).
2.2.2. LiDAR data
LiDAR is the only remote sensing technology that allows the user to get 3D information underneath the vegetation canopy and to model the 3D vegetation structure since the laser impulsion penetrates the vegetation. In this work, a 250m vertical height flight acquisition mission, with 190kHz measurement rate provided a very dense point cloud of 68 pts/m². This helps modelling the soil underneath vegetation and the 3D vegetation structure. The Table 2. summarizes the LiDAR mission details:
2.2.3. Training and testing data
Joint airborne acquisition and in-field observations were conducted in the autumn (3rd and 4th October 2019) with tree foliage on. Trees were measured on canopy and shrub strata leading to more than 31 unbalanced classes. In this study, we only focus on five major canopy classes. In-field data correspond to circular plots with a radius of 15 m as shapefiles of points. Training and Testing data (Figure 2.) were selected using individual tree crowns generated after the segmentation process (see section 2.3.3). They consist of 165 and 73 samples, respectively.
2.3. Methodology
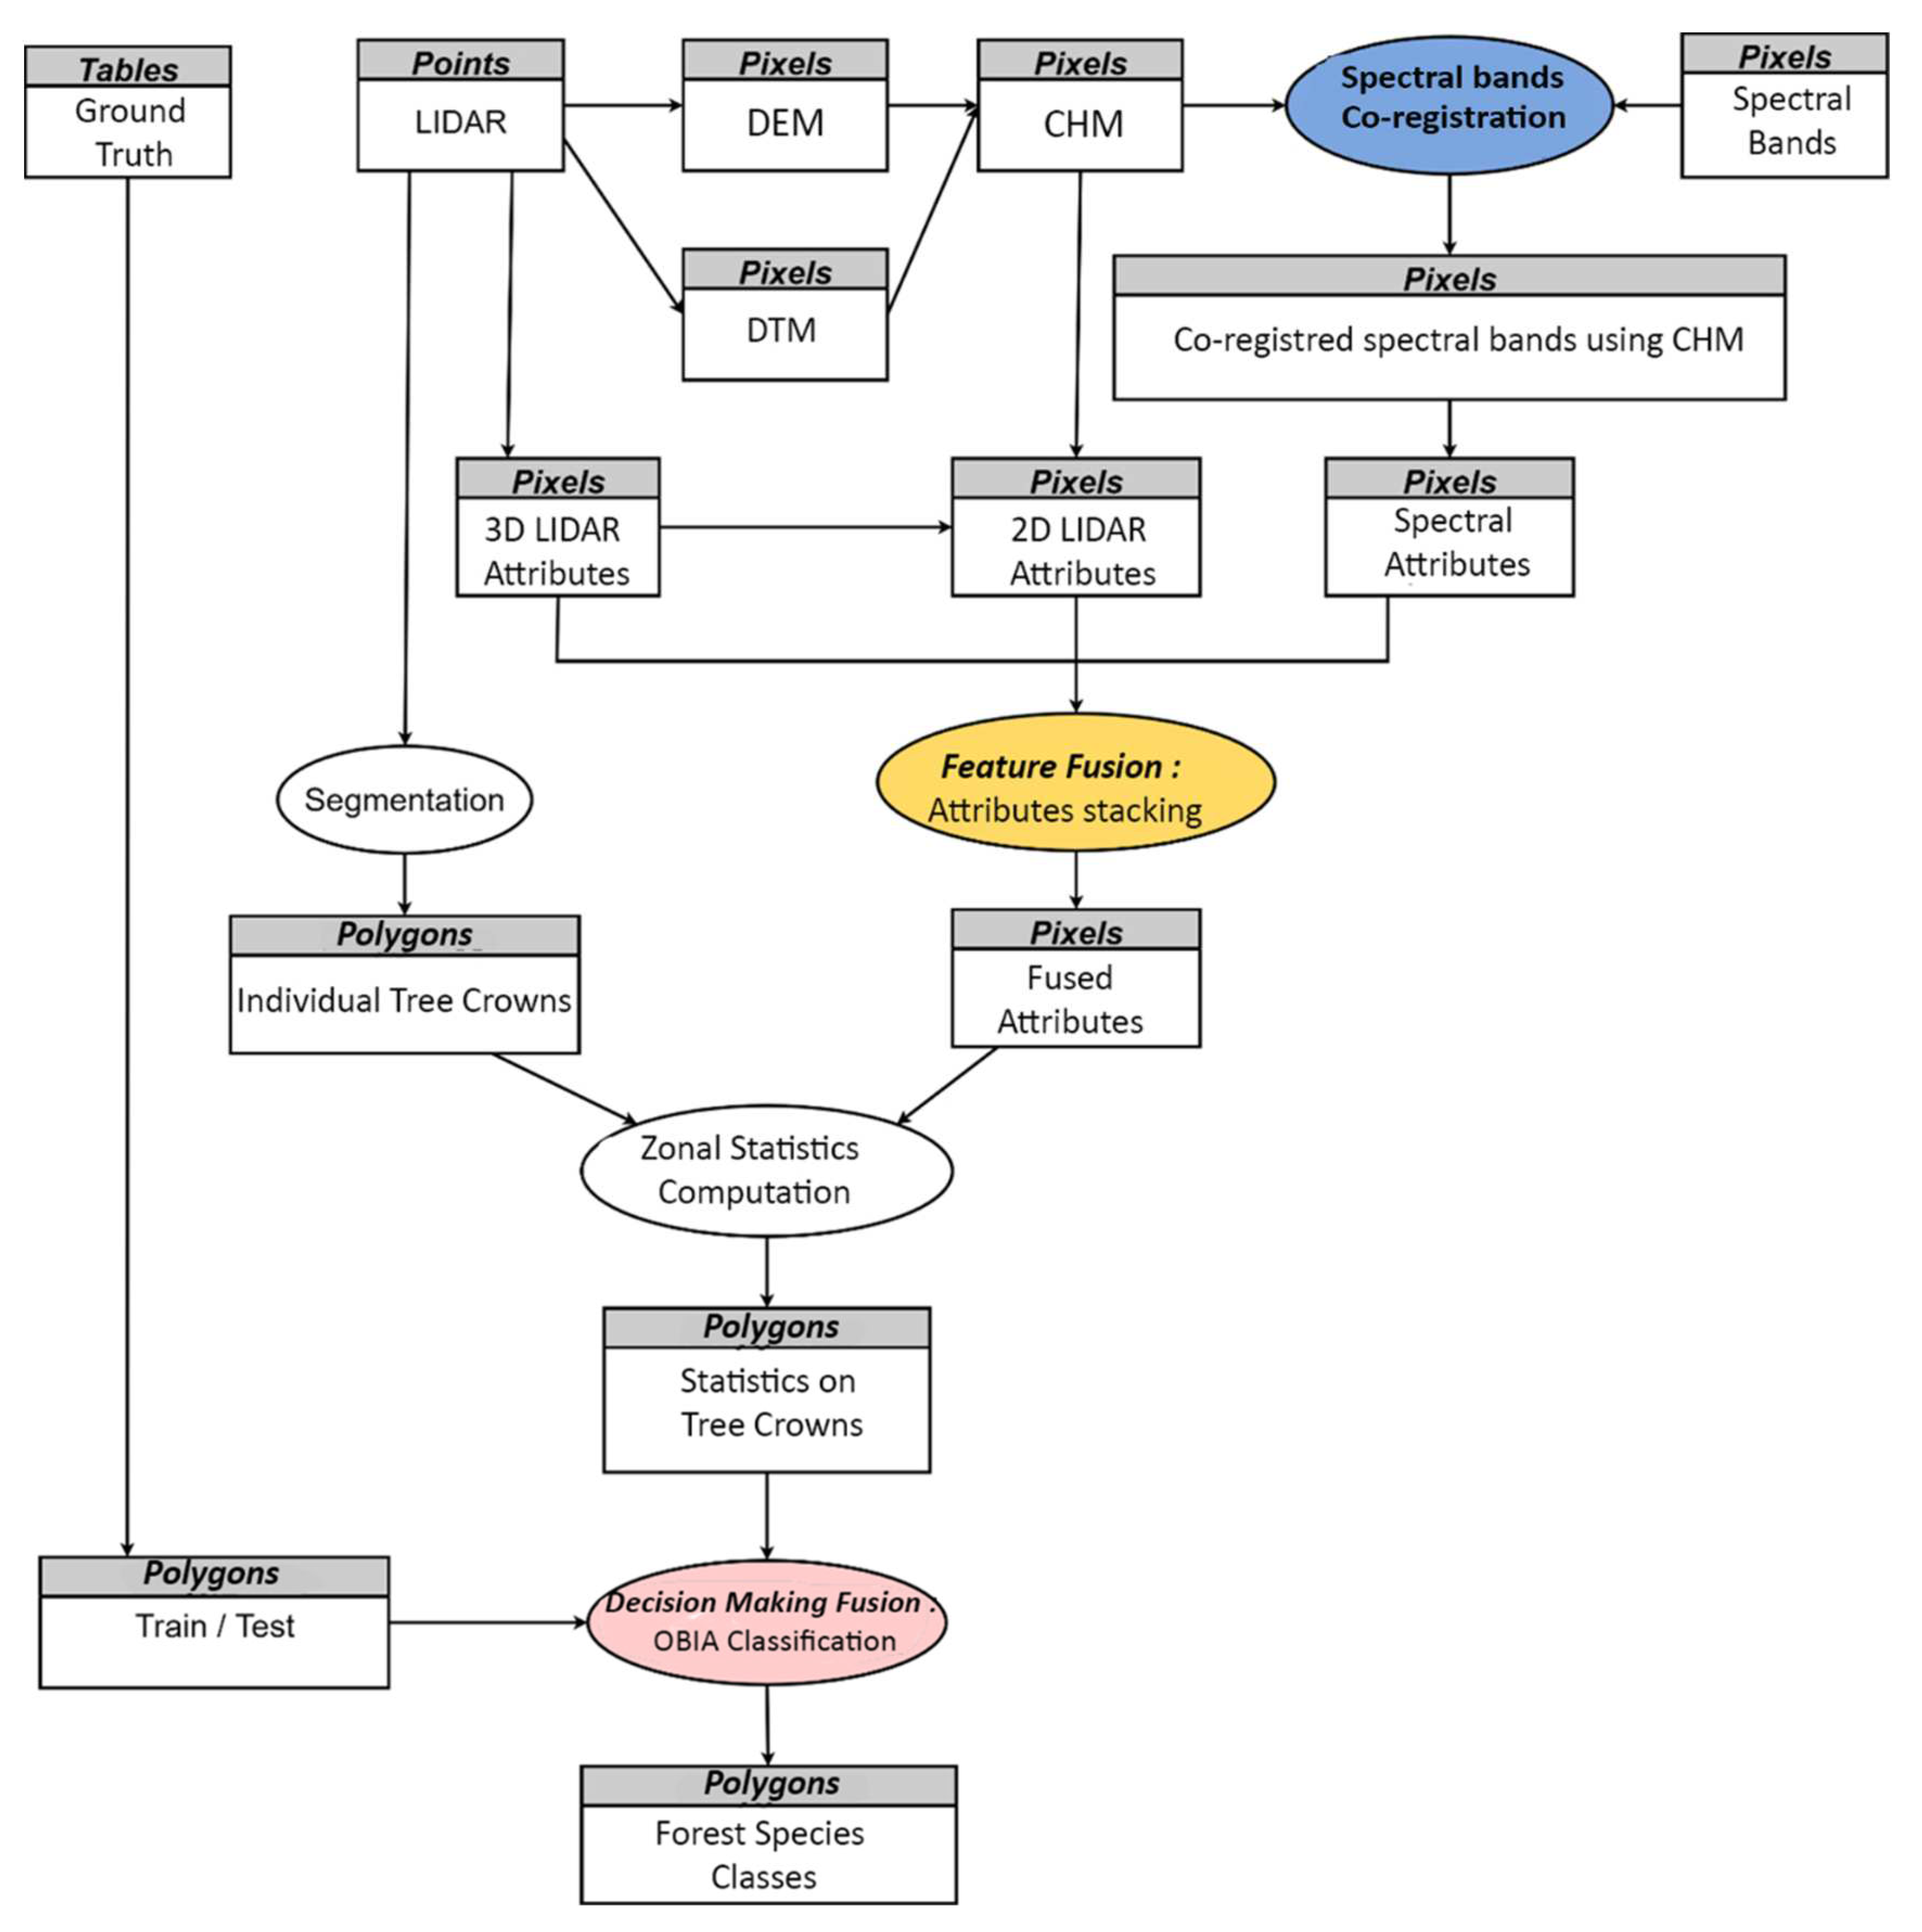
In this paper, an automated workflow is proposed for airborne LiDAR and multispectral satellite imagery fusion to map riparian forest species biodiversity at tree level as illustrated in the scheme below. It consists of three levels of processing:
1. LiDAR and multispectral images co-registration
2. Feature fusion
3. Decision making fusion
Figure 3.
LIDAR and multispectral data fusion for forest species classification.
2.3.1. LiDAR and multispectral images co-registration
LiDAR and multispectral data were first co-registered exploiting the high accuracy of Lidar data. Each data source was processed separately and then fused at feature and decision-making levels[6].
Co-registration is essential to manipulate multi-source data. However, the digital elevation models used for satellite image ortho-rectification are less accurate than those generated from LiDAR point clouds due to the differences between their spatial resolutions. This leads to a misregistration between the image and the LiDAR-derived elevation models. We therefore opted for a data co-registration as a geometric correction that consists of spectral bands translation in order to assign them the same planimetric location as the 2D representations of LiDAR data and match their pixels with accurate trees’ positions. (Figure 4).
2.3.2. Feature fusion
In the context of specie characterization in a forest environment, the most widely used 2D representation is the Canopy Height Model (CHM) as it represents the height of trees. It is obtained by substracting the Digital Terrain Model from the Digital Surface Model. Though, DSM, DTM and CHM (Figure 5) were derived from dense LiDAR point clouds leading to 2D elevation maps at a resolution of 0.25 m.
Spectral bands were then upsampled to the CHM resolution, clipped over plots ‘extents and finally translated over CHM’s extents finishing the co-registration process.
Fusion at feature level was first processed by generating then stacking spectral and geometric LiDAR 2D attributes which are intended to be used in the classification of forest species. We mainly used three LIDAR attributes as shown in Table 3 and Figures 5.
Figure 6.
Density map of site 1.
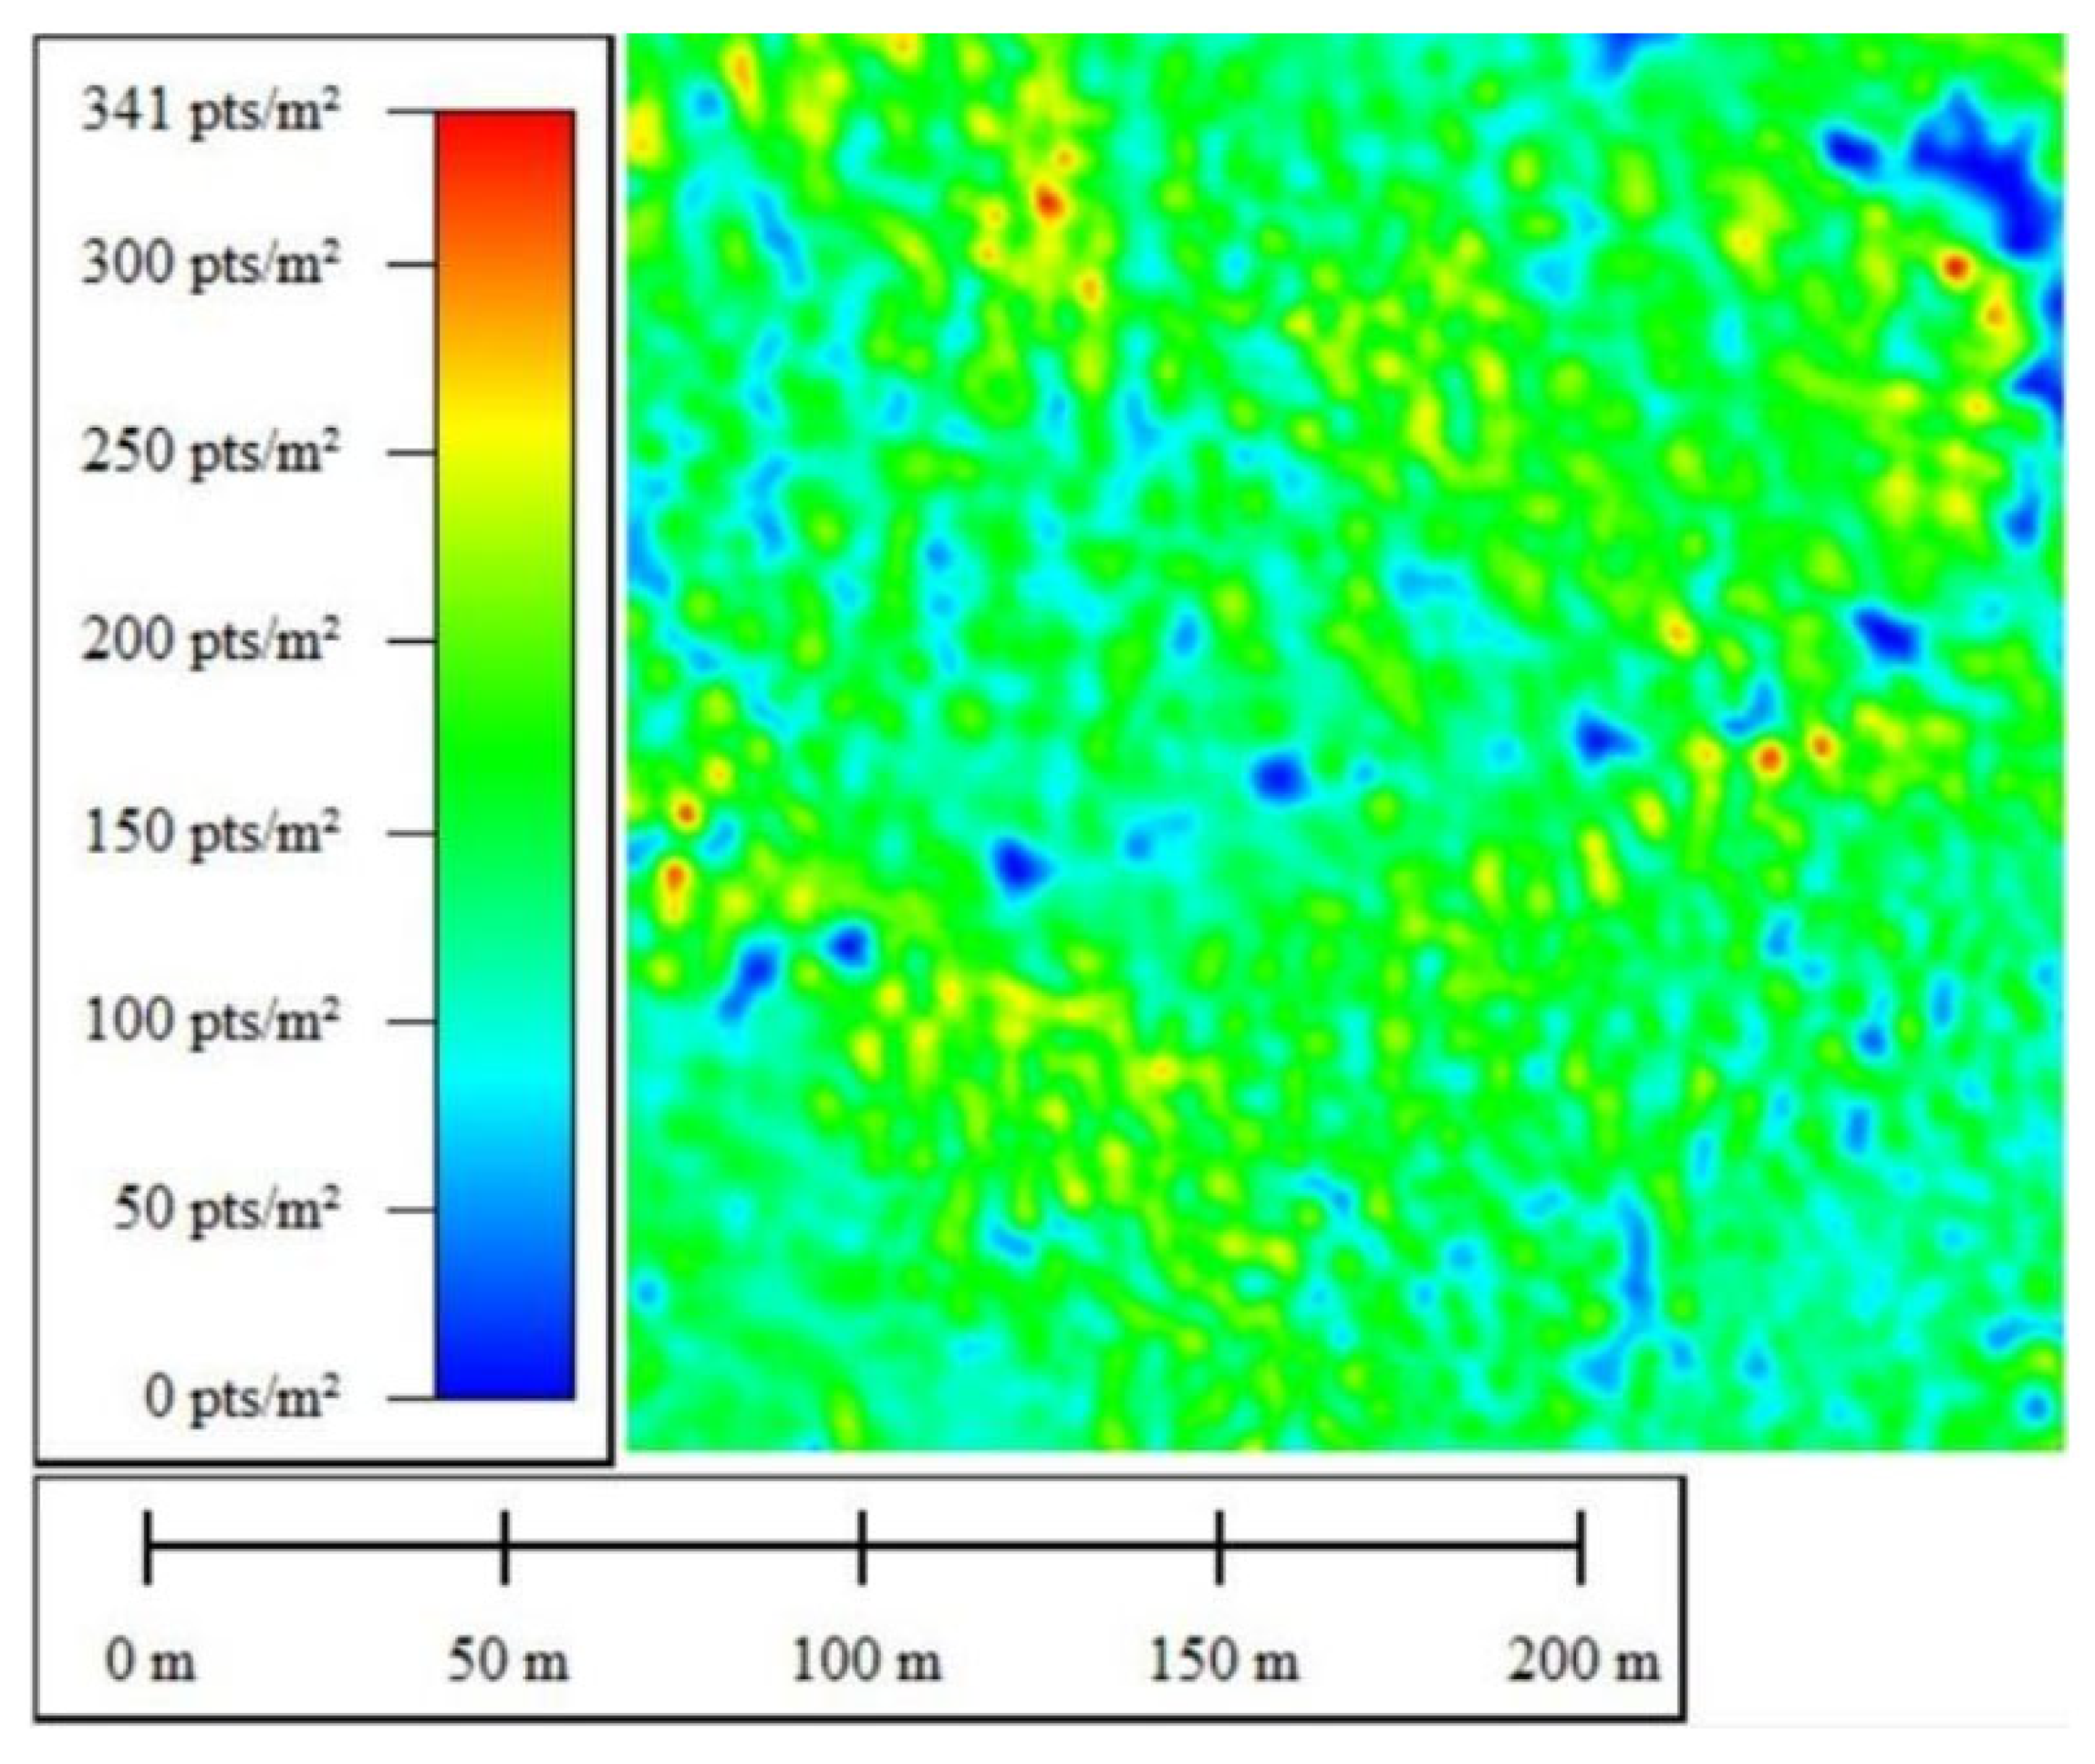
Figure 7.
Number of Echoes map of site 1.
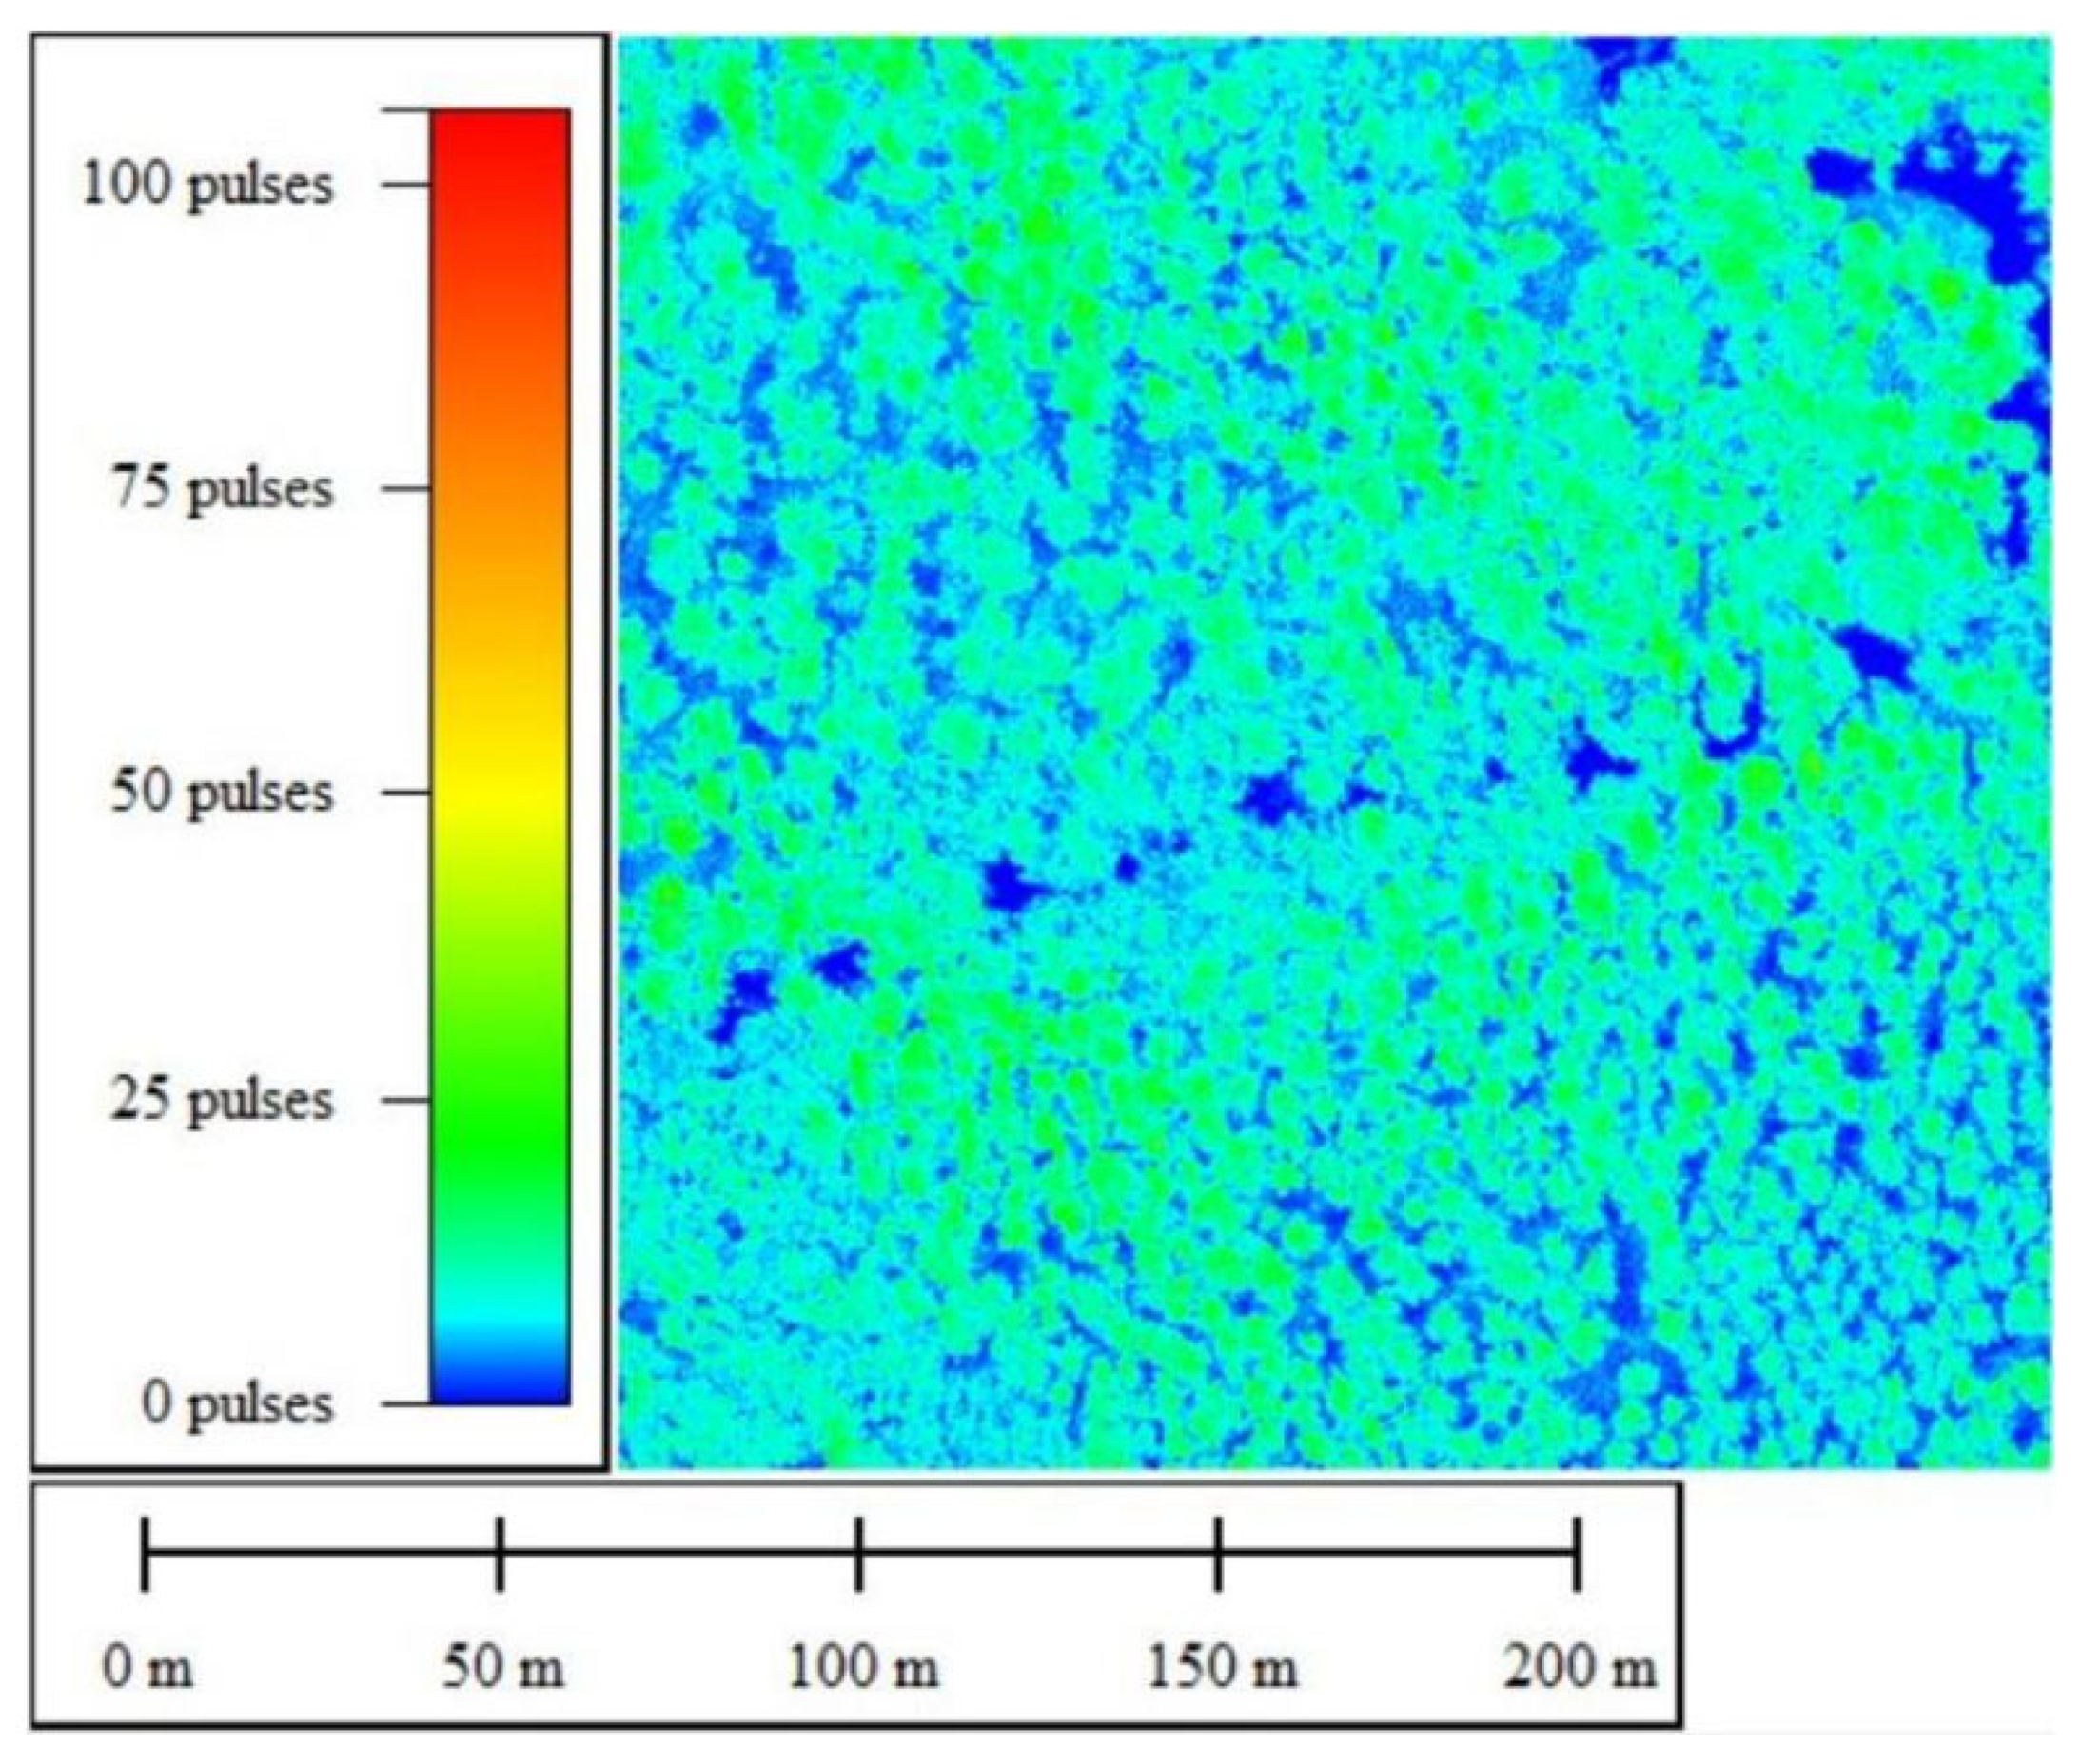
Figure 8.
Elevation range map of site 1.
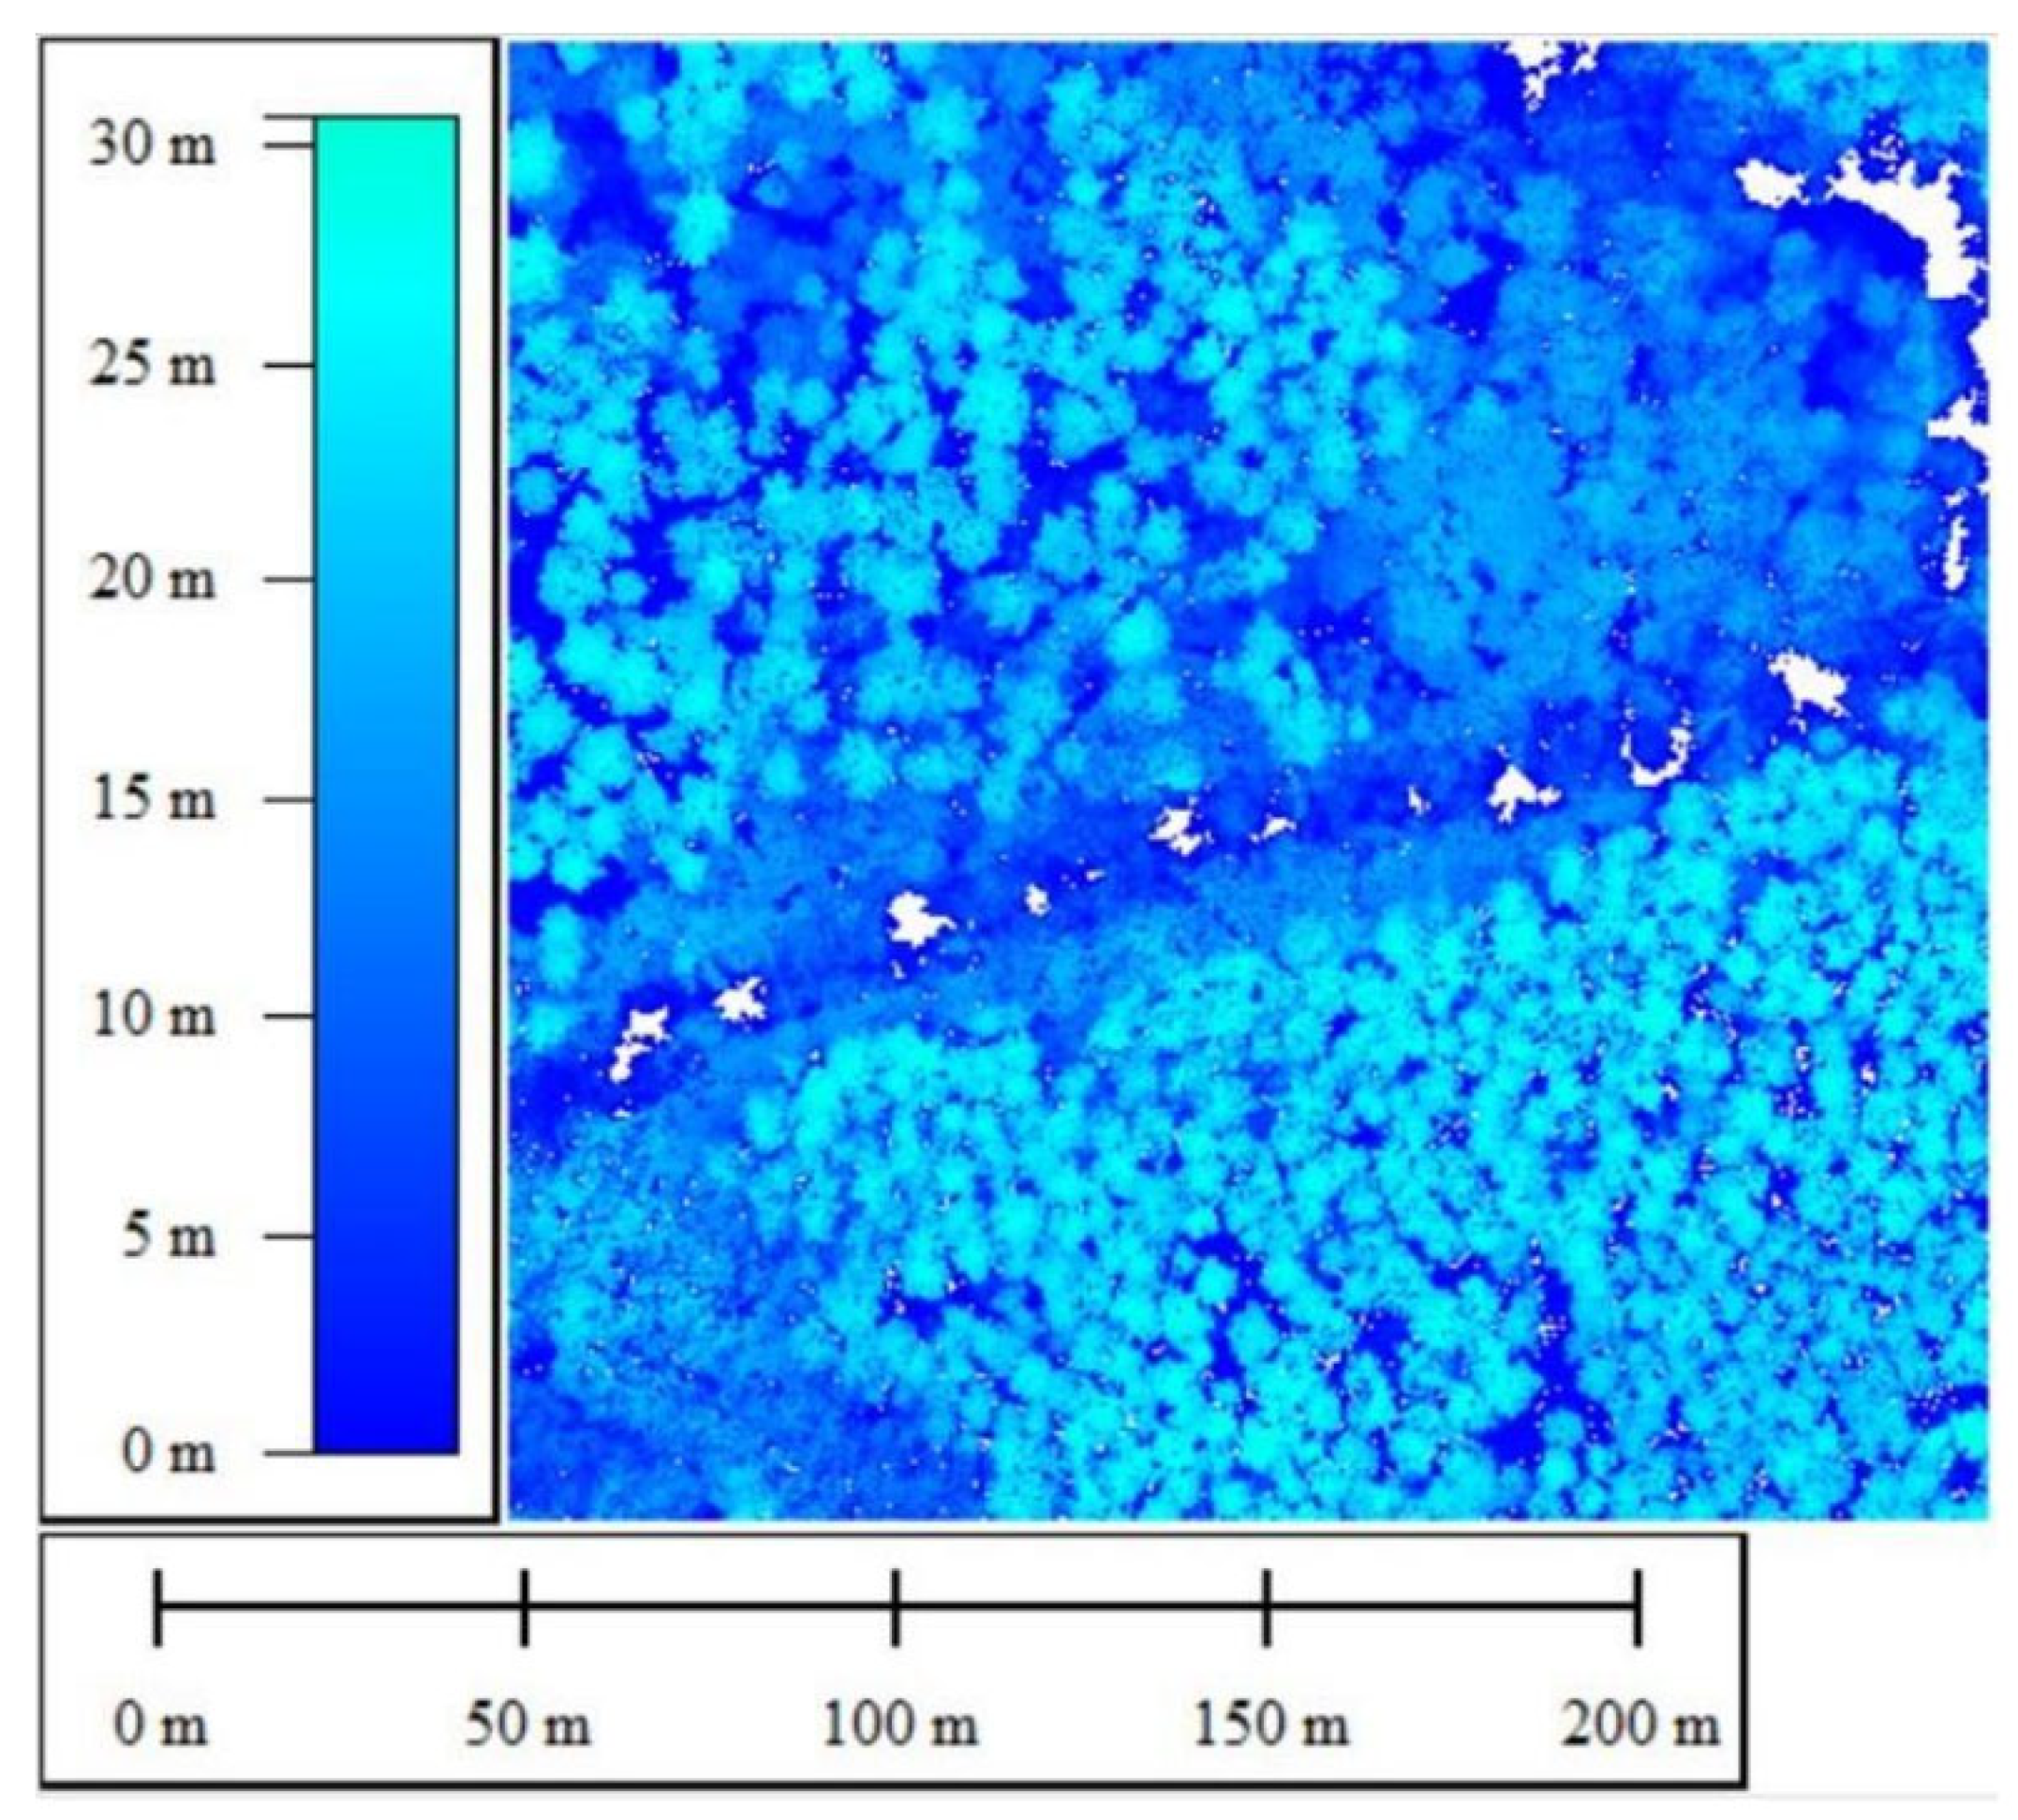

Table 3.
Used LIDAR attributes and their utility.
| Lidar attributes | Definition | Utility |
|---|---|---|
| Density | Number of LIDAR points per area unit | Characterizing biodiversity and providing information on the number of vertical strata in each zone. |
| Number of Echoes | Number of backscatters of the laser pulse | Tree species characterization according to their spatial distribution |
| Elevation range | Altitude difference between the first and last echo | Tree species discrimination according to their thickness and height |
2.3.3. Decision making fusion
At decision-making level, 3D LiDAR point clouds were segmented using PyCrown method [19] which is a re-implementation of the itcSegment crown delimitation algorithms. It provides a 3D segmentation of individual trees besides a raster segmentation. It is based on local maximum search (i.e. tree tops) and region growth with regards to user-defined parameters (distance of a crown point from its top and point height w.r.t crown average heights).These parameters are defined for each site individually in the aim of maximising the compactness [20].
Segmented LiDAR regions were first used to select training and testing samples by inspecting the ground truth data and assigning the appropriate classes to tree crowns. Then spectral attributes at an object-level (tree crowns) were derived using attributes' mean and standard deviation over each segmented region. An object-oriented classification was then carried out on labeled tree crowns. And this is where the decision-making fusion between LiDAR and multispectral data lies.
Due to few training data, data augmentation techniques as Gaussian Noise filtering were applied on each spectral band and each attribute to double them in order to allow the classifier to learn more robust features[21] .
Different feature combinations were used to assess the importance of spectral, temporal, or spatial information:
- Single date Sentinel-2 and LIDAR fusion
- Multi-date Sentinel-2 and LIDAR fusion
- Pleiades and LIDAR fusion
- Single date Sentinel-2 , Pleiades and LIDAR fusion
- Multi-date Sentinel-2 , Pleiades and LIDAR fusion
Finally, the classification was processed using a Random Forest classifier. Results are evaluated using Overall accuracy, kappa and per class precision and recall.
2.3.4. Data fusion process automation
A python script was developed for automating data fusion for tree species classification using GDAL, otbApplication , Numpy , Whitebox and Pycrown (Table 5).
3. Results
3.1. Tree Crown delineation
3.2. Classification
4. Discussion
4.1. Quantitative Interpretations
4.1.1. Evaluation of the best fusion configuration
The best classification results were obtained by the combination of multi-temporal Sentinel-2 images and LiDAR data. We obtained 0.66 as Kappa and 0.69 as Overall Accuracy. It has also shown that Tauzin Oak, Maritime Pine, and the class Other have precision values superior to 0.73 which means that at least 73% of these species where correctly labeled. Otherwise, less than 54% of Pedunculate Oak and Black Alder were correctly labeled. Results have also shown low recall values for the class Other compared to other classes which means that it is sub-estimated by the classifier. In fact, this class is heterogeneous as it assembles many minority tree species not essentially having similar characteristics. Thus confusions occurred in the learning process causing lower classification results.
4.1.2. Contribution of data augmentation
The results obtained by increasing training and validation samples are more relevant. Indeed, this allowed to have more training data to better optimize the classification model parameters. Moreover, the initial training and testing polygons respectively correspond to 0.35% and 0.15% only of the total number of tree crowns. The small number of polygons selected is mainly related to the fact that the in-field data provided are point-geometry shapefiles (Figure 14) covering only 15m radius circular plots . Each point corresponds to a location of a tree trunk. The density of these points is important so that some canopy crowns could cover sub-canopy trees. This makes the choice of polygons critical, in order to avoid the interference of several classes within the same polygon and consequently avoid misleading the learning process. Hence, the number of training and testing samples was reduced.
4.2. Qualitative interpretations
4.2.1. Spectral Vs. spatial resolutions contribution
By comparing the results of “LiDAR – Sentinel-2 mono-date" and "LiDAR – Pléiades" fusion configurations, one can notice that the first combination using Sentinel-2 image was better despite a lower spatial resolution than Pléiades imagery (2m). This can be explained by the fact that forestry environment is dominated by vegetation leading to low reflectance variance in visible and near infrared spectral bands of Pléiades. In addition, the higher the spatial resolution is, the more the satellite sensor is able to discern small details. Therefore, shadows and ground through the vegetation are detected which makes discriminating species more challenging.
However, Sentinel-2 images are characterized by spectral richness (10 bands). Thanks to its high spectral resolution and especially the red edge domain, many attributes are calculated highlighting information related to chlorophyll activity, chlorophyll content, internal leaf structure and leaf health while minimizing the effect of disturbing signals (shadows and soil).
Therefore, it turns out that the spectral resolution impact on the characterization of forest species is more important than that of spatial resolution.
4.2.2. Contribution of image time series
The best obtained results correspond to multi-temporal classifications. Indeed, time series make it possible not only to multiply the number of attributes but also to extract information related to the different phenological stages of the forest. They thus allow taking into account the phenomenon of changes in leaf color during the seasons and loss of foliage that differ from one species to another.
4.2.3. Tree species assemblage interpretations
By observing the charts, we notice that the class "Other" is a minority compared to other classes. This is in fact related to previous interpretations concerning the low recall values of this class. Another interesting remark concerns the spatial distribution of classes, is that the presence of certain classes is linked to the characteristics of the environment such as Black Alder which is often present at the edge of the river. All these data are consistent with a study carried out in the same place [27] which showed that alder trees are specifically located along the river bank and that this riparian forest mainly consists of Pedonculate oak trees whereas maritime pines and tauzin oaks are more located further from the river .This approach can then be used to test many hypotheses concerning the functioning and dynamics of the forest ecosystem and conversely this information could be used as an a priori to enhance the prediction of related classes such as Black Alder.
5. Conclusions
This paper focused on the tree crowns delineation in 2D and 3D and the mapping of forest species by exploiting multi-source: spectral and high point density LIDAR data. Thanks to an automated workflow, several features and data sources combinations were tested to assess the contribution of the characteristics of each of them.
The key findings of this study are first, the contribution of data augmentation by Gaussian noise filtering in overcoming the lack and imbalance of training and testing data as it allows learning more robust features by the classifier.
Secondly, the study showed the assessment of Sentinel-2 resolutions impact in forest species classification. In fact, Sentinel-2 high temporal resolution allows multiplying attributes number and getting more relevant information about the different phenological stages such as leaf color changes during seasons and foliage loss.
Equally important to the temporal resolution contribution, Sentinel-2 spectral richness especially the Red-edge domain allows computing numerous attributes that highlight relevant features related to chlorophyll activity, chlorophyll content, internal leaf structure and leaf health added to minimizing disturbing signals effect (shadows and soil).
Otherwise, the very high spatial resolution of Pleiades images worsens the forest species classification as it causes shadows and ground interference through vegetation which creates mixed spectral signatures measured at the sensor and makes it more difficult to discern species.
In addition, high density LIDAR data are with great importance in this process. Indeed, it allows individual tree crowns delineation, elevation attributes generation and pixels co-registration to match Sentinel-2 pixels with accurate positions.
Further work will focus on providing spatial metrics from species patterns and measuring their relationships with biodiversity taxa especially canopy and sub strata association.
Acknowledgments
The authors want to thank the French National Space Agency - CNES for their support through the TOSCA FRISBEE project.
References
- CPF, Strategic framework for forests and climate change. A proposal by the Collaborative Partnership on Forests for a coordinated forest-sector response to climatechange. . 2008.
- FAO, Global Forest Resources Assessment 2020 2020: Rome,Italy.
- Thompson, I.D., et al., Forest biodiversity and the delivery of ecosystem goods and services: translating science into policy. BioScience, 2011. 61(12): p. 972-981. [CrossRef]
- Puletti, N., F. Chianucci, and C. Castaldi, Use of Sentinel-2 for forest classification in Mediterranean environments. Ann. Silvic. Res, 2018. 42(1): p. 32-38. [CrossRef]
- Bolyn, C., et al., Forest mapping and species composition using supervised per pixel classification of Sentinel-2 imagery. Biotechnologie, Agronomie, Société et Environnement, 2018. 22(3). [CrossRef]
- Hill, R., et al., Mapping tree species in temperate deciduous woodland using time-series multi-spectral data. Applied Vegetation Science, 2010. 13(1): p. 86-99.
- Grabska, E., et al., Forest stand species mapping using the Sentinel-2 time series. Remote Sensing, 2019. 11(10): p. 1197. https://doi.org/10.3390/rs11101197. [CrossRef]
- Dalponte, M. and D.A. Coomes, Tree-centric mapping of forest carbon density from airborne laser scanning and hyperspectral data. Methods in ecology and evolution, 2016. 7(10): p. 1236-1245. [CrossRef]
- Njimi, H., N. Chehata, and F. Revers. Mapping riparian forest species for biodiversity analysis by fusion of Airborne LiDAR and multispectral satellite imagery. in # PLACEHOLDER_PARENT_METADATA_VALUE#. 2021.
- Schriever, J.R. and R.G. Congalton, Evaluating seasonal variability as an aid to cover-type mapping from Landsat Thematic Mapper data in the Northeast. Photogrammetric engineering and remote sensing, 1995. 61(3): p. 321-327.
- St-Onge, B., F.-A. Audet, and J. Bégin, Characterizing the height structure and composition of a boreal forest using an individual tree crown approach applied to photogrammetric point clouds. Forests, 2015. 6(11): p. 3899-3922. [CrossRef]
- Aubry-Kientz, M., et al., A comparative assessment of the performance of individual tree crowns delineation algorithms from ALS data in tropical forests. Remote Sensing, 2019. 11(9): p. 1086. [CrossRef]
- Ferraz, A., et al., Lidar detection of individual tree size in tropical forests. Remote Sensing of Environment, 2016. 183: p. 318-333. [CrossRef]
- Williams, J., et al., Three-dimensional segmentation of trees through a flexible multi-class graph cut algorithm (MCGC). arXiv, 2019.
- Hamraz, H., M.A. Contreras, and J. Zhang, A robust approach for tree segmentation in deciduous forests using small-footprint airborne LiDAR data. International journal of applied earth observation and geoinformation, 2016. 52: p. 532-541.
- Hamraz, H., M.A. Contreras, and J. Zhang, Vertical stratification of forest canopy for segmentation of understory trees within small-footprint airborne LiDAR point clouds. ISPRS Journal of Photogrammetry and Remote Sensing, 2017. 130: p. 385-392. [CrossRef]
- Ouayjan, A. and A. Hampe, Extensive sib-mating in a refugial population of beech (Fagus sylvatica) growing along a lowland river. Forest Ecology and Management, 2018. 407: p. 66-74. [CrossRef]
- Sentinel-2 - Missions. Available from: https://sentinel.esa.int/web/sentinel/missions/sentinel-2.
- Zörner, J., et al., Pycrown-Fast raster-based individual tree segmentation for LIDAR data. Landcare Research Ltd.: Lincoln, New Zealand, 2018.
- Lee, S.C., Y. Wang, and E.T. Lee. Compactness measure of digital shapes. in Region 5 Conference: Annual Technical and Leadership Workshop, 2004. 2004. IEEE.
- Shorten, C. and T.M. Khoshgoftaar, A survey on image data augmentation for deep learning. Journal of big data, 2019. 6(1): p. 1-48. [CrossRef]
- Rouault, E., et al., GDAL. 2022, Zenodo.
- Python API — Orfeo ToolBox 8.1.0 documentation. Available from: https://www.orfeo-toolbox.org/CookBook/.
- NumPy. Available from: https://numpy.org/.
- Geoprocessing with Whitebox Workflows for Python, in Whitebox Geospatial Inc.
- PyCrown - Fast raster-based individual tree segmentation for LiDAR data. 2022, Manaaki Whenua – Landcare Research.
- Acloque, A., et al., Recording tree-related microhabitats to assess riparian forest contribution to biodiversity in landscapes dominated by conifer plantations. Biological Conservation, 2023. 286: p. 110261. [CrossRef]
Figure 1.
Study area, Ciron Valley,estern France.
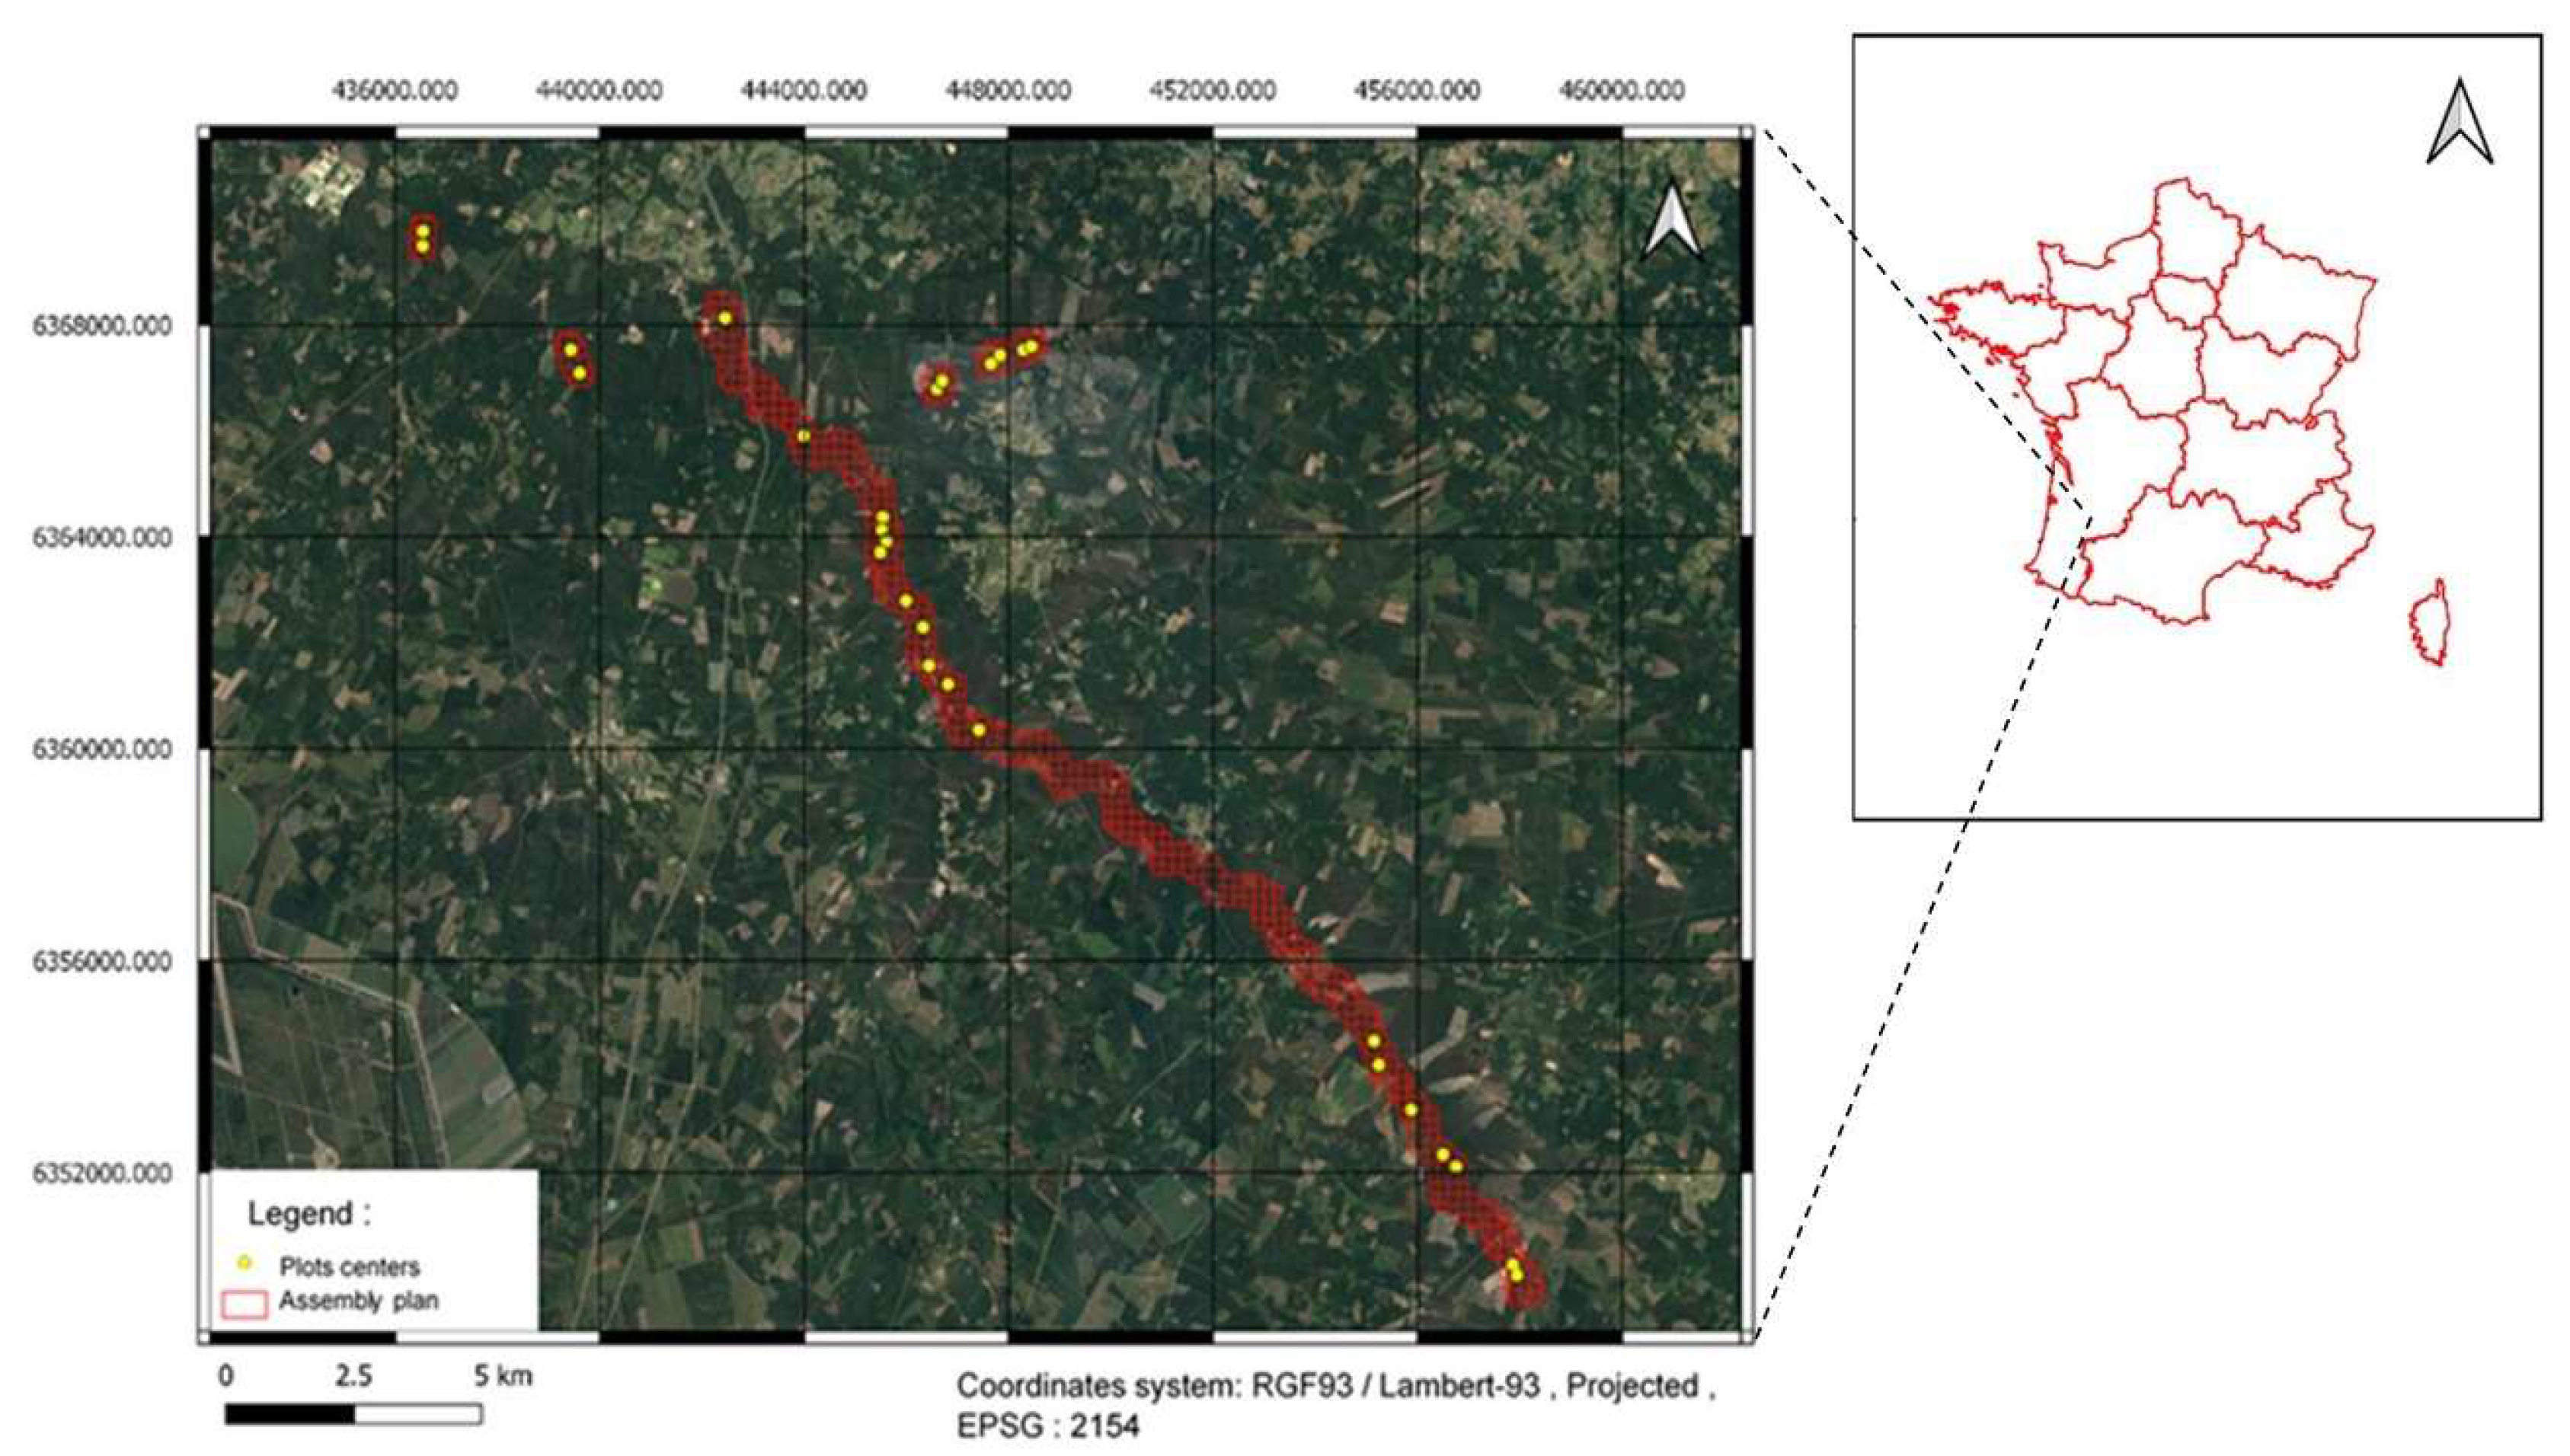
Figure 2.
Training and testing data distribution.
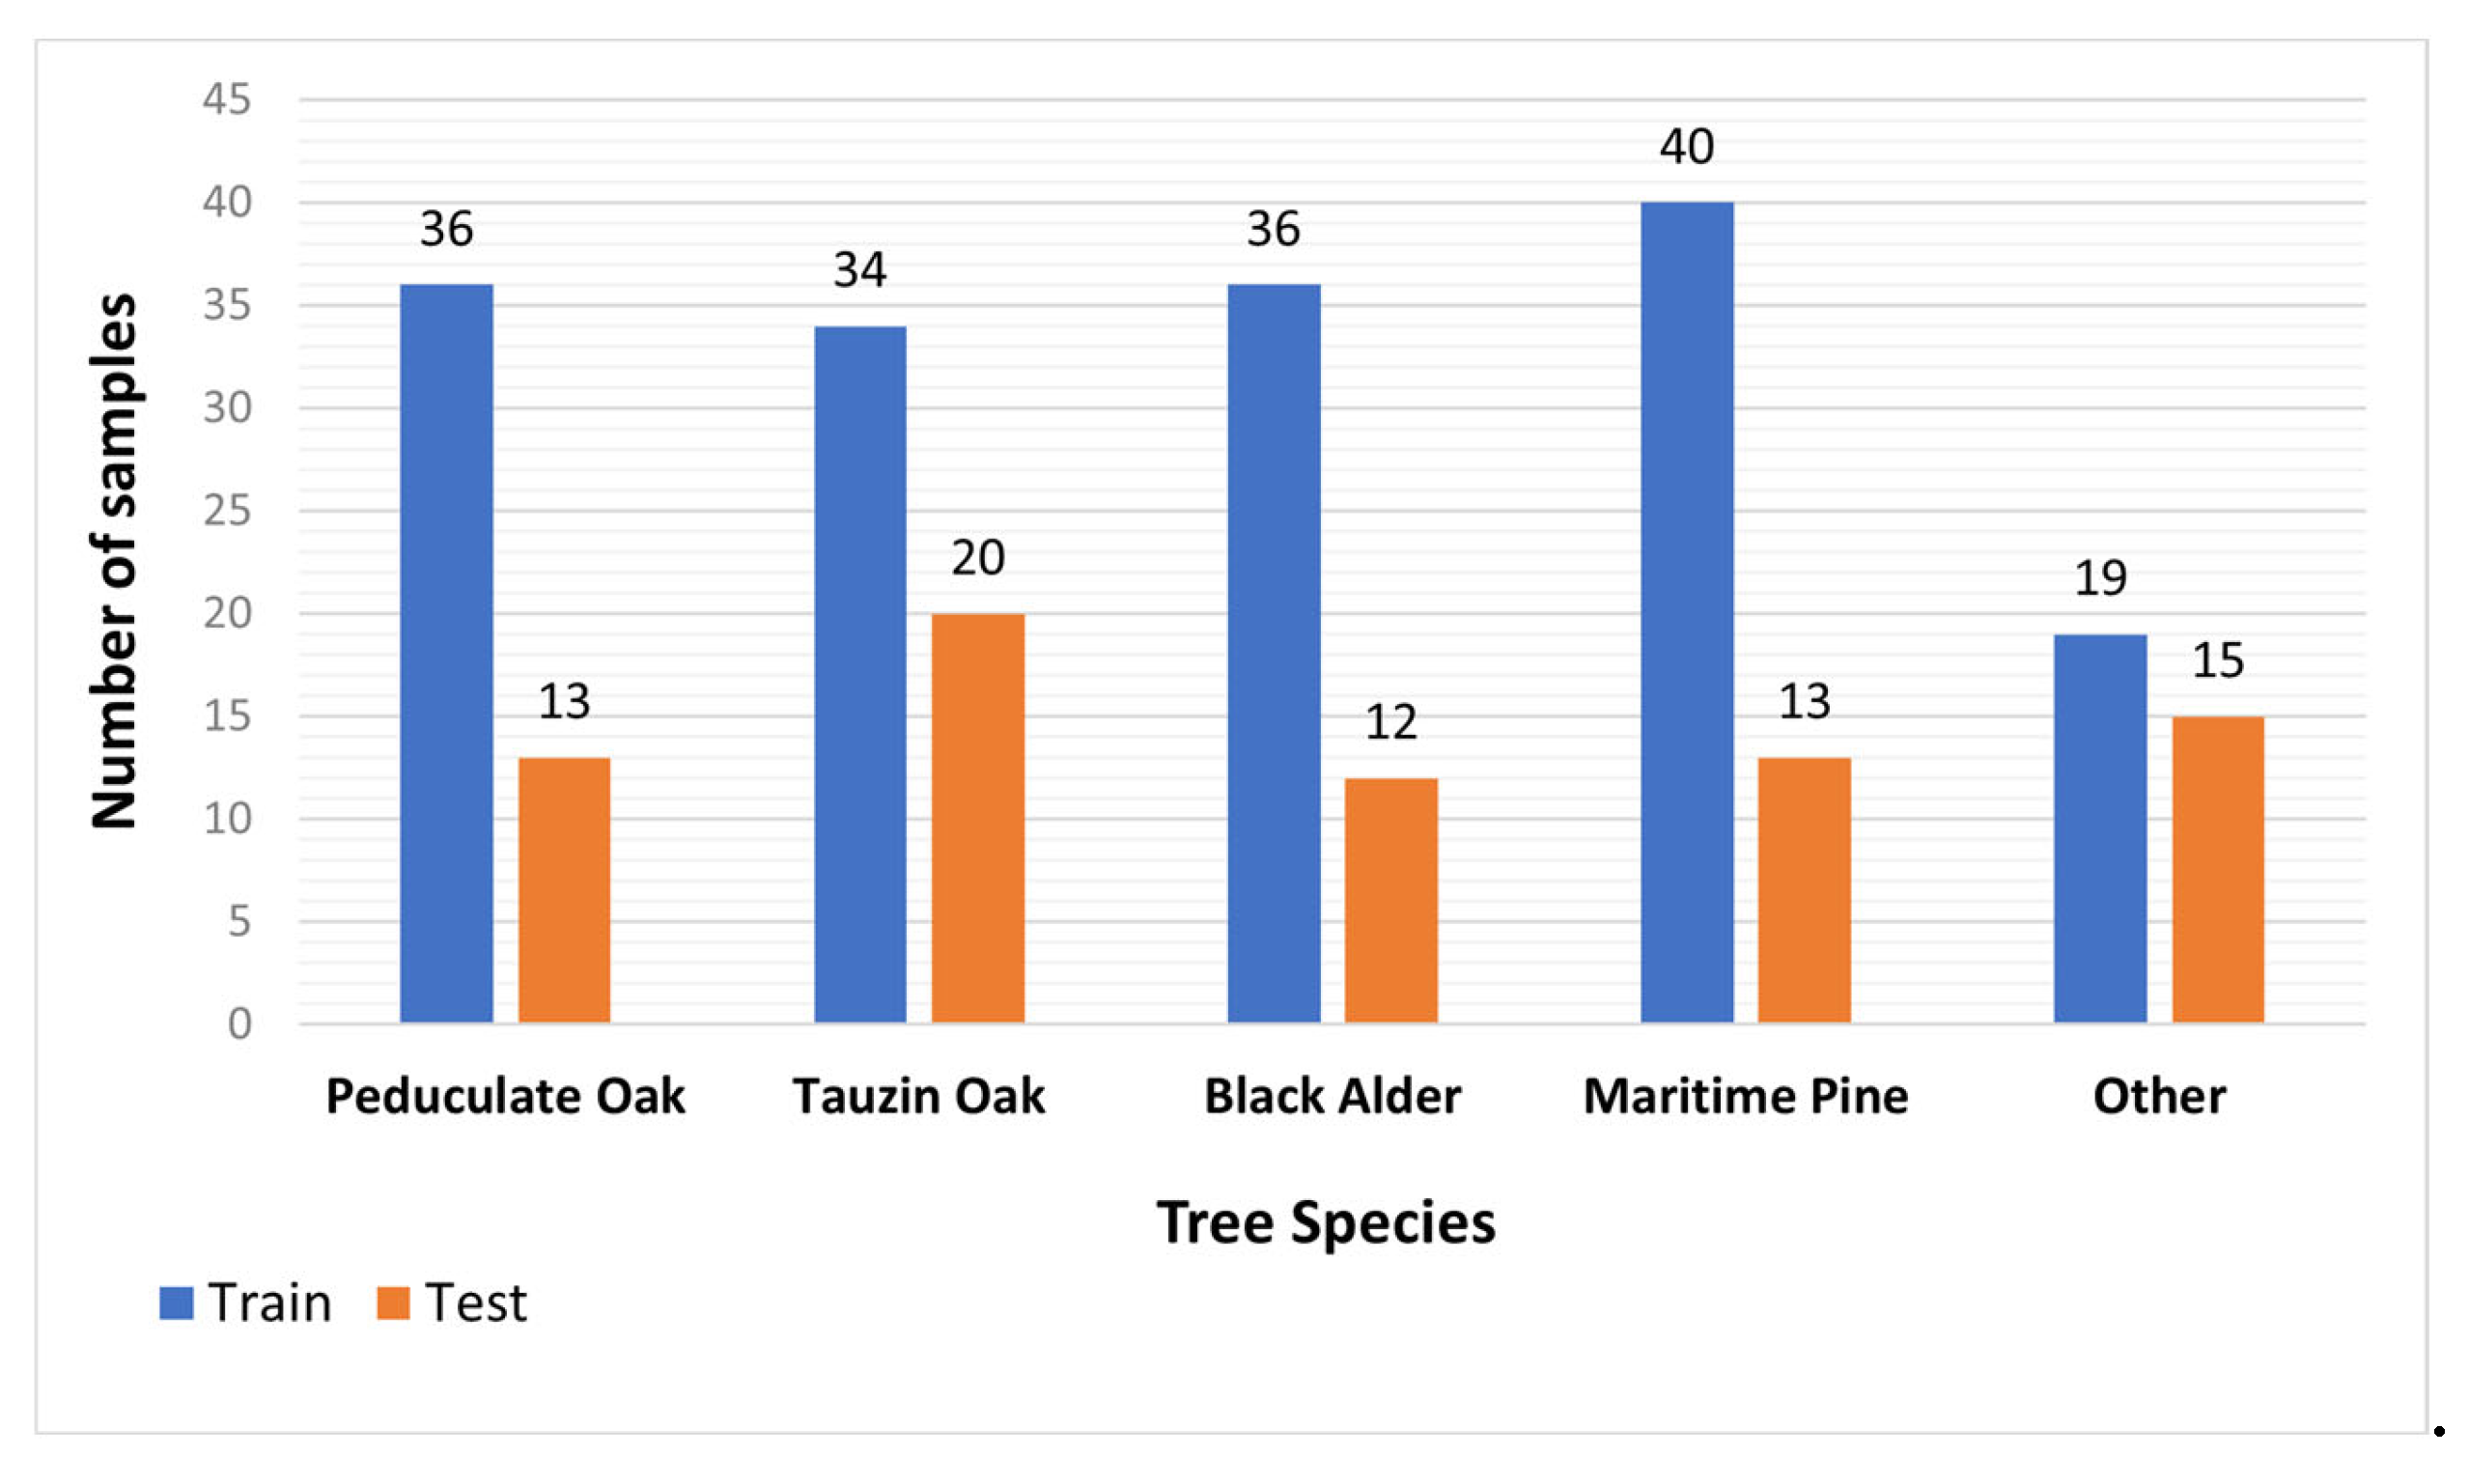
Figure 4.
Image and LiDAR data co-registration.
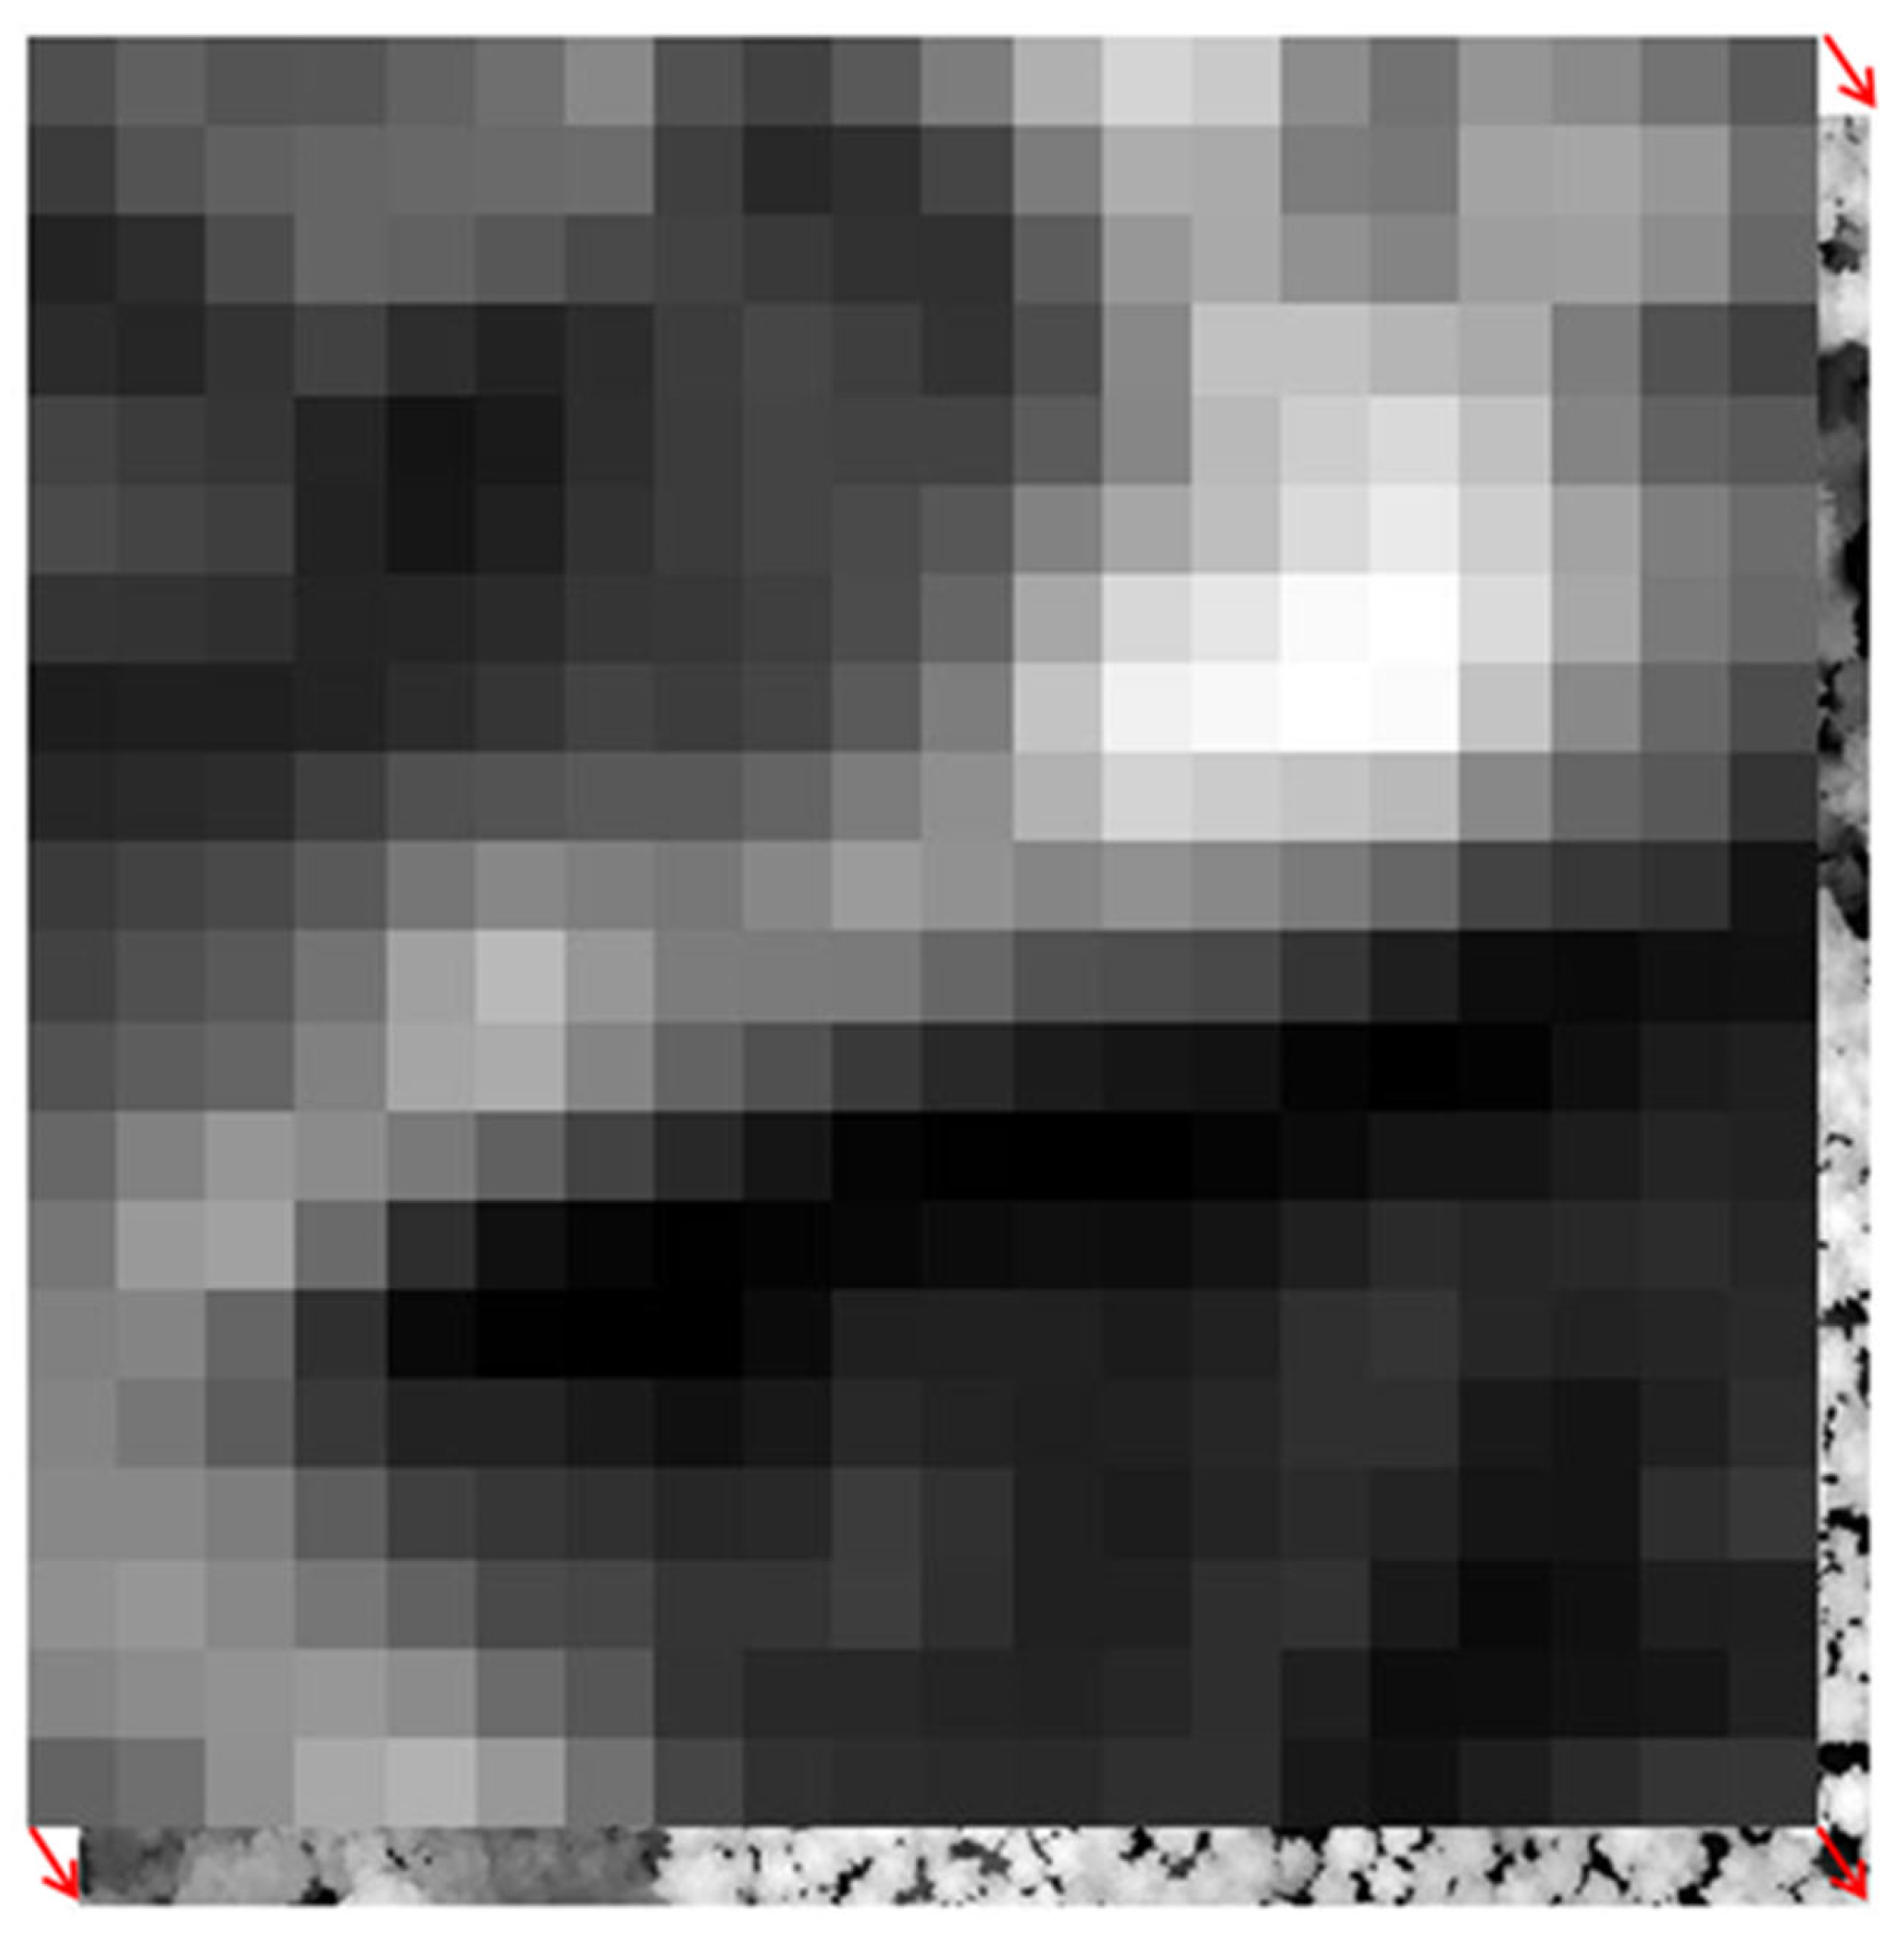
Figure 5.
Digital elevation models of site1: (a) Digital Surface Model (DSM); (b) Digital Terrain Model (DTM); (c) Canopy Height Model (CHM) at a resolution of 0.25 m.
Figure 5.
Digital elevation models of site1: (a) Digital Surface Model (DSM); (b) Digital Terrain Model (DTM); (c) Canopy Height Model (CHM) at a resolution of 0.25 m.
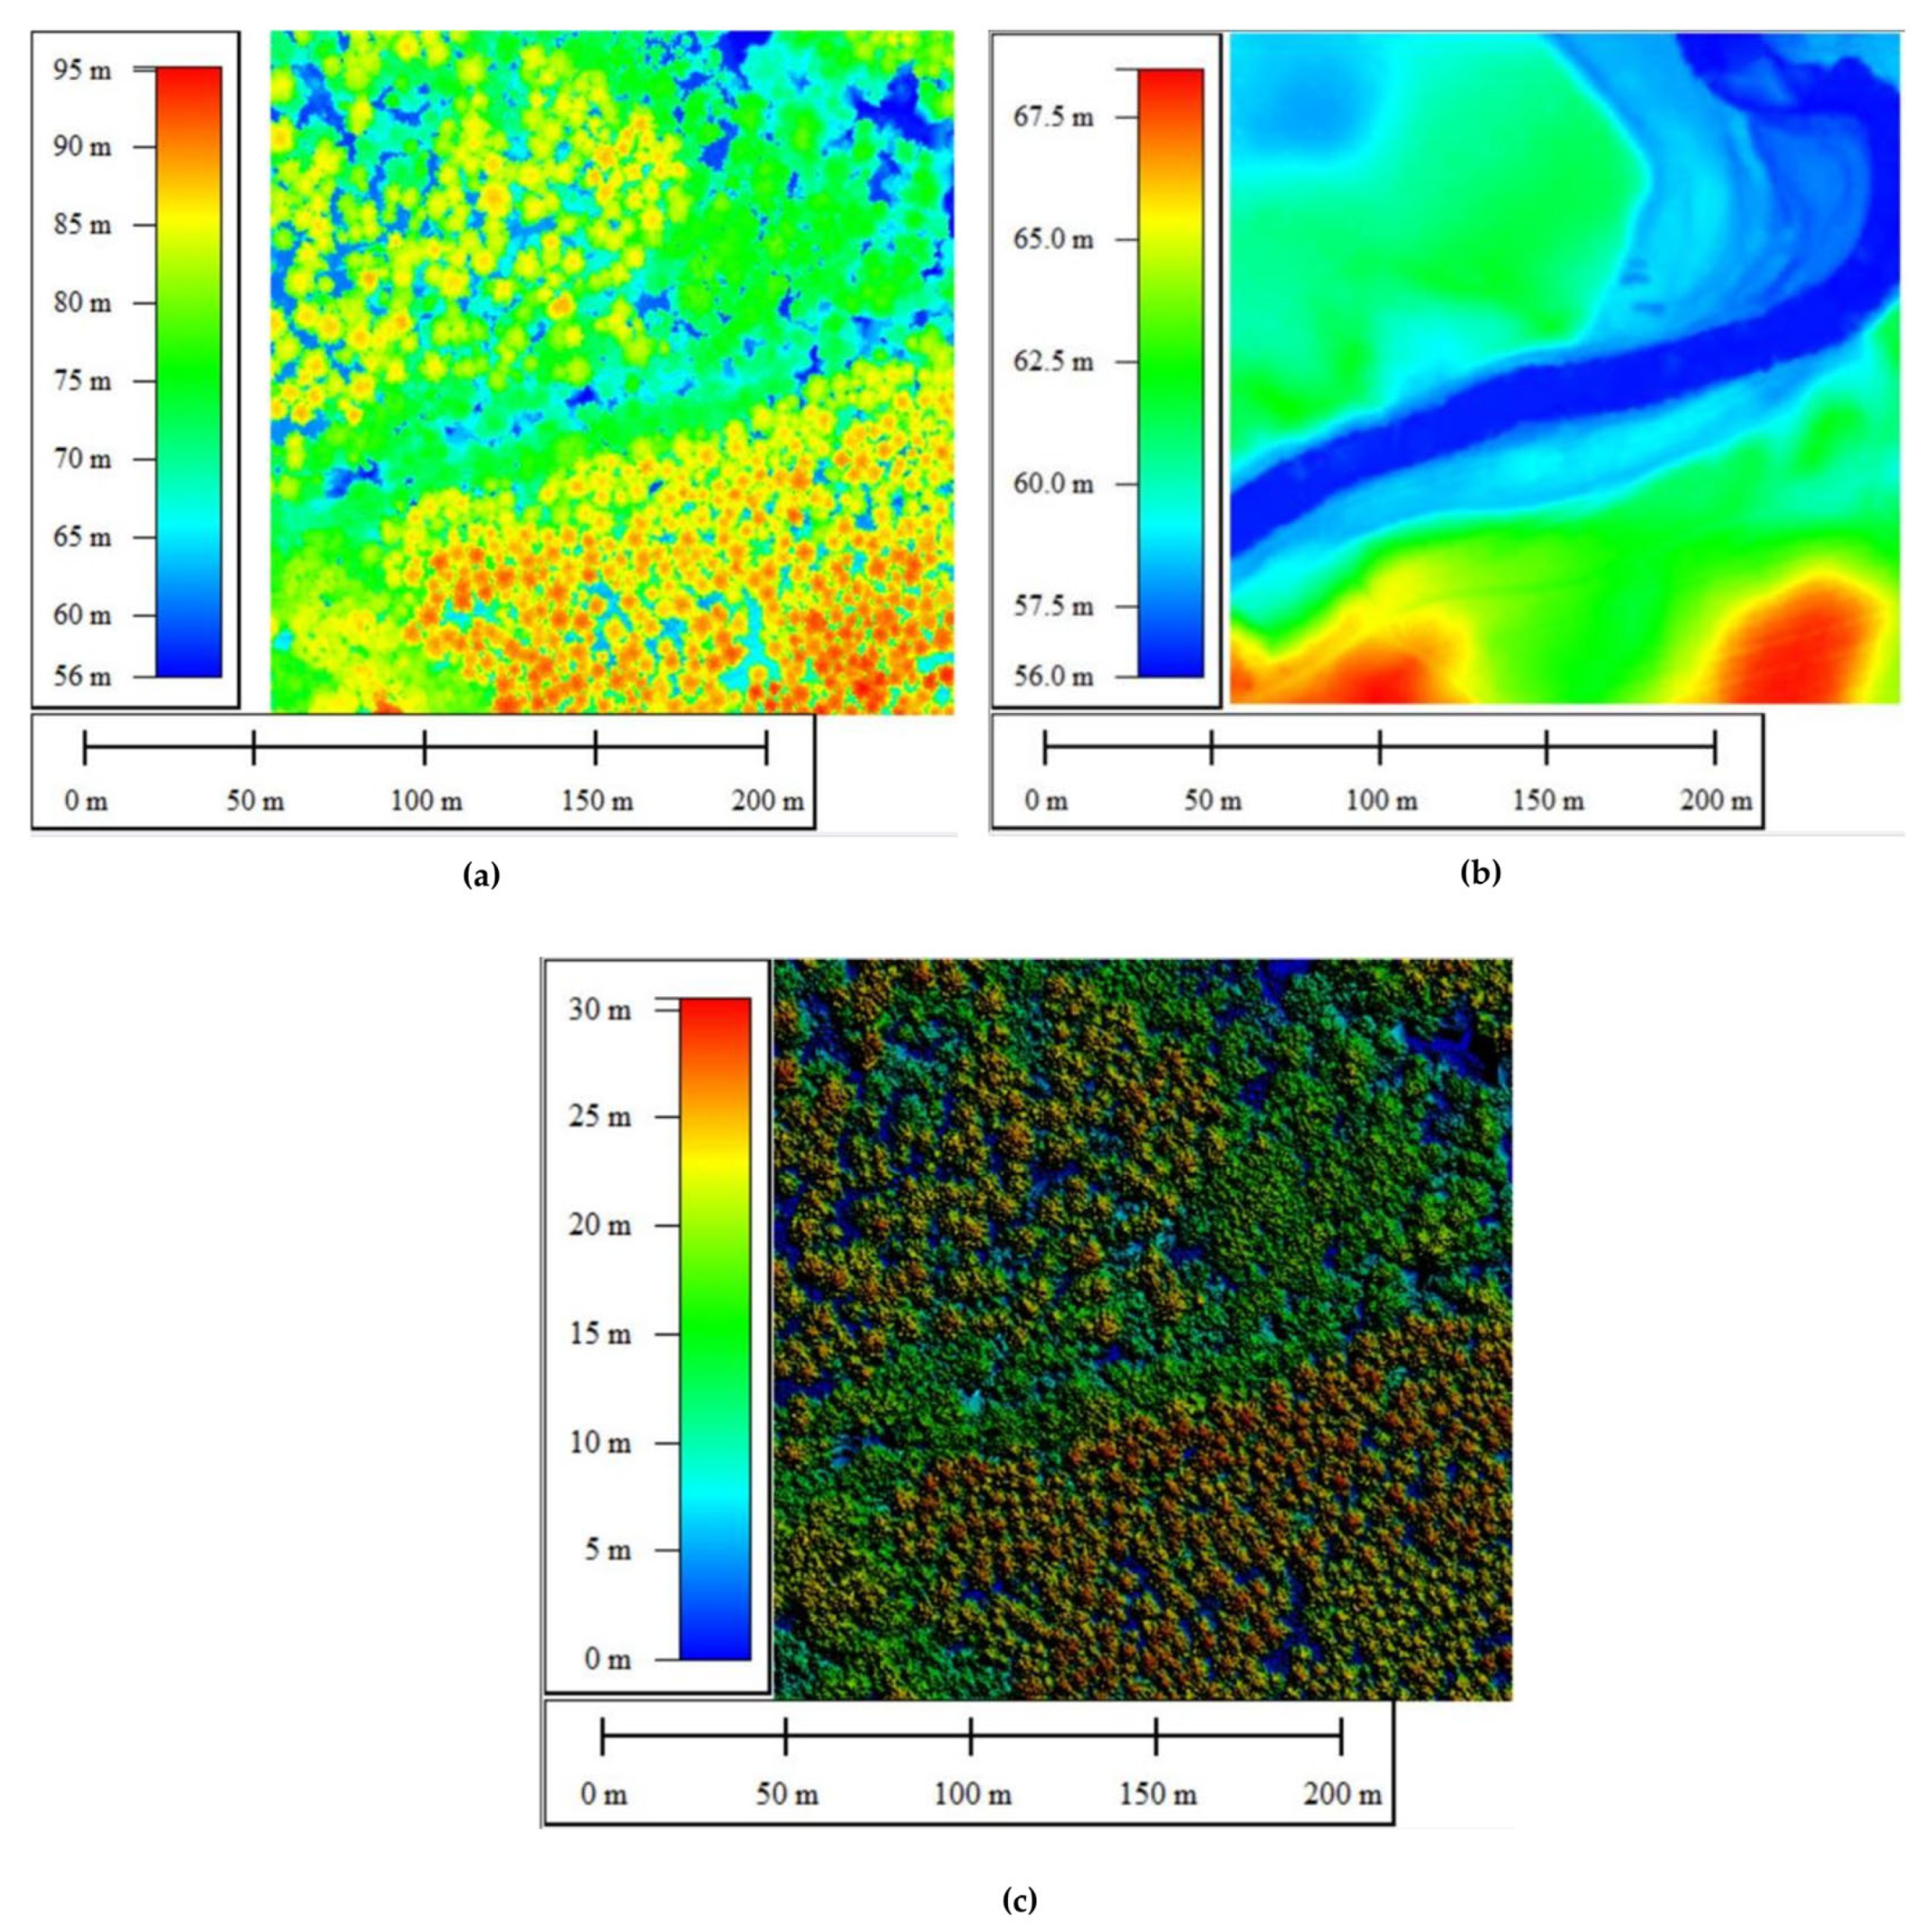
Figure 9.
2D Individual tree crowns delineation map of site 1.
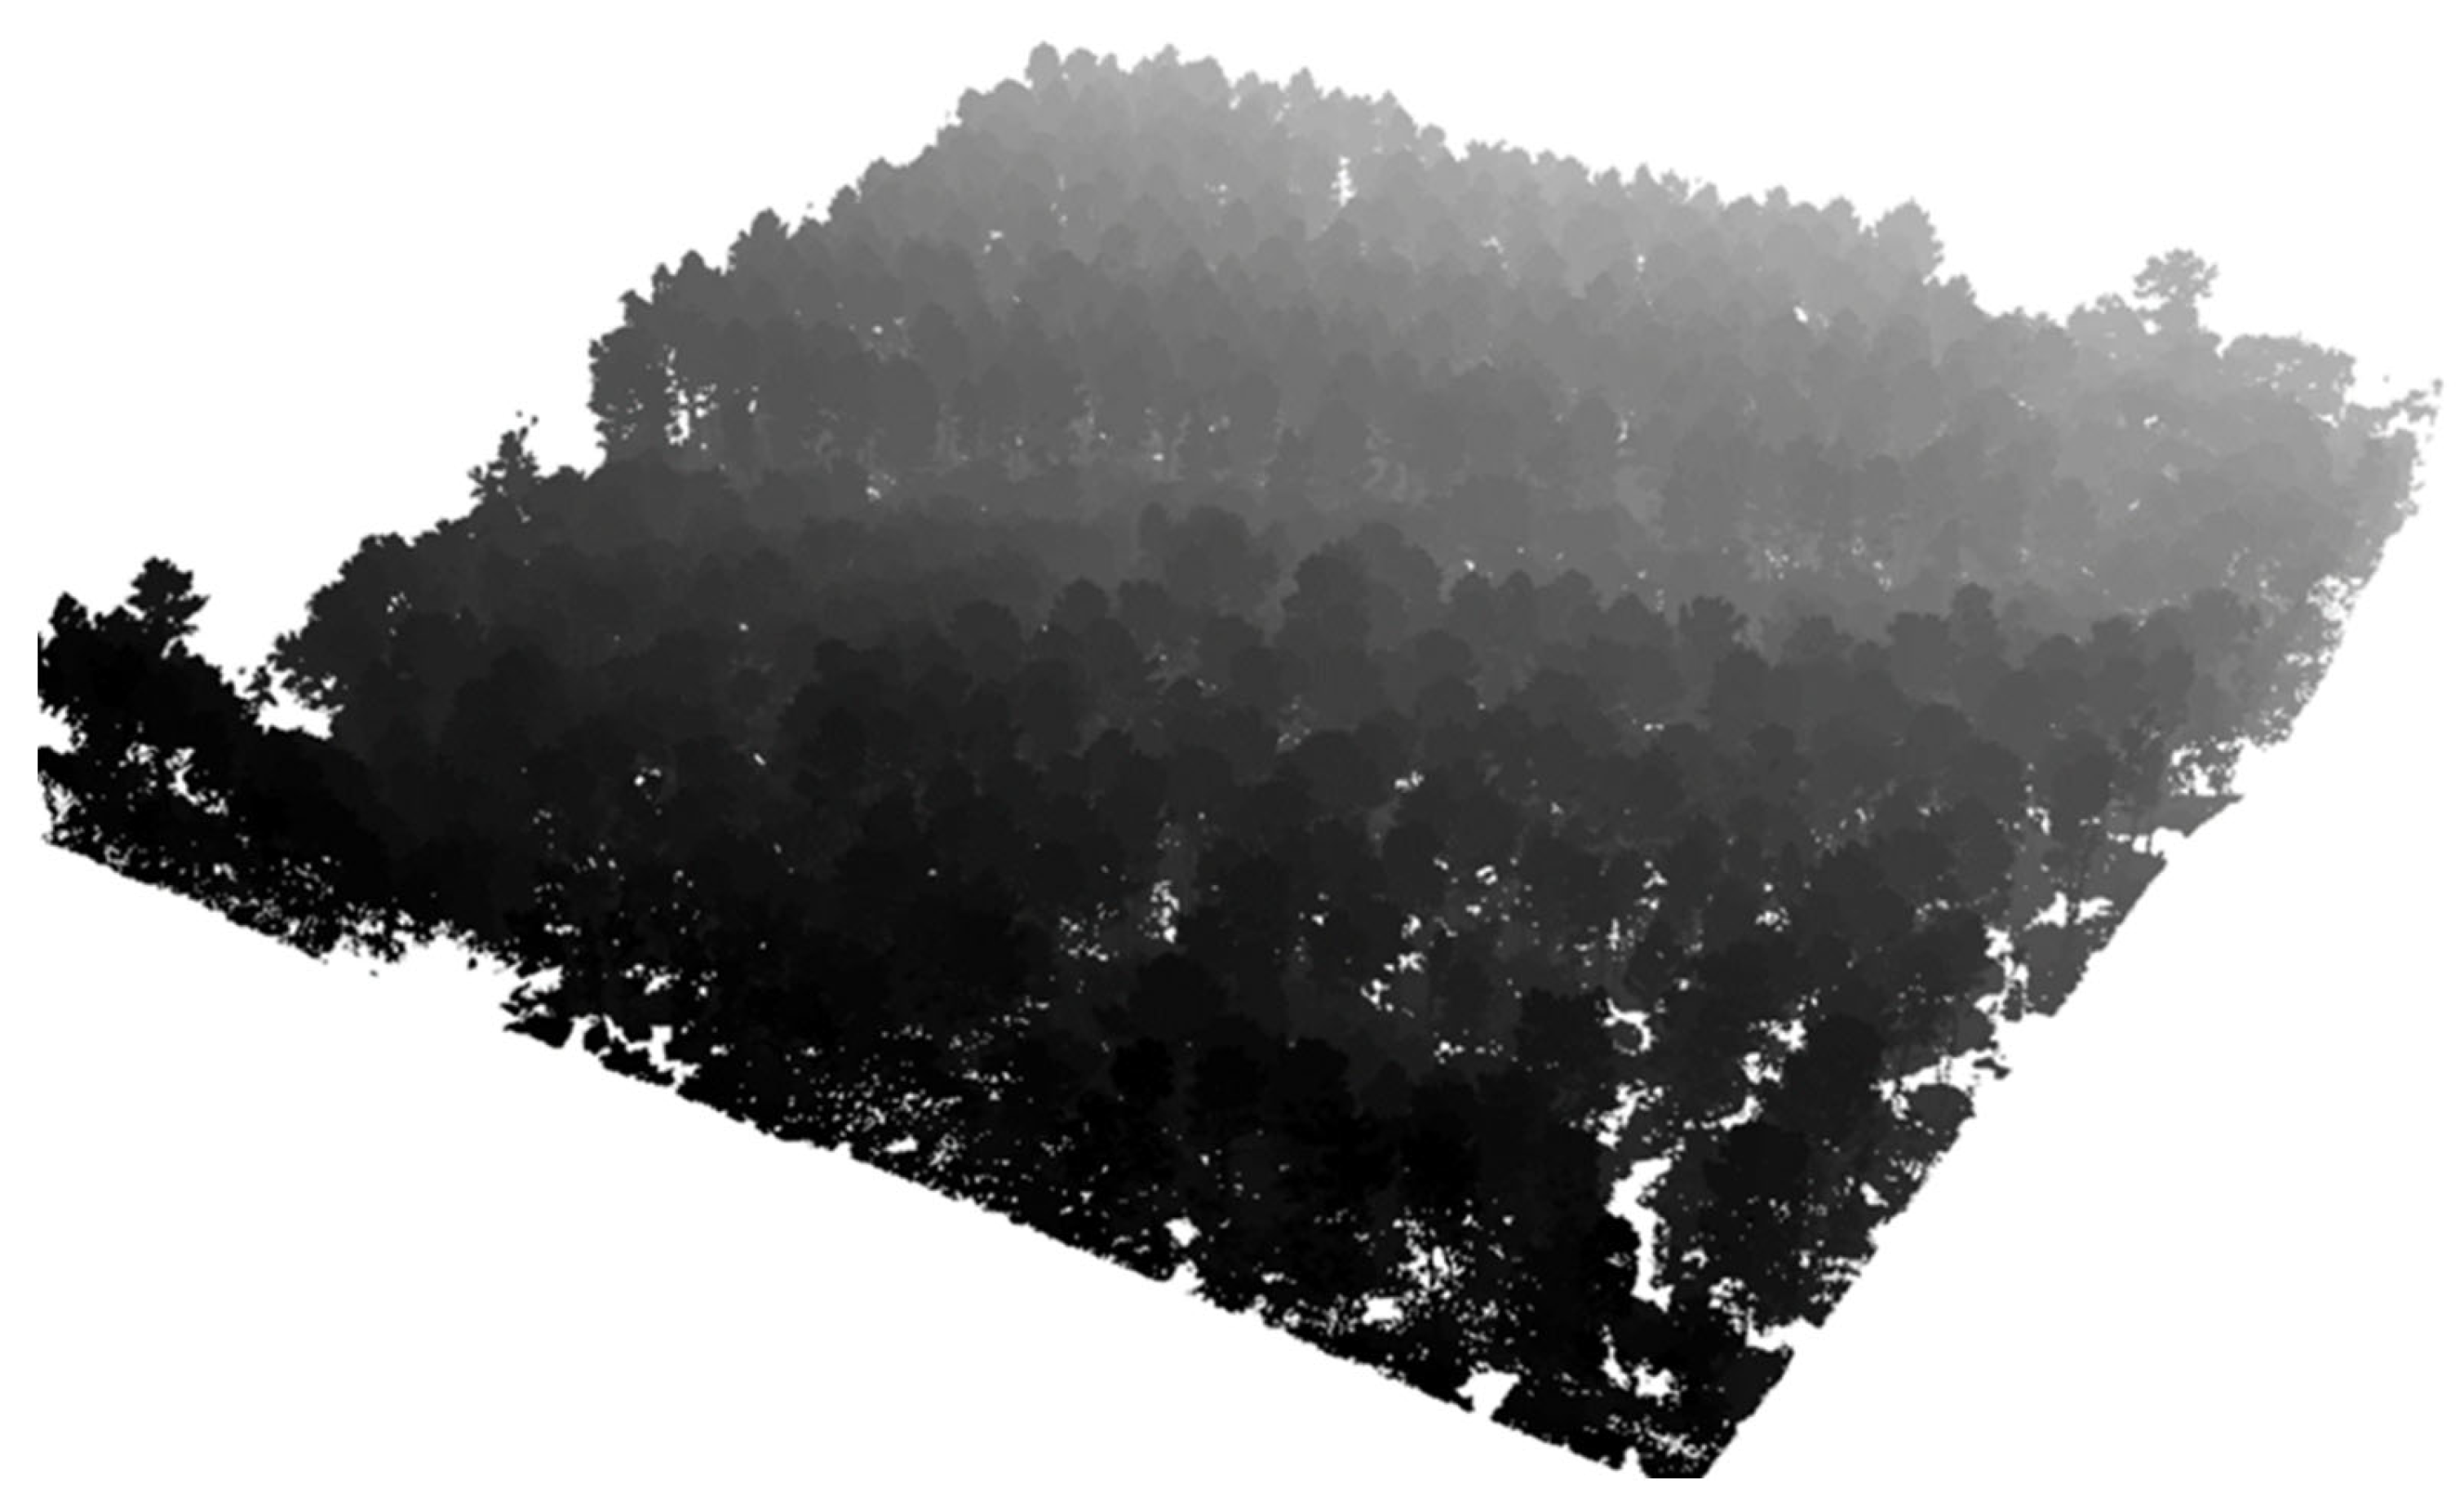
Figure 10.
3D Individual tree crowns delineation of site 1.
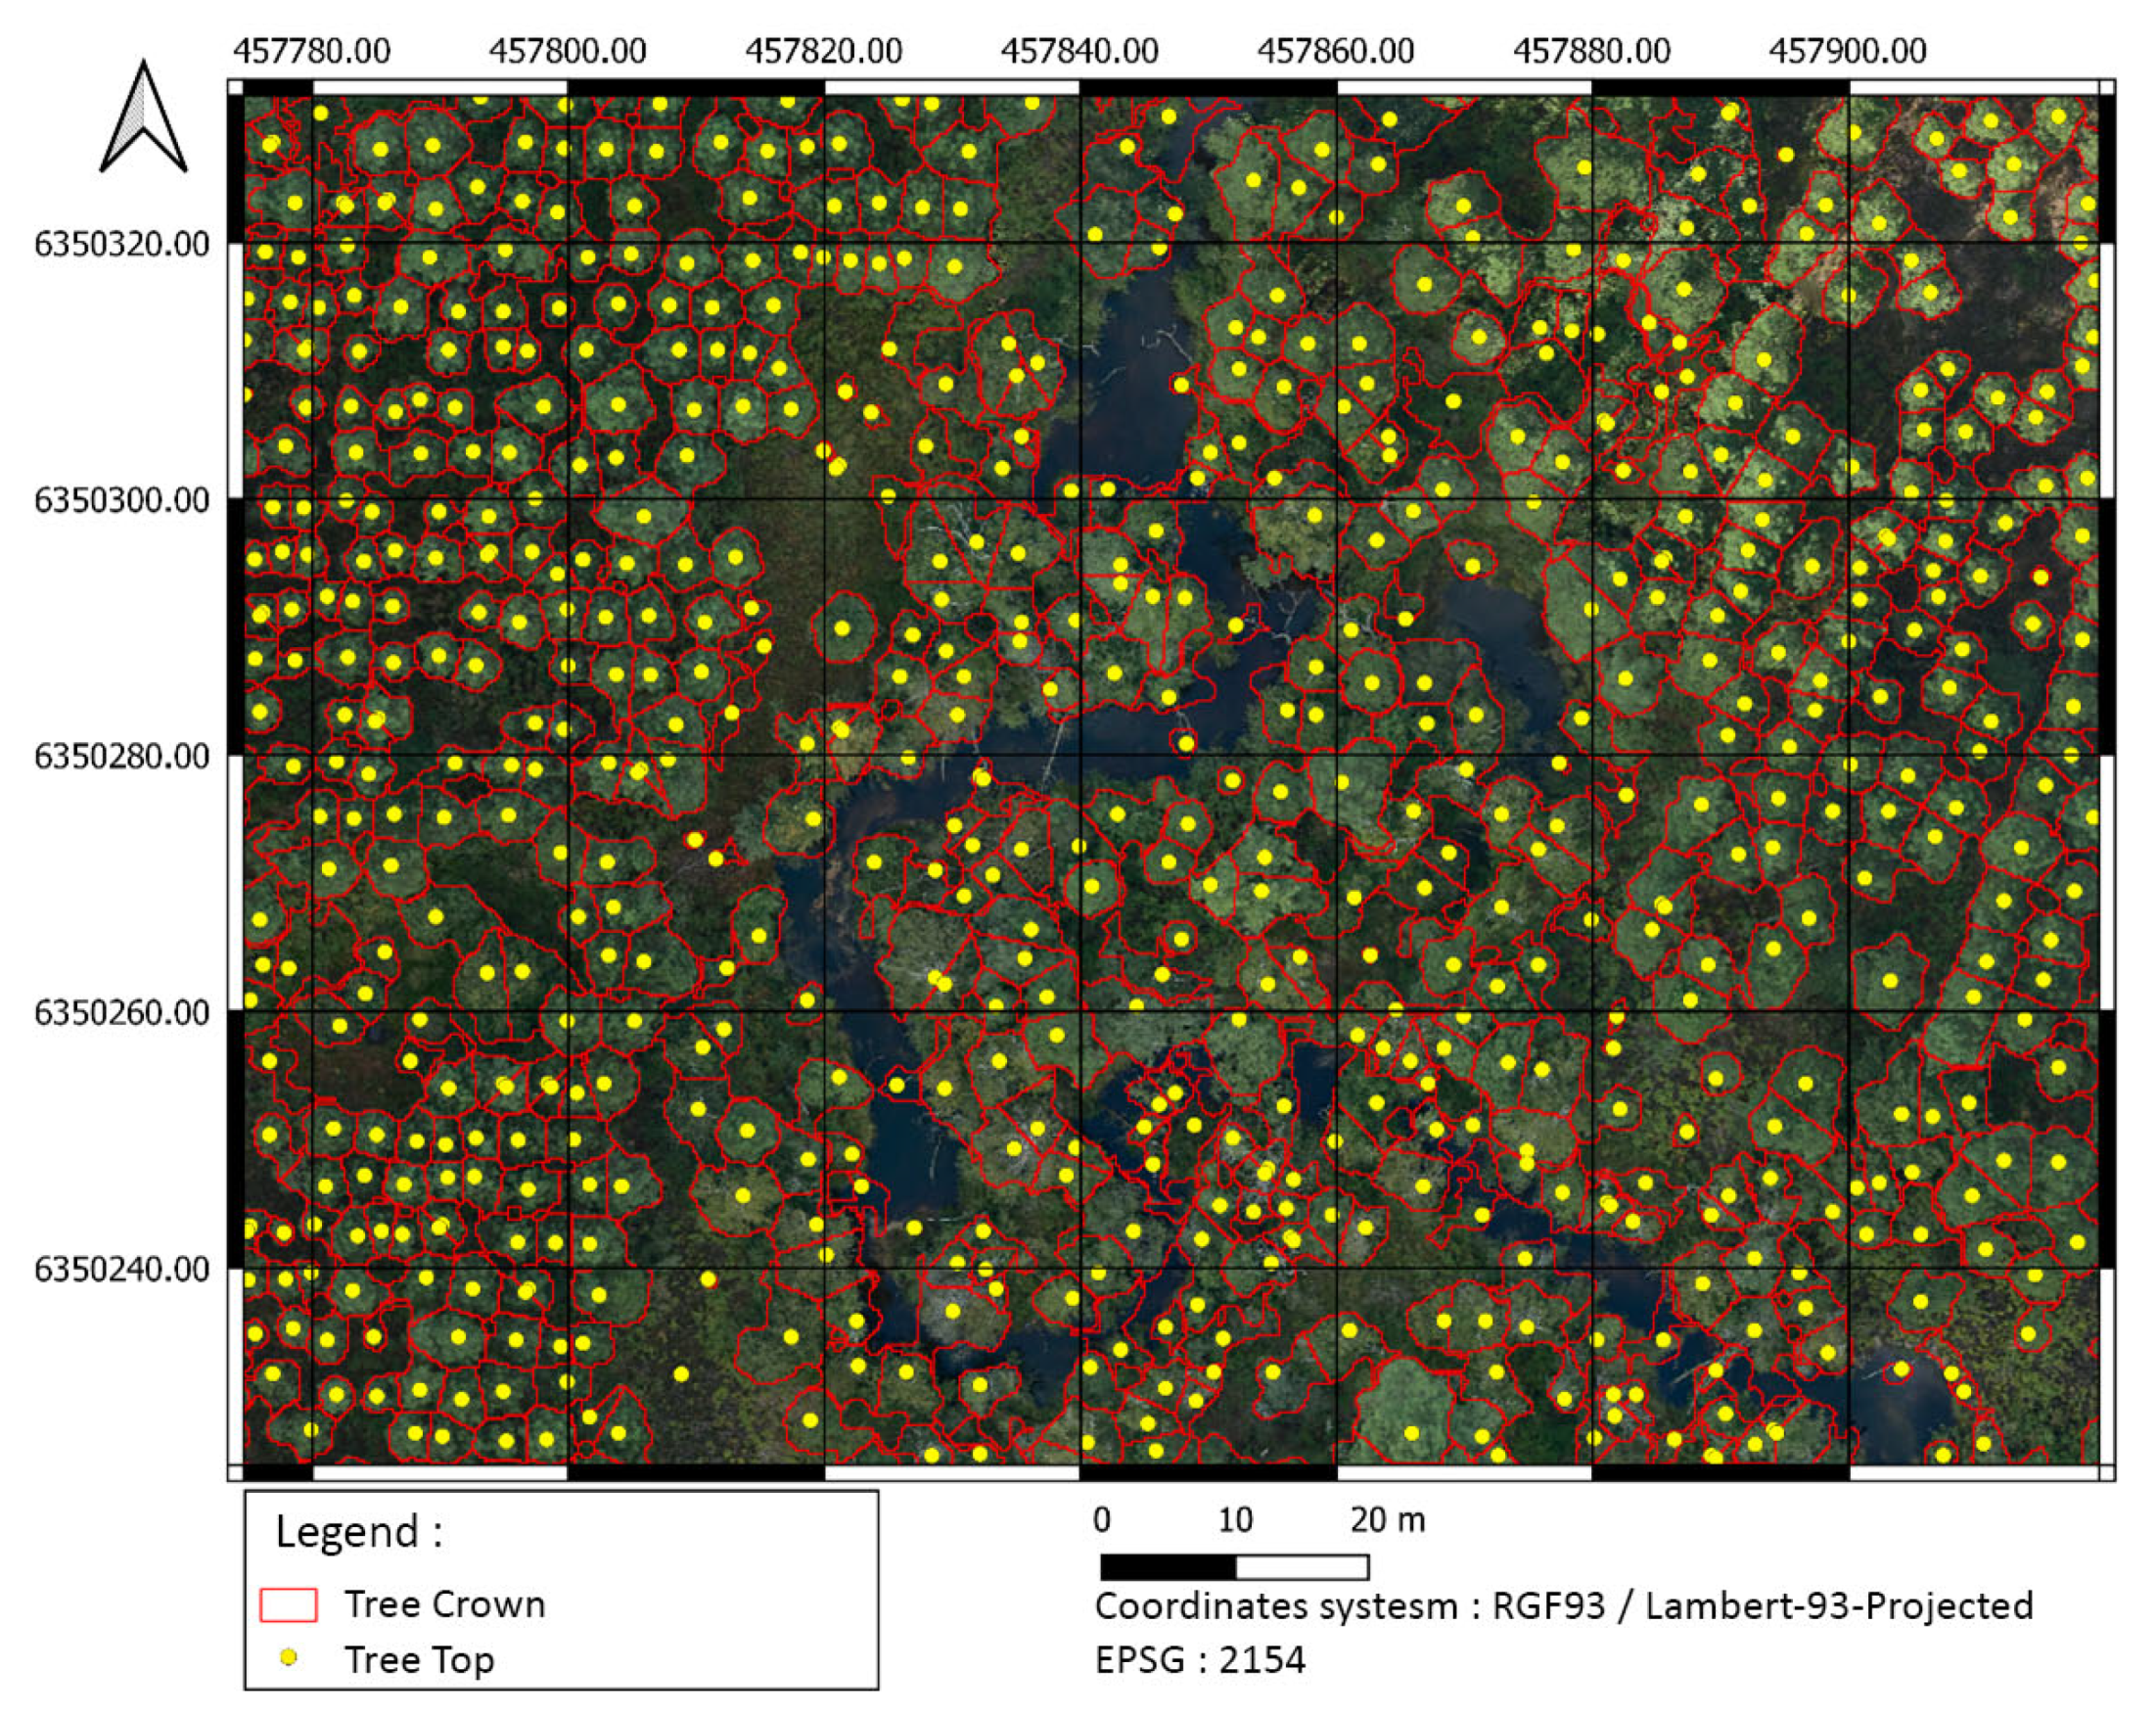
Figure 11.
Site 1 forest species map.
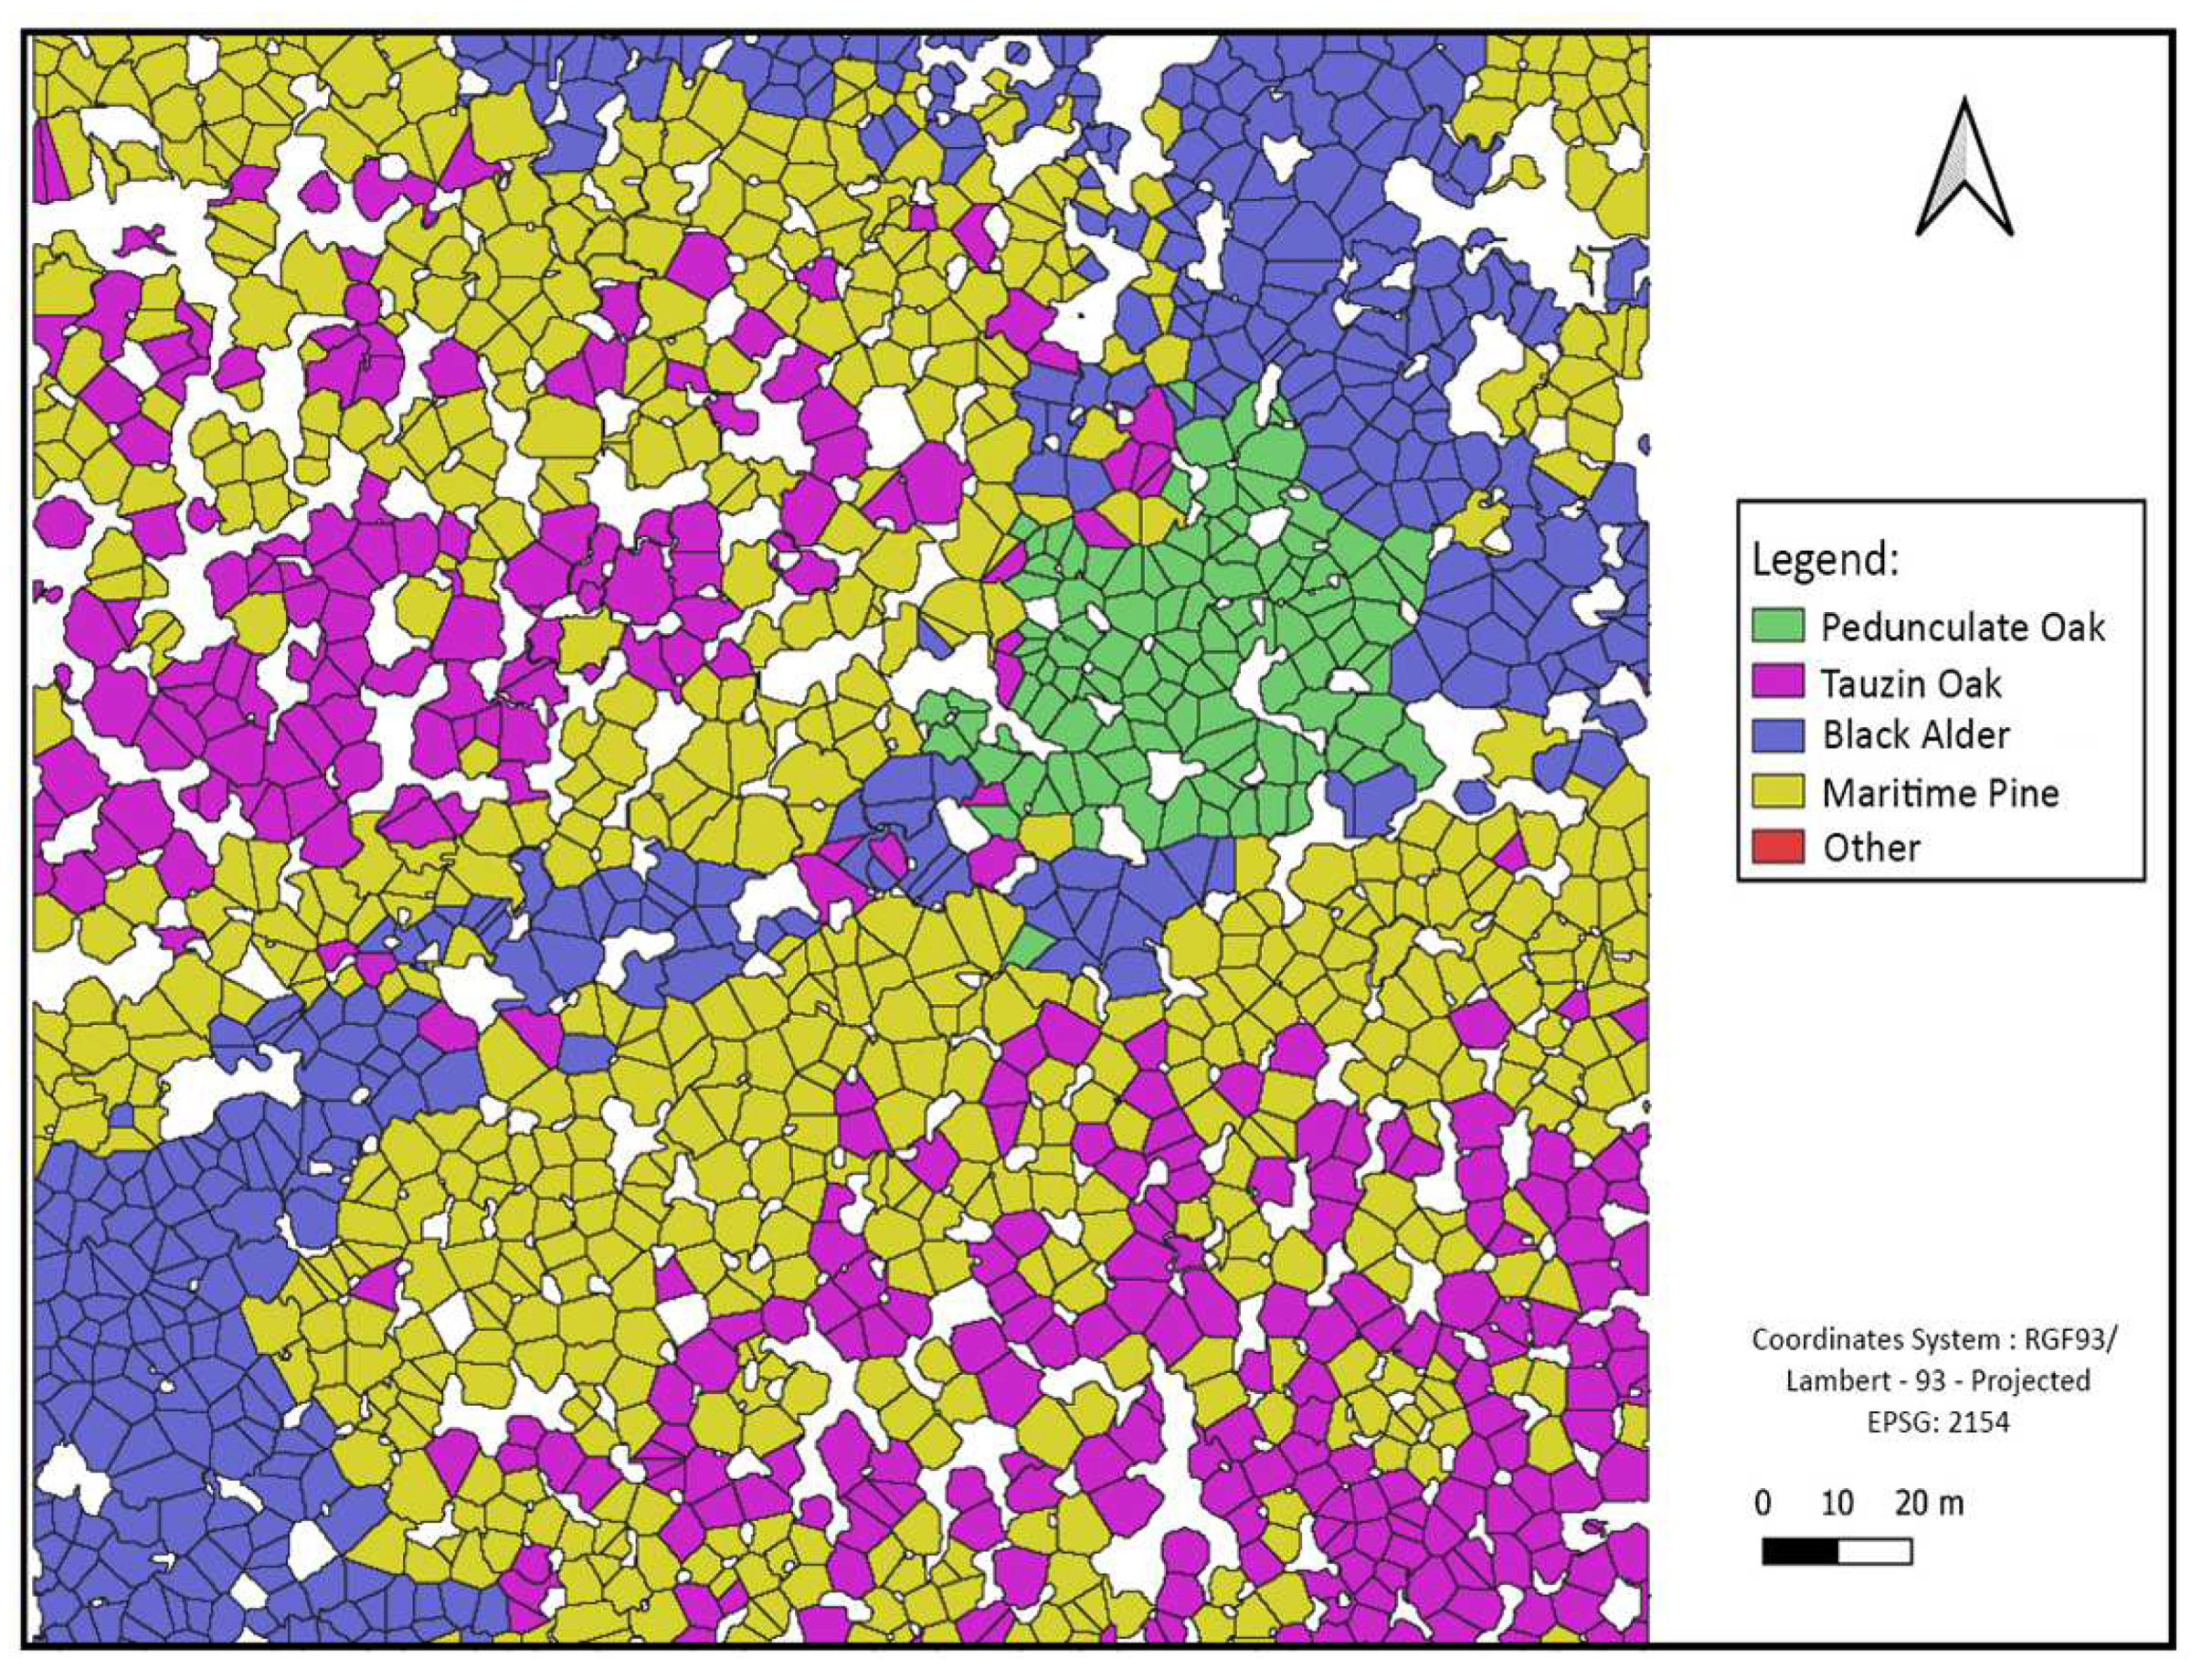
Figure 12.
Site 2 forest species map.
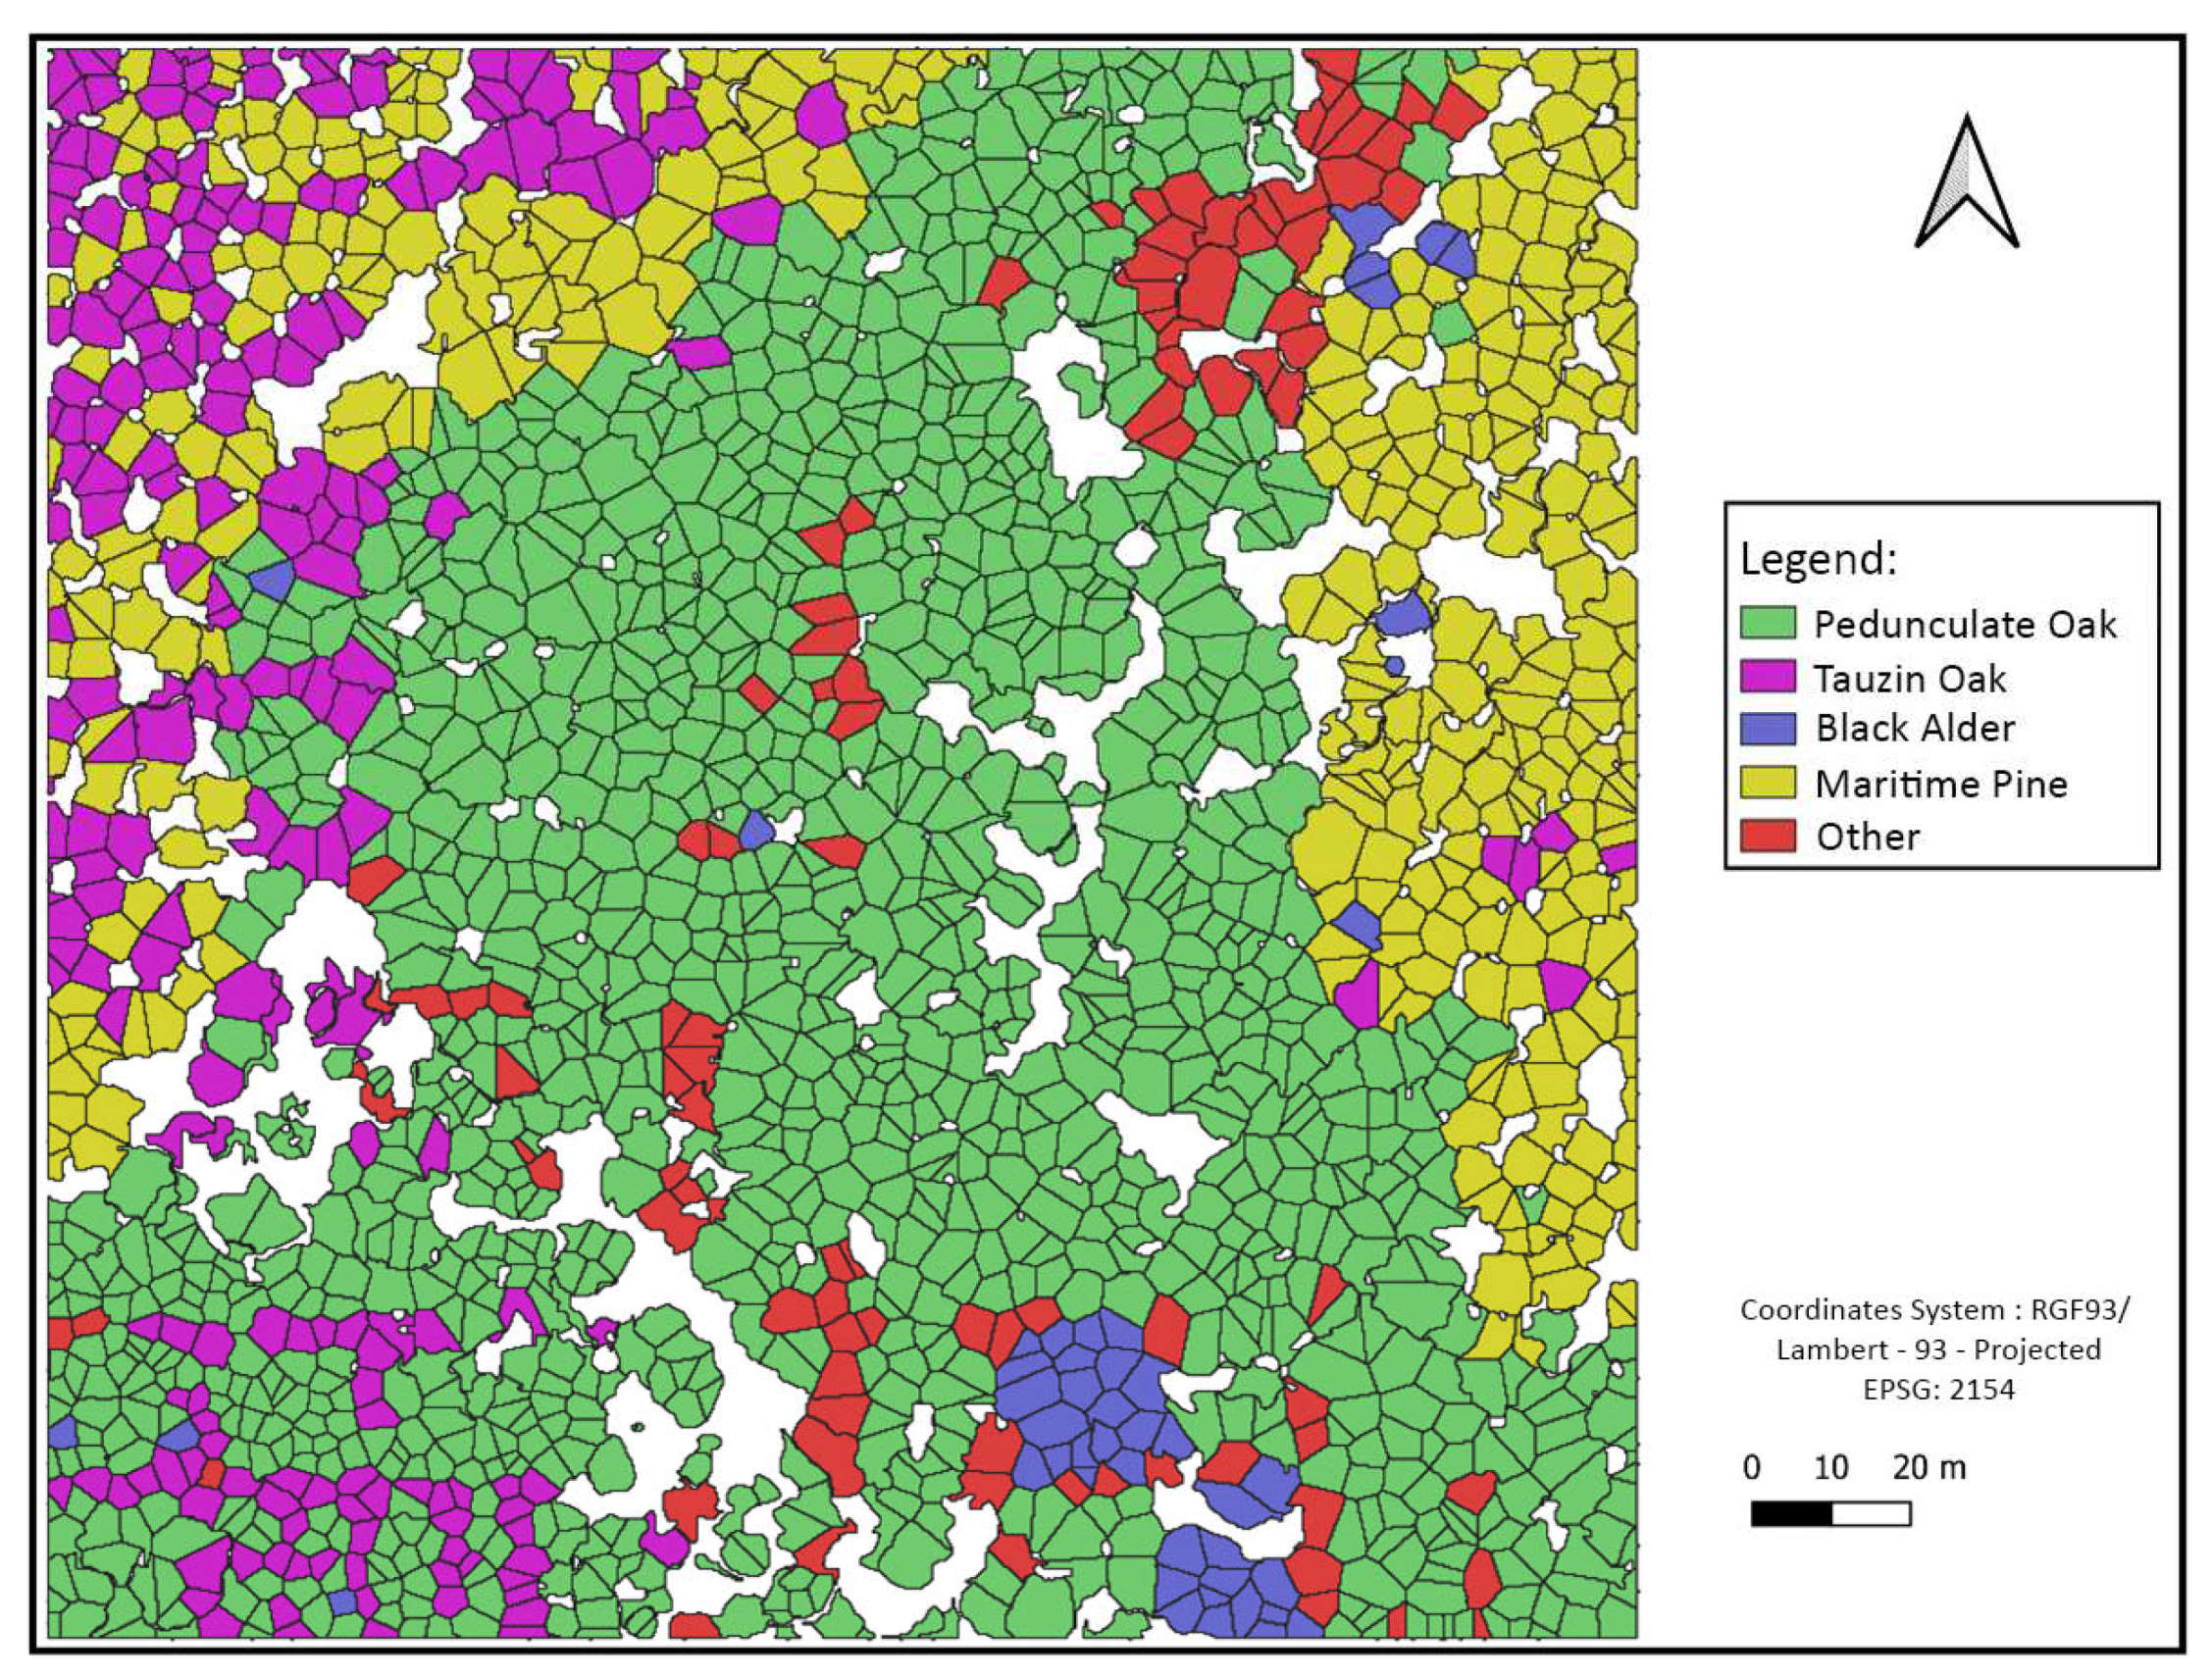
Figure 13.
Site 4 forest species map.
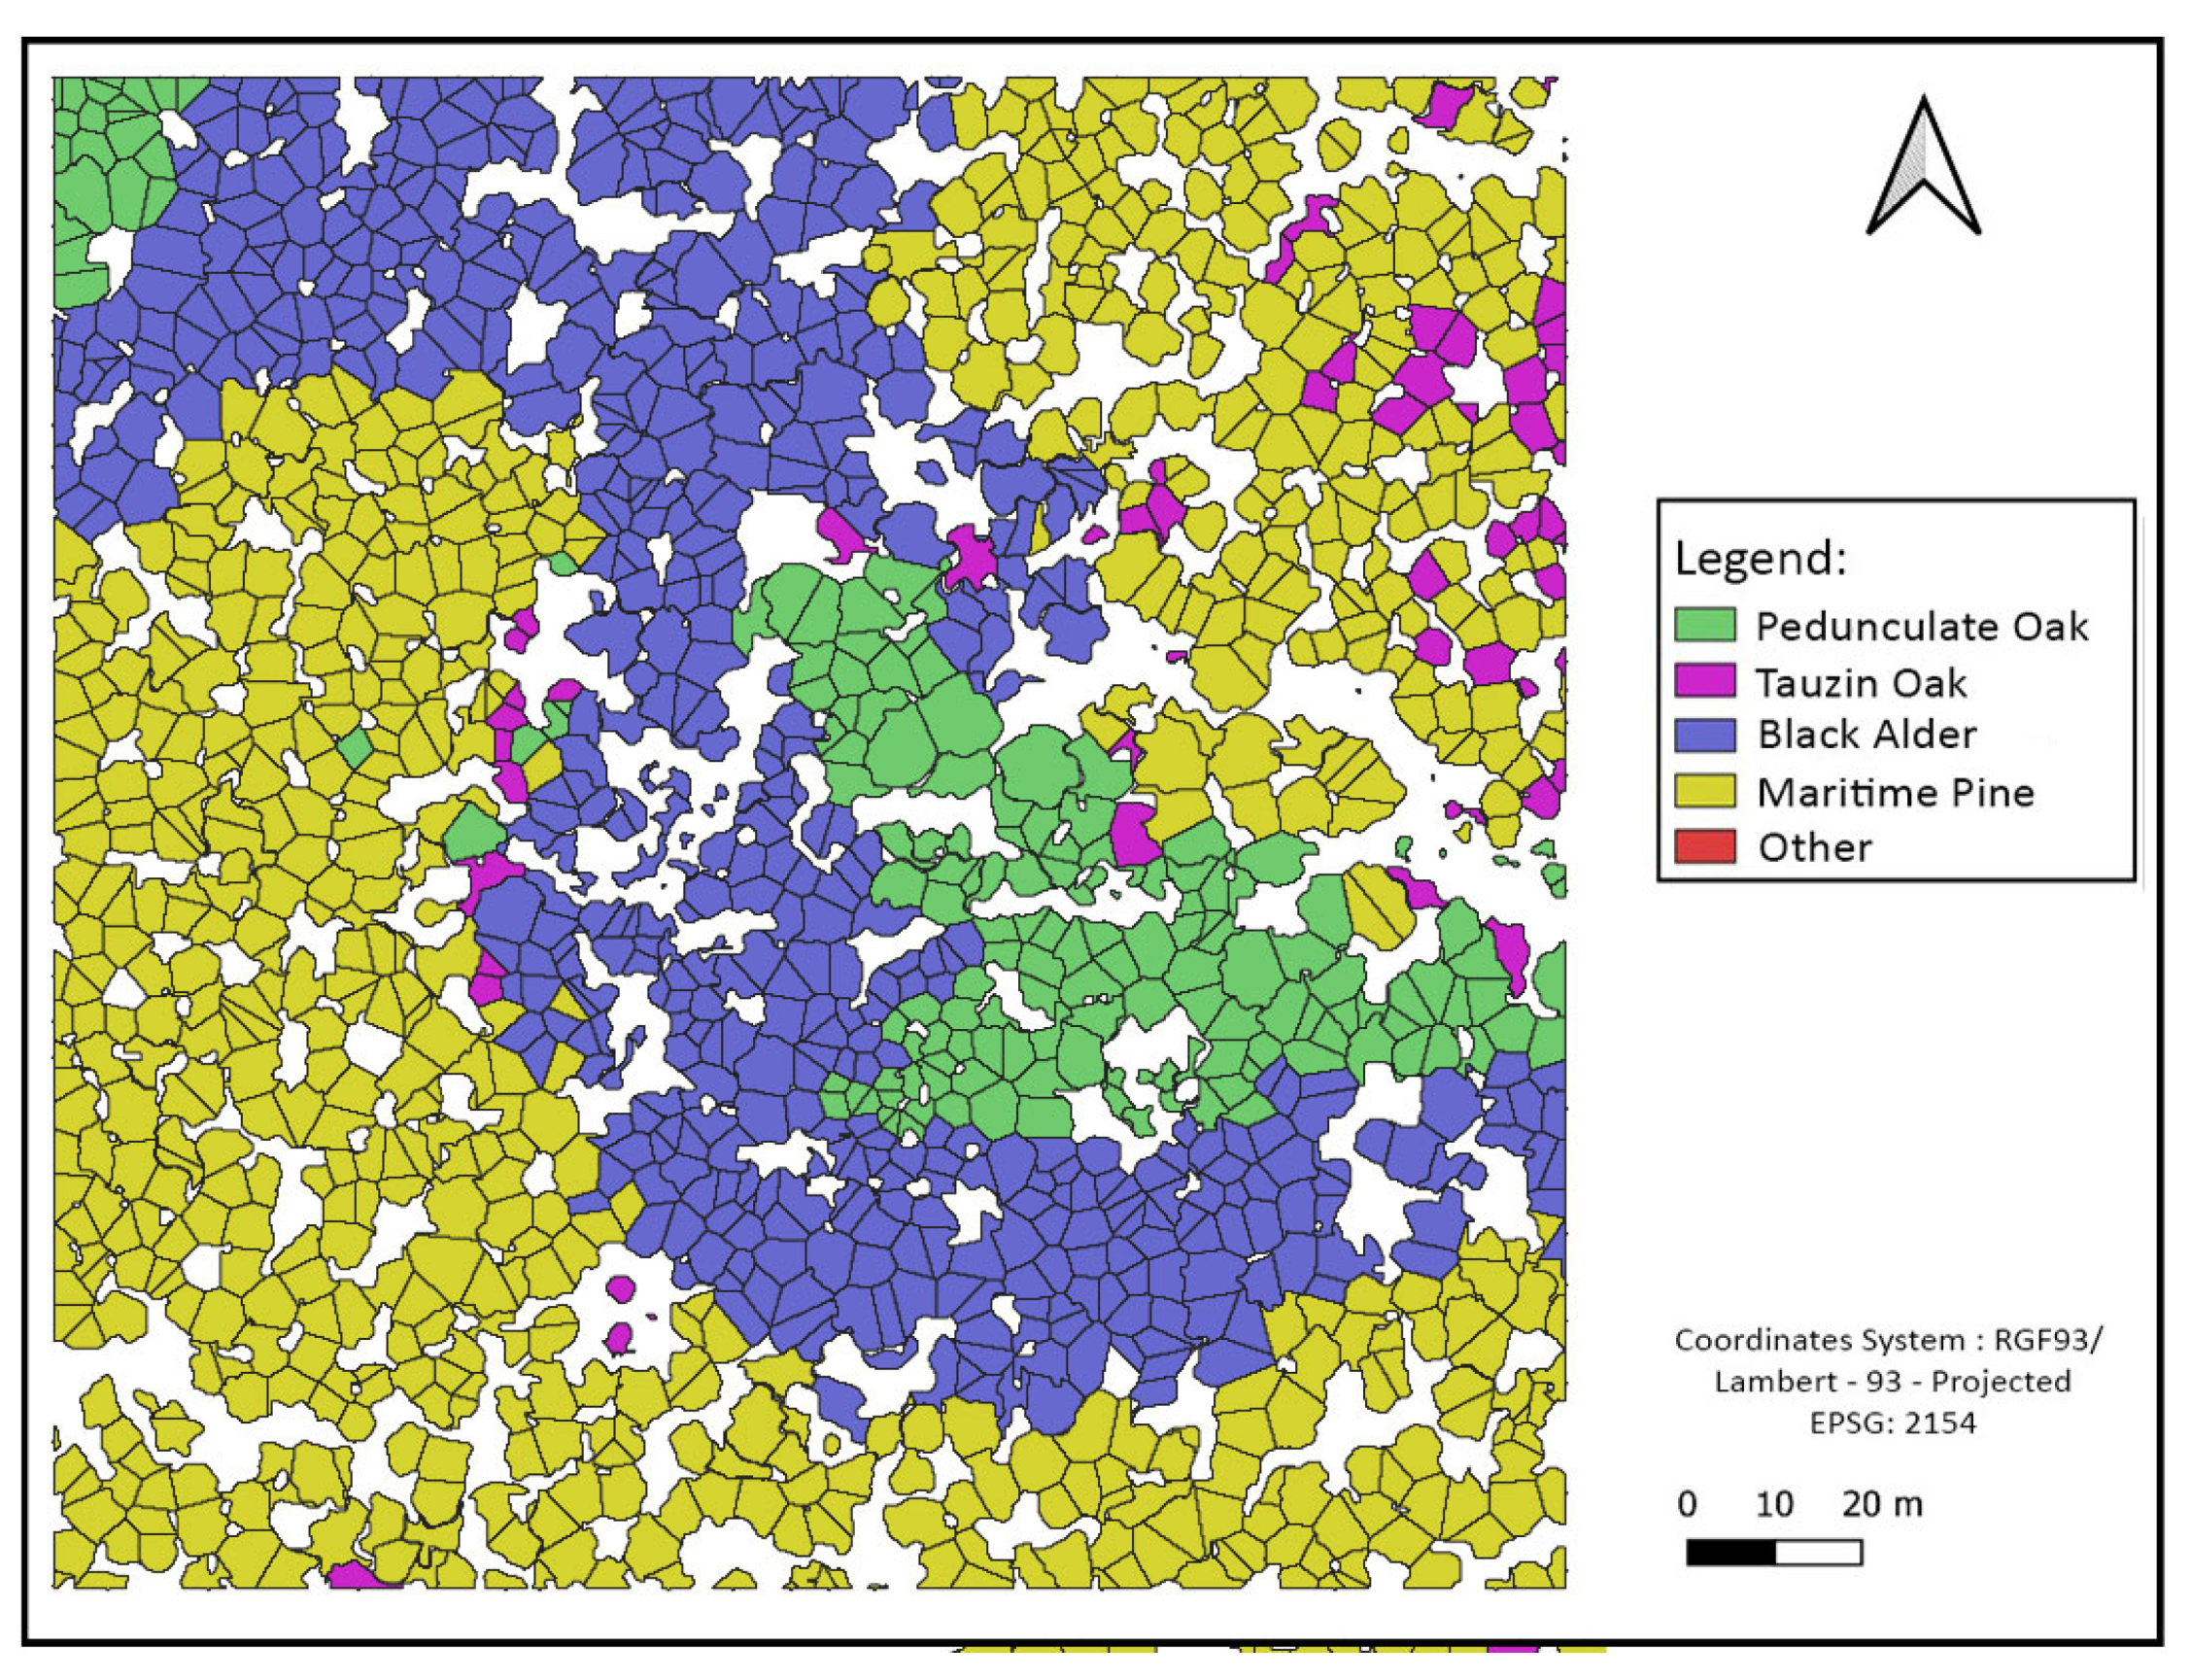
Figure 14.
Ground truth data spatial distribution compared to site1's extent.
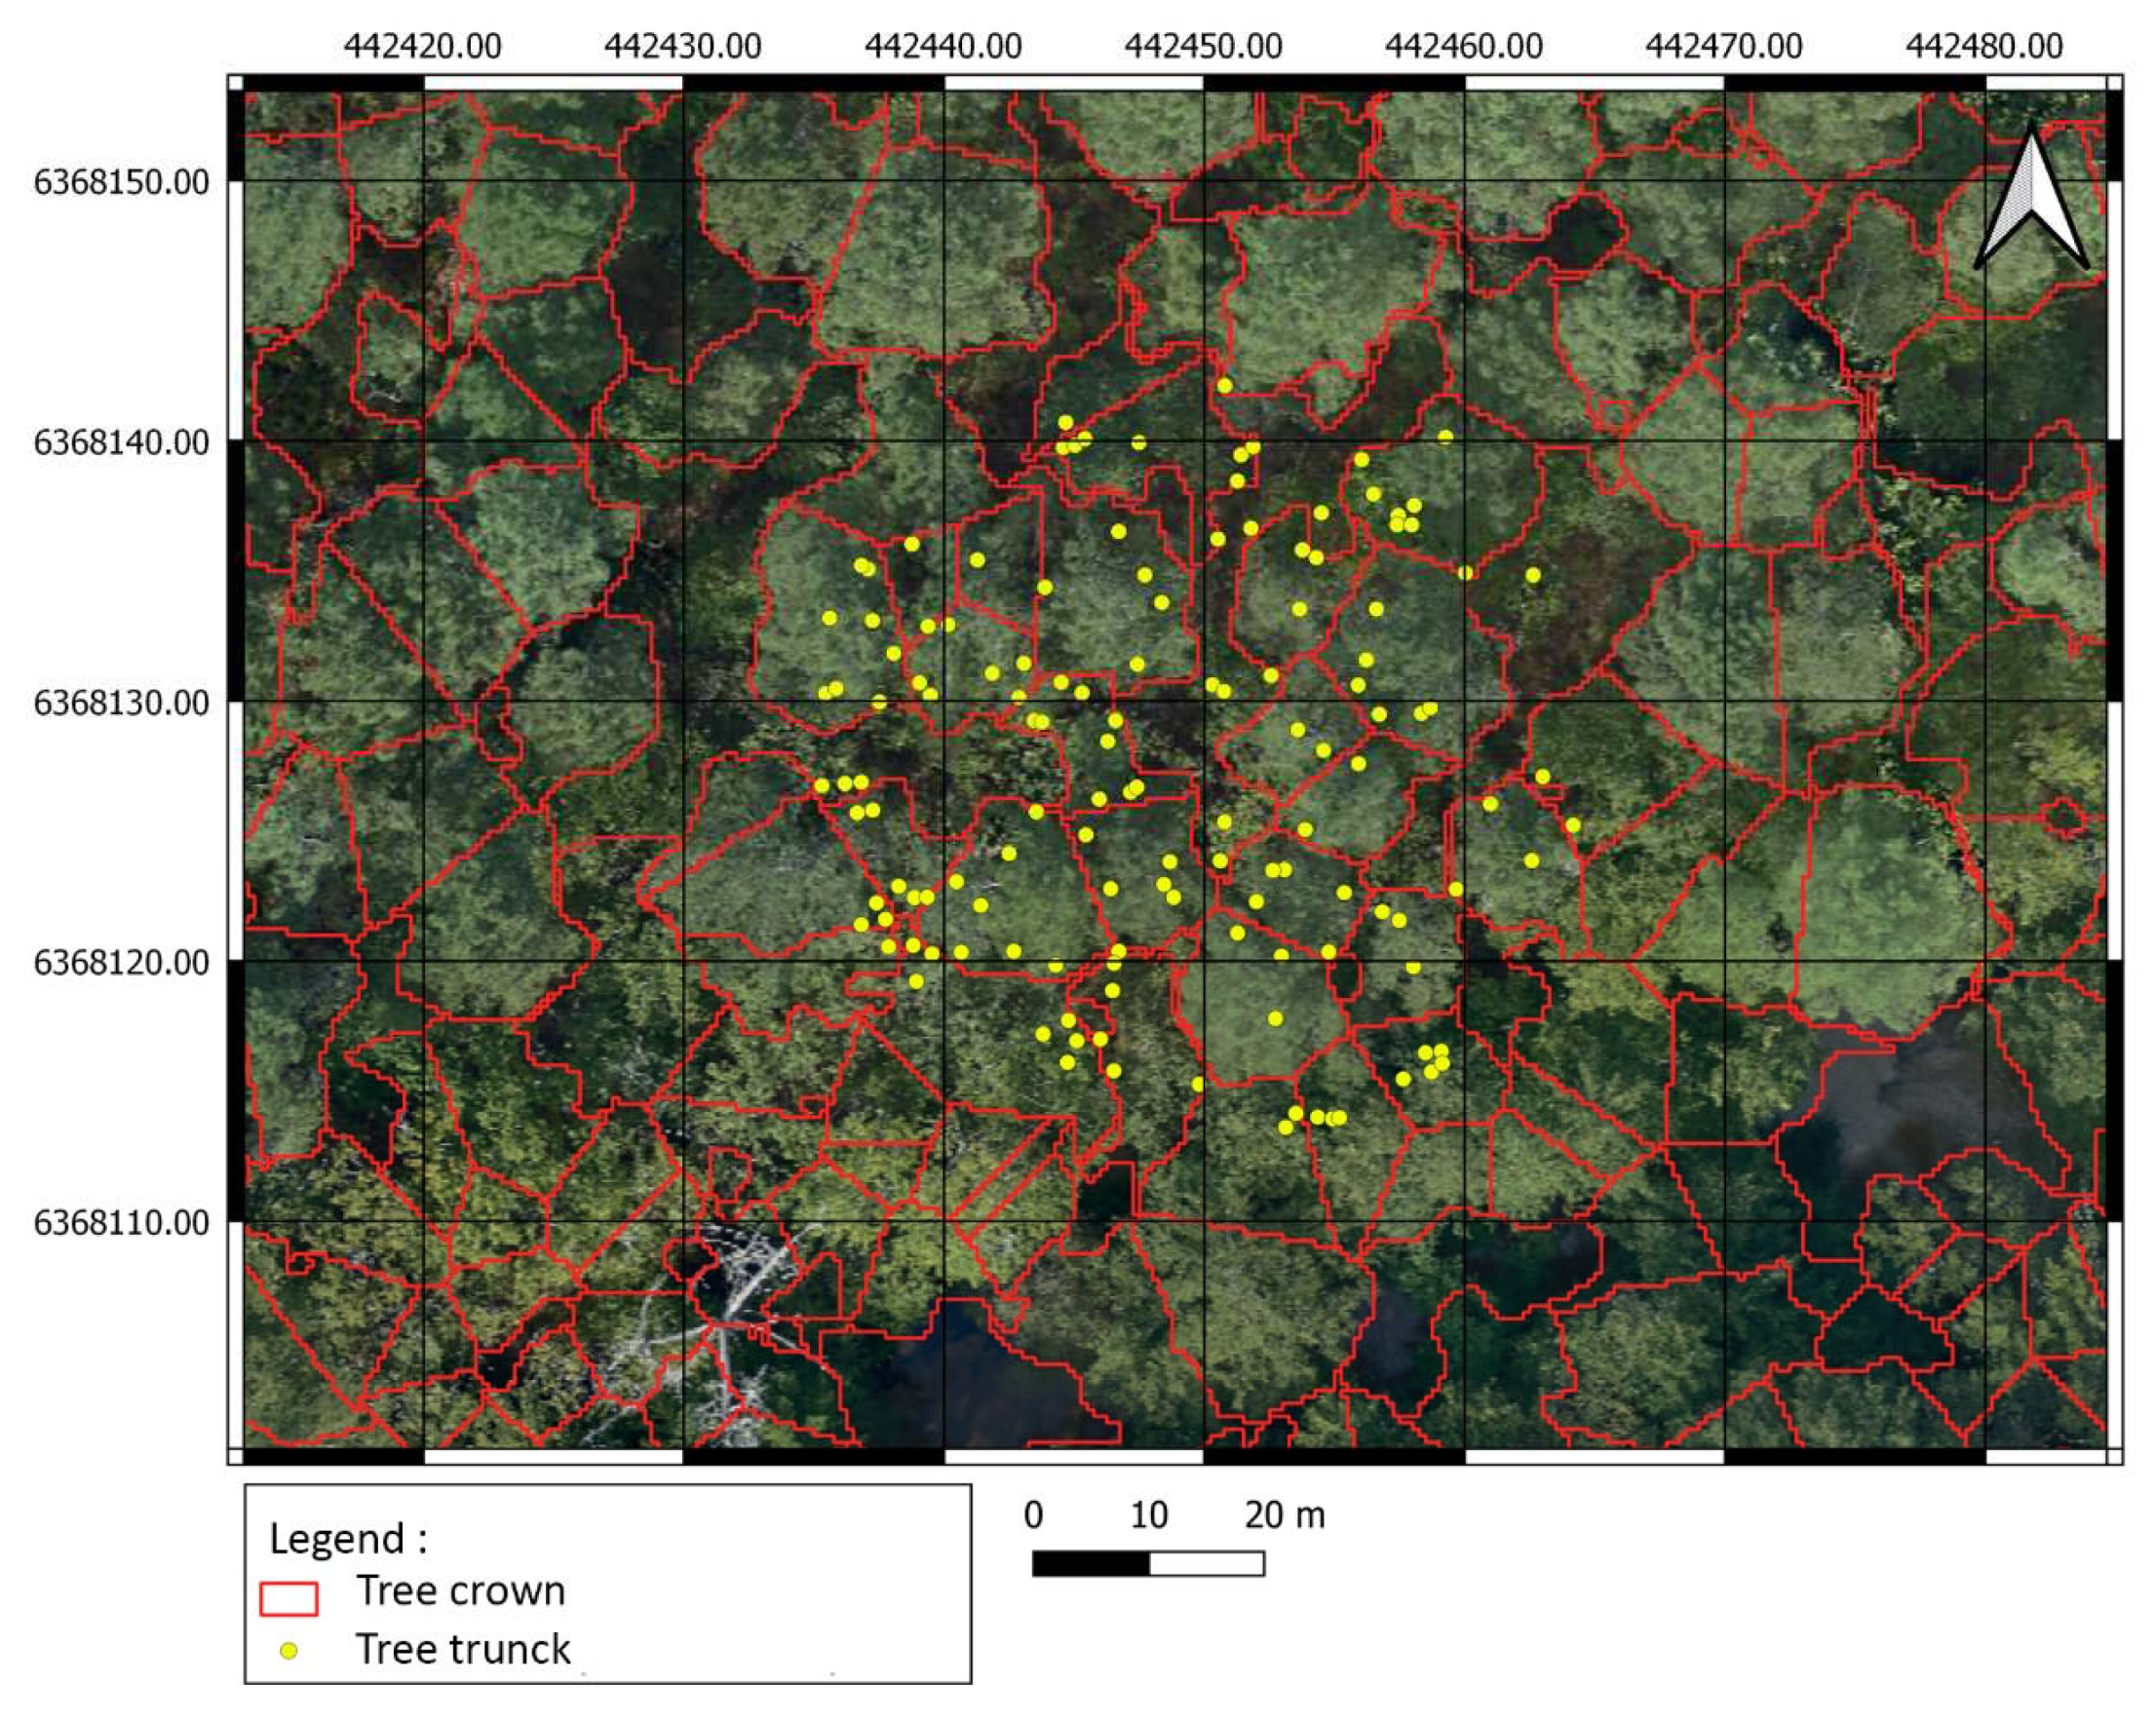
Table 1.
Sentinel-2 scenes technical information
| Product Tile Reference |
Sensor | Radiometric processing |
Dimensions |
|---|---|---|---|
| T30TYQ | Sentinel-2A, Sentinel-2B | Level 2A, Top of Canopy (TOC) reflectance | 10980x10980 |
Table 2.
Airborne LiDAR mission details.
| Parameters | Description |
|---|---|
| Date | 03/10/2019-04/10/2019 |
| Acquisition system | Laser scan: RIEGL VQ580 |
| Inertial unit: IXSEA AirINS | |
| Camera: iXUR 1000-50mm NIR | |
| Accuracy | Planimetry: 5cm |
| Altimetry: 5cm | |
| Density | 68 pts/m² |
| Projection | RGF 93 Lambert 93 (EPSG: 2154) |
| Altimetry | IGN69 – RAF18 |
Table 4.
Spectral indices: Formulas and descriptions for Sentinel-2 imagery.
| Spectral index | Formula | Description |
|---|---|---|
| NDVI | Assesses the importance of biomass and chlorophyll activity | |
| GRVI1 | - In addition to spring greening, it allows the detection of autumn coloration which can be differentiating factors between hardwoods and softwoods - Robust with misleading signals due to water on the ground surface |
|
| CIre | Sensitive to small variations in chlorophyll content helping differentiation between vegetation classes | |
| NDVIre3 | Exploits Red Edge bands to differentiate between vegetation classes based on the chlorophyll content of the leaves. | |
| NDre2 | Exploits the Red Edge strips to assess the health status of vegetation according to chlorophyll content | |
| SAVI | Sensitive to floors color and shine thus minimizing the ground effect. | |
| MSAVI2 | Study in vegetation detection in areas with high bare soil composition. |
Table 5.
Python modules used for data fusion process automating.
| Python library | Description |
|---|---|
| GDAL | Translator library for raster and vector geospatial data formats [22]. |
| otbApplication | Python API for Orfeo ToolBox applications. It is used for image processing and classification.[23] |
| Numpy | Scientific package for manipulating multidimensional arrays and computing mathematical operations.[24] |
| Whitebox | Package built on WhiteboxTools [25], an advanced geospatial data analysis platform. It is used to perform common geographical information systems (GIS) analysis operations and LiDAR data processing. |
| PyCrown | PyCrown [26] is a Python package for identifying tree top positions in a canopy height model (CHM) and delineating individual tree crowns. |
Table 6.
Comparison of classification accuracies using different fusion configurations with and without data augmentation.
Table 6.
Comparison of classification accuracies using different fusion configurations with and without data augmentation.
| Classification | Kappa | OA | |
|---|---|---|---|
|
Without data augmentation |
Sentinel-2 (single date) + LIDAR | 0.48 | 0.59 |
| Pleiades + LIDAR | 0.43 | 0.55 | |
| Sentinel-2 (multi dates) + LIDAR | 0.51 | 0.61 | |
| Sentinel-2 (single date) + Pléiades + LIDAR | 0.49 | 0.59 | |
|
With data augmentation |
Sentinel-2 (mono-date) + LIDAR | 0.53 | 0.62 |
| Pleiades + LIDAR | 0.49 | 0.60 | |
| Sentinel-2 (multi-dates) + LIDAR | 0.66 | 0.69 | |
| Sentinel-2 (mono-date) + Pléiades + LIDAR | 0.58 | 0.66 | |
Table 7.
Comparison of precision and recall per species using data augmentation.
| Pedonculate Oak | Tauzin Oak | Black Alder | Maritime Pine | Other | |
|---|---|---|---|---|---|
| Precision | 0.47 | 0.91 | 0.54 | 0.73 | 0.85 |
| Recall | 0.56 | 0.71 | 0.89 | 0.80 | 0.48 |
Disclaimer/Publisher’s Note: The statements, opinions and data contained in all publications are solely those of the individual author(s) and contributor(s) and not of MDPI and/or the editor(s). MDPI and/or the editor(s) disclaim responsibility for any injury to people or property resulting from any ideas, methods, instructions or products referred to in the content. |
© 2024 by the authors. Licensee MDPI, Basel, Switzerland. This article is an open access article distributed under the terms and conditions of the Creative Commons Attribution (CC BY) license (http://creativecommons.org/licenses/by/4.0/).
Copyright: This open access article is published under a Creative Commons CC BY 4.0 license, which permit the free download, distribution, and reuse, provided that the author and preprint are cited in any reuse.


