1. Introduction
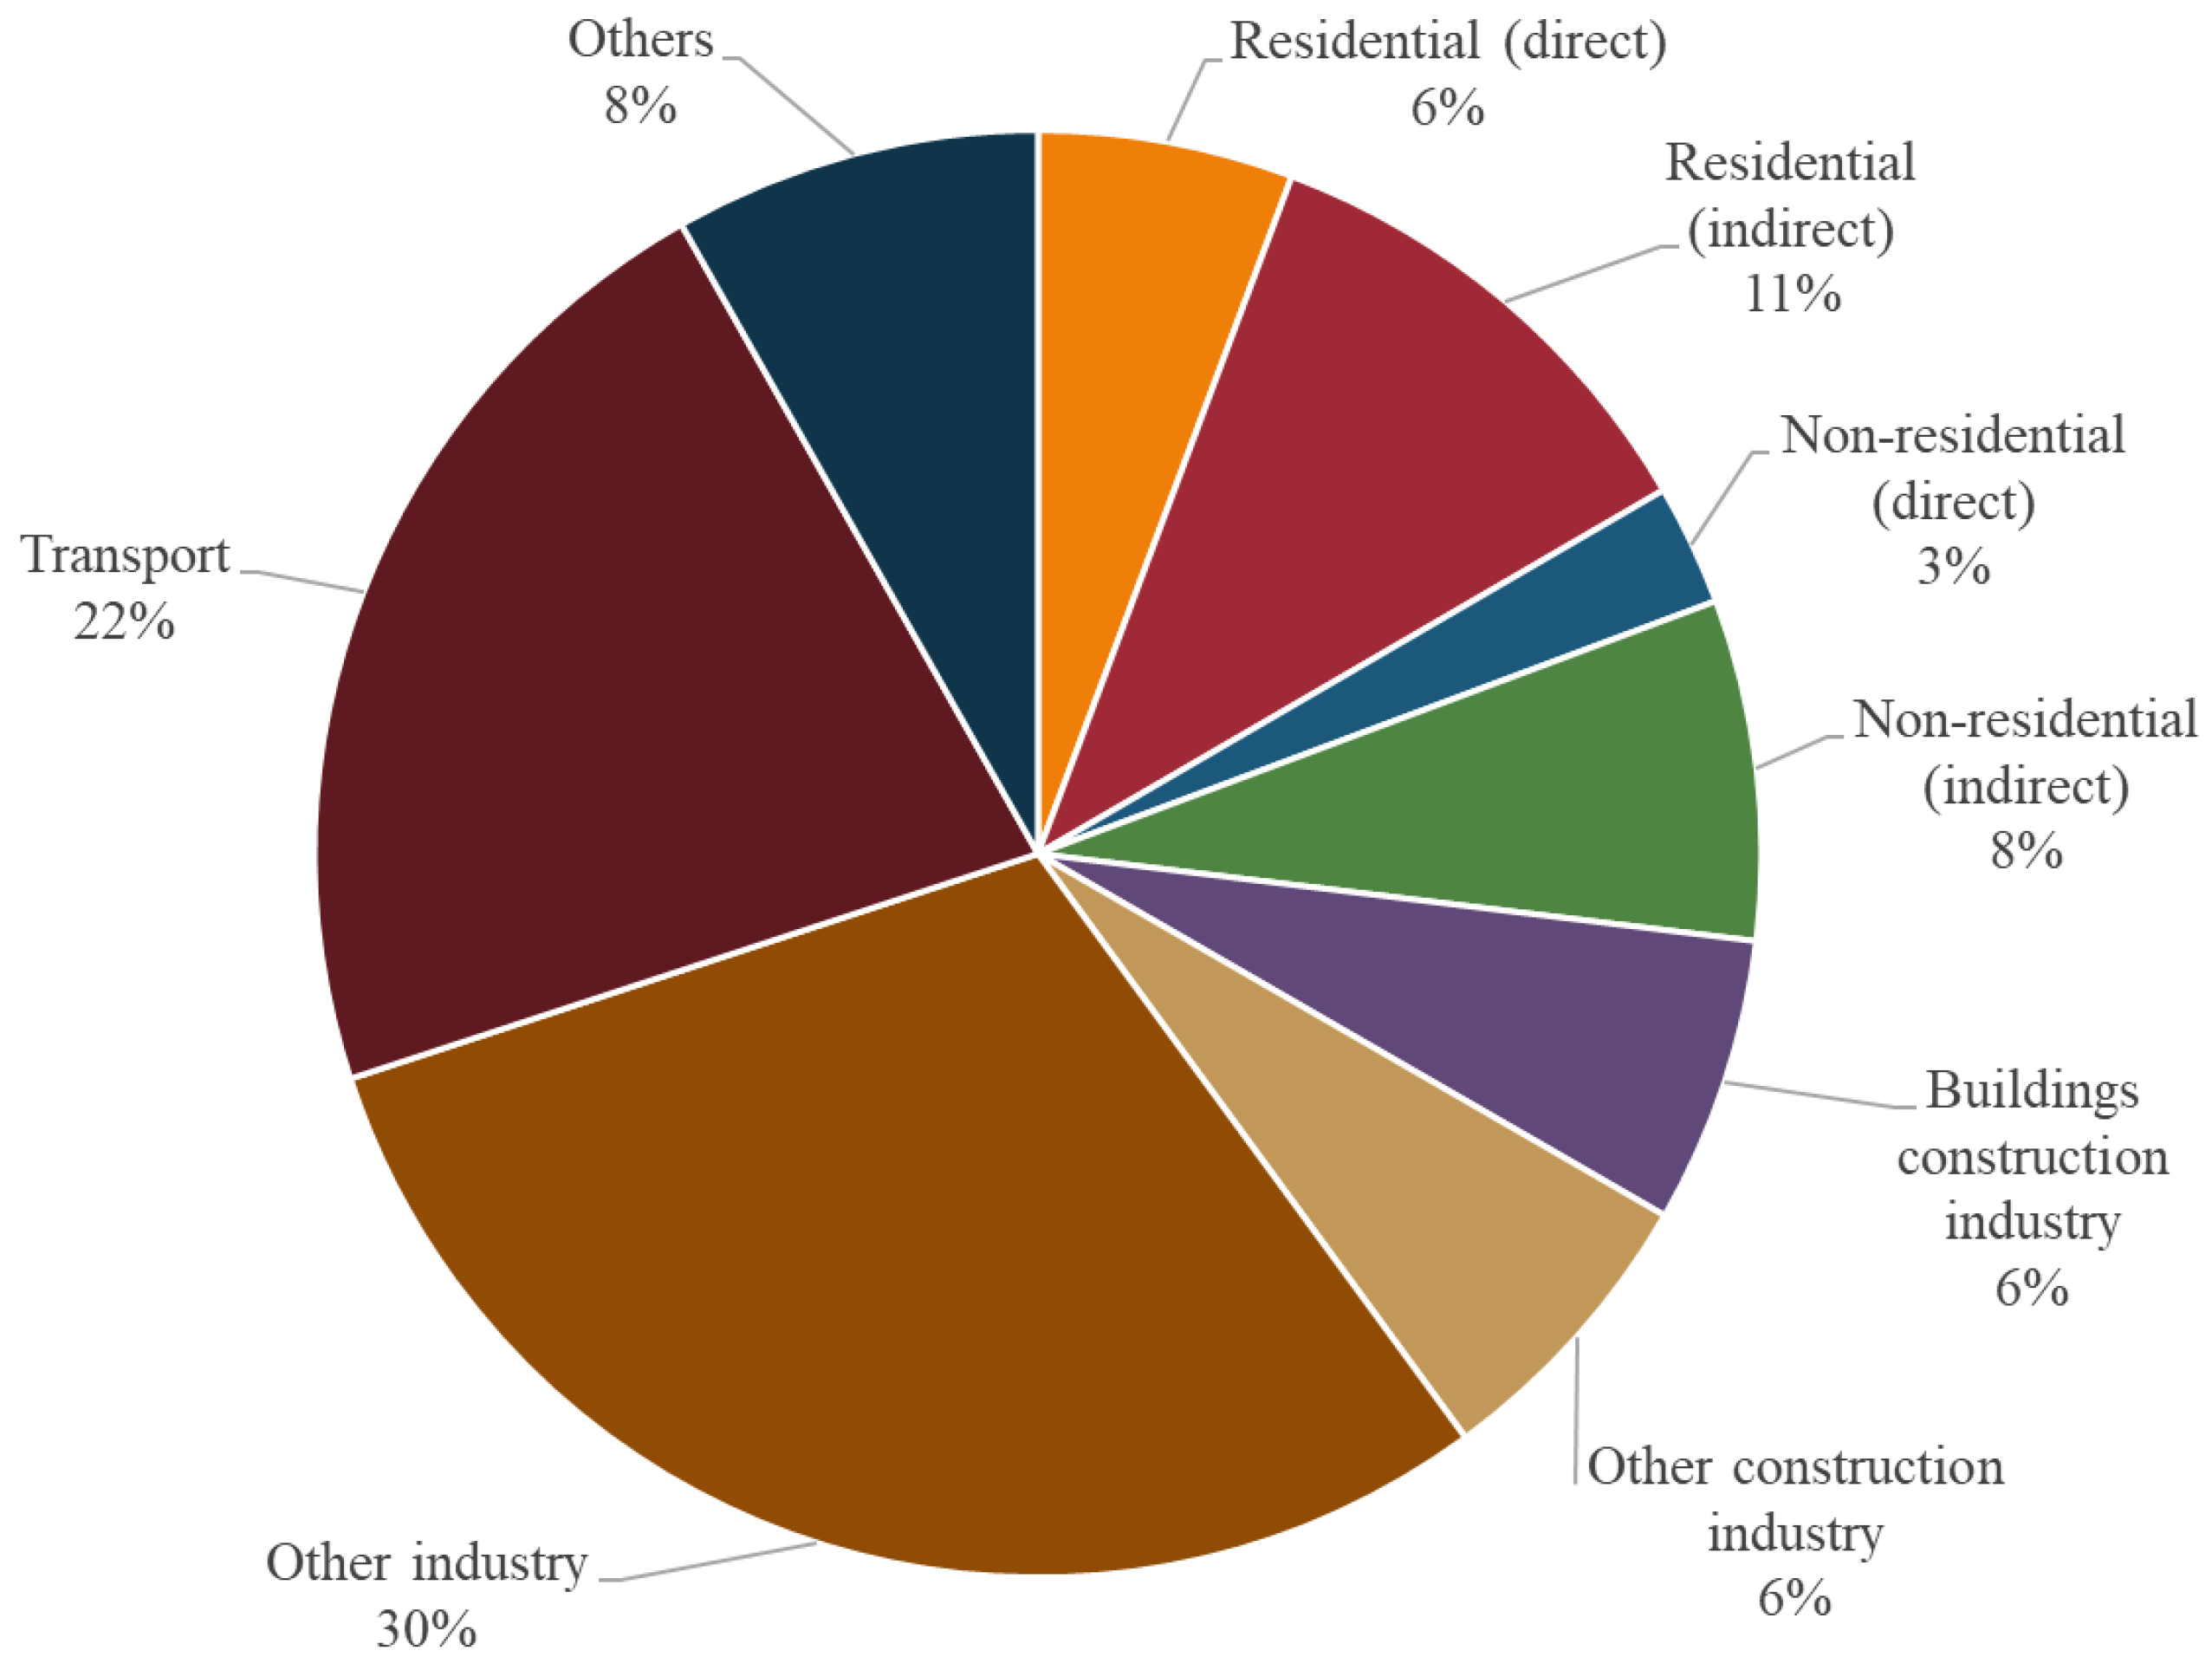
Climate change is one of the most significant challenges of our time, and the construction sector, which accounts directly and indirectly for about the 40% of global energy- and process- related emissions, is a primary focus for policymakers to achieve the expected decarbonization targets of national economies by 2050. Data show that in 2021, direct and indirect emissions from the operation of buildings increased by 2 % compared to 2019 values and by about 5% compared to 2020. In detail, around 8% of global energy and process-related CO
2 emissions are associated to the use of fossil fuels in buildings, another 19% to the generation of electricity and heat used in buildings, and a further 6% to the production of materials used by construction industry [
1].
In Europe, as in the United States, due to its potential to implement cost-effective energy-saving solutions, the construction sector is at the forefront of national action programmes aimed at reducing CO
2 emissions. Indeed, already since 2010, the EU’s Energy Performance of Buildings Directive (EPBD) mandated that all new buildings become "nearly zero-energy building" (nZEB) by the end of 2020. Similarly, the U.S. Department of Energy (DOE) aims to achieve "marketable zero energy homes in 2020 and commercial zero energy buildings in 2025." [
2] These standards primarily address the reduction of the operational energy demand of the building stock - maximizing thermal comfort and daylight access while producing renewable energy - and only partially the problem of reducing the overall impact of the construction sector with respect to climate change [
3].
Figure 1.
Global energy and process emissions from buildings, including embodied emissions from new construction. Source IEA, 2022 [
1].
Figure 1.
Global energy and process emissions from buildings, including embodied emissions from new construction. Source IEA, 2022 [
1].
Indeed, they are based on the assumption that the operational energy of a building, and the emissions associated with it, is usually greater than the embodied energy, which includes the energy consumption, and the related emissions, throughout its entire life cycle, not just during the use phase. The more the energy consumption of a building is reduced through an improved building envelope design and more efficient systems, the more the energy demand to produce building materials and components increases; consequently, the contribution of embodied energy to the overall life cycle emissions becomes even more significant [
4]. In the case of buildings, moreover, it becomes particularly important to consider not only the emissions, embodied and operational, associated with energy, but also the indirect carbon emissions that are often underestimated [
5].
In this context, the concept of nZEB has evolved to a Life Cycle Zero Carbon Building concept (LC-ZCB), which considers the entire life cycle of the building. While it is true that carbon emissions include those associated with energy use, they are nevertheless influenced by the type of fuel mix and, for the embedded part, by the chemical processes of materials that emit and sequester carbon [
6]. Neglecting embodied carbon could unfairly penalize the use of bio-based building materials, such as wood, which can potentially remove CO
2 from the atmosphere by storing biogenic CO
2 during their growth and contribute significantly to the decarbonization efforts in response to climate change challenges [
7]. Previous studies already highlighted the contribution of storing in buildings the atmospheric CO
2 removed by bio-based materials when used as an alternative to conventional structural and insulation materials [
8].
To achieve the Zero Carbon goal, this study argues for the importance of considering both embodied carbon (EC) and operational carbon (OC) in evaluating building emissions and suggests using parametric design and Life Cycle Assessment (LCA) as practical tools for designers to orient preliminary design choices considering the storage potential of biogenic CO2 in different building materials.
LCA is the methodology commonly used for evaluating the environmental impact of buildings. However, many LCA studies overlook the effects of biogenic CO
2 when it comes to bio-based materials. Typically, these studies assume that emissions and sequestration of biogenic CO
2 balance out during biomass growth. But since these events occur at different times, dynamic approaches have been introduced to account for their temporal effects [
9,
10,
11]. Dynamic LCA (DLCA) approaches can assess the impact of timing, such as how long CO
2 stays in the atmosphere. For instance, DLCA applied to wooden products shows that carbon neutrality is achieved after about half of the rotation period [
12]. Considering the urgent need to take action against climate change, adopting a dynamic approach for carbon flows can aid decision-making in the construction sector, both for new and existing buildings, by promoting the use of bio-based materials as an effective means of carbon storage in the built environment, and encouraging uptake in the land [
13]. Incorporating environmental assessment methods during the early stages of the design process can have the most significant impact, as costs [
14], operational energy demand, and environmental effects can be optimized and minimized at this stage [
15].
Based on these premises, the objectives of this paper are identified as follows: (1) to develop a simplified decision-making tool for the preliminary assessment of parameters influencing carbon neutrality of buildings; (2) to implement a methodological framework to integrate biogenic carbon evaluation and consider the potential of carbon capture and storage from bio-based building materials; and, in consideration of the global decarbonization target by 2050, (3) to understand how future weather scenarios impact the emission balance between EC and OC towards long-term carbon neutrality. The following research questions are proposed to address these objectives: 1) What are the key parameters that significantly impact the carbon neutrality of buildings, and how can they be integrated into a decision-making tool for the preliminary assessment? 2) How can biogenic materials be effectively integrated into building design and construction to reduce carbon emissions, and what is the environmental impact of their use compared to conventional materials? and 3) What are the potential future impacts of climate change on building design and construction, and how can designers and stakeholders adapt to mitigate these impacts and improve the overall carbon neutrality of buildings?
2. Materials and Methods
These following steps are proposed to achieve the study’s objectives:
selection of a typical building and its modelling using Grasshopper for Rhino by means of the main parameters that influence its total emissions (geometry, envelope material characteristics, plant type, etc., as later specified);
use of custom code, Bombyx, and Honeybee plugins to integrate OC and EC into the model;
conversion of operational energy to operational carbon in consideration of the energy mix of the reference country (in this case, the United States);
identification of alternative configurations, and related parameters, for optimizing the base case, both for operational carbon reduction (transparent/opaque envelope ratio, thickness of insulation material, photovoltaic surface area) and embodied carbon reduction (replacement of insulation material with biogenic materials);
comparison of the results obtained for the different alternatives in terms of kg CO2 eq/m2/year;
validation of the results against future climate scenarios up to the end of the century.
The tool Bombyx - a design-integrated parametric tool for real-time Life Cycle Assessment (LCA) developed at ETH in Zurich [
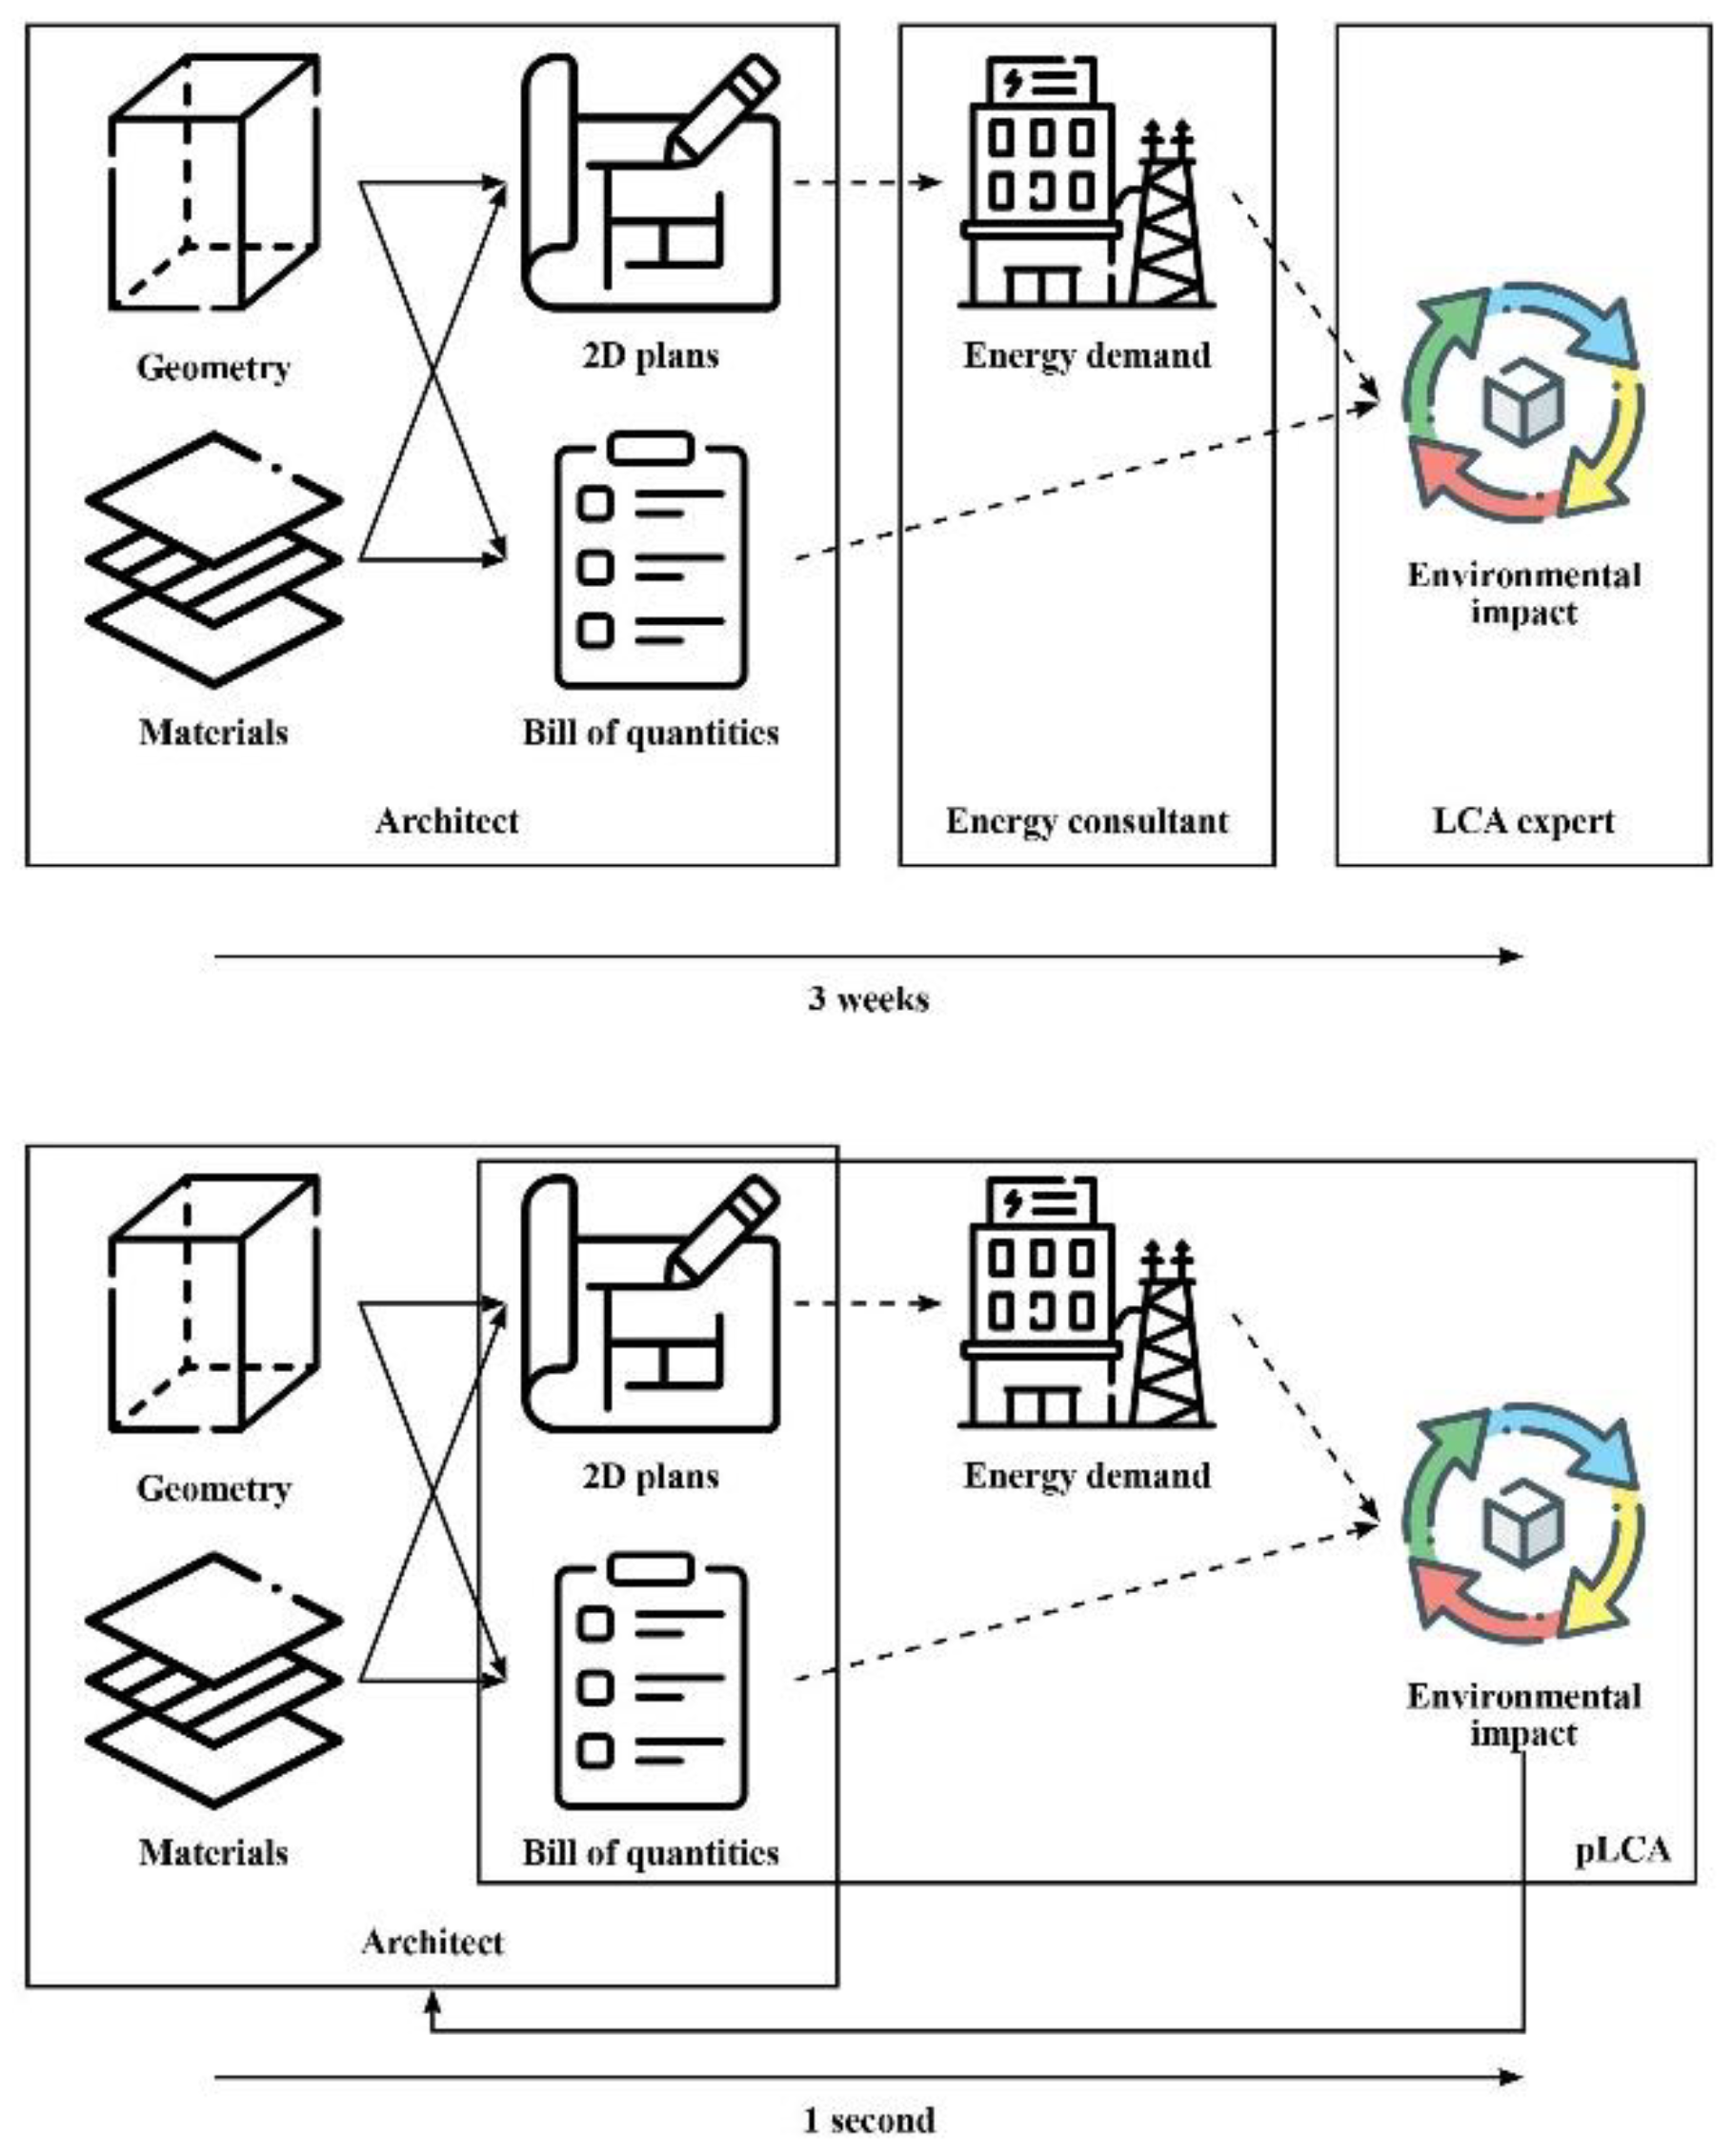
16], is used to calculate the embodied emissions. It allows a simplified LCA, based on a Rhino/Grasshopper model, and permits different Levels of Detail (LOD) - a term used in Building Information Modelling to describe the precision of a model. Since all the materials have been identified for this case study, a high LOD has been used. The parametric LCA (pLCA) method, compared with conventional methods in
Figure 2, allows for modifications of the main building parameters and get real time impact assessment calculated on the updated configuration of the model [
17].
Since the Bombyx tool does not contemplate biogenic CO
2, effectively implying the impossibility of achieving climate neutrality with renewable energy production alone, a Grasshopper-specific code was developed based on the biogenic global warming potential (GWPbio) index method considering a time horizon of 100 years. This method is based on dynamic life cycle analysis that assumes the biomass turnover period and storage period as variable functions. The goal is set to obtain a total net-GWP of 0 kg CO
2eq/m
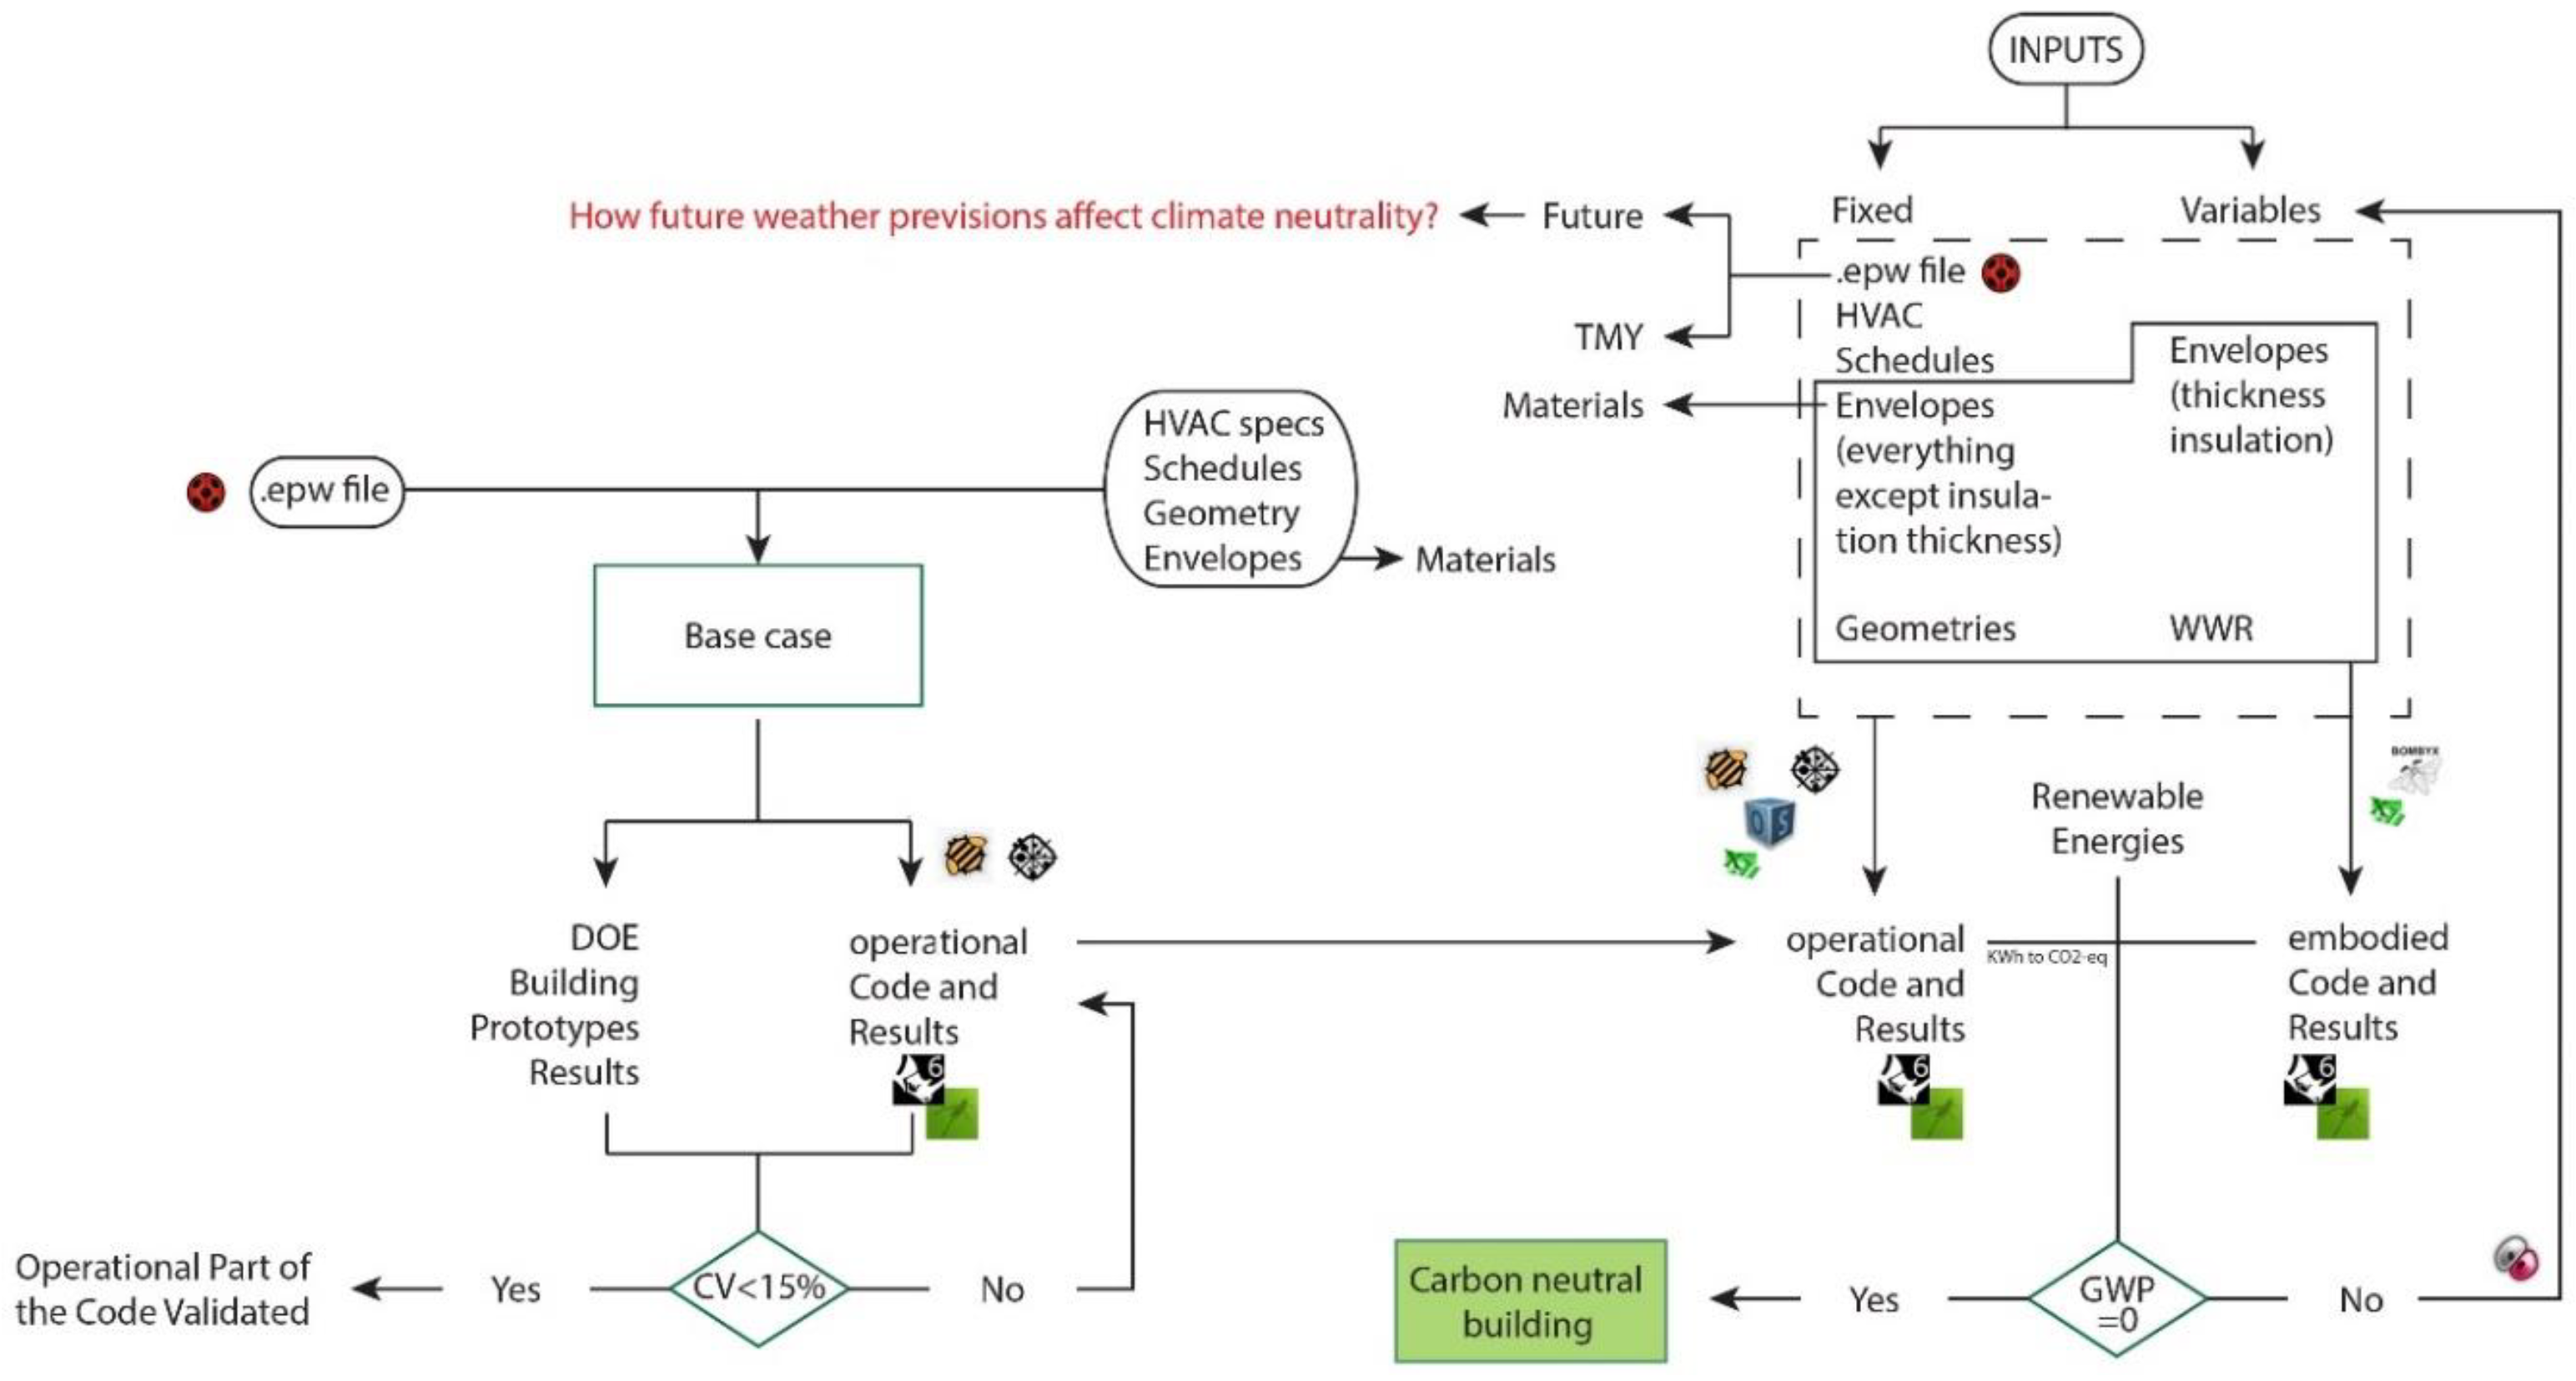
2 through estimated sum of OC and EC. In order to consider carbon emissions, emissions associated with energy were converted to carbon emissions in consideration of the mix of energy sources in the United States. The summary of the adopted methodology is presented in
Figure 3.
2.1. Case study: single-family detached house
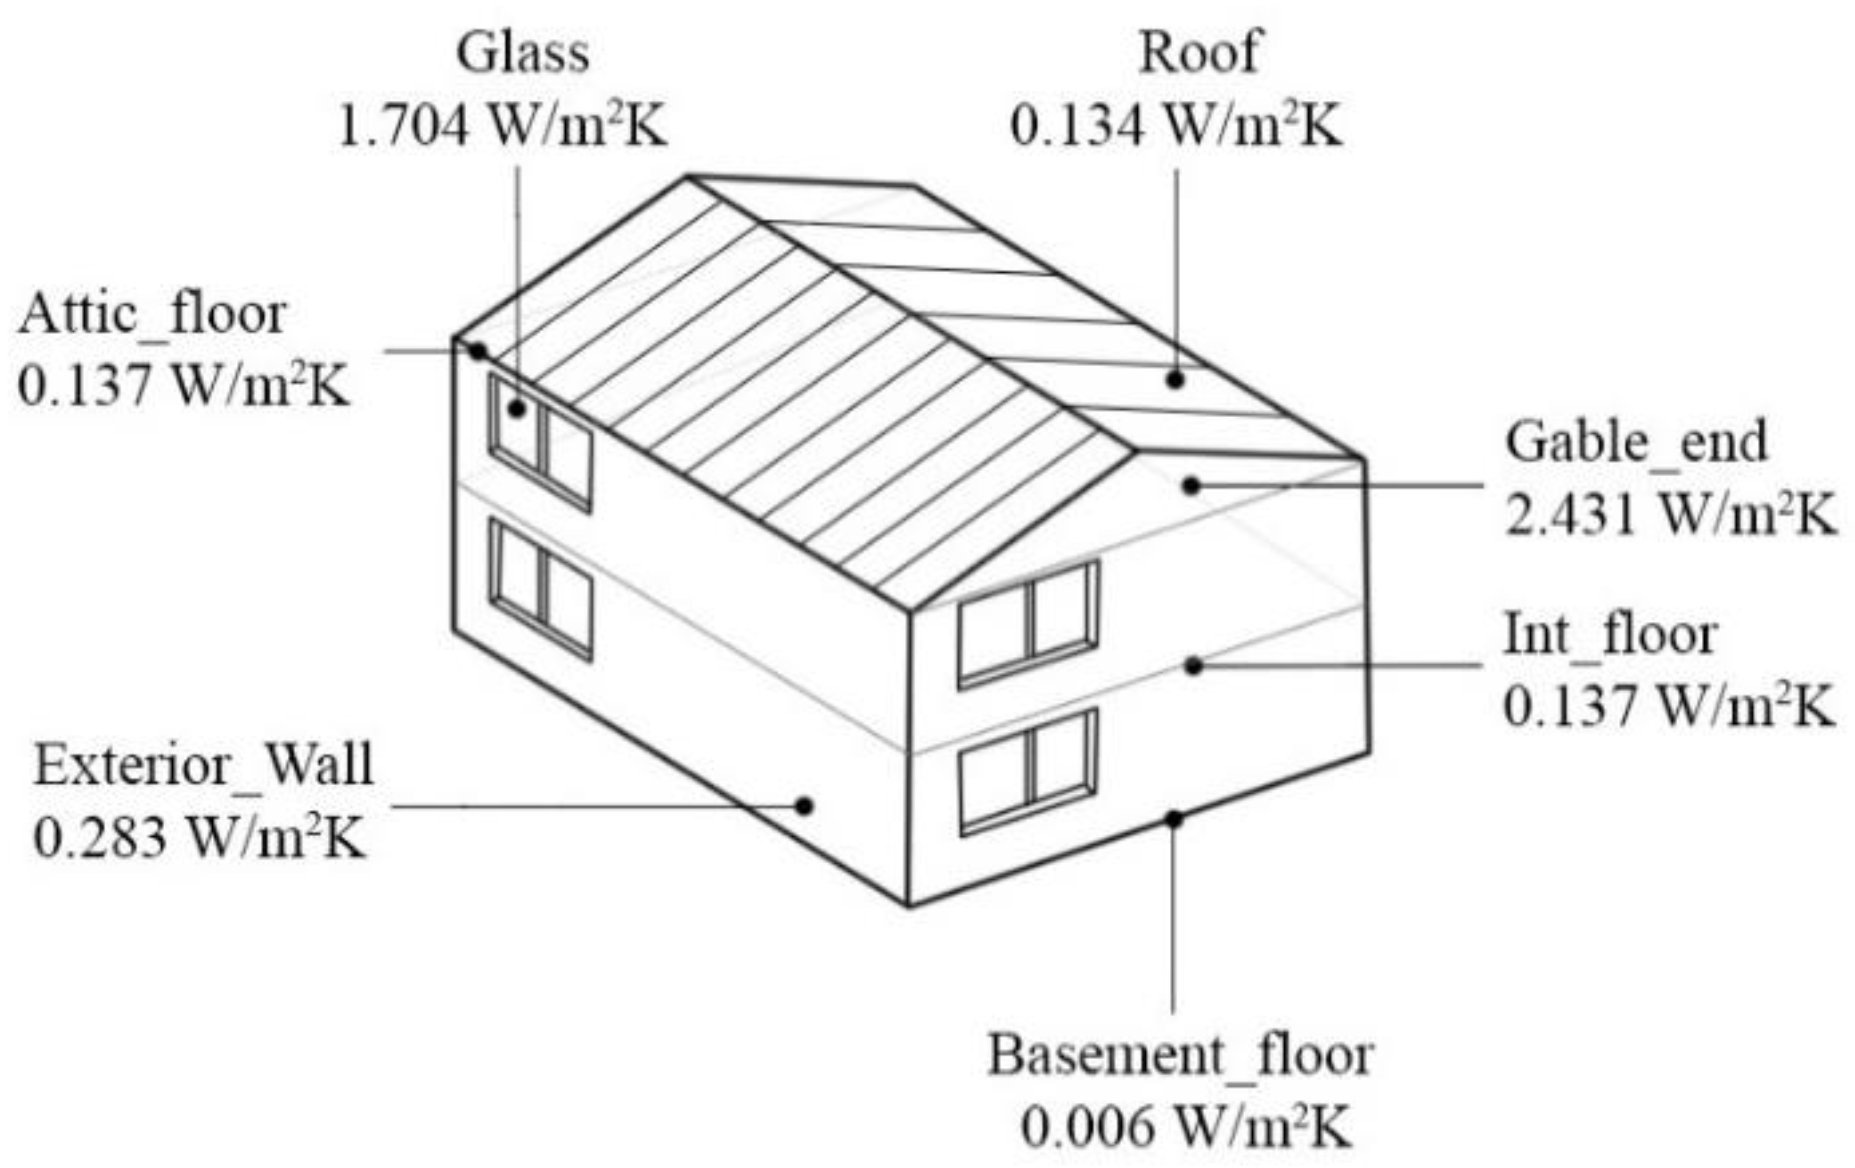
The case study is a residential single-family house with 2-floors adopted from the Department of Energy (DOE) prototype building built in the 80’s (
Figure 4). Its characteristics are based on the International Energy Conservation Code (IECC), with a slab-on-ground foundation and a heat pump as the heating and cooling system, with specifications reported in
Appendix C (Table C.1 and C.2). The climate zone chosen for the simulation is the 4A, the representative city is New York City, and the weather data (.epw file) come from John F. Kennedy International Airport. The number of occupants considered is 3. With an internal surface of 220 square meters (≈ 2368 sq ft), the building includes a pitched roof and eight windows with a window/wall ratio (WWR) reported in
Table 1. The building also has a non-heated attic of 110 square meters (≈ 1184 sq ft). As shown in
Figure 4, the building envelope consists of two types of wall (i.e., the Exterior_Wall, and Gable_End), a basement floor (i.e., Basement_floor), a roof (Roof), and two interior floors (Int_Floor, and Attic_Floor).
The overall R-Values of the envelope components, their construction layers’ physical and thermal properties, the heating and cooling system properties, and other equipment are reported in
Appendix C (Table C.3 and C.4). The glass used in the model has a U-Value of 1.704 W/m
2K, a Solar Heat Gain Coefficient (SHGC) of 0.334, and a Visible Transmittance (VT) of 0.880. The Window-Wall Ratio is also reported in
Table 1. The weather data is the John F. Kennedy International Airport EnergyPlus weather (EPW) file representing the 4-A climate zone (i.e., Mixed – Humid) in New York City. The temperature in this climate zone is defined by CDD10ºC ≤ 2500 AND HDD18ºC ≤ 3000 where CDD and HDD are cooling and heating degree days, respectively. EnergyPlus™ Version 9.0. simulated the prototype building’s energy use.
2.2. Integrating operational and embodied carbon emission
The Life Cycle Carbon Footprint Assessment (LC-CFA) consists of two phases: i) the Operational Carbon (OC) and ii) the Embodied Carbon (EC). The Honeybee tool is used to calculate the OC, while the EC consists of two parts: fossil carbon (FC) and biogenic carbon (BC). The first one is calculated by multiplying the mass of each material (M
j) with the material’s specific emission factor (EF
j) (Equation 1), while the second one is evaluated by multiplying the total mass of CO
2 stored in a specific biobased product (CC
j) with the specific GWPbio index assumed on the base of: i) type of biomass, ii) storage period (see
Appendix A) (Equation 2). First, the areas of the different building element (A
i) must be calculated to determine the mass of the involved materials. Then, it is multiplied by the thickness (t
j) and density of the specific material. The density data comes from KBOB database together with the specific EF. For some materials, such as windows, KBOB database provides the EF per surface area of the element. In this case, the element area 𝐴
i can directly be multiplied by the EF
j.
Additionally, the number of replacements (R
j) is considered for each material used. To calculate it, the reference study period (RSP) has been divided by the reference service life (RSL) of the building component (Equation 3). As Bombyx is based on Swiss standards, the RSL is defined in SIA 2032 [
20], and the RSP for residential buildings is assumed equal to 60 years. The RSP of 60 years is maintained because it is typical in the U.S. and is a reasonable value for this type of calculation.
2.3. Code and model validation
The next step is determining the operational energy calculation using Honeybee and Ironbug components and validating the Grasshoper model. Once the system is set, it is validated and compared to the results from the residential single-family model from the DOE building prototypes [
16]. The inputs were: schedules, geometry, Heating, Ventilation, and Air Conditioning (HVAC) efficiency, envelopes, materials, and the New York City J. F. Kennedy weather file, downloaded from the Ladybug Tool EPW map website [
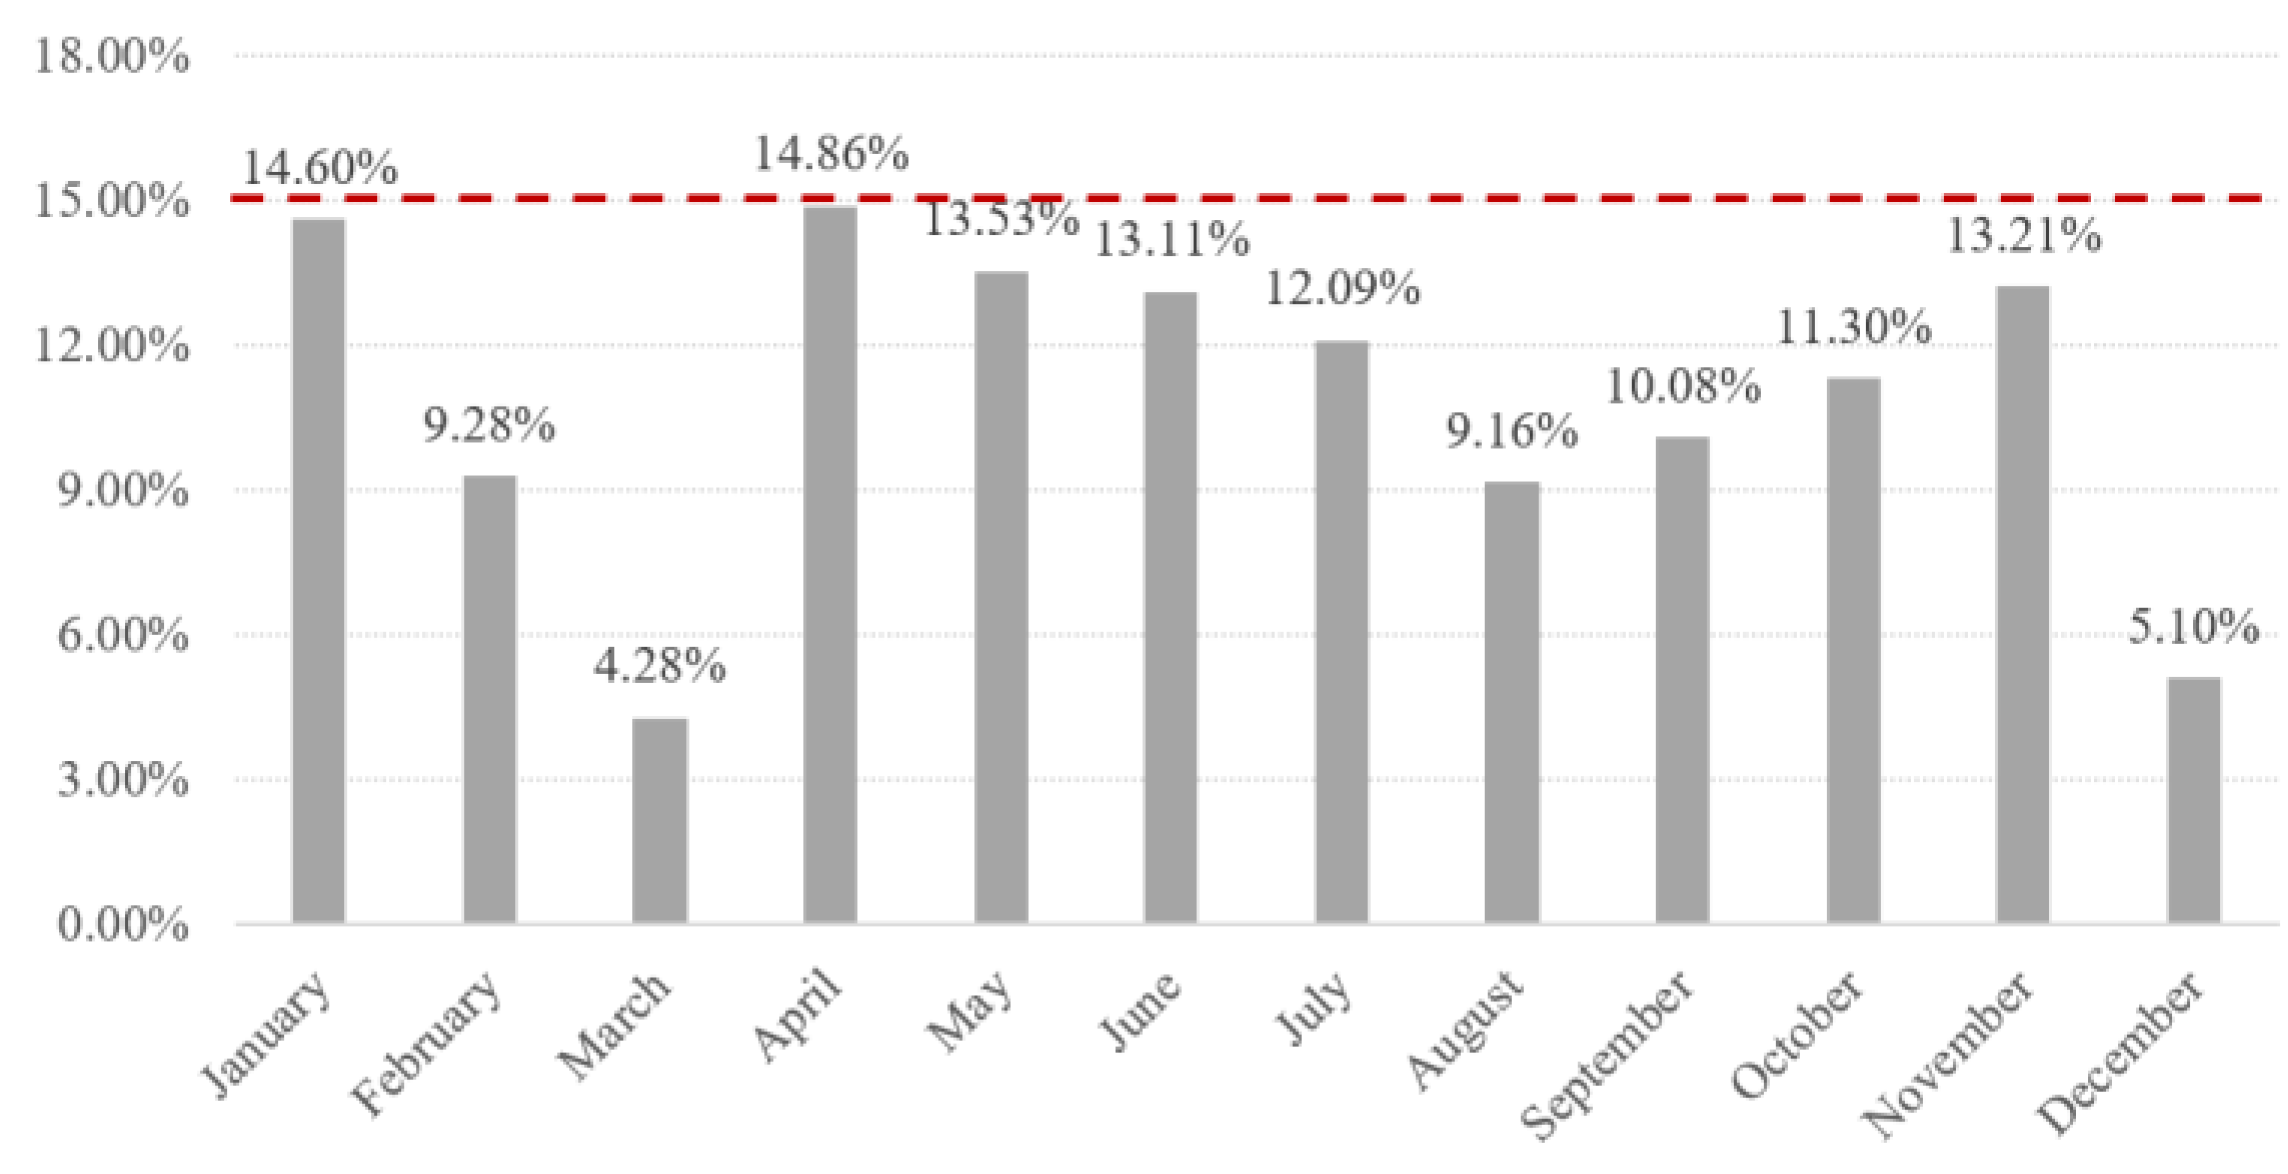
17]. Honeybee and GhExcel are used for the geometrical and material properties, respectively. The workflow creates zones based on plan dimensions, height, roof type, and Window-Wall Ratio. The inputs follow ASHRAE 90.1-2010 with equipment, lighting, occupancy, temperature setpoints, and zone loads schedules. Ironbug determines HVAC inputs from the .ifc file. The "Honeybee Export To Openstudio" plug-in executes the simulation, producing 19,230.6 kWh for the "Midrise Apartment" schedules. The model is validated against the prototype building using ASHRAE Guideline 14-2014 and the "Coefficient of Variation of the Root-Mean-Square Error" (CV RMSE), with a limit of 15% [
21]. The Grasshopper model produced the CV RMSE, as shown in
Figure 5, confirming the model validity.
2.4. Optimization of the base case building and carbon neutrality considering the U.S. energy mix
Using the Grasshopper code, an optimization process is applied to the existing model to introduce new materials and a photovoltaic (PV) system to achieve the nZEB standard. The building’s Global Warming Potential (GWP) is used to evaluate the success of the optimization, with a target of reaching 0 kg CO
2eq/m
2 per year. The GWP is calculated as the sum of operational and embodied energy. To calculate the operational energy, the electricity consumption is first converted from "kWh/m
2" to "kgCO
2eq/m
2" using the average U.S. electricity source emissions of 0.429 [
19] for the reference building in New York City. The embodied energy is calculated using the Bombyx plug-in’s bottom-up approach, which considers material properties, thicknesses, reference service life, component surface areas, and window details. The energy conversion is assumed to be steady, but this value may change in the future as the energy source mix changes.
The construction material properties were sourced from the KBOB Swiss database, but the present study used Environmental Product Declarations (EPDs) from local producers due to imprecise material information in the DOE. The EPDs provide material properties like Density, Embodied Energy, Renewable Energy, Non-Renewable Energy, Greenhouse Gas Emissions, Thermal Conductivity, and others.
The study evaluates two variations to optimize the base case scenario: BASE_OPT and BASE_BIO. BASE_OPT improves energy efficiency by adding sufficient PV-covered surfaces while BASE_BIO incorporates more bio-based materials (i.e., hemp shives) than the base case, reducing Embodied GWP values to achieve the nZEB condition. Life cycle impact assessment (LCIA) databases and validated standards do not currently include carbon storage and end-of-life considerations for bio-based products due to methodological limitations. This creates a challenge for accurately assessing the environmental impact of wood and other bio-based materials, as their ability to store carbon and delay greenhouse gas emissions temporarily is not fully captured [
11]. To address this issue, this study utilized the GWPbio index method, developed by Guest et al. [
10], which considers a 100-year time horizon and incorporates dynamic life cycle analysis with variables such as rotation period and storage period explained in
Appendix A and shown in Figure A.1. The results showed that using fast-growing materials like straw, hemp, and flax as thermal insulation in buildings can be a negative carbon technology, as the carbon embedded in the bio-based product is fully regenerated within one year of crop growth [
8].
Ladybug is used to analyze PV panel-covered surfaces like walls and roofs and utilizing the Galapagos plugin, potential values for various parameters can be inputted to identify the optimal solution for achieving zero carbon emissions.
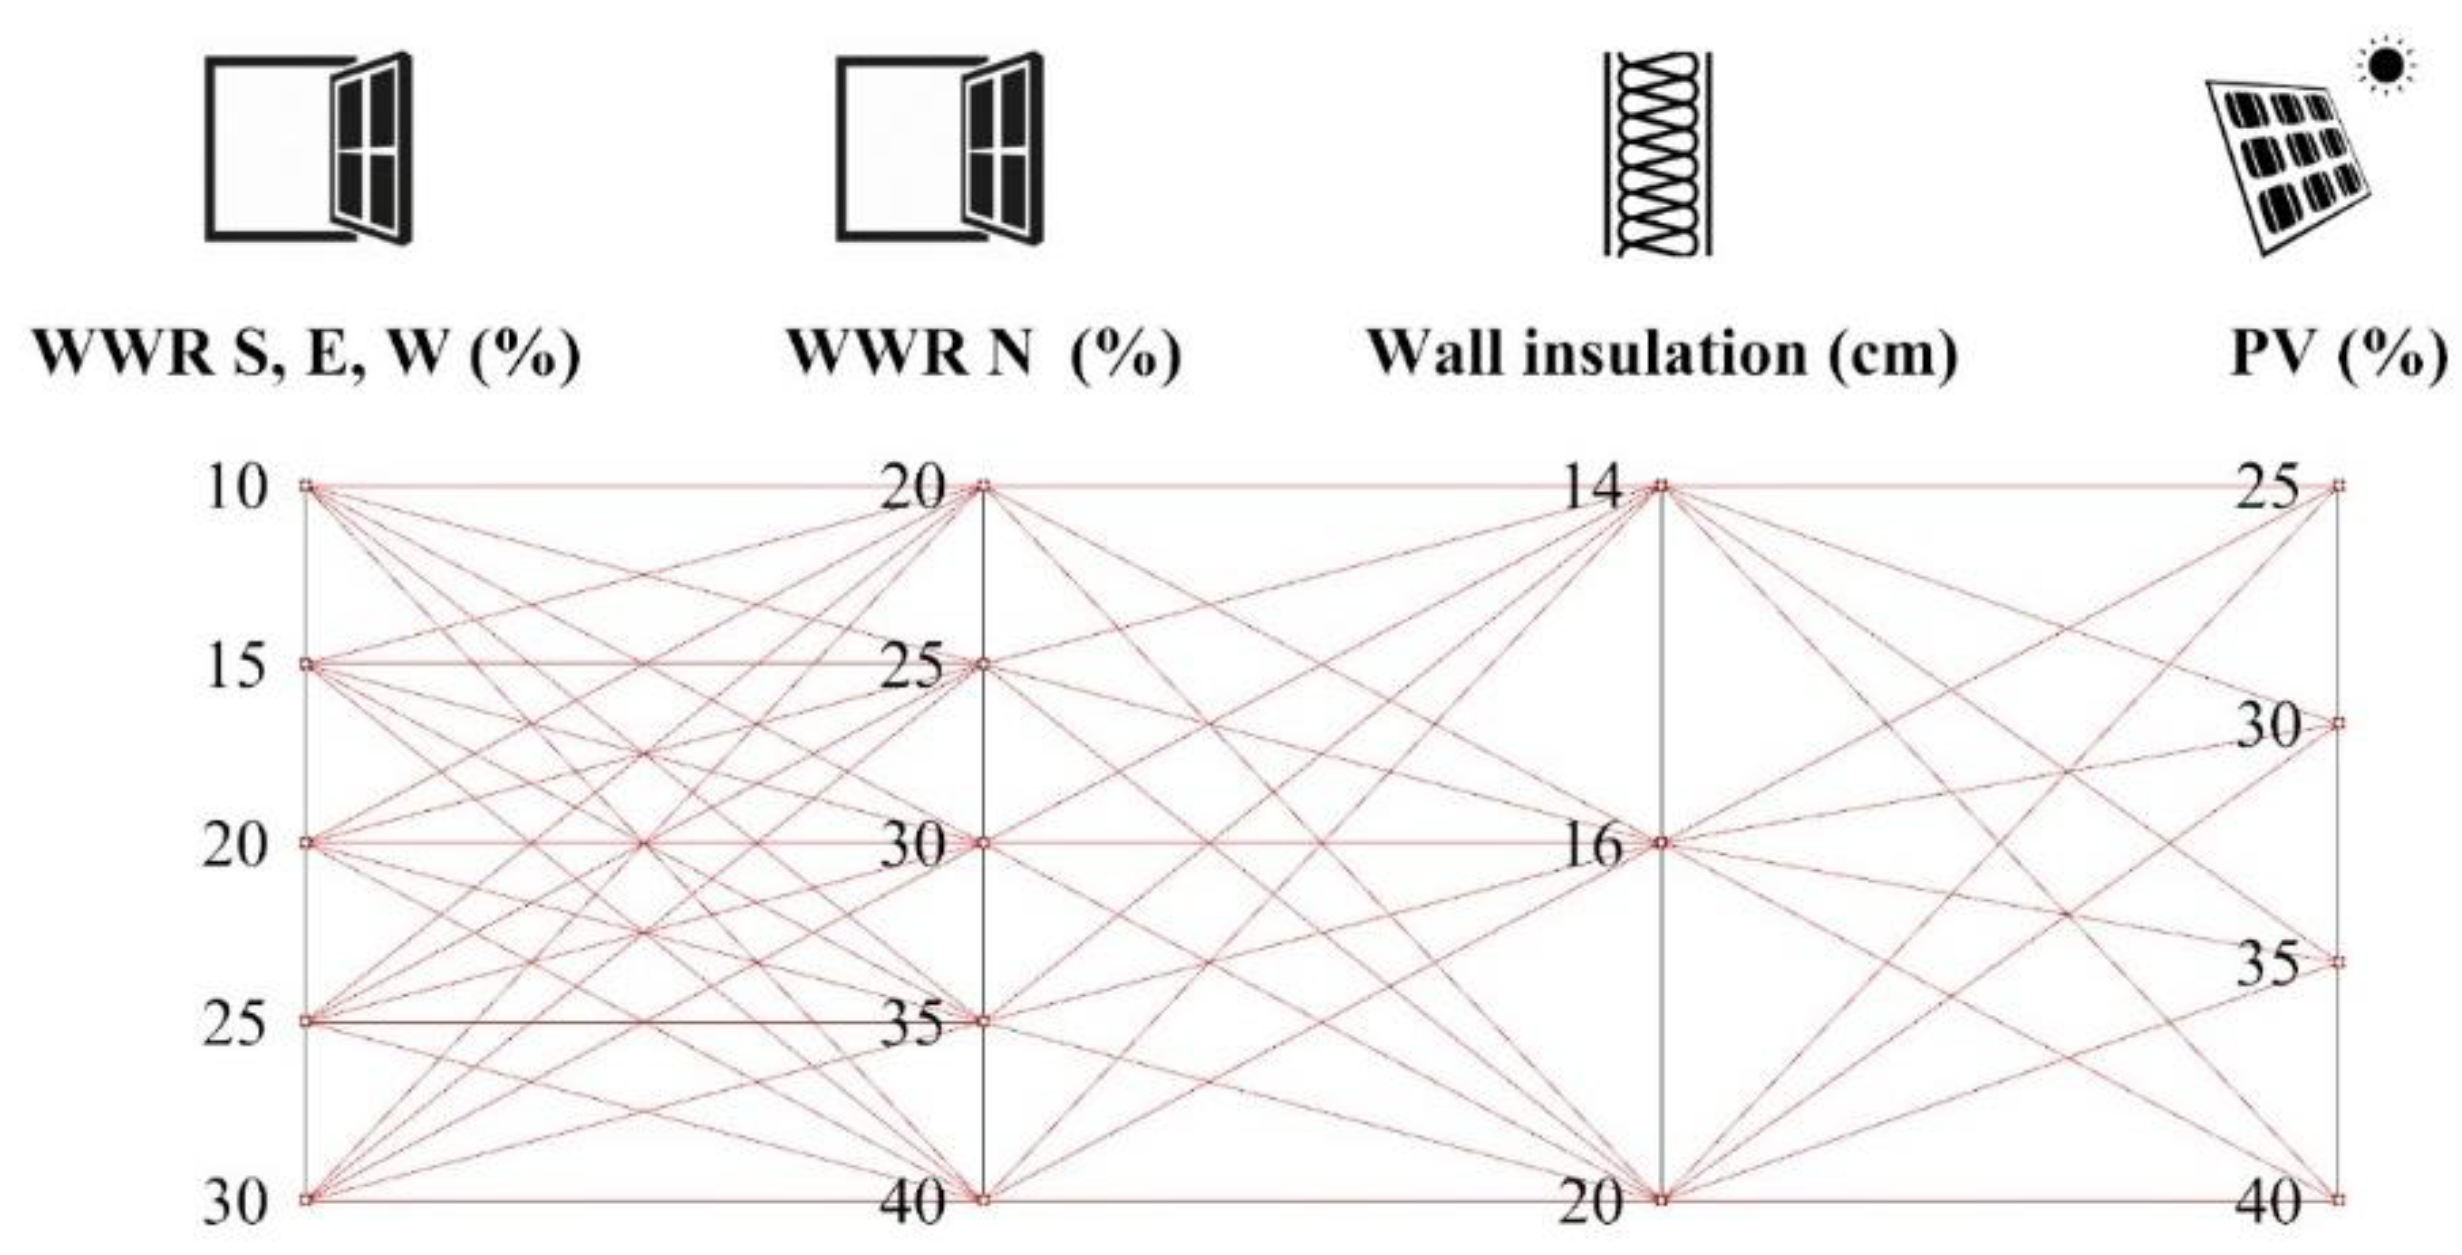
Figure 6 summarizes the parametric inputs used in this study. The range of glazed surfaces is defined based on their orientation, with the north-facing surface having greater extremes as it is not exposed to direct solar radiation. Following the ASHRAE code, the minimum and maximum values for window/wall ratio (WWR) are set to 10% and 40%, respectively [
22]. To achieve the zero-energy building target, renewable energy sources, such as PV panels, were added to the roof of the DOE prototype building. The insulation thickness of the base case is 14 cm and is increased to 16 and 18 cm, but ultimately, a thickness of 20 cm is chosen due to its minimal difference in results compared to the 16 cm thickness.
2.5. Evaluation of the best solutions for the future climate
In order to assess the validity of the best solutions obtained, it is essential to evaluate their performance under future climate conditions. To achieve this, the developed and calibrated models are subjected to simulation using current Typical Meteorological Year (TMY) tailored for the year 2099. These weather files are generated through the utilization of the WeatherShift Tool [
23], which takes into account climate change projections and incorporates them into the current TMY files. By employing TMY as a study parameter in the Honeybee and Grasshopper platforms, we can investigate how the identified optimal solutions perform in the face of potential climate variations expected in the distant future. This analysis is crucial as buildings and their energy systems are long-term investments, and their design should account for changing climatic conditions to ensure their sustainability and efficiency over time. Additionally, it allows us to make informed decisions about the suitability and reliability of these solutions in mitigating environmental impacts and addressing climate change challenges in the years to come.
3. Results and discussion
3.1. Parametric study results
After setting up the code and its variables, the Galapagos plug-in simulates 300 possible solutions. The results show the base case and solutions with minimal energy consumption for both optimization scenarios. Achieving negative GWP through the addition of renewable sources in Bombyx was not feasible without considering biogenic GWP. To satisfy the nZEB requirements, it was necessary to cover a percentage of the south wall surface with PV panels, as well, ranging from 25% (13.35 m
2) to 40% (21.37 m
2). The primary objective is to achieve climate neutrality, prompting the use of hemp shives as biogenic insulations. Adopting bio-based materials facilitated the achievement of the nZEB condition. Additionally, the approach led to solutions requiring fewer PV panels and larger windows, demonstrating the advantages of designing with biogenic materials. All the solutions in
Table 2 are nZEB.
The decision to choose between the two should not solely be based on energy and environmental analysis but also on cost, feasibility, and building appearance, which should be the subject of further research. As demonstrated in
Figure 7, bio-based materials significantly reduce the embodied equivalent carbon (i.e., green points) and using PV panel leads to lower operational equivalent carbon (i.e., red points).
3.2. Climate neutrality for the 21st century
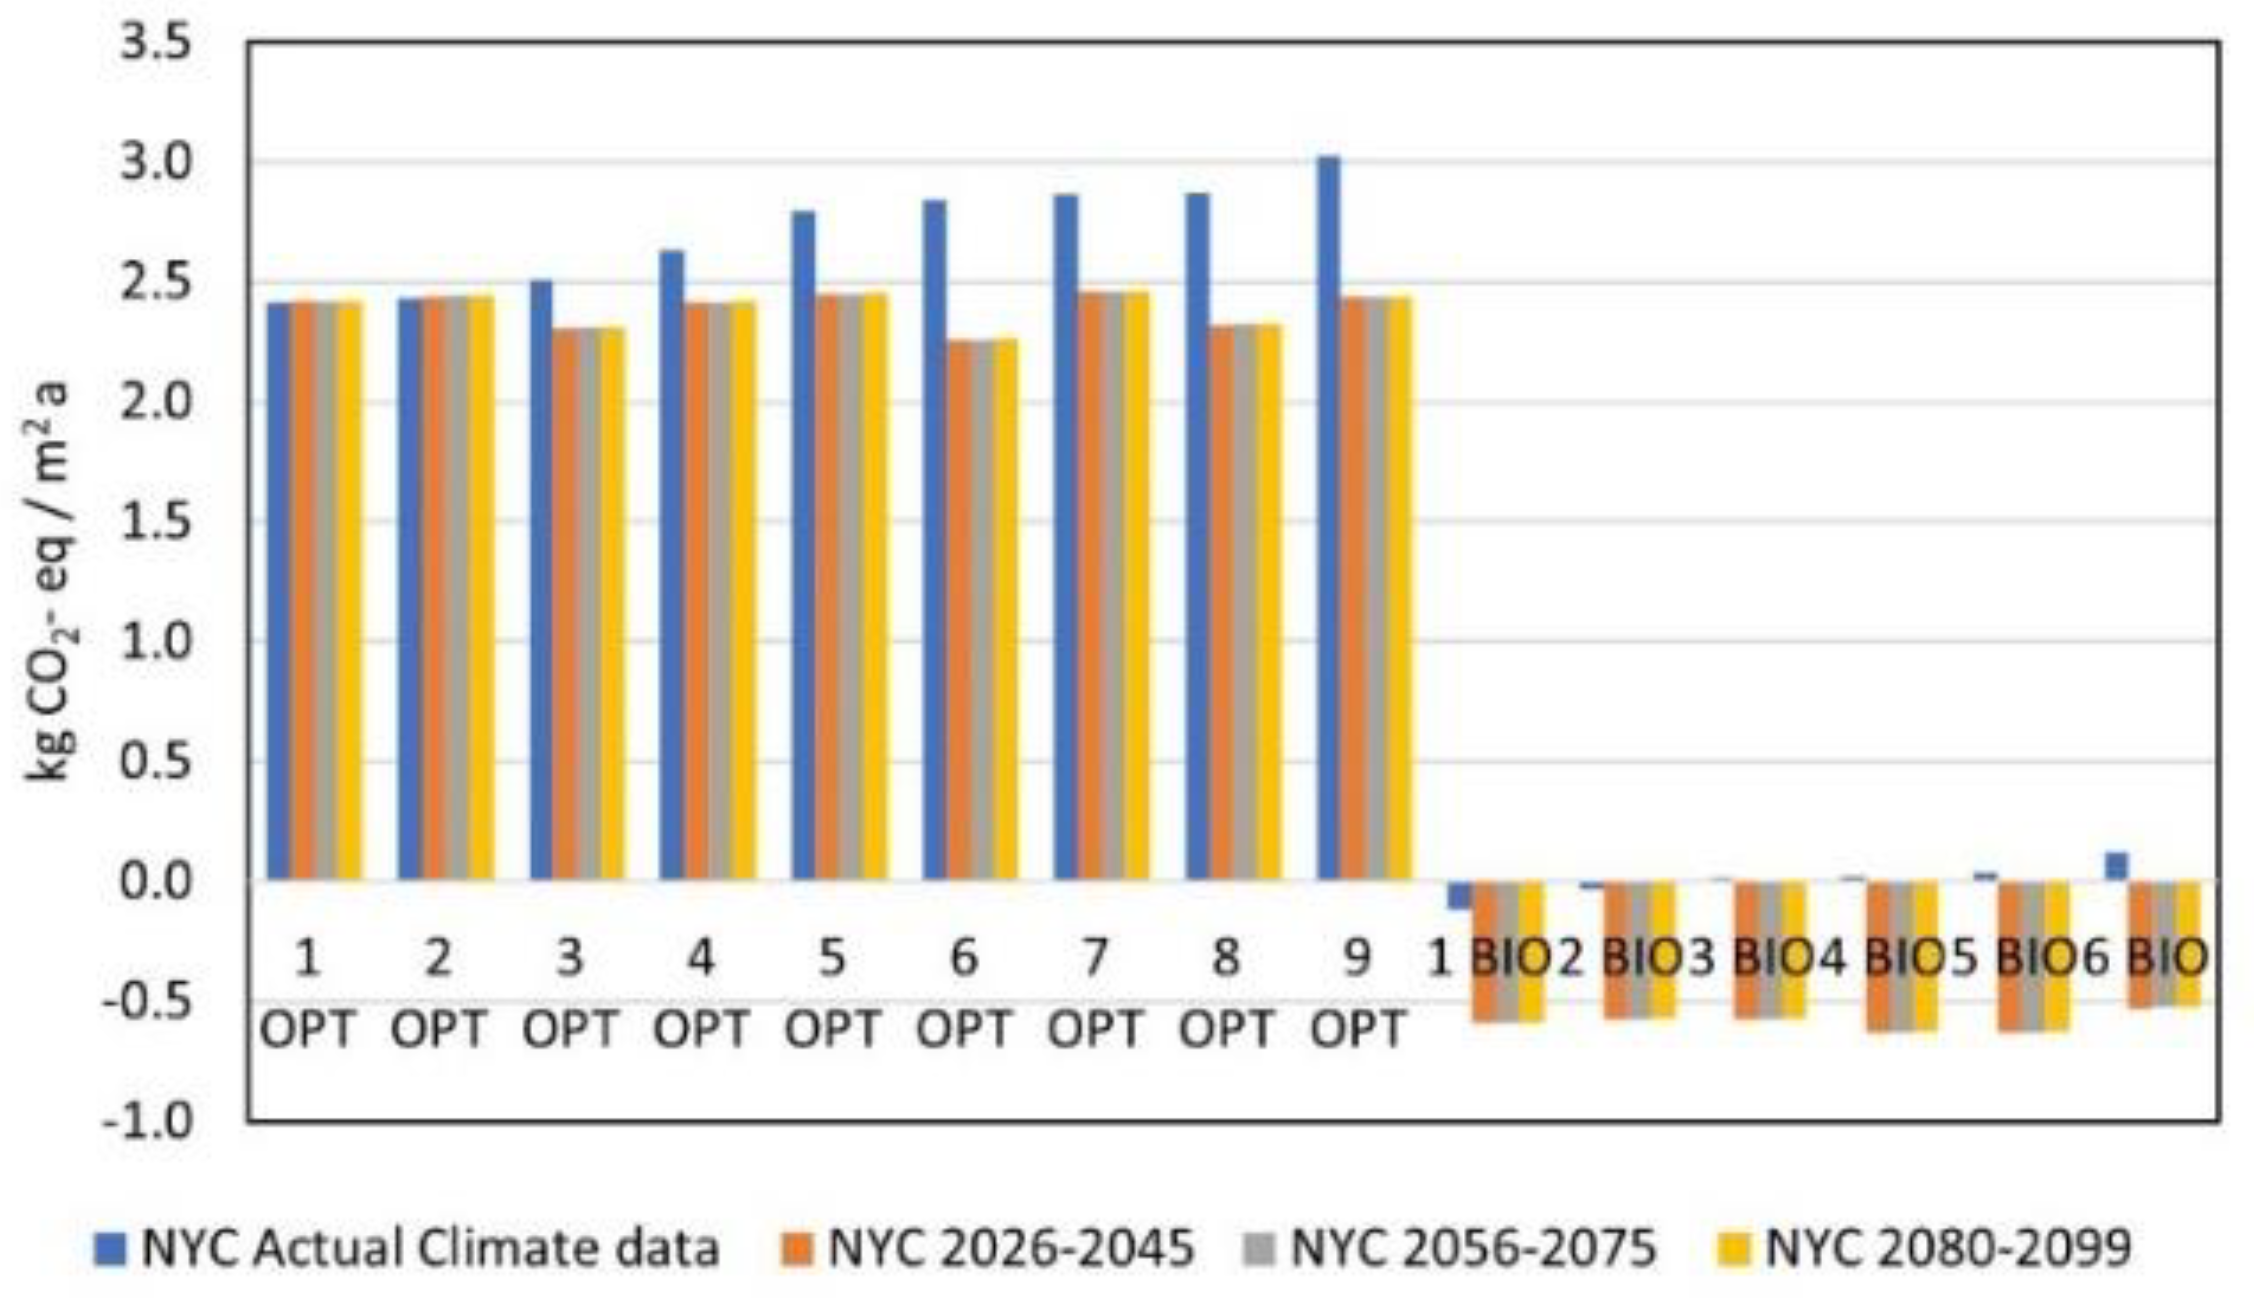
Using fTMY for three future periods (i.e., 2026-2045, 2056-2075, 2080-2099), the changes in the base case and optimal solutions throughout the 21st century are assessed, as depicted in
Figure 8. The observed rise in temperature and global irradiance results in increased power output from the PV panels, enabling the total energy demand to be met in the future. As a result, the nZEB BASE_BIO cases (with positive GWP values) are expected to achieve the Zero Energy Buidling (ZEB) condition in future scenarios. Although the tool effectively addresses the primary objectives, some areas still require further attention and future research. For instance, it is imperative to incorporate the emissions resulting from the life cycle of the structure, HVAC, or PV panels. Adding shading systems and doors could also improve the model’s accuracy. Because of the unavailability of the exact location of the building, the model has not accounted for transport emissions.
The first nine combinations that minimized whole lifecycle carbon emissions to achieve a net-zero target were analyzed from the 200 generated within the parametric integrated platform. All combinations had a glazing exposition ranging between 15-35% on the south facade and 10-15% on the north facade, and insulation thickness between 14-20 cm. Partial coverage of the south facade is required for all combinations, ranging between 35-40%. As shown in
Figure 8, none of the OPT combinations achieved absolute zero due to the carbon intensity of construction materials. However, all BIO combinations achieved nearly-LC carbon goals due to low emissions for bio-based insulation manufacturing and fast carbon CO
2 uptake during hemp regeneration in the crop. The evaluation of future climate scenarios showed that the overall carbon emission of the building is reduced for every combination except for OPT 1 and OPT 2, where high glazing exposition, conventional insulation EC, and PV panels increased energy demand and consequential OC for cooling. However, future climate scenarios only considered energy need estimation, ignoring the negative consequences of increased risk of extreme events and building vulnerability.
3.3. Strength and limitations
This study does not consider HVAC’s properties in the parametric study and instead focuses on building envelope embodied energy and its impact on operational energy. A critical factor in this study is the future climate data, and RCP 4.5 is assumed as representative scenario of future climate. The outcomes could be different under a different climate change scenario. The present case study does not consider transportation due to the unavailability of data concerning the type and quantity of means of transport used.
4. Conclusions
This paper presents a research effort that culminates in the development of a parametric tool to design Life Cycle Zero-Carbon Buildings (LC-ZCBs) with minimized operational carbon (OC) and embodied carbon (EC) throughout their lifecycle. By defining and implementing critical parameters, such as geometry, construction technology, envelope thermal resistance, and on-site renewable energy production, into the Grasshopper platform, the tool provides a versatile and effective means of achieving carbon neutrality in buildings. The validation of this tool using a prototype residential building demonstrates its accuracy, with the CV-RMSE staying consistently below the 15% limit.
The study undertakes a comparative analysis of two distinct building envelope options: the conventional timber frame and insulation (OPT) versus the bio-based hemp shives and fiber insulation (BIO). The results underscore the limitations of conventional materials, as none of the OPT combinations could achieve absolute zero carbon emissions, primarily due to the carbon-intensive nature of these construction materials. However, in stark contrast, the implementation of bio-based insulation materials in all BIO combinations led to the realization of a LC carbon goal, signifying the efficacy of sustainable alternatives in promoting carbon-neutral construction.
Nevertheless, the research acknowledges the influence of future climate scenarios on building performance. While the study offers valuable insights into the potential impact of climate projections on energy needs, it also highlights the need to consider additional factors such as increased risks of extreme events and the building vulnerability to such conditions. A more comprehensive approach to climate resilience should be pursued in future investigations to create buildings that not only minimize carbon emissions but also withstand and adapt to changing climate patterns.
In conclusion, the development of a parametric design tool for LC-ZCBs marks a significant advancement in the construction industry journey towards sustainability. By optimizing both operational and embodied carbon, the tool sets a new standard for environmentally conscious building design. The positive results achieved through the implementation of bio-based insulation materials emphasize their potential in driving the transformation towards net-zero carbon buildings. As the field of sustainable construction continues to evolve, future research should explore the integration of other eco-friendly materials and innovative design strategies to further advance the construction sector’s contributions to global decarbonization goals. By embracing such advancements and promoting interdisciplinary collaboration, we can collectively pave the way for a greener, more sustainable future.
Author Contributions
Conceptualization, E.K., F.P. and G.I.; methodology, F.P and E.K.; software, L.M.D.V. and P.S.; validation, L.M.D.V. and P.S.; formal analysis, L.M.D.V. and P.S.; investigation, L.M.D.V. and P.S.; resources, F.P., E.K. and G.I.; data curation, F.P. and E.K.; writing—original draft preparation, L.M.D.V. and P.S.; writing—review and editing, E.K., F.P. and G.I.; visualization, L.M.D.V., P.S. and F.P.; supervision, E.K. and F.P; project administration, E.K. and G.I.; funding acquisition, G.I. and E.K.. All authors have read and agreed to the published version of the manuscript.
Funding
This research was funded by the EU Programme Erasmus+, under the Action KA107 - International Credit Mobility (ICM).
Data Availability Statement
The data presented in this study are available on request from the corresponding author.
Conflicts of Interest
The authors declare no conflicts of interest. The funders had no role in the design of the study; in the collection, analyses, or interpretation of data; in the writing of the manuscript; or in the decision to publish the results.
Nomenclatures
BC: Biogenic Carbon
CC: CO2 storage in biobased product
CDD: Cooling Degree Days
DOE: U.S. Department of Energy
DLCA: Dynamic LCA
EC: Embodied Carbon
EF: Emission Factor
EPD: Environmental Product Declaration
EPBD: Energy Performance of Buildings Directive
EPW: EnergyPlus weather
FC: Fossil Carbon
GWP: Global Warming Potential
GWPbio: Biogenic Global Warming Potential
HDD: Heating Degree Days
HVAC: Heating, Ventilation, and Air Conditioning
IECC: International Energy Conservation Code
LCA: Life Cycle Assessment
LCIA: Life Cycle Impact Assessment
LC-CFA: Life Cycle Carbon Footprint Assessment
LC-ZCB: Life Cycle Zero-Carbon Building
LOD: Levels of Detail
nZEB: nearly Zero-Energy Building
OC: Operational Carbon
pLCA: parametric LCA
PV_ Photovoltaic
RSL: Reference Service Life
RSP: Reference Study Period
SHGC: Solar Heat Gain Coefficient
TMY: Typical Meteorological Year
VT: Visible Transmittance
WWR: Window/Wall Ration
ZEB: Zero Energy Building
Appendix A
Bio-based materials can help decrease GHG emissions by capturing and storing CO
2. More precisely, the biomass is stored in the anthroposphere as a harvested product (e.g. solid wood), while the carbon sequestration happens in the biomass that is regrowing through photosynthesis, reducing the atmospheric carbon dioxide [
23]. To take into account this biogenic CO
2 deposit in the anthroposphere, the method [
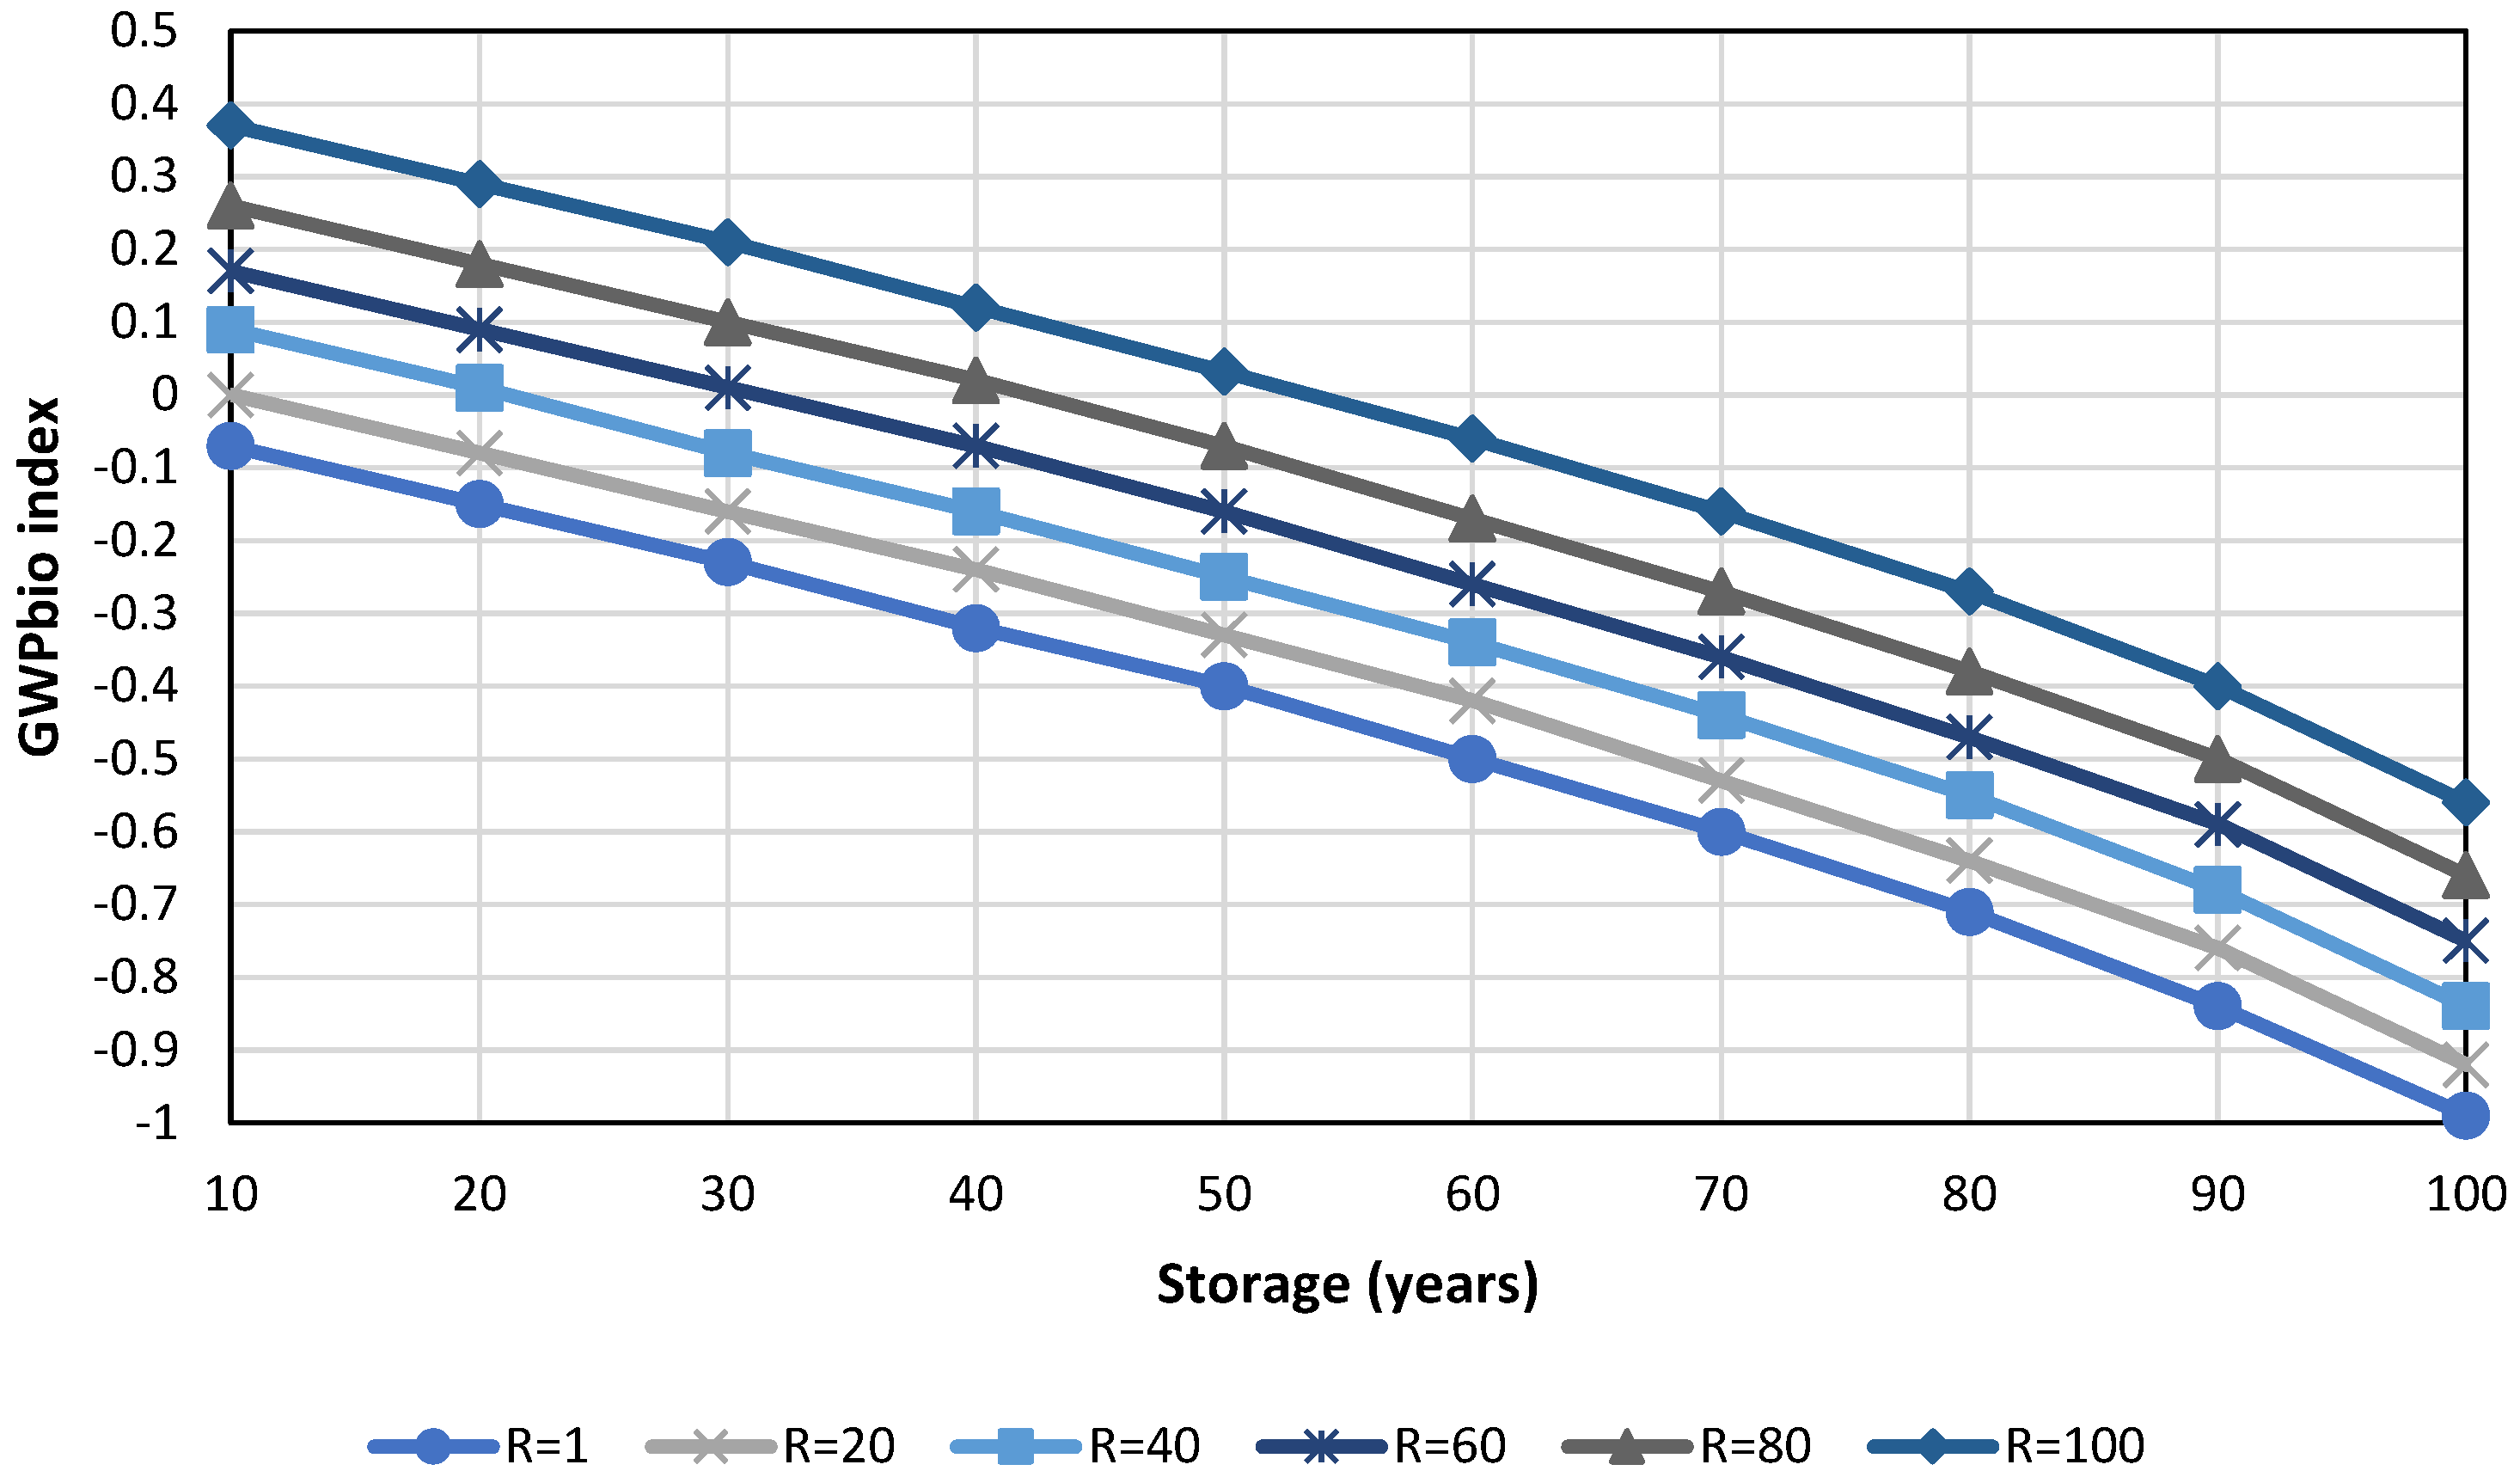
24] illustrated in the Figure A.1 is used, which includes a GWPbio index to consider the benefits of biogenic carbon over a 100-year time horizon. The method incorporates the interface between biomass growth and global carbon cycle emissions. As can be seen, the rotation and retention periods vary from 0 to 100 years, while the time horizon is set at 100 years. Furthermore, the GWPbio index decreases with the increase in the storage period and with smaller rotation periods. Hence, to absorb the same amount of carbon that is stored in biogenic products, fast growing plants need a shorter time than slow growing ones, resulting in a more beneficial effect on GWP.
Figure A.1.
The biogenic global warming potential (GWPbio) factor values for six rotation periods (R) as a function of the storage period (S), calculated for 100-year time horizon (TH). Edited from Guest et al. [
10].
Figure A.1.
The biogenic global warming potential (GWPbio) factor values for six rotation periods (R) as a function of the storage period (S), calculated for 100-year time horizon (TH). Edited from Guest et al. [
10].
The CO
2 storage of the new bio-based compounds (CC) can be determined [
25] according to the following equation A.E.1:
where
ρ0 is the dry density of the material;
C is the percentage of carbon content;
BC is the percentage biomass content of the finished compound;
3.67 is the molar weight ratio between CO2 and C.
Subsequently, by multiplying the carbon storage with the GWPbio index defined above, the absorbed carbon is obtained by the following equation A.E.2:
Finally, the Net-GWP of construction materials is assumed as the sum of the GWP at 100 years, calculated according to the IPCC 2013 method, and the related biogenic GWP, also referred to as the carbon footprint, as obtained by the equation A.E.3:
where
Appendix B
Non-bio-based materials have no carbon deposition or absorption, so their net values are always positive. On the contrary, every bio-based material has a storage potential and also depends on carbon emissions for its production or transport; their net values can be positive, however much lower than conventional ones, or even better negative.
The last factor to be defined is the dry density of the material ρ
0 [
26].
For a water content of ≤25%, the following equation B.E.1 is assumed:
While for a water content> 25% is expressed by the following equation B.E.2:
where
Appendix C
The building is equipped with an electric boiler for domestic hot water (DHW). The heating and cooling system (Table C.1) is located in the attic, using the same circuit for both systems. Other equipment includes fans (Table C.2) and pumps for domestic water. Table C.3 reports the miscellaneous equipment nominal capacity. The overall R-Values of the envelope components and their construction layers’ physical and thermal properties are reported in Table C.4.
Table C.1.
Heating pump coils’ specifications.
Table C.1.
Heating pump coils’ specifications.
| |
Capacity at Peaks (W) |
Nominal Efficiency |
| Main Heating Coil |
5547.18 |
3.69 |
| Cooling Coil |
5232.20 |
4.07 |
| Supp Heating Coil |
6737.66 |
1.00 |
Table C.2.
Fans’ specifications.
Table C.2.
Fans’ specifications.
| |
Pressure (Pa) |
Air Flow (m3/s) |
Input (W) |
Efficiency |
| Exhaust air fan |
227 |
0.03 |
82.6 |
0.6 |
| Fresh air fan |
400 |
0.27 |
146.8 |
0.5 |
Table C.3.
Electric miscellaneous equipment nominal capacity.
Table C.3.
Electric miscellaneous equipment nominal capacity.
| |
Nominal Capacity (W) |
| Washing machine |
28.47 |
| Dishwasher |
65.70 |
| Electric burner |
248.10 |
| Electric dryer |
213.06 |
| Refrigerator |
91.05 |
| Television |
130.00 |
Table C.4.
Total R-Value of building envelope components and their construction layers’ physical and thermal properties.
Table C.4.
Total R-Value of building envelope components and their construction layers’ physical and thermal properties.
| |
Layer Name |
Thickness (m) |
Conductivity (W/m.K) |
Density (kg/m3) |
Specific Heat(J/kg.K)
|
Thermal Resistance (m2.K/W) |
| Exterior_Wall |
Syn_stucco |
0.003 |
0.087 |
2775.0 |
878.64 |
0.0352 |
| Sheating_consol_layer |
0.031 |
0.035 |
20.1 |
1465.42 |
0.8807 |
| OSB_7/16in |
0.011 |
0.116 |
544.6 |
1213.36 |
0.0956 |
| Wall_consol_layer |
0.140 |
0.057 |
120.8 |
1036.26 |
2.4438 |
| Drywall_1/2in |
0.013 |
0.160 |
800.9 |
1087.84 |
0.0793 |
| |
|
0.198 |
0.455 |
|
5681.51 |
3.535 |
| Gable_end |
Cement_stucco |
0.019 |
0.721 |
2775.0 |
878.64 |
0.0264 |
| Bldg_paper_felt |
|
|
|
|
0.011 |
| OSB_5/8in |
0.016 |
0.116 |
544.6 |
1213.36 |
0.1365 |
| Air_4_in_vert |
|
|
|
|
0.158 |
| Drywall_1/2in |
0.013 |
0.160 |
800.9 |
1087.84 |
0.0793 |
| |
|
0.013 |
0.160 |
|
1087.84 |
0.411 |
| Basement_Floor |
Carpet_n_pad |
0.025 |
0.060 |
32.0 |
836.80 |
0.0015 |
| Plywood_3/4in |
0.019 |
0.115 |
544.7 |
674.54 |
0.0022 |
| Floor_consol_layer |
0.000 |
12.990 |
55.1 |
916.93 |
0.0000 |
| R_high |
|
|
|
|
177.0000 |
| Soil_12in |
0.305 |
1.731 |
1842.3 |
232.60 |
0.1761 |
| |
|
0.350 |
14.896 |
|
2660.87 |
177.180 |
| Roof |
Asphalt_shingle |
0.006 |
0.082 |
1121.3 |
1255.20 |
0.0774 |
| OSB_1/2in |
0.013 |
0.116 |
544.6 |
1213.36 |
0.1092 |
| Ceil_consol_layer |
0.444 |
0.062 |
41.9 |
776.25 |
7.2015 |
| Drywall_1/2in |
0.013 |
0.160 |
800.9 |
1087.84 |
0.0793 |
| |
|
0.476 |
0.420 |
|
4332.651 |
7.468 |
| Int_Floor |
Plywood_3/4in |
0.019 |
0.115 |
544.7 |
674.54 |
0.1650 |
| Carpet_n_pad |
0.025 |
0.060 |
32.0 |
836.80 |
0.4224 |
| Ceil_consol_layer |
0.444 |
0.062 |
41.9 |
776.25 |
7.2015 |
| Drywall_1/2in |
0.013 |
0.160 |
800.9 |
1087.84 |
0.0793 |
| |
|
0.457 |
0.222 |
|
1864.09 |
7.281 |
| Attic_floor |
Plywood_3/4in |
0.019 |
0.115 |
544.7 |
674.54 |
0.1650 |
| Carpet_n_pad |
0.025 |
0.060 |
32.0 |
836.80 |
0.4224 |
| Ceil_consol_layer |
0.444 |
0.062 |
41.9 |
776.25 |
7.2015 |
| Drywall_1/2in |
0.013 |
0.160 |
800.9 |
1087.84 |
0.0793 |
| |
|
0.457 |
0.222 |
|
1864.09 |
7.281 |
References
- IEA, “Global energy and process emissions from buildings, including embodied emissions from new construction, 2021,” Sep. 22, 2022. https://www.iea.org/data-and-statistics/charts/global-energy-and-process-emissions-from-buildings-including-embodied-emissions-from-new-construction-2021 (accessed Sep. 27, 2022).
- US Department of Energy, “Building Technologies Program: Planned Program Activities for 2008-2012,” pp. 1–4, 2008.
- M. Röck et al., “Embodied GHG emissions of buildings – The hidden challenge for effective climate change mitigation,” Appl Energy, vol. 258, Jan. 2020. [CrossRef]
- Passer, G. Fischer, Franz, P. J. Sölkner, and S. Spaun, “Innovative building technologies and technical equipment towards sustainable construction – a comparative LCA and LCC assessment Short Summary,” Sustainable Built Environment Conference 2016 in Hamburg Strategies, Stakeholders, Success factors, no. April, pp. 716–725, 2016. [CrossRef]
- Habert et al., “Carbon budgets for buildings: harmonising temporal, spatial and sectoral dimensions”. [CrossRef]
- T. Ibn-Mohammed, R. Greenough, S. Taylor, L. Ozawa-Meida, and A. Acquaye, “Operational vs. embodied emissions in buildings - A review of current trends,” Energy Build, vol. 66, pp. 232–245, 2013. [CrossRef]
- L. Gustavsson, P. Börjesson, B. Johansson, and P. Svenningsson, “Reducing CO2 emissions by substituting biomass for fossil fuels,” Energy, vol. 20, no. 11, pp. 1097–1113, 1995. [CrossRef]
- F. Pittau, F. Krause, G. Lumia, and G. Habert, “Fast-growing bio-based materials as an opportunity for storing carbon in exterior walls,” Build Environ, vol. 129, pp. 117–129, 2018. [CrossRef]
- F. Cherubini, G. P. Peters, T. Berntsen, A. H. Strømman, and E. Hertwich, “CO2 emissions from biomass combustion for bioenergy: Atmospheric decay and contribution to global warming,” GCB Bioenergy, vol. 3, no. 5, pp. 413–426, 2011. [CrossRef]
- G. Guest, F. Cherubini, and A. H. Strømman, “The role of forest residues in the accounting for the global warming potential of bioenergy,” GCB Bioenergy, vol. 5, no. 4, pp. 459–466, 2013. [CrossRef]
- A. Levasseur, P. Lesage, M. Margni, and R. Samson, “Biogenic Carbon and Temporary Storage Addressed with Dynamic Life Cycle Assessment,” J Ind Ecol, vol. 17, no. 1, pp. 117–128, 2013. [CrossRef]
- E. Hoxha et al., “Biogenic carbon in buildings: a critical overview of LCA methods,” Buildings and Cities, vol. 1, no. 1, pp. 504–524, 2020. [CrossRef]
- F. Pittau, G. Iannaccone, G. Lumia, and G. Habert, “Towards a model for circular renovation of the existing building stock: A preliminary study on the potential for CO2 reduction of bio-based insulation materials,” IOP Conf Ser Earth Environ Sci, vol. 323, no. 1, 2019. [CrossRef]
- A. C. Paulson, “Designing To Reduce Construction Costs,” ASCE J Constr Div, vol. 102, no. 4. pp. 587–592, 1976. [CrossRef]
- S. Basic, A. Hollberg, A. Galimshina, and G. Habert, “A design integrated parametric tool for real-time Life Cycle Assessment - Bombyx project,” IOP Conf Ser Earth Environ Sci, vol. 323, no. 1, Sep. 2019. [CrossRef]
- S. Basic, A. Hollberg, A. Galimshina, and G. Habert, “A design integrated parametric tool for real-time Life Cycle Assessment - Bombyx project,” IOP Conf Ser Earth Environ Sci, vol. 323, no. 1, Sep. 2019. [CrossRef]
- A. Hollberg and J. Ruth, “LCA in architectural design—a parametric approach,” The International Journal of Life Cycle Assessment 2016 21:7, vol. 21, no. 7, pp. 943–960, Feb. 2016. [CrossRef]
- Galimshina, “BOMBYX A: A design-integrated parametric tool for real-time Life Cycle Assessment,” 2020.
- “Prototype Building Models | Building Energy Codes Program.”.
- SYGREN, “Systemkennwerte Graue Energie Gebäudetechnik,” 2021.
- ASHRAE, “Measurement of Energy, Demand, and Water Savings,” ASHRAE Guideline 14-2014, vol. 4, pp. 1–150, 2014.
- “BUILDING ENERGY CODES PROGRAM www.energycodes.gov BUILDING ENERGY CODES PROGRAM,” 2017.
- Carcassi, G. Habert, L. E. Malighetti, and F. Pittau, “Material diets for Climate-Neutral Buildings.”.
- G. Guest, F. Cherubini, and A. H. Strømman, “Global Warming Potential of Carbon Dioxide Emissions from Biomass Stored in the Anthroposphere and Used for Bioenergy at End of Life”. [CrossRef]
- Carcassi, P. Minotti, G. Habert, I. Paoletti, S. Claude, and F. Pittau, “Carbon Footprint Assessment of a Novel Bio-Based Composite for Building Insulation,” Sustainability (Switzerland), vol. 14, no. 3, 2022. [CrossRef]
- CEN/TC175, “Wood and wood-based products — Calculation of sequestration of atmospheric carbon dioxide,” vol. CEN/TC 124, no. 1130, pp. 0–7, 2012.
|
Disclaimer/Publisher’s Note: The statements, opinions and data contained in all publications are solely those of the individual author(s) and contributor(s) and not of MDPI and/or the editor(s). MDPI and/or the editor(s) disclaim responsibility for any injury to people or property resulting from any ideas, methods, instructions or products referred to in the content. |
© 2024 by the authors. Licensee MDPI, Basel, Switzerland. This article is an open access article distributed under the terms and conditions of the Creative Commons Attribution (CC BY) license (http://creativecommons.org/licenses/by/4.0/).
