1. Introduction
Breast cancer represents the most common neoplasm worldwide, with an incidence of 11.7%, followed by lung cancer with an incidence of 11.4%, and the most frequent in women, representing 25.4% of all types of cancer [
1]. In 2020, 2.3 million women were diagnosed with breast cancer, with a mortality rate of 685,000 worldwide [
2]. According to data from INCA (National Cancer Institute), in 2022, Brazil had an incidence of 73,610 cases of this type of cancer, and 17,825 of associated deaths [
3]. There are two types of classification for breast cancer, histological (
in situ or invasive ductal carcinoma and
in situ or invasive lobular carcinoma) and molecular (Luminal A or B, super HER 2 and triple-negative ) [
4].
The relationship between hereditary genetic factors and the etiology of breast cancer has already been established. However, this cancer is also associated with several environmental and behavioral factors, such as prolonged exposure to estrogen due to early menarche, nulliparity, late menopause, exposure to high doses of ionizing radiation, regular consumption of alcohol, and a diet rich in fat [
5]. In addition to these factors, viral infections are also associated with breast carcinogenesis, including those caused by oncoviruses, between them are the high-risk human papillomaviruses (hr-HPVs) [
6]. The carcinogenesis process of several types of cancer, including cervical, anal, vulvar, vaginal, penile, and oropharyngeal, are associated with hr-HPVs persistent infections [
7].
HPV has already been detected in several types of non-anogenital cancer, such as oropharyngeal, head, neck, lung, and breast cancer [
8]. To date, nine types of HPVs (6, 11, 16, 18, 31, 33, 35, 45, and 52) have been identified in breast tumor samples from different populations of the world [
5,
9]. There are three hypothesized pathways by which HPV would reach the breast tissue, (I) through oral sexual practices and microlesions in the skin of the breast or nipple, (II) through the blood in patients with cervical cancer, or (III) by metastasis, a possible secondary malignant transformation derived from a primary tumor in another organ [
5].
Despite the established relationship between HPV and cervical cancer, the possible connection between this infectious agent and other types of cancer, such as breast, still needs more studies. Recently, it has been observed that HPV infection may contribute to chemoresistance in breast cancer through genes involved in cellular apoptosis [
10]. Additionally, it was observed,
in vitro, a remodeling of the environment after HPV infection and the cells inserted in it, providing a post-infection microenvironment (PIM) with immunosuppressive characteristics, leading to viral persistence and possible neoplastic development [
11]. In addition, the array of surrounding immune cells, blood vessels, extracellular matrix, fibroblasts, bone marrow-derived inflammatory cells, and signaling molecules such as members from the interleukin family, which are part of the tumor microenvironment can affect cancer progression and development [
12,
13].
In this sense, the definition of the immune microenvironment, based on gene expression and the study of the immune response mechanism against the tumor, can provide important information about cancer development, the degrees of progression, and possible targets for immunotherapy strategies [
14]. In this study, considering that HPV can alter the tumor microenvironment and has already been detected in breast tumors , we investigated possible changes in breast adenocarcinoma cell lines transfected with HPV oncogenes and the role of immune cells in response to this target
in vitro.
2. Materials and Methods
2.1. Cell lineage
The MDA-MB-231 cell line (ATCC HTB-26) is a human breast cancer epithelial cell line. It is a cell derived from the metastasis of a mammary adenocarcinoma, triple negative. MDA-MB-231 has the following phenotype: CD44+CD24-/low. MDA-MB-231. The cells were cultured at 37◦C in Dulbecco's Modified Eagle's Medium (DMEM-Invitrogen®) plus 10% fetal bovine serum (Gibco®); 1% L-Glutamine (Sigma®) - Complete DMEM - and passed through the priming process until reaching 70-80% confluence.
2.2. Isolation of peripheral blood mononuclear cells (PBMC)
About 8-10 mL of peripheral blood was collected in an EDTA tube from 5 healthy volunteer donors between 24 and 45 years, 2 men, and 3 women, which did not present recent (a month before the blood collection) infection (such as respiratory syndromes, hepatic or gastrointestinal compromise), metabolic syndromes or cancer. Peripheral blood mononuclear cells (PBMCs) were isolated from blood using a 1.077 g/mL Ficoll solution (300 xg / 30min / 26°C) (GE Healthcare ®). After two washes with 1X PBS, the cells were resuspended in Dulbecco's Modified Eagle's Medium (DMEM-Invitrogen®) with 10% fetal bovine serum (Gibco®) added, 1% L-Glutamine (Sigma®) and antibiotics. Cells obtained from each volunteer were cultured in 75 cm2 culture flasks (24 hours / 5% CO2 / 37°C). In the next day, the suspended lymphocytes were centrifuged in PBS 1X (200 x g /10 min) and counted using the Countess 3 cell counter (Thermo Fisher ®). From the same culture flask, the adhered macrophages were removed with the aid of 2% trypsin, followed by centrifugation with 1X PBS (200 x g /10 min) and counted (Countess 3 / Thermo Fisher ®). Lymphocytes and macrophages were plated (48-well plates / 105 cells/well) in different cell culture schemes (see item 2.4).
2.3. Production and transfection of HPV oncoproteins
The E5, E6, and E7 wild-type oncogene sequences (unaltered reference gene sequence) of HPV16, based on the sequence deposited in GenBank (K02718.1), were cloned using the expression vector for mammalian cells, pCDNA 3.1 (+) - Invitogen®. Clones were confirmed by restriction analysis and sequenced using the ABI PRISM BigDyeTM Terminator v3.1 ReadyReaction cycle sequencing kit (Applied Biosystems ®) in the ABI Prism 3100 automated DNA sequencer (Applied Biosystem ®). After the cloning confirmation, the DNA of recombinant vectors was isolated by the Plus Maxi kit (Qiagen) according to the manufacturer’s instructions
2.4. Transfection of HPV oncoproteins
In 48-well cell culture plates about 10
5 tumor cells (MDA-MB-231) in each well were seeded in 1 mL of Dulbecco’s Modified Eagle’s Medium (DMEM-Invitogen®) plus 10% foetal bovine serum (Gibco ®); 1% L-Glutamine (Sigma ®) - Complete DMEM. These tumor cells were transfected with 250 ng/ul of empty pcDNA 3.1 (+) vector, pcDNA-E5, pcDNA-E6, or pcDNA-E7 separately using Lipofectamine 3000 transfection reagent (Thermo Fisher) following the protocol recommended by the manufacturer. Cells were incubated at 37ºC in a 5% CO2 incubator for 24h. Subsequently, RNA was extracted from cells of those pellets using the PureLink
TM RNA Mini Kit (Invitogen®) and used to confirm the efficiency of transfection of the E5, E6, and E7 by RT-qPCR. All reactions were performed in a LineGene9660 (Bioer) thermos cycler, using SYBR green with GoTaq qPCR Master Mix (Promega) as a detection system and specific primers for E5 (Forwad: ACT GGC GTG CTT TTT GCT TTG and Reverse: GAC ACA GAC AAA AGC AGC GG), E6 ( Forward: GAG AAA CTG CAA TGT TTC AGG ACC and Reverse: TGT ATA GTT GTT TGC AGC TCT GTG C) and E7 (Forwad: AGC TCA GAG GAG GAG GAT GA and Reverse: GAG AAC AGA TGG GGC ACA CA). To calculate the relative expression of the target genes, they were analyzed together with the reference genes ACTB (Forwad: AAGAGAGGCATCCTCACCCT and Reverse: TACATGGCTGGGGTGTTGAA) and GAPDH (Forwad: GAAGGTGGGGCTCATTTG and Reverse: TTAAAAGCAGCCCTGGTG). The 2
ΔΔcq was calculated to analyze the expression of each oncogene in comparison with the endogenous genes (ACTB and GAPDH), as well as it was compared with the expression of the oncogenes in the C3 cell line (HPV16 positive uterine cervix cell) [
15]. The Cq values greater than 35 or those that did not present an amplification value, were excluded from the following analysis steps.
2.5. In vitro stimulation of PBMC
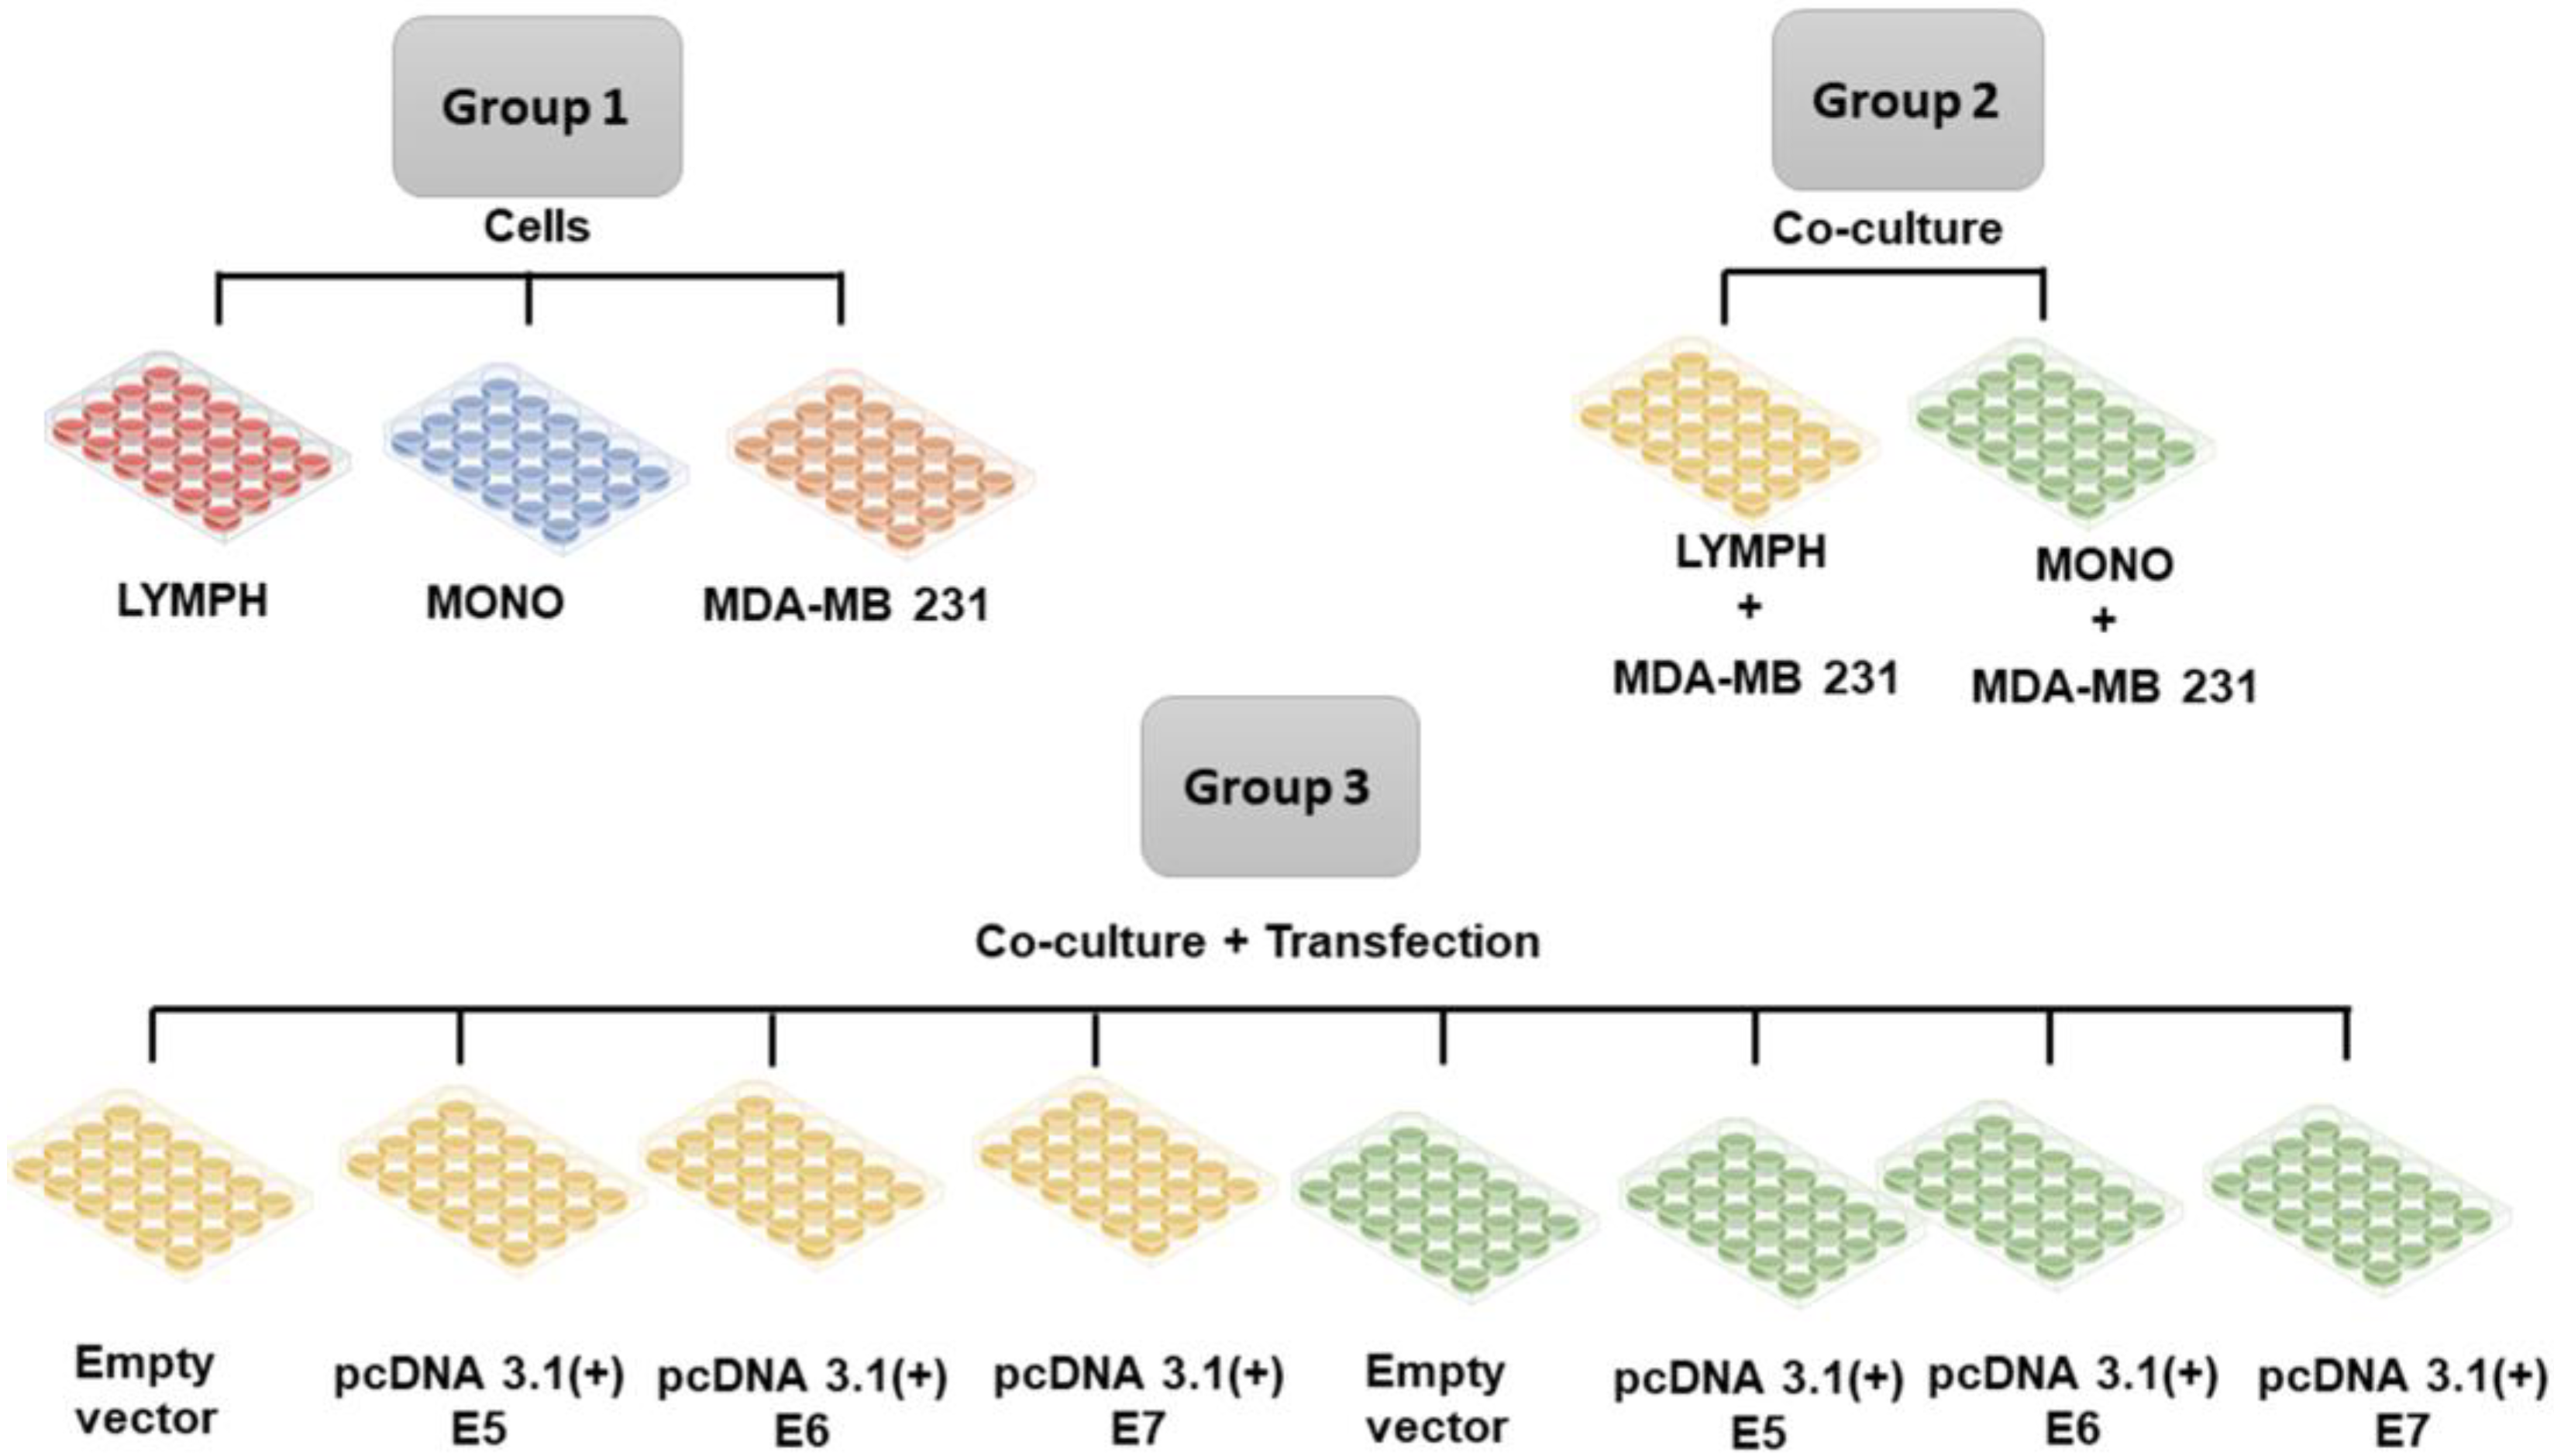
When the transfected cells (as described in the previous section) reached 80% confluence, lymphocytes or macrophages were inserted into the cultures to investigate the immune stimulus. Lymphocytes and macrophages obtained, as described before (item 2.2), were cultured separately in 48-well plates, previously seeded with tumor cells using the cell culture schemes described in Figure 1. The cultured cells were maintained for 24 hours under the stimulus of the tumor cells and after this period the immune cells were collected and marked for immunophenotyping, and the supernatants of the cultures were stored for cytokine investigation.
Figure 1.
Group 1. Lymphocytes (LYMPH), monocytes (MONO), MDA-MB-231 cells; Group 2 MDA-MB-231 cells co-cultured with lymphocytes (LYMPH+MDA), MDA-MB-231 cells co-cultured with monocytes (MONO+MDA); Group 3 LYMPH+MDA cultured with pcDNA 3.1 (empty vector), LYMPH+MDA transfected with the E5 oncogene, LYMPH+MDA transfected with the E6 oncogene, LYMPH+MDA transfected with the E7 oncogene, MONO+MDA cultured with empty vector, MONO+MDA transfected with the E5 oncogene, MONO+MDA transfected with the E6 oncogene, MONO+MDA transfected with the E7 oncogene.
2.6. Immunophenotyping of PBMCs stimulated in vitro with tumor cells and investigation of the cytokines produced in the culture supernatant.
The immunophenotyping assay was conducted in vitro to investigate the immune response induced by tumor cells in PBMC, through anti-CD3 (FITC or APC), -CD4 (FITC or APC), -CD8 (FITC or PE) surface antibodies, -CD56 (PEcy5.5 or APC), -CD25 (PercP), -CD14 (FITC), -B7.1 (PE), -B7.2 (APC), -HLA-DR (PercP). Intracellular antibodies anti-FoxP3 (PE), -perforin (FITC), granzyme (PercP), -IL-17 (PE), -IFN (APC), and IL-10 (PE) were also used. For specific identification of the MDA-MB 231 lineage, the anti-CD44 antibody was used (all antibodies were from BD ®). The cytokines IL-2, IL-4, IL-6, IL-10, TNF-α, IFN-α, and IL-17 were investigated using the CBA kit (BD ®) from the culture supernatant. All acquisitions were performed using flow cytometry (Accuri BD ®), and 30000 events in the P1 region (lymphocytes or monocytes gates) for cellular investigation and 2100 events for humoral investigation through cytokine production in experimental groups. Analyses were performed using the Accuri cytometry platform.
2.7. Statistical analysis
Data distribution was verified using the Kolmogorov-Smirnov test. All samples that adopted a normal distribution were used for this purpose and the Ordinary One-way ANOVA test was performed for. A p-value < 0.05 was considered statistically significant. All statistical analyses were performed using GraphPad Prism software version 9.0.0 (GraphPad Software, Inc. San Diego, CA, USA).
4. Discussion
Usually, the main tumor-infiltrating immune cells isolated from breast cancer are CD4
+ and CD8
+ T cells, in addition to B cells and tumor-associated macrophages. Otherwise, eosinophils, monocytes, and natural killer (NK) inactive cells are present in smaller amounts in the microenvironment of breast tumor. In general, CD4
+ T helper 1 (Th1) cells, CD8
+ cytotoxic T cells, NK cells, and M1 macrophages have a protective activity against tumor development, whereas Treg, CD4
+ T cells (Th2), and M2 macrophages can promote tumor growth [
16]. Studies indicate that in the presence of HPV, there is a decrease of immune cells in the tumor microenvironment due to the immune evasion mechanism that is activated by HPV oncoproteins [
17,
18].
In most breast tumors there is a low infiltration of T cells. However, in triple-negative breast tumors, a high number of tumor-infiltrating lymphocytes is observed [
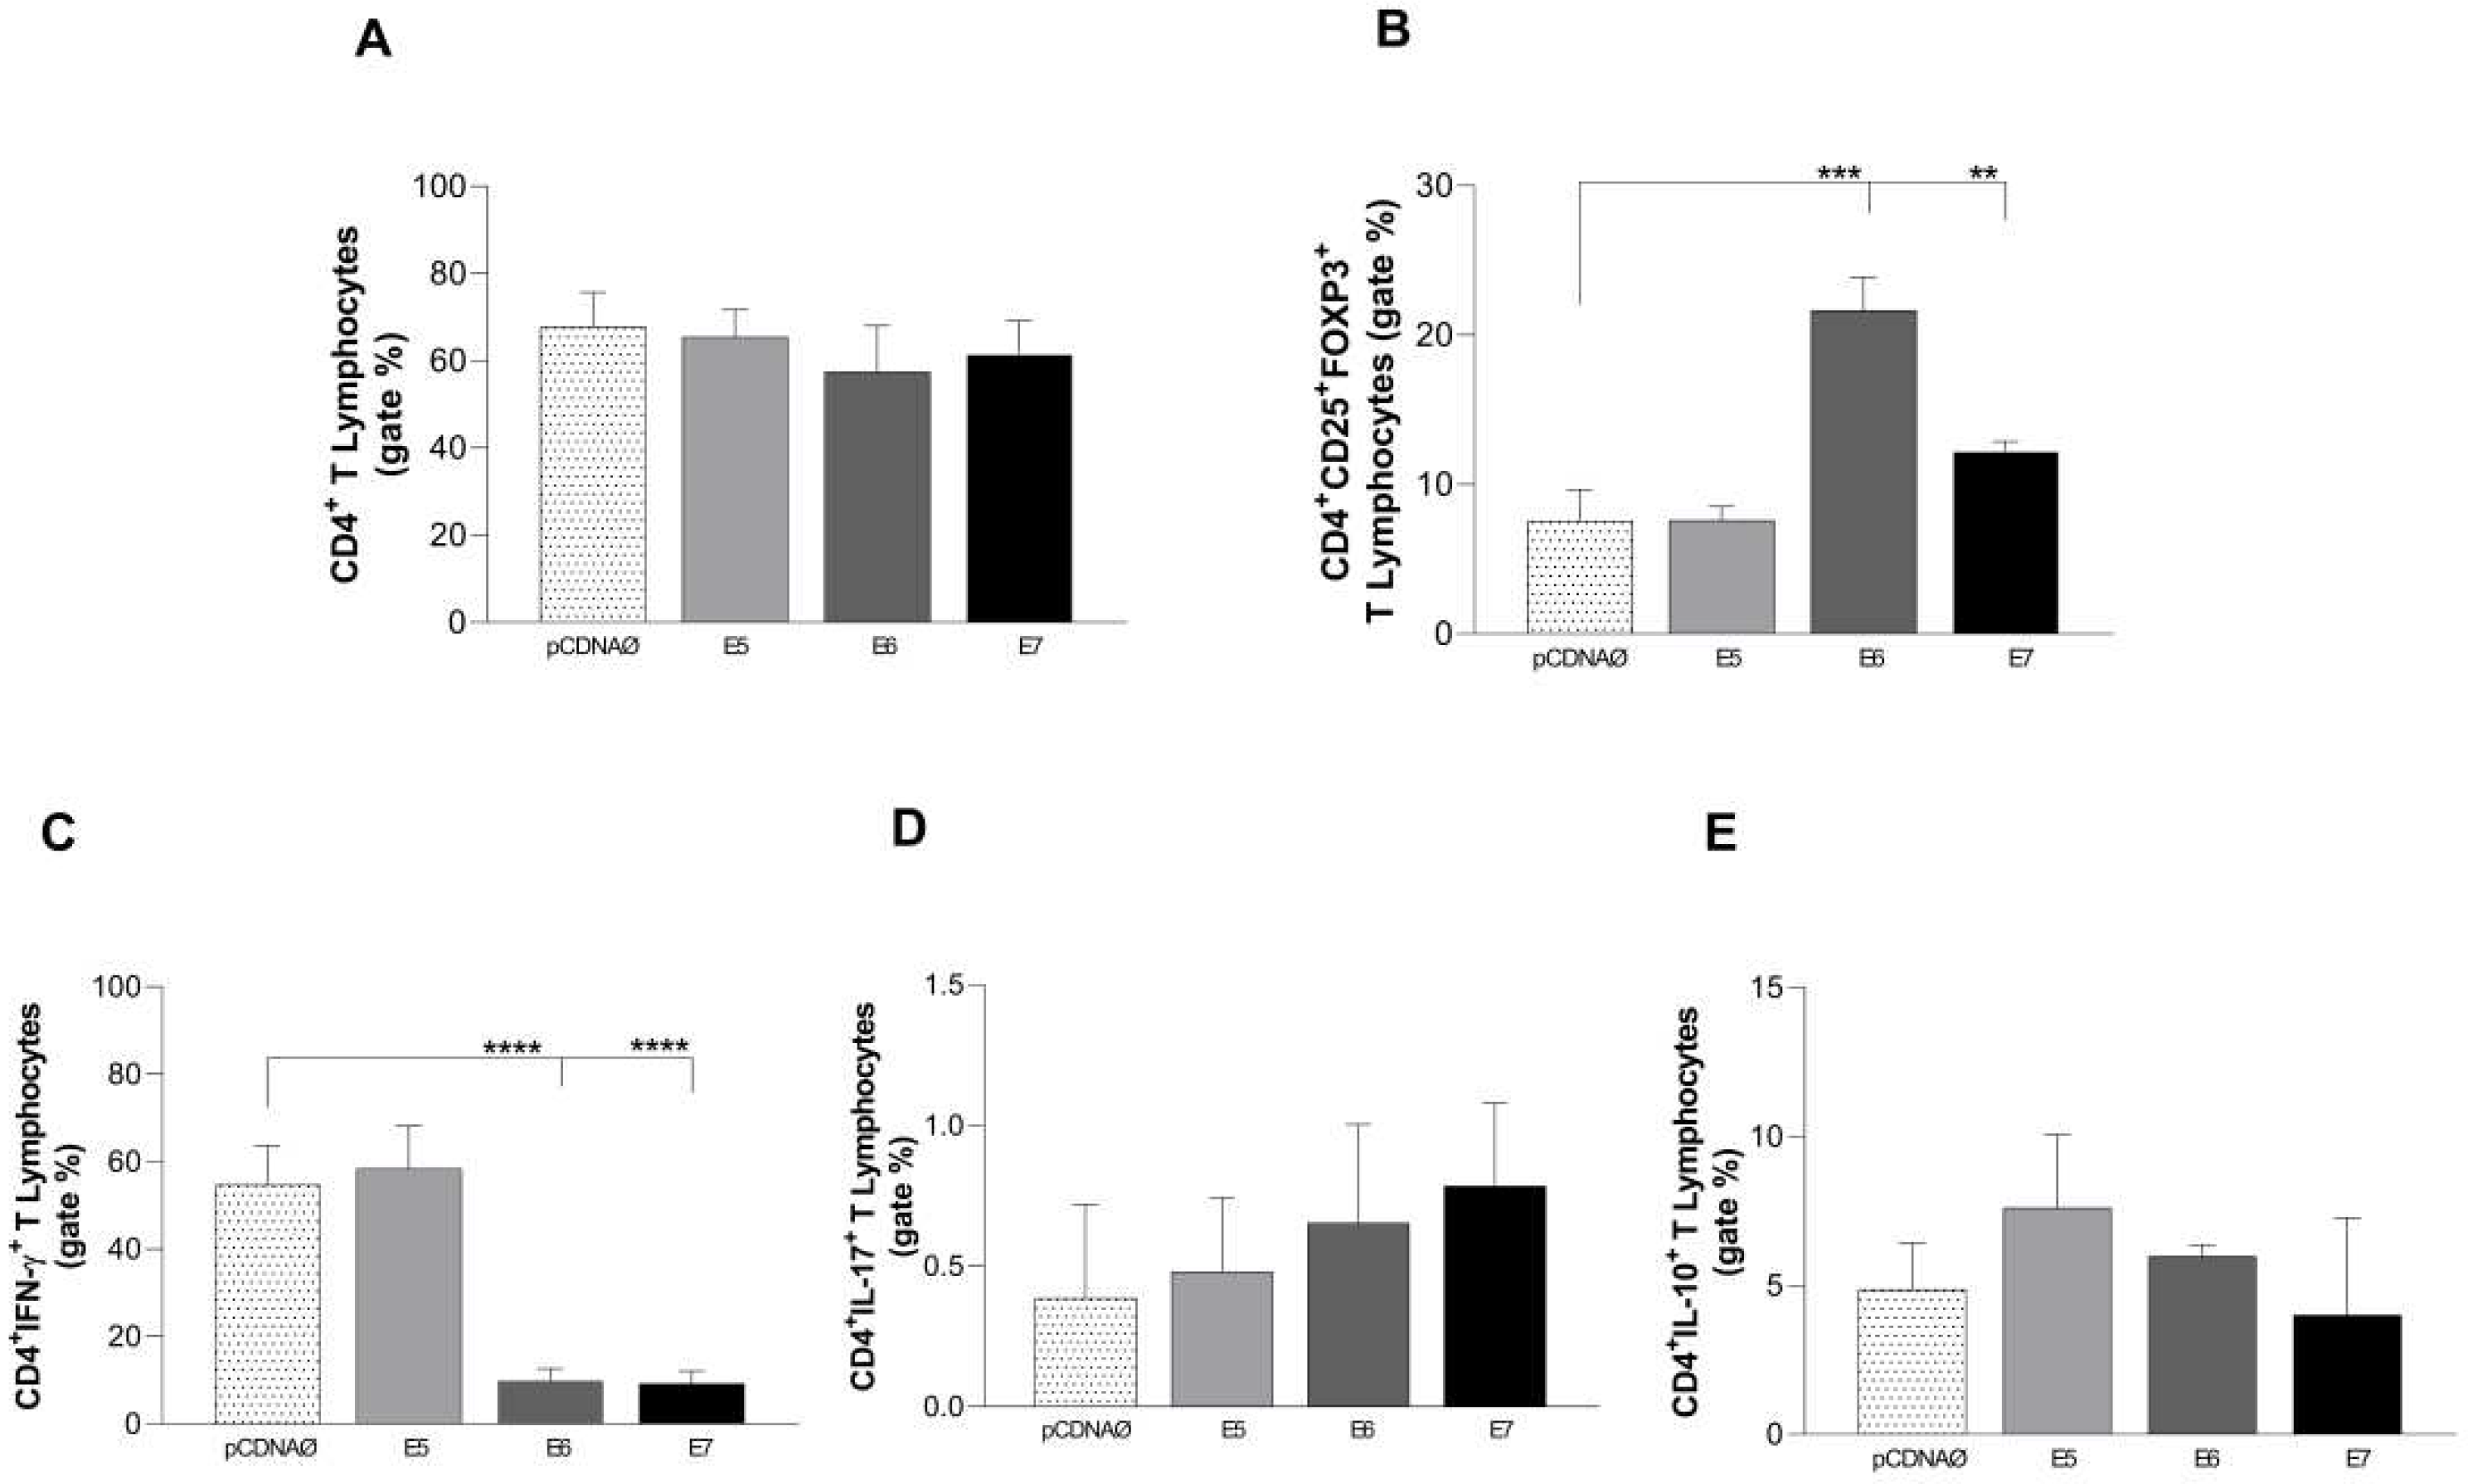
19], which was also seen in our study through the increase of CD4
+ T cells in lymphocyte cultures stimulated only by MDA-MB-231 (data in supplementary material). However, our data showed a decrease in intracellular IFN-γ production, caused by CD4
+ T cells, consequently decreasing the production of Th1 cytokine. These findings are in line with a study by Meng Cao (2020), where a change in the profile of Th1 cytokines (IFN-y, IL-2, and TNF-α) to Th2 (IL-4) was observed, and correlated with more severe HPV infections [
20]. Another important result observed in CD4
+ T lymphocytes, na presença de E6 e E7, was the increase of FOXP3-positive cells. Treg cells are characterized by the expression of CD4, CD25, and Foxp3, since these cells are known to suppress antitumor immunity and block attacks, especially by cytotoxic lymphocytes, against malignant cells [
21,
22]. In fact, a study by Hayashi et al. (2022) in HPV-infected human oral squamous cell carcinoma samples, demonstrated an increased number of Tregs in carcinomas suppressed antitumor immune responses, contributing to the onset and exacerbation of malignancies. Increased Treg can directly suppress CD8+ cell antitumor function [
23]. Furthermore, persistent antigen expression can lead to T cell dysfunction or exhaustion, which may be associated with chronic viral infections [
24].
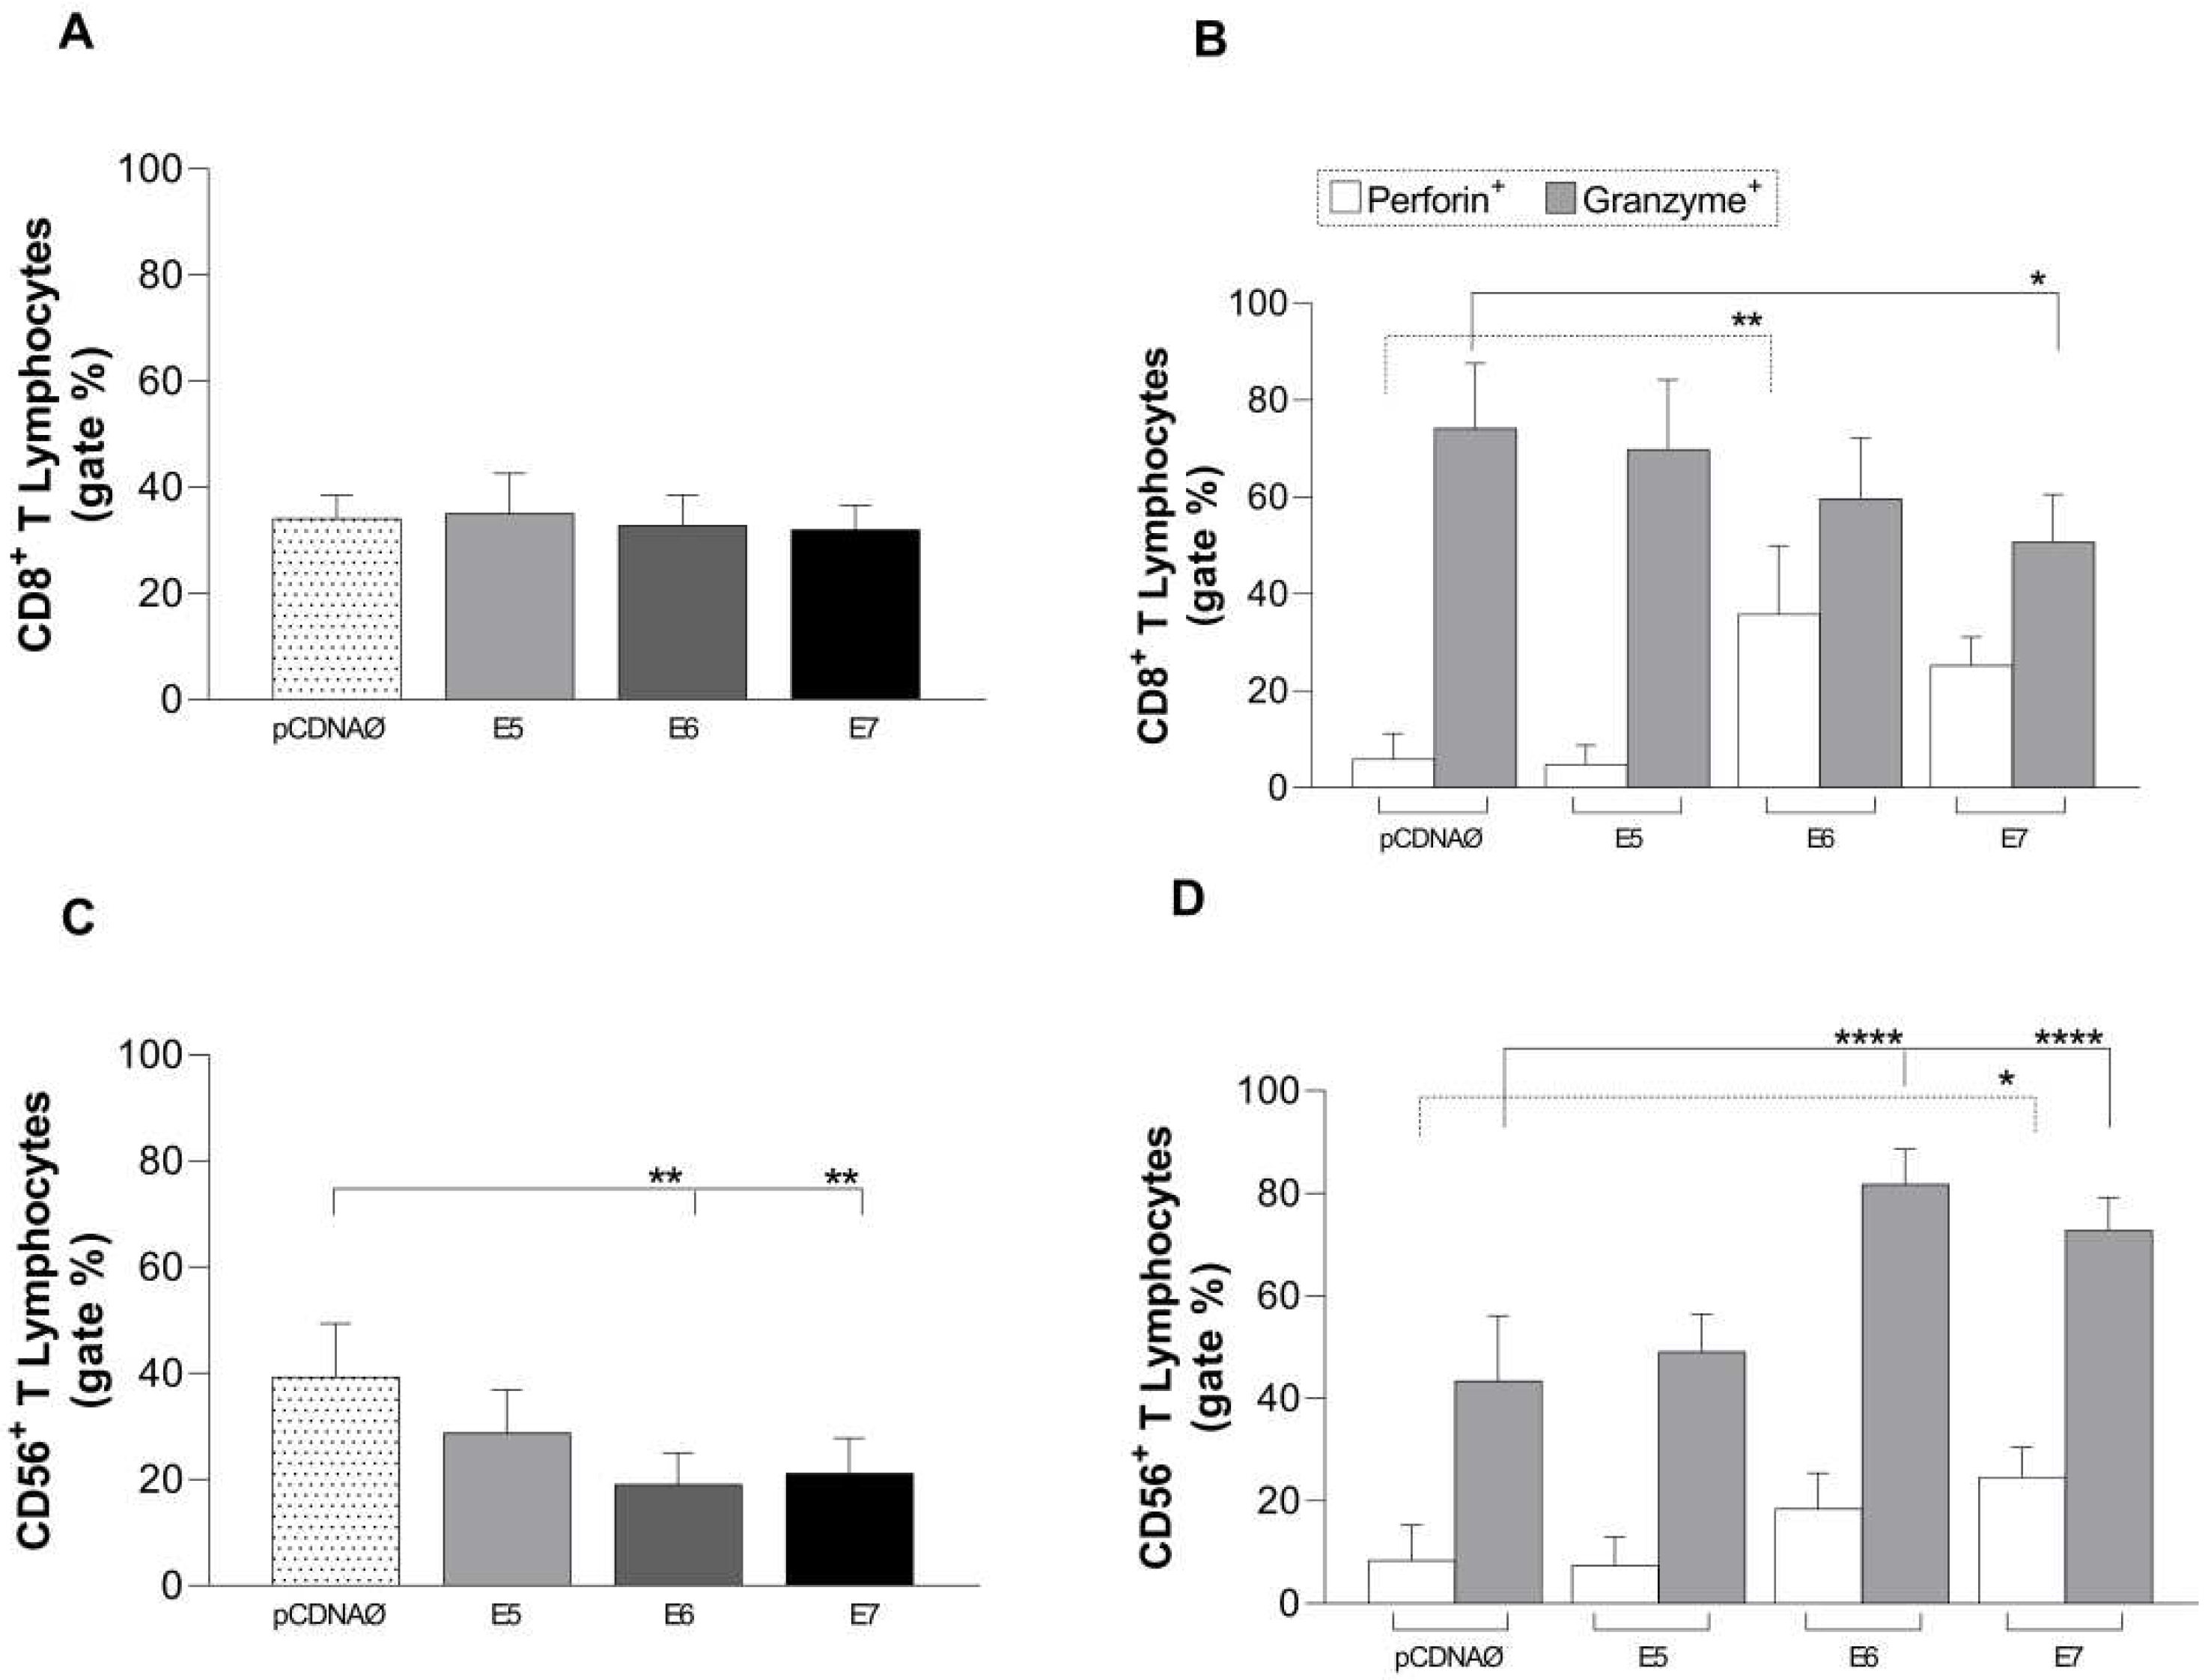
The HPV oncoproteins caused a decrease of NK cells proliferation in oncogenes transfected cell cultures and, similarly to the CD8
+ lymphocyte subtype, there was a suppression of cytolytic response due to the low production of perforin and accumulation of intracellular granzyme. Perforin is integrated into the cell membrane, forming pores through which granzymes invade the target cell, causing cell death [
25]. Thus, perforin plays a key role in delivering granzymes to target cells, promoting the cytotoxicity of T cells and NK cells. Decreasing perforin levels may indicate that antigen-specific immune cells in the tumor microenvironment are being eliminated [
26]. A study in breast tumor patients showed a greater release of granzyme in the blood of patients compared to tissue samples and the expression of granzyme and perforin in breast cancer cells were involved in cytotoxicity for these cells [
27]. It is known that CD8
+ and NK T cells (CD56
+) have the function of eliminating tumor cells through their cytolytic effect mediated by perforins and granzymes, associated with IFN-γ secretion [
28]. A previous study also pointed out that TNF-α is essential to perforin-mediated death in cervical keratinocyte cells expressing E7 oncoproteins, and that IFN facilitated the death of these cells even in the absence of perforin [
29].
In our study, we observed no change in the amount of CD8
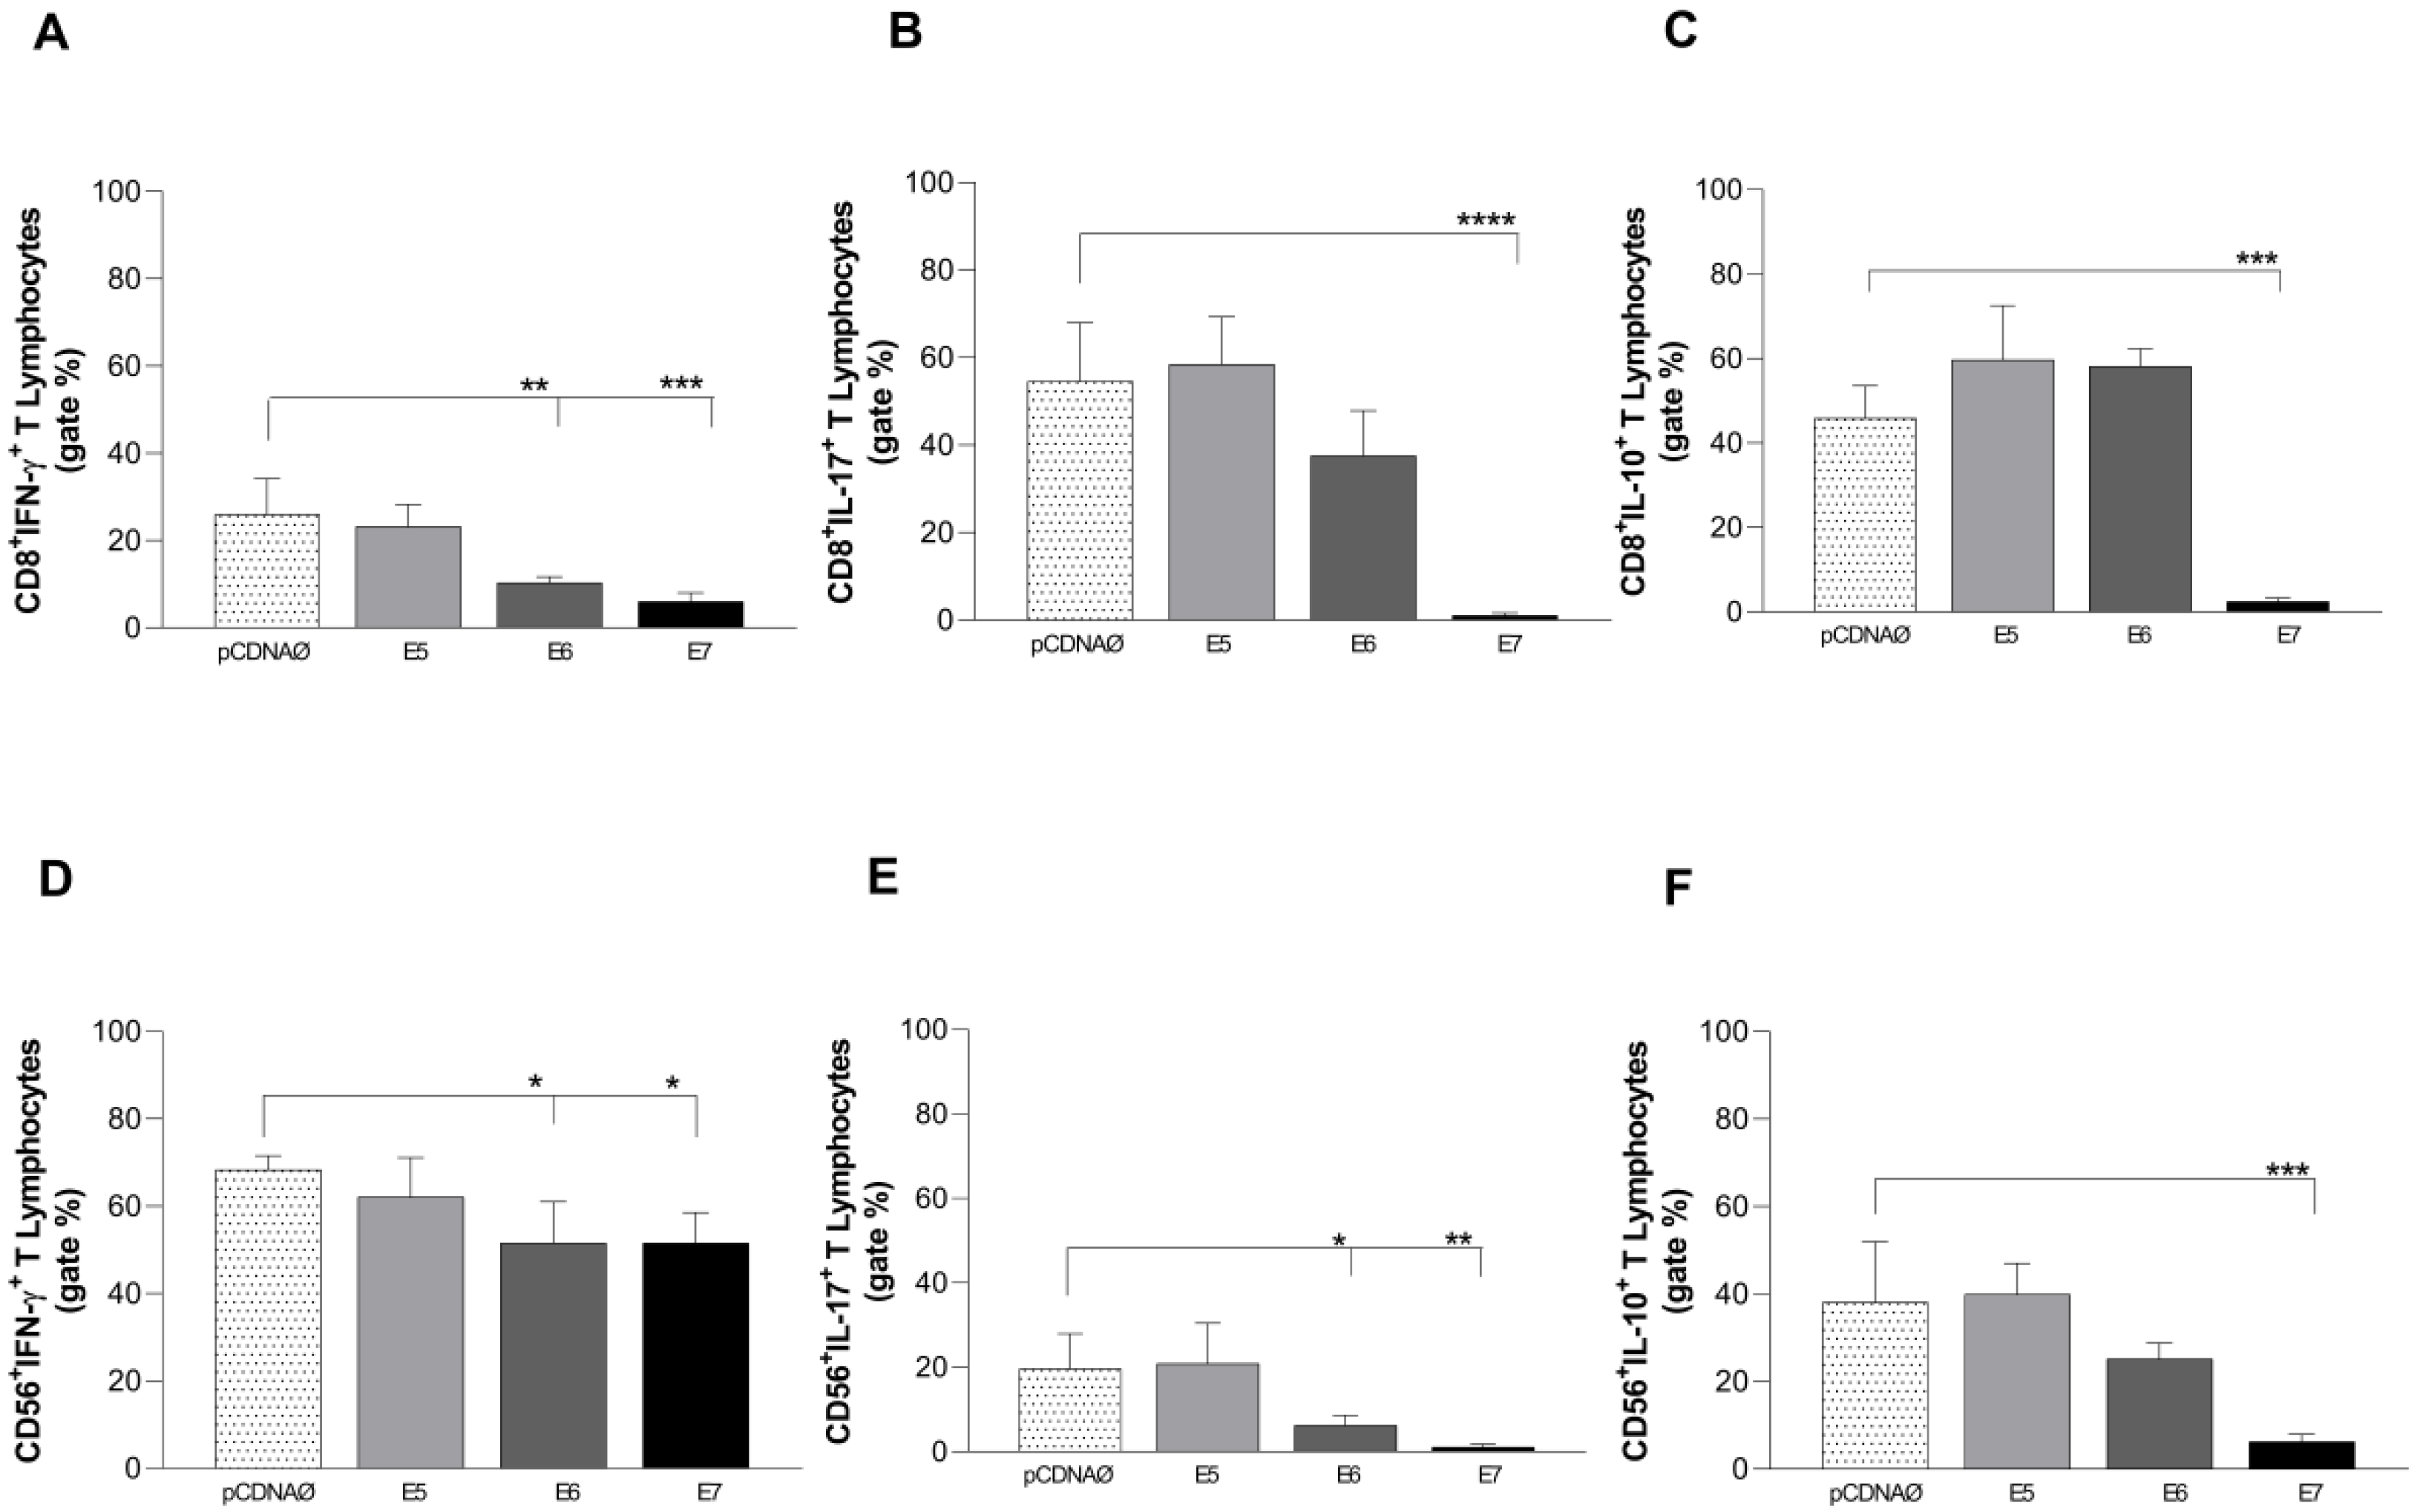
+ T cells stimulated with breast tumor cells (with or without transfection). However, it is possible to notice a decrease in the production of perforin and granzyme in lymphocytes stimulated with transfected tumorigenic cells,. In addition, there was also a significant decrease in the intracellular production of IFN-γ and IL-17 in lymphocytes from E6 and E7 transfected CD8 T cells, decreasing the inflammatory and cytolytic profile expected from CD8
+ T lymphocytes. CD8+ cells induce tumor clearance through the production of IFN-γ, TNF, and granzyme B [
24], however, the same was not found in our study, in which there was suppression of the activity of CD8+ T cells induced by the presence of oncoproteins E6 and E7, as well as an increase of Treg cells in your microenvironment.
Similar to the CD8
+ findings, there was a decrease in the intracellular production of IFN-γ and IL-17 in NK lymphocytes from E6 and E7 transfected cells.These findings corroborate studies carried out in cervical cancer, where the number of NK cells, as well as their cytolytic activity, are suppressed in the presence of E6 and E7 of HPV16, which in turn has the ability to inhibit the synthesis of IFN-γ induced by IL18. , and the expression of MHC class I and CXCL14 to create a microenvironment against the cytotoxic activity of NK cells [
30].
The macrophage profile was also analyzed. M1 phenotype macrophages characterize pro-inflammatory responses and are associated with a good prognosis in antitumor activities. M2 phenotype macrophages are associated with poor prognosis, given they promote tumor angiogenesis [
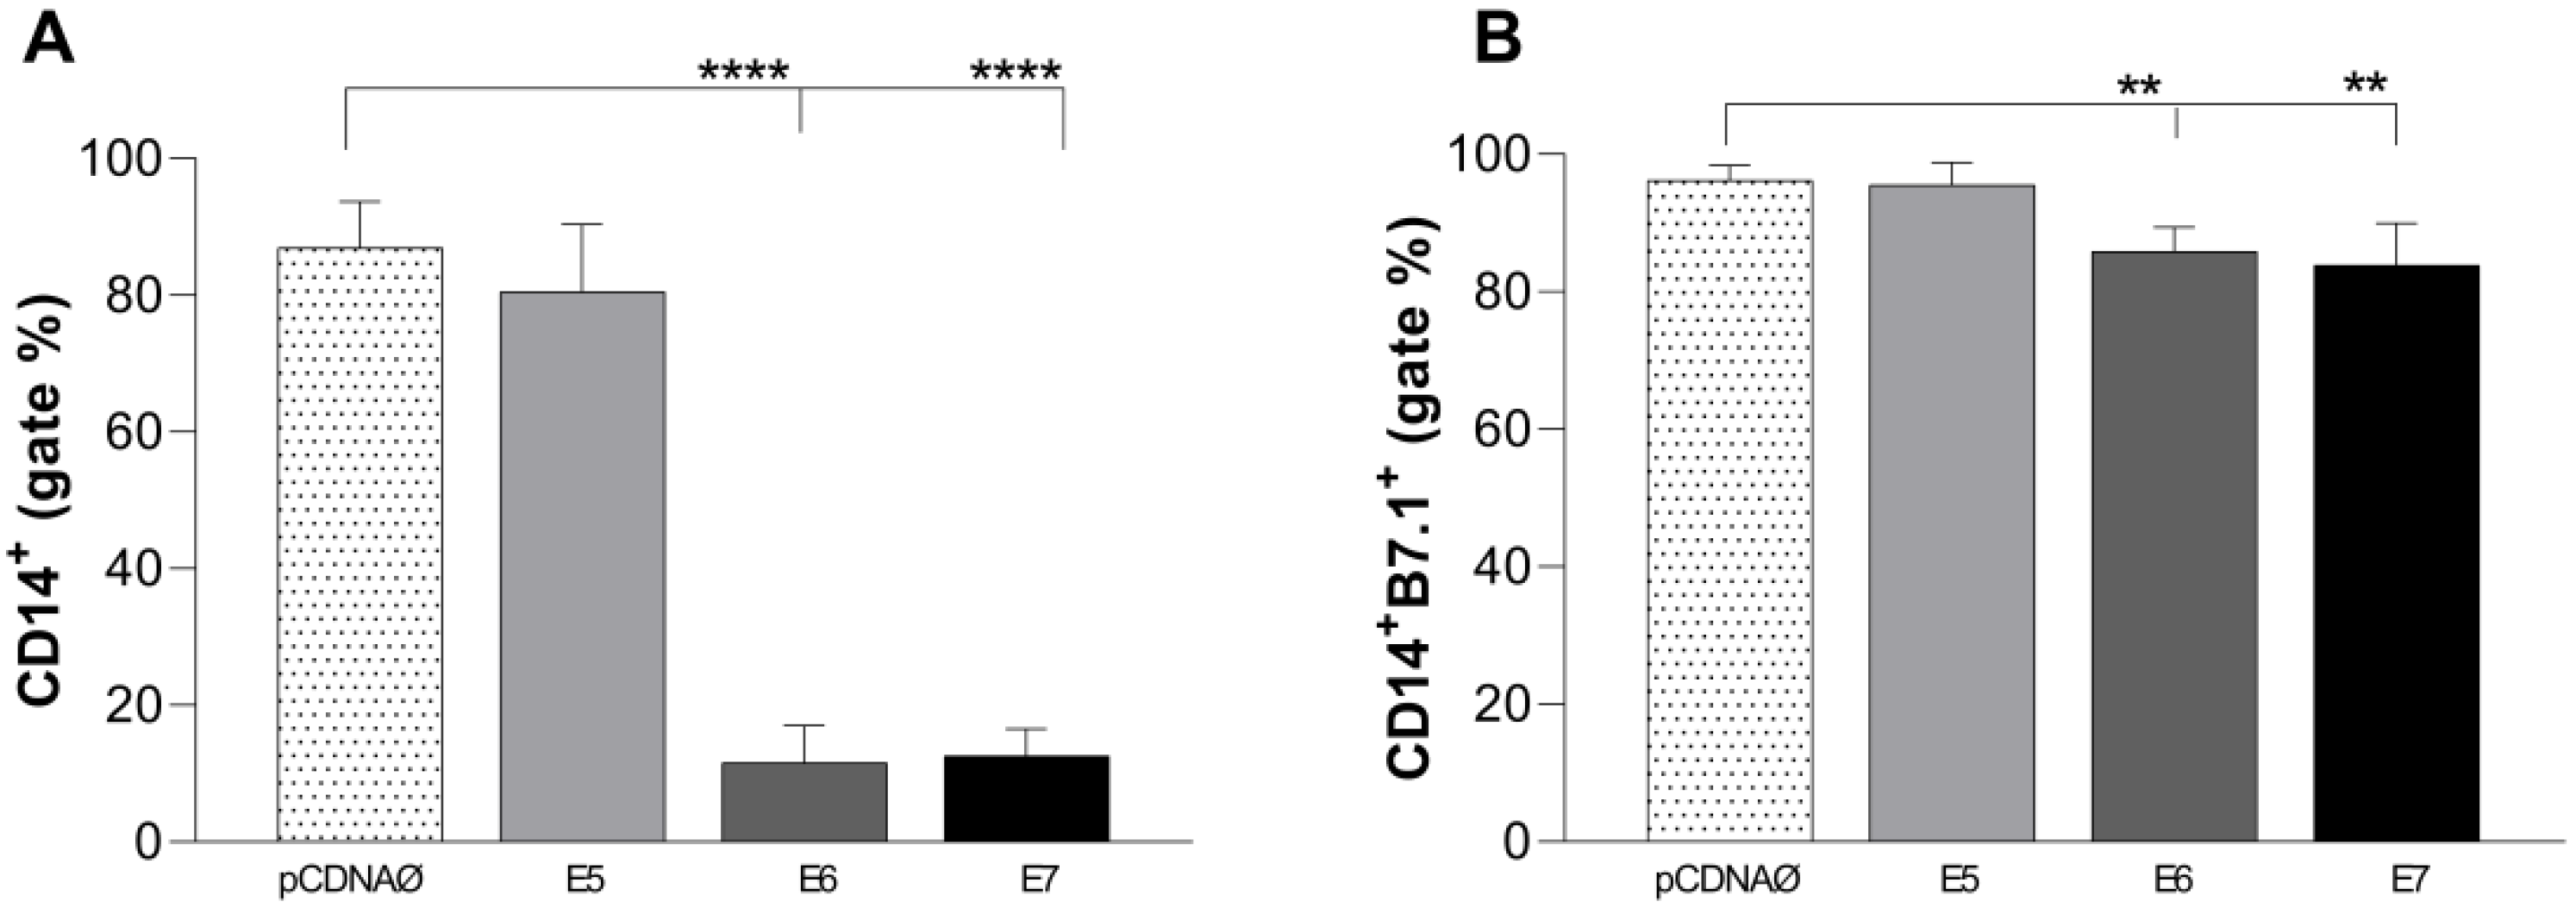
31]. In our study, CD14
+ cells were decreased in the presence of E6 and E7 oncogenes, as well as their co-stimulatory molecules B7.1, not effectively stimulating the M1 profile. A lung cancer study detected B7.1 and B7.2 primarily in tumor-infiltrating macrophages, from which B7.1 was associated with a worse prognosis [
32]. In cervical cancer cell lines, it is likely that the induction of M2 macrophage occurs, which may provide a tumor immunosuppressive microenvironment, thus acting positively on angiogenesis and metastasis processes [
33]. Accordingly, two studies with breast cancer patients demonstrated a reduced expression of HLA-DR in CD14
+ cells associated with mechanisms of immunosuppression [
34,
35]. According to Figueiredo (2019) the M2 macrophage profile negatively regulates HLA-DR and IL-12 and increases the expression of anti-inflammatory cytokines, such as IL-4 and IL-10 [
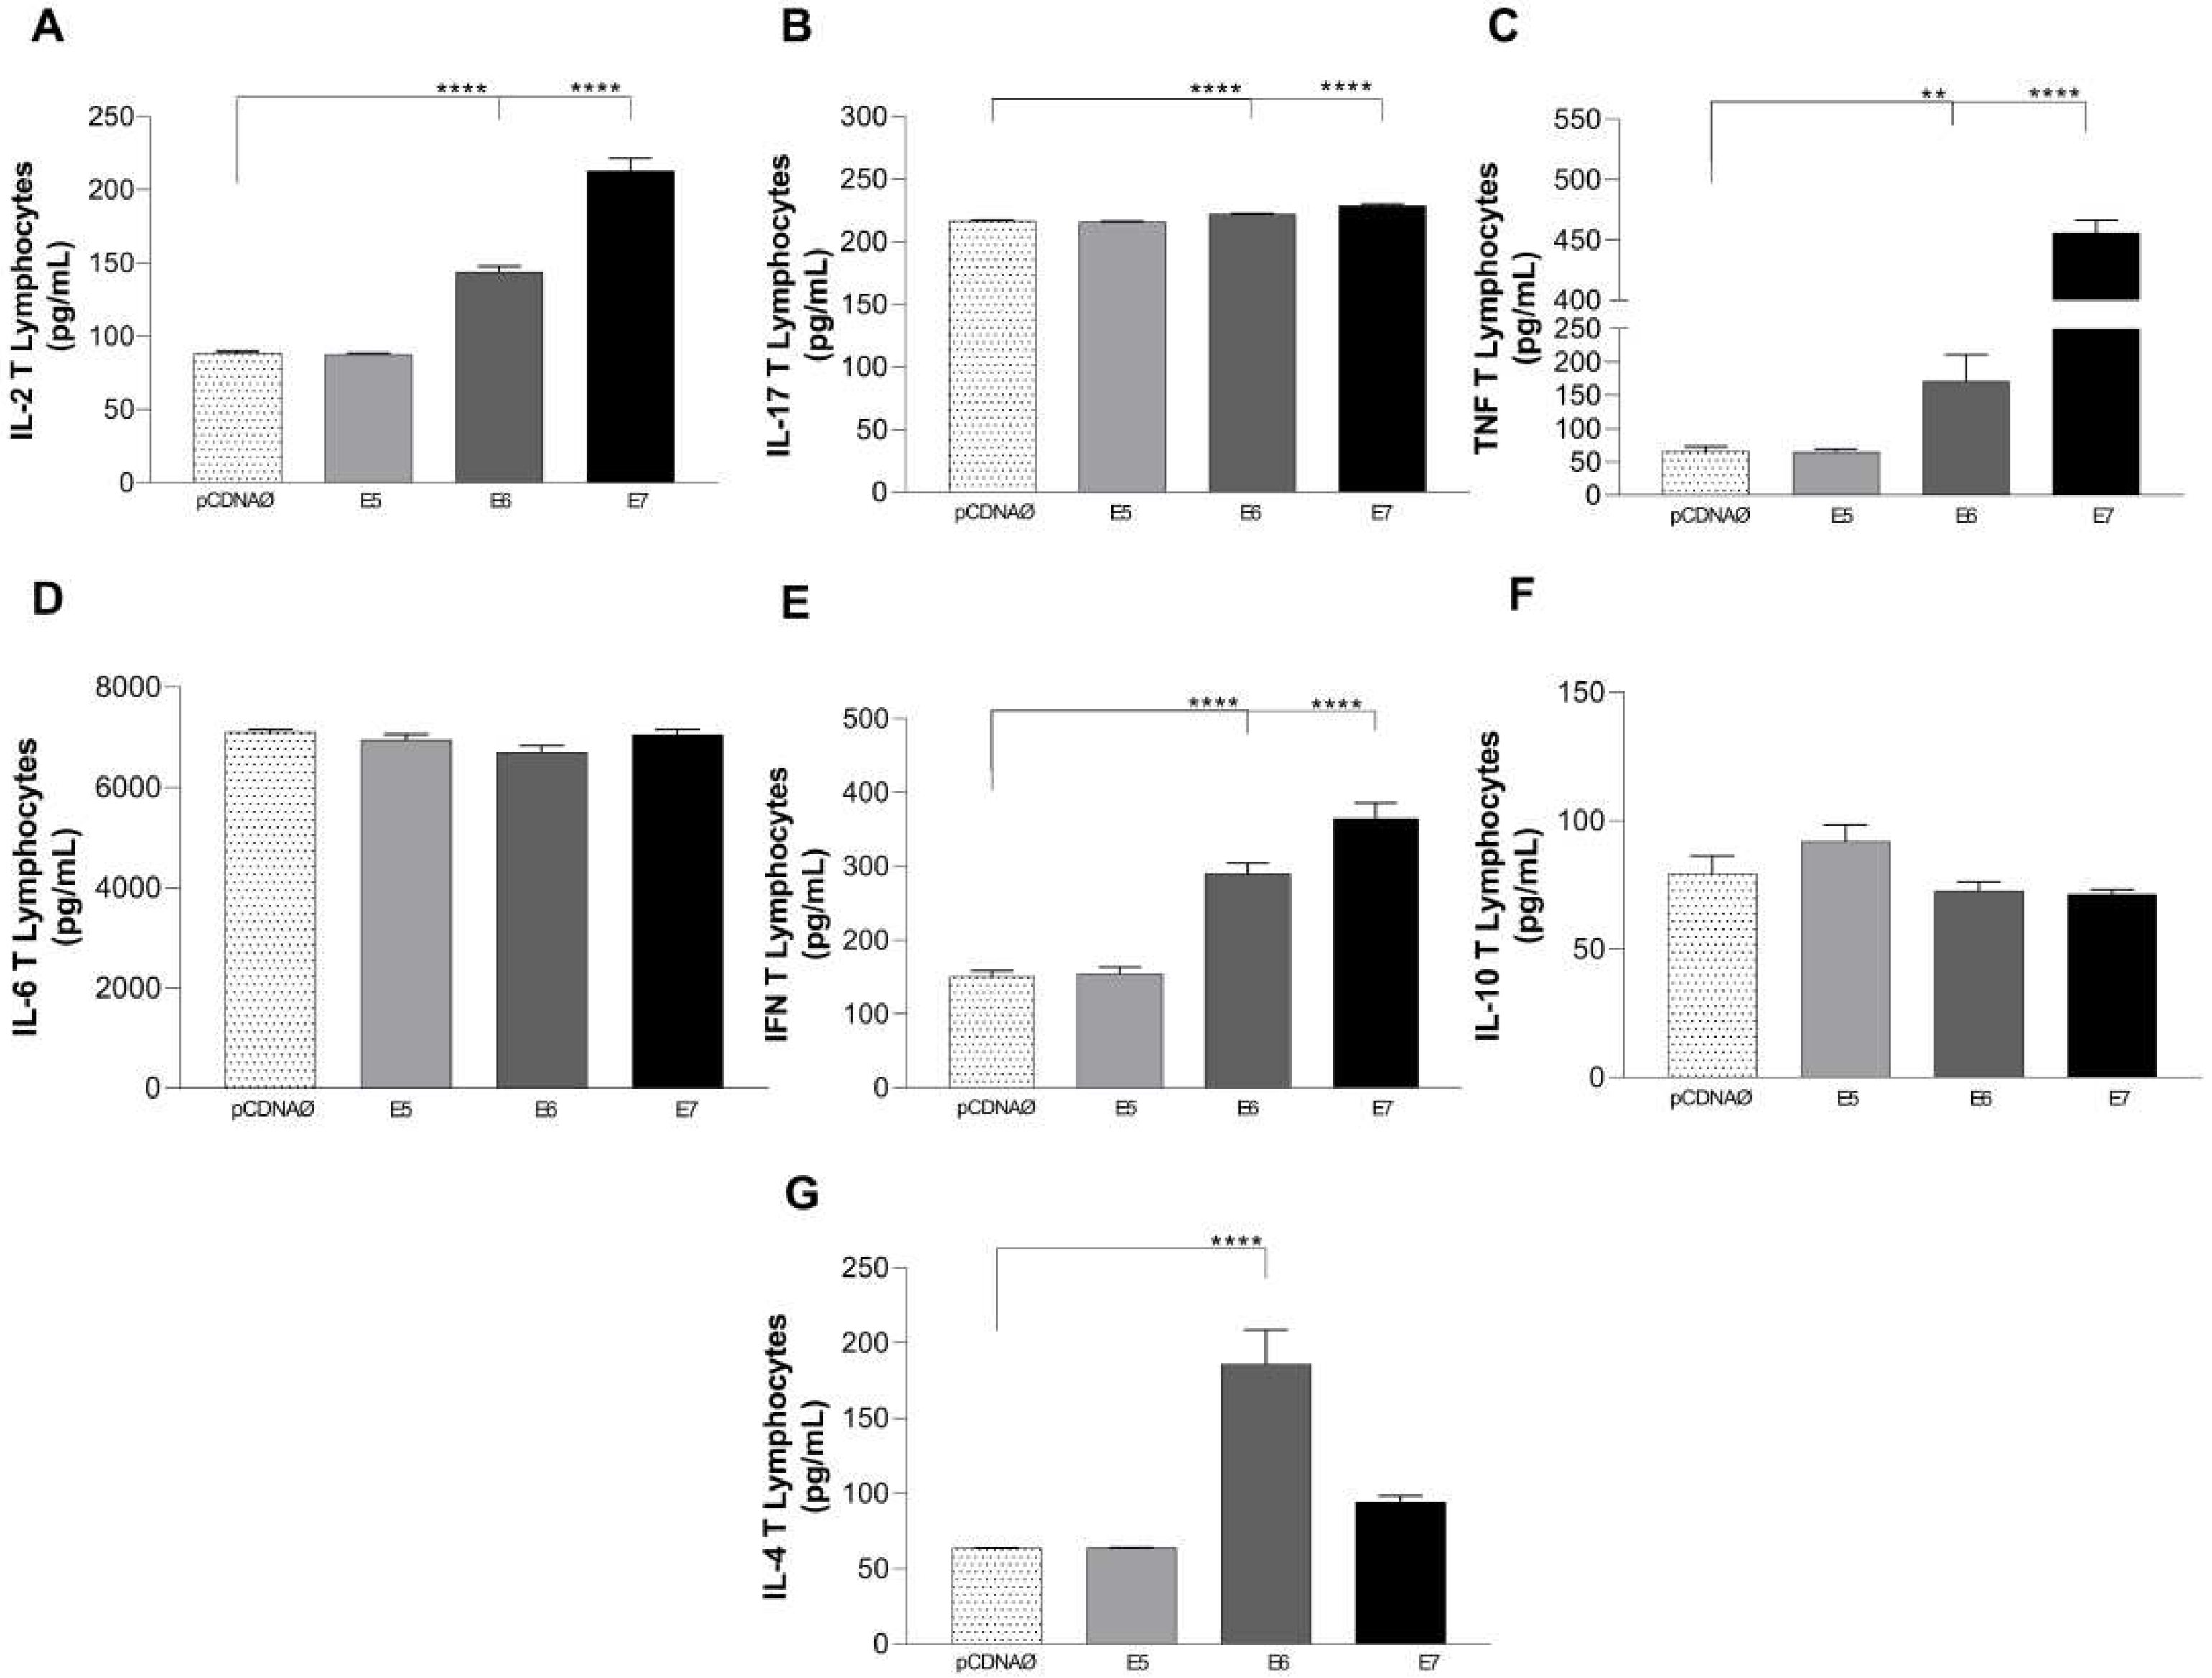
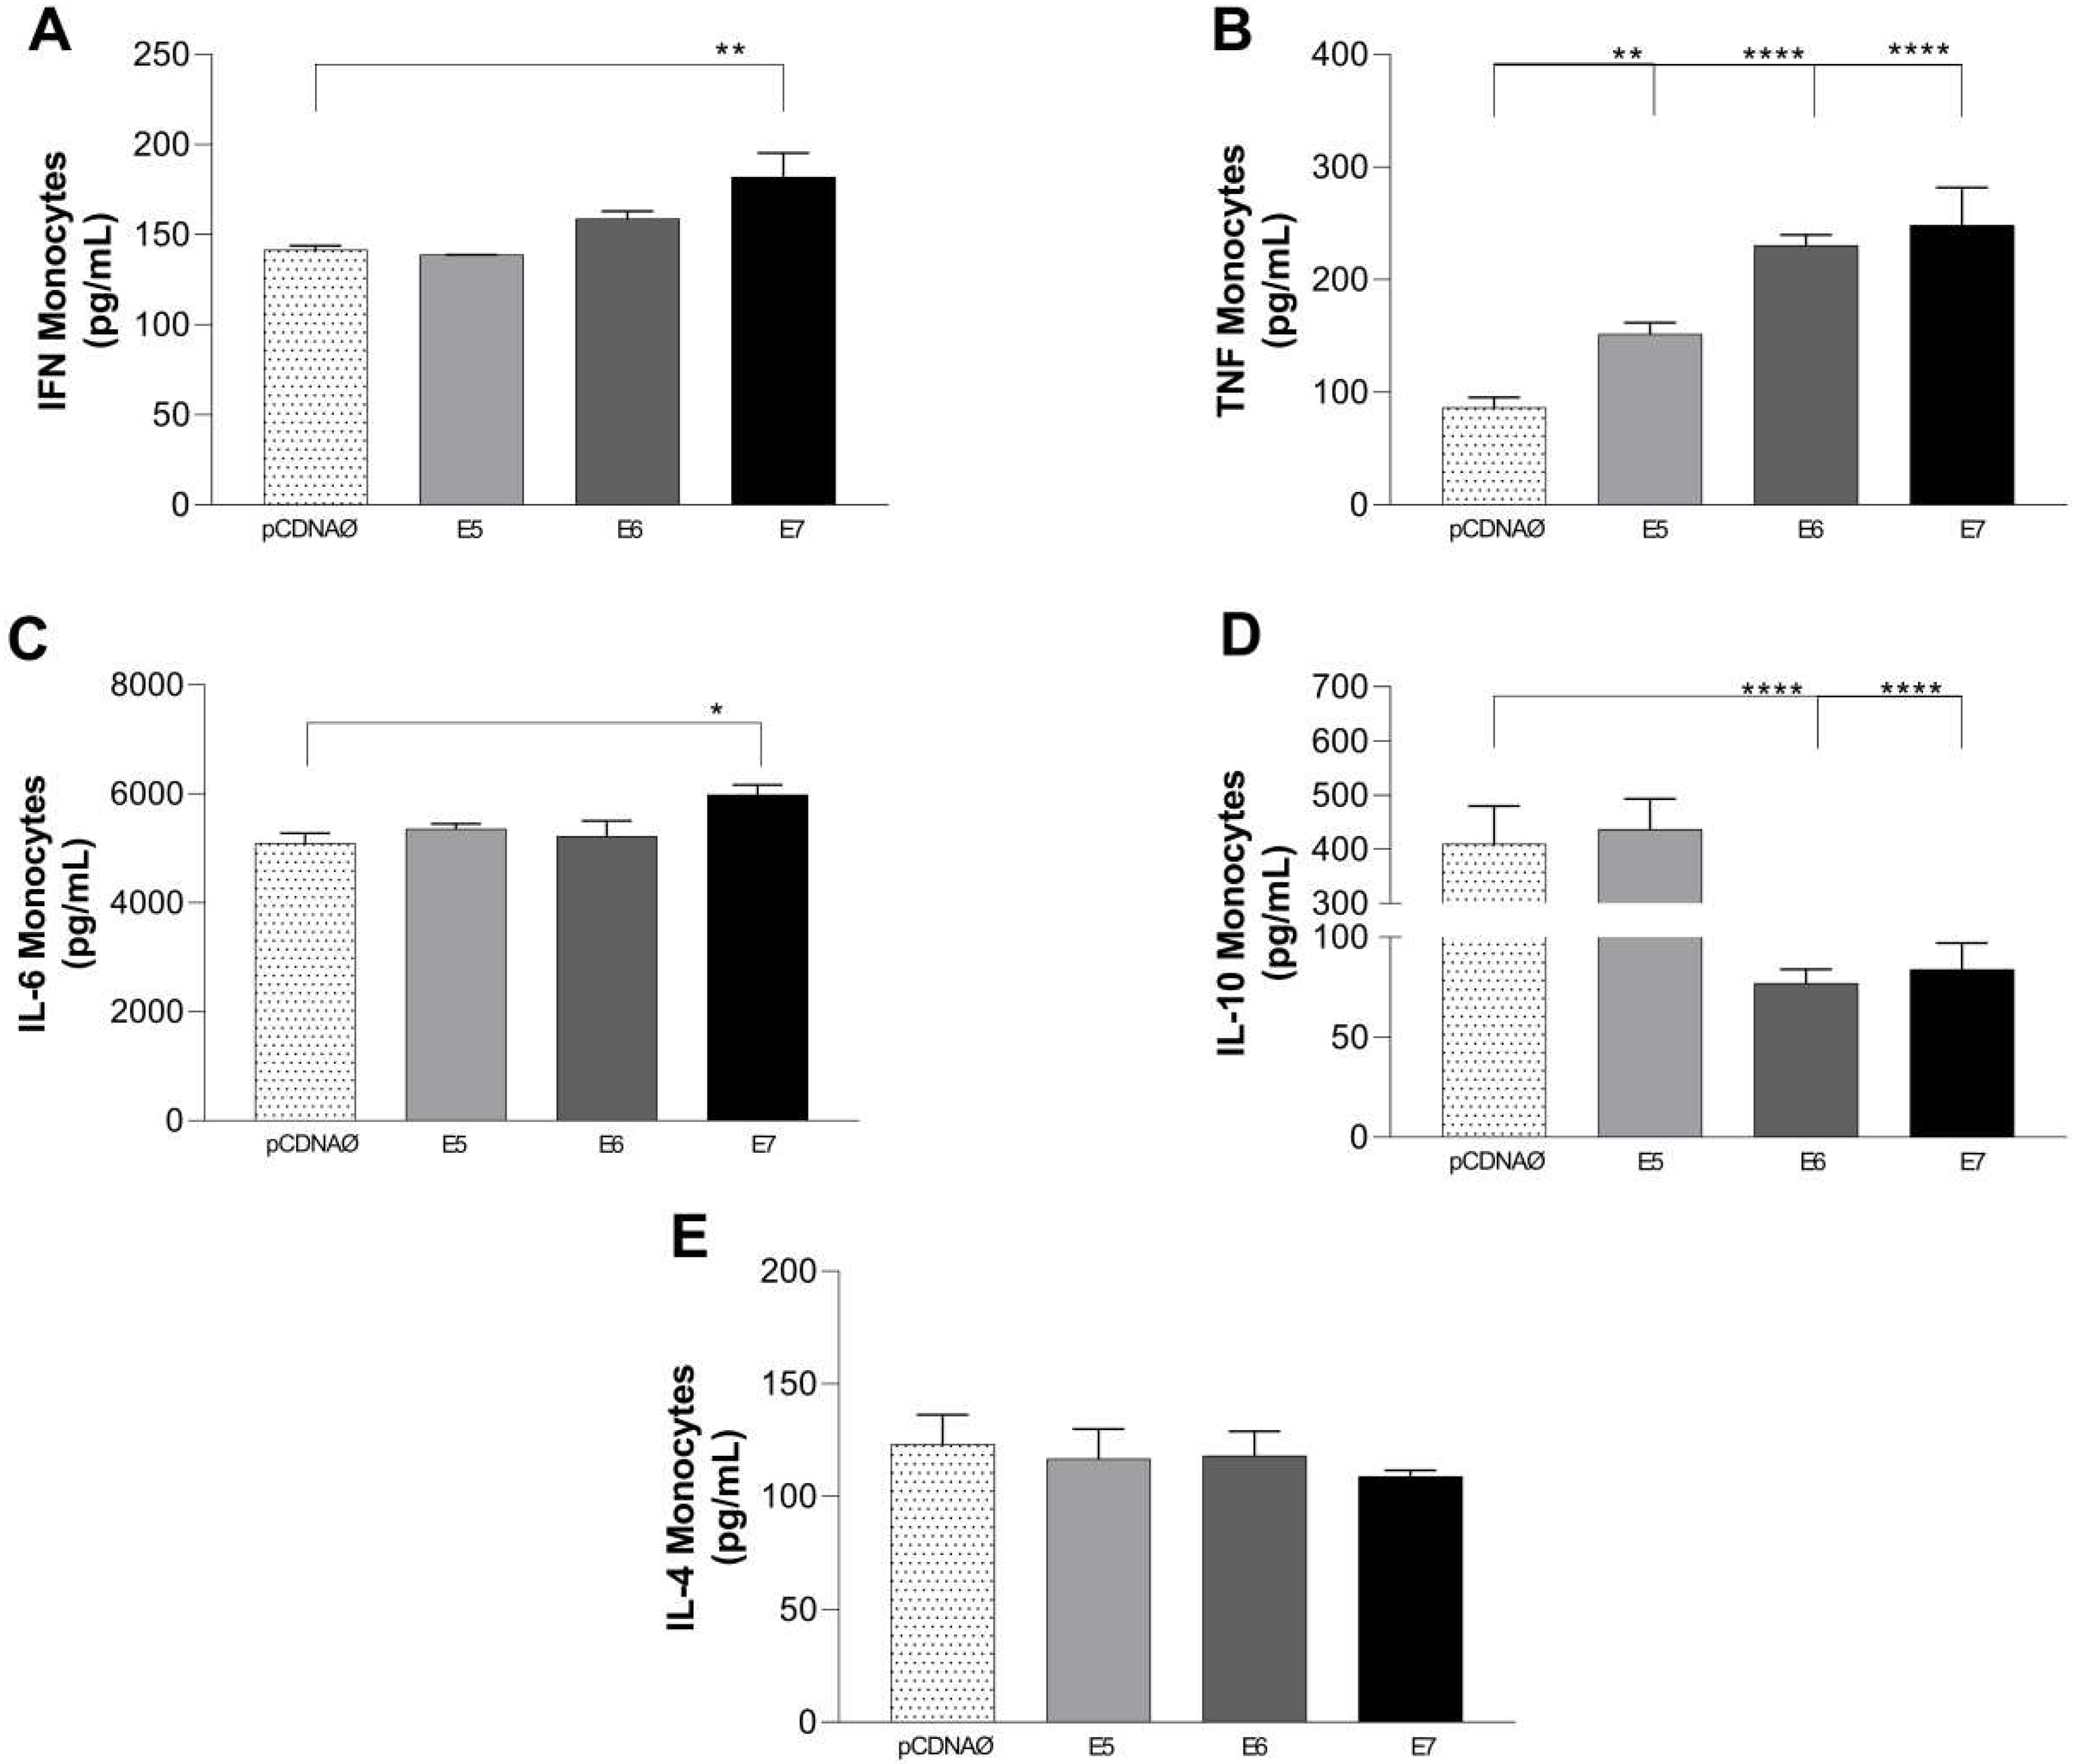
36]. Our results regarding the cytokines released by macrophages demonstrate that only the E7 oncoprotein stimulated the release of IFN-γ. Cytokines IL-2, IL-17 and IL-4 were not stimulated significantly in the experimental groups, but TNF-α was stimulated by E5, E6, and E7 in the transfected cultures and IL-6 was stimulated only by E7, demonstrating an increased M1 profile and decreased M2 due to the suppression of IL-10 release by monocytes in the presence of E6 and E7. These findings suggest a pro-inflammatory profile of the few monocytes found in the environment of HPV-associated in vitro cultured breast cancer cells. In agreement, analyzing the lymphocyte supernatant cultures, E6 and E7 oncogenes mainly induced the release of Th1 (IL-2, IFN-y, and TNF-α), Th17 (IL-17), leading to a pro-inflammatory profile too.
In more advanced stages of ductal carcinoma, tumor tissues are infiltrated by abundant concentrations of T cells and M2 macrophages, which produce large amounts of IL-6, promoting metastasis of breast tumor cells. This was evidenced by the fact that IL-6 serum levels in patients with ductal carcinoma were significantly higher than in healthy women. As for the TNF-α levels of stage III carcinoma patients, they were also significantly higher in relation to healthy women. When comparing the levels of TNF-α in breast cancer patients (stage III) to those with stage I cancer and control patients (healthy), stage III levels were elevated. This study indicated that only patients with tumors in advanced stages secrete high levels of TNF-α [
37]. In our analyses, we highlight the results of cells transfected with E6 and E7, which promoted high release of cytokines, including IL-6 and TNF-α. Furthermore, IL-6 was stimulated in all experimental groups.
Author Contributions
Conceptualization, A.C.d.F, B.d.F.S.M., D.L.S and C.M.L.d.M.; methodology, D.L.S., B.d.F.S.M, G.F.d.S.; formal analysis, C.M.L.d.M., D.L.S, B.d.F.S.M.; investigation,D.L.S, B.d.F.S.M, G.F.d.S, L.C.d.O.C; B.R.d.S.B and M.C.d.B.L.N.; data curation, C.M.L.d.M., D.L.S and B.d.F.S.M.; writing—original draft preparation, C.M.L.d.M., D.L.S and B.d.F.S.M; writing—review and editing, A.J.D.S, T.H.d.A.O, V.E.P.S. and C.M.L.d.M .; supervision, A.C.d.F. and C.M.L.d.M.; project administration, A.C.d.F. and C.M.L.d.M.; funding acquisition A.C.d.F and C.M.L.d.M. All authors have read and agreed to the published version of the manuscript.
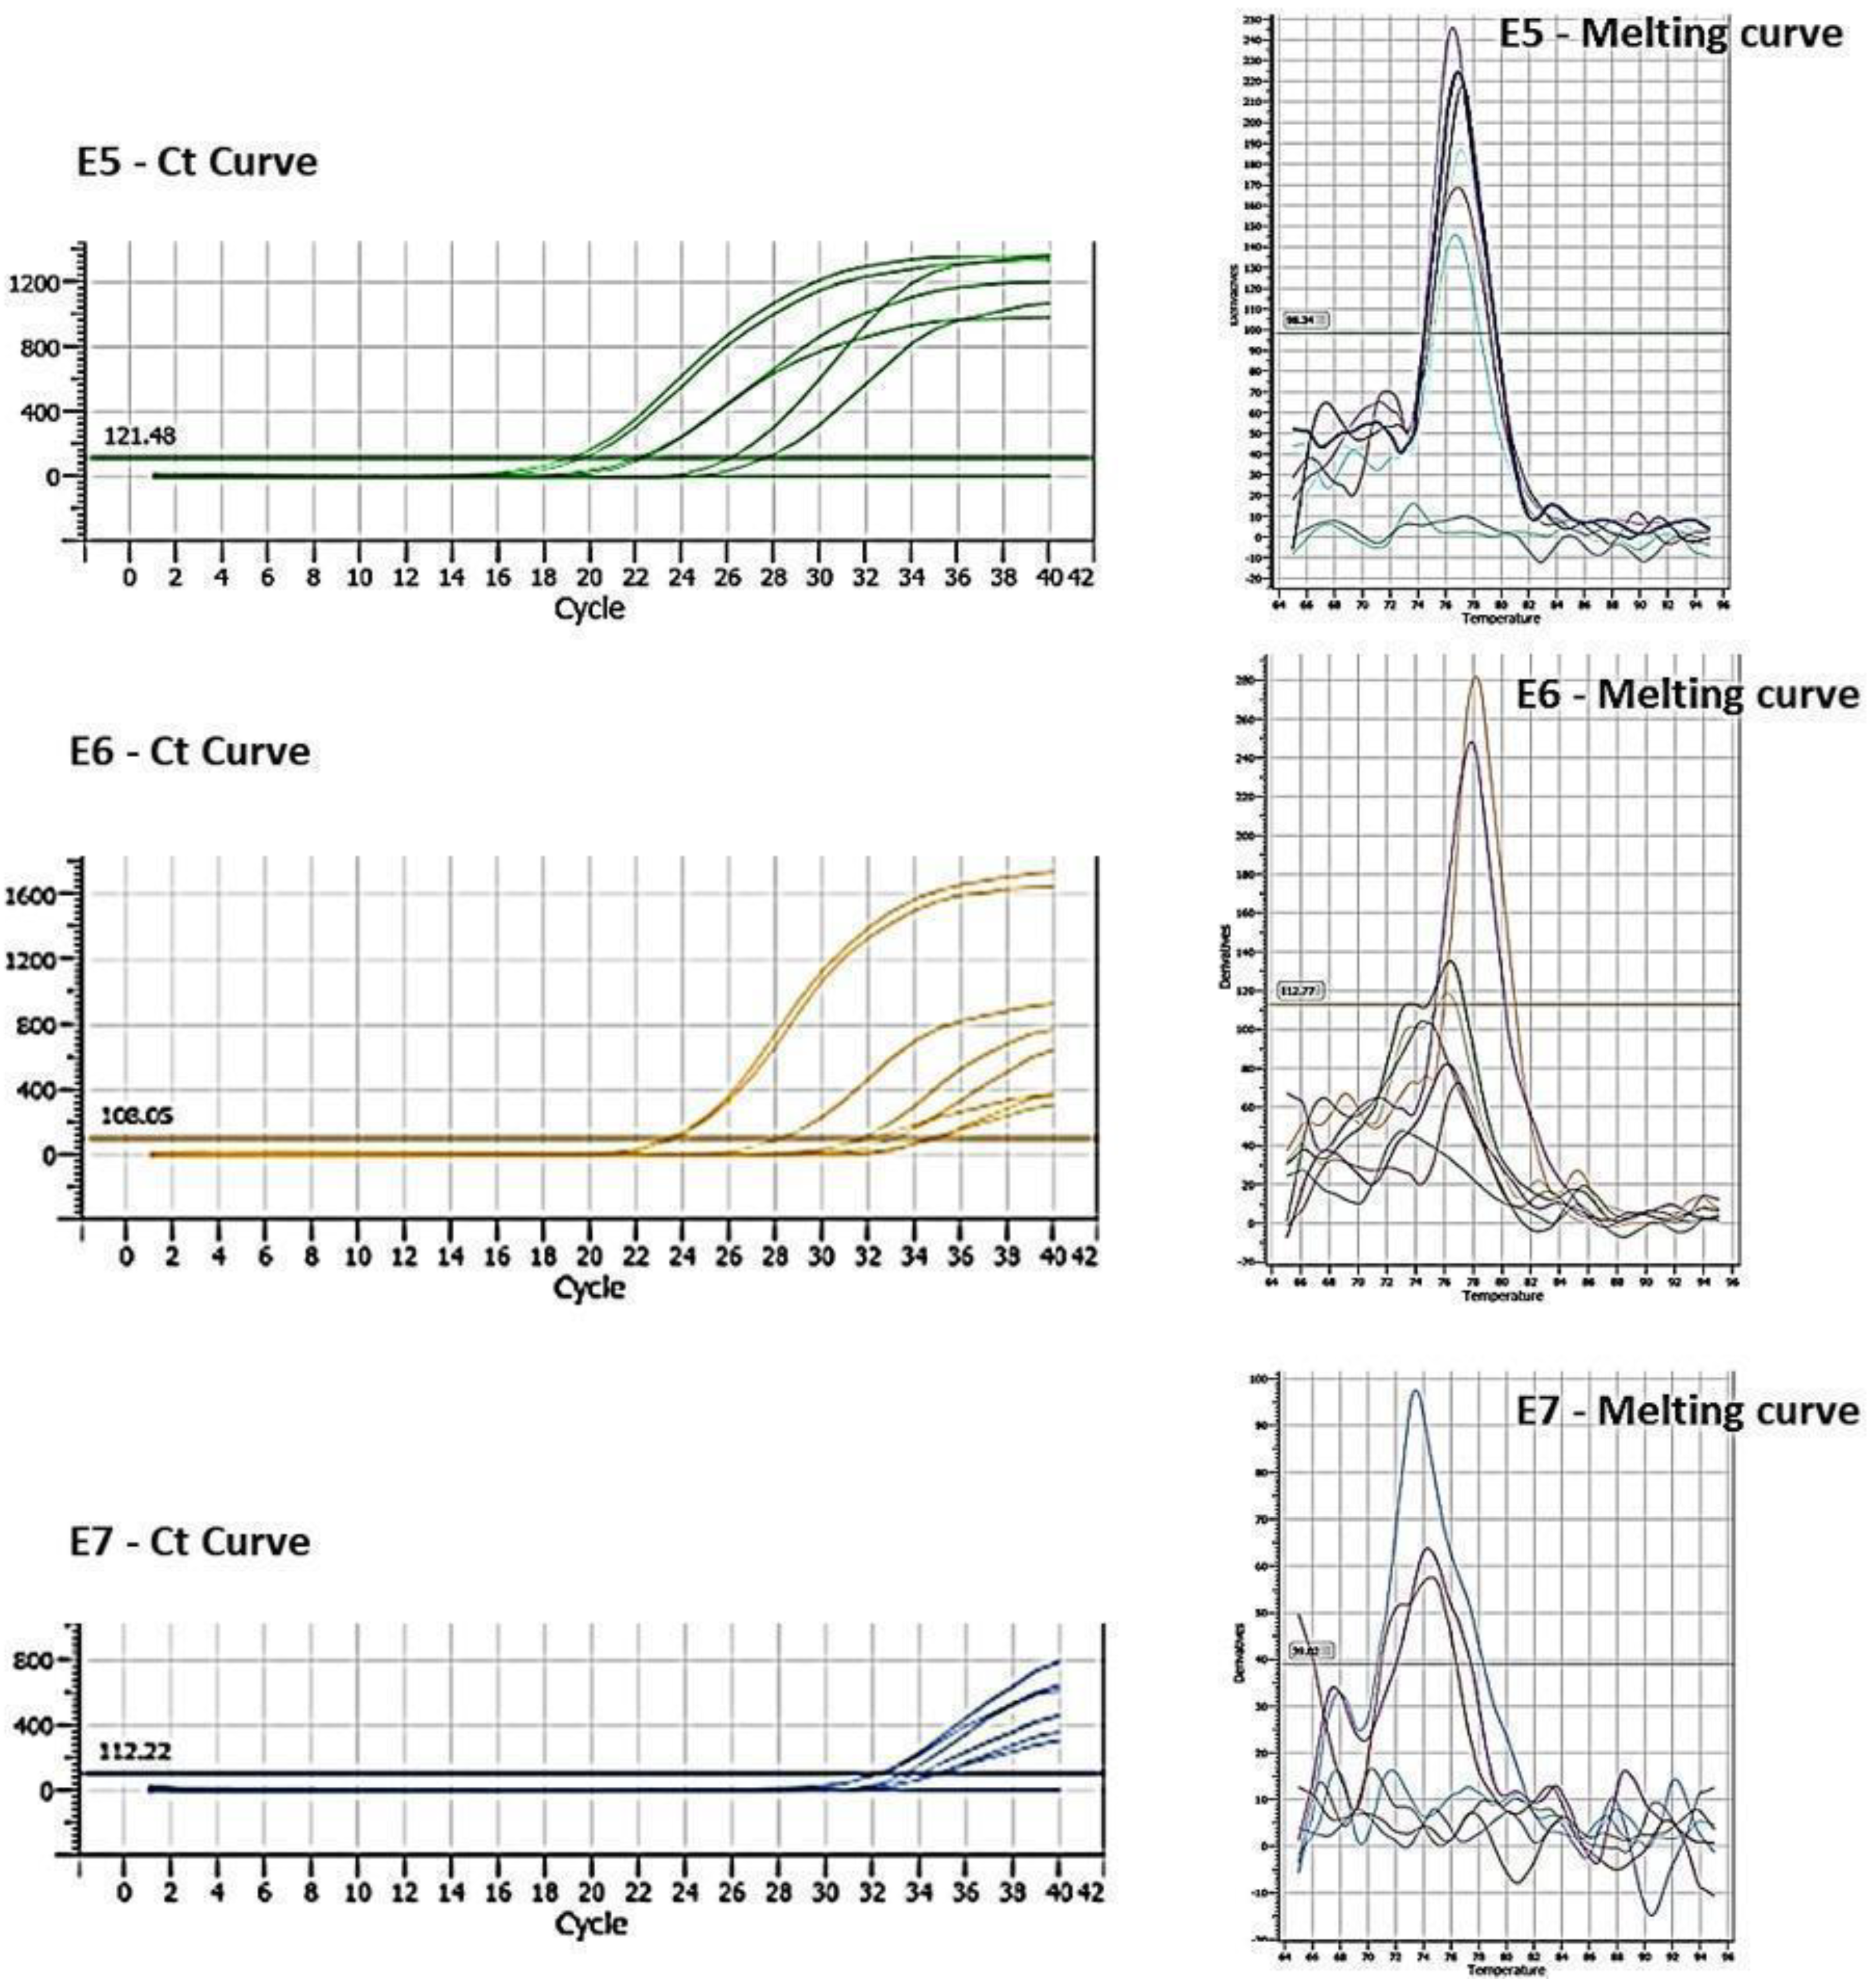
Figure 2.
Cq and Melting curve referring to the expression of oncogenes E5, E6 and E7 transfected in MDA-MB-231 cells.
Figure 2.
Cq and Melting curve referring to the expression of oncogenes E5, E6 and E7 transfected in MDA-MB-231 cells.
Figure 4.
Stimulation profile of CD4+ T lymphocytes cultured with the MDA-MB 231 tumor cell line. The experimental groups were composed of the empty pcDNA vector and lymphocytes cultured with MDA- MB 231 transfected with the E5, E6, and E7 genes. (a) – Differential count of CD4+ T lymphocytes. - Differential (b) count of the CD25+ subset of CD4+ T lymphocytes and its suppressor expression profile by the presence of the intracellular molecule FOXP3+. (c), (d), and (e) the presence of IFN-γ, IL-17, and IL-10 intracellular cytokines in CD4+ lymphocytes, respectively. **p < 0.01, ***p< 0.001, ****p<0.0001. Error bars: standard error between samples.
Figure 5.
Stimulation profile of CD8+ T lymphocytes cultured with the MDA-MB 231 tumor line. Experimental groups: the empty pcDNA vector and lymphocytes cultured with transfected MDA-MB 231 with the E5, E6, and E7 genes. (a) – Differential count of CD8+ T lymphocytes. (b) – intracellular production of perforin and granzyme in CD8+ T lymphocytes. (c) - CD56+ T lymphocyte differential count. (d) – intracellular production of perforin and granzyme in CD56+ T lymphocytes. Asterisks represent statistical significance (* p < 0.05, ** p< 0.001, **** p<0.0001). Error bars: standard error between samples.
Figure 6.
Intracellular cytokines are produced by CD8+ and CD56+ lymphocytes against tumor cells. (a), (b) and (c) – CD8+ T lymphocytes producing IFN-γ, IL-17, and IL-10, respectively; (d), (e) and (f) – CD56+ T lymphocytes producing IFN-γ, IL-17 and IL-10, respectively. *p < 0.05, **p < 0.01, ***p< 0.001, ****p<0.0001. Error bars: standard error between samples.
Figure 7.
Stimulation profile of CD14+ monocytes cultured with MDA-MB-231 tumor cell lineage. Experimental groups: monocytes cultured with E5, E6, and E7 oncogenes and with the empty vector, transfected MDA-MB-231 . (a) – Differential count of CD14+ monocytes. (b) – B7.1 surface costimulatory molecule production. **p < 0.001, ****p<0.0001. Error bars: standard error between samples.
Figure 8.
Cytokines are produced in the supernatants of lymphocyte and tumor cell cultures. (a) – (g) – cytokines IL-2, IFN-γ , TNF-α, IL-6, IL-17, IL-10, and IL-4, respectively. Asterisks represent statistical significance **p < 0.001, ****p<0.0001. Error bars: standard error between samples.
Figure 8.
Cytokines are produced in the supernatants of lymphocyte and tumor cell cultures. (a) – (g) – cytokines IL-2, IFN-γ , TNF-α, IL-6, IL-17, IL-10, and IL-4, respectively. Asterisks represent statistical significance **p < 0.001, ****p<0.0001. Error bars: standard error between samples.
Figure 9.
Cytokines are produced in the supernatants of monocyte and tumor cell cultures. (a) – (e) – IFN-y, TNF-α, IL-6, IL-10, and IL-4 cytokines, respectively. *p < 0.05, **p < 0.01, **** p<0.0001. Error bars: standard error between samples.
Figure 9.
Cytokines are produced in the supernatants of monocyte and tumor cell cultures. (a) – (e) – IFN-y, TNF-α, IL-6, IL-10, and IL-4 cytokines, respectively. *p < 0.05, **p < 0.01, **** p<0.0001. Error bars: standard error between samples.
