Submitted:
29 December 2023
Posted:
04 January 2024
You are already at the latest version
Abstract
Keywords:
1. Introduction
2. Negative effects of supraharmonics ????
- power losses in conductors, due to frequency dependent phenomena, such as skin effect and proximity effects;
- aging of insulating materials (mainly in cables and transformers) due to local losses and self heating;
- aging of capacitors with a combination of effects of dielectric stress (similarly to what occurs to insulating materials) and increased wiring losses (especially for large power capacitors);
- specific damage to MV cable terminations caused by local heating and electric field gradient;
- triggering of network resonances (impacting on the resulting voltage or current distortion of primary emissions), including local resonance phenomena between connected loads and apparatuses (favored e.g. by the extensive use of interface and EMC filters) associated to the so called “secondary emissions”;
- interference to equipment in particular connected at the LV level, consisting of e.g. domestic appliances, information technology (IT), lighting, energy meters, etc.;
- specific interference to power line communication (PLC) circuits, more and more commonly used at LV, but also at MV, levels, for example to exchange information on energy metering and for control purposes.
2.1. Power losses
2.2. Aging of insulating materials
2.2.1. Partial discharges
2.2.2. Degradation of insulating materials
2.3. Aging of capacitors
2.4. Damage to MV cable terminations
2.5. Interference to equipment
2.6. Interference to PLC
2.7. SH transfer efficiency between MV and LV levels
- the transfer between LV and MV sides undergoes a significant resonance that is not visible from the MV side; apart from this (where the transfer ratio peaks to almost 10x the 50:1 nominal ratio), the values are low between about 0.2 and 0.01;
- the usual transfer behavior is that the phase L1 on the LV side influences the corresponding phase L1 on the MV side and similarly the phase L2, but not phase L3; this for a delta-wye transformer as customary used for MV to LV distribution;
- the transformer has a symmetric behavior for which the self transfer ratios (each LV phase to the corresponding one on the MV side) is the same (Figure 8);
- the transfer from MV to LV for the same phase is more effective and does not show significant variations vs. frequency, being at around unity (ranging between 0.64 and 2.25 up to 80 kHz).
- regarding the current LV-to-MV transfer the results for L1 to L1 show an almost unity transfer ratio between kHz and kHz with a slight amplification (30%) at some components;
- voltage, instead (always for L1 to L1 from LV to MV) is attenuated by a factor of 3 to 10 in the same frequency range;
- for the MV to LV transfer the results provided by [43] are not fully confirmed, having found a slightly larger variation (more persistently around a factor of 2 to 3); what is relevant is that in case of an unloaded transformer (not magnetized) the behavior is quite different and variable;
- last, also the LV-to-LV transfer occurring between the secondary windings of two different transformers through the MV grid was studied and the observed transfer ratio is more than unity (e.g. 2 to 3) at several frequency points, whereas some attenuation should be in general expected; this is a relevant result for what regards the propagation of interference within the same LV grid but on different feeders and parts of the grid.
3. Bibliometric assessment of references and findings
4. Lessons learned and compatibility levels for the SH interval
4.1. Existing normative limits and compatibility levels
4.2. Limits based on documented negative effects
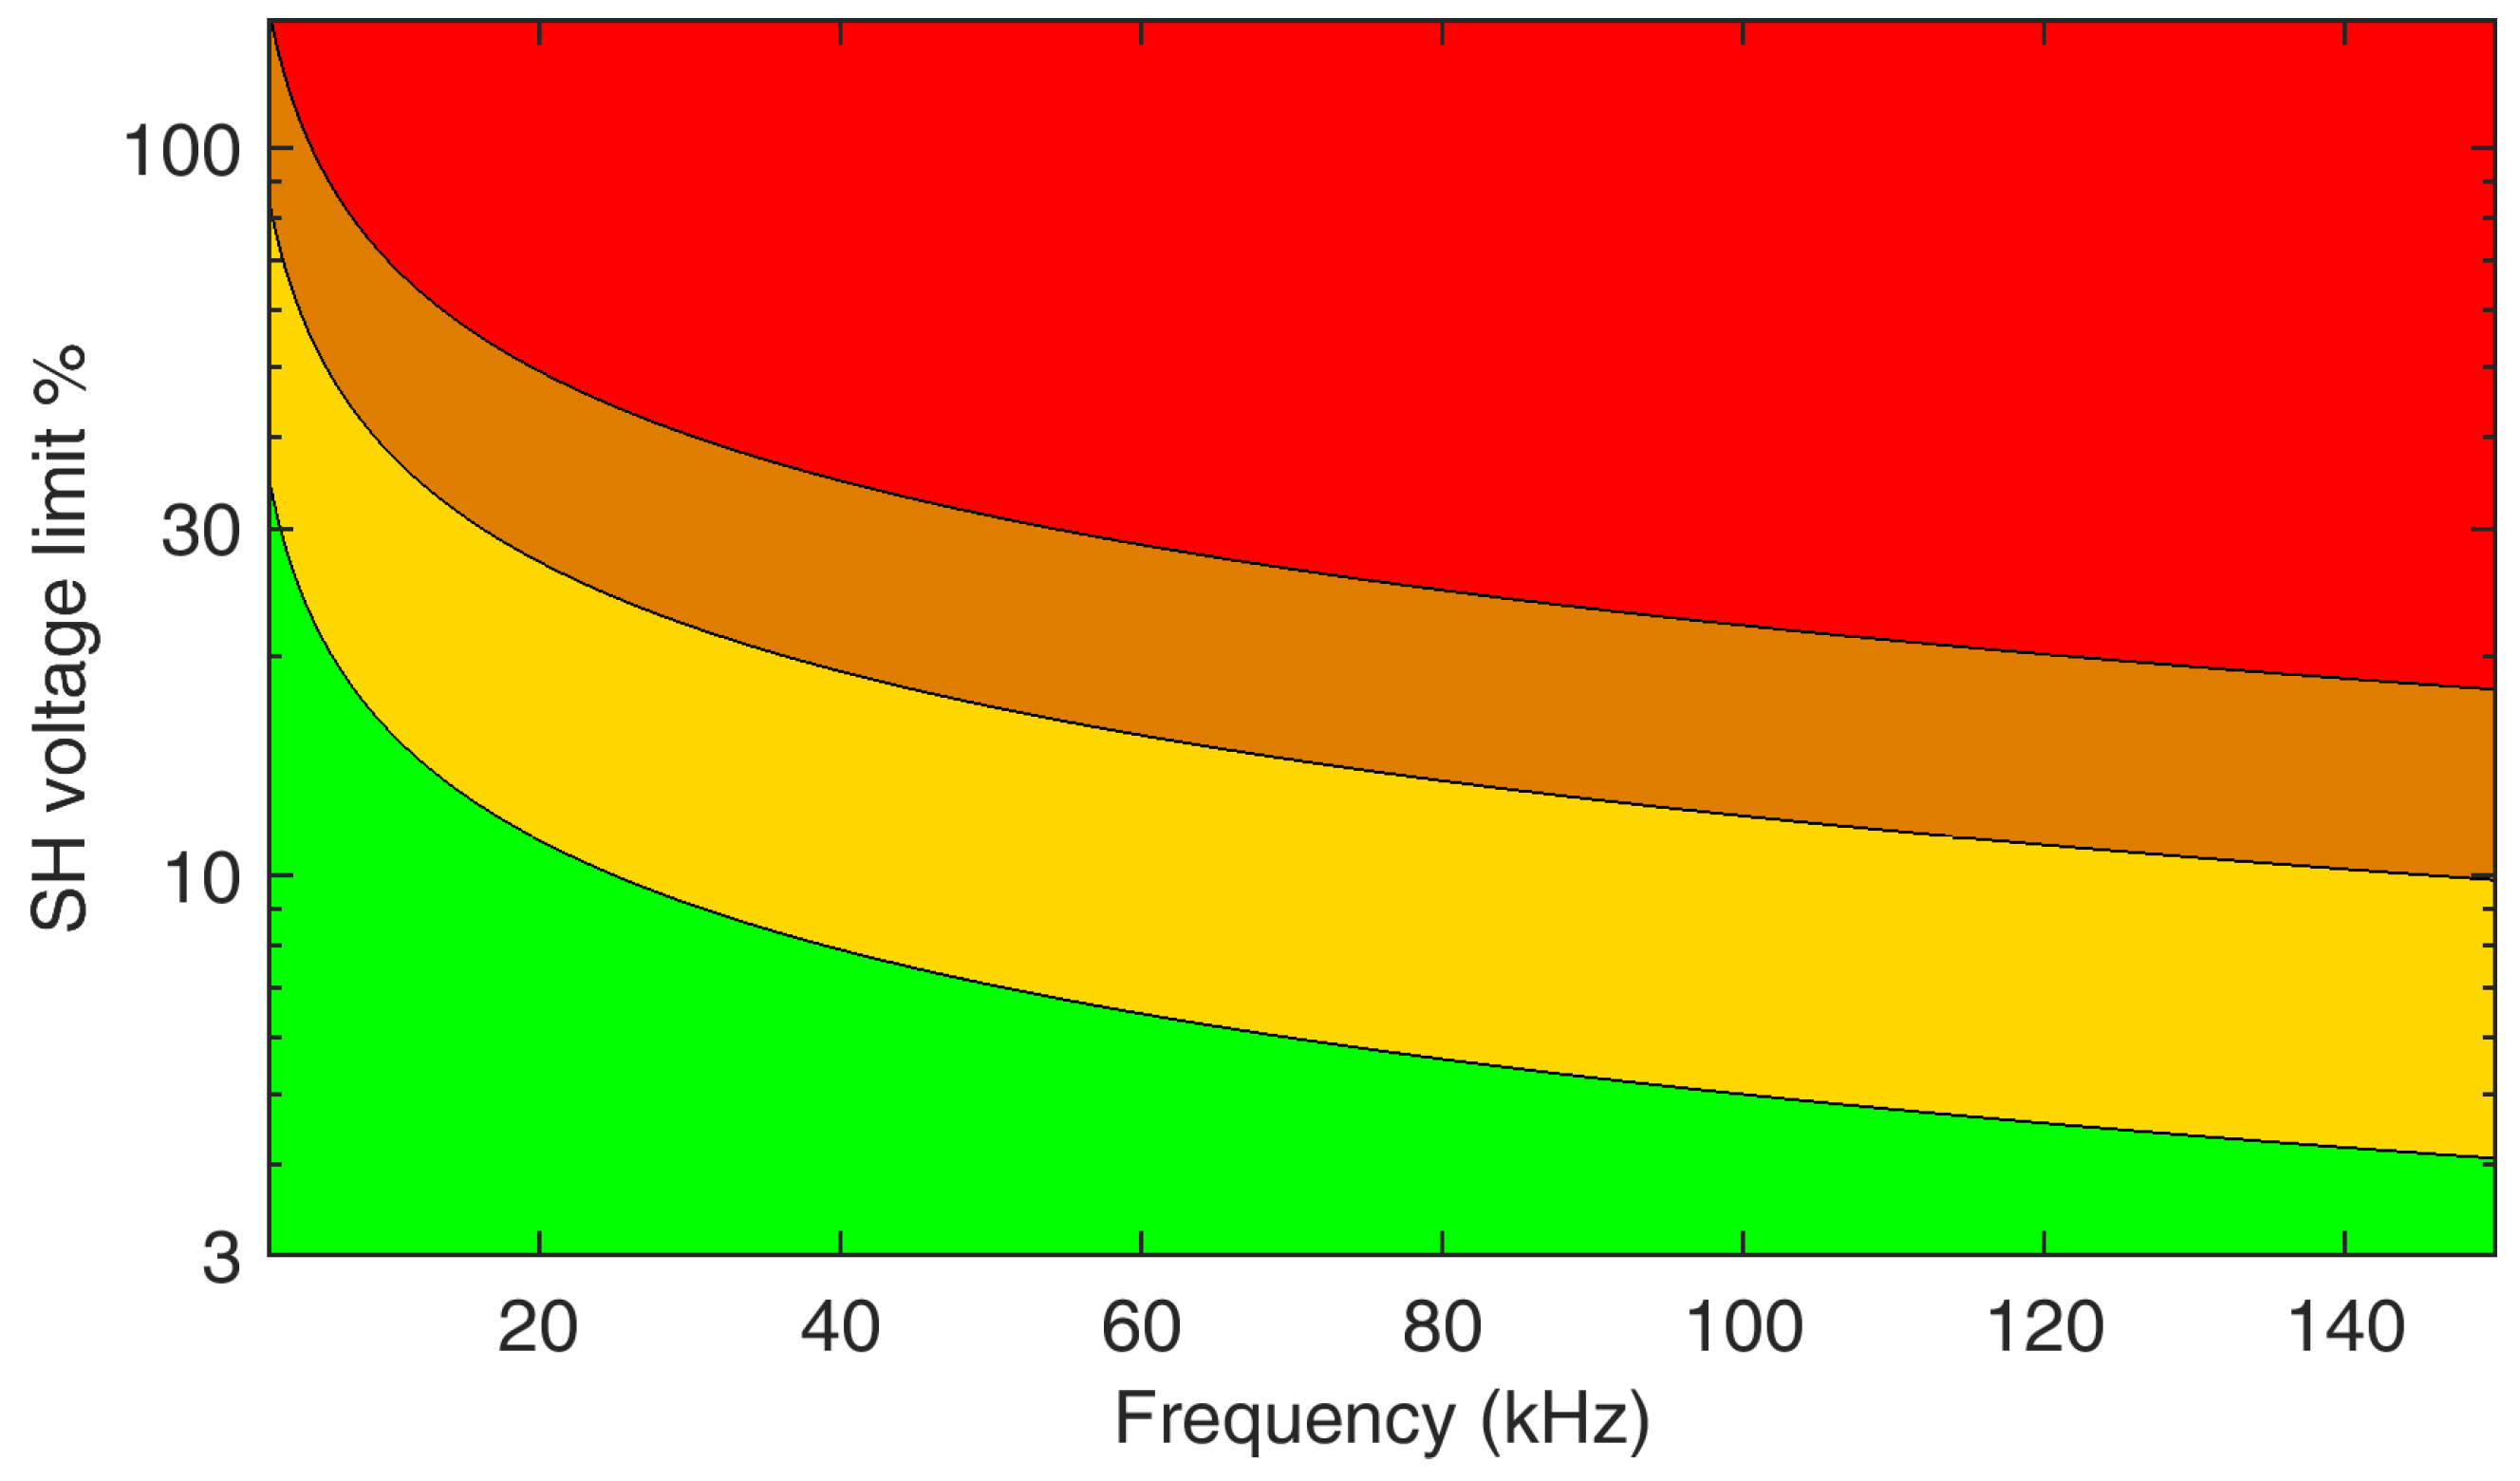
- losses and consequential heating taking the harmonic limits as reference for the Residential and Industrial applications, namely considering the current distortion limits of the EN 61000-3-2 (2019) [50] and EN 61000-3-12 (2019) [51], respectively; with a general assumption regarding the expected grid impedance, such limits are transformed into voltage distortion levels and then compared to those of the EN 61000-2-2 (2019) [46] and EN 61000-2-4 (2020) [48];
- effects at MV level, considering the critical values impacting on the reliability of cable joints (see Section 2.4).
4.2.1. Interference to PLC devices
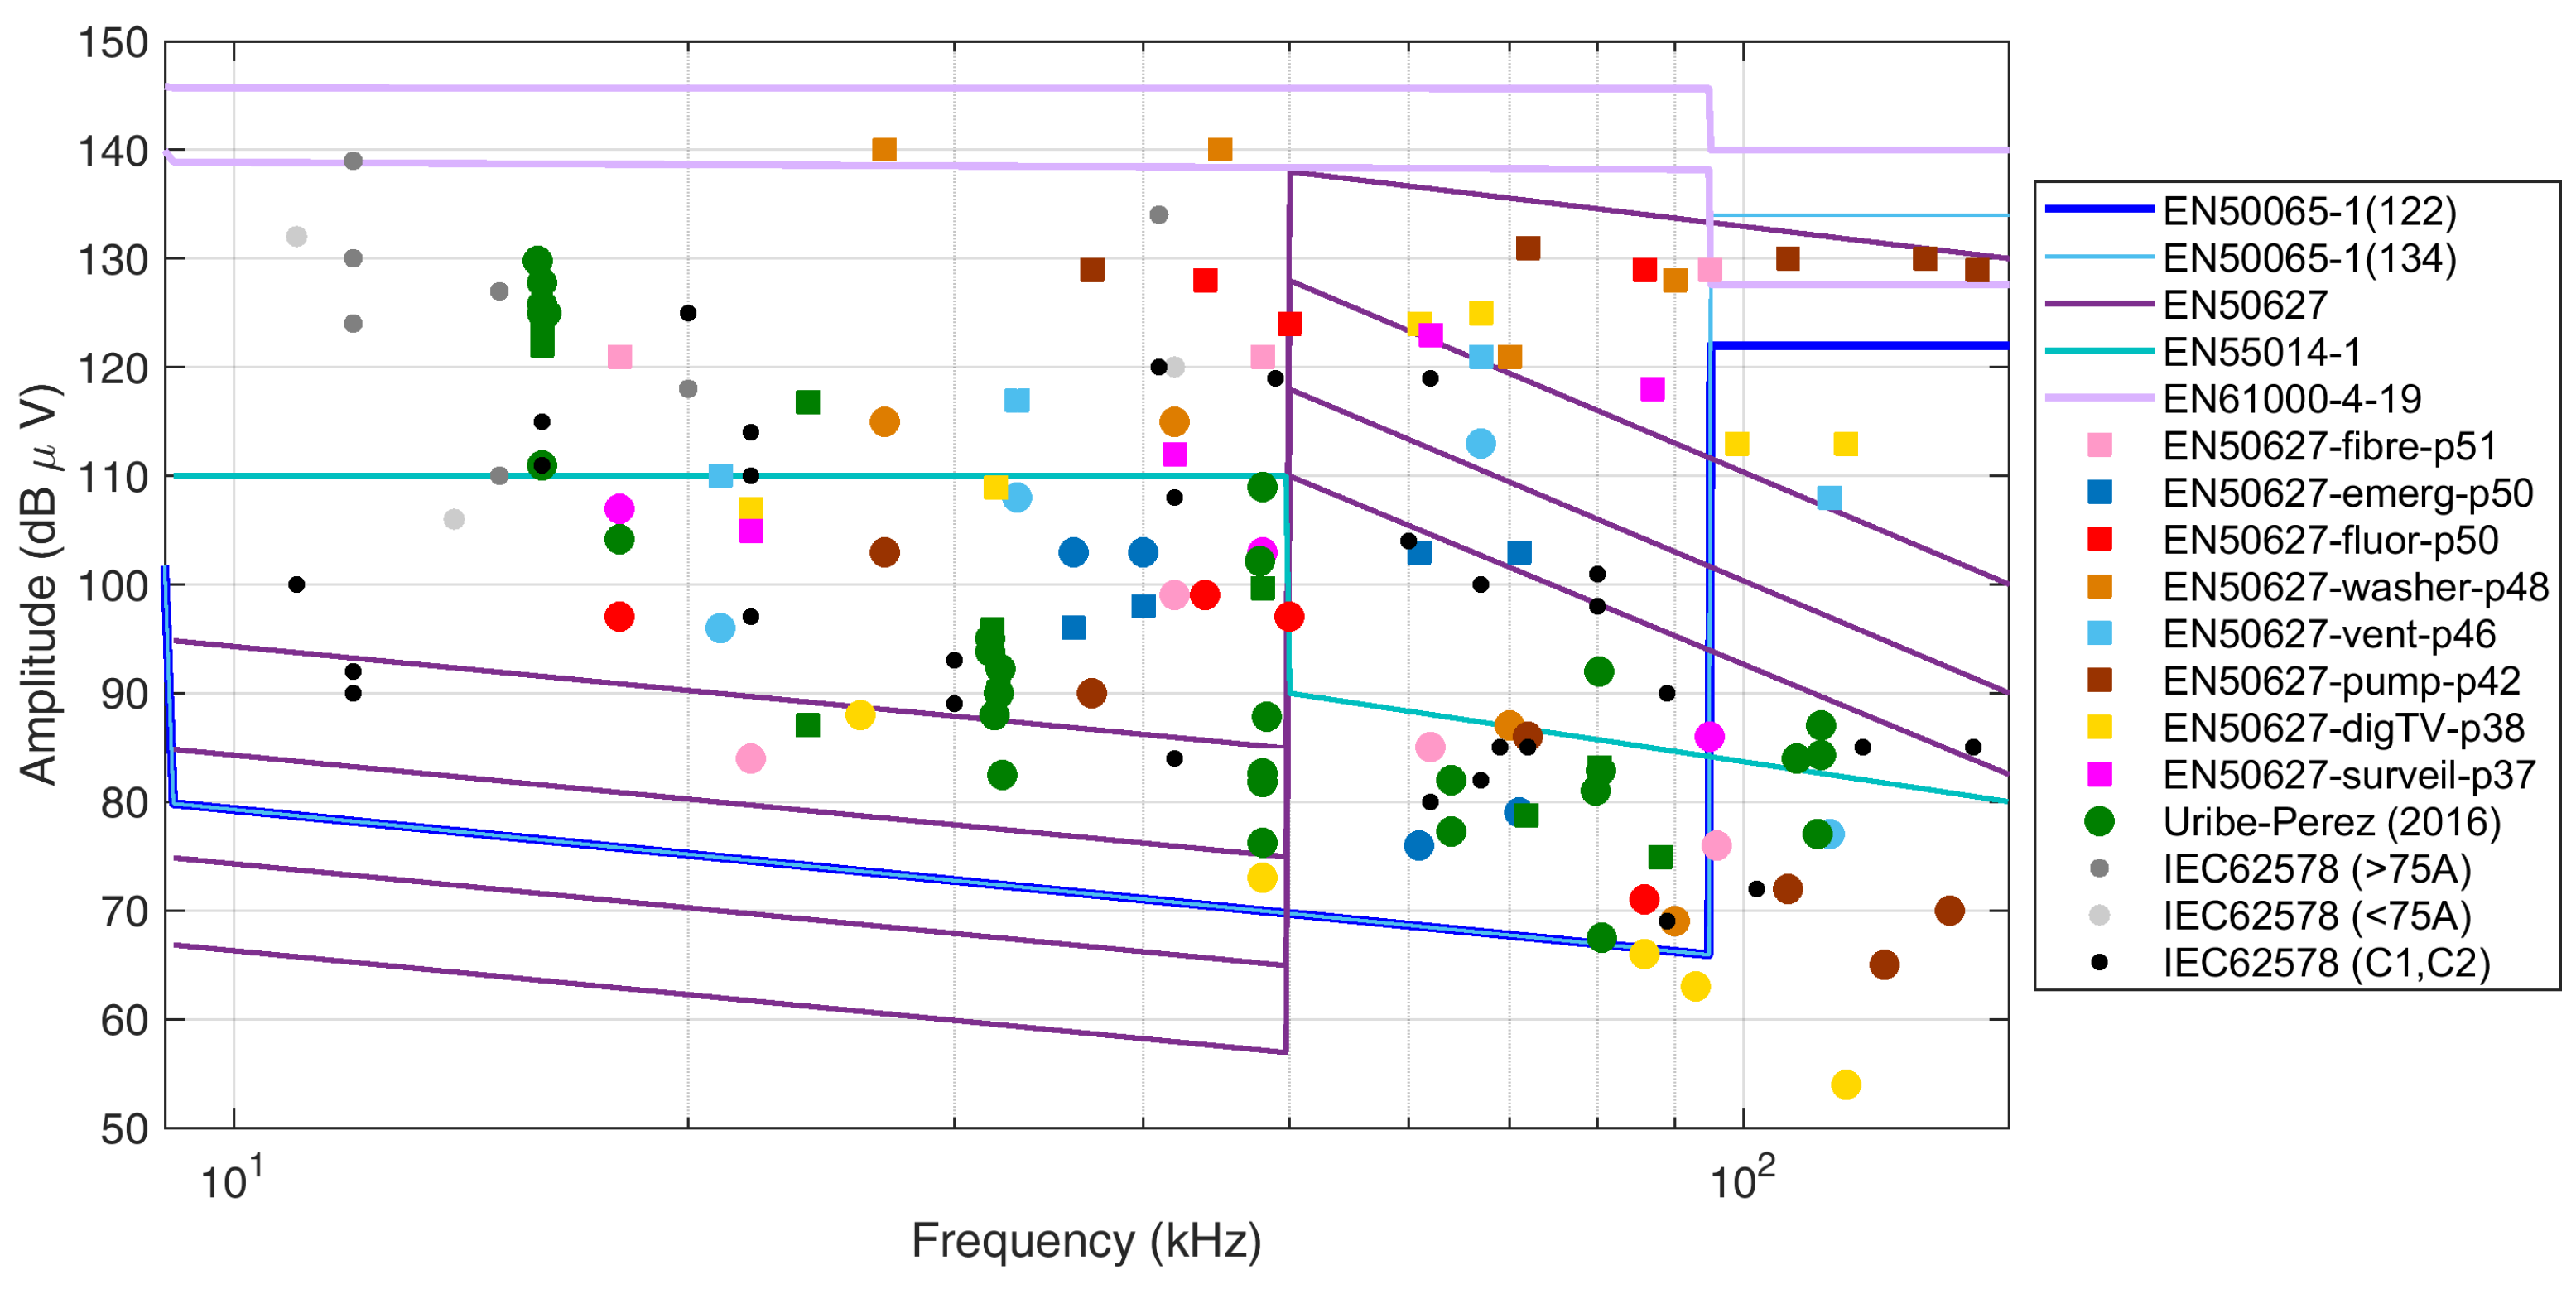
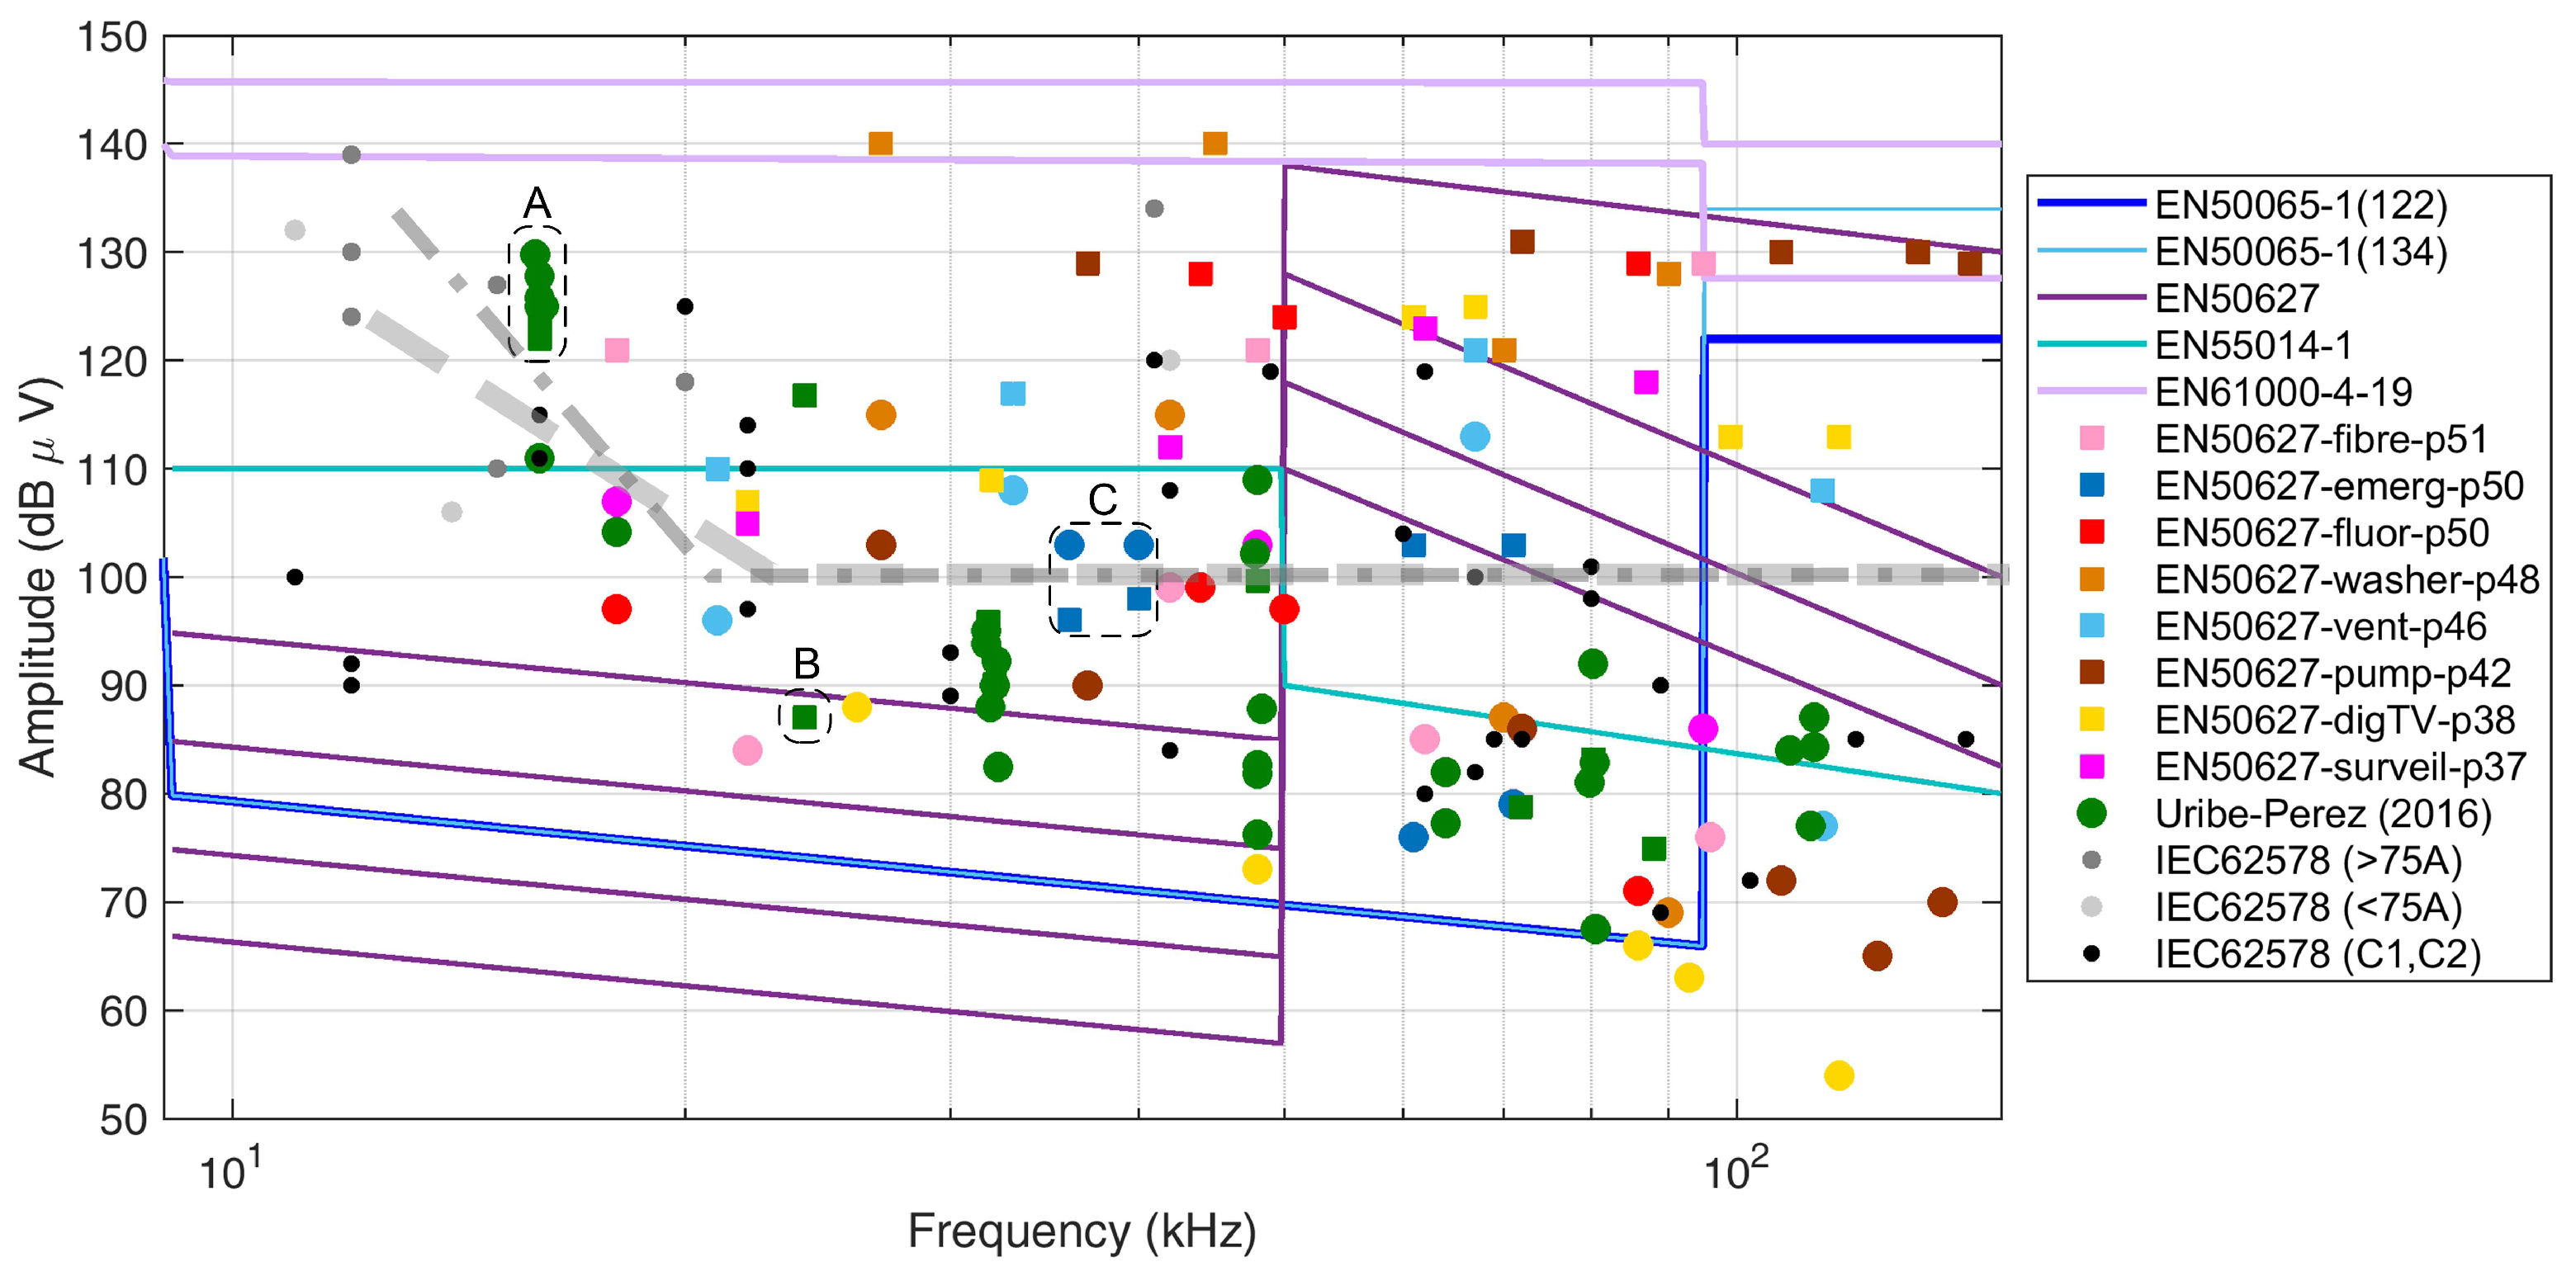
- Group A: the points have a spread of 8 dB only but with the interfering value reported as the lowest one; these values come different PV inverters connected at the same grid where interference was reported for one of the PLC devices in the same grid, so that it is possible that the attenuation from the source to the victim PLC is variable and accounts to some dB of variation, as well as that these values are not really interfering or not interfering with the PLC operation as they fall outside the 42kHz–89kHz Prime PLC operating band.
- Group B: similarly, this is an isolated point reported as interfering, but part of a broader spectrum where the interfering components fell inside the Prime PLC band.
- Group C: these two pairs at 35 kHz and 40 kHz are also very likely outside the operating band of the PLC in question, whereas confirmed interference for the square symbols is caused by the other points of the same case (blue squares) at 60 kHz and 70 kHz.
4.2.2. Losses and self-heating
4.2.3. Stress of MV cable joints
4.3. Assessment and specifications for Instrument Transformers
- Frequency Response. The frequency response of an IT poses a significant challenge when measuring supraharmonics. Most ITs and LPITs exhibit optimal performance only within a limited frequency interval. For example inductive ITs are subject to resonances outside the traditional 50Hz–2500Hz operating range; in addition, their response at higher frequencies may significantly deviate from the required flat profile, necessitating a comprehensive characterization process [63]. Although LPITs generally demonstrate better frequency performance, preliminary characterization remains indispensable.
- Amplitude of the Measured Signal and Sensitivity. Assessing the smaller SH amplitude proves challenging for ITs, which are inherently designed to achieve maximum accuracy at the rated voltage/current. Dealing with amplitudes that are 3 to 6 orders of magnitude lower than the nominal values presents a formidable task. Two potential solutions are conceivable: a) installing an additional IT dedicated to measuring the SH frequency range with the discussed amplitudes, or b) replacing all inadequate ITs with units capable of covering the entire frequency range between 50 Hz and 150 kHz. While both solutions entail considerable challenges and expenses, their phased implementation over several years could align with the economic and physical constraints of the system operator.
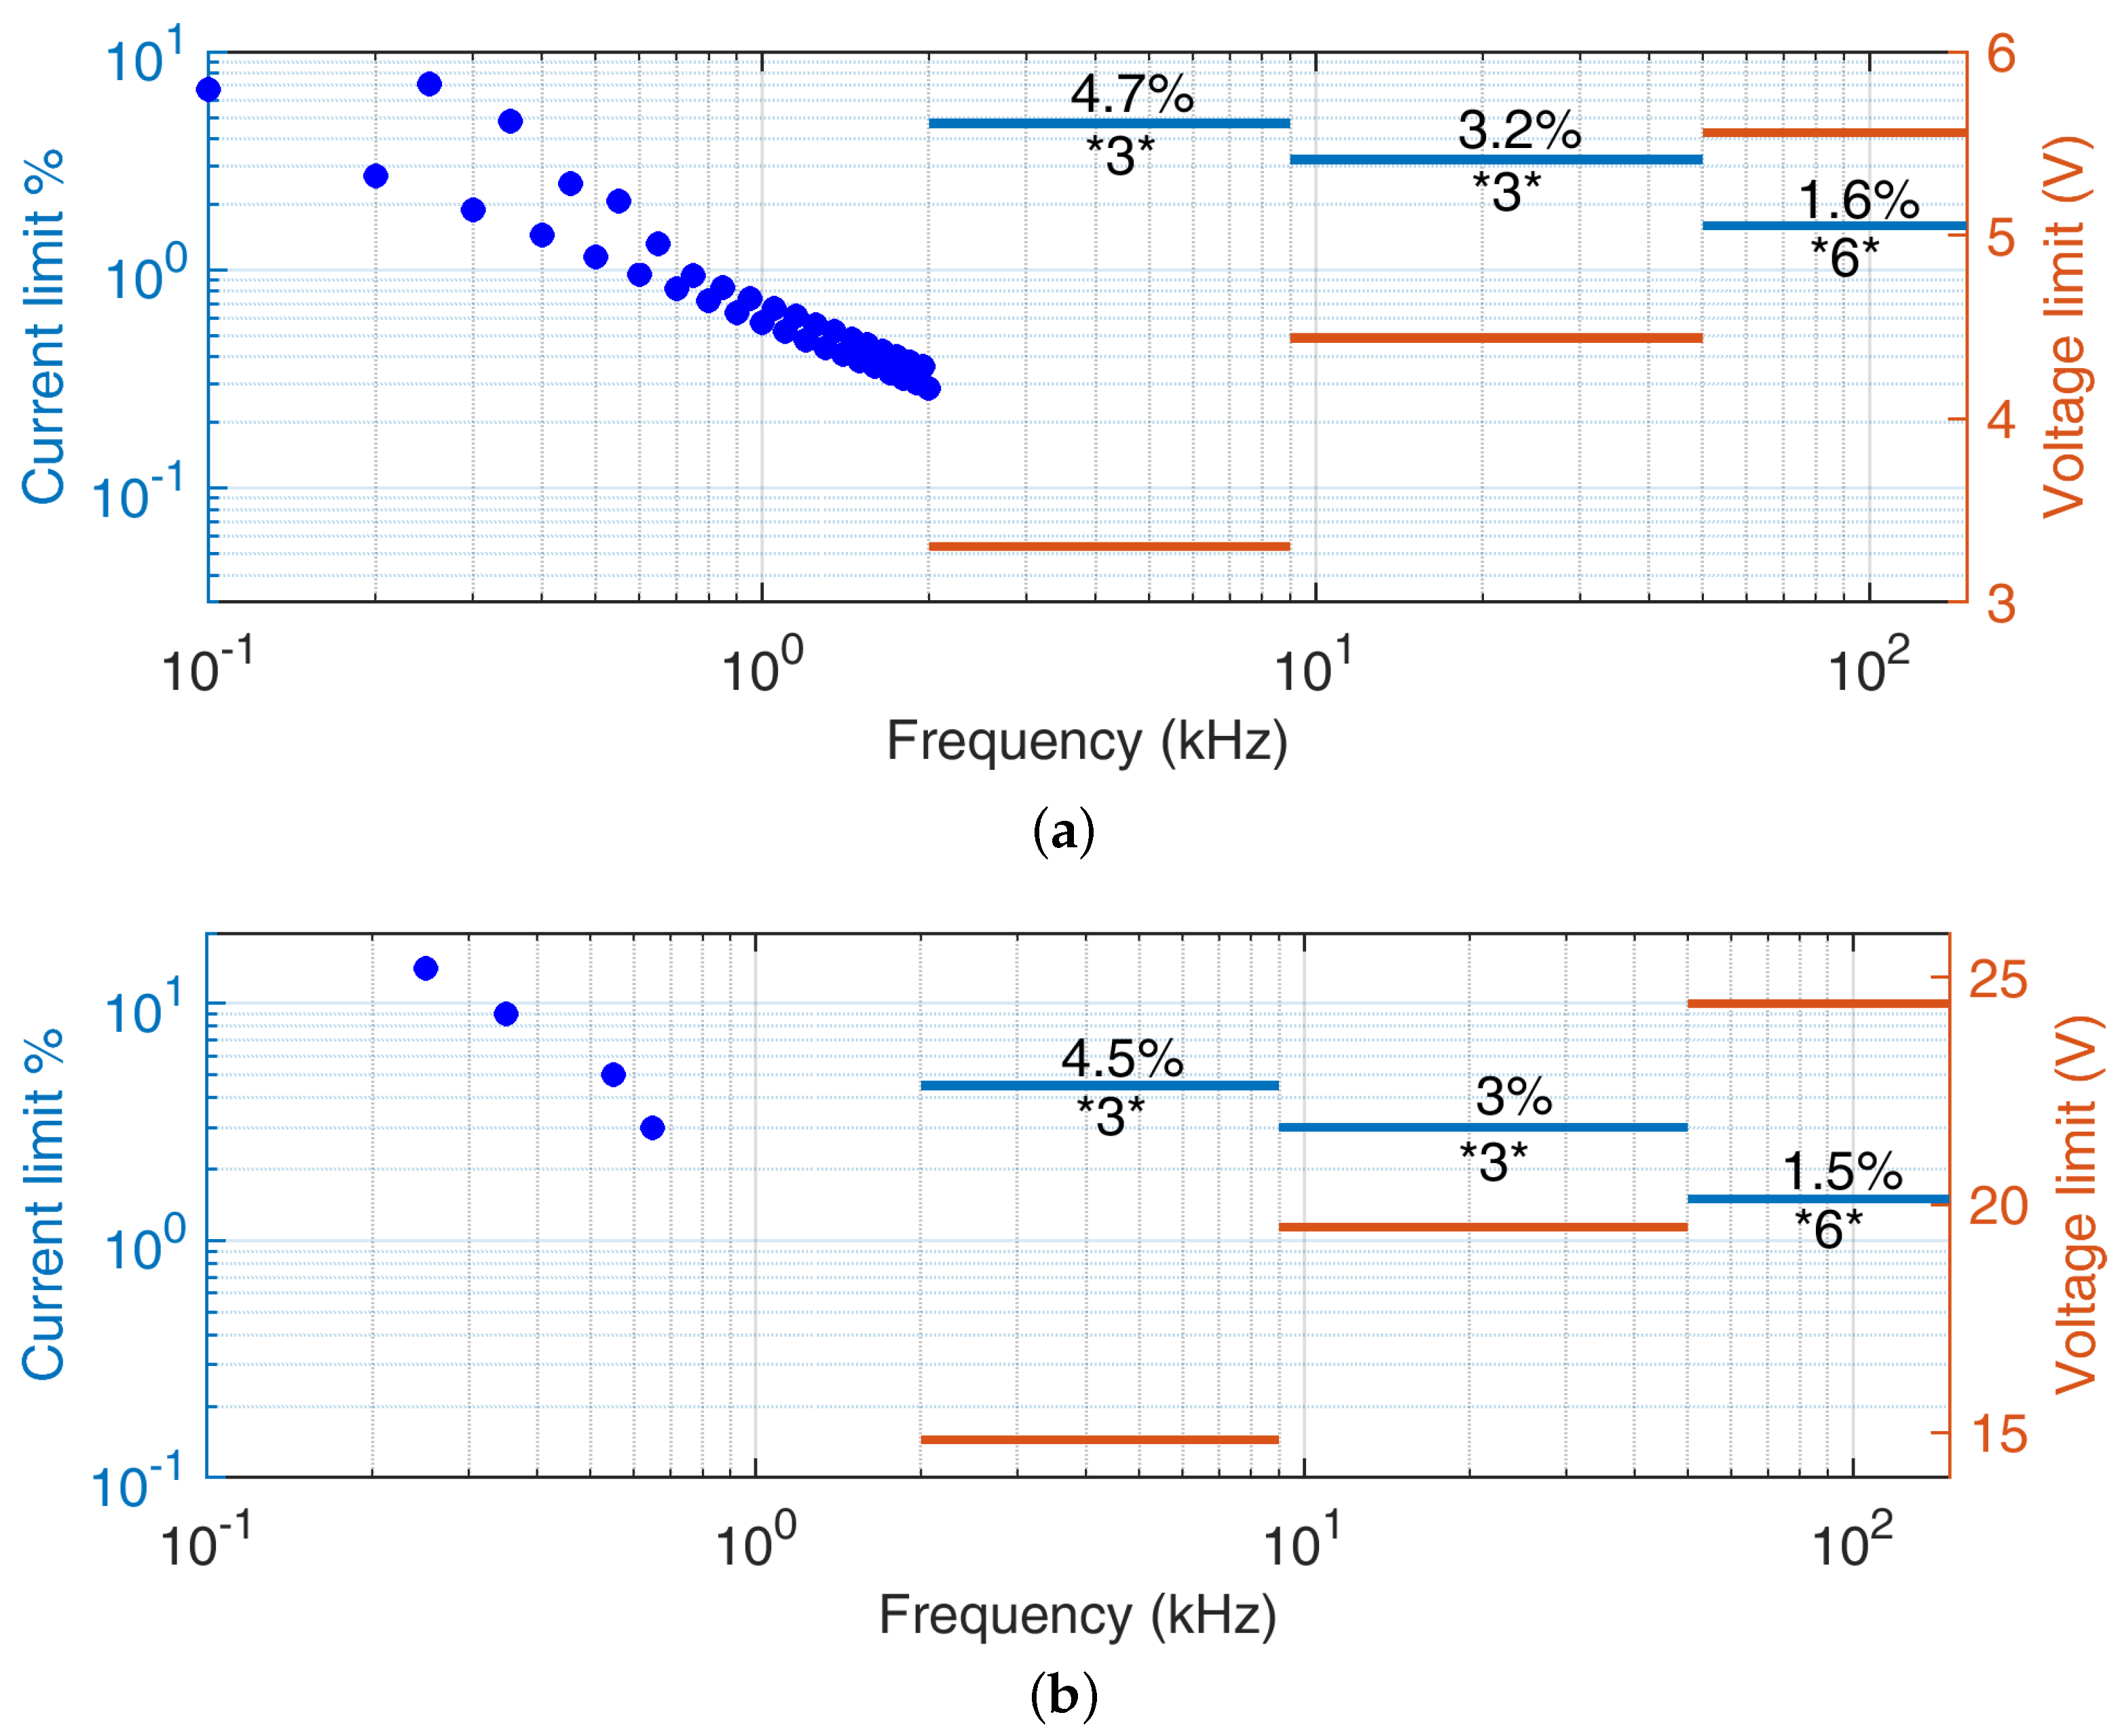
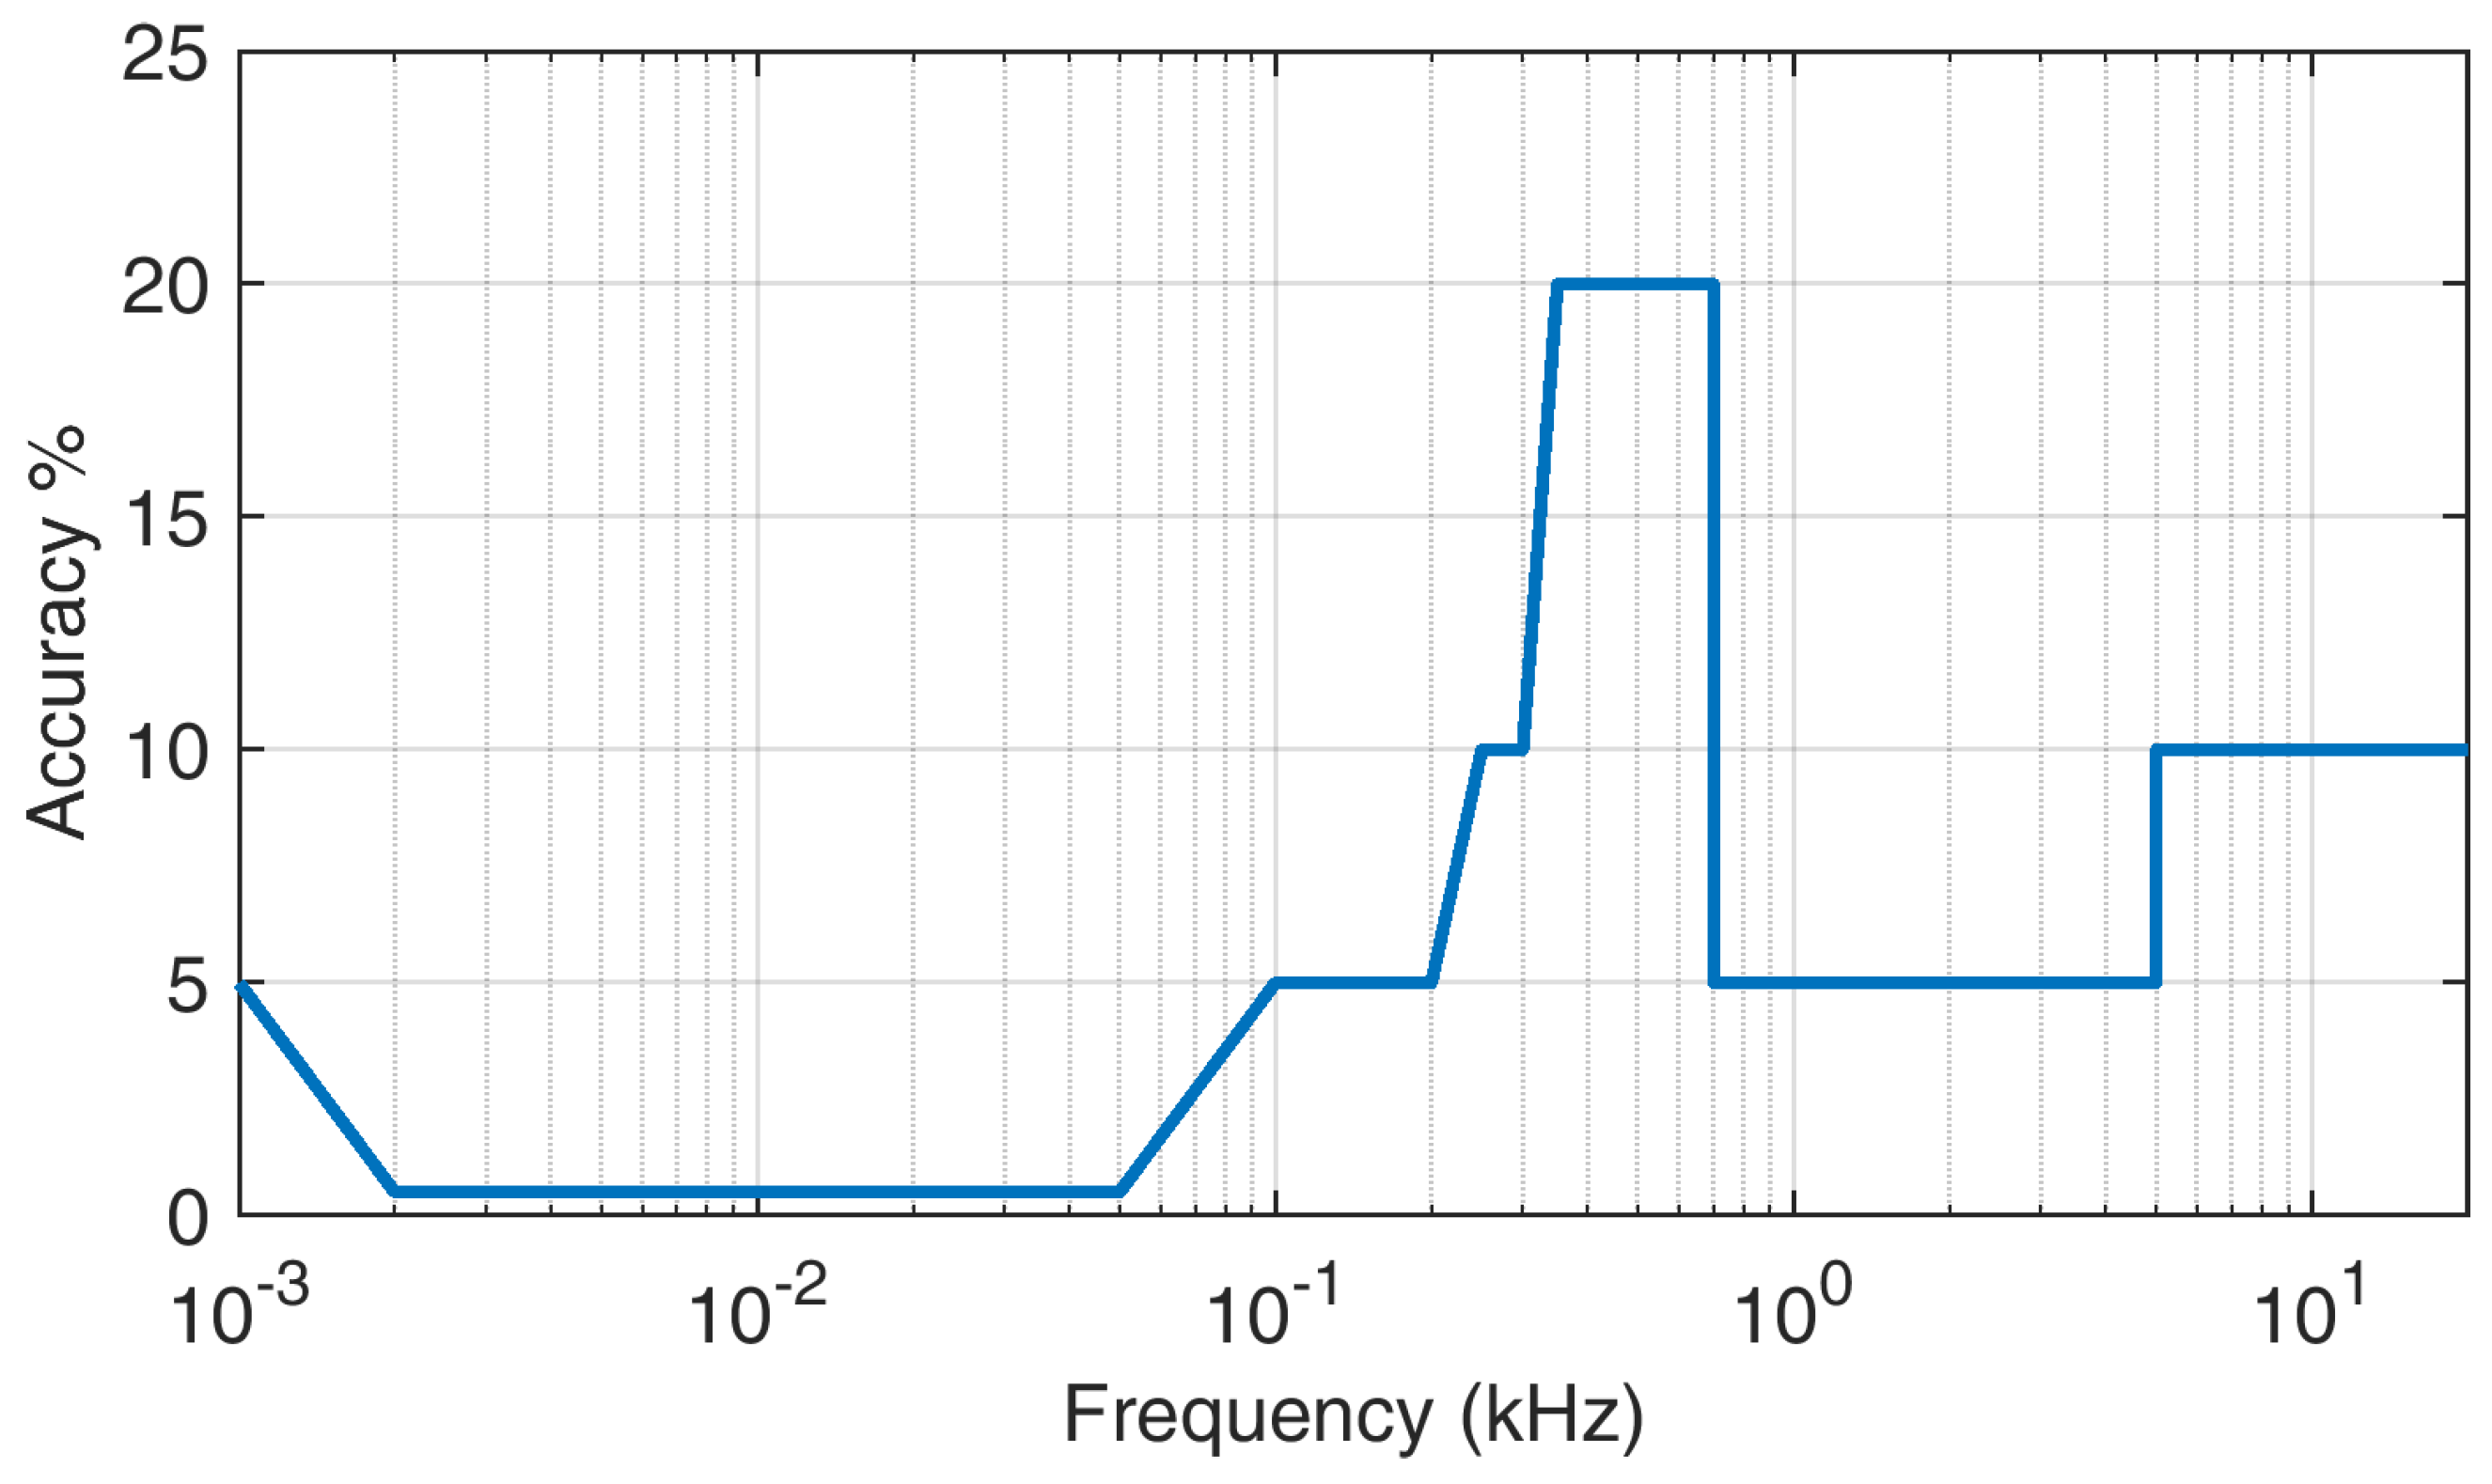
- Accuracy. Measurement accuracy is not only another way of describing the sensitivity problem, but it is also crucial when small and large signals combine onto the same IT sensor at the same time [64]. Figure 6 provides a summary of the current situation, derived from the IEC 61869-6 [59] and related documents, for all frequency sub-intervals considered in the standard. The curve shows that accuracy limits presently extend up to 20 kHz, with an average accuracy ranging from 5 % to 10 %. Similar indications are strongly necessary also for frequencies above 20 kHz to cover entirely the SH interval, but need to be determined with a careful trade-off of all physical and practical limitations of these devices.
5. Conclusions
Funding
Institutional Review Board Statement
Informed Consent Statement
Conflicts of Interest
References
- Yang, K.; Bollen, M.H.J.; Larsson, E.O.A. Aggregation and Amplification of Wind-Turbine Harmonic Emission in a Wind Park. IEEE Transactions on Power Delivery 2015, 30, 791–799. [Google Scholar] [CrossRef]
- Novitskiy, A.; Schlegel, S.; Westermann, D. Measurements and Analysis of Supraharmonic Influences in a MV/LV Network Containing Renewable Energy Sources. Electric Power Quality and Supply Reliability Conference (PQ) & Symposium on Electrical Engineering and Mechatronics (SEEM). IEEE, 2019. [CrossRef]
- Busatto, T.; Larsson, A.; Rönnberg, S.; Bollen, M. Supraharmonics Emission Assessment of Multi-level Converters Applied for Photovoltaic Grid-Connected Inverters. Renewable Energy and Power Quality Journal 2017, 1, 143–148. [Google Scholar] [CrossRef]
- Darmawardana, D.; Perera, S.; Meyer, J.; Robinson, D.; Jayatunga, U.; Elphick, S. Development of high frequency (Supraharmonic) models of small-scale (<5 kW), single-phase, grid-tied PV inverters based on laboratory experiments. Electric Power Systems Research 2019, 177, 105990. [Google Scholar] [CrossRef]
- Torquato, R.; Hax, G.R.T.; Freitas, W.; Nassif, A. Impact Assessment of High-Frequency Distortions Produced by PV Inverters. IEEE Transactions on Power Delivery 2021, 36, 2978–2987. [Google Scholar] [CrossRef]
- Sun, Y.; Jong, E.D.; Cuk, V.; Cobben, J. Ultra fast charging station harmonic resonance analysis in the Dutch MV grid: application of power converter harmonic model. CIRED - Open Access Proceedings Journal 2017, 2017, 879–882. [Google Scholar] [CrossRef]
- Cassano, S.; Silvestro, F.; Jaeger, E.D.; Leroi, C. Modeling of harmonic propagation of fast DC EV charging station in a Low Voltage network. 2019 IEEE Milan PowerTech. IEEE, 2019. [CrossRef]
- Chen, F.; Zhong, Q.; Zhang, H.; Zhu, M.; Müller, S.; Meyer, J.; Huang, W. Survey of harmonic and supraharmonic emission of fast charging stations for electric vehicles in China and Germany. CIRED 2021 - The 26th International Conference and Exhibition on Electricity Distribution. Institution of Engineering and Technology, 2021. [CrossRef]
- Alfieri, L.; Bracale, A.; Carpinelli, G.; Larsson, A. Accurate assessment of waveform distortions up to 150 kHz due to fluorescent lamps. 2017 6th International Conference on Clean Electrical Power (ICCEP). IEEE, 2017. [CrossRef]
- Li, T.; Rong, B.; Wu, Z.; Huang, J.; Huang, K. Research on supraharmonic emission characteristics and influence factors of two-stage single-phase frequency converter. Energy Reports 2023, 9, 1212–1224. [Google Scholar] [CrossRef]
- Gil-De-Castro, A.; Medina-Gracia, R.; Ronnberg, S.; Blanco, A.; Meyer, J. Differences in the performance between CFL and LED lamps under different voltage distortions. 2018 18th International Conference on Harmonics and Quality of Power (ICHQP). IEEE, 2018. [CrossRef]
- Sakar, S.; Ronnberg, S.; Bollen, M. Interferences in AC–DC LED Drivers Exposed to Voltage Disturbances in the Frequency Range 2–150 kHz. IEEE Transactions on Power Electronics 2019, 34, 11171–11181. [Google Scholar] [CrossRef]
- Knenicky, M.; Prochazka, R.; Hlavacek, J.; Sefl, O. Impact of High-Frequency Voltage Distortion Emitted by Large Photovoltaic Power Plant on Medium Voltage Cable Systems. IEEE Transactions on Power Delivery 2021, 36, 1882–1891. [Google Scholar] [CrossRef]
- Sefl, O. Influence of supraharmonics on aging rate of polymeric insulation materials. PhD thesis, Czech Technical University in Prague, 2021.
- Mariscotti, A. Power Quality Phenomena, Standards, and Proposed Metrics for DC Grids. Energies 2021, 14, 6453. [Google Scholar] [CrossRef]
- Palmer, J.A.; Degeneff, R.C.; McKernan, T.M.; Halleran, T.M. Pipe-type cable ampacities in the presence of harmonics. IEEE Transactions on Power Delivery 1993, 8, 1689–1695. [Google Scholar] [CrossRef]
- Espin-Delgado, A.; Letha, S.S.; Ronnberg, S.K.; Bollen, M.H.J. Failure of MV Cable Terminations Due to Supraharmonic Voltages: A Risk Indicator. IEEE Open Journal of Industry Applications 2020, 1, 42–51. [Google Scholar] [CrossRef]
- Klatt, M.; Kaiser, F.; Meyer, J.; Lakenbrink, C.; Gayner, C. Measurement and simulation of supraharmonic resonances in public Low Voltage networks. CIRED, 2019. [CrossRef]
- Letha, S.S.; Delgado, A.E.; Rönnberg, S.K.; Bollen, M.H.J. Evaluation of Medium Voltage Network for Propagation of Supraharmonics Resonance. Energies 2021, 14, 1093. [Google Scholar] [CrossRef]
- Bhagat, S.; Mariscotti, A.; Simonazzi, M.; Sandrolini, L. Variability of Conducted Emissions of EV Chargers due to Mutual Effects on a DC Grid. 2023 International Symposium on Electromagnetic Compatibility – EMC Europe. IEEE, 2023. [CrossRef]
- Ronnberg, S.; Wahlberg, M.; Bollen, M.; Lundmark, C. Equipment currents in the frequency range 9–95 kHz, measured in a realistic environment. 13th International Conference on Harmonics and Quality of Power. IEEE, 2008. [CrossRef]
- Espin-Delgado, A.; Rönnberg, S.; Busatto, T.; Ravindran, V.; Bollen, M. Summation law for supraharmonic currents (2–150 kHz) in low-voltage installations. Electric Power Systems Research 2020, 184, 106325. [Google Scholar] [CrossRef]
- Collin, A.J.; Femine, A.D.; Landi, C.; Langella, R.; Luiso, M.; Testa, A. The Role of Supply Conditions on the Measurement of High-Frequency Emissions. IEEE Transactions on Instrumentation and Measurement 2020, 69, 6667–6676. [Google Scholar] [CrossRef]
- Mariscotti, A.; Sandrolini, L.; Pasini, G. Variability Caused by Setup and Operating Conditions for Conducted EMI of Switched Mode Power Supplies Over the 2–1000 kHz Interval. IEEE Transactions on Instrumentation and Measurement 2022, 71, 1–9. [Google Scholar] [CrossRef]
- IEC 61869-14. Instrument Transformers — Additional requirements for current transformers for DC applications. IEC, Geneva, Switzwerland, 2019.
- Novitskiy, A.; Schlegel, S.; Westermann, D. Estimation of Power Losses Caused by Supraharmonics. E3S Web of Conferences 2020, 209, 07008. [Google Scholar] [CrossRef]
- IEC 60287-1-1. Electric cables — Calculation of the current rating. Part 1-1: Current rating equations (100 % load factor) and calculation of losses — General. IEC, Geneva, Switzwerland, 2023.
- Du, Y.; Burnett, J. Experimental investigation into harmonic impedance of low-voltage cables. IEE Proceedings - Generation, Transmission and Distribution 2000, 147, 322. [Google Scholar] [CrossRef]
- Topolski, L.; Warecki, J.; Hanzelka, Z. Methods for determining power losses in cable lines with non-linear load. Przegląd Elektrotechniczny 2018, 1, 87–92. [Google Scholar] [CrossRef]
- IEEE C57.110. IEEE Recommended Practice for Establishing Liquid Immersed and Dry-Type Power and Distribution Transformer Capability when Supplying Nonsinusoidal Load Currents. IEEE, New York, USA, 2018.
- IEC/TS 62578. Power electronics systems and equipment — Operation conditions and characteristics of active infeed converter (AIC) applications including design recommendations for their emission values below 150 kHz. IEC, Geneva, Switzwerland, 2015.
- Paulsson, L.; Ekehov, B.; Halen, S.; Larsson, T.; Palmqvist, L.; Edris, A.; Kidd, D.; Keri, A.; Mehraban, B. High-frequency impacts in a converter-based back-to-back tie; the eagle pass installation. IEEE Transactions on Power Delivery 2003, 18, 1410–1415. [Google Scholar] [CrossRef]
- de Castro, A.G.; Ronnberg, S.K.; Bollen, M.H.J. Harmonic interaction between an electric vehicle and different domestic equipment. 2014 International Symposium on Electromagnetic Compatibility. IEEE, 2014. [CrossRef]
- Mariscotti, A.; Sandrolini, L.; Simonazzi, M. Supraharmonic Emissions from DC Grid Connected Wireless Power Transfer Converters. Energies 2022, 15, 5229. [Google Scholar] [CrossRef]
- CLC/TR 50627. Study Report on Electromagnetic Interference between Electrical Equipment/Systems in the Frequency Range Below 150 kHz. CENELEC, Brussels, Belgium, 2015.
- CLC/TR 50669. Investigation Results on Electromagnetic Interference in the Frequency Range below 150 kHz. CENELEC, Brussels, Belgium, 2017.
- Slangen, T.M.H.; Lustenhouwer, B.R.F.; Cuk, V.; Cobben, J.F.G. The Effects of High-Frequency Residual Currents on the Operation of Residual Current Devices. Renewable Energy and Power Quality Journal 2021, 19, 67–72. [Google Scholar] [CrossRef]
- EN 61000-4-19. Electromagnetic compatibility (EMC). Part 4-19: Testing and measurement techniques — Test for immunity to conducted, differential mode disturbances and signalling in the frequency range 2 kHz to 150 kHz at a.c. power ports. CENELEC, Brussels, Belgium, 2014.
- Mariscotti, A. Harmonic and Supraharmonic Emissions of Plug-In Electric Vehicle Chargers. Smart Cities 2022, 5, 496–521. [Google Scholar] [CrossRef]
- EN 55014-1. Electromagnetic compatibility — Requirements for household appliances, electric tools and similar apparatus. Part 1: Emission. CENELEC, Brussels, Belgium, 2020.
- Ronnberg, S.K.; Bollen, M.H.J.; Wahlberg, M. Interaction Between Narrowband Power-Line Communication and End-User Equipment. IEEE Transactions on Power Delivery 2011, 26, 2034–2039. [Google Scholar] [CrossRef]
- Uribe-Pérez, N.; Angulo, I.; Hernández-Callejo, L.; Arzuaga, T.; de la Vega, D.; Arrinda, A. Study of Unwanted Emissions in the CENELEC-A Band Generated by Distributed Energy Resources and Their Influence over Narrow Band Power Line Communications. Energies 2016, 9, 1007. [Google Scholar] [CrossRef]
- Schottke, S.; Rademacher, S.; Meyer, J.; Schegner, P. Transfer characteristic of a MV/LV transformer in the frequency range between 2 kHz and 150 kHz. 2015 IEEE International Symposium on Electromagnetic Compatibility (EMC). IEEE, 2015. [CrossRef]
- Slangen, T.; de Jong, E.; Cuk, V.; Cobben, S. Transfer of supraharmonics through a MV/LV transformer. 27th International Conference on Electricity Distribution (CIRED 2023). Institution of Engineering and Technology, 2023. [CrossRef]
- Michalec, L.; Kostyła, P.; Leonowicz, Z. Supraharmonic Pollution Emitted by Nonlinear Loads in Power Networks — Ongoing Worldwide Research and Upcoming Challenges. Energies 2022, 16, 273. [Google Scholar] [CrossRef]
- EN 61000-2-2. Electromagnetic compatibility (EMC). Part 2-2: Environment — Compatibility levels for low-frequency conducted disturbances and signalling in public low-voltage power supply systems. CENELEC, Brussels, Belgium, 2019.
- EN 61000-2-12. Electromagnetic compatibility (EMC). Part 2-12: Environment — Compatibility levels for low-frequency conducted disturbances and signalling in public medium-voltage power supply systems. CENELEC, Brussels, Belgium, 2003.
- EN 61000-2-4. Electromagnetic compatibility (EMC). Part 2-4: Environment — Compatibility levels in industrial plants for low-frequency conducted disturbances. CENELEC, Brussels, Belgium, 2020.
- EN 50065-1. Signalling on low-voltage electrical installations in the frequency range 3 kHz to 148,5 kHz — Part 1: General requirements, frequency bands and electromagnetic disturbances. CENELEC, Brussels, Belgium, 2011.
- EN 61000-3-2. Electromagnetic compatibility (EMC). Part 3-2: Limits — Limits for harmonic current emissions (equipment input current ≤ 16 A per phase). CENELEC, Brussels, Belgium, 2019.
- EN 61000-3-12. Electromagnetic compatibility (EMC). Part 3-12: Part 3-12: Limits — Limits for harmonic currents produced by equipment connected to public low-voltage systems with input current > 16 A and ≤ 75 A perphase. CENELEC, Brussels, Belgium, 2019.
- Lodetti, S.; Bruna, J.; Sanz, J.F.; Melero, J.J. Characterization of the Emission of an Electric Bus Inductive Charging in the 2 kHz to 150 kHz Range. 2019 AEIT International Conference of Electrical and Electronic Technologies for Automotive (AEIT AUTOMOTIVE). IEEE, 2019. [CrossRef]
- IEC 61869-1. Instrument Transformers — General requirements for instrument transformers. IEC, Geneva, Switzwerland, 2023.
- IEC 61869-2. Instrument Transformers — Additional requirements for current transformers. IEC, Geneva, Switzwerland, 2012.
- IEC 61869-3. Instrument Transformers — Additional requirements for inductive voltage transformers. IEC, Geneva, Switzwerland, 2011.
- IEC 61869-4. Instrument Transformers — Additional requirements for combined transformers. IEC, Geneva, Switzwerland, 2014.
- IEC 61869-11. Instrument Transformers — Additional requirements for low-power passive voltage transformers. IEC, Geneva, Switzwerland, 2018.
- IEC 61869-5. Instrument Transformers — Additional requirements for capacitive voltage transformers. IEC, Geneva, Switzwerland, 2011.
- IEC 61869-6. Instrument Transformers — Additional requirements for low-power instrument transformers. IEC, Geneva, Switzwerland, 2016.
- IEC 61869-9. Instrument Transformers — Digital interface for instrument transformers. IEC, Geneva, Switzwerland, 2019.
- IEC 61869-10. Instrument Transformers — Additional requirements for low-power passive current transformers. IEC, Geneva, Switzwerland, 2018.
- IEC 61869-15. Instrument Transformers — Additional requirements for voltage transformers for DC applications. IEC, Geneva, Switzwerland, 2019.
- Crotti, G.; D’Avanzo, G.; Femine, A.D.; Gallo, D.; Giordano, D.; Iodice, C.; Landi, C.; Letizia, P.S.; Luiso, M.; Mazza, P. Characterization of Voltage Transformers for MV Applications Up to 150 kHz - A Preliminary Study. 2023 IEEE 13th International Workshop on Applied Measurements for Power Systems (AMPS). IEEE, 2023. [CrossRef]
- Crotti, G.; Giordano, D.; Letizia, P.; Signorino, D.; Iodice, C.; Luiso, M.; Mazza, P.; Palladini, D. How Undesired Non-Idealities of the Input Signal Affect the Accuracy Evaluation of Instrument Transformers at Power Frequency. 2023 IEEE 13th International Workshop on Applied Measurements for Power Systems (AMPS). IEEE, 2023. [CrossRef]
Disclaimer/Publisher’s Note: The statements, opinions and data contained in all publications are solely those of the individual author(s) and contributor(s) and not of MDPI and/or the editor(s). MDPI and/or the editor(s) disclaim responsibility for any injury to people or property resulting from any ideas, methods, instructions or products referred to in the content. |
© 2024 by the authors. Licensee MDPI, Basel, Switzerland. This article is an open access article distributed under the terms and conditions of the Creative Commons Attribution (CC BY) license (http://creativecommons.org/licenses/by/4.0/).


