
Submitted:
02 January 2024
Posted:
04 January 2024
You are already at the latest version
Abstract
Having garnered significant attention in the scientific community over the past decade, Wire Arc Directed Energy Deposition (arc-DED) technology is at the heart of this investigation into additive manufacturing parameters. Singularly focused on invar as the selected material, the primary objective revolves around devising an indirect cord height measurement approach. This innovative methodology involves the seamless integration of internal signals and sensors, enabling the derivation of crucial measurements sans the requirement for direct physical interaction or conventional measurement methodologies. Through the course of this research, meticulous alteration of deposition parameters is undertaken to thoroughly scrutinize their influence on the ultimate cord dimensions. The fusion of cutting-edge manufacturing techniques with advanced sensor technology constitutes the essence of this endeavor, offering substantial potential to augment precision and efficiency in additive manufacturing processes. Remarkably cost-effective, this solution circumvents the need for intricate measurements and significantly contributes to the proper layer-by-layer growth process.
Keywords:
wire arc additive manufacturing
; WAAM
; Invar
; wall geometry
; additive manufacturing monitoring
1. Introduction
In recent decades, Wire Arc Directed Energy Deposition (arc-DED) technology has gained significant traction within the scientific community, emerging as a focal point to produce additive components. A notable advantage of arc-DED lies in its robust deposition ratios, positioning it favorably among other additive methodologies [1,2]. This heightened attention has catalyzed a surge in research, propelling the exploration of 3D printed part fabrication [3]. Notably, aerospace applications have taken a prominent role, showcasing promising outcomes [4,5]. Of the arc-DED techniques, Gas Metal Arc Welding (GMAW) stands out for its elevated deposition rates, surpassing other wire-based technologies such as plasma-based arc-DED and Gas Tungsten Arc Welding (GTAW) [6,7]. The utilization of Invar alloy within this realm adds an intriguing dimension, leveraging its distinctive mechanical properties [8,9]. Comprising predominantly iron (64%) and nickel (36%) alloys, Invar finds purpose across diverse fields [10,11]. Renowned for its superior dimensional stability and mechanical prowess in cryogenic environments, Invar plays a pivotal role in applications demanding precision and reliability, as seen in metrology and aerospace components. The formidable challenge posed by its malleability and low heat conductivity in machining scenarios drives the interest in additive manufacturing for Invar, offering preforms aligning closely with final part geometries [12,13,14]. Invar’s application through PBF-LB/M has revealed optimal energy density ranges for mechanical properties [15], along with characteristic microstructures [16].
To advance the implementation of arc-DED technology in complex geometries, the fine-tuning of processes from initial passes has emerged as a key focus [17]. Understanding the geometry of zero beads has been central, often centering on models that correlate wire feed rate (WFR) and travel speed (TS) with bead geometry characteristics [18,19,20]. While conventional approaches maintain transverse bead geometry as constant during deposition, limited studies acknowledge longitudinal variations [21]. Pinto et al. [22] reported real-time determination of weld bead dimensions using passive vision systems and digital image processing. Proper construction of initial beads fundamentally underpins accurate manufacturing of final walls. Xiong et al. [23] delve into layer-by-layer forming characteristics analysis in GMAW-based arc-DED, while Donghong et al. [24] address corner piece generation for intricate geometries. Amid the importance of final bead geometry analysis, the challenge of online process control remains pronounced [25]. Infrared pyrometry techniques for melt-pool measurement have found favor within integrated process monitoring systems [26,27,28], some even hinting at symmetries in the generated geometries [9], offering a realm of exploration for the research community.
Throughout history, humanity’s quest for improved materials and fabrication techniques has driven innovation. Contemporary technological advancements have paved the way for novel materials with unprecedented applications. Among these, Invar 36, or FeNi36, has emerged as a versatile Fe-based alloy with exceptional properties. Its notably low Coefficient of Thermal Expansion (CTE) makes it a standout choice. Conventionally, Invar 36 is machined, yet its poor machinability due to high ductility, low heat conductivity, and substantial work hardening has sparked exploration into alternative manufacturing methods. Additive Manufacturing (AM) stands out as a solution, offering efficient material usage and design flexibility. While previous literature has predominantly explored Laser-based Powder Bed Fusion (PBF-LB/M) and power/laser directed energy deposition techniques, the usage of wire material and electric arc in AM is garnering renewed attention due to its potential to overcome the limitations of powder-based methods.
Focusing on the wire-based approach, this paper addresses the advantages of the arc-DED process, particularly its suitability for complex and large-scale parts due to its high deposition rates and cost-effectiveness. Leveraging symmetry analysis techniques for improved process understanding and control, this study aims to enhance the precision and efficiency of Invar material additive manufacturing.
This investigation aims to identify the optimal process parameters for achieving precise geometric walls in Invar material. The novelty of this paper is encapsulated in the innovative utilization of symmetry analysis techniques to address pivotal inquiries. These encompass an exploration of the geometry of zero beads via symmetry coefficient analysis in both longitudinal and transverse planes, an investigation into the symmetry of the final wall employing scanning laser technology, and a pioneering approach to melt-pool monitoring through the integration of infrared thermography techniques.
2. Materials and Methods
2.1. Experimental Setup and Material
In the experimental phase of this study, Invar wire was selected as the foundational material. The mechanical properties of this material, particularly its Coefficient of Thermal Expansion (CTE), stand as notable characteristics, driven by its specific chemical composition. The chemical properties of the wire, as provided by the supplier, are summarized in Table 1. It’s worth noting that the material employed in the tests originates from the same wire coil to ensure consistent chemical and metallurgical attributes.
2.2. Experimental Equipment
The experimentation was conducted at the Addilan V0.1 manufacturing center, specialized in WAAM technology. The setup includes an EWM brand generator, Titan XQ 400 AC puls DW, and an M drive 4 Rob5 XR RE wire feeder, as depicted in Figure 1. Additionally, the setup is equipped with a laser profilometer (Laser Scanner Q4 Series) and an infrared measurement camera (TACHYON 1024 microCAMERA Uncooled MWIR camera IP-67) operating at up to 1 kHz frame rate. The chosen generator mode was the pulsed GMAW mode specified by the manufacturer, enabling the introduction of a pulsed intensity signal into the supplied wire. The MC500 Weld Camera (Redman) offered a visual window into the deposition process from an external perspective. A shielding gas mixture of Ar (97.5%) and CO2 (2.5%) was utilized, with a flow rate of 17 L/min. The nozzle diameter installed was 20 mm.
2.3. Experimental Procedure and Parameters
The experimentation unfolded in two distinct phases. The initial phase focused on producing various zero beads to refine the optimal deposition parameters. In the subsequent phase, utilizing the optimized parameters, a larger wall was fabricated to assess the accuracy of the geometry achieved.
During the wall manufacturing process on a fixed table, the substrate was secured and prepared by cleaning before welding. The software programmed with manufacturing parameters for the walls was loaded, specifying the start and end points of welding to determine the wall length (100 mm). The wall was then meticulously constructed, with layers of beads added in a layer-by-layer manner. The stipulated growth per layer was set at 2.5 mm, and a geometric laser profilometer (Laser Scanner Q4 Series) was used to correct and determine the welding point for the subsequent layer. Table 2 encapsulates the experimental design for process optimization.
The profilometer is employed to assess the geometry of the beads, positioned perpendicular to the substrate, with its movement analogous to that of the welding torch. This integration within the same head ensures that the scanning trajectory of the profilometer is equivalent to the torch’s path during bead deposition.
3. Results
This section presents the experimental outcomes and discussion related to arc-DED process applied to Invar. The chapter is structured into three interconnected subsections, each focusing on distinct aspects of the study. The first segment focuses on the measurement results pertaining to the bead profile, shedding light on the geometry of the initial bead and its implications for process parameters. The subsequent segment unveils the acquisition and analysis of current and voltage signals, offering insights into the dynamic nature of the process. Notably, the final facet of this chapter is dedicated to exploring the potential application of a virtual sensor for height measurement. This application leverages the signals from the generator and wire tractor, aiming to ascertain the height based on these instrumental inputs.
These interconnected components synergistically contribute to a holistic comprehension of the arc-DED process on Invar, as well as its implications for geometric precision and manufacturing performance.
3.1. Measurement and modeling of Zero Bead Geometry
The zero bead, Figure 2, the first pass of material deposited during arc-DED, plays a crucial role in determining the final geometry and properties of the deposited material. Accurately measuring and modeling the zero bead geometry is essential for optimizing arc-DED parameters and ensuring consistent part quality. The image shows a top view of a bead deposited using arc-DED. The middle section of the bead exhibits a different geometry than the beginning and end sections. This is due to the flux of the molten material during the welding process. The flux of the molten material can lead to a slight variation in the bead geometry at this location. At the beginning of the bead, the molten material is still flowing and has not yet fully solidified. The bead is slightly wider and has a more irregular surface finish in the beginning section. This is due to the flux of the molten material, which can cause the bead to spread out and form a less uniform surface. Similarly, at the end of the bead, the molten material is starting to solidify, and the flux is decreasing. This can also lead to a slight variation in the bead geometry. The bead is slightly narrower and has a slightly more irregular surface finish in the end section. This is due to the decreasing flux of the molten material, which can cause the bead to narrow and form a less uniform surface. The middle section of the bead, however, is where the molten material has fully solidified, and the flux is at a minimum. As a result, the bead geometry in this section is more uniform and consistent. The bead has a more uniform width and a smoother surface finish in the middle section. This is because the molten material has fully solidified, and the flux is at a minimum in this section. It is important to note that the variations in bead geometry observed in the image are relatively minor. However, understanding these variations is important for ensuring consistent part quality and optimizing material properties. In the context of this image, the analysis will focus on the middle section of the bead, where the bead geometry is most uniform and consistent. By measuring and modeling the bead geometry in this section, engineers can gain valuable insights into the arc-DED process and its impact on material properties.
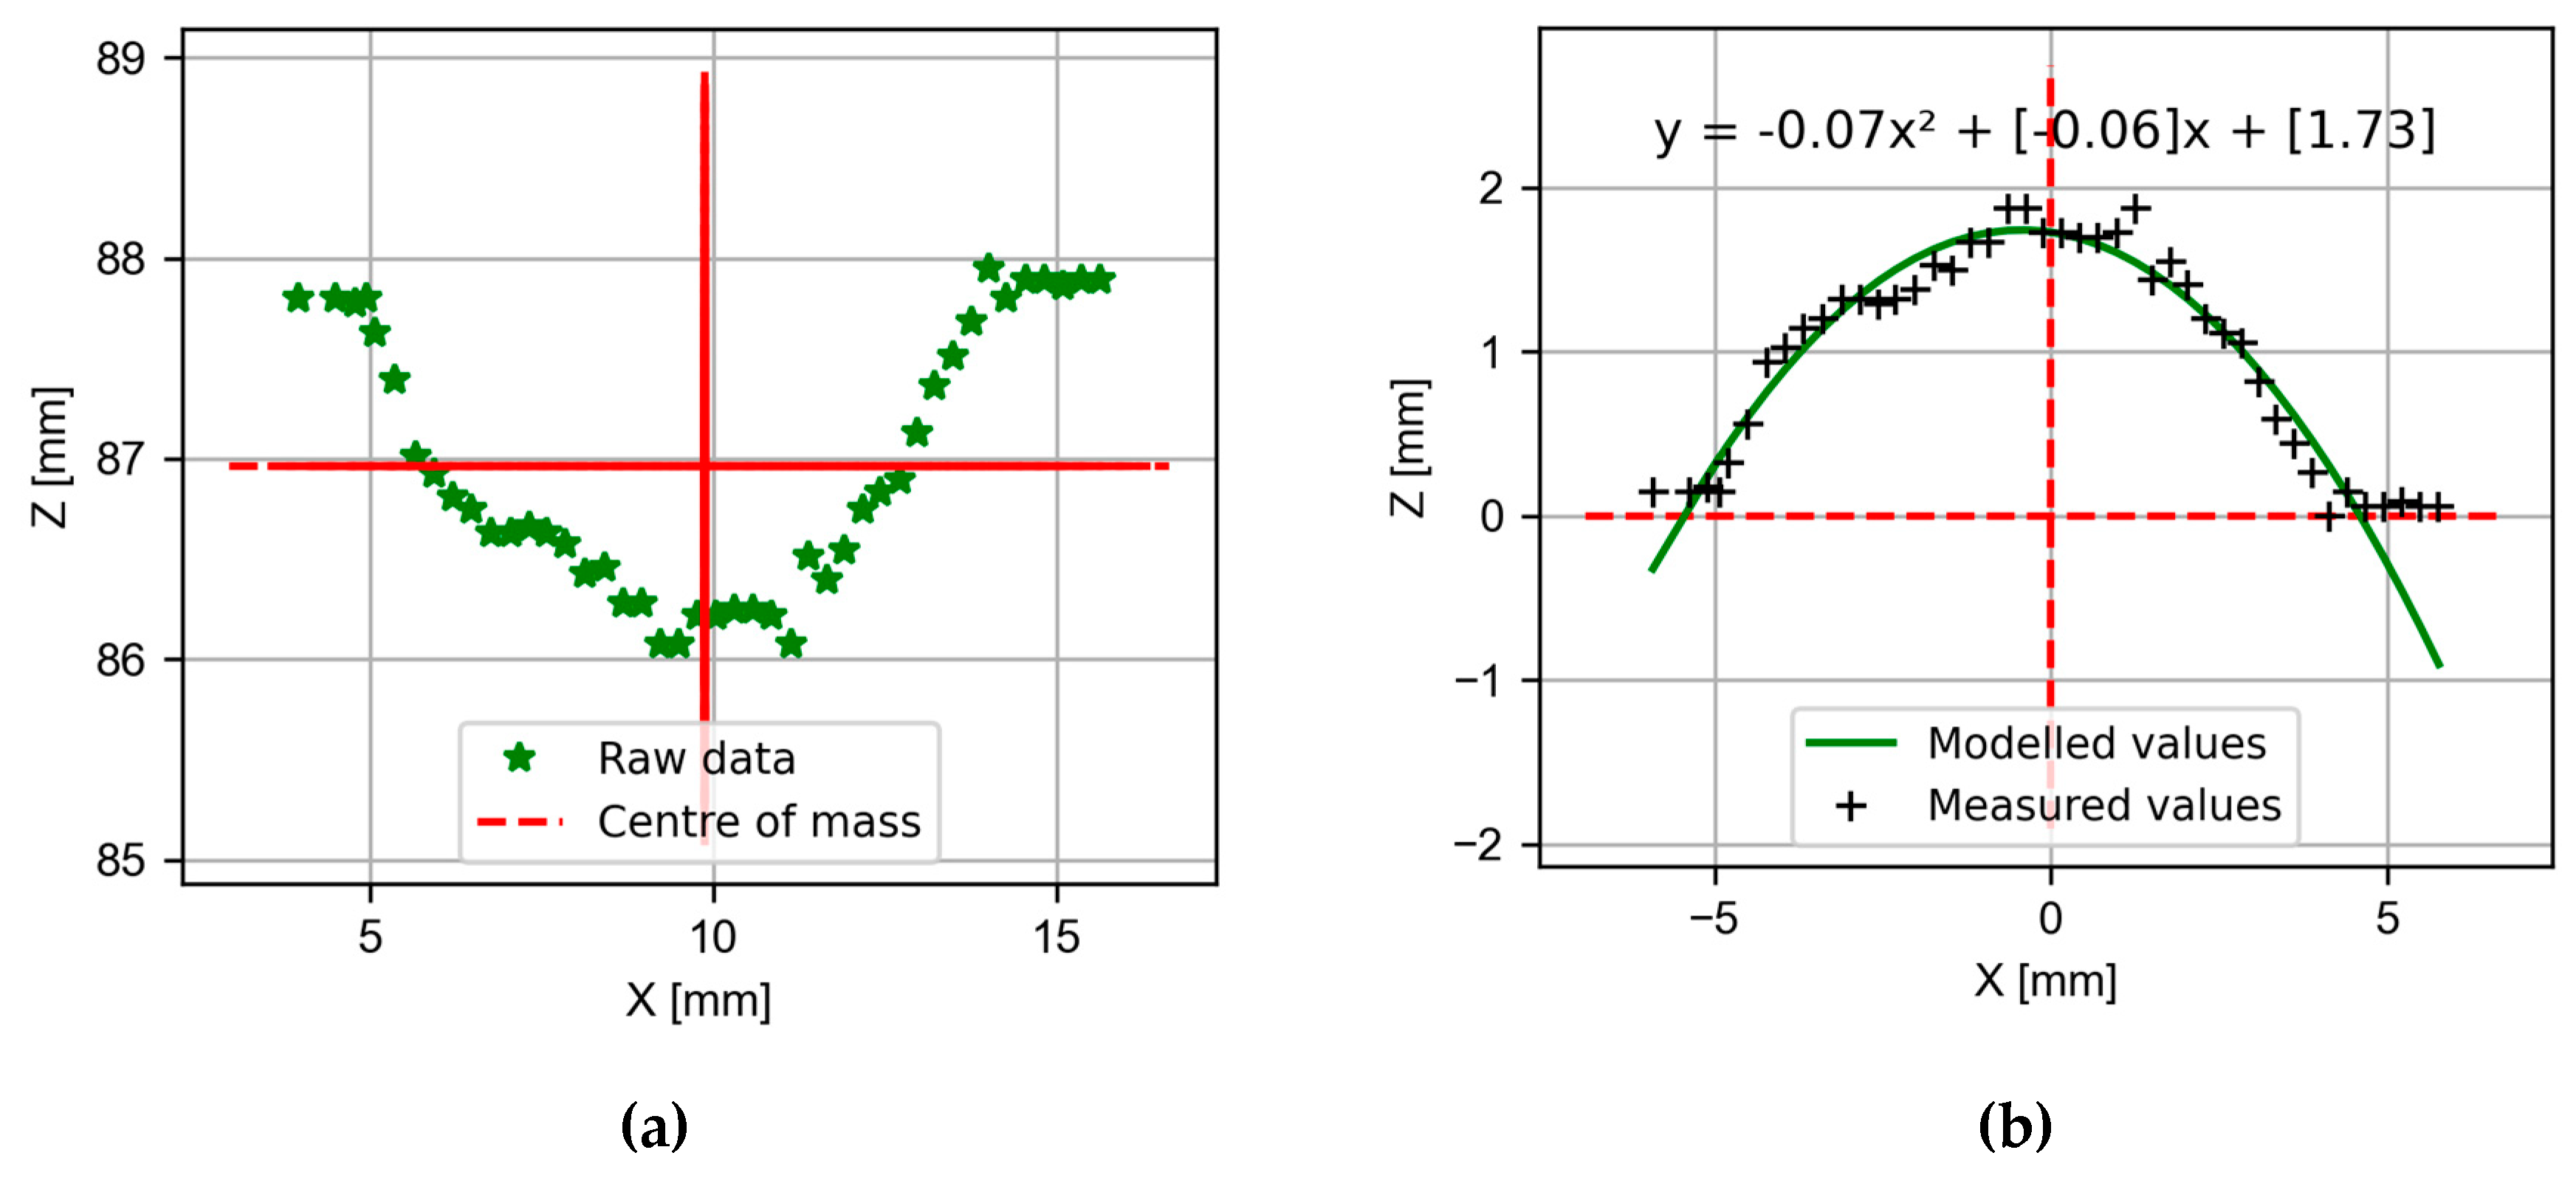
The presented approach to measuring the zero bead geometry involves scanning the bead surface with a laser profilometer. The laser profilometer precisely measures the distance between the laser beam and the bead surface at a series of discrete points, capturing a detailed representation of the bead’s transversal profile. The centre of mass of the function formed by the measured profile points is calculated. To do this in two dimensions it can be found by first dividing the domain of the function into a regular grid of points. Then, the weighted average of the coordinates of these points can be calculated, where the weights are the values of the function at these points. The formula, equation (1), for the centre of mass (xcm, ycm) is:
These equations give you the coordinates of the center of mass for a two-dimensional object with either continuous or discrete mass distribution. Adjust the integrals or sums based on the specific form of your mass distribution.
This data can then be used to fit a parabolic equation, representing the idealized parabolic shape of the zero bead. The fitted parabola provides valuable insights into the bead’s geometry, including its height and width.
Figure 3.
Zero bead morphology: a) point cloud and center of masses of the zero bead and b) modelled parabola for the profile.
Figure 3.
Zero bead morphology: a) point cloud and center of masses of the zero bead and b) modelled parabola for the profile.
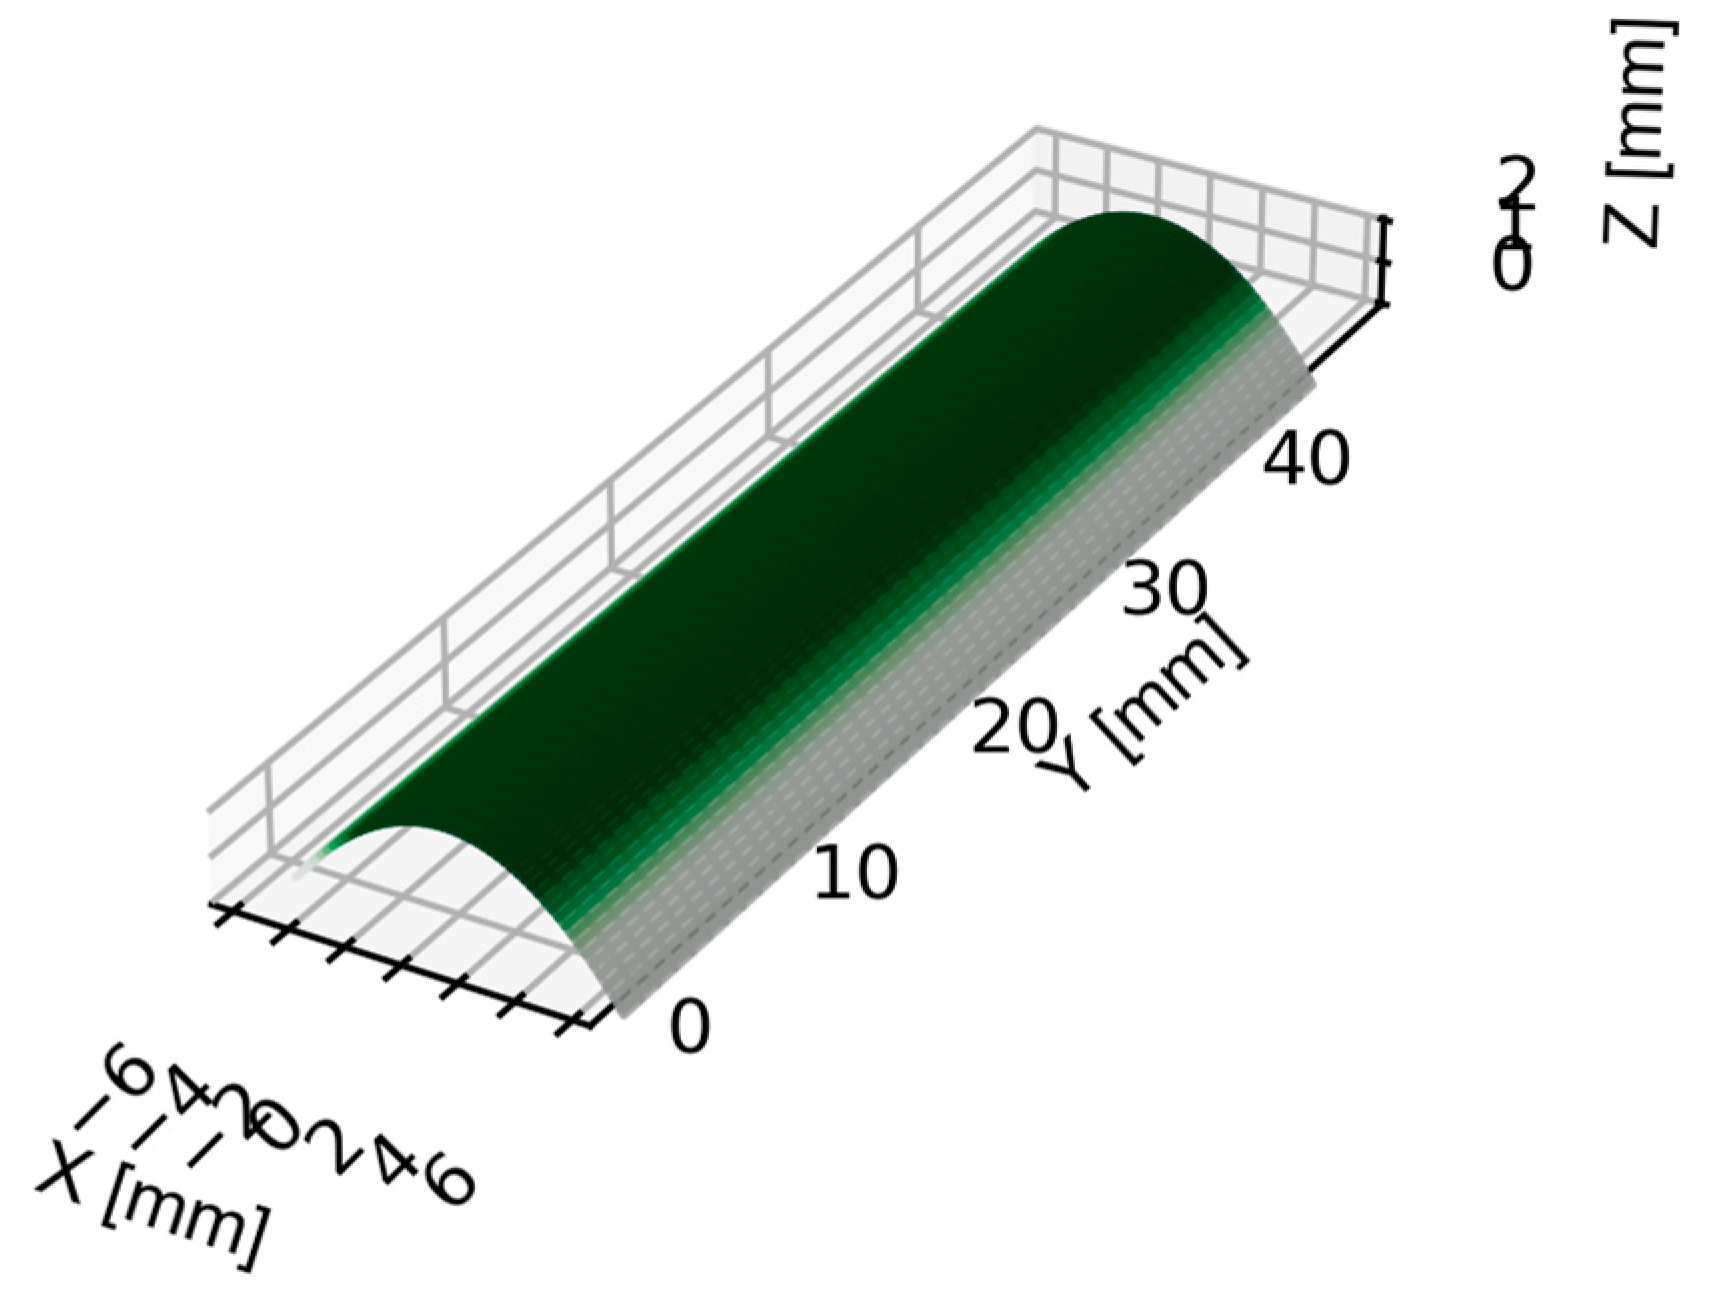
To further enhance the accuracy of the bead geometry representation, 3D modeling techniques can be employed, as can be seen in. By combining the fitted parabola with the measured bead dimensions, a comprehensive 3D model can be developed. This model provides a holistic view of the bead’s shape, size, and distribution of material. The comparison of the 3D model to theoretical models of zero beads provides valuable insights into the influence of arc-DED parameters on bead geometry. By understanding the relationship between process parameters and bead shape, engineers can optimize arc-DED settings to achieve the desired bead geometry and material properties.
Figure 4.
Zero bead morphology: a) point cloud and center of masses of the zero bead and b) modelled parabola for the profile Test 1.
Figure 4.
Zero bead morphology: a) point cloud and center of masses of the zero bead and b) modelled parabola for the profile Test 1.
The measuring and modeling the zero bead geometry in arc-DED is a critical step in understanding and optimizing the process. The insights gained from these measurements can be used to ensure consistent part quality, enhance material properties, and optimize the design of arc-DED applications. Table 3 summarizes the results of bead height (h) and bead width (w) for the manufacturing conditions.
The data indicates that there is a significant relationship between the welding parameters and the resulting bead dimensions. As the wire feed rate and deposition rate increase, the average bead width (w) and height (h) also increase. Conversely, increasing the traverse speed leads to a decrease in the average bead width and height.
This suggests that the wire feed rate and deposition rate primarily influence the deposition rate, while the traverse speed primarily affects the melt pool shape. Higher deposition rates result in wider and taller beads due to the increased amount of deposited material. Conversely, higher traverse speeds reduce the amount of time for the melt pool to solidify, leading to narrower and shorter beads.
The implications of these findings for arc-DED Invar manufacturing are that the desired bead dimensions can be controlled by adjusting the welding parameters. For applications requiring wider and taller beads, higher wire feed rates and deposition rates can be employed. For applications requiring narrower and shorter beads, higher traverse speeds can be used.
3.2. Geometry Analysis of Wall Fabrication with Optimized Parameters
The Figure 5 shows the results of the parabola model fitted to the profilometer data at each of the different arc-DED manufacturing conditions. The profilometer is located in the nozzle and allows the transverse profile to be measured. The figure shows that the parabola model fits well to the profilometer data for all Arc-DED manufacturing conditions. This suggests that the shape of the bead in the first pass is well described by a parabolic function.
The parabola model can be used to predict the geometry of the bead manufactured with Arc-DED. This information can be used to optimise during the manufacturing process and produce parts in-situ between passes.
The parabola model can be used and its relationship to the monitored parameters can be used to feed a neural network to serve as a virtual sensor of the bead geometry and thus replace the scan times of the profilometer. This information could be used to select the in-situ manufacturing conditions that will produce near net shape parts.
3.3. Data Monitoring of DED process on Invar
The data provided from the mold manufacturing process, Figure 6, proves to be invaluable in enhancing the overall efficiency and quality of the manufacturing process. Through a meticulous analysis of this data, various trends and patterns emerge, shedding light on areas that require attention and improvement. For instance, the temperature data allows for the identification of regions within the mold experiencing temperatures either too high or too low. Such insights may signify issues with the cooling system or point to inadequacies in the mold part design. This design has been used in previous work by the authors [29].
The feed rate data becomes a crucial metric in determining whether the wire feeder operates at the appropriate speed. This ensures uniform solidification of the mold part, contributing to higher quality outcomes. The energy data plays a pivotal role in assessing the wire feeder’s energy consumption. Optimizing energy usage not only reduces production costs but also enhances overall process efficiency.
Mold manufacturing process monitoring, facilitated by comprehensive data analysis, emerges as a powerful tool for refining efficiency, quality, and profitability. The insights gained from this data pave the way for continuous improvement throughout the various phases of the manufacturing process. In a three-dimensional context with Cartesian X, Y and Z axes in millimetres, the visual representation in Figure 6 is a three-dimensional graph showing the evolution of properties over time and their relation to spatial coordinates. Each of the collected variables is represented in a subplot, and the colour in the graph would represent the value of the property at each three-dimensional point. To describe the three-dimensional representation a) the tension which remains constant during most of the process, b) the energy as tension per current between feed rate, c) wire feed speed is the speed at which the wire feeds the nozzle other than the nozzle, d) wire feed rate is the speed at which the wire feeds the nozzle, e) wire feed rate is the speed at which the wire feeds the nozzle other than the nozzle, d) traverse feed speed, e) current and f) temperature which is higher in the area where it is higher in the straight section.
Utilizing the data to identify trends and patterns can help predict potential issues. For instance, an increase in mold temperature may signal a cooling system problem, prompting timely intervention. Also, adjusting process parameters could be addressed. The data aids in adjusting parameters to enhance efficiency and quality. If feed rate data reveals uneven solidification, adjustments can be made to ensure uniformity. Also, could lead to reduction in costs by a detailed analysis of energy data can uncover opportunities to minimize production costs. Identifying excess energy usage can lead to strategies for energy conservation. The Figure 7 shows the mould produced by arc-DED which is the subject of this study. Material detachments can be observed in the corners due to the change of direction in the deposition and which should be studied for a later improvement of the manufacturing process with this technology.
4. Discussion
In this subsection a virtual sensor emerges as a data-driven alternative to traditional physical sensors, enabling continuous monitoring and analysis of weld bead geometry without requiring direct physical contact with the weld zone. This virtual sensor harnesses the power of machine learning algorithms, particularly neural networks, to establish a correlation between process parameters and weld bead characteristics.
The sensor’s core lies in its ability to extract meaningful insights from process monitoring data, encompassing parameters like gas flow rate, wire feed speed, voltage, amperage, travel speed, energy, and pyrometer temperature. This data forms the input layer of the neural network model, which serves as the sensor’s analytical engine.
The neural network model, trained on a comprehensive dataset of weld bead measurements obtained using physical sensors and profilometers, learns to map the intricate relationships between process parameters and weld bead geometry. This trained model constitutes the virtual sensor’s intelligence, enabling it to predict weld bead geometry for new process conditions without physical interaction.
The neural network model at the heart of the virtual sensor employs a series of interconnected nodes, mimicking the structure of the human brain. These nodes process information, performing complex calculations and passing the processed information to subsequent nodes in a hierarchical manner.
The input layer of the model receives the process monitoring data, represented as vectors of numerical values. These vectors are transformed into features that capture the essence of the process conditions. The transformed features are then fed into the hidden layers of the neural network, where they undergo a series of mathematical operations. The hidden layers, typically comprising multiple layers, introduce non-linearities into the model, enabling it to capture complex relationships between the features and the weld bead geometry. The output of the hidden layers is then passed through an output layer, which generates the predicted weld bead geometry, represented as a parabola that accurately represents the bead’s shape and dimensions.
The neural network model predicts the height and width of the weld beads based on various input parameters such as amperage, voltage, speed, gas, energy, wire, and temperature. The code follows the following methodology using the libraries (sklearn.model_selection and tensorflow). These libraries are used for data manipulation, data splitting, and model training, respectively. The code employs experimental test data with different cutting conditions. The data is split into training and testing sets. The training set is used to train the model (80% of the data), while the testing set (20% of the data) is used to evaluate the model’s performance on unseen data. The model consists of an input layer, two hidden layers with 100 and 50 neurons respectively, and an output layer with two neurons corresponding to the height and width of the weld beads. The model is compiled using the Adam optimizer, mean squared error (MSE) loss function, and precision metric. The model’s performance is evaluated on the test set, as shown in the Figure 8. The fact that the points on the validation graph are clustered around the line of perfect prediction indicates that the model is predicting real values with a fair degree of accuracy. However, it would be important to conduct further tests to confirm these results. This could be done by increasing the size of the test dataset or using a different test dataset. It would also be crucial to analyze the model’s errors to identify any trends or patterns that may indicate an issue with the model.
Figure shows the Test 9 welding bead fabricated with the direct deposition arc welding (DED) process. The cross-section considered to be the weld profile shown in the image is typical of a DED weld. The weld has a parabolic shape, almost perfectly matching the raw data from the profilometer with its regression model, with a wide melt region at the bottom and a narrow bead region at the top. The virtual sensor correctly defines the shape by fitting very well to both the regressed parabola and the raw points. It has for its conception the error associated to the fact that the centre of the parabola is not the physical centre as it has a certain flattening to the right in positive values of the abscissa axis.
The virtual sensor’s ability to predict weld bead geometry in real-time opens up a plethora of applications, including: i) Real-time monitoring and defect detection, the virtual sensor can continuously monitor weld bead geometry, alerting operators to potential defects such as undercut, lack of fusion, or excessive bead height; ii) automated process control: The predicted weld bead geometry can guide the automation of the welding process, optimizing parameters like wire feed speed and travel speed to achieve the desired weld characteristics and iii) Quality assurance: The virtual sensor can evaluate the quality of weld beads by comparing the predicted geometry to the actual geometry measured using a physical sensor. This comparison can identify defects and ensure consistent weld quality.
The virtual sensor, powered by a neural network model, represents a transformative advancement in weld bead monitoring and control, paving the way for enhanced weld quality, improved process efficiency, and reduced production costs.
5. Conclusions
This paper introduces the additive manufacturing of an Invar mold using three-dimensional printing with arc-DED technology. However, its success is not solely based on this; it relies on the development of online inspection and monitoring techniques. Some of the conclusions that can be drawn are:
- A range of manufacturing conditions has been studied, considering the feed rate and wire speed in the deposition of Invar.
- The geometry of the weld bead has been characterized for different cases.
- It has been observed that profiles obtained by direct measurement of the bead with a laser profilometer fit a parabolic regression.
- Monitoring data has been extracted during the fabrication of an Invar mold using arc-DED.
- A virtual sensor methodology has been established, allowing the indirect measurement of bead geometry through a neural network model fed with process monitoring data.
- Measurements made with the profilometer and the virtual sensor have been compared, showing a high level of precision.
Future lines of research aim to extend the model to beads above the zero bead, as well as to explore other materials and additive manufacturing technologies.
Author Contributions
Conceptualization, F.V. and A.S.; data curation, A.F. and F.V.; formal analysis, A.F. and F.V.; investigation, F.V. and A.S.; methodology, A.F. and F.V.; project administration, A.S. and J-R.A.; supervision, J-R.A., A.S.; validation, J-R.A., A.S.; writing—original draft, A.F. and F.V.; writing—review and editing, A.F., J-R.A., and A.S. All authors have read and agreed to the published version of the manuscript.
Funding
This research received no external funding.
Institutional Review Board Statement
Not applicable.
Informed Consent Statement
Not applicable.
Data Availability Statement
The data presented in this study are available on request from the corresponding author.
Conflicts of Interest
The authors declare no conflict of interest.
References
- Chaturvedi, M.; Scutelnicu, E.; Rusu, C.C.; Mistodie, L.R.; Mihailescu, D.; Subbiah, A.V. Wire Arc Additive Manufacturing: Review on Recent Findings and Challenges in Industrial Applications and Materials Characterization. Metals 2021, 11, 939. [Google Scholar] [CrossRef]
- Li, K.; Chen, W.; Gong, N.; Pu, H.; Luo, J.; Zhang, D.Z.; Murr, L.E. A Critical Review on Wire-Arc Directed Energy Deposition of High-Performance Steels. Journal of Materials Research and Technology 2023, 24, 9369–9412. [Google Scholar] [CrossRef]
- Svetlizky, D.; Das, M.; Zheng, B.; Vyatskikh, A.L.; Bose, S.; Bandyopadhyay, A.; Schoenung, J.M.; Lavernia, E.J.; Eliaz, N. Directed Energy Deposition (DED) Additive Manufacturing: Physical Characteristics, Defects, Challenges and Applications. Materials Today 2021, 49, 271–295. [Google Scholar] [CrossRef]
- Gardner, L. Metal Additive Manufacturing in Structural Engineering – Review, Advances, Opportunities and Outlook. Structures 2023, 47, 2178–2193. [Google Scholar] [CrossRef]
- Kumar, N.; Bhavsar, H.; Mahesh, P.V.S.; Srivastava, A.K.; Bora, B.J.; Saxena, A.; Dixit, A.R. Wire Arc Additive Manufacturing – A Revolutionary Method in Additive Manufacturing. Materials Chemistry and Physics 2022, 285, 126144. [Google Scholar] [CrossRef]
- Wang, F.; Williams, S.; Colegrove, P.; Antonysamy, A.A. Microstructure and Mechanical Properties of Wire and Arc Additive Manufactured Ti-6Al-4V. Metall Mater Trans A 2013, 44, 968–977. [Google Scholar] [CrossRef]
- Wu, B.; Pan, Z.; Ding, D.; Cuiuri, D.; Li, H.; Xu, J.; Norrish, J. A Review of the Wire Arc Additive Manufacturing of Metals: Properties, Defects and Quality Improvement. Journal of Manufacturing Processes 2018, 35, 127–139. [Google Scholar] [CrossRef]
- Jiao, G.; Fang, X.; Chen, X.; Xi, N.; Zhang, M.; Liu, Y.; Wu, H.; Huang, K. The Origin of Low Thermal Expansion Coefficient and Enhanced Tensile Properties of Invar Alloy Fabricated by Directed Energy Deposition. Journal of Materials Processing Technology 2023, 317, 117994. [Google Scholar] [CrossRef]
- Veiga, F.; Suárez, A.; Artaza, T.; Aldalur, E. Effect of the Heat Input on Wire-Arc Additive Manufacturing of Invar 36 Alloy: Microstructure and Mechanical Properties. Welding in the World 2022, 66, 1081–1091. [Google Scholar] [CrossRef]
- Qiu, C.; Adkins, N.J.E.; Attallah, M.M. Selective Laser Melting of Invar 36: Microstructure and Properties. Acta Materialia 2016, 103, 382–395. [Google Scholar] [CrossRef]
- Yakout, M.; Elbestawi, M.A.; Veldhuis, S.C. Density and Mechanical Properties in Selective Laser Melting of Invar 36 and Stainless Steel 316L. Journal of Materials Processing Technology 2019, 266, 397–420. [Google Scholar] [CrossRef]
- Clark, D.; Bache, M.R.; Whittaker, M.T. Shaped Metal Deposition of a Nickel Alloy for Aero Engine Applications. Journal of Materials Processing Technology 2008, 203, 439–448. [Google Scholar] [CrossRef]
- Gil Del Val, A.; Cearsolo, X.; Suarez, A.; Veiga, F.; Altuna, I.; Ortiz, M. Machinability Characterization in End Milling of Invar 36 Fabricated by Wire Arc Additive Manufacturing. Journal of Materials Research and Technology 2023, 23, 300–315. [Google Scholar] [CrossRef]
- Honeycutt, A.; Mhatre, P.; Gibson, B.; Smith, S.; Richardson, B. Iterative Hybrid Manufacture of a Titanium Alloy Component. Manufacturing Letters 2021, 29, 90–93. [Google Scholar] [CrossRef]
- Yakout, M.; Elbestawi, M. Residual Stress Formation in Laser-Based Powder Bed Fusion (PBF-LB) of Invar 36. 2020; pp. 34–44. ISBN 978-0-8031-7708-6. [Google Scholar]
- Qiu, C.; Liu, Y.; Liu, H. Influence of Addition of TiAl Particles on Microstructural and Mechanical Property Development in Invar 36 Processed by Laser Powder Bed Fusion. Additive Manufacturing 2021, 48, 102457. [Google Scholar] [CrossRef]
- Sebbe, N.P.V.; Fernandes, F.; Sousa, V.F.C.; Silva, F.J.G. Hybrid Manufacturing Processes Used in the Production of Complex Parts: A Comprehensive Review. Metals 2022, 12, 1874. [Google Scholar] [CrossRef]
- Ding, D.; Pan, Z.; Cuiuri, D.; Li, H. A Multi-Bead Overlapping Model for Robotic Wire and Arc Additive Manufacturing (WAAM). Robotics and Computer-Integrated Manufacturing 2015, 31, 101–110. [Google Scholar] [CrossRef]
- Dinovitzer, M.; Chen, X.; Laliberte, J.; Huang, X.; Frei, H. Effect of Wire and Arc Additive Manufacturing (WAAM) Process Parameters on Bead Geometry and Microstructure. Additive Manufacturing 2019, 26, 138–146. [Google Scholar] [CrossRef]
- Ding, D.; Pan, Z.; Cuiuri, D.; Li, H.; van Duin, S.; Larkin, N. Bead Modelling and Implementation of Adaptive MAT Path in Wire and Arc Additive Manufacturing. Robotics and Computer-Integrated Manufacturing 2016, 39, 32–42. [Google Scholar] [CrossRef]
- Veiga, F.; Suárez, A.; Aldalur, E.; Bhujangrao, T. Effect of the Metal Transfer Mode on the Symmetry of Bead Geometry in WAAM Aluminum. Symmetry 2021, 13, 1245. [Google Scholar] [CrossRef]
- Pinto-Lopera, J.E.; S T Motta, J.M.; Absi Alfaro, S.C. Real-Time Measurement of Width and Height of Weld Beads in GMAW Processes. Sensors 2016, 16, 1500. [Google Scholar] [CrossRef]
- Wang, X.; Meng, D.; Yi, H.; Yan, Z.; Xiao, J.; Chen, S. A Novel Model for Directed Energy Deposition-Arc Based on in-Order Stacking of Primitives. Virtual and Physical Prototyping 2024, 19, e2291471. [Google Scholar] [CrossRef]
- Ding, D.; Zhao, R.; Lu, Q.; Pan, Z.; Li, H.; Wang, K.; He, K. A Shape Control Strategy for Wire Arc Additive Manufacturing of Thin-Walled Aluminium Structures with Sharp Corners. Journal of Manufacturing Processes 2021, 64, 253–264. [Google Scholar] [CrossRef]
- Ding, D.; Yuan, L.; Huang, R.; Jiang, Y.; Wang, X.; Pan, Z. Corner Path Optimization Strategy for Wire Arc Additive Manufacturing of Gap-Free Shapes. Journal of Manufacturing Processes 2023, 85, 683–694. [Google Scholar] [CrossRef]
- Halisch, C.; Radel, T.; Tyralla, D.; Seefeld, T. Measuring the Melt Pool Size in a Wire Arc Additive Manufacturing Process Using a High Dynamic Range Two-Colored Pyrometric Camera. Weld World 2020, 64, 1349–1356. [Google Scholar] [CrossRef]
- Dellarre, A.; Limousin, M.; Beraud, N. Melt Pool Acquisition Using Near-Infrared Camera in Aluminum Wire Arc Additive Manufacturing. In Proceedings of the Advances on Mechanics, Design Engineering and Manufacturing IV; Gerbino, S., Lanzotti, A., Martorelli, M., Mirálbes Buil, R., Rizzi, C., Roucoules, L., Eds.; Springer International Publishing: Cham, 2023; pp. 803–814. [Google Scholar]
- Richter, A.; Gehling, T.; Treutler, K.; Wesling, V.; Rembe, C. Real-Time Measurement of Temperature and Volume of the Weld Pool in Wire-Arc Additive Manufacturing. Measurement: Sensors 2021, 17, 100060. [Google Scholar] [CrossRef]
- Aldalur, E.; Suárez, A.; Veiga, F. Thermal Expansion Behaviour of Invar 36 Alloy Parts Fabricated by Wire-Arc Additive Manufacturing. Journal of Materials Research and Technology 2022, 19, 3634–3645. [Google Scholar] [CrossRef]
Figure 1.
Experimental setup for Invar manufacturing based on GMAW.
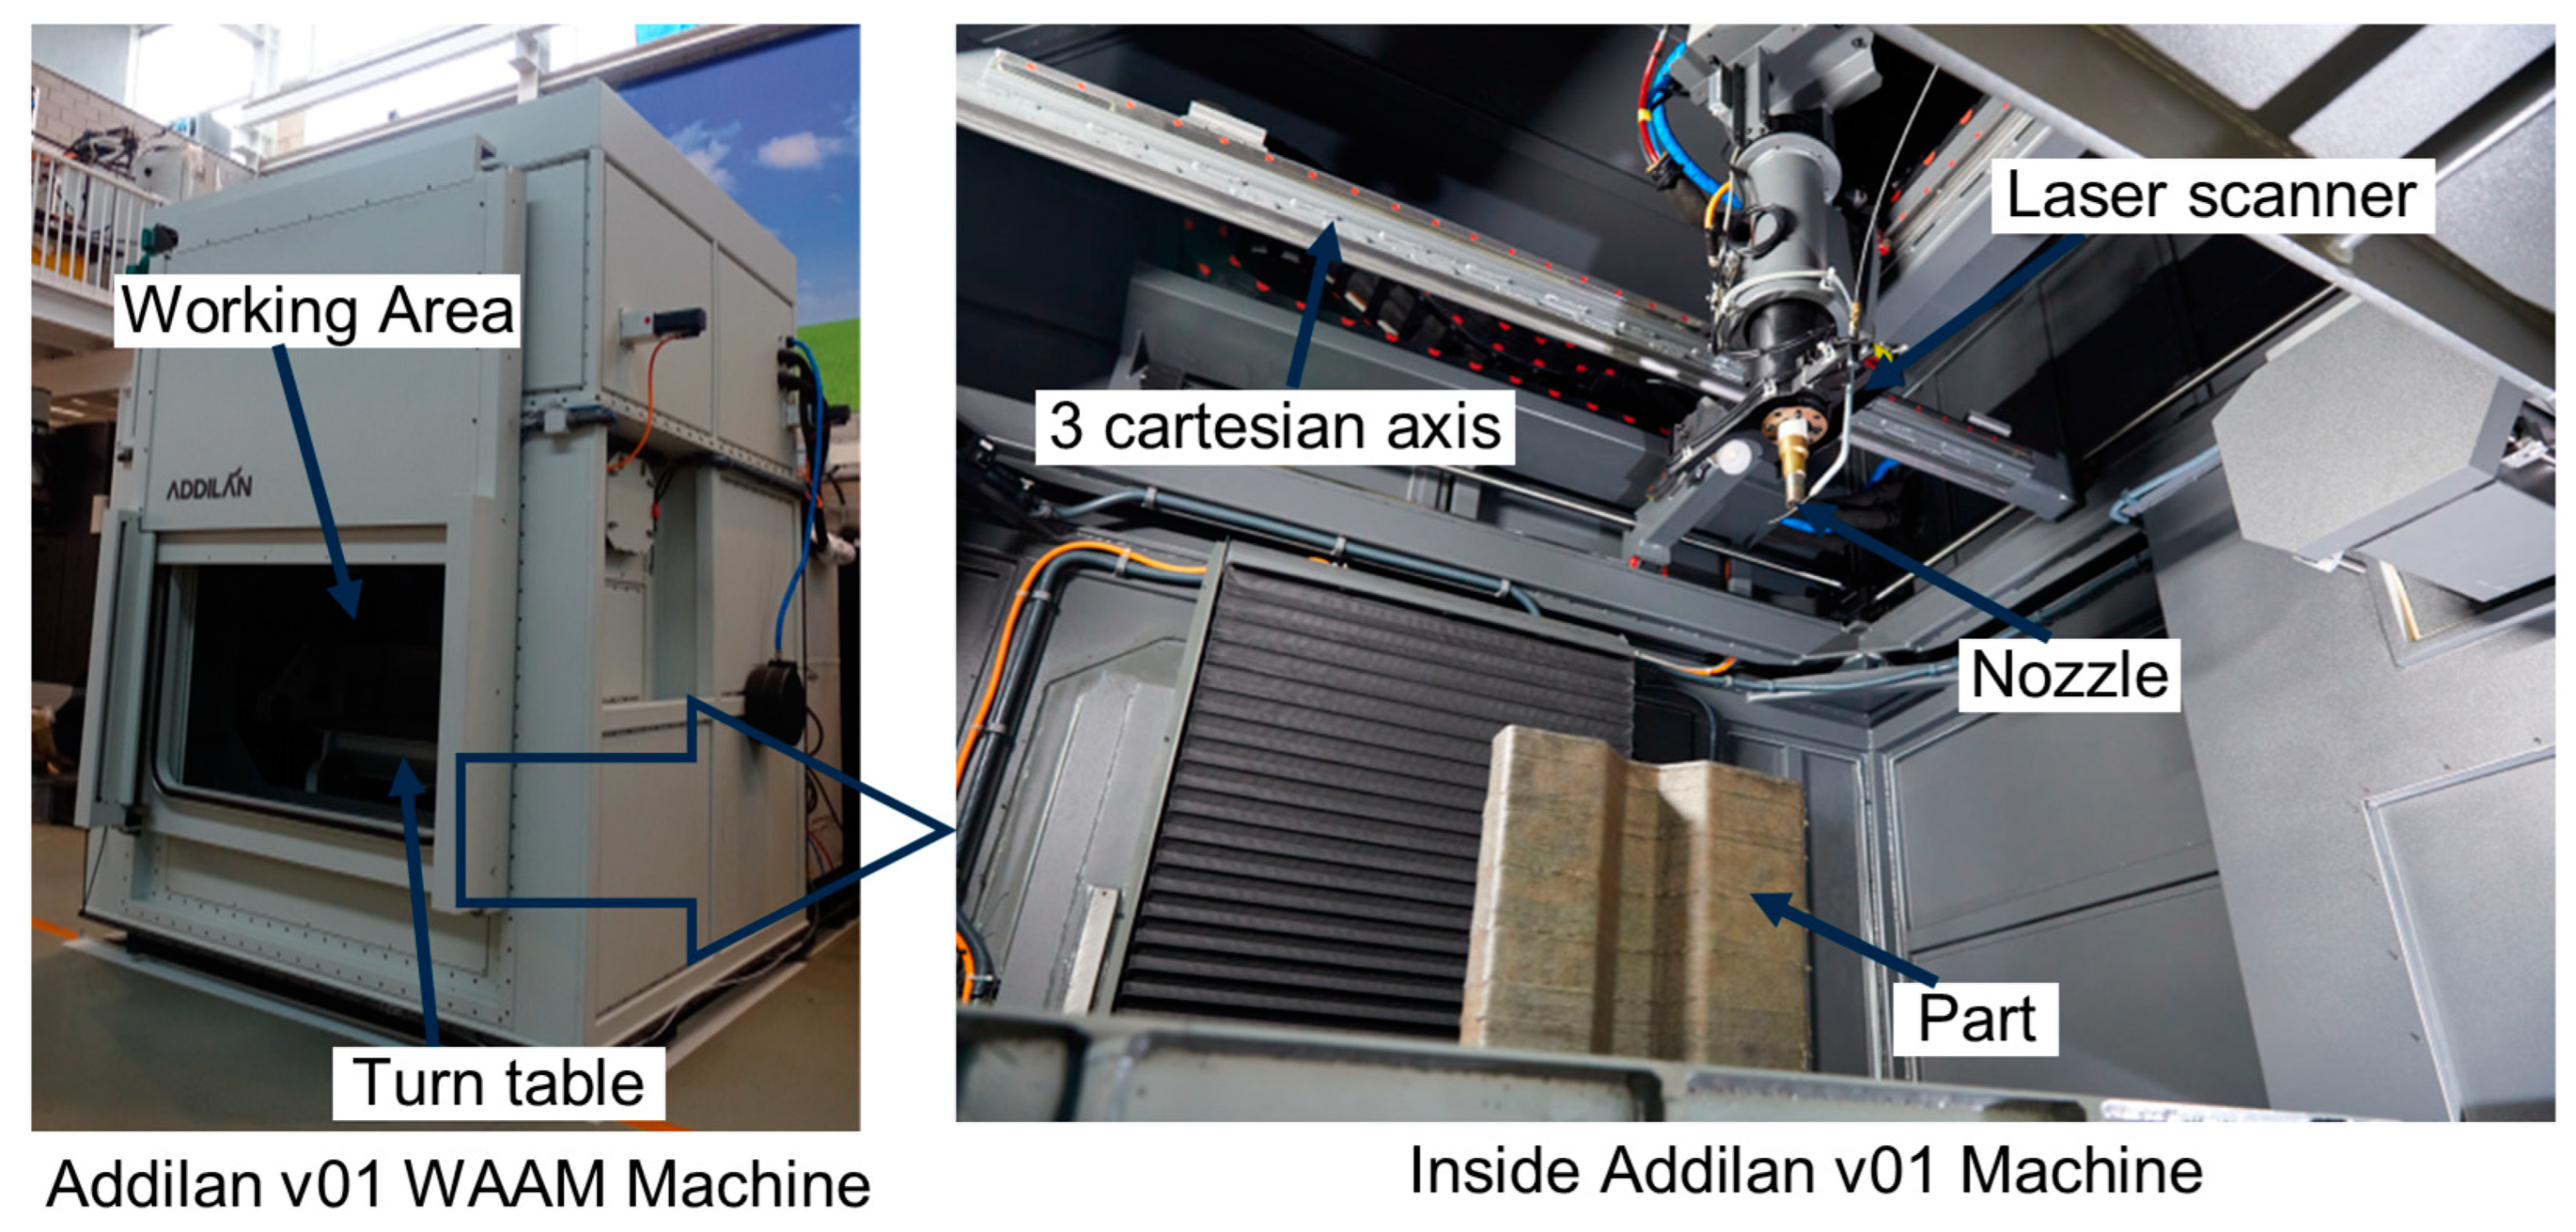
Figure 2.
Zero bead morphology for the different manufacturing conditions.
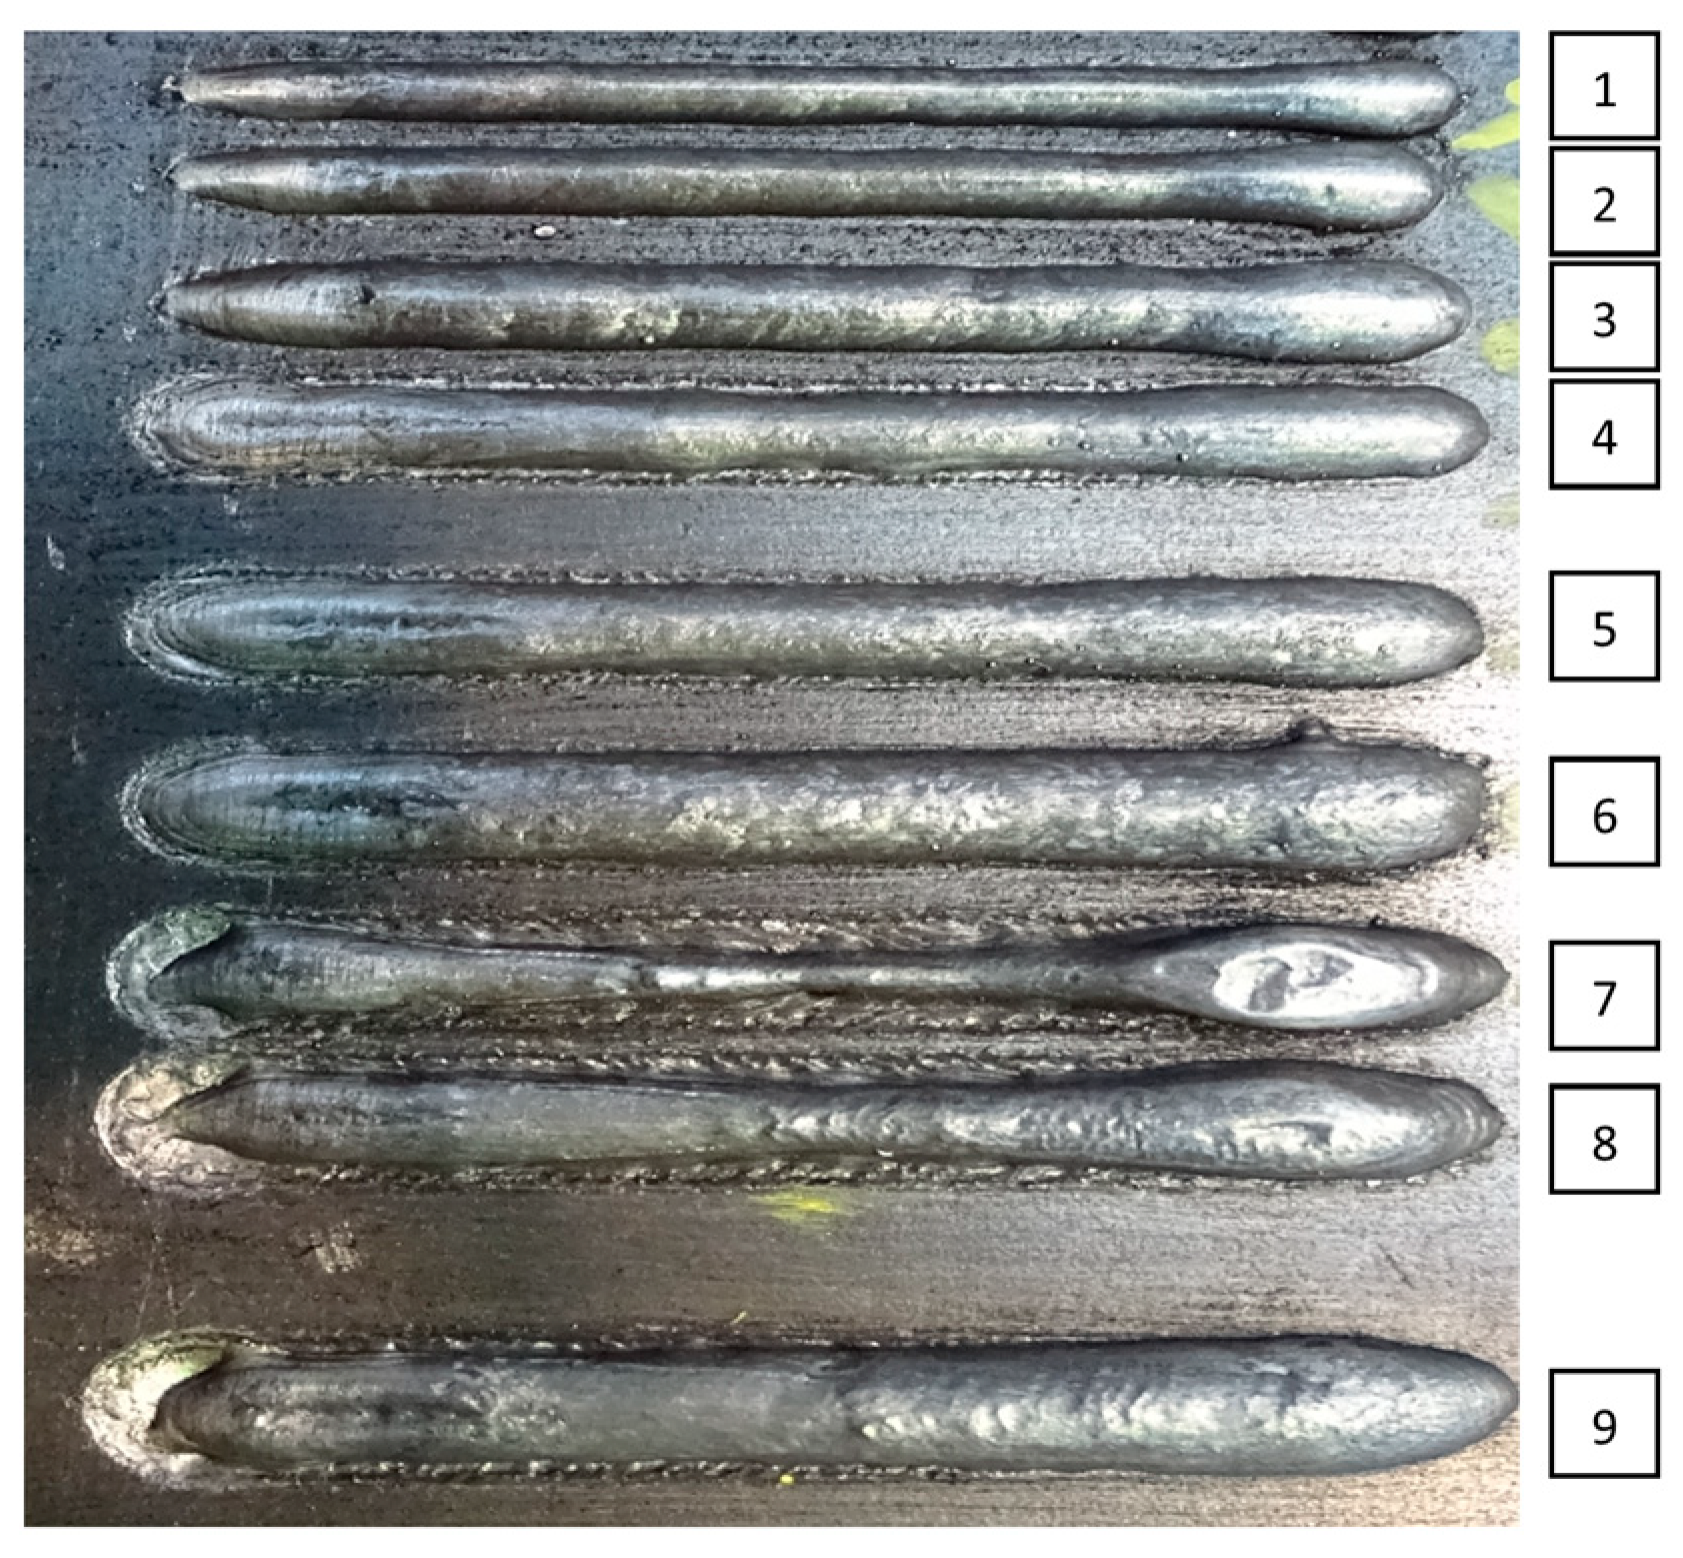
Figure 5.
Zero bead morphology parabola modelled geometry from the data collected profilometer.
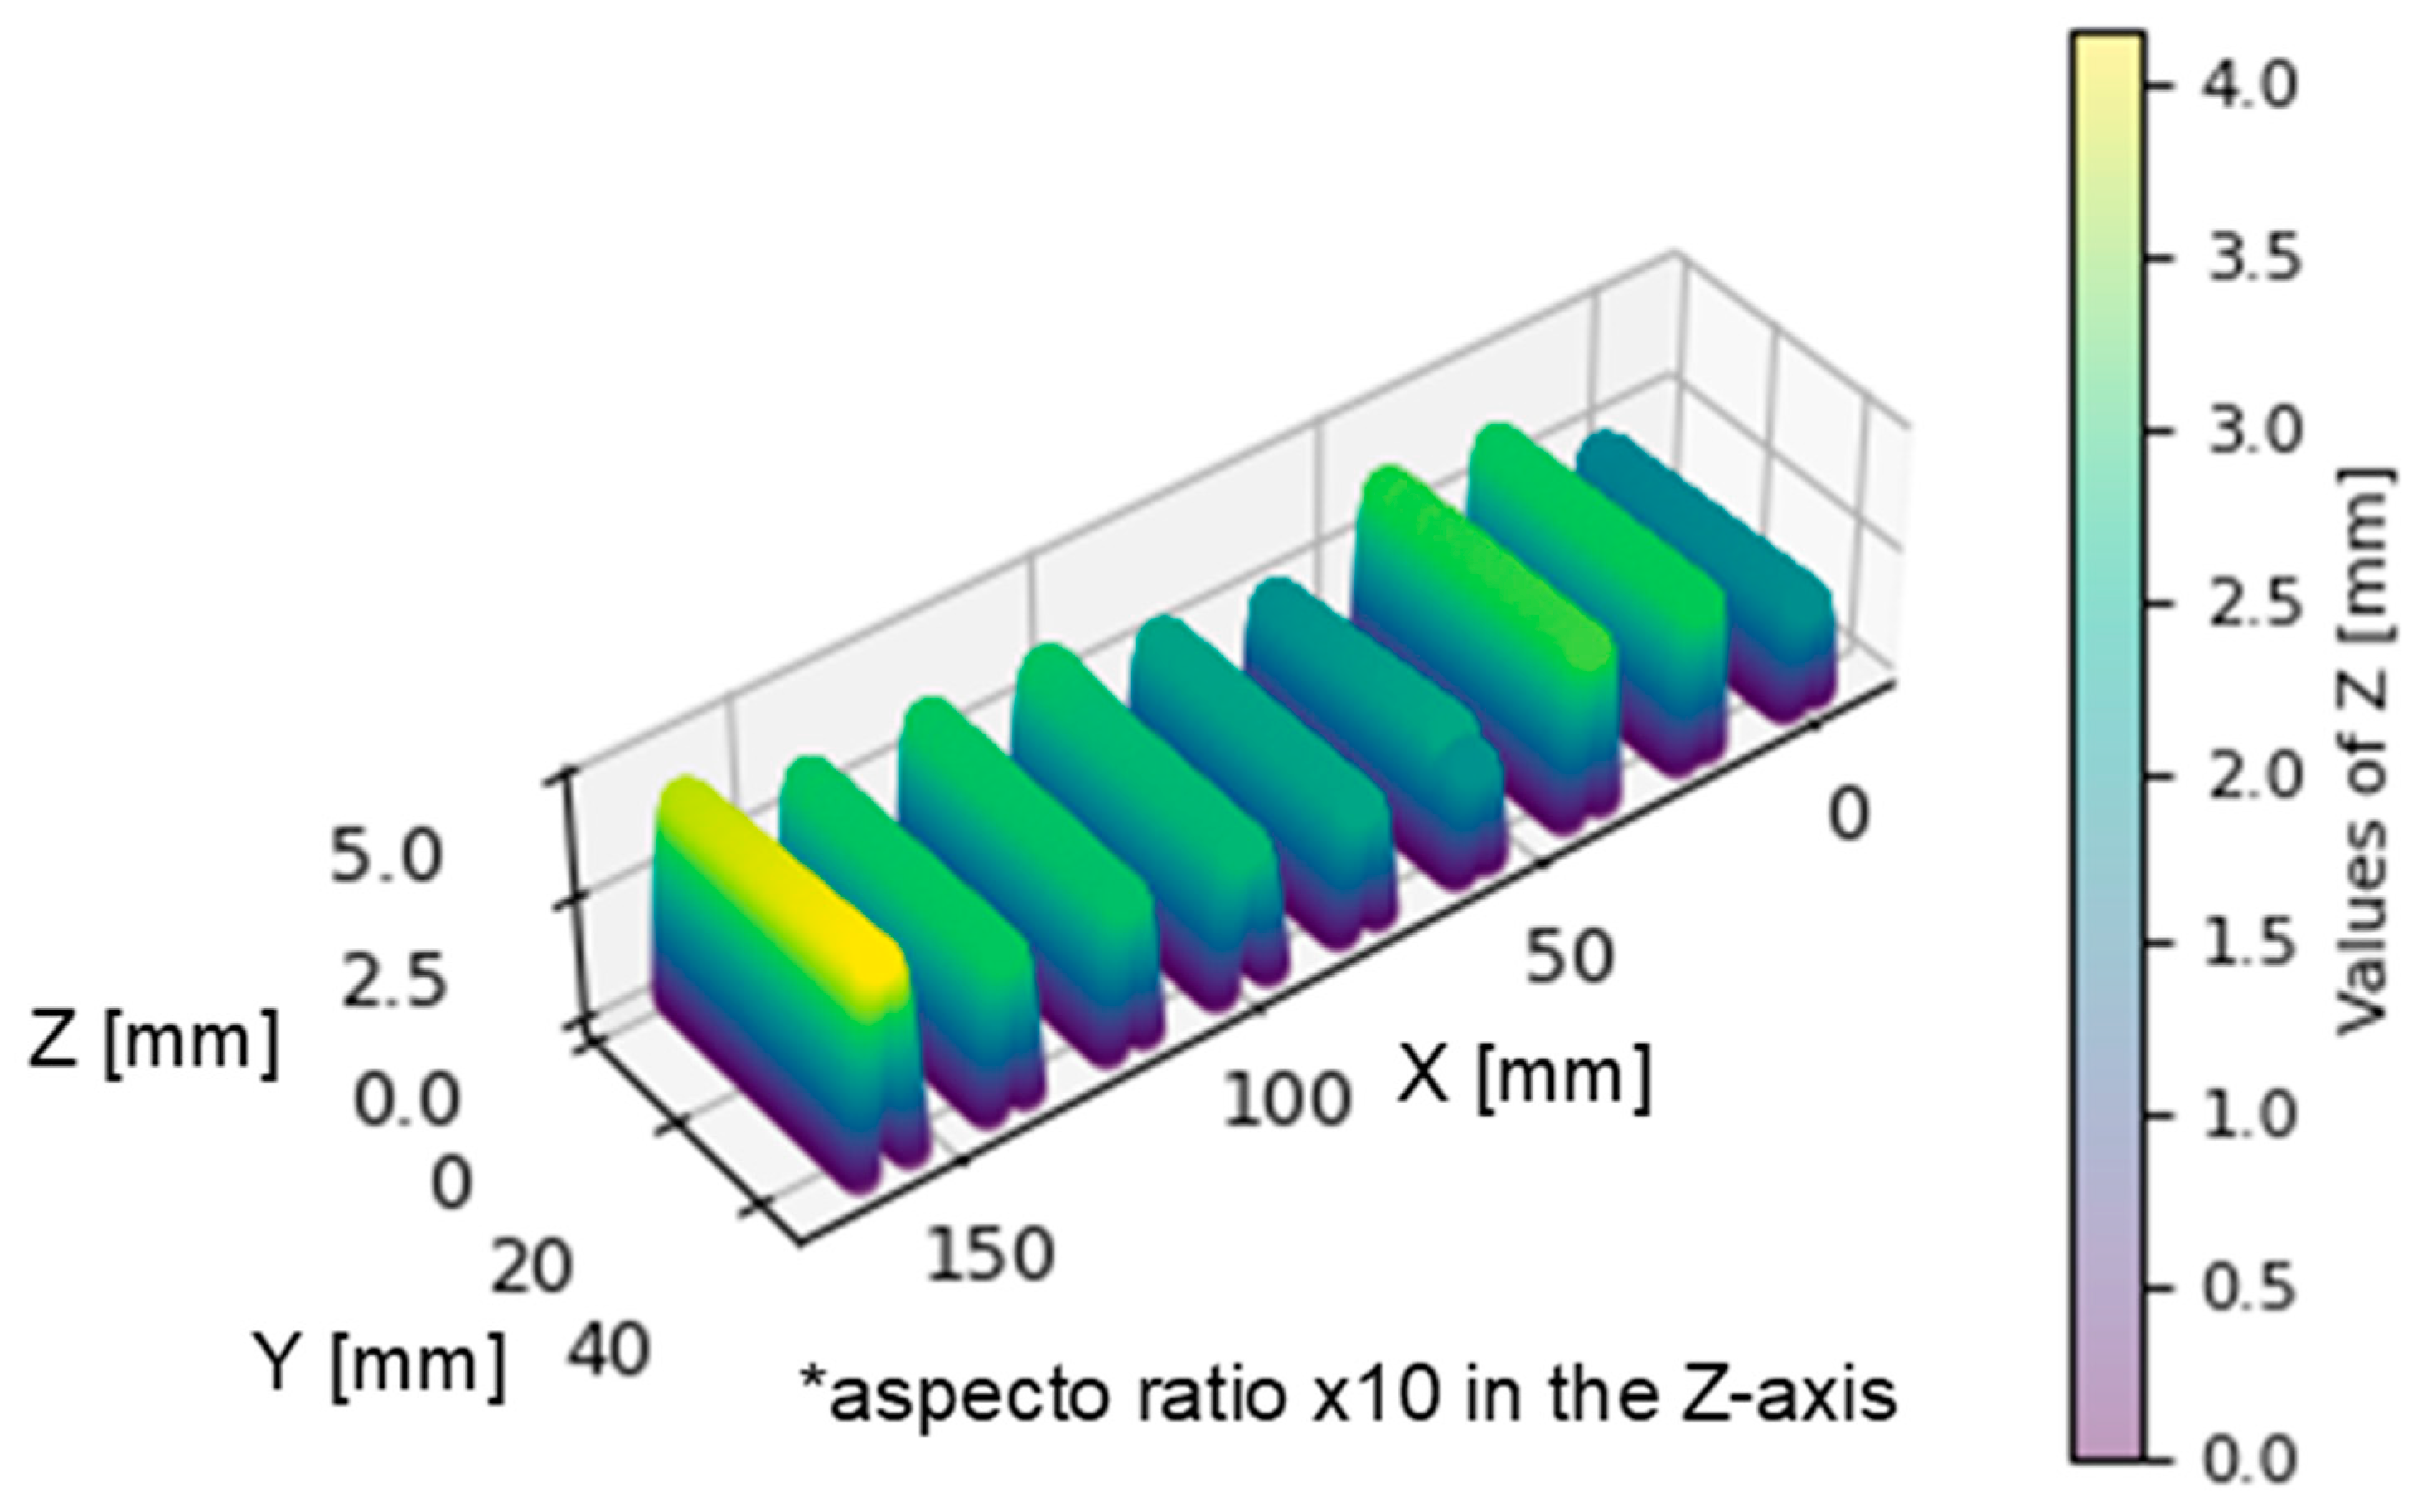
Figure 6.
Data collected from the numerical control of the machine and sensor: a) voltage, b) energy, c) wire feed speed, d) traverse feed speed, e) current and f) temperature.
Figure 6.
Data collected from the numerical control of the machine and sensor: a) voltage, b) energy, c) wire feed speed, d) traverse feed speed, e) current and f) temperature.

Figure 7.
Mould manufactured by arc.-DED on Invar material.
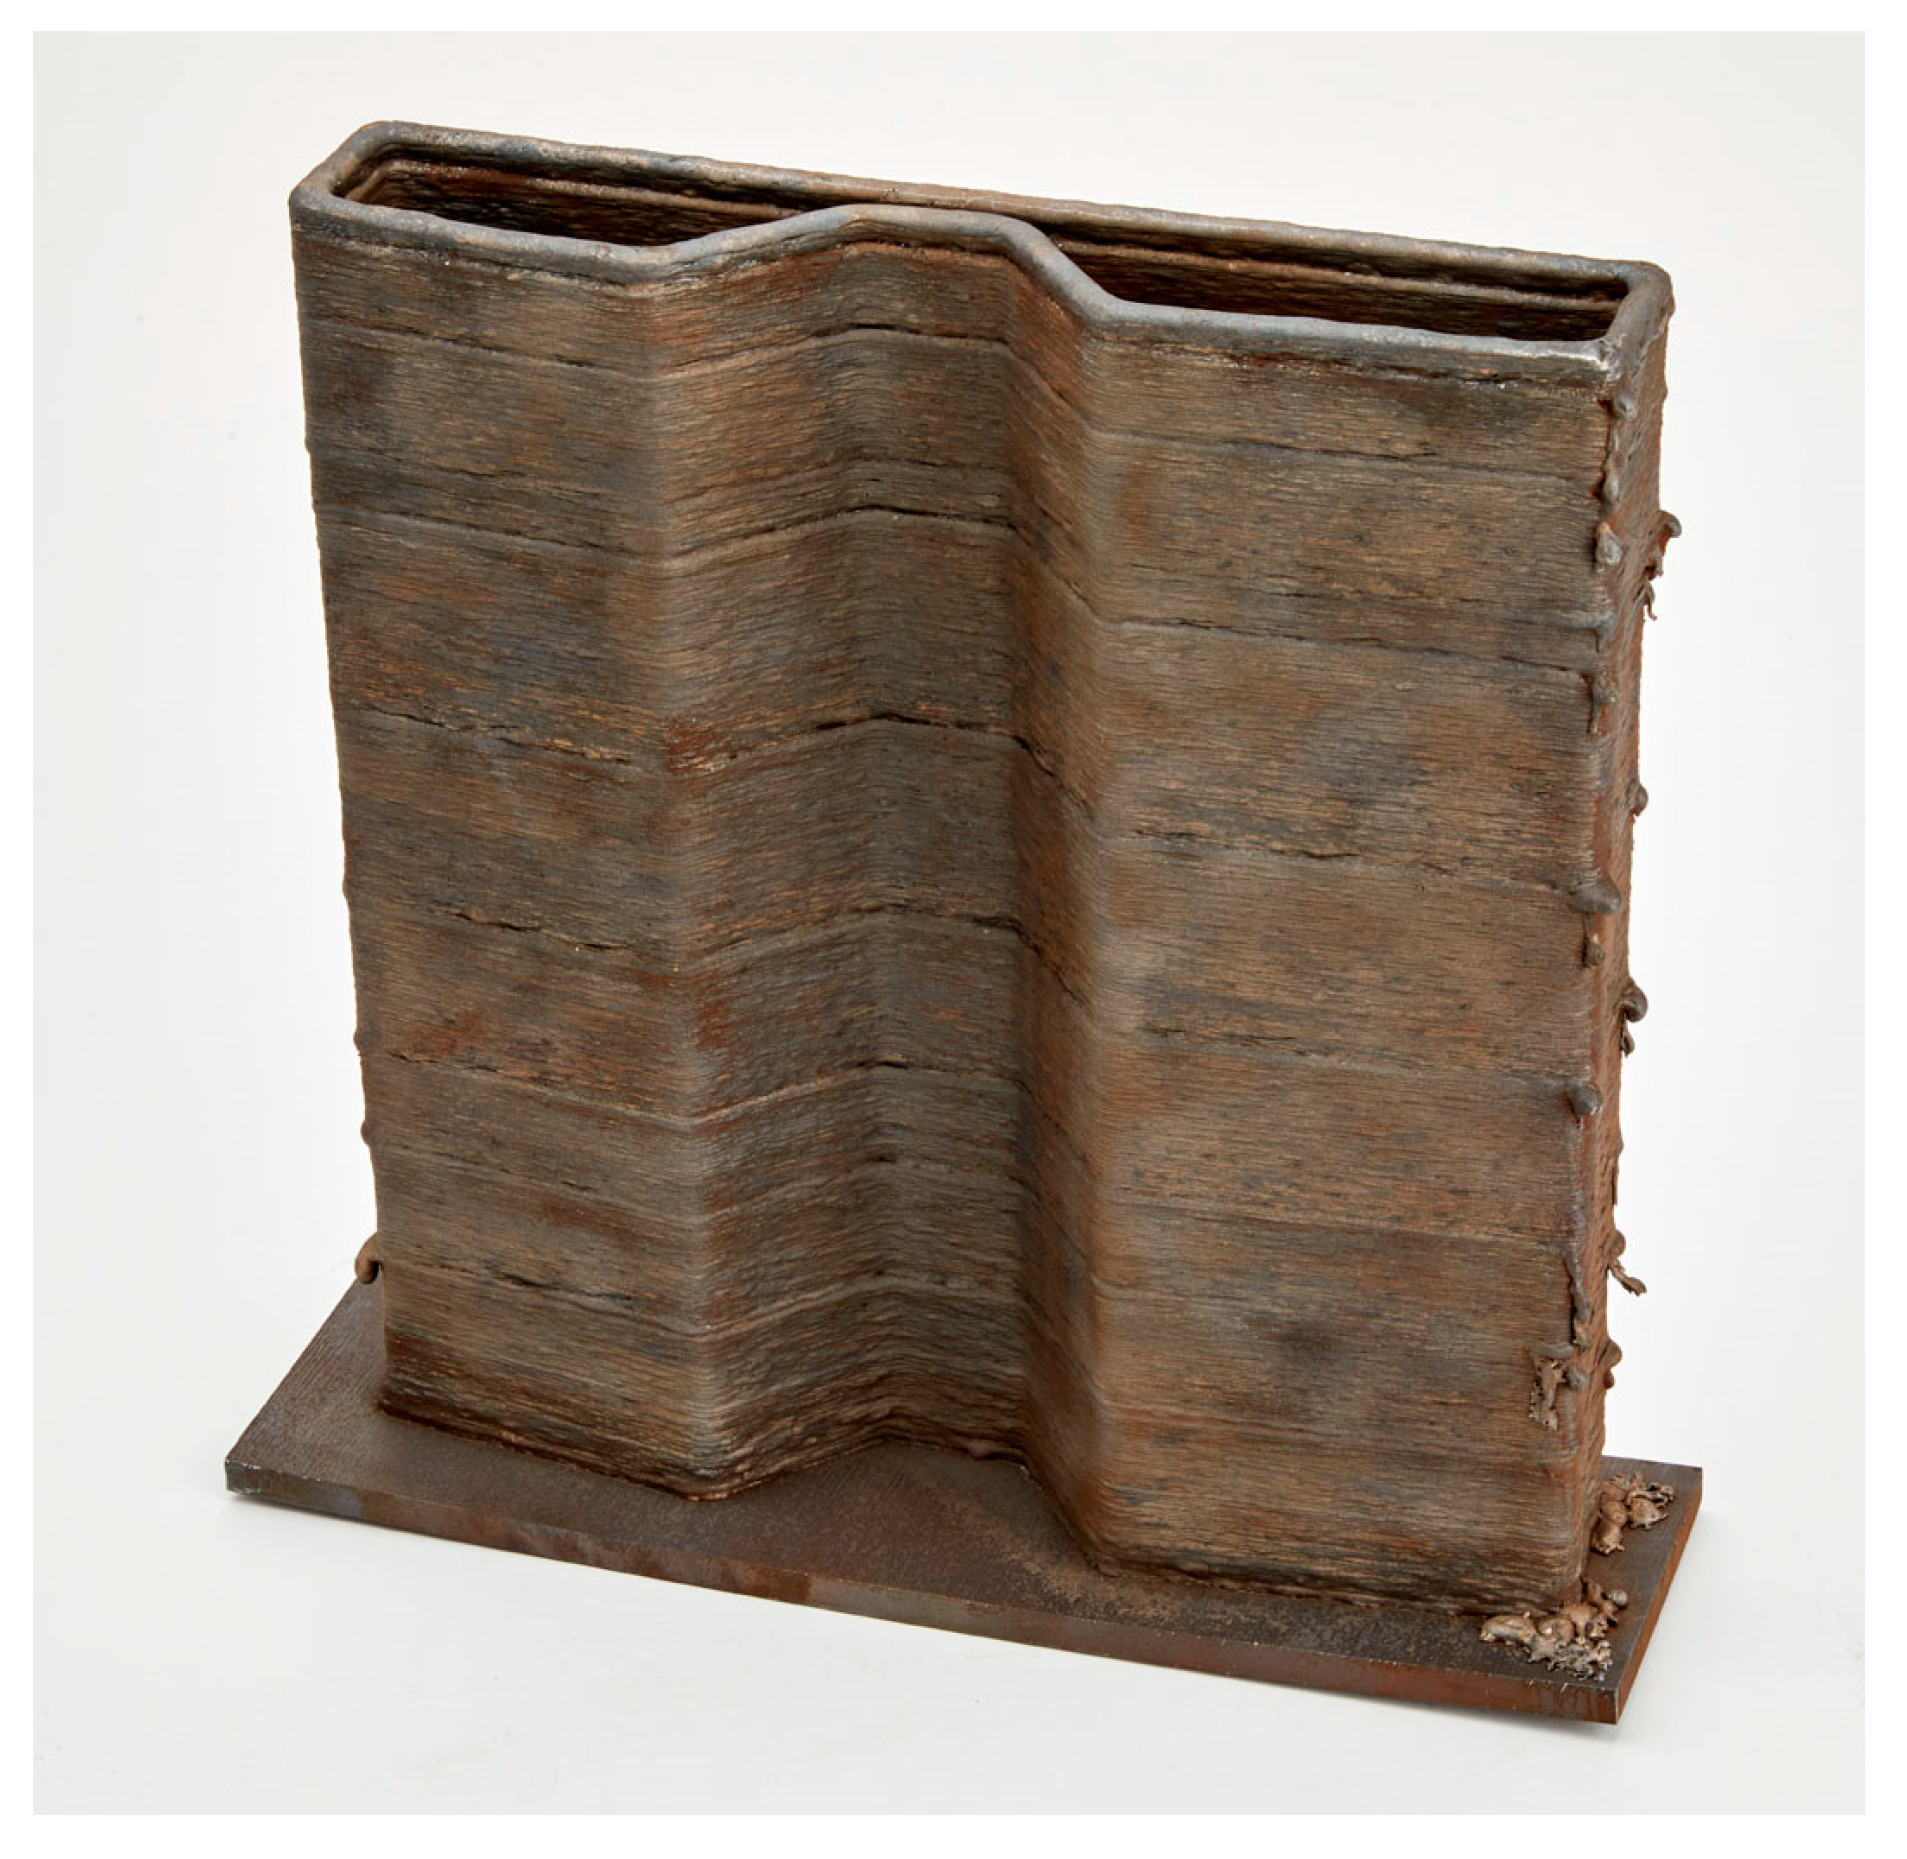
Figure 8.
Zero bead estimation actual values versus predicted values in the test observations using the neuronal network model.
Figure 8.
Zero bead estimation actual values versus predicted values in the test observations using the neuronal network model.
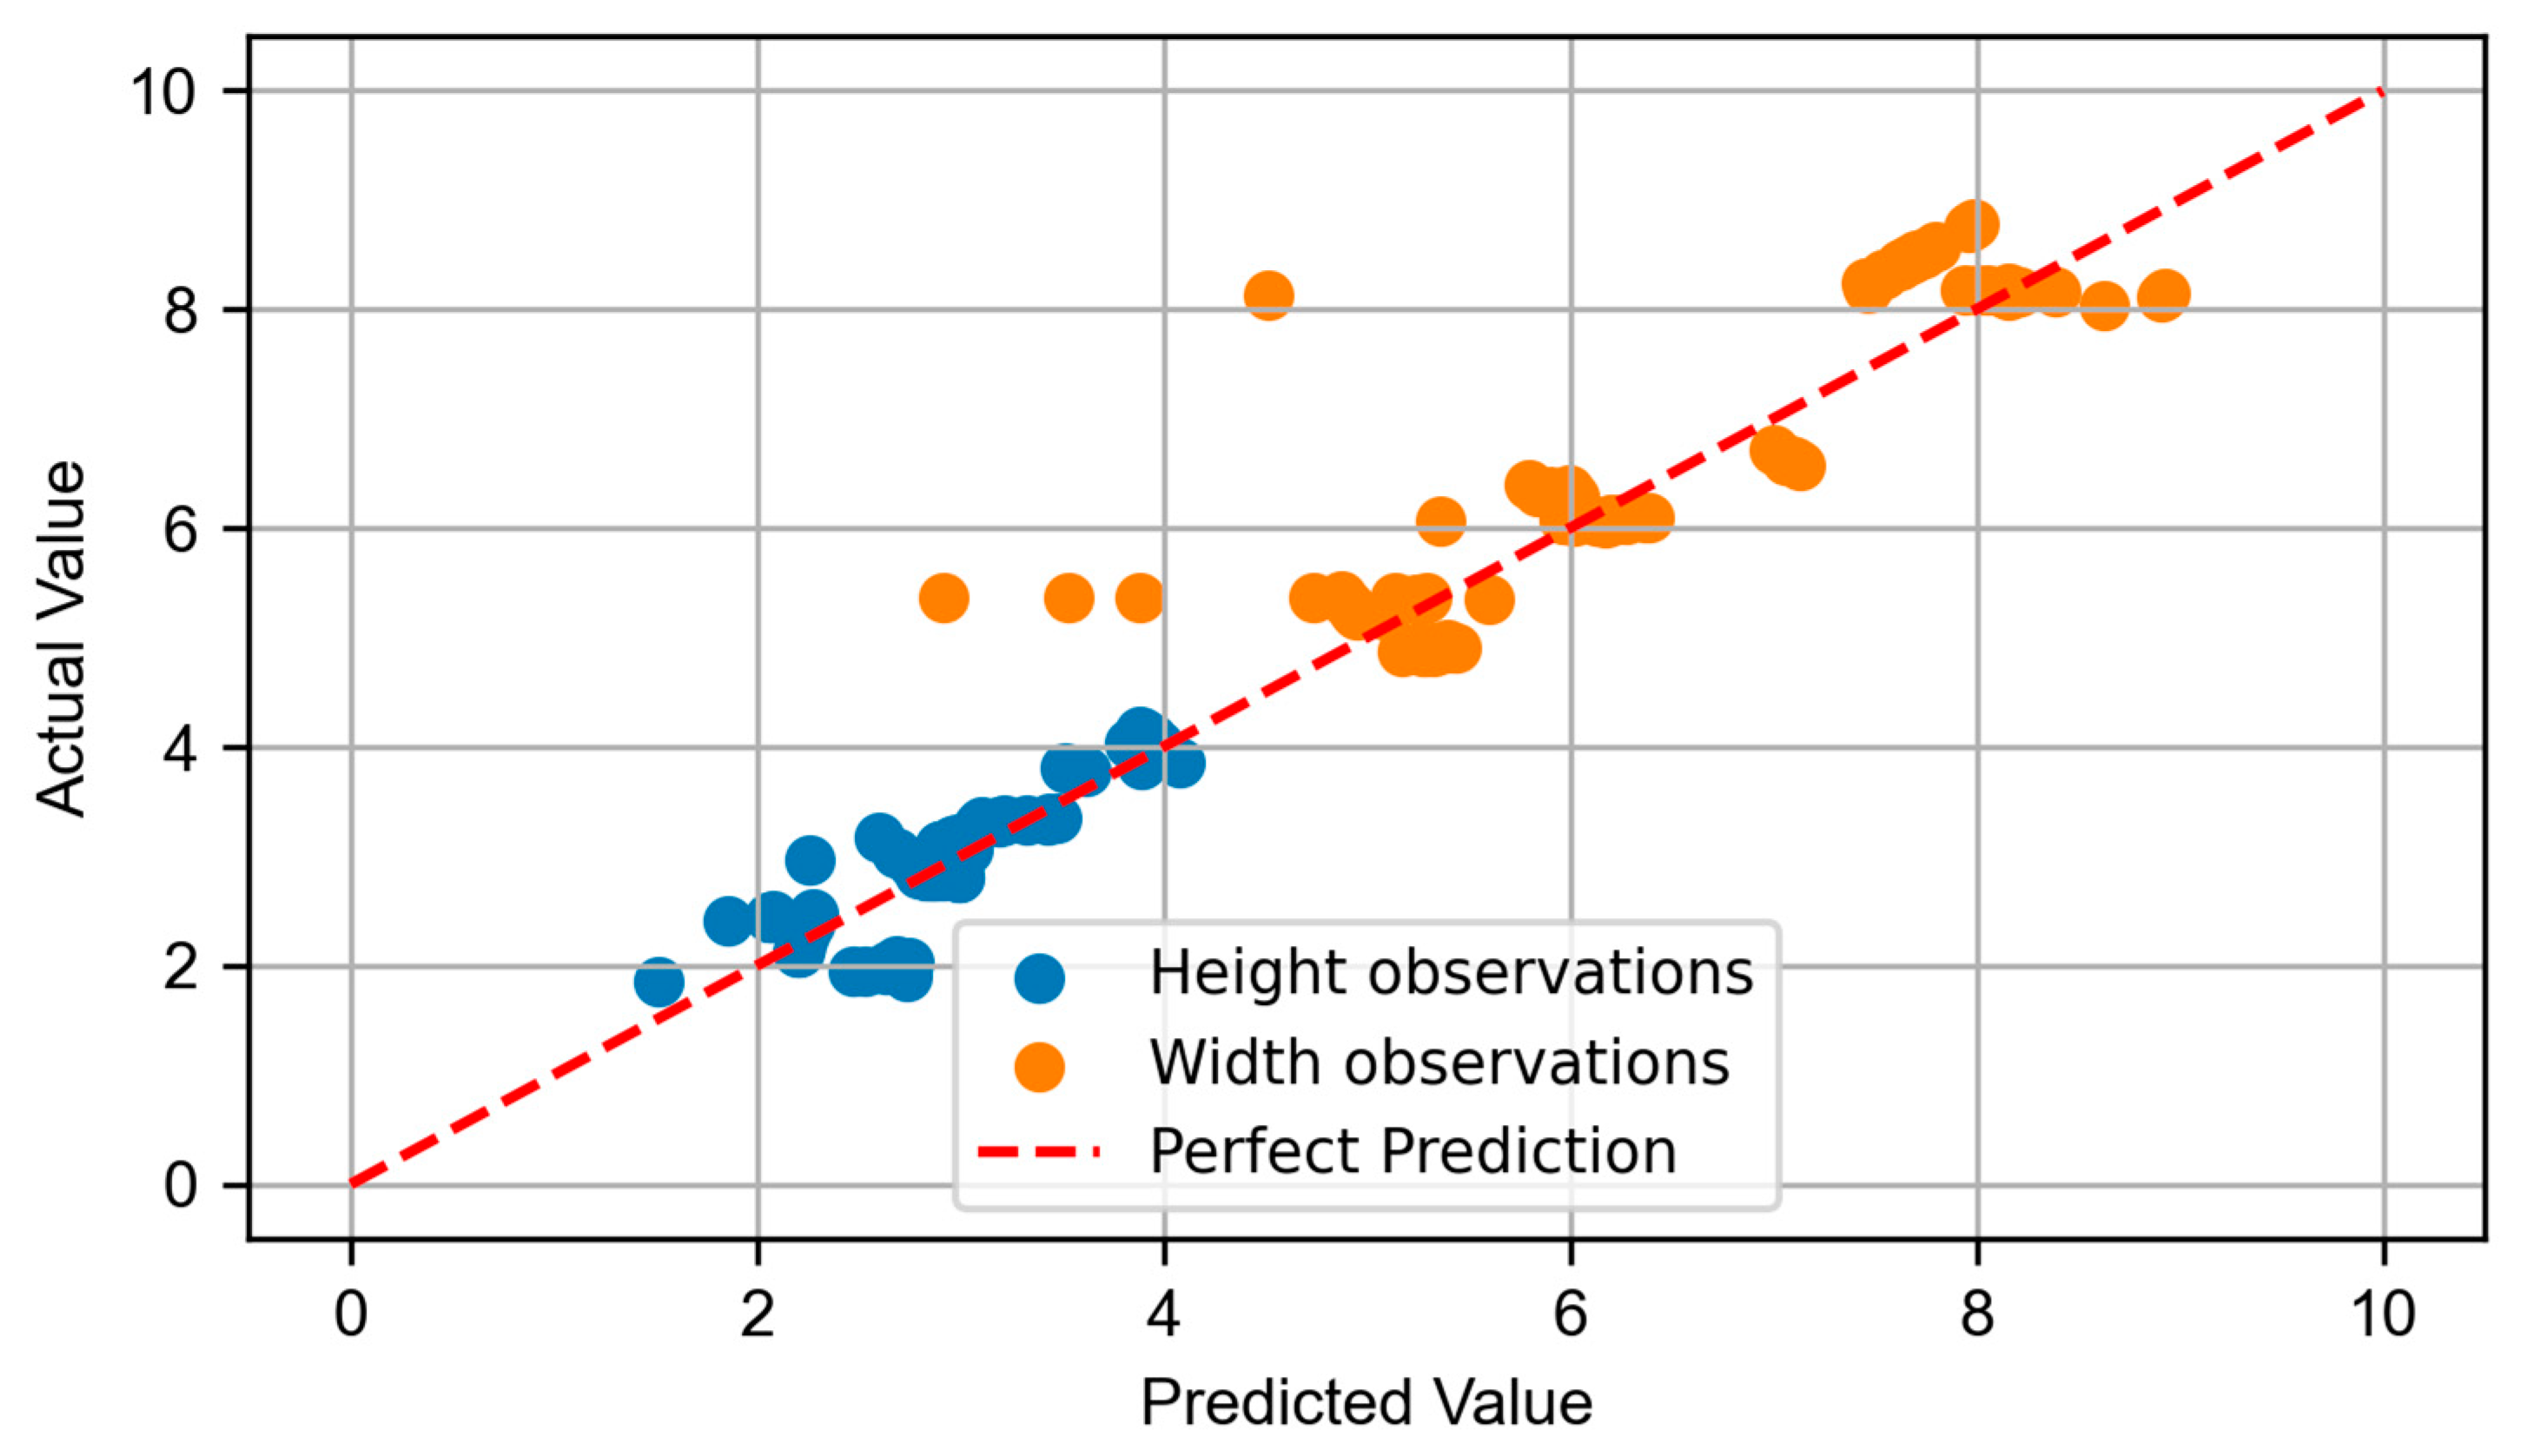
Figure 9.
Zero bead morphology comparison between raw data from the profilometer, parabola modeled and virtual sensor estimated geometry from the neuronal network model in the Test 9 arc-DED manufacturing conditions.
Figure 9.
Zero bead morphology comparison between raw data from the profilometer, parabola modeled and virtual sensor estimated geometry from the neuronal network model in the Test 9 arc-DED manufacturing conditions.
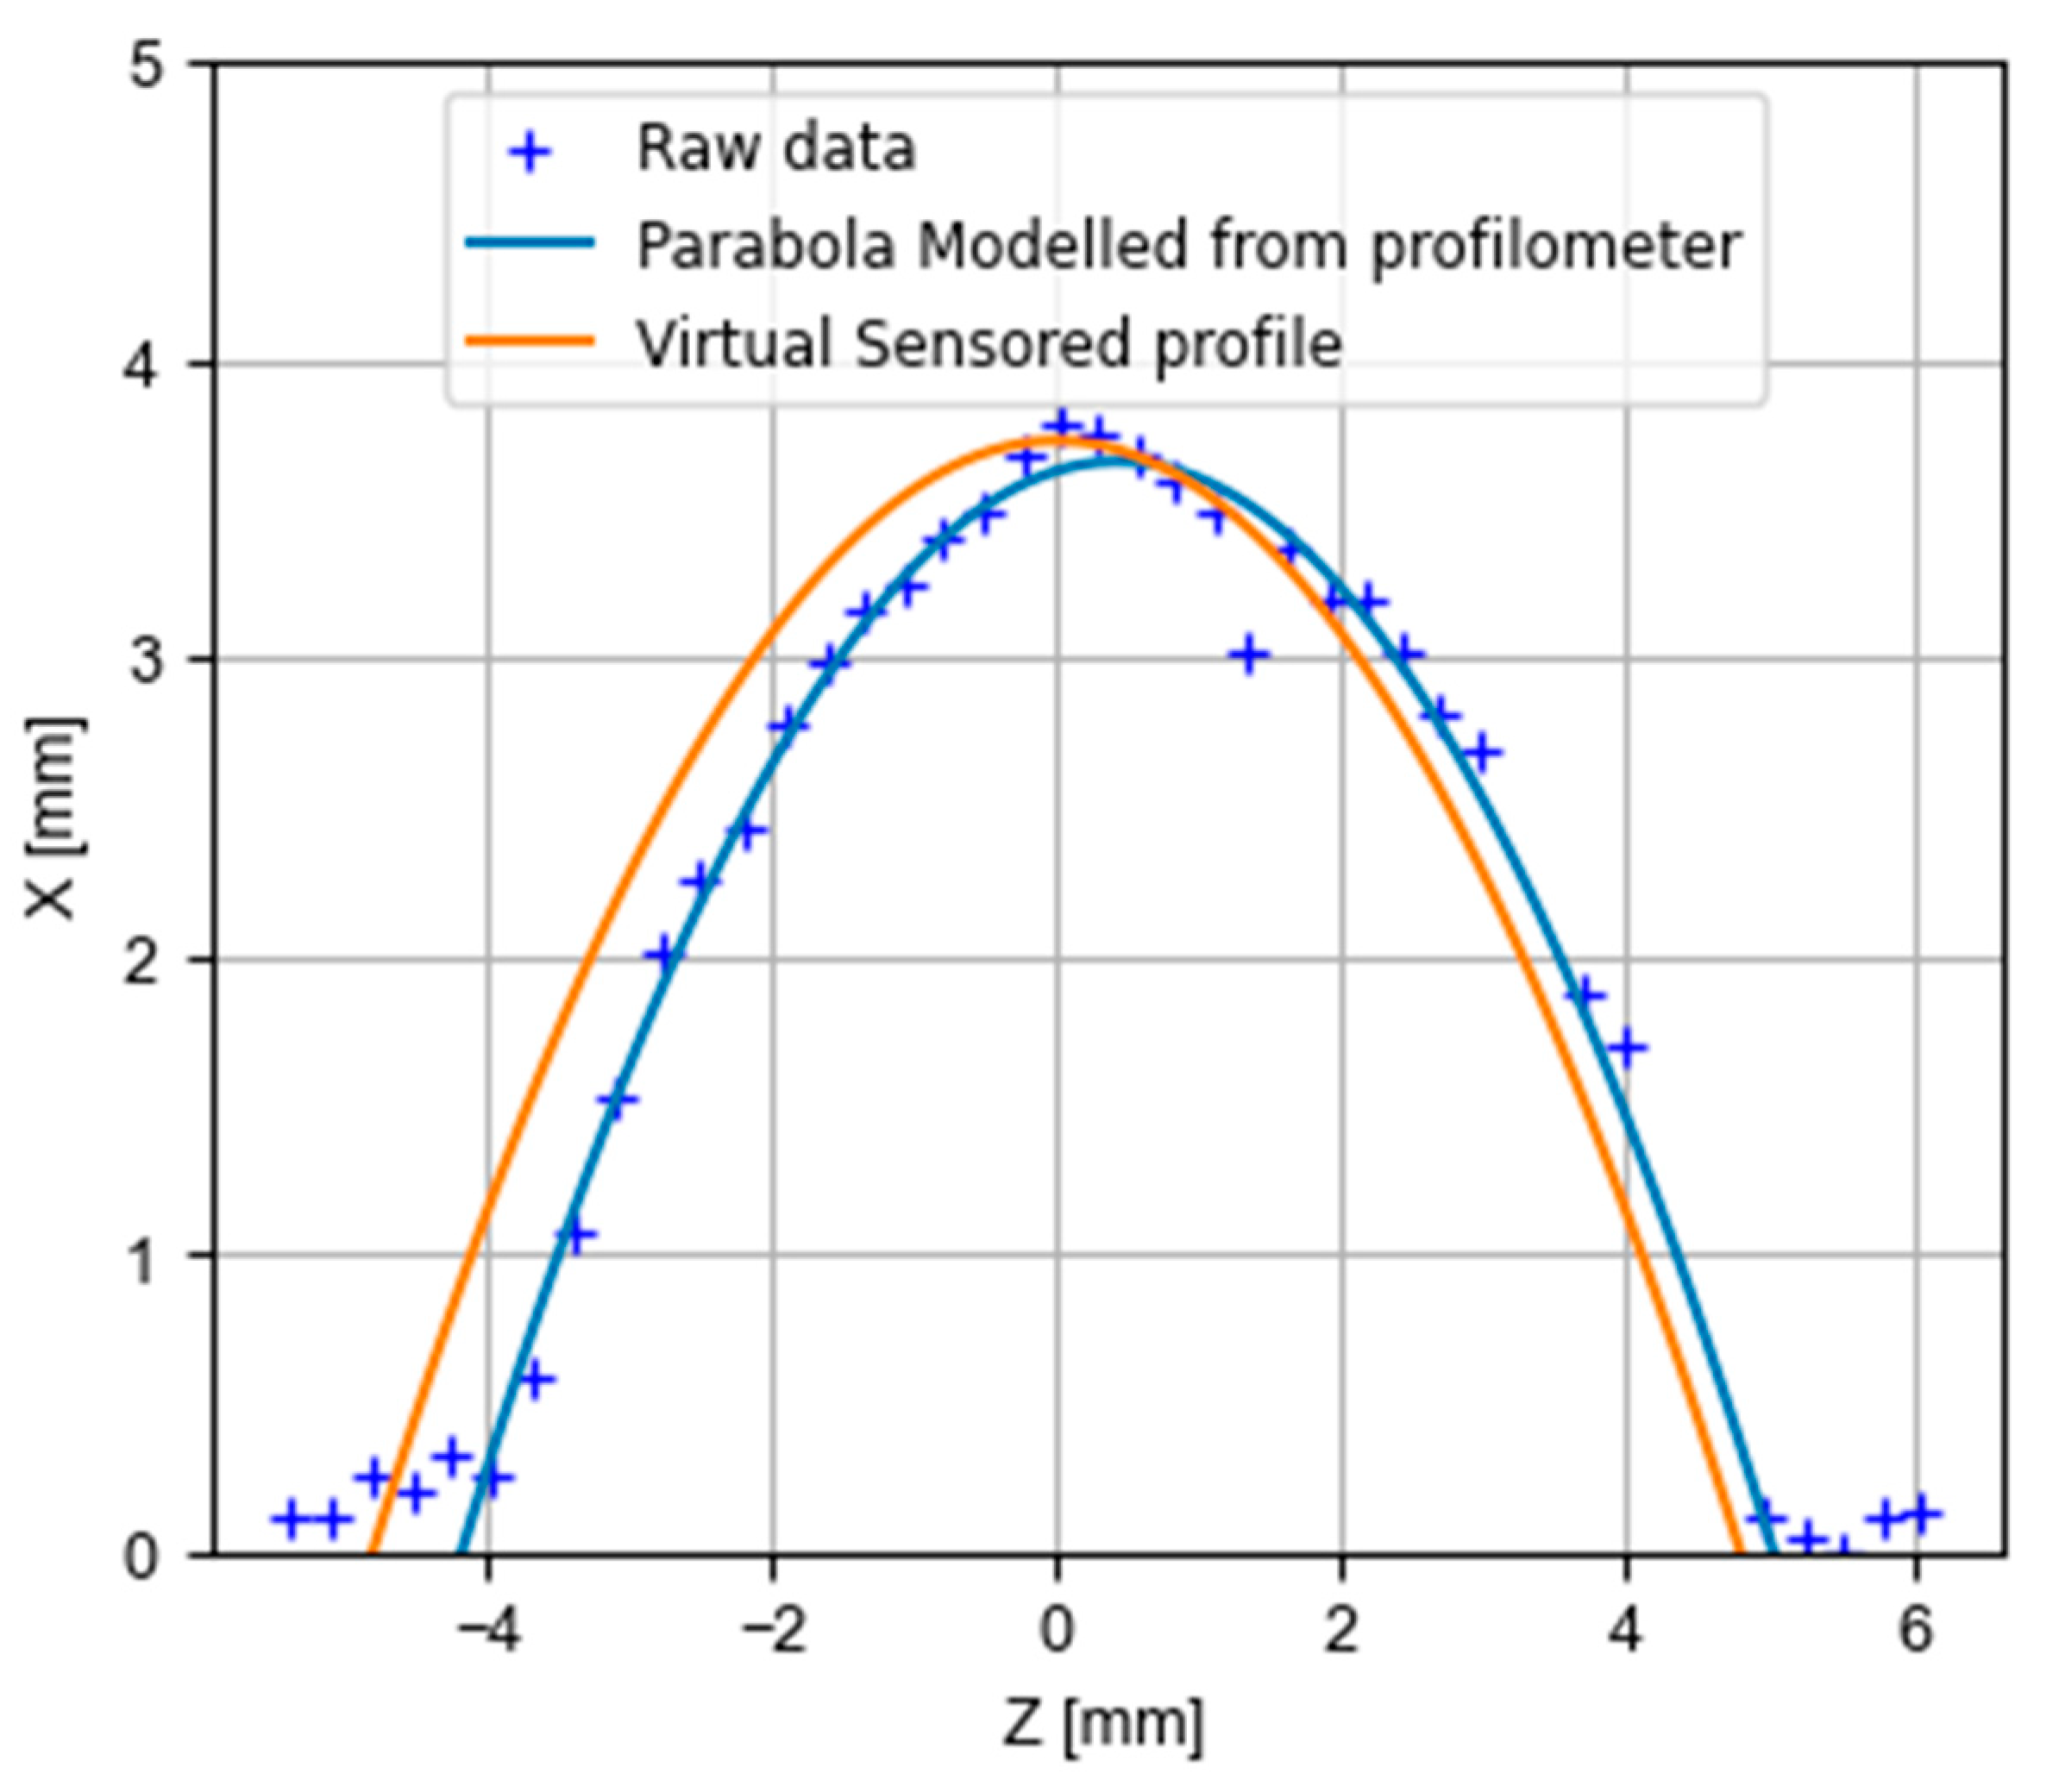

Table 1.
Chemical Composition of Invar Wire Used in Experimentation.
| C | Mn | Cr | Ni | Nb | Fe | Ti |
|---|---|---|---|---|---|---|
| 0.22% | 0.43% | 0.01% | 35.66% | 1.38% | 61.6% | 0.53% |
Table 2.
Design of Experiments for Process Optimization.
| Test N# | Wire Feed (m/min) | Deposition rate (kg/h) | Traverse Speed (cm/min) | Ratio |
|---|---|---|---|---|
| 1 | 4 | 2.2 | 80 | 5 |
| 2 | 4 | 2.2 | 53 | 7.5 |
| 3 | 4 | 2.2 | 40 | 10 |
| 4 | 10 | 5.5 | 200 | 5 |
| 5 | 10 | 5.5 | 134 | 7.5 |
| 6 | 10 | 5.5 | 100 | 10 |
| 7 | 16 | 8.8 | 320 | 5 |
| 8 | 16 | 8.8 | 212 | 7.5 |
| 9 | 16 | 8.8 | 160 | 10 |
Table 3.
Zero bead height and width for the different test conditions.
| Test N# | w1 (mm) | w2 (mm) | w3 (mm) | w (mm) | h1 (mm) | h2 (mm) | h3 (mm) | h (mm) |
|---|---|---|---|---|---|---|---|---|
| 1 | 5.20 | 5.40 | 5.30 | 5.30 | 1.80 | 1.90 | 1.80 | 1.83 |
| 2 | 4.70 | 5.00 | 4.90 | 4.87 | 3.10 | 3.20 | 3.00 | 3.10 |
| 3 | 6.30 | 6.30 | 6.30 | 6.30 | 3.20 | 3.40 | 3.20 | 3.27 |
| 4 | 5.20 | 5.00 | 5.30 | 5.17 | 2.10 | 2.00 | 2.10 | 2.07 |
| 5 | 6.90 | 6.50 | 6.60 | 6.67 | 2.60 | 2.40 | 2.20 | 2.40 |
| 6 | 8.00 | 8.10 | 8.30 | 8.13 | 3.00 | 3.00 | 2.90 | 2.97 |
| 7 | 4.30 | 2.30 | 3.60 | 3.40 | 2.60 | 2.52 | 2.50 | 2.54 |
| 8 | 6.80 | 5.30 | 6.10 | 6.07 | 4.30 | 2.60 | 2.20 | 3.03 |
| 9 | 8.30 | 8.30 | 7.60 | 8.07 | 4.00 | 4.00 | 3.40 | 3.80 |
Disclaimer/Publisher’s Note: The statements, opinions and data contained in all publications are solely those of the individual author(s) and contributor(s) and not of MDPI and/or the editor(s). MDPI and/or the editor(s) disclaim responsibility for any injury to people or property resulting from any ideas, methods, instructions or products referred to in the content. |
© 2024 by the authors. Licensee MDPI, Basel, Switzerland. This article is an open access article distributed under the terms and conditions of the Creative Commons Attribution (CC BY) license (http://creativecommons.org/licenses/by/4.0/).
Copyright: This open access article is published under a Creative Commons CC BY 4.0 license, which permit the free download, distribution, and reuse, provided that the author and preprint are cited in any reuse.


