
Preprint
Article
The nonspecific effects of COVID-19 vaccination upon non-COVID-19 all-cause mortality (NCACM) in the population of England: Effects of age, sex, COVID-19 variant, vaccination history, and time in a real-world study from Jan-21 to May-23
This version is not peer-reviewed.


Submitted:
03 January 2024
Posted:
04 January 2024
You are already at the latest version
Abstract
All vaccines exhibit specific and nonspecific effects. Specific effects are shown by the efficacy against the target pathogen, while nonspecific effects can be detected by the change in all-cause mortality. The real-world non-COVID-19 all-cause mortality (NCACM) data for the population of England between January 2021 and May 2023 was assessed. All vaccines administered were based on the original Wuhan antigen. Each gender and age group, along with COVID-19 variant shows its own unique NCACM vaccination benefit/disbenefit time profile. The efficacy of COVID-19 vaccination against COVID-19 disease/death per se is undisputed, however, the nonspecific outcomes of COVID–19 vaccination is far more nuanced than have been widely appreciated. This confirms an earlier study on the unanticipated nonspecific effects of influenza vaccination against all-cause winter mortality. Interestingly, a high proportion of NCACM beneficial effects occurred during the first 21 days following COVID-19 vaccination, while the worst example of increased NCACM occurred during the fourth dose of COVID-19 vaccination in 19–40-year-olds for the interval >21 days post vaccination which led to NCACM 3- to 10-times higher than in the unvaccinated. By the time of the Omicron variant, NCACM outcomes in those aged 90+ are mostly adverse. The beneficial nonspecific effects of COVID-19 vaccination increase with age and reach their maximum effect during the second week post vaccination for age groups below 50 years, rising to during the third week for those aged 70+. Finally, we discuss the mechanisms by which COVID-19 vaccination could induce wider nonspecific effects. Most of these mechanisms seem to depend on gene regulation by noncoding RNAs which also interact with mRNAs. We suggest that further international studies are required to discern the nonspecific NCACM effects of the different COVID-19 variants other than the three variants prevalent in the UK, and different types/manufacturer of COVID-19 vaccines which have been employed around the world. We can only speculate regarding the nonspecific effects of the COVID-19 vaccines administered to persons with an asymptomatic infection, and during vaccine waning. Vaccines not only need to be effective against the target pathogen, as primarily determined by antibody production, but need to minimize any unanticipated adverse nonspecific effects against all-cause mortality.
Keywords:
COVID–19
; vaccination
; all-cause mortality
; age
; gender
; complex system
; pathogen interference
; seasonality
; miRNAs
; negative vaccine effectiveness
; nonspecific vaccine effects
supplementary.docx (43.17KB )
Preprints on COVID-19 and SARS-CoV-2
1. Introduction
The high mortality from the COVID-19 pandemic led to a desperate search for effective vaccines and of necessity several were given temporary or emergency authorization. However, there is increasing awareness that vaccines exhibit specific and nonspecific effects in both humans and animals [1,2,3,4,5,6]. Thankfully most (but not all) of the nonspecific effects detected in humans and animals have led to wider beneficial effects against all-cause mortality [1,2,3,4,5,6]. Benn et al [6] have argued that the existence of nonspecific effects has profound implications for the testing, approving, and regulation of vaccines. The specific effects are measured by the efficacy of the vaccine against the targeted pathogen, while the nonspecific effects can be discerned by evaluating the change in all-cause mortality. A fully efficacious vaccine will reduce deaths arising from the targeted pathogen but should have minimal adverse nonspecific effects.
There are two examples of the nonspecific effects of vaccines during COVID-19. During the early stages of the pandemic both influenza and BCG vaccination gave nonspecific protective effects against COVID-19 morbidity and mortality [7,8,9,10].
The nonspecific effects arise from the ability of pathogen antigens to cause polyclonal immune activation [11,12], immunostimulation [13], antitumor effects [14], and the ability of pathogen antigens to initiate the mechanisms of pathogen interference, which are mediated by the production of small noncoding RNAs (miRNAs) which comprise the small non-coding RNAs (ncRNAs): miRNA, siRNA, etc. [4]. The small ncRNAs then regulate gene expression which either enhances or diminishes infection by other pathogens. Vaccines (as a class of antigens) also stimulate the production of miRNAs [4], and hence create sometimes unexpected, nonspecific outcomes like pathogen interference. Vaccination may also induce antibody-dependent enhancement with negative health consequences [15,16,17,18].
While it is true that all vaccines in commercial use are effective against the target pathogen, we have recently demonstrated that influenza vaccination has powerful nonspecific effects against all-cause winter mortality [19]. Indeed, using a data set of nearly 100 countries over a 40-year period no long-term net effect against all-cause winter mortality could be demonstrated [19,20]. This was because in some years influenza vaccination was associated with benefit against all-cause mortality, while in others with net disbenefit [19,20]. The degree of benefit/disbenefit varied each winter (as does the composition of the vaccine) and between countries. Increasing obesity may be associated with net disbenefit [20]. Climatic and other variables appear to explain the different levels of international pathogen circulation and diversity over the winter or rainy season near to the equator [19,20].
Influenza and SARS-CoV-2 are among the class of RNA pathogens showing high mutation rates [21,22,23,24]. Each new clade of antigen mutations leads to a unique age profile for each variant which is also associated with the generation of specific miRNAs, further nuances of pathogen interference and epigenetic modifications [25]. In the UK, the COVID–19 pandemic commenced somewhere in early 2020 with the first laboratory-confirmed death occurring on 2 March 2020 [26]. However, COVID–19 testing capacity was very low at that time and earlier deaths are possible. Research in the USA suggests that COVID–19 deaths may have started in early January 2020 [27]. Hence, we have the pre-COVID era which ends in December 2019 through to the ongoing surges as new variants come to the fore [24,28,29,30].
As for the strains of COVID–19 the original Wuhan strain is predominant during 2020. The Alpha strain (formerly the Kent variant) appears around December 2020 and predominates from January to June 2021, the Delta strain (formerly the Indian variant) commences around May 2021 and predominates from July to December 2021. While Omicron (BA.1) first emerges in November 2021 but begins to spread in December 2021 and dominates from 2022 onward (BA.2 followed by BA.4/5, etc.) [24,28,29,30]. The Alpha variant caused slightly higher mortality than the original strain and will therefore affect mortality in the winter of 2020/21 [24,28,29,30]. The Delta variant which mainly affected the winter of 2021/22 had higher transmission and a slightly lower or equal mortality risk [24,28,29,30].
Under the normal course of events vaccination against something like influenza commences before the influenza season. However, the vaccination schedule for COVID-19 vaccines depended on the dates for approval and the need for widespread vaccination among adults. As a result, individuals were being vaccinated at different times of the year, at points associated with the arrival of new variants, and at occasions of high through to low incidence of COVID-19 infections. If nonspecific effects were to exist, then the unusual circumstances associated with the COVID-19 vaccination campaign offer the greatest opportunity for such effects to be identified and quantified.
In the UK, COVID-19 vaccines were approved in the following order: Pfizer/BioNTech (2 December 2020 - deployed 8 December 2020), AstraZeneca (30 December 2020 - deployed 4 January 2021), Moderna (8 January 2021 - deployed 7 April 2021) [31,32,33]. The proportions of persons vaccinated by age and time from different manufacturers (Pfizer/AstraZeneca/Moderna) does not appear to be publicly available. Table 1 provides a summary of the timeline for vaccination in England.
COVID–19 vaccination began on 8 Dec 2020 for care home residents, persons aged 80+, and some health care workers, by 18 January 2021 this included age 70+ and persons with very high clinical risk, by 15 February age 65+ and persons with high risk, and by 22 May age 32+ and age 18+ by 18 June 2021 [31,32,33]. Following reports of a rare type of blood clot in late March 2021 for the AstraZeneca vaccine, persons under 30 years were all given the mRNA vaccine from 7 April 2021 onward, and those aged under 40 from 7 May 2021 onward [34].
Astra Zeneca was phased out from September 2021. An alternative non-mRNA vaccine Novavax (recombinant protein) was made available from spring 2022 onwards. Some younger children with high clinical risk were vaccinated from January 2021 onward [33,34,35,36]. Vaccination of persons aged 16 ̶ 17 years was from July 2021 onward, 12 ̶ 15 years from September 2021 onward and 5 ̶ 11 years from February 2022 onwards for those with high risk and for any child aged 5 ̶ 11 from April 2022 onward. The majority aged 12+ were vaccinated during late 2021. All with mRNA as per the age under-40 rule as above. Booster doses began to be delivered from 16 September 2021 and these were all mRNA. Further booster doses were given in February/March 2022, and September 2022 for the winter of 2022/23 respectively. From around spring 2022 onward persons were vaccinated (including booster) with a mix of the mRNA vaccine and the Novavax (a non-MRNA recombinant protein) vaccine.
Healthcare workers in the NHS (who will mostly be under the age of 65) began to be vaccinated from 8 December 2020 (initially with Pfizer/BioNTech) and by March 2021 over 80% of clinical staff had received their first dose and over 39% had received their second dose [35]. To vaccinate the most people, the timing of the second dose was delayed to approximately 12 weeks [33]. In practice, vaccination schedules showed local and regional variation. In order not to waste vaccines, toward the end of the day many centers would send social media messages for adults of any age to be vaccinated.
A somewhat neglected 2010 study suggested that optimum vaccination outcomes can only be achieved when the timing of vaccination is adjusted relative to the target and competing pathogens [36]. The implication is that sub-optimum outcomes are possible. Table 1 summarizes which vaccines were prevalent in each age band for vaccination during the three variants.
The timing for the approval of COVID-19 vaccines (listed above) meant that the English population (mainly oldest first) only began to be vaccinated during an outbreak of the Alpha variant [25], and with first dose still being delivered to some people into 2022 and 2023 during the outbreak of the Omicron variant [37]. Ample opportunities for suboptimum time-based outcomes are therefore present.
While COVID–19 vaccination is clearly effective against COVID–19 mortality per se [37,38,39] there is a paucity of studies using the ‘gold standard’ of a reduction in NCACM. This was achieved using a record-linked whole population study of COVID–19 vaccination in England by the Office for National Statistics (ONS) in 2021 through to May 2023. This study uses age bands, month of death, and vaccination status (first, second, third dose at both up to 12 weeks and greater than 12 weeks post vaccination) [40].
The all-cause mortality data set used in this study is very large and covers all residents of England who are registered with a GP and were residents in England at the 2011 census [40]. This allows detailed analysis of 944 000 deaths over a 29-month period by gender, over 7 age bands, and by various stages of vaccination split by less than 21 days, and greater than 21 days post vaccination, and at monthly intervals – which can be grouped by SARS-CoV-2 variant [25].
The unique feature of the ONS data is that mortality is available at monthly intervals – a feature which is very rare in vaccine studies. Such profiles compare the mortality rates by age and gender within a vaccination stage or over time. The shape of the time profile gives an internal consistency check. We thereby avoid arguments regarding the exact value of each data point, since the principal aim of the study is to demonstrate that nonspecific effects do exist and have important consequences.
Our results are illustrative rather than prescriptive for three reasons.
- The study uses only seven broad age bands. We have demonstrated that each COVID-19 variant has a unique single-year-of-age profile for mortality [25] and would argue that age should be a continuous variable. The use of age bands is probably concealing more nuanced behavior.
- The study was conducted at a time when vaccines in the UK were based on the original Wuhan stalk antigen. In addition, by early 2023 the Alpha and Delta variants are no longer present, and by the end of the study only Omicron sub-variants were circulating. The results cannot therefore be directly extrapolated into the future should variants other than Omicron arise.
- Time since vaccination is split into two groups, namely, up to 21 days and greater than 21 days. The up to 21-day group encompasses the time when immunity is being optimized, however, the greater than 21-day group contains a mix of individuals with differing degrees of vaccine waning.
Hence, we seek to establish the basic principles rather than argue if a certain set of conditions caused a large or very large increase in non-COVID-19 mortality in the vaccinated. Confidence intervals are not shown simply because they only add unnecessary complexity to an already data rich study. They are however available in the ONS data [40].
The above needs to be understood in terms of system complexity which leads to unexpected outcomes. We have recently proposed that influenza pandemics and epidemics show very high system complexity leading to unexpected all-cause mortality outcomes associated with influenza vaccination in approximately 50% of years [4,19,25]. Such system complexity may well lie behind the reported nonspecific effects of vaccines [1,2,3,4,5,6]. Indeed, it is possible that the age-based schedule of COVID-19 vaccination (as above), along with the specific (and unexplained) single-year-of-age profiles for mortality associated with COVID-19 variants [25], has inadvertently increased system complexity in unexpected ways. It is hoped that this study will shed light on such issues.
Finally, we will provide an extended discussion of the mechanisms by which such nonspecific effects can occur focusing on the somewhat neglected effects of both the environment, drugs, and vaccines upon the expression of noncoding RNAs which are profoundly powerful regulators of gene expression.
2. Materials and Methods
2.1. All-cause mortality by vaccination status in England
Month of death, vaccination status and age band come from a whole population record-linked study by the Office for National Statistics (ONS) [40]. Vaccinations are not recorded on the death certificate when the death is registered, therefore the ONS publication ‘Deaths involving COVID-19 by vaccination status’ [40] uses mortality data with data linkage to the National Immunization Management System.
The data for the age-standardized mortality rates (ASMRs) are created using the Public Health Data Asset (PHDA), a linked dataset combining the 2011 Census, the General Practice Extraction Service (GPES) data for coronavirus (COVID-19) pandemic planning and research, and the Hospital Episode Statistics (HES). The ONS then linked vaccination data from the National Immunization Management Service (NIMS) to the PHDA based on the individuals NHS number.
This data source has two files. The first file contains data for the period January 2021 to May 2022. The second file contains updated data for the period April 2021 to May 2023. The data is continuously updated implying that the file to May 2023 has more deaths than the file to May 2022. Numerical data in both files is stored as text which was converted back to numbers using the Microsoft Excel Data tool, ‘Text to Columns’. In this study data for the months January to March 2021 was taken from the first file while that from April 2021 to May 2023 was from the second file.
Both files give the age standardized mortality rate (deaths per 100 000 person years) for several age bands. Confidence intervals are given in the ONS data file [40] and show the expected variation with number of deaths, hence, ± 20% of the mortality rate value based on 100 deaths (for example females aged 18-39, first dose > 21 days ago, for death in April 2021), and ± 3.9% at 2500 deaths, etc. Age standardized mortality is not given for instances where there are less than 3 deaths within the age band - zero deaths are reported as zero.
values ‘less than 3’ was substituted by 1 death and the resulting unadjusted mortality rate was calculated. The mortality rate is standardized within each age band. The raw versus standardized mortality rates by age band were compared and showed high correlation (R-squared = 0.998). The raw mortality rate tended to be lower than the standardized rate and the interquartile range for the difference was -3.6% to +1.1%. The high correlation between the two arises from the fact that the age bands are mostly only 10-years wide, except for ages 18 ̶ 39 and 90+. Age standardization within such relatively narrow age bands is unable to have a large impact on the difference between raw and age standardized mortality rates. The raw mortality rate is only used when an age standardized value is not available on 29% of occasions.
The ONS only provides data for all-cause mortality and COVID-19 mortality [40], and hence non-COVID-19 mortality (NCACM) is via subtraction of the latter from the former. In the case of <3 deaths, this creates gaps in the non-COVID-19 mortality after subtraction.
2.2. Effect of time of vaccination, vaccine history, gender and age upon all-cause mortality
To maintain simplicity, the data is presented as the mortality rate for both the vaccinated and the unvaccinated. This is given monthly or over the duration of the various COVID-19 variants, and vaccine doses.
Given that the study uses the population of England, the unvaccinated groups are generally large and provide a reliable time profile against which to compare the outcomes in the vaccinated.
At small numbers a Poisson distribution becomes highly skewed. In a Poisson distribution the two equally most common values are the average, and the average minus one. Hence, for 3 expected deaths, 2 and 3 should appear equally, etc. The outcome is that at small numbers a Poisson distribution tends to underestimate, hence, very high values of disbenefit are most likely underestimates rather than statistical overestimates. We note that the data contains far fewer examples of 0 deaths than would be expected.
3. Results
3.1. Overview of the net effect of vaccination with time
As a reference point Figure A1.1 and Figure A1.2 in the Appendix shows the trend in proportion of total deaths ‘with’ COVID-19. The two major outbreaks peaking at weeks ending 17-Apr (Wuhan) and 8-Jan (Alpha) are evident. Figure A1 is for all ages but clearly shows the peaks and troughs in COVID-19 deaths. Weekly data has been used for greater definition [42]. From Figure A1.2 note three ‘summer’ minima in the proportion of total deaths with COVID-19 in June to Aug-21, Jun-22, and Jul-23. Also note peaks in January 2021, and a series of undulating maxima in Sep-21, Nov-21, Jan-22, Apr-22, Jul-22, Oct-22, Jan-23, and Mar-23. These most likely outbreaks of the various COVID-19 variants and sub-variants. At the other extreme is a trough occurring in April/May of 2021 for age bands below 50 years. The trough represents the non-outbreak tail end of the Alpha variant [25], followed by the arrival of Delta which specifically targets the younger ages [25].
Further undulations reflect the relative impact of outbreaks of the three different SARS-CoV-2 variants upon different age groups [25]. Likewise, Omicron had a disproportionate effect on the groups aged over 80 years [25]. Hence the overall shapes of the trends are consistent with the independently characterized effects of the variants upon the year-of-age age profiles for mortality [25].
Figure 1 shows the net effect of COVID-19 vaccination against all-cause mortality (including COVID-19 deaths) for persons aged 18+ receiving one or more doses of the vaccine. Below the blue dashed line is increasing protection, i.e., all-cause mortality is reduced relative to the unvaccinated, while above lies increasing all-cause disbenefit.
As can be seen the COVID-19 vaccines employed in England generally had a net beneficial effect against all-cause mortality (except perhaps in the two youngest age bands, under specific conditions) which diminished with time, seemingly, due to the transition between SARS-CoV-2 variants and sub-variants. This decline in performance reflects the known specific effect of antigenic distance between a vaccine and the prevailing variants and sub-variants [4]. It will also include any unanticipated nonspecific beneficial/disbenefit effects from vaccination, which are expected to exist [1,2,3,4,5,6,7,8,9,10,11,12,13,14].
Differences between males and females are evident with males seemingly benefiting more from vaccination than females. June and July of 2021 represent a point of minimum COVID-19 mortality as a proportion of all-cause mortality [42]. COVID-19 mortality does not drop to this low level again until June of 2022 just after the peak of infections due to the arrival of the first Omicron variant, and then again in July 2023 [25].
Based on the mean/median values for the last six months (Dec-22 to May-23) the best vaccine protection occurs in the interval 50–79 years and deteriorates either side. Disbenefit against all-cause mortality occurs in the youngest and oldest age groups.
Hence, the overall conclusion is that COVID-19 vaccination was generally but not specifically successful at reducing population-wide all-cause mortality (including COVID-19 mortality) but that the effectiveness of the vaccine reduced as new SARAS-CoV-2 variants and sub-variants showed increasing antigenic distance from the vaccines based on the original Wuhan strain. However, age appears to be a key factor as has been previously demonstrated for COVID-19 variants [25].
Within the above context of general vaccination success (with curious exceptions), the aim of this paper is to avoid investigating the specific effects of vaccination which may include antigenic distance and other factors, hence, to focus primarily on all-cause mortality which excluded COVID-19 deaths (NCACM), to investigate some of the more curious outcomes seen in Figure 1.
3.2. Unexpected complexity
Figure 2.a and Figure 2.b show the NCACM rate for the vaccinated during the 21 days and >21 days post vaccination and corresponding unvaccinated NCACM rate. This is shown for the youngest age group, namely, 19–39 years. Note that in both Figure 2.a and Figure 2.b the month is the month of death rather than the month of vaccination. For the <21-day post vaccination group, the month of death and vaccination will be mostly identical. As a generalization the male rate is higher than that for females. The only exception is for the group who received their fourth dose earlier than the general population.
The <21-day post vaccination group has fewer data points because it only spans a 21-day period whereas the >21-day group can be for an extended duration, especially for persons who halted their vaccine journey after the first, second or third vaccine dose.
We understand that every data point is subject to statistical uncertainty and the reader is invited to use their knowledge of statistics to interpret the trends. While a 95% confidence interval exists in theory, visual inspection can quickly reveal questionable values. For example, unvaccinated male mortality in Sep-22 and Feb-23 looks to be low. On both occasions the data can be adjusted upwards to somewhere close to the two months on either side. Such an adjustment has a negligible effect on the overall conclusions. The same could be said for female first shot >21-day mortality in Jun-22, and for male first shot > 21-day mortality in Feb-23. Adjustment up to the average of the surrounding points likewise makes a minor effect on interpreting the overall chart, namely, nonspecific effects are highly prevalent.
Should you choose to question the validity of the unvaccinated as an ‘unbiased’ group you can simply shift the lines up or down, with inconsequential effects on interpreting the chart. All high values in the chart remain unquestioned because they are part of a continuous trend. Recall that all values is the real-world actual outcome. As can be seen in Figure 2.a the vaccination of males with their first dose continued through to March 2022. After this point so few are given their first dose that small numbers preclude meaningful analysis.
Few people aged 19–39 was given a fourth dose delivered mainly in October and November (Figure 2.b). Note that the corresponding charts for all other age groups are given in the Appendix Figure A3.1 to 3.6.
The main point is that in the absence of nonspecific effects the lines for the vaccinated and unvaccinated should be one and the same. This is clearly not the case. It would be interesting to review the reasons for early vaccination with the fourth dose from May to September 2023, and their associated risk factors. Whatever the case, they experienced very high mortality. It would be apposite if every NCAM death following the fourth dose in this age band was subject to a retrospective clinical review.
Note from Figure 2.a that outcomes for the second and third dose <21 days after vaccination are mostly beneficial. That for the first dose reaches maximum protection against NCACM in Jun-21, which is around the point of minimum levels of COVID-19 mortality (Figure 1.b.), implying that very low COVID-19 infection (even as asymptomatic), facilitates this type of nonspecific effect.
Graphs for the other age bands are given in the Appendix as Figure A2.a to Figure A2.f. Examples of nonspecific benefit/disbenefit are likewise observed which are age/gender specific. Recall that time represents transitions between COVID-19 variants, transitions between seasons, and fluctuation between high/low COVID-19 deaths (as in Figure 1.a. and Figure A1.b.)The significance of such transitions will be covered in the Discussion.
Based on Figure 2.a and Figure 2.b plus A2.a to A2.f, nonspecific effects do exist and that under different combinations of age/sex/COVID-19 variant/season/time since vaccination that these can be beneficial or give disbenefit. Figure 1 is therefore a composite derived from a complex set of highly dynamic interactions.
3.3. The timing of the nonspecific benefit of vaccination during the first 21 days
‘Table 9’ in the ONS data set covering the period January 2021 to May 2022 [40] provides a useful breakdown of both COVID-19 and non-COVID-19 deaths during the first 11 weeks following vaccination. This material is summarized in Figure 3 as the ratio of ‘with’ COVID-19 deaths to other non-COVID-19 deaths. This is a composite picture from the first, second and third doses, and is not split by gender. During the first 11 weeks the data encompasses some 2068 deaths for the age 10–39 group, through to 78 925 in the age 80–89 group, and 53 723 in the age 90+ group.
This data is presented as a ratio of ‘with’ COVID-19 deaths to all other deaths. The ratio needs to be interpreted in the light of Figure 2.b which shows benefit against NCACM for the first 21 days (3 weeks) postvaccination, i.e., the denominator has been reduced.
Also, from Figure A1.b it should be noted that the ratio of COVID-19 to non-COVID-19 deaths is constantly changing over time and for the prevailing COVID-19 variant [25]. Depending on the sampling strategy employed by the ONS and the proportion of persons who received each of the three doses up to May-22, the magnitude but not the timing of the peaks seen in Figure 3 will be affected. However, when compared to Figure A1.b the 21% ratio of COVID-19 deaths in Figure 3 is far beyond anything possible from simple COVID-19 infection.
Somewhat surprisingly Figure 3 appears to reveal nonspecific disbenefit following vaccination relating to ‘with’ COVID-19 deaths. This disbenefit commences in the first week, while the maximum disbenefit occurs during the second week for ages <50 years, and during the third week for ages 80+ and some point between 2 to 3 weeks for ages 50–79. This disbenefit then diminishes and reaches a minimum after around 6 weeks in the younger groups, and up to 10 to 11 weeks in the two oldest age bands. Clearly the extent and timing of the disbenefit is age dependent.
Since this is a composite of different vaccine types, male/female and up to three different vaccine shots, more cannot be discerned, however, it confirms the fact of unanticipated nonspecific effects following COVID-19 vaccination and its age dependence. More detailed analysis using days rather than weeks, males/females, vaccine dose number, and vaccine type/manufacturer is highly recommended.
Antigen production can be excluded since this only occurs around 3 weeks after vaccination. Given the timescale for the increase in COVID-19 mortality we suspect enhancement of asymptomatic COVID-19 infection as the most plausible cause. COVID-19 is a multiorgan disease [43] and presumably asymptomatic or sub-clinical infections can be triggered to assume greater clinical severity. Further detail will be given in the Discussion.
3.4. All-cause (including COVID-19) mortality during Omicron
Given the results in Figure 1, Figure 2, Figure A2, and Figure 3 it is illustrative to look at the trend in all-cause (including COVID-19) mortality during Omicron. As shown in Figure A1.a. and Figure A1.b. the mortality rate during Omicron is very low, and especially below the age of 70. Depending on your point of view, the rationale for vaccinating ‘healthy’ persons below the age of 65 is a grey area. The Discussion presents the evidence suggesting that use of the experimental vaccines should have been tempered by the possibility of unanticipated disbenefit.
Hence, it is useful to look at the real-world outcomes. Reverting to all-cause mortality removes the issues surrounding subtracting COVID-19 from all-cause mortality to get NCACM. Plus, the number of deaths is slightly larger leading to lower statistical uncertainty. In addition, the net outworking of specific and nonspecific vaccine effects can be observed. The outcome is shown in Figure 4 which shows the results for age 18–39. Note that deaths from Omicron commence around March 2022 and the transition from the end of Delta is shown for context. A similar chart for age 90+ is shown in the Appendix as Figure A3.
Regarding statistical uncertainty, male unvaccinated mortality in Sep-22 looks to be a statistical outlier and is probably closer to August and October of 2022, as is observed for females. However, making such an adjustment negligible difference to interpreting the chart. Likewise, female mortality for the fourth dose <21 days in October 2022 looks to be an outlier, but adjustment to somewhere near to the values for September and November 2022 also makes a negligible effect on interpreting the chart.
Hence, all people receiving their first, second or third dose <21 days ago show increasing adverse outcomes beyond Mar-22, May-22, and Aug-22 respectively. The fourth dose <21 days only shows benefit around October/November 2022, but is otherwise not beneficial compared to their unvaccinated colleagues. The fourth dose >21 days is universally not beneficial, etc.
A similar story emerges for those aged 90+ in Figure A3. Somewhat curiously the disbenefit attached to the fourth dose >21 days appears to diminish with time. This could suggest that vaccine waning is behind this nonspecific effect.
As above, outliers can be quickly spotted, such as low values in August 2022 and January 2023 for males receiving their fourth dose <21 days ago. Adjustment upward turns benefit into borderline disbenefit. The overall observation is that over half of outcomes show disbenefit except for the fourth dose >21 day between April and August 2022 for both males and females. The fourth dose <21 days is generally beneficial up to February 2023, but then leads to disbenefit. The second dose <21 days shows a small benefit between March and May 2022, but otherwise shows disbenefit, etc.
As with NCAM a dynamic interaction between competing biological forces is evident which unfortunately is only revealed retrospectively. As noted in Figure 1 it is only the age groups 50–79 years which experience a greater proportion of benefit during the period beyond December 2022.
In conclusion, evidence for highly dynamic nonspecific effects from COVID-19 vaccination can be demonstrated. As expected from other vaccination studies [1,2,3,4,5,6,7,8,9,10] there is a mix of benefit and disbenefit which appears to be highly dependent on the context. The exact balance of the forces can be demonstrated by comparing NCAM and all-cause mortality outcomes.
4. Discussion
The discussion includes a survey of explanatory literature and will attempt to present a whole system framework in which to interpret both the conclusions of this paper and other studies. It also seeks to emphasize roles for system complexity [4,19,20], and how this may contribute to nonspecific vaccine outcomes under specific conditions.
4.1. Factors driving complexity in COVID–19 mortality and the vaccine response
4.1.1. Declining vaccine effectiveness
Regarding Figure 1 the existence of negative vaccine effectiveness is not widely communicated to the public, but its occurrence is based on the antigenic distance between the vaccine and the current circulating variant or clade in the case of influenza [4].
Hence for influenza, a group meets under the auspices of the WHO to determine the antigen mix for the forthcoming influenza season in the southern and northern hemispheres and large numbers of vaccines are duly manufactured.
Sometimes a new clade emerges before the vaccine is administered which has too great an antigenic distance and the immune training via the vaccine diverts the resulting immune response to the production of futile antibodies which can lead to higher mortality in the vaccinated compared to the unvaccinated [4].
The reality of antigenic distance is poorly quantifiable and while it may be realized that the latest clade is antigenically distant, vaccination is still initiated under the hope that some similarity may exist. At present, we can only speculate regarding the basis for the nonspecific effects which may accompany antigenic distance, but simply observe that they do seem to exist. Whatever the mechanisms, they are highly dependent on combinations of sex, age, vaccine history and COVID-19 variant. A case of vaccination in the face of scientific uncertainty. A potential role for noncoding RNAs is discussed later.
Such expression is probably made more complex by the unique single-year-of-age profiles for COVID-19 mortality [25]. Evidence exists that influenza vaccines may likewise show single-year-of-age profiles [4]. Such profiles are totally obscured using broad age bands such as the 65+ age band universally used in influenza VE studies [4], and the confusing jumble of age bands employed in COVID-19 vaccine studies [25]. As a result, the newly emergent COVID-19 variants behave as if they were ‘different’ pathogens [44]. The presence of antigenic distance is reflected in declining vaccine effectiveness documented in studies conducted during the Delta and Omicron variants [45,46,47].
Thankfully at the third/booster dose the presence of negative vaccine effectiveness (in Figure 1) was not widespread for the bulk of the population who followed the standard fully vaccinated profile. At the fourth dose things appeared to be somewhat more complex.
4.1.2. COVID-19 variants show year of age specificity for mortality
It has been highlighted that COVID-19 variants show year of age specificity for death which is also dependent on sex. Such age specificity is primarily due to the variant and not the medical interventions because the age specificity abruptly changes with the arrival of each new variant [25], however, the shape of the primary age profile is modified to a degree by vaccination. Hence the Wuhan strain shows maximum mortality as a proportion of all-cause deaths at ages 83-89, the Alpha variant at ages 81-86, the Delta variant at ages 33-48, and the Omicron variant for ages above 67 years reaching a maximum at age around 100 [25].
The key point is that the molecular mechanisms for such age specificity are completely unknown. It has been proposed that small noncoding RNAs (miRNAs) may be involved, which are produced in response to nuances in the binding of the mutated spike protein to the ACE-2 receptor and ensuing entry into the cell [25]. Wider roles for miRNAs in both infection and vaccination are discussed later.
Given the unknown mechanisms behind the age specificity that vaccination (based upon the original Wuhan spike protein) may have been better (in hindsight) restricted to those ages showing the greatest number of COVID-19 deaths, and hence the greatest possible benefit [25]. The possibility existed that vaccination could behave in unexpected ways depending on age and variant, as has been demonstrated in this study.
4.1.3. Gene expression varies with season and latitude
Many health conditions, from psychiatric disorders to cardiovascular disease, show seasonal variation in severity and onset [48]. In one study 74 transcripts associated with a 12-month seasonal cycle were enriched for processes involved in DNA repair and binding. Another 94 showed significant seasonal variability that was associated with blood cell count levels. These transcripts were enriched for immune function, protein production, and specific cellular markers for lymphocytes. Cell counts for erythrocytes, platelets, neutrophils, monocytes, and CD19 cells demonstrated a significant 12-month seasonal cycle. Notable changes in leukocyte counts and genes involved in immune function indicate that immune cell physiology varies in a seasonal manner [48].
Another study showed that nearly a quarter of genes differ with season [49]. In Europe the immune system has a pro-inflammatory transcriptomic profile during winter, with increased levels of soluble IL-6 receptor and C-reactive protein which are risk biomarkers for cardiovascular, psychiatric, and autoimmune diseases that have peak incidences in winter [49]. This seasonality affects immune cells, the composition of blood and adipose tissue. The pattern of seasonal activity was not as strong in Iceland, while in Gambia peak expression occurred in the rainy season. The ARNTL gene which is most active in summer suppresses inflammation. In winter, those at greatest risk will reach the ‘threshold’ at which the disease becomes a problem more rapidly. A set of genes associated with the response to vaccination were more active in winter [49]. This may affect the response to COVID-19 vaccination depending on latitude and is highly relevant to the month-of-year patterns potentially involved in this study. Note from Figure A1.a. and Figure A1.2 that COVID-19 mortality shows a reasonably strong seasonal pattern.
As to be expected, small noncoding RNAs (miRNAs) are involved in the expression of seasonal diseases [50] – discussed next.
It is highly likely that seasonal patterns lie within the trends in this study, however, the timing for the arrival of new variants and the timescale of vaccination imposed by the need to vaccinate the whole nation has probably disrupted these patterns and additionally contributed to a portion of the observed variation.
Once again, the latitude dependance of gene expression implies that the results from England will show subtle differences to those derived from other countries.
4.1.4. The central role of small non-coding RNAs in gene expression
Some 80 % of the human genome is transcribed to RNA but only 2% of these are translated into proteins [51]. The other transcripts are defined as noncoding RNAs (ncRNAs), including long noncoding RNAs (lncRNAs) and small noncoding RNAs (smRNAs). Small non-coding RNAs (microRNA, small nuclear RNA, small nucleolar RNA, tRNA derived small RNA and Piwi-interacting RNA) can be considered a relatively new class of molecule that are differentially regulated in many diseases [51]. The terms ‘micro’ and ‘small’ are seemingly used interchangeably in the literature.
It is estimated that there are around 2300 unique human miRNAs [652]. Each miRNA affects one or more genes, and a gene can be modulated by more than one miRNA [53,54], and miRNAs are estimated to regulate over 30% of mammalian genes [55].
ncRNAs are expressed in different tissues and cell types that can interact with target mRNAs, through base-pairing, to modulate gene translation [56,57]. miRNAs are powerful regulators of cellular activities including cell growth, development, proliferation and death, apoptosis, fat metabolism, mitochondrial function, neuronal patterning, hematopoietic differentiation, immune function, and epigenetic modification [50,51,52,53,54,55,56,57,58,59,60,61].
All human diseases, including those associated with higher risk of COVID-19 disease, have an associated dysregulated miRNA profile [50,51,52,53,54,62,63,64,65,66], and all human pathogens have their own miRNA profiles coded into their genetic material [67,68,69,70,71]. Part of these pathogen encoded miRNAs are directed at interferon production and regulation, and hence pathogen interference [25,72,73,74,75,76,77,78,79,80]. Hence profound changes in the proportions of pathogens and the frequency of mixed infections since the arrival of COVID-19 [81,82,83,84,85,86,87,88,89].
The outcomes of COVID-19 disease are associated with certain miRNA profiles [90]. Most importantly, all vaccines so far studied, lead to altered miRNA profiles, see 4.1.4, which has also been documented following COVID-19 vaccination [91]; covered in 4.1.6.
While the ability of vaccines to stimulate a large antibody response is a key part of the specific effects of vaccines, their ability to stimulate the production of ncRNAs, is a poorly investigated area and is probably central to understanding the diversity of vaccine outcomes observed in this study.
4.1.5. COVID–19 infection alters the miRNA landscape and ensuing gene expression.
In the absence of vaccines, infection by pathogens modify infection by other pathogens via pathogen interference, which has its basis in miRNA production and subsequent modification of gene expression including interferon production [4]. This is especially important in the clinical outcome of all respiratory infections [67,69,98].
There are now numerous studies regarding the effects of COVID-19 infection upon miRNA production, both by cells in response to the infection, and by SARS-CoV-2 to promote its own successful infection [99,100,101,102,103,104,105,106,107,108,109,110]. These studies include the effects on gene expression, altered biochemical pathways, interferon signaling, interaction with host mRNAs, and have demonstrated that various miRNAs appear associated with clinical severity including inflammatory and cytokine storm mechanisms [93,94,95,96,97,98,99,100,101,102,103,104,105,106,107,108,109,110]. One study has identified both chemokine (CC) CCL20, inflammatory cytokines IL6 and IL10, and miR-451a as key correlates of fatal COVID-19 [110], i.e., miRNAs are part of a wider whole system response.
Zhang et al [75] propose that that COVID-19 cleverly exploits the interplay between the miRNAs and other biomolecules to avoid being effectively recognized and attacked from host immune protection as well to deactivate functional genes that are crucial for immune function.
Dare we suggest that COVID-19 vaccination has unduly focused on antibody production which has ignored a vast regulatory machinery of potentially equal or greater importance. The role of miRNAs in the ‘real world’ success of vaccination has been largely ignored and is discussed later.
4.1.6. Interplay between interferons and miRNAs
It is of interest to note that severe COVID-19 disease patients mount a dysregulated interferon response compared to those with mild disease [80] and that the Omicron variant is less effective than Delta in antagonizing the interferon response in human cells [76]. Treatment with interferon-α, interferon-β, and interferon-γ revealed that the weaker interferon antagonism by Omicron translates into an increased Omicron sensitivity to interferon treatment [87]. These factors seemingly explain the reemergence of influenza due to altered pathogen interference upon the arrival of Omicron [111].
4.1.7. Nonspecific effects of vaccines
Given the implications of this study to the nonspecific effects of vaccines via ncRNAs and other heterologous mechanisms it is of interest to note the reported beneficial effects of prior BCG vaccination against COVID–19 infection [2,7,8,112,113]. Both influenzas, diphtheria, and tetanus vaccines have likewise been suggested to reduce serious COVID-19 outcomes [114]. Our unpublished research suggests that the nonspecific beneficial effects of influenza vaccine disappeared with the arrival of the Omicron variant. It is probably fair to say that many vaccinologists are unaware that vaccines alter the miRNA landscape with resulting nonspecific consequences.
In their recent review Diener et al [115] note regarding miRNAs that “their cellular effects are so numerous that off-target effects can hardly be avoided”.
Zhang et al [116] likewise point out that “One miRNA generally targets tens and even hundreds of genes. We named it “too many targets for miRNA effect” (TMTME). Further, two adverse events from the discontinuation of two miRNA therapeutics were exactly answered by TMTME. In summary, TMTME is inevitable because of the special complementary approach between miRNA and its target. It means that miRNA therapeutics would trigger a series of unknown and unpreventable consequences, which makes it a considerable alternative for application.”
While the ability of vaccines to stimulate a large antibody response is a key part of the specific effects of vaccines, their ability to stimulate the production of miRNAs, is also recognized but not widely appreciated.
Sufficient studies on the miRNA profiles generated in response to human vaccines have been published to support the notion that the profiles are specific to the vaccine type and its efficacy in individuals [117,118,119,120,121,122,123,124,125]. Circulating extracellular vesicles (EVs) deliver miRNAs to myeloid and lymphoid cells [122]. miR-21 levels in serum EVs also increase with aging and regulates the expression of IL-12 required for Th1 responses; therefore, EV miR-21 is expected to regulate vaccine efficacy [122]. miR-451a, another important miRNA [125], is abundant in serum EVs and controls the expression of cytokines, such as type I interferon and IL-6 [124].
In COVID-19 vaccination EV miR-92a-2-5p levels in sera were negatively correlated with degrees of adverse reactions, and EV miR-148a levels were associated with specific antibody titers [124].
A study of influenza vaccination in children up to 12 years of age revealed that 19 miRNAs were expressed at 21 days after receiving a pandemic (H1N1) vaccine. However, several miRNAs were expressed which were not present in existing RNA sequencing data [121]. As an example of nonspecific effects, in children and adolescents vaccinated with Pandemrix vaccine (a H1N1 influenza pandemic vaccine) the number of narcolepsy cases increased [118].
Our conclusion is that the COVID-19 vaccines based on the original Wuhan strain was reinforcing both immune and regulatory miRNA responses which were becoming increasingly unhelpful as COVID-19 variants emerged.
A recurring emphasis in the above studies are that the vaccine response is specific to the individual. Such an individual basis for COVID-19 risk will now be discussed.
4.1.8. A genetic basis for COVID–19 risk
Genomic distribution analysis reveals the highest density of miRNA sequences on the X chromosome [126]. This links directly to the lower risk of female death from COVID–19 infection [127] and to any miRNAs associated with chromosome 3 identified as a genetic risk factor. Likewise certain ACE2 gene polymorphs are associated with serious COVID-19 outcomes in men [128] and forms part of wider ACE2 genetic risk factors [129,130,131].
There is evidence that the risk of COVID–19 morbidity and mortality has a strong genetic basis centered around chromosome 3 mutations inherited from Neanderthals, hence, higher risk among various people groups, and certain blood groups [132,133,134,135,136,137,138,139]. Nakanishi et al [133] showed that chromosome 3 rs10490770 risk allele carriers had a 40% increased risk of all-cause mortality, 110% increased risk of severe respiratory failure, +70% venous thromboembolism, and +50% hepatic injury. Risk allele carriers aged under 60 years had higher odds of death or severe respiratory failure +170%, compared with +50% in those aged 60+. Among individuals younger than 60 years who died or experienced severe respiratory failure, 32% were risk-variant carriers [133]. The risk-associated DNA segment modulates the expression of several chemokine receptors, among them CCR5, a coreceptor for HIV which is down-regulated in carriers of the risk haplotype who also have a 27% lower risk of HIV infection [134,135]. Age dependence is relevant to this study. Lastly, it is important to emphasize that miRNAs are themselves subject to mutations with impact on inherited diseases [140].
The genetic factors imply that repeating the English vaccination study in another country may yield different outcomes depending on the constituent people groups. Given the exclusion of persons arriving in England after 2011 in the ONS data [40] this would imply immigration from the European Union (EU) countries, especially the Eastern European new EU members, is excluded. This affects mainly the younger age groups, although the magnitude of the people group effect is unknown.
4.1.9. Different responses between males and females
This study has established that males and females show different all-cause mortality outcomes both in the unvaccinated and the vaccinated, and that these responses are different between SARS-CoV-2 variants. This observation is unsurprising since sex is a biological variable that affects the functions of the innate and adaptive immune system. In their comprehensive review Klein & Flanagan [141] have demonstrated how the differing immune system responses change with age and are influenced by the reproductive status of the individual. Both sex chromosome genes and sex hormones differentially regulate immune responses. Environmental factors, including nutrition status and the composition of the microbiome, also alter the development and functioning of the immune system differently in males and females. Sex differences in immune responses result in differential susceptibility of males and females to infectious diseases, as well as affecting the outcome of vaccination [44,142].
A study regarding COVID-19 infection showed that male patients had higher levels of innate immune cytokines such as IL-8 and IL-18 along with a stronger induction of non-classical monocytes. Female patients had stronger T cell activation. A poor T cell response negatively correlated with patients' age and was associated with worse disease outcome in male patients. In females, higher levels of innate immune cytokines were associated with worse disease progression [143].
Another study showed that showed that the concentration of IgG antibody in mild, and recovering patients showed no difference between males and females. However, in severe status, there were more female patients having a relatively high concentration of serum SARS-CoV-2 IgG antibody. The generation of IgG antibody in female patients was stronger than male patients in the early disease phase [144].
A Hungarian study showed that the ratio of male to female deaths changed between the Alpha and Delta waves. They observed statistically higher excess female deaths aged 55-64 during the Delta outbreak [145]. Inspection of their data indicates that the ratio of male to female deaths probably changed by age band in both the Alpha and Delta outbreaks which is consistent with our findings. Vaccination rates in Hungary during Delta were lower than in England indicating that the effect is probably dominated by the year of age profile of the variant [25] with possible additional vaccine interactions. Lastly, gender is associated with different miRNA profiles [146,147].
Our previous study on the year of age profiles for COVID-19 variants likewise highlighted the role of gender in the specific outcomes at different ages and for different birth cohorts [25].
4.1.10. Age and COVID–19 vaccination outcomes
Our previous studies regarding influenza vaccination highlighted issues surrounding the age at which ‘healthy’ individuals should be vaccinated [4,19,20]. This issue is linked to the single-year-of-age profile risk of death for different SARS-CoV-2 variants [25], and the observed single-year-of-age efficacy of influenza vaccines [4]. This whole area is poorly studied since most vaccine trials or vaccine effectiveness (VE) estimates do not have enough participants to detect the full nuances of age [4,19,25].
This study employs a collection of chronologic age-banded data. It is well recognized that chronologic and biological age are very different realities [148]. Hence it could be expected that the vaccination topography for each (chronological) age band may show blurring as in Figure 1, etc.
Another study found that while the average heritability of gene expression is consistent across tissues, the average contribution of age varies substantially. Furthermore, while the genetic regulation of gene expression is similar across tissues, age-associated changes in gene expression are highly tissue-specific in their action [149].
Changes in the mean and variance of gene expression with age have consequences for healthy aging and disease development. Up to 60% of age effects on transcription levels are shared across tissues, and 47% of those on splicing. Using gene expression variance and discordance between genetically identical MZ twin pairs, 137 genes with age-related changes in variance and 42 genes with age-related discordance between co-twins were identified [150], implying the latter are driven by environmental effects. These results show a complicated mix of environmental and genetically driven changes in expression with age. Additive genetic effects explain considerably more of the variance in gene expression than aging, but less that other environmental factors, potentially explaining why reliable expression-derived biomarkers for healthy-aging have proved elusive compared with those derived from methylation [150]. Coupled with the effects of genetic polymorphisms, early-life environmental exposures can give rise to substantial variation among individuals in their immune responses [151]. Gene expression implies the involvement of miRNAs.
The processes of aging are evident in human miRNA production. For example, miRNA-92a declines with age in CD3+CD8+CD62L+ cells and CD8+ T-lymphocytes. This suggests that the age-related attrition of human naïve T cells could be connected to a reduced miRNA-92a in T-lymphocytes and downregulation of the miRNA-92a level might indicate exhaustion of naïve T-cells due to alteration of the immunologic condition with aging, and hence in vaccine response [152].
Bera [153] reports that in Italy for children and adolescents receiving mRNA vaccine the risk of myocarditis and severe adverse events is much higher than the risk of COVID-induced admission to critical care. See Supplementary material S1.
The study of Nakanishi et al [133] noted that in those aged below 60 years the prediction of death or severe respiratory failure improved when including the rs10490770 risk allele (AUC 0·82 vs 0·84, p=0·016) and that the prediction ability of risk allele was similar or better than, most established clinical risk factors.
As noted in the Introduction, healthy children aged 5 ̶ 11 only begin to be vaccinated from February 2022 onward, i.e., during Omicron. Children with high clinical risk are vaccinated across the entire time range. Unfortunately, the detailed ONS data does not go below age 18 ̶ 39. However, Table 6 in the ONS data up to May 2022 [40] gives entire period data using 5-year age bands (male plus female) which can be aggregated at the level of any vaccine dose (first or more) to give enough deaths in the younger age bands. This appears to show adverse all-cause mortality vaccine outcomes for children aged 10-14 and 15-19 – all having received mRNA vaccine. This approach has limitations and wider international studies are recommended to fully disentangle age and vaccine type effects in the younger ages. Supplementary material S1 also contains an analysis of the all-cause mortality trends in children and young adults in England and Wales. Once again, those aged 15-19 appeared to undergo a large shift in all-cause mortality at the time when the mRNA vaccine was administered. A Hungarian study likewise indicated age/sex interactions in all-cause mortality following COVID-19 vaccination [145].
Dinetz [154] notes that as more of the younger population (under 40) are getting vaccinated, based on vaccine safety approvals, the real-world safety reporting data on adverse events have yet had time to catch up. He details three distinct neurological events that occurred after the Pfizer mRNA vaccine, without identifiable alternate etiologies, in patients with an average age of 36 years, all within eight weeks of one another. The cases occurred within hours of the second dose and, in one case, after the third booster dose of the vaccine.
These cases illustrate rising concerns of risks in widely recognized very low-risk age categories as shown in Supplementary material S1. These concerns are especially relevant given studies indicating that some types of COVID-19 vaccines may increase rather than decrease all-cause mortality [155]. In such cases the real-world safety reporting process will be missing a range of highly nuanced causes of death which are indirectly linked to vaccination.
Our study implies that the benefits of COVID-19 vaccination declined with younger ages. Supplementary material S1 presents preliminary analysis which suggests that ages 10-14 and 15-19 may have experienced a higher balance of all-cause mortality disbenefit compared to benefit. In a moving 52-week total chart (as in S1) a fundamental change in the rate of death is indicated by a change in slope, and the magnitude of the effect is revealed some 52 weeks after the fundamental change in slope, i.e., the change in slope represents the point of a sudden increase in population health state. Figure S1 covers both the vaccinated and unvaccinated, however, it is implied that age 15–19 as a group experienced a 30% to 40% increase in all-cause mortality, while age 10–14 experienced around a 40% increase in all-cause mortality. Further study is required to differentiate between the vaccinated and unvaccinated. Supplementary material S1 indicates that wider international studies should be instigated regarding the nonspecific all-cause mortality effects of COVID-19 vaccination in young adults and children. We are not suggesting that COVID-19 vaccination did not prevent COVID-19 mortality per se — although at such young ages COVID-19 mortality was extremely low. We are merely pointing out that all-cause mortality seems to tell a conflicting story with potential roots in nonspecific effects.
4.1.11. Simultaneous benefit/disbenefit
Figure 1showed a continuous gradient against all-cause mortality ranging from benefit through to disbenefit. This suggests that the effects of vaccination in general may be the net effect of benefit and disbenefit.
A recent study suggests that the same may occur for the nonspecific effects of influenza vaccination [4]. Hence at a theoretical 100% vaccination rate in persons aged 65+, influenza vaccination was associated with outcomes ranging from a 6% reduction in all-cause winter mortality in 2003/04, no effect in 2009/10, and to an increase of 7.5% in 2014/15 [4]. There was no apparent correlation between the specific measure of Vaccine Effectiveness (VE) and the nonspecific effect against all-cause mortality.
One of the nonspecific effects of influenza vaccination emerges in children and the elderly by which influenza infection is diminished by influenza vaccination, however, influenza is simply replaced by alternative pathogens [4]. The resulting all-cause mortality effect then depends on which other pathogens are most prevalent in that winter and location [4]. A similar effect may occur after COVID-19 vaccination but has not yet been investigated.
These suggest that the outcomes are a balance between the proportion of individuals who experience benefit against those who experience disbenefit – perhaps due to genetic and other factors. In this respect all the results shown in this, and other studies, are ‘average’ outcomes from population-wide studies – although our study uses far greater subdivision including time to reveal the hidden nonspecific complexity.
4.1.12. COVID-19 prophylactic therapy and mortality
Throughout the pandemic there has been an ongoing process of improvements in COVID-19 management and therapy [156], which has reduced the mortality rate. This has been an ongoing process and applies to both the vaccinated and unvaccinated who require hospital treatment, i.e., it affects both the numerator and denominator, and as such should not greatly affect the study outcomes.
However, miRNAs are recognized to respond to both illegal and medicinal drugs [157,158], are involved in nonspecific therapeutic success [159], and adverse drug reactions [165]. The changing therapeutic approach to COVID-19 management therefore adds another layer into the complexities of miRNA profiles and their outworking especially regarding interactions with SARS-CoV-2 variants.
4.1.13. The 21-day break point to characterize vaccine time-related effects
All vaccines have time related effects including the build-up of antibodies and subsequent vaccine waning. For example, the vaccine effectiveness (VE) for the 2021/22 flu vaccine declined to zero in the interval 120-149 days after vaccination [160]. Antibody levels are said to reach their maximum at around 21 days after vaccination and COVID-19 spike antibody levels start waning after around 6 weeks [161].
The ONS 21-day break point is therefore a pragmatic choice. However, the effects against all-cause mortality up to 21 days are more complex and were shown in greater detail in Figure 3.
The situation regarding higher apparent COVID-10 mortality during the first 21 days has been recognized by others [161,162,163,164], and the US CDC does not count a person as ‘vaccinated’ until 14 days after vaccination [163]. It is claimed that higher infection is due to persons wrongly behaving as if vaccination was fully effective from day one [163,164]. We dispute this simplistic explanation since in Figure 3 the effect increases with age. The propensity to lower adherence to social distancing , etc., increases with lower age, which is the reverse of Figure 3. We propose that nonspecific activation of otherwise asymptomatic COVID-19 infection may be the real cause.
It is unlikely that such effects are due to the absence of antibodies during the first 21 days. In this respect, it is important to understand the totality of changes occurring in the days after vaccination.
A study (Houston, USA) in the response to influenza vaccination (Sanofi 2008/09 trivalent vaccine) among healthy Caucasian males aged 18-40 years showed the following notable patterns [165]
- Maximum gene expression (up/down-regulation) occurred 1 to 3 days after vaccination. This implies rapid production of miRNAs prior to gene regulation.
- Three groups of genes were regulated, namely early and late upregulation, and downregulation.
- Different patterns of genes are expressed in high/medium/low antibody responders. High vaccine responder status correlates with increased early expression of interferon signaling and antigen processing and presentation genes.
- The expression of early activation genes strongly correlated with antibodies at 14 and 28 days after vaccination.
This study was focused entirely on antibody production and somewhat glossed over the fact that the expression patterns of numerous genes were changed which could be a partial explanation of the higher COVID-19 mortality in the first 21 days – under a particular set of conditions.
A study of COVID-19 vaccination using an mRNA vaccine showed peak IgG production at 40 days for doses 1-3, and at 30 days for the fourth dose. Peak response for IgA production was more complex with an early peak at 15-20 days followed by a minimum at 25 days and then another peak around 40 days (slightly earlier for the fourth dose). Rapid waning in production then occurred through to 80 days after vaccination [166].
Another study conducted in the UK using mRNA and a virus vector vaccines showed a peak in IgG levels irrespective of age around 21 days after natural infection, first dose or second dose, followed by antibody waning depending on natural or vaccine acquired immunity [167]
All the above studies focused on antibody production with a possibility of lower protection as antibody levels increase over the first 21 days, but no explanation as to why non-COVID-19 all-cause mortality could be simultaneously reduced. Causes for the increased COVID-19 mortality outside of antibody levels are therefore implicated.
A Norwegian study regarding vaccination during the Alpha variant for persons aged 70+ claimed increasing protection from day 1 onwards [168]. This seemingly contradicts the known biology of antibody production discussed above but concurs with our study where a degree of nonspecific protection does occur for the first 21 days (as a block of time), especially during Alpha and less so during Delta.
A Dutch study (mRNA vaccine) showed no short-term mortality effects for the third dose given to ages 19+ during the first Omicron wave, however, during the fourth dose delivered to age 60+ in the absence of an Omicron wave there was a significant short-term rise in all-cause mortality [169], especially shortly after vaccination. This implicates roles for miRNAs and inflammatory responses to mRNA vaccines (discussed later) under conditions where Omicron infections are low. This Dutch study concurs with our results during Omicron.
It is unknown how the three different vaccines available for the data in Figure 3 affected the ratio. It is also unknown exactly how the numerator and denominator change during the first 21 days. Section 4.2.4. is also highly relevant to the complex issues involved in the first 21 days. We appear to be dealing with a mix of specific and nonspecific vaccine effects.
For all-cause mortality, we suggest that whatever is happening in the first 21 days is not primarily related to human behavior, because it is worse in the older age groups who are more conservative in their behavior and is generally most common with Omicron. This whole issue requires greater investigation since it is clearly multidimensional regarding causes. Given the large amount of monthly data available for this study the question arises as to whether similar behavior occurs after influenza vaccination but has remained hidden. Such behavior may depend on the year of vaccination [4].
We conclude that the timeline from day zero of vaccination requires more detailed study regarding sex/age/vaccine stage/variant issues.
4.1.14. miRNA expression is highly dynamic
Given the highly dynamic nature of all the Figures in this study, any proposed regulatory mechanism must show rapid responses to nuanced changes. miRNAs do meet this criterion. For example, in a mouse model the miRNA transcriptome undergoes state-transition during acute myeloid leukemia initiation and progression, with potential to predict disease trajectory [170]. Generation of expanded and activated NK cells involved changes in the expression of 64 miRNAs with highly significant changes in 7 all involved in both up/down gene regulation [171]. In patients undergoing rectal cancer treatment those who respond to therapy show a progression in miRNA profile to an eventual non-cancer baseline, while those resistant to treatment do not [172].
Hence, we propose that miRNA expression is likely to lie behind the highly dynamic responses to vaccination observed in this study.
4.2. Differences between mRNA and other vaccines
Given the transition away from the AstraZeneca (virus vector) vaccine in the UK, especially among young adults (moved to mRNA), it is of interest to see if this may have influenced the results of this study. Several studies are available which address the issue of COVID–19 vaccine type upon all-cause mortality.
4.2.1. General studies
Benn et al [155] appraised the randomized control trials (RCTs) of mRNA and adenovirus-vector vaccines reporting overall mortality, including COVID–19 deaths, accident deaths, cardiovascular deaths and other non-COVID–19 deaths. For overall mortality, with 74,193 participants and 61 deaths (mRNA:31; placebo:30), the relative risk (RR) for the two mRNA vaccines compared with placebo was 1.03 (95% CI=0.63-1.71). In the adenovirus-vector vaccines there were 122,164 participants and 46 deaths (vaccine:16; controls:30). The RR for adenovirus-vector vaccines versus placebo/control vaccine was 0.37 (0.19-0.70). The adenovirus-vector vaccines were associated with protection against COVID–19 deaths (RR=0.11 (0.02-0.87)) and non-accident, non-COVID–19 deaths (RR=0.38 (0.17-0.88)). They argue for performing RCTs of mRNA and adeno-vectored vaccines head-to-head comparing long-term effects on overall mortality. The study of Ben et al [155] confirms the results of a much larger Hungarian all-cause mortality studies which contained over 6 million participants after exclusion of partly vaccinated individuals [45,173].
Several other studies have implicated COVID-19 vaccination in increased all-cause mortality. These studies have used different methods, countries, age groups, and time periods covering different COVID-19 variants, different vaccine histories, and time following vaccination [174,175,176,177,178,179]. A common theme was the involvement of mRNA vaccines, and poor outcomes in children and young adults. While some of these studies may be flawed, the point is that they cannot all be wrong, and that they broadly confirm that such a possibility exists. Once again, no one is questioning the ability of COVID-19 vaccines to protect against COVID-19 per se. It is the issue of all-cause mortality that is problematic.
In view of the possibility that mRNA vaccines may be associated with adverse all-cause mortality two reviews of potential adverse effects from mRNA vaccination raised a number of issues which could impact long-, medium- and short-term all-cause mortality [180,181]. Other studies have raised concerns around neurological side-effects, reverse transcription, and toxicity of the naked spike protein [182,183,184,185,186,187,188].
Given the emphasis on the regulatory role of miRNAs in this study the possibility has been raised that the mRNA from the vaccine will bind to cellular miRNAs thereby interfering in unexpected ways with cell regulation [189,190]. A comprehensive review of the potential immunological and biochemical effects of mRNA vaccines against innate and other immunity, and miRNA regulation, identified potential disturbances in regulatory control of protein synthesis and cancer surveillance with a possible causal link to neurodegenerative disease, myocarditis, immune thrombocytopenia, Bell's palsy, liver disease, impaired adaptive immunity, impaired DNA damage response and tumorigenesis [181]. While some of these concerns may be proved to be unwarranted, they nevertheless may provide further explanations for some of the adverse nonspecific effects seen in this study.
The next section explores all-cause mortality differences between different types of COVID-19 vaccines.
4.2.2. All-cause mortality differences between vaccines
A Hungarian study with comprehensive risk adjustment showed that the magnitude and post vaccination trajectory of all-cause survival after COVID–19 vaccination during the Alpha wave varied markedly between COVID vaccine manufacturers [45].
Taking survival at 21 days during the epidemic period (April to June 2021), which is the break point in the ONS vaccination data for England [40], all vaccines deliver protection, however all-cause survival is highest for Janssen (viral vector) followed equally by Sputnik and AstraZeneca (both viral vector). Next is Sinopharm (inactivated whole virus) and then lowest protection equally by Moderna and Pfizer (both mRNA) [45]
However, 80-day survival during the epidemic period) was highest for Janssen (viral vector), Sputnik (viral vector) and AstraZeneca (viral vector). Moderna (mRNA) had a worse all-cause mortality outcome than the unvaccinated, while Pfizer (mRNA) was equal to the unvaccinated, while Sinopharm (inactivated whole virus) was slightly better than the unvaccinated [45]. Survival for the Moderna vaccine had dropped below the unvaccinated around day 65, while that for Pfizer had fallen to that for the unvaccinated at day 80. During the non-epidemic period (55-day survival), Moderna was once again worse than the unvaccinated, while Pfizer was very close to the unvaccinated. Sputnik had by far the highest survival, then followed by AstraZeneca and Janssen. Sinopharm was once again intermediate [45].
Hence all viral vector vaccines gave highest long-term all-cause survival while mRNA vaccines gave no better protection or worse than the unvaccinated after waning. Inactivated whole virus was intermediate.
4.2.3. Specific and nonspecific effects of vaccine waning
Waning is a part of the real-world effects of both influenza [174,] and COVID-19 vaccination [161,173,191,192,193,194,195]. The waning of efficacy after COVID–19 vaccination will mostly affect the >21 days after vaccination group in the various Figures in this study, with higher reduction in the all-cause rate relative to the unvaccinated generally, but not always, occurring in this group.
A large population study in Israel demonstrated that rates of reinfection were highest following mRNA (Pfizer) in the two-dose cohort at 6 to 7 months after vaccination (88 infections per 100 000 person days), but only 15 infections per 100 000) for the unvaccinated or one dose/recovered hybrid group after 6 to 7 months, 10 for the recovered/one dose hybrid group [192,193]. At >12 months after infection the recovered/unvaccinated cohort were still only showing 30 infections per 100 000 person days. At up to 1 month the three-dose cohort had higher than 2-times the infection rate of the recovered/one dose cohort [192,193]. Seemingly far better protection is afforded in the hybrid group and vaccine waning is steep for the vaccine-only group which confirms the results reported in Hungary [173].
Another UK population-based study investigating COVID-19 related hospitalization or death (not all-cause mortality ) found that following doses 1 and 2 of the AstraZeneca vector and dose 1 of the Pfizer mRNA the outcomes reached zero protection by approximately days 60–80 and then went negative. By Day 70, VE/rVE was –25% and 10% for doses 1 and 2 of AstraZeneca, respectively, and 42% and 53% for Doses 1 and 2 of Pfizer respectively. rVE for dose 2 of Pfizer remained above zero throughout and reached 46% after 98 days of follow-up [194]. This study broadly confirms potential negative vaccine effectiveness; however, it only covers COVID-19 confirmed hospitalization or death, i.e., not all-cause mortality.
A study in Hungary during the Delta outbreak (Sep-21 to Dec-21) showed that vaccine waning occurred after the primary vaccine dose (delivered before Delta) such that Vaccine Effectiveness (VE) for COVID-19 death at >240 days had fallen to between 80% (Sputnik, Moderna) and 50% (Sinopharm, Astra Zeneca) [145]. Hence the specific effects of COVID-19 vaccines show no evidence of a transition to negative VE.
On the other hand, during the earlier Alpha outbreak in Hungary the profiles regarding all-cause mortality were vastly different. During the Alpha epidemic period (Apr-21 to Jun-21) both Pfizer and Moderna (mRNA vaccines) led to increased all-cause mortality (negative VE) beyond 65 days (Moderna) and 80 days (Pfizer). Vaccination during the non-epidemic period (Jun-21 to Aug-21) showed far greater waning with Moderna offering no protection up to 27 days and increased all-cause mortality beyond 27 days. Pfizer was slightly better up to 60 days post vaccination after which negative VE was likely [173]. None of the other vaccines (Sputnik, Astra Zeneca, Sinopharm, Janssen) showed any evidence for long-term decay into negative VE. Our study appears to confirm these results.
A further interesting observation regarding the specific effects of vaccination in the Hungarian study was that protection against COVID-19 infection showed very high waning after the primary dose going negative at around 180 days for Sinopharm, 220 days for Astra Zeneca, 240 days for Sputnik, and at some point >240 days for Janssen, Moderna and Pfizer. Waning against hospitalization lay between that seen for infection and death [45]. Which leads to the interesting question as to why waning shows different trajectories for COVID-19 infection, hospitalization, and death and for all-cause mortality. Multiple layers of complexity appear to be involved.
4.2.4. Reevaluation of the study of Rinchai et al [196] in relation to the effects of mRNA vaccination
The study of Rinchai et al [196] shows various physiological responses by days after vaccination with mRNA vaccine. For example, the data presented in their Fig. 1B demonstrated up to 4-fold (-2 log2) decrease in blood concentration of IgM and total IgG antibodies specific to all studied antigens of SARS-CoV-2 at day 7 in all COVID-19 naïve persons after their vaccination with the mRNA vaccines, i.e., the negative seroconversion. This can be considered as an increase of susceptibility to Sars-CoV-2 infection of all previously uninfected persons up to day 7 after vaccination. See Figure 2 for a possibly similar phenomenon. The decreased levels of the specific IgM antibodies look to be especially strange because IgM antibodies should first react to an antigenic challenge, but not in this case of mRNA vaccine application.
Notably, they detected an increase in the concentration of erythroid progenitor cells in peripheral blood of persons vaccinated with the mRNA vaccine. Such an event may have negative consequences because of possible fusion of the progenitor cells with adult somatic cells. Such fusion provides somatic cell increased replication potential and increased resistance to apoptosis. Both consequences are good for normal, healthy cells, but potentially can activate oncogenesis, generate tumor-initiating-like cells, and increase resistance of tumor cells to chemotherapy [197].
The biological response to the second dose of the mRNA vaccine summarized in Fig. 9 of Rinchai et al [196] is strikingly resembles data obtained during an investigation of the mechanisms of side effects after transplantation of autologous (syngeneic) embryonic cells into adult mice [198]. Both observe the picture of an inflammatory response in the presence of unusually high concentrations of progenitor cells (in the case of mRNA second dose – erythroid cells) which are genetically identical to the host organism, but significantly differ from adult cells in the expression profile of some potent bioactive substances, including cytokines: LIF, GM-CSF, VEGF, IL-6, TNF and TGF [198,199,200,201,202,203].
Some of these cytokines: IL-6 and TNF-alpha – are well known proinflammatory agents. What is especially noteworthy in Zaporozhan et al [198,203] is that to describe the side effects of the authologous embryonic cell transplantation they introduced the term “Cytokine toxicosis” and mentioned that the complex morphological and immunological alterations resemble that in psoriasis patients: exactly like the consequences of the second dose of the mRNA vaccination when compared to Rinchai et al. [196, pp 9].
Based on the data from Fig.9. of Rinchai et al [196] we suggest the following possible mechanism of the inflammatory response to the second dose mRNA vaccine. The authors show that the second dose of mRNA vaccine initiates rapid enrichment of blood with Erythroid progenitor cells. Such an event bears a hidden threat because in natural physiological conditions such mobilization and release of progenitor cells from their niche in bone marrow to peripheral blood stream is accompanied (prepared) by specific alleviation (restraint) of the person’s immunity by a specific population of T lymphocytes: the Tregs (CD25+ CD4+ cells) [203]. Stem and progenitor cells are bearing on their surface some residual embryonic antigens which in the case of contact with peripheral blood can elicit auto-immune reactions. Besides, progenitor cells produce proinflammatory cytokines. To prevent autoimmune and inflammatory reactions related to migration of the progenitor cells to peripheral blood, an organism (under physiological conditions) restrains its immunity using increasing concentration of the Tregs [203]. We suggest that the second mRNA dose causes rapid release of the erythroid progenitor cells without precautionary release (activation?) of the Tregs.
This possibly causes auto-immune reaction against the mobilized erythroid cells and their destruction with local inflammatory responses at days 1 – 4 after the second mRNA dose — a potential explanation for the behavior seen in Figure 3.
As mentioned above, stem and progenitor cells have peculiar gene expression profiles, which differ from that of adult differentiated cells. Consequently, the progenitor cells produce much higher concentrations of the proinflammatory cytokines in comparison with normal adult cells. Therefore, acute enrichment of peripheral blood with erythroid progenitors in persons receiving the second dose of the mRNA vaccine inadvertently cause significant release of the proinflammatory cytokines in tissues and blood stream. In experiments with transplantation of autologous embryonic cells to adult mice this caused significant inflammatory response with specific alterations in kidney, liver, skin, and some generalized reactions [197,198,199,200,201,202,203]. The proposed mechanism of possible side effects after the second dose of mRNA vaccine explains the more harmful consequences, demonstrated in this study, of the vaccination with mRNA vaccines for young and middle-aged people. The amount of adult stem and progenitor cells (and their activity) in elderly is negligibly small in comparison with young persons, therefore possibility (chances) of their mobilization to peripheral blood with secretion of proinflammatory cytokines is also significantly smaller than in young and middle-aged people.
From a positive point of view, we could expect some rejuvenating effect from the second dose of the mRNA vaccines because activation of the progenitor cells is an analog of “regeneration therapy”. But to achieve this rejuvenation and to decrease the side effects of the mRNA vaccination we should arrange simultaneous with the second vaccine dose downregulation (restrain) of the vaccinee’s immunity possibly by corticosteroids or other immunosuppressants.
Next the gene expression profiling data presented in Rinchai et al [196], witnesses that from an immunological point of view the first dose of the mRNA vaccine cause a sensibilization effect: It looks like the components encoded by the vaccine’s mRNA or some vaccine constituent’s acts (behave) as an allergen. Rinchai e al [196] (possibly incorrectly) use the terminology:
“training of the innate immune response by the first vaccine dose”.
Taken together, conducted analysis explains possible inflammatory responses in persons vaccinated with mRNA vaccines. The acuity of the inflammatory responses usually decreasing with age, therefore unwanted side effects (all-cause mortality) after the mRNA vaccination most evident in persons below age 50.
Finally in Table 1 of Rinchai et al [196] it is shown that the most severe side effects were developed in a youngest (among participants) previously infected with SARS-CoV-2, notably woman. This fact questioned the safety of vaccination of such persons with mRNA vaccines.
It is somewhat unfortunate that basic issues analyzed above, were not investigated prior to the wider release of the mRNA vaccines. Thus, the study of Rinchai et al [196] is very important, but somewhat belated.
4.3. Limitations of the study
One of the potential limitations of this study is the use of the unvaccinated as an unbiased reference group.
There are multiple potential factors from certain medical conditions through to occupational exposure, racial, genetic, frailty functional status factors, and healthy vaccinee bias [204,205,206,207,208,209,210,211,212,213,214,215]. A combined score based on genetic and clinical risk gave enhanced prediction of severe COVID-19 infection [215]. However, in this study the unvaccinated remained a stable group and were not easily dissuaded from their position.
A further factor is the acquisition of natural immunity. An Israeli study on unadjusted data for people over 60 years of age who were not infected (and therefore not protected by natural infection before the 2nd or 3rd dose), the risk is 18-times higher to have a severe COVID-19 after the 3rd dose compared to people protected by natural infection and 118-times higher with only 2 doses, again compared to non-vaccinated people protected by natural infection [192,193].
The UK study of Agrawal et al [212] noted that persons with a previous COVID–19 infection were at reduced risk when infected ≥9 months before booster dose vs no previous infection; aRR 0·41 [95% CI 0·29–0·58].
The unvaccinated, along with the vaccinated, are acquiring protection via natural immunity and therefore become a ‘real-world’ part of the issue of the baseline, which is leading to declining all-cause mortality in the unvaccinated. It is unknown if the unvaccinated acquire natural immunity faster than the vaccinated.
We suspect that numerous individual features can influence final outcomes of vaccination, including previous diseases and vaccination history, individual miRNA and siRNA profiles, HLA phenotype, gene mutations, individual variations in concentration dynamics of thyroid hormones, corticosteroids, etc. Indeed, there are even risk factors for severe outcomes from COVID-19 following a third dose of vaccine, namely, male, aged 80+, underweight, >5 comorbidities, >11 persons per household, living in a high deprivation area, and chronic neurological conditions [216].
Given the ambiguity regarding which risk adjustment method to use we believe that presenting the monthly trend in age-standardized mortality rates allows for ready identification of the key issues without falling into the trap of speculating about the exact value of the individual points.
The outcome is based on the degree to which the unvaccinated group may have a higher/lower proportion of high-risk individuals. If the proportion is higher, then the vaccine benefit will be slightly over-estimated or in the case of lower this will be under-estimated.
It has been claimed that the earlier versions of the ONS data for the unvaccinated contains persons who have been vaccinated due to misclassification errors [41,161]. However, the data is continually updated, and such errors should be minimized in the file ending May 2023. Also note that claims of misclassification could be based on the perception that COVID-19 vaccination should always be beneficial against all-cause mortality. The objections seem based on the incorrect premise that:
- COVID-19 vaccines are supposed to behave in a way which does not involve nonspecific effects.
- That the single-year-of-age behavior of the different SARS-CoV-2 variants is roughly similar [25].
We have demonstrated that neither of these assumptions is valid. However, in most cases of disbenefit the values are so high that disbenefit can be assumed to be real – although there may be arguments regarding the ‘exact’ value.
It is our opinion that the unvaccinated baseline is of sufficient accuracy for the purpose of this study – especially given our emphasis upon the dynamic nature of the time profile.
4.4. Individual versus population risk
Healthy individuals can have an inherent genetic risk of an adverse COVID-19 outcome. This inherent genetic risk is not included in current risk-adjustment models. Dite et al [215] noted that a combined clinical and genetic risk profile gave better results in predicting COVID-19 outcomes. This is especially the case for persons under the age of 40 – as in Figure 1, Figure 2a, Figure 2b, etc. Individuals with other risk factors such as occupational exposure, immune suppressing drugs, obesity, kidney disease, Vitamin D deficiency, frailty etc. [210,211,212,213,214,215], are advised to be vaccinated or else take other protective measures. As mentioned earlier specific diseases are associated with altered miRNA profiles. Alas there will always be an element of the unknown as COVID–19 continues to mutate, and different year of age risk profiles for new variants emerge [25].
We have emphasized the importance of human immune diversity in relation to the mechanisms behind vaccine efficacy, pathogen interference, and the nonspecific effects of vaccination [4]. Regarding the role of age in COVID-19 disease and vaccination Cevigel et al [217] have identified nine immunotypes that displayed different aging-associated immune signatures. These immunotypes explained inter-individual variation better than age. To this individual level immune profiles we can now add individual level miRNA profiles. We point to the need to better understand the behavior in the 90+ age group observed in this study, especially the markedly increased mortality relative to other ages during Omicron [25].
Investigation of miRNA, siRNA and lncRNA profiles is a promising area for better understanding and prognostication of the individual risks of infection and outcomes of vaccination.
5. Study summary
This study is not in any way suggesting that COVID-19 vaccination does not provide a measure of protection against COVID-19 disease per se. The interaction between individual health status (age, immunotypes, etc.), COVID–19 infection, SARS-CoV-2 variant, vaccination, and the environment represent a case of exquisite complexity.
It must be emphasized that from around the middle of 2021 the pool of unvaccinated persons stayed relatively constant and the higher proportion of adverse outcomes during Omicron are therefore not due to changes in the unvaccinated baseline.
The second point to emphasize is that the unique age profiles for each COVID-19 variant are not being recognized in most studies. This creates huge problems for age standardization of mortality rates between variants. Our study attempts to avoid this problem by reporting all results by age band.
The necessary urgency to develop and implement vaccines has inadvertently interacted with this complexity in sometimes adverse ways. To deny that such complexity exists is unhelpful and hinders efforts to implement safe vaccination development and implementation. The move to discontinue the use of viral vector vaccines in favor of mRNA vaccines due to increased risk of thromboembolic events is an example of a potentially incorrect decision since the available evidence supports the notion that the original viral vector vaccines had overall lower all-cause mortality. This requires further investigation.
This study confirms that COVID vaccination of the elderly was generally a success – within the limits of certain optimum gender/time/age combinations – and less so during the Omicron period (as in Figure 1). For unknown reasons the age 90+ group appears to be an exception.
However, all-cause mortality outcomes for mRNA vaccines during the Omicron variant (the UK had switched to virtually exclusive mRNA vaccination prior to Omicron) were especially poor with most age/gender/vaccine stage/time combinations showing higher all-cause mortality in the vaccinated compared to the unvaccinated.
Generally worse all-cause mortality outcomes after COVID-19 vaccination among persons aged below 40 years are a common theme among this and other studies and this line of investigation should be pursued.
6. Conclusions
This study does not contradict the numerous studies regarding the specific effects of the vaccines against COVID-19 mortality. It merely adds to the growing body of evidence for the nonspecific benefit/disbenefit effects of vaccines [1,2,3,4,5,6,7,8,9,10,218].
While the increasing antigenic distance between the Wuhan-based vaccines looks to be the primary driver of declining performance against all-cause mortality which includes COVID-19 (in Figure 1), it is also evident that other nonspecific mechanisms are involved.
However, our overall conclusion is that the COVID-19 vaccines employed in England during 2021 and 2022 led to unintended selective NCACM harm under specific combinations of age, sex, vaccine history, COVID-19 variant, and time (season, outbreak versus non-outbreak months, etc.). The question is which of the three vaccines employed during 2021 and the those employed in 2022 led to the most unintended NCACM and all-cause mortality harm and under which circumstances.
We again note that the single year of age profiles for mortality in different SARS-CoV-2 variants [25] presents considerable problems to the issue of age standardization.
Human vaccines must be open to scientific scrutiny, and it is only in such an open framework that vaccines can be continuously improved. It is our observation that researchers questioning aspects of COVID-19 vaccination are not ‘anti-vaxxers’ but are seeking genuine answers to seeming ‘anomalies’ in the data. Indeed, such anomalies can be hidden by the application of certain types of analysis, especially after age-standardization across all age groups.
There is no such thing as ‘perfect’ protection, only a balance between the risks and rewards, which this study demonstrates are far more complex than has been appreciated. We highlight that a ‘good’ vaccine should not disadvantage those (via increased all-cause mortality ) who choose to halt their vaccine journey. The high rate of waning in mRNA vaccines leading to eventual higher mortality in the vaccinated compared to the unvaccinated remains a concern. A very recent study has confirmed that age-based selection occurs between persons receiving the second and third dose of the mRNA vaccine [205].
It would also appear that the process for reporting/detecting adverse events following vaccination is not achieving its intended purpose since subtle changes in all-cause mortality are going undetected in both influenza [4,5,6] and COVID-19 vaccination. The latter has been elegantly illustrated by the analysis of Seneff et al [180] and inferred by Pantazatos and Seligmann [175,176].
We also recommend that long term surveillance and re-analysis of all-cause disease outcomes following COVID–19 vaccination is actively pursued. Vaccination of the young must be reconsidered based on the comprehensive evaluation of the all-cause mortality vaccination outcomes for the different types and brands of vaccines. In this respect we strongly recommend an international investigation regarding the deaths of any person aged below 40 (adult, teenager, child) who had received COVID-19 vaccination. This should include days since vaccination, potential risk factors, COVID-19 variant(s), and cause(s) of death. We remain unconvinced regarding the clinical justification for the vaccination of any ‘healthy’ person in this age group.
It is also strongly recommended that international studies are conducted to determine the exact contribution of the different types of COVID-19 vaccines against all-cause mortality.
Reporting of outcomes by month as used in the ONS study is the recommended approach as it allows both seasonal, and epidemic and non-epidemic effects to be disentangled along with the effects of different variants. Studies which report outcomes using time (days) after vaccination as a continuous variable are also recommended. We suggest that influenza vaccines be subject to the same all-cause mortality scrutiny [4].
Indeed, it is entirely possible that the optimum vaccine choice, assuming that the antigenic distance is not too great, is both gender, age, and context specific (timing, latitude, mix of circulating pathogens, ethnicity, and personal risk factors).
We strongly suggest that the evaluation of all-cause and NCACM mortality become a standard for all vaccine trials and that the measurement of noncoding RNA profiles may be of profound benefit.
Supplementary Materials
The following supporting information can be downloaded at the website of this paper posted on Preprints.org, Supplementary materials S1: Moving 52-week total deaths (relative to March 2020) for age bands 10–14 and 15–19 years, combined male and female, in England and Wales. Also showing vaccination commencement dates with mRNA vaccines.
Author Contributions
Conceptualization, R.P.J. and Y.Y.; methodology, R.P.J.; validation, R.P.J.; formal analysis, R.P.J.; investigation, R.P.J.; resources, R.P.J.; data curation, R.P.J.; writing—original draft preparation, R.P.J and A.P. (two sections).; writing—review and editing, R.P.J. and A.P.; visualization, R.P.J.; supervision, R.P.J.; project administration, R.P.J. All authors have read and agreed to the published version of the manuscript.
Funding
This research received no external funding.
Institutional Review Board Statement
Not applicable.
Informed Consent Statement
Not applicable.
Data Availability Statement
All data are publicly available, and sources are listed in the Materials and Methods section.
Acknowledgments
Thanks are expressed to Stephen Andrews for sending details of several relevant papers.
Conflicts of Interest
The authors declare no conflict of interest.
Appendix A
Figure A1.
a. Trend in a moving 4-week total of non-COVID-19 all-cause mortality and COVID-19 mortality in England and a large influenza outbreak during the winter of 2022/23 (Deaths registered weekly in England and Wales, provisional - Office for National Statistics (ons.gov.uk); Surveillance of influenza and other seasonal respiratory viruses in the UK, winter 2022 to 2023 - GOV.UK (www.gov.uk)). A1.b. Proportion of total deaths ‘due to’ COVID-19 split by age band (Single year of age and average age of death of people whose death was due to or involved coronavirus (COVID-19) - Office for National Statistics (ons.gov.uk)). Note that deaths in infants are absent before the arrival of the Delta variant. The disposition of the lines for each age band reflects the known specific age profiles for each variant [25], i.e., age 40–49 shows highest proportion of total mortality during Delta, etc.
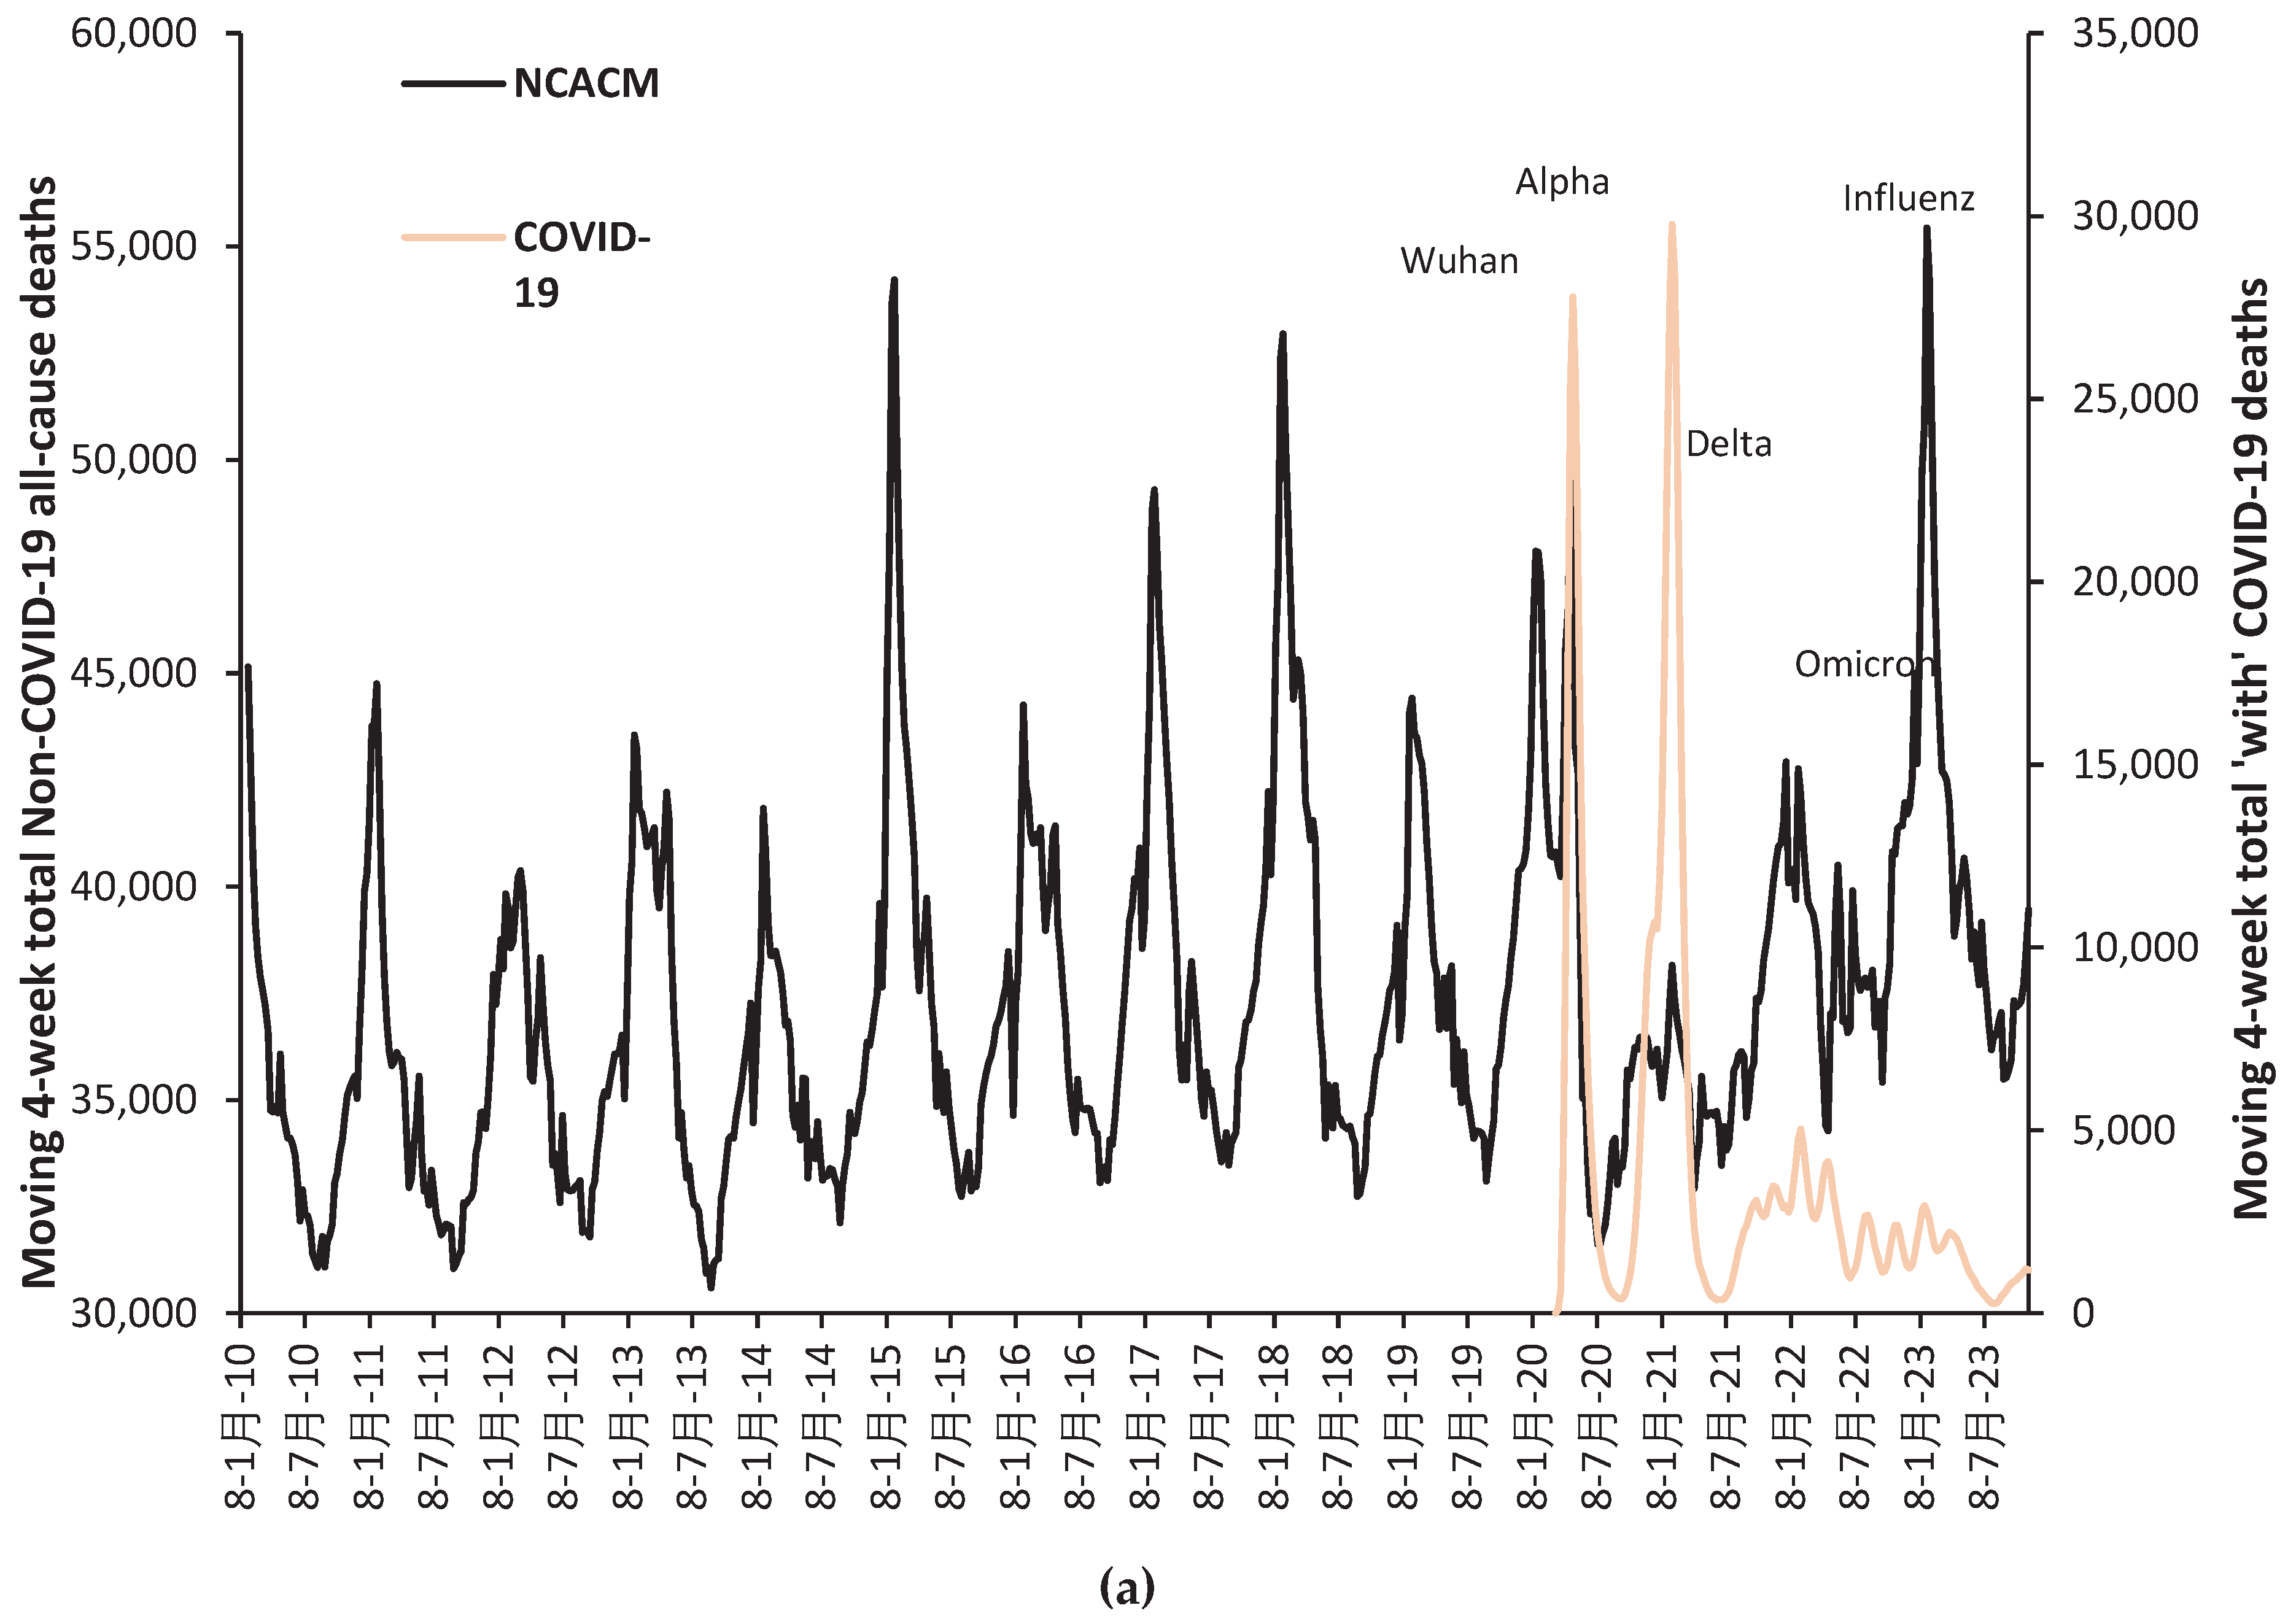
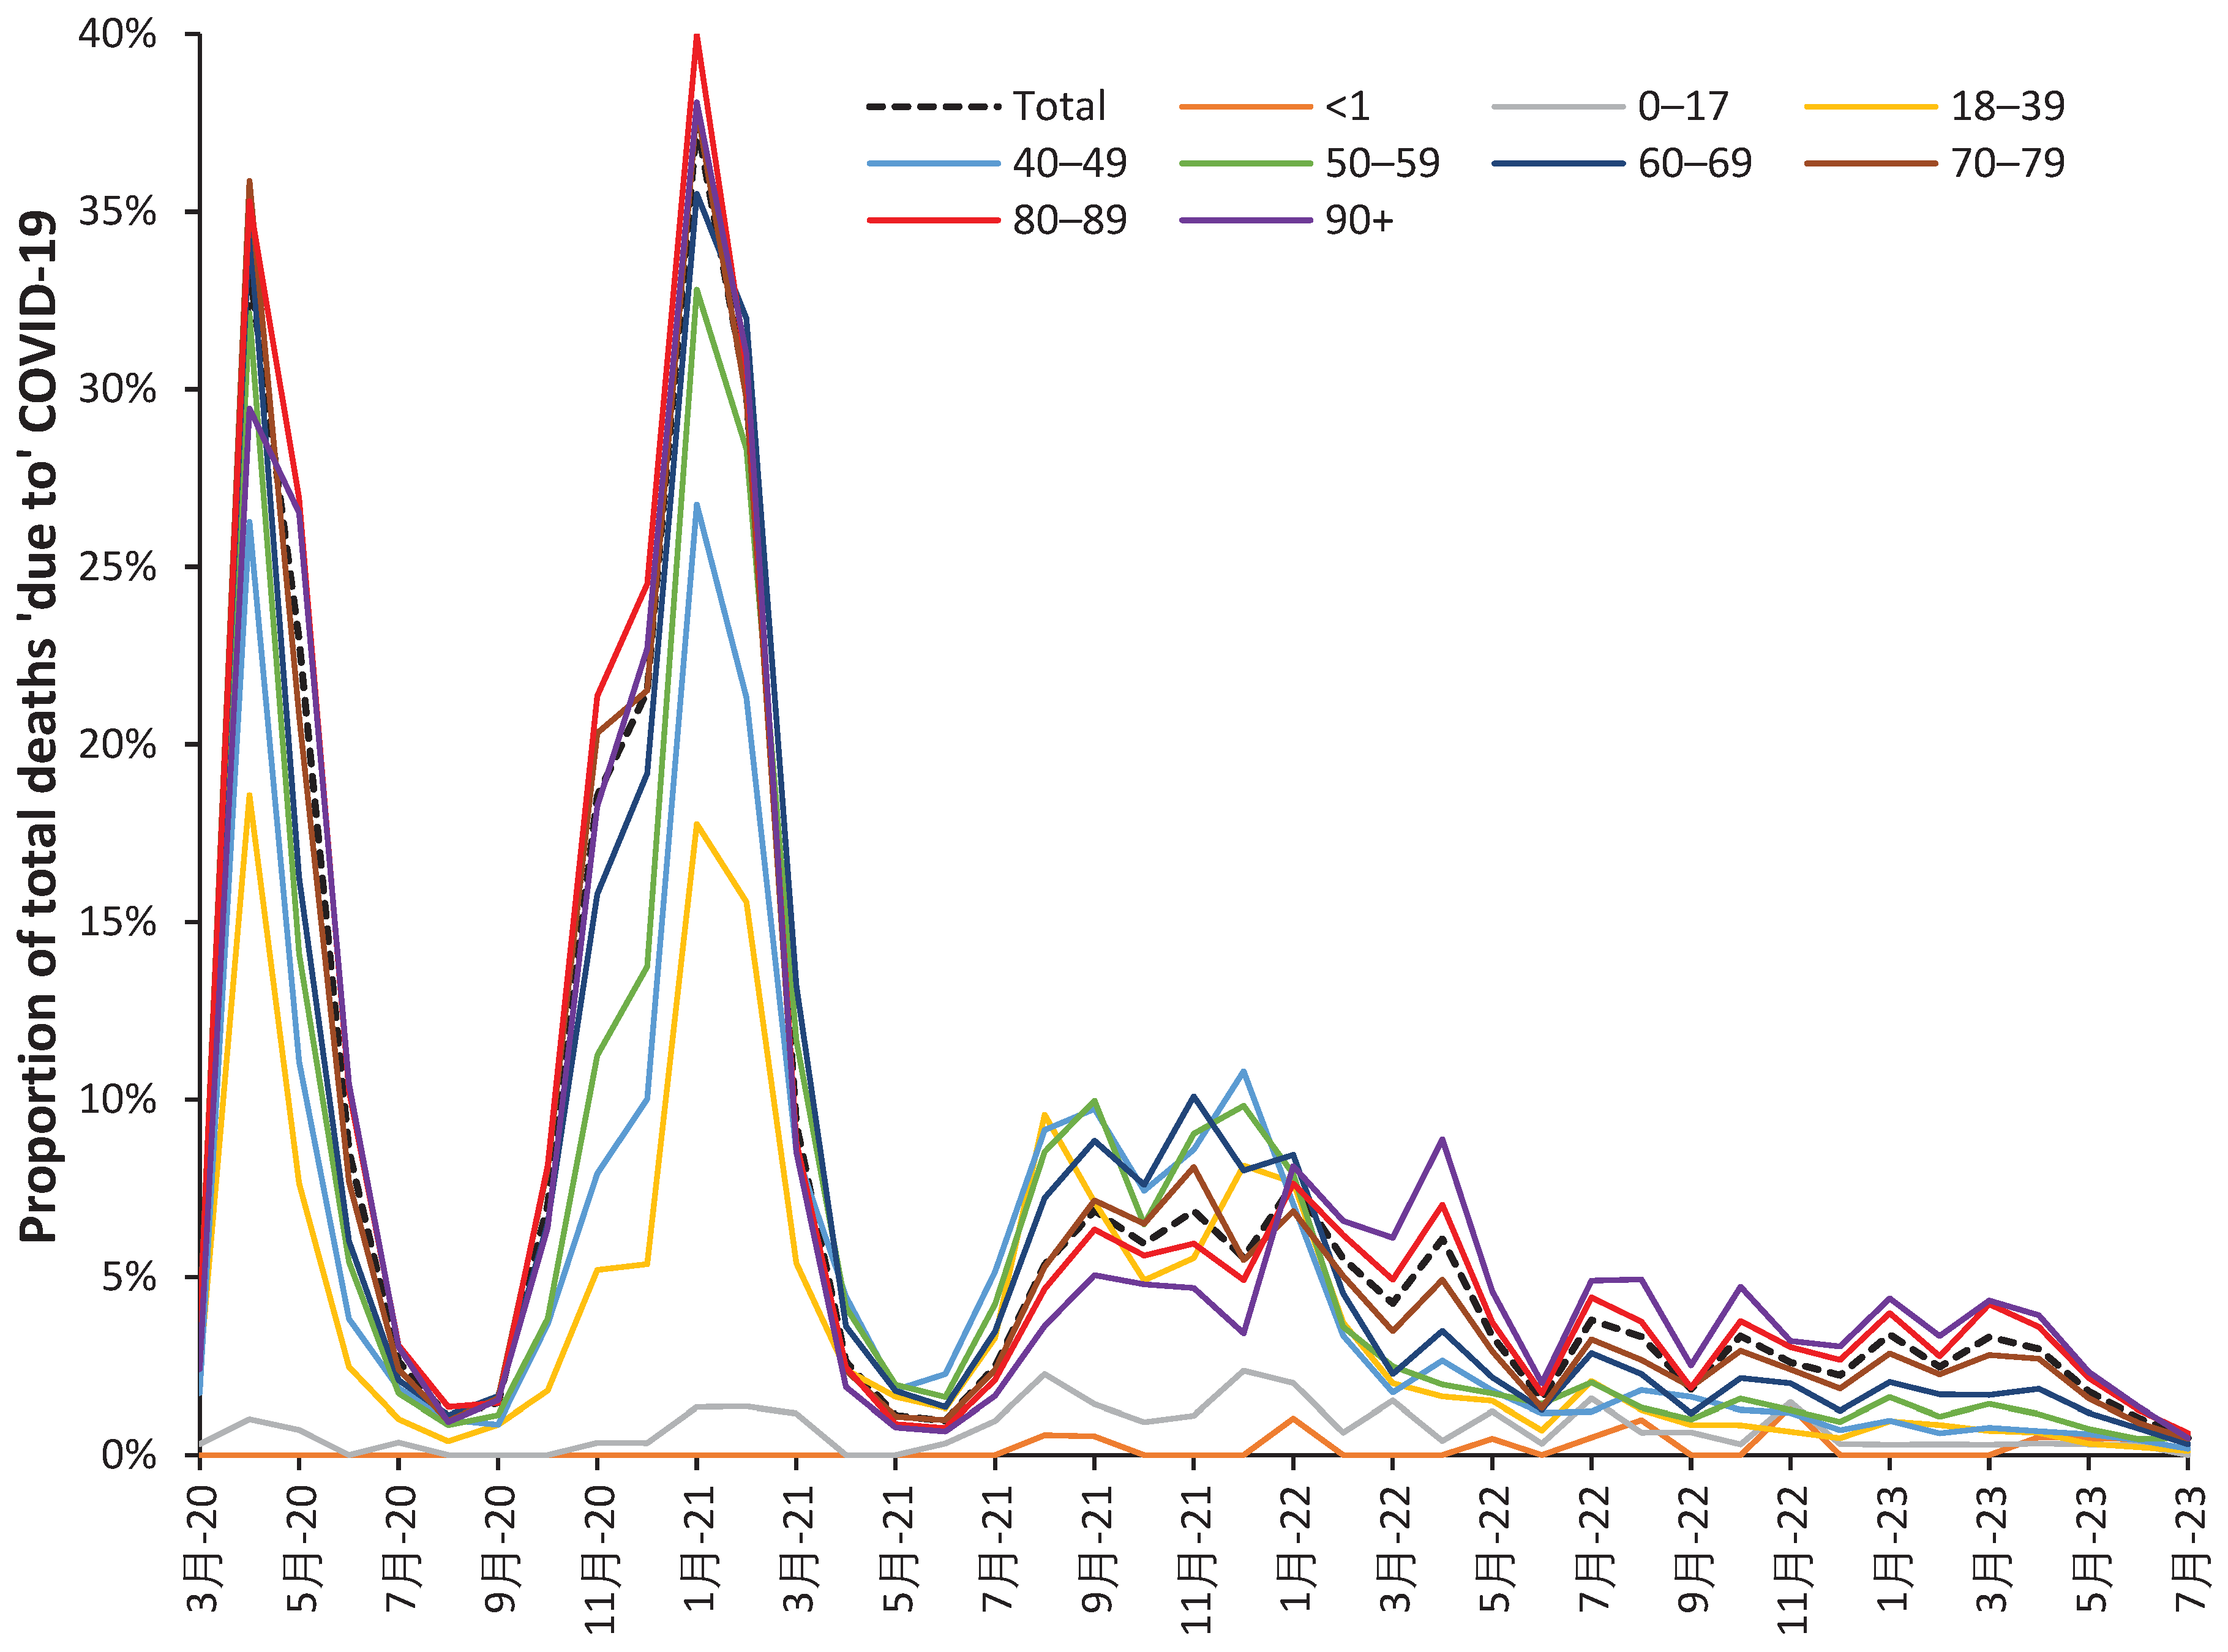
Footnote: The minimum for COVID-19 deaths in the summer of 2020, 2021 and 2023. Omicron deaths appear to drop to a lower level from the summer of 2022 onward, perhaps, associated with the arrival of certain Omicron sub-variants. Note that the mortality rate will increase during large outbreaks of the various SARS-CoV-2 variants, each of which has a particular year of age profile for deaths [25]. For example, deaths from the Alpha variant concludes around May-21 while Delta commences around June-21. Because this variant unduly affects younger people the shape of the profiles is shifted in the two youngest age groups. Note that Delta appears to affect younger males more so than females. Recall that deaths always lag infections and that the time to death after infection is likely to be age dependent.
Figure A2.a to Figure A2.f follow next, which show the relative rate of age-standardized all-cause mortality in the vaccinated versus the unvaccinated for those vaccinated during the Alpha, Delta, and Omicron variant periods. Age 40–49 (a), 50–59 (b), through to 90+ (f). Charts are sometimes truncated. A limited number of higher values lie above this truncation limit. As before, a negative relative value signifies protection via the vaccine while a positive value signifies disbenefit.
Figure A2.
a to A2.f. Relative rate of age-standardized all-cause mortality in the vaccinated versus the unvaccinated for those vaccinated during Alpha, Delta, and Omicron variants. The Y-axis has been occasionally truncated.
Figure A2.
a to A2.f. Relative rate of age-standardized all-cause mortality in the vaccinated versus the unvaccinated for those vaccinated during Alpha, Delta, and Omicron variants. The Y-axis has been occasionally truncated.
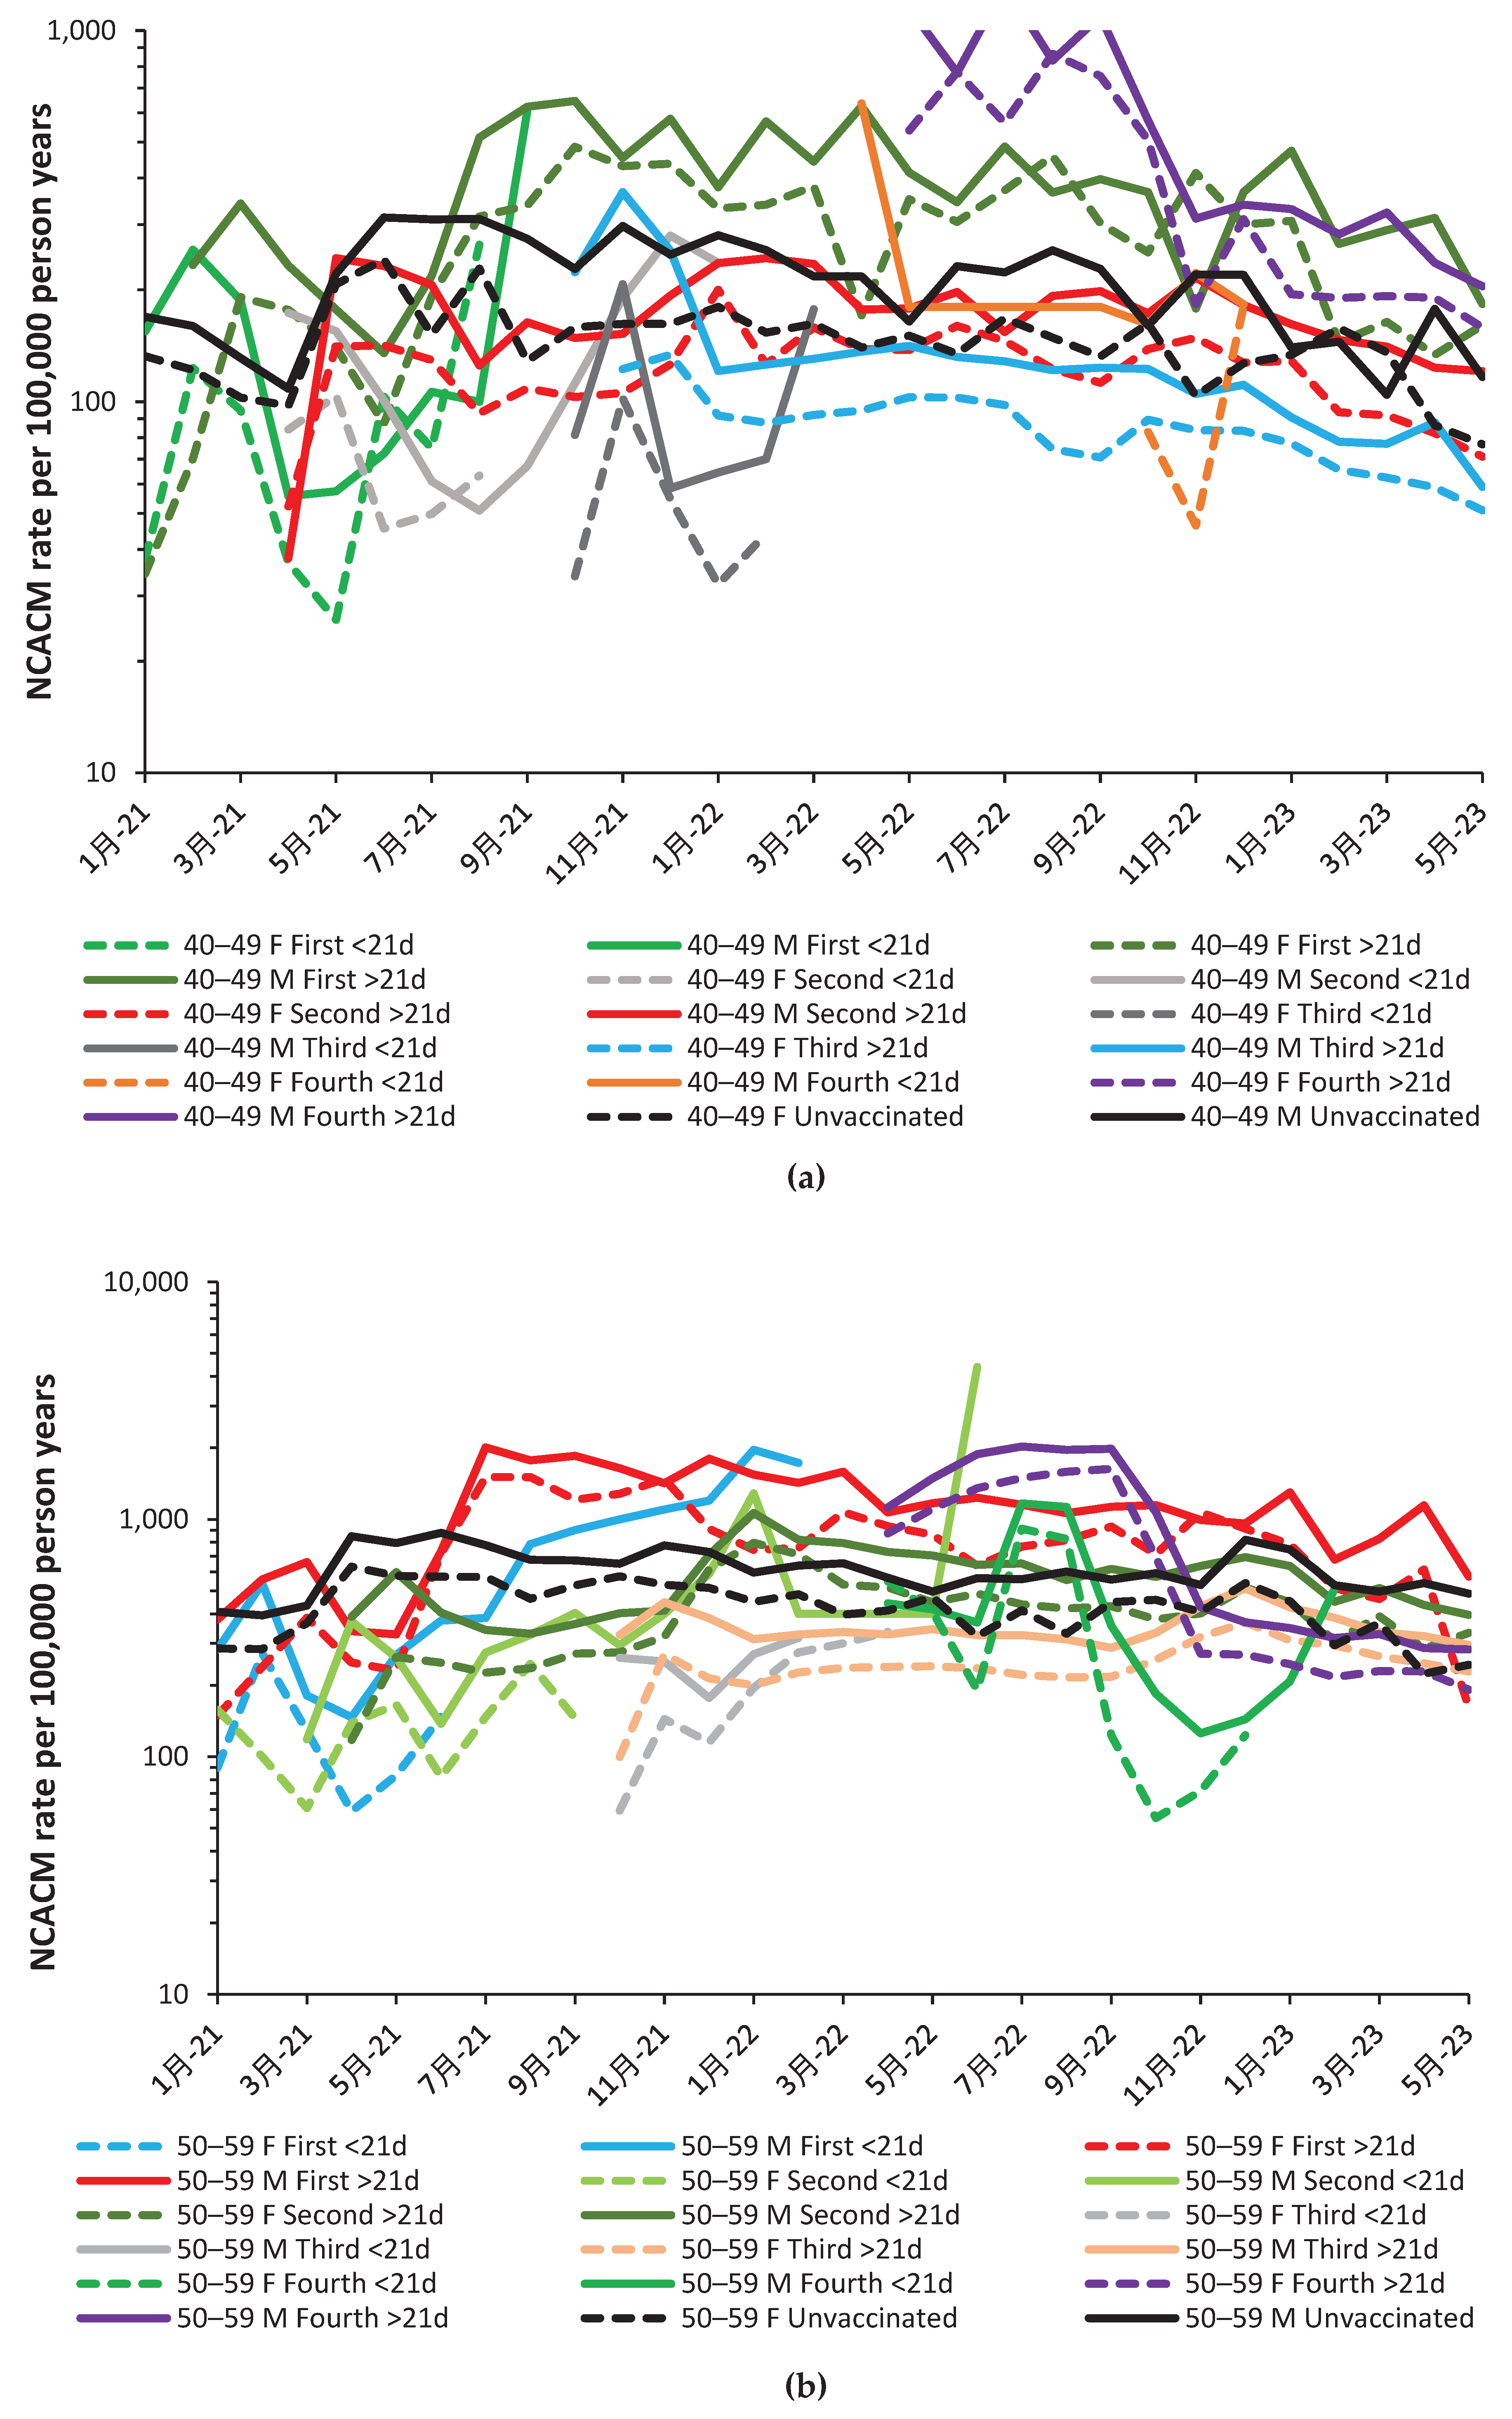
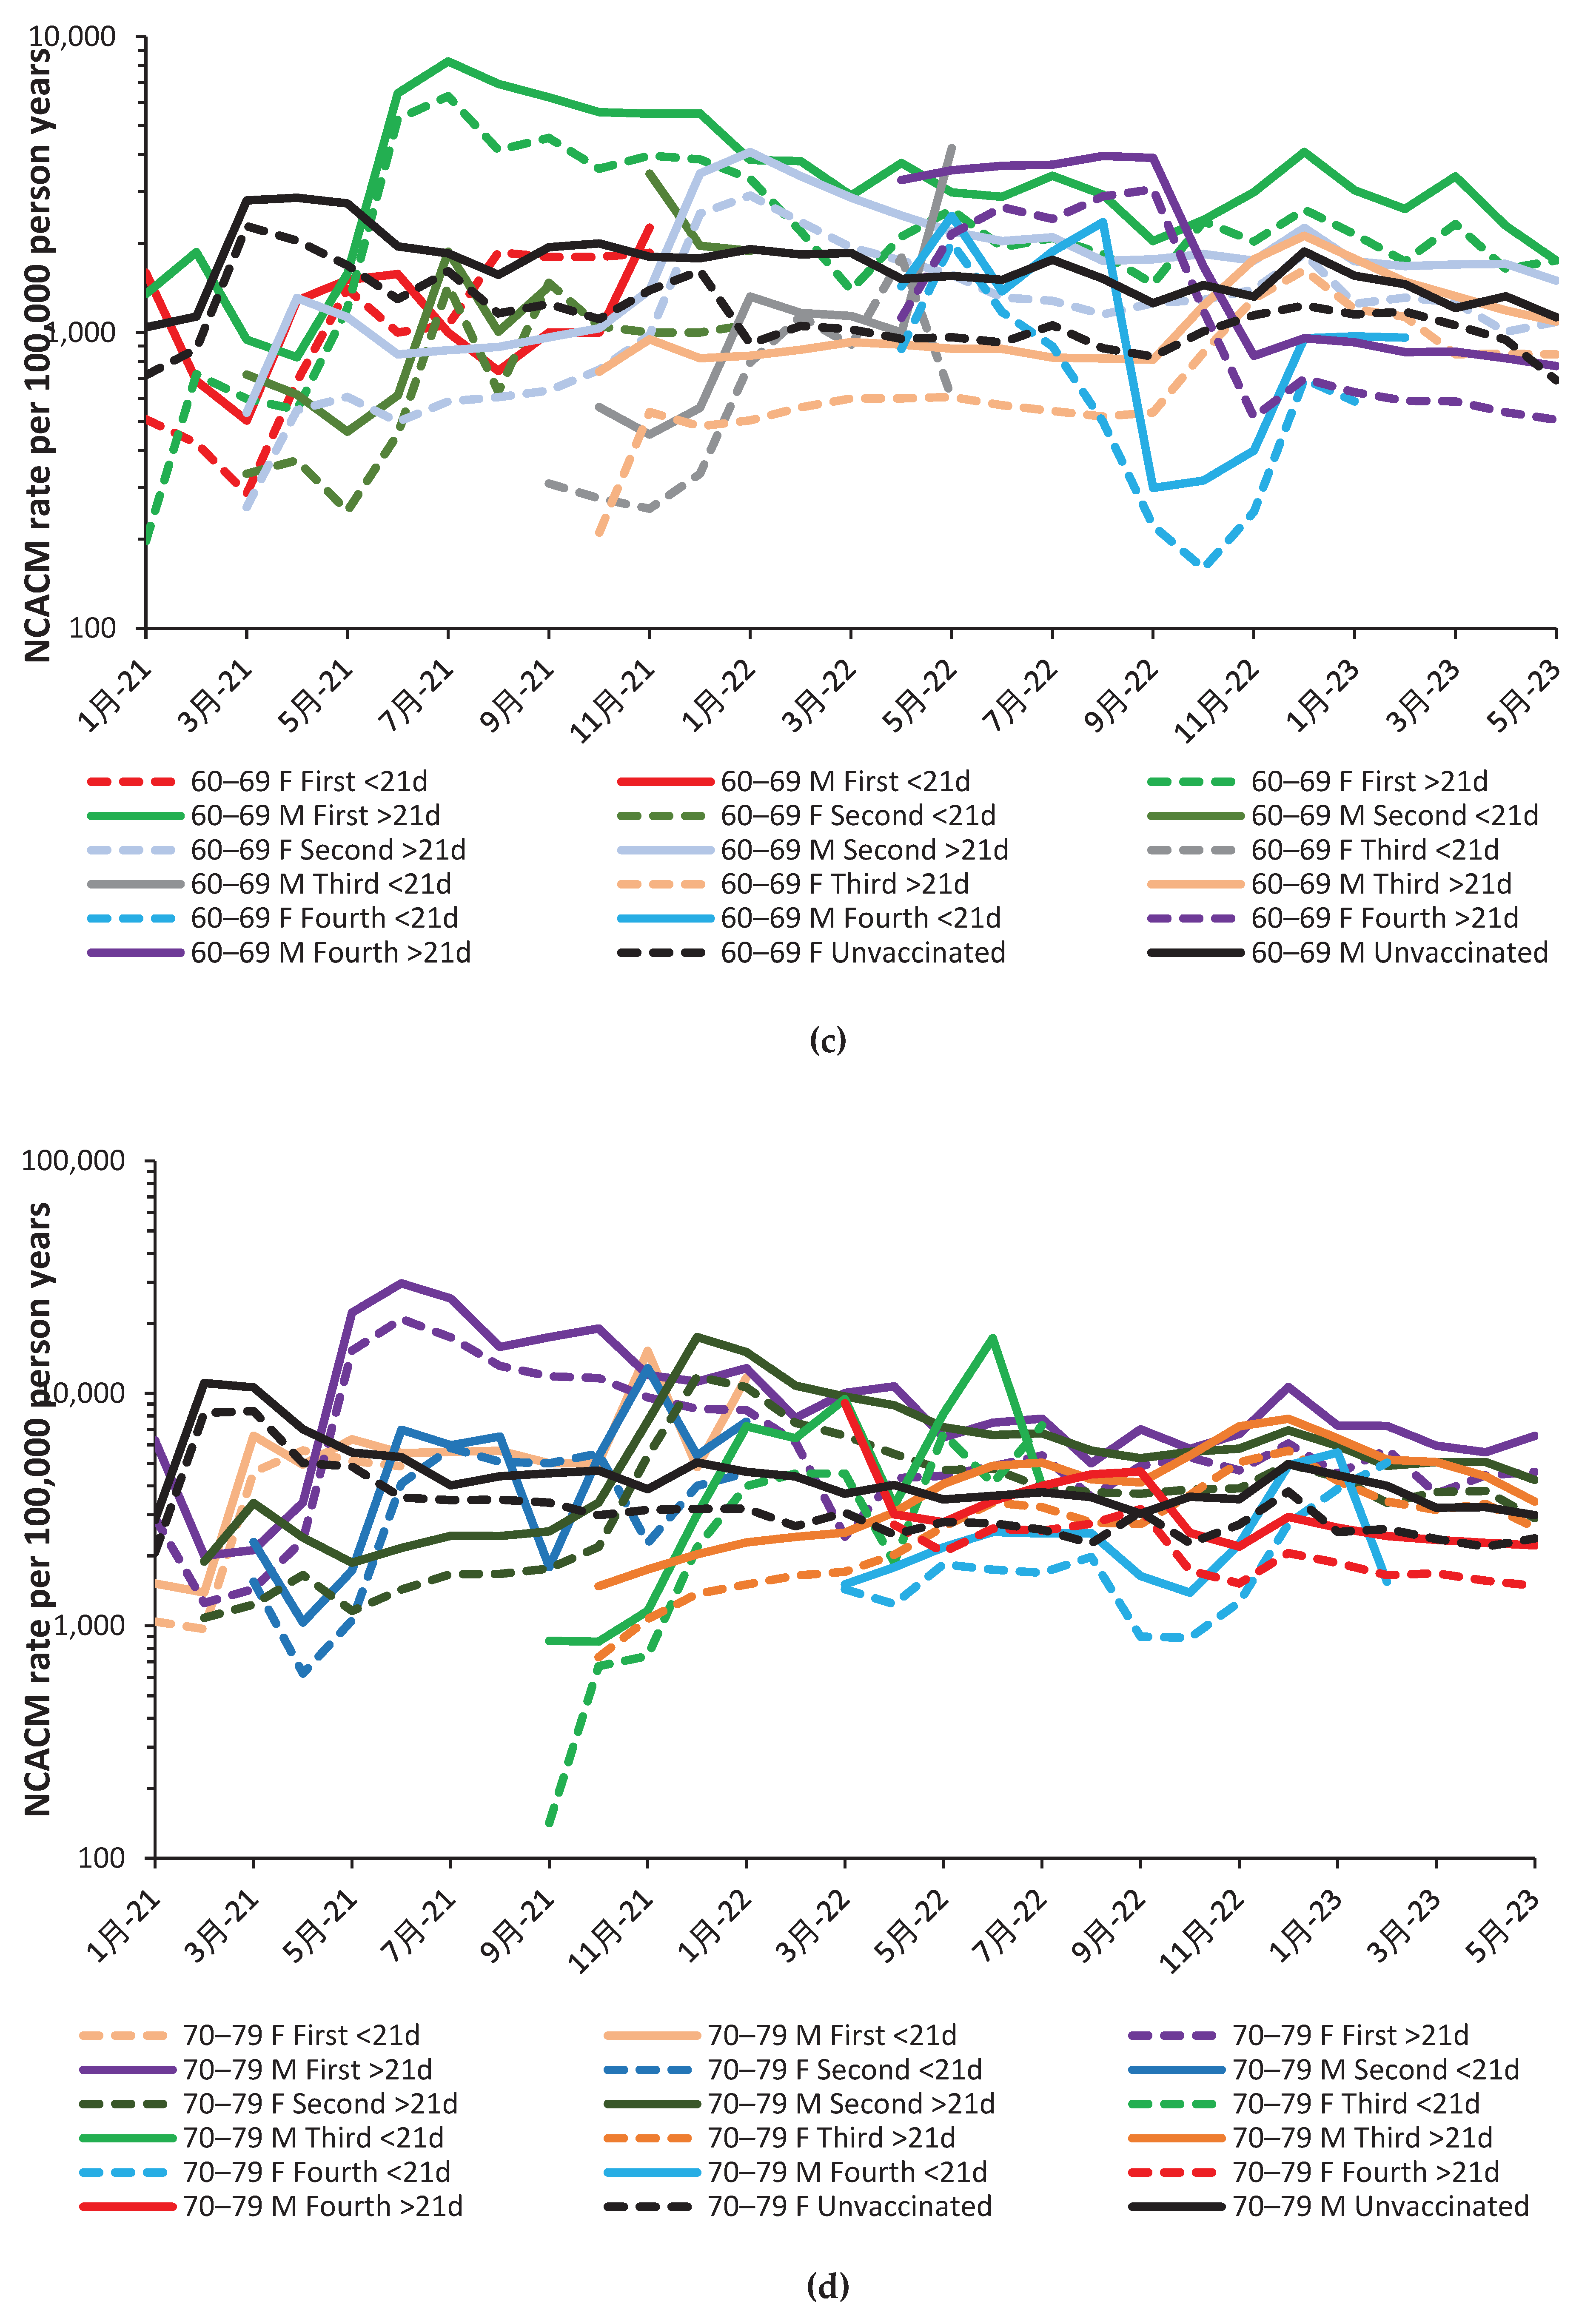
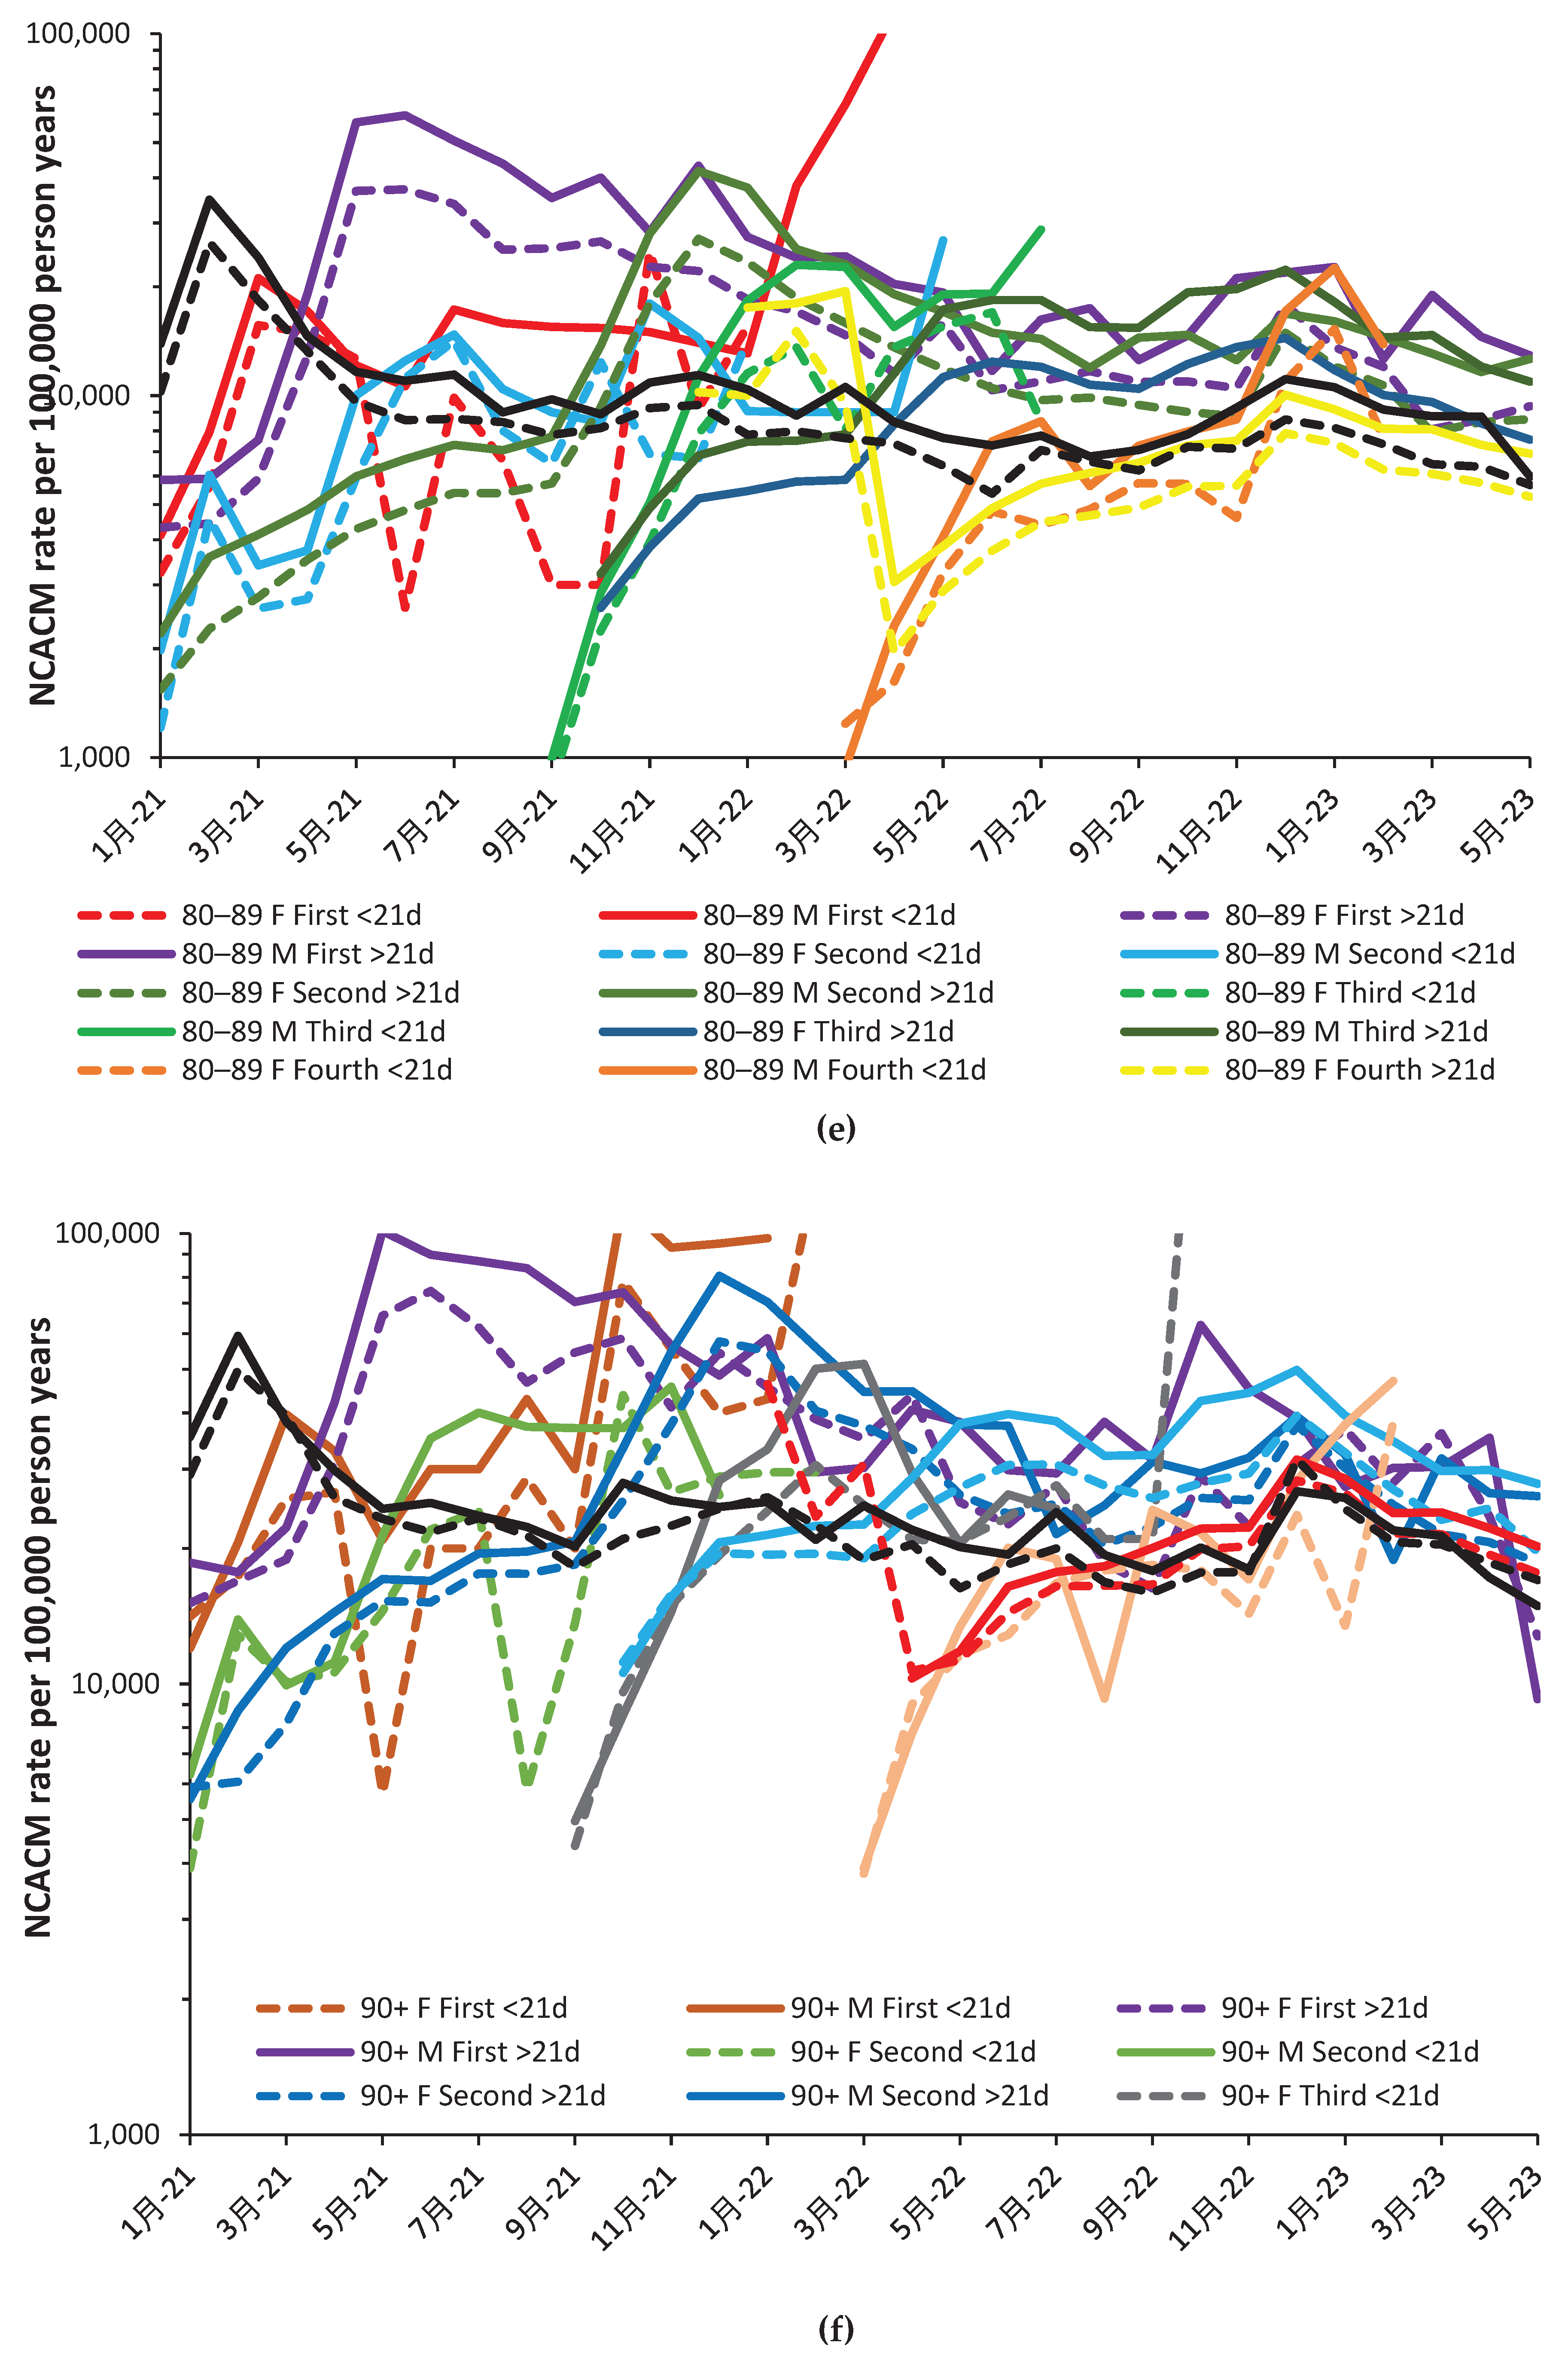
Figure A3.
All-cause mortality (including COVID-19) rate for persons age 90+ during the Omicron variant. The Y-axis has been truncated at 10,000 and 100,000.
Figure A3.
All-cause mortality (including COVID-19) rate for persons age 90+ during the Omicron variant. The Y-axis has been truncated at 10,000 and 100,000.
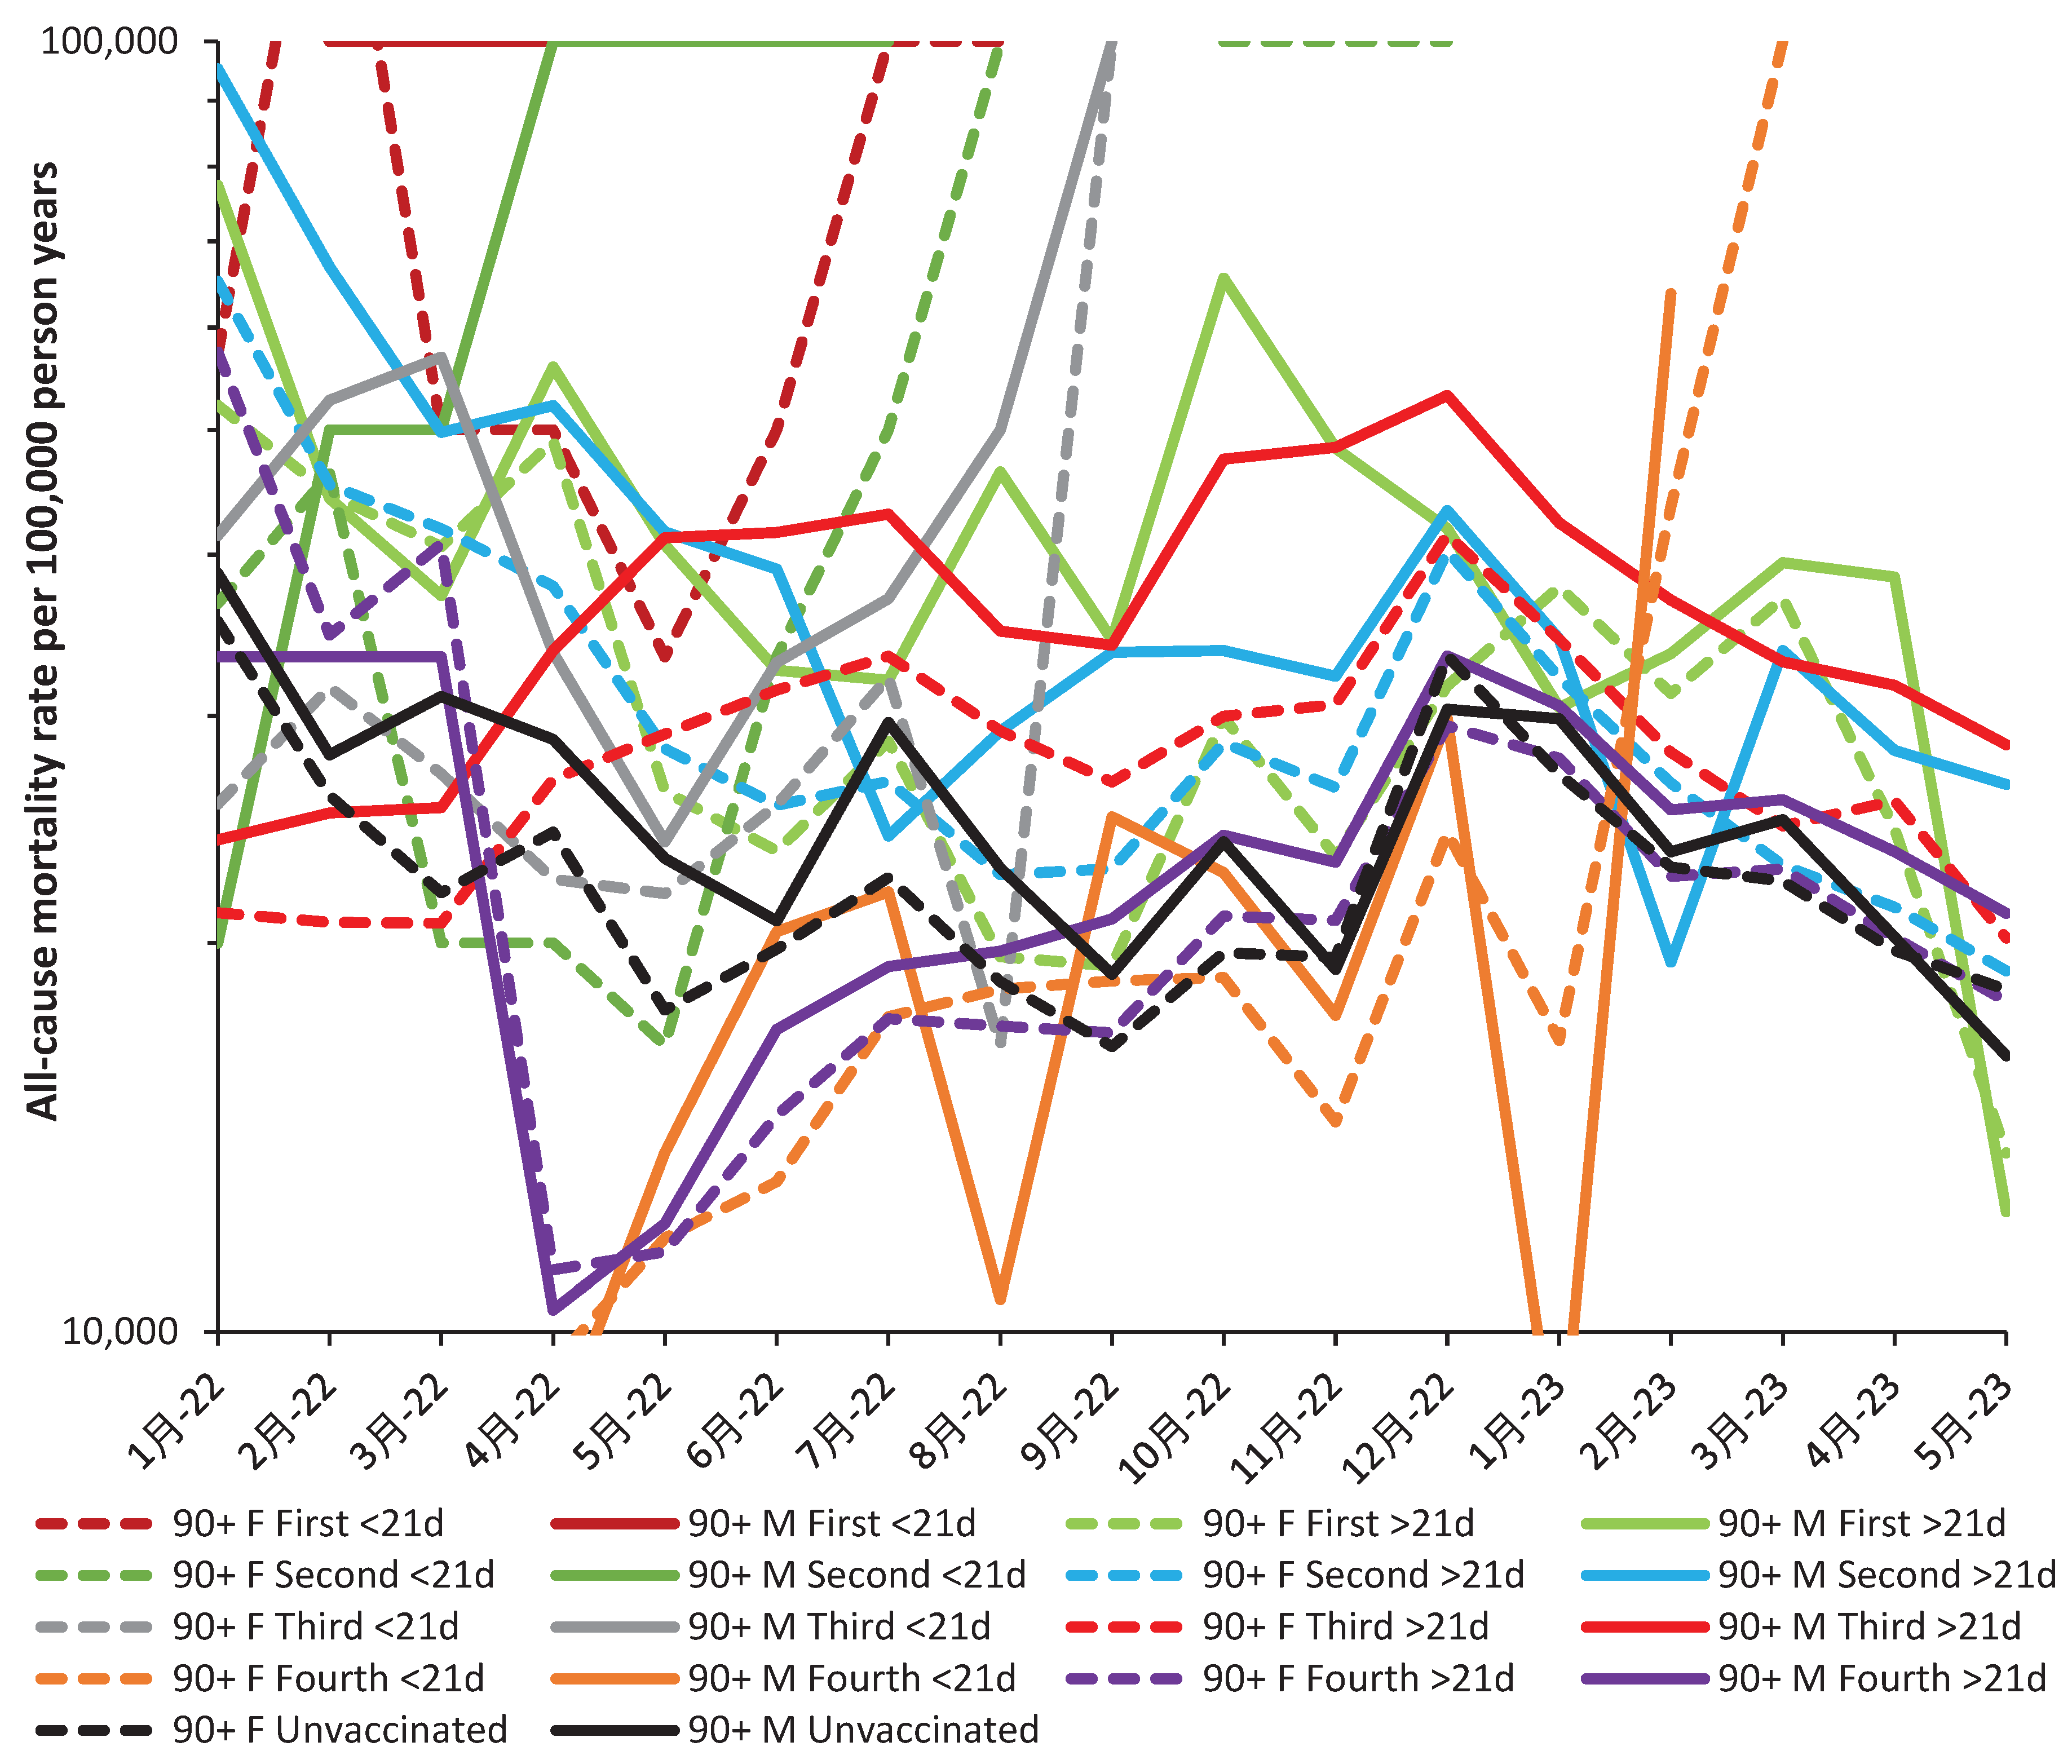
References
- de Bree, L.; Koeken, V.; Joosten, L.; Aaby, P.; Benn, C.; van Crevel, R.; Netea, M. Nonspecific effects of vaccines: Current evidence and potential implications. Semin. Immunol. 2018, 39, 35–43. [Google Scholar] [CrossRef] [PubMed]
- Walk, J.; de Bree, L.; Graumans, W.; Stoter, R.; van Gemert, G.; van de Vegte-Bolmer, M.; Teelen, K.; Hermsen, C.; Arts, R.; Behet, M.; Keramati, F.; et al. Outcomes of controlled human malaria infection after BCG vaccination. Nat. Commun. 2019, 10, 874. [Google Scholar] [CrossRef] [PubMed]
- Aaby, P.; Benn, C.; Flanagan, K.; Klein, S.; Kollmann, T.; Lynn, D.; Shann, F. The nonspecific and sex-differential effects of vaccines. Nat Rev Immunol 2020, 20, 464–470. [Google Scholar] [CrossRef] [PubMed]
- Jones, R.; Ponomarenko, A. Roles for pathogen interference in influenza vaccination, with implications to vaccine effectiveness (VE) and attribution of influenza deaths. Infect. Dis. Rep. 2022, 14, 710–758. [Google Scholar] [CrossRef] [PubMed]
- Arega, S.; Knobel, D.; Toka, F.; Conan, A. Nonspecific effects of veterinary vaccines: a systematic review. Vaccine. 2022, 40, 1655–1664. [Google Scholar] [CrossRef] [PubMed]
- Benn, C.; Amenyogbe, N.; Björkman, A.; Domínguez-Andrés, J.; Fish, E.; Flanagan, K.; Klein, S.; Kollmann, T.; Kyvik, K.; Netea, M.; Rod, N.; Schaltz-Buchholzer, F.; Shann, F.; Selin, L.; Thysen, S.; Aaby, P. Implications of nonspecific effects for testing, approving, and regulating vaccines. Drug Saf. 2023, 46, 439–448. [Google Scholar] [CrossRef] [PubMed]
- Bagheri, N.; Montazeri, H. On BCG vaccine protection from COVID-19: A review. SN Compr Clin Med. 2021, 3, 1261–1271. [Google Scholar] [CrossRef] [PubMed]
- Aspatwar, A.; Gong, W.; Wang, S.; Wu, X.; Parkkila, S. Aspatwar, A.; Gong, W.; Wang, S.; Wu, X.; Parkkila, S. Tuberculosis vaccine BCG: the magical effect of the old vaccine in the fight against the COVID-19 pandemic, Int Rev Immunol. [CrossRef]
- Wang, R.; Liu, M.; Liu, J. The Association between Influenza Vaccination and COVID-19 and Its Outcomes: A Systematic Review and Meta-Analysis of Observational Studies. Vaccines 2021, 9, 529. [Google Scholar] [CrossRef]
- Yang, M.; Rooks, B.; Le, T.; Santiago, I.; Diamond, J.; Dorsey, N.; Mainous, A. Influenza Vaccination and Hospitalizations Among COVID-19 Infected Adults. J Am Board Fam Med. 2021, 34 (Supp. l), S179–S182. [Google Scholar] [CrossRef]
- Montes, C.; Acosta-Rodríguez, E.; Merino, M.; Bermejo, D.; Gruppi, A. Polyclonal B cell activation in infections: infectious agents’ devilry or defense mechanism of the host? J Leukocyte Biol. 2007, 82, 1027–1032. [Google Scholar] [CrossRef]
- D. Juy, G. Sterkers, A. Gomez, D. Zelizewski, J.-P. Lévy. Polyclonal B-cell activation by influenza A/Texas virus-specific human T-cell clones. Annales de l'Institut Pasteur Immunologie. 1987, 138, 371–382. [CrossRef]
- Louis, J.; Lambert, P. Lipopolysaccharides: From immunostimulation to autoimmunity. In: Chedid, L.; Miescher, P.; Mueller-Eberhard, H. (eds) Immunostimulation.1980, Springer, Berlin, Heidelberg.
- Russell, S.; Peng, K. Measles virus for cancer therapy. Curr Top Microbiol Immunol. 2009, 330, 213–241. [Google Scholar] [CrossRef] [PubMed]
- Sánchez-Zuno, G.; Matuz-Flores, M.; González-Estevez, G.; Nicoletti, F.; Turrubiates-Hernández, F.; Mangano, K.; Muñoz-Valle, J. A review: Antibody-dependent enhancement in COVID-19: The not so friendly side of antibodies. Int J Immunopathol Pharmacol. 2021, 35, 20587384211050199. [Google Scholar] [CrossRef] [PubMed]
- Wang, S.; Wang, J.; Yu, X.; et al. Antibody-dependent enhancement (ADE) of SARS-CoV-2 pseudoviral infection requires FcγRIIB and virus-antibody complex with bivalent interaction. Commun Biol. 2022, 5, 262. [Google Scholar] [CrossRef] [PubMed]
- Zhou, W.; Tang, B.; Bai, Y.; Shao, Y.; Xiao, Y.; Tang, S. The resurgence risk of COVID-19 in the presence of immunity waning and ADE effect: a mathematical modelling study. medRxiv, 2021, 2021.08.25.21262601. [CrossRef]
- Karthik, K.; Senthilkumar, T.; Udhayavel, S.; Raj, G. Role of antibody-dependent enhancement (ADE) in the virulence of SARS-CoV-2 and its mitigation strategies for the development of vaccines and immunotherapies to counter COVID-19. Hum Vaccin Immunother. 2020, 16, 3055–3060. [Google Scholar] [CrossRef] [PubMed]
- Jones, R.; Ponomarenko, A. System complexity in influenza infection and vaccination: effects upon excess winter mortality. Infect. Dis. Rep. 2022, 14, 287–309. [Google Scholar] [CrossRef] [PubMed]
- Jones, R.; Ponomarenko, A. Trends in excess winter mortality (EWM) from 1900/01 to 2019/20 – evidence for a complex system of multiple long-term trends. Int. J. Environ. Res. Public Health 2022, 19, 3407. [Google Scholar] [CrossRef]
- Domingo, E.; García-Crespo, C.; Lobo-Vega, R.; Perales, C. Mutation Rates, Mutation Frequencies, and Proofreading-Repair Activities in RNA Virus Genetics. Viruses. 2021, 13, 1882. [Google Scholar] [CrossRef]
- Cosar, B.; Karagulleoglu, Z.; Unal, S.; Ince, A.; Uncuoglu, D.; Tuncer, G.; Kilinc, B.; Ozkan, Y.; Ozkoc, H.; Demir, I.; Eker, A.; Karagoz, F.; et al. COVID–19 mutations and their viral variants. Cytokine Growth Factor Rev. 2022, 63, 10–22. [Google Scholar] [CrossRef]
- Centers for Disease Control and Prevention. COVID–19 variant classifications and definitions. Available online: COVID–19 Variant Classifications and Definitions (cdc.gov) (accessed 2 August 2022).
- GOV.UK. Investigation of COVID–19 variants: technical briefings. Available online: Investigation of COVID–19 variants: technical briefings - GOV.UK (www.gov.uk) (accessed 26 August 2022).
- Jones, R.; Ponomarenko, A. COVID-19-Related Age Profiles for SARS-CoV-2 Variants in England and Wales and States of the USA (2020 to 2022): Impact on All-Cause Mortality. Infect. Dis. Rep. 2023, 15, 600–634. [Google Scholar] [CrossRef]
- GOV.UK. COVID–19 confirmed deaths in England (to 31 December 2020) – report. Available online: COVID–19 confirmed deaths in England (to 31 December 2020): report - GOV.UK (www.gov.uk) (accessed 29 August 2022).
- Mueller B. When was the first U.S. Covid death? C.D.C. investigates 4 early cases. The New York Times, 9 September 2021. Available online: When Was the First U.S. Covid Death? CDC Investigates 4 Early Cases - The New York Times (nytimes.com) (accessed 2 September 20220.
- Freeman, A.; Watson, A.; O'Regan, P.; Wysocki, O.; Burke, H.; Freitas, A.; Livingstone, R.; Dushianthan, A.; Celinski, M.; Batchelor, J.; Phan, H.; et al. Wave comparisons of clinical characteristics and outcomes of COVID–19 admissions - Exploring the impact of treatment and strain dynamics. J Clin Virol. 2022, 146, 105031. [Google Scholar] [CrossRef]
- Mlcochova, P.; Kemp, S.; Dhar, M.; Papa, G.; Meng, B.; Ferreira, I.; Datir, R.; Collier, D.; Albecka, A.; Singh, S.; Pandy, R.; et al. COVID–19 B. 1.617.2 Delta variant replication and immune evasion. Nature 2021, 599, 114–119. [Google Scholar] [CrossRef]
- Stepanova, M.; Lam, B.; Younossi, E.; Felix, S.; Ziavee, M.; Price, J.; Pham, H.; de Avila, L.; Terra, K.; Austin, P.; Jeffers, T.; et al. The impact of variants and vaccination on the mortality and resource utilization of hospitalized patients with COVID-19. BMC Infect Dis. 2022, 22, 702. [Google Scholar] [CrossRef] [PubMed]
- Wikipedia. COVID–19 vaccination in the United Kingdom. Available online: COVID–19 vaccination in the United Kingdom - Wikipedia (accessed 26 August 2022).
- GOV.UK. COVID vaccinations in United Kingdom. Available online: Vaccinations in England | Coronavirus in the UK (data.gov.uk) (accessed 26 August 2022).
- Majeed, A.; Pollock, K.; Hodes, S.; Papaluca, M. Implementation of COVID–19 vaccination in the United Kingdom. BMJ. 2022, 378, e070344378. [Google Scholar] [CrossRef] [PubMed]
- GOV.UK. JCVI advises on COVID–19 vaccine for people aged under 40. 7 May 2021. Available online: JCVI advises on COVID–19 vaccine for people aged under 40 - GOV.UK (www.gov.uk) (accessed 4 September 2022).
- GOV.UK. COVID-19 vaccine uptake in healthcare workers. Published 7 October 2021. Available online: COVID-19 vaccine uptake in healthcare workers - GOV.UK (www.gov.uk) (accessed on 5 January 2023].
- Berencsi, G.; Kapusinszky, B.; Rigó, Z.; Szomor, K. Interference among viruses circulating and administered in Hungary from 1931 to 2008. Acta Microbiol. Immunol. Hung. 2010, 57, 73–86. [Google Scholar] [CrossRef] [PubMed]
- Ioannou, G.; Locke, E.; O'Hare, A.; Bohnert, A.; Boyko, E.; Hynes, D.; Berry, K. COVID–19 Vaccination Effectiveness Against Infection or Death in a National U. S. Health Care System : A Target Trial Emulation Study. Ann Intern Med. 2022, 175, 352–361. [Google Scholar] [CrossRef] [PubMed]
- Tang F, Hammel IS, Andrew MK, Ruiz JG. COVID–19 mRNA vaccine effectiveness against hospitalisation and death in veterans according to frailty status during the COVID–19 delta (B.1.617.2) variant surge in the USA: a retrospective cohort study. Lancet Healthy Longev 2022, Aug 1. [CrossRef]
- GOV.UK. COVID–19: the green book, Chapter 14a. Available online: COVID–19: the green book, chapter 14a - GOV.UK (www.gov.uk) (accessed 4 September 2022).
- Office for National Statistics. Deaths by vaccination status, England. Available online: Deaths by vaccination status, England - Office for National Statistics (accessed 28 August 2022).
- Fenton, N.; Neil, M.; Craig, C.; McLachlan, S. What the ONS mortality COVID-19 surveillance data can tell us about vaccine safety and efficacy. 2022. Available from: http://dx.doi.org/10.13140/RG.2.2.30898.07362 (accessed 15 January 2023).
- Office for National Statistics. Deaths registered weekly in England and Wales. Available online: Deaths registered weekly in England and Wales, provisional - Office for National Statistics (ons.gov.uk) (accessed 12 October 2023).
- Odilov, A.; Volkov, A.; Abdullaev, A.; Gasanova, T.; Lipina, T.; Babichenko, I. COVID-19: Multiorgan Dissemination of SARS-CoV-2 Is Driven by Pulmonary Factors. Viruses. 2021, 14, 39. [Google Scholar] [CrossRef]
- Jones, R.; Ponomarenko, A. Pathogens Have Different Age/Sex Profiles for Hospital Admission and Why COVID-19 Variants Behave as If They Were ‘Different’ Pathogens. Preprints 2023, 2023091886. [Google Scholar] [CrossRef]
- Pálinkás, A.; Sándor, J. Effectiveness of COVID–19 Vaccination in preventing all-cause mortality among adults during the third wave of the epidemic in Hungary: Nationwide retrospective cohort study. Vaccines. 2022, 10, 1009. [Google Scholar] [CrossRef]
- Andrews, N.; Stowe, J.; Kirsebom, F.; Toffa, S.; Rickeard, T.; Gallagher, E.; Gower, C.; Kall, M.; et al. Covid-19 Vaccine Effectiveness against the Omicron (B.1.1.529) Variant. N Engl J Med. 2022, 386, 1532–1546. [Google Scholar] [CrossRef]
- Tseng, H.; Ackerson, B.; Bruxvoort, K.; Sy, L.; Tubert, J.; Lee, G.; Ku, J.; Florea, A.; et al. Effectiveness of mRNA-1273 vaccination against SARS-CoV-2 omicron subvariants BA.1.; BA.2.; BA.2.12.1.; BA.4.; and BA.5. Nat Commun. 2023, 14, 189. [Google Scholar] [CrossRef] [PubMed]
- Goldinger, A.; Shakhbazov, K.; Henders, A.; McRae, A.; Montgomery, G.; Powell, J. Seasonal effects on gene expression. PLoS One. 2015, 10, e0126995. [Google Scholar] [CrossRef]
- Dopico, X.; Evangelou, M.; Ferreira, R.; Guo, H.; Pekalski, M.; Smyth, D.; Cooper, N.; Burren, O.; Fulford, A.; Hennig, B.; Prentice, A.; et al. Widespread seasonal gene expression reveals annual differences in human immunity and physiology. Nat Commun. 2015, 6, 7000. [Google Scholar] [CrossRef] [PubMed]
- Tunçer, F.; Şahiner, Ü.; Ocak, M.; Ünsal, H.; Soyer, Ö.; Şekerel, B.; Birben, E. Comparison of miRNA expression in patients with seasonal and perennial allergic rhinitis and non-atopic asthma. Turk J Pediatr. 2022, 64, 859–868. [Google Scholar] [CrossRef] [PubMed]
- Park, E.; Ha, H.; Lee, D.; Kim, W.; Lee, Y.; Bae, W.; Kim, H. Genomic Analyses of Non-Coding RNAs Overlapping Transposable Elements and Its Implication to Human Diseases. Int J Mol Sci. 2022, 23, 8950. [Google Scholar] [CrossRef] [PubMed]
- Alles, J.; Fehlmann, T.; Fischer, U.; Backes, C.; Galata, V.; Minet, M.; Hart, M.; Abu-Halima, M.; Grässer, F.; Lenhof, H.; Keller, A.; Meese, E. An estimate of the total number of true human miRNAs. Nucleic Acids Res. 2019, 47, 3353–3364. [Google Scholar] [CrossRef]
- Kabekkodu, S.; Shukla, V.; Varghese, V.; D' Souza, J.; Chakrabarty, S.; Satyamoorthy, K. Clustered miRNAs and their role in biological functions and diseases. Biol Rev Camb Philos Soc. 2018, 93, 1955–1986. [Google Scholar] [CrossRef]
- Xu, P.; Wu, Q.; Yu, J.; Rao, Y.; Kou, Z.; Fang, G.; Shi, X.; Liu, W.; Han, H. A Systematic Way to Infer the Regulation Relations of miRNAs on Target Genes and Critical miRNAs in Cancers. Front Genet. 2020, 11, 278. [Google Scholar] [CrossRef]
- Leung, A.; Sharp, P. Function and localization of microRNAs in mammalian cells. Cold Spring Harb Symp Quant Biol. 2006, 71, 29–38. [Google Scholar] [CrossRef]
- O'Brien J, Hayder H, Zayed Y, Peng C. Overview of MicroRNA Biogenesis, Mechanisms of Actions, and Circulation. Front Endocrinol (Lausanne). 2018, 9, 402. [CrossRef]
- Shang, R.; Lee, S.; Senavirathne, G. et al. microRNAs in action: biogenesis, function and regulation. Nat Rev Genet. 2023. [CrossRef]
- Gao, K.; Cheng, M.; Zuo, X. Active RNA interference in mitochondria. Cell Res. 2021, 31, 219–228. [Google Scholar] [CrossRef] [PubMed]
- Mehta, A.; Baltimore, D. MicroRNAs as regulatory elements in immune system logic. Nat Rev Immunol. 2016, 16, 279–294. [Google Scholar] [CrossRef] [PubMed]
- Liao, T.; Chen, Y.; Tang, K.; Chen, P.; Liu, H.; Chen, D. MicroRNA-223 inhibits neutrophil extracellular traps formation through regulating calcium influx and small extracellular vesicles transmission. Sci Rep. 2021, 11, 15676. [Google Scholar] [CrossRef]
- Wei, J.; Huang, K.; Yang, C.; Kang, C. Non-coding RNAs as regulators in epigenetics. Oncol Rep. 2017, 37, 3–9. [Google Scholar] [CrossRef] [PubMed]
- Iacomino, G.; Siani, A. Role of microRNAs in obesity and obesity-related diseases. Genes Nutr. 2017, 12, 23. [Google Scholar] [CrossRef] [PubMed]
- Erkal, B.; Korkut, S. Identification of miRNAs and their potential effects on multiple sclerosis related pathways using ın silico analysis. Multiple Sclerosis and Related Disorders 2022, 59, 103642. [Google Scholar] [CrossRef] [PubMed]
- Ghafouri-Fard, S.; Abak, A.; Talebi, S.; Shoorei, H.; Taheri, W.; Dilmaghani, N. Role of miRNA and lncRNAs in organ fibrosis and aging. Biomedicine & Pharmacotherapy. 2021, 143, 112132. [Google Scholar] [CrossRef]
- Tan, Z.; Li, W.; Cheng, X.; Zhu, Q.; Zhang, X. Non-Coding RNAs in the Regulation of Hippocampal Neurogenesis and Potential Treatment Targets for Related Disorders. Biomolecules. 2022, 13, 18. [Google Scholar] [CrossRef]
- Hill, M.; Tran, N. miRNA interplay: mechanisms and consequences in cancer. Dis Model Mech. 2021, 14, dmm047662. [Google Scholar] [CrossRef]
- Leon-Icaza, S.; Zeng, M.; Rosas-Taraco, A. microRNAs in viral acute respiratory infections: immune regulation, biomarkers, therapy, and vaccines. ExRNA. 2019, 1, 1. [Google Scholar] [CrossRef]
- Hicks, J.; Liu, H.-C. Involvement of eukaryotic small RNA pathways in host defense and viral pathogenesis. Viruses 2013, 5, 2659–2678. [Google Scholar] [CrossRef] [PubMed]
- Martinez-Espinoza, I.; Banos-Lara, M.; Guerrero-Plata, A. The Importance of miRNA Identification During Respiratory Viral Infections. J Cell Immunol. 2021, 3, 207–214. [Google Scholar] [CrossRef] [PubMed]
- Plaisance-Bonstaff K, Renne R. Viral miRNAs. Methods Mol Biol. 2011, 721, 43–66. [CrossRef]
- Shmaryahu, A.; Carrasco, M.; Valenzuela, P. Prediction of bacterial microRNAs and possible targets in human cell transcriptome. J Microbiol. 2014, 52, 482–489. [Google Scholar] [CrossRef] [PubMed]
- Takahashi, T.; Heaton, S.; Parrish, N. Mammalian antiviral systems directed by small RNA. PLoS Pathog. 2021, 17, e1010091. [Google Scholar] [CrossRef] [PubMed]
- Zhu, Y.; Zhang, Z.; Song, J.; Qian, W.; Gu, X.; Yang, C.; Shen, N.; Xue, F.; Tang, Y. SARS-CoV-2-Encoded MiRNAs Inhibit Host Type I Interferon Pathway and Mediate Allelic Differential Expression of Susceptible Gene. Front Immunol. 2021, 12, 767726. [Google Scholar] [CrossRef] [PubMed]
- Sedger, L. microRNA control of interferons and interferon induced anti-viral activity. Mol Immunol. 2013, 56, 781–793. [Google Scholar] [CrossRef] [PubMed]
- Zhang, S.; Amahong, K.; Sun, X.; Lian, X.; J Liu, J.; Sun, H.; Lou, Y.; Zhu, F.; Qiu, Y. The miRNA: a small but powerful RNA for COVID-19, Brief Bioinformatics. 2021, 22, 1137–1149. [CrossRef]
- Bojkova, D.; Widera, M.; Ciesek, S.; Wass, M.; Michaelis, M.; Cinatl, J. Reduced interferon antagonism but similar drug sensitivity in Omicron variant compared to Delta variant of SARS-CoV-2 isolates. Cell Res. 2022, 32, 319–321. [Google Scholar] [CrossRef]
- Bojkova, D.; Rothenburger, T.; Ciesek, S.; Wass, M.; Michaelis, M.; Cinatl, J. SARS-CoV-2 Omicron variant virus isolates are highly sensitive to interferon treatment. Cell Discov. 2022, 8, 42. [Google Scholar] [CrossRef]
- Liu, F.; Liu, C.; Hu, X.; Shang, Y.; Wu, L. MicroRNA-21: A positive regulator for optimal production of type I and type III interferon by plasmacytoid dendritic cells. Front Immunol. 2017, 8, 947. [Google Scholar] [CrossRef]
- Zhao, Y.; Liu, F.; Dong, J.; Fu, H.; Luo, J.; Ji, J.; Gao, X, Guo, W. Inducible downregulation of miR-93 feedback promotes innate responses against RNA virus by amplifying interferon signaling. Am J Transl Res. 2022, 14, 7689–7704.
- Lopez L, Sang PC, Tian Y, Sang Y. Dysregulated Interferon Response Underlying Severe COVID-19. Viruses. 2020, 12, 1433. [CrossRef] [PubMed]
- Wan, W.; Thoon, K.; Loo, L.; Chan, K.; Oon, L.; Ramasamy, A.; Maiwald, M. Trends in respiratory virus infections during the COVID–19 pandemic in Singapore, 2020. JAMA Netw Open. 2021, 4, e2115973. [Google Scholar] [CrossRef] [PubMed]
- Partridge, E.; McCleery, E.; Cheema, R.; Nakra, N.; Lakshminrusimha, S.; Tancredi, D.; Blumberg, D. Evaluation of Seasonal respiratory virus activity before and after the statewide COVID–19 Shelter-in-Place order in Northern California. JAMA Netw Open. 2021, 4, e2035281. [Google Scholar] [CrossRef]
- Serigstad, S.; Markussen, D.L.; Ritz, C.; et al. The changing spectrum of microbial aetiology of respiratory tract infections in hospitalized patients before and during the COVID–19 pandemic. BMC Infect Dis. 2022, 22, 763. [Google Scholar] [CrossRef] [PubMed]
- Dhanasekaran, V.; Sullivan, S.; Edwards, K.; Xie, R.; Khorov, A.; Valkenburg, S.; Cowling, B.; Barr,I. Human seasonal influenza under COVID-19 and the potential consequences of influenza lineage elimination. Nat Commun 2022, 13, 1721. [CrossRef] [PubMed]
- Koutsakos, M.; Wheatley, A.; Laurie, K.; Kent, S.; Rockman, S. Influenza lineage extinction during the COVID–19 pandemic? Nat Rev Microbiol 2021, 19, 741–742. [Google Scholar] [CrossRef] [PubMed]
- Lansbury, L.; Lim, B.; Baskaran, V.; Lim, W. Co-infections in people with COVID–19: a systematic review and meta-analysis. J. Infect. 2020, 81, 266–275. [Google Scholar] [CrossRef]
- Garcia-Vidal, C.; Sanjuan, G.; Moreno-Garcia, E.; Puerta-Alcalde, P.; Garcia-Pouton, N.; Chumbita, M.; Fernandez-Pittol, M.; Pitart, C.; Inciarte, A.; et al. Incidence of co-infections and superinfections in hospitalized patients with COVID–19: a retrospective cohort study. Clin. Microbiol. Infect. 2021, 27, 83–88. [Google Scholar] [CrossRef]
- Krumbein, H.; Kümmel, L.; Fragkou, P.; Thölken, C.; Hünerbein, B.; Reiter, R.; Papathanasiou, K.; Renz, H.; Skevaki, C. Respiratory viral co-infections in patients with COVID–19 and associated outcomes: A systematic review and meta-analysis. Rev Med Virol. 2022, e2365. [Google Scholar] [CrossRef]
- Wang, B.; Zhang, L.; Wang, Y.; Dai, T.; Qin, Z.; Zhou, F.; Zhang, L. Alterations in microbiota of patients with COVID–19: potential mechanisms and therapeutic interventions. Signal Transduct Target Ther. 2022, 7, 143. [Google Scholar] [CrossRef]
- Hardin, L.; Xiao, N. miRNAs: The Key Regulator of COVID-19 Disease. Int J Cell Biol. 2022, 2022, 1645366. [Google Scholar] [CrossRef] [PubMed]
- Miyashita, Y.; Yoshida, T.; Takagi, Y.; et al. Circulating extracellular vesicle microRNAs associated with adverse reactions, proinflammatory cytokine, and antibody production after COVID-19 vaccination. npj Vaccines 2022, 7, 16. [Google Scholar] [CrossRef]
- Martinez-Espinoza, I.; Banos-Lara, M.; Guerrero-Plata, A. The Importance of miRNA Identification During Respiratory Viral Infections. J Cell Immunol. 2021, 3, 207–214. [Google Scholar] [CrossRef] [PubMed]
- Yousefi, H.; Poursheikhani, A.; Bahmanpour, Z.; Vatanmakanian, M.; Taheri, M.; Mashouri, L.; Alahari, K. SARS-CoV infection crosstalk with human host cell noncoding-RNA machinery: An in-silico approach. Biomed Pharmacother. 2020, 130, 110548. [Google Scholar] [CrossRef]
- Sun, G.; Cui, Q.; Garcia, G.; Jr.; Lizhar, E.M.; Arumugaswami, V.; Shi, Y.; Riggs, A.D. Viral and Host Small RNA Response to SARS-CoV-2 Infection. Microbiol. Res. 2022, 13, 788–808. [CrossRef]
- Battaglia, R.; Alonzo, R.; Pennisi, C.; Caponnetto, A.; Ferrara, C.; Stella, M.; Barbagallo, C.; Barbagallo, D.; Ragusa, M.; Purrello, M.; Di Pietro, C. MicroRNA-mediated regulation of the virus cycle and pathogenesis in the COVID–19 disease. Int J Mol Sci. 2021, 22, 13192. [Google Scholar] [CrossRef] [PubMed]
- Lyu, L.; Feng, R.; Zhang, M.; Xie, X.; Liao, Y.; Zhou, Y.; Guo, X.; Su, B.; Dorsett, Y.; Chen, L. Subgenomic RNA profiling suggests novel mechanism in coronavirus gene regulation and host adaption. Life Sci Alliance. 2022, 5, e202101347. [Google Scholar] [CrossRef] [PubMed]
- Pawlica, P.; Yario, T.; White, S.; Wang, J.; Moss, W.; Hui, P.; Vinetz, J.; Steitz, J. COVID–19 expresses a microRNA-like small RNA able to selectively repress host genes. Proc Natl Acad Sci U S A. 2021, 118, e2116668118. [Google Scholar] [CrossRef]
- Wang, D.; Jiang, A.; Feng, J.; Li, G.; Guo, D.; Sajid, M.; Wu, K.; Zhang, Q.; Ponty, Y.; Will, S.; Liu, F.; et al. The COVID–19 subgenome landscape and its novel regulatory features. Mol Cell. 2021, 81, 2135–2147. [Google Scholar] [CrossRef]
- Paul, S.; Bravo Vázquez, L.; Reyes-Pérez, P.; Estrada-Meza, C.; Aponte Alburquerque, R.; Pathak, S.; Banerjee, A.; Bandyopadhyay, A.; Chakraborty, S.; Srivastava, A. The role of microRNAs in solving COVID–19 puzzle from infection to therapeutics: A mini-review. Virus Res. 2022, 308, 198631. [Google Scholar] [CrossRef]
- Abu-Izneid, T.; AlHajri, N.; Ibrahim, A.; Javed, M.; Salem, K.; Pottoo, F.; Kamal, M. Micro-RNAs in the regulation of immune response against SARS CoV-2 and other viral infections. J Adv Res. 2021, 30, 133–145. [Google Scholar] [CrossRef] [PubMed]
- Moatar, A.; Chis, A.; Marian, C.; Sirbu, I. Gene Network Analysis of the Transcriptome Impact of COVID–19 Interacting MicroRNAs in COVID–19 Disease. Int J Mol Sci. 2022, 23, 9239. [Google Scholar] [CrossRef]
- Grehl, C.; Schultheiß, C.; Hoffmann, K.; Binder, M.; Altmann, T.; Grosse, I.; Kuhlmann, M. Detection of COVID–19 derived small RNAs and changes in circulating small RNAs associated with COVID–19. Viruses. 2021, 13, 1593. [Google Scholar] [CrossRef] [PubMed]
- Marchi, R.; Sugita, B.; Centa, A.; Fonseca, A.; Bortoletto, S.; Fiorentin, K.; Ferreira, S.; Cavalli, L. The role of microRNAs in modulating COVID–19 infection in human cells: a systematic review. Infect Genet Evol. 2021, 91, 104832. [Google Scholar] [CrossRef]
- Meng, F.; Siu, G.; Mok, B.; Sun, J.; Fung, K.; Lam, J.; Wong, N.; Gedefaw, L.; Luo. S.; Le,e T.; Yip, S.; Huang, C-L. Viral microRNAs encoded by nucleocapsid gene of COVID–19 are detected during infection, and targeting metabolic pathways in host cells. CL.Cells. 2021, 10, 1762. [CrossRef]
- Singh, M.; Chazal, M.; Quarato, P.; Bourdon, L.; Malabat, C.; Vallet, T.; Vignuzzi, M.; van der Werf, S.; Behillil, S.; Donati, F.; et al. A virus-derived microRNA targets immune response genes during COVID–19 infection. EMBO Rep. 2022, 23, e54341. [Google Scholar] [CrossRef] [PubMed]
- Fu, Z.; Wang, J.; Wang, Z.; Sun, Y.; Wu, J.; Zhang, Y.; Liu, X.; Zhou, Z.; Zhou, L.; Yi, Y.; Xia, X.; Wang, L.; Chen, X. A virus-derived microRNA-like small RNA serves as a serum biomarker to prioritize the COVID–19 patients at high risk of developing severe disease. Cell Discov. 2021, 7, 48. [Google Scholar] [CrossRef]
- Liu, X.; Wen, Y-Z.; Huang, Z-L.; Shen, Z.; Wang, J-H.; Luo, Y-H.; Chen, W-X.; Lun, Z-R.; Li, H-B.; Qu, L-H.; Shan, H.; Zheng, L-L. COVID–19 causes a significant stress response mediated by small RNAs in the blood of COVID–19 patients. Molec Ther - Nucleic Acids. 2022, 27, 751–762. [CrossRef]
- Farr, R.; Rootes, C.; Rowntree, L.; Nguyen, T.; Hensen, L.; Kedzierski, L.; Cheng, A.; Kedzierska, K.; Au, G.; Marsh, G.; Vasan, S.; et al. Altered microRNA expression in COVID–19 patients enables identification of COVID–19 infection. PLOS Pathog. 2021, 17, e1009759. [Google Scholar] [CrossRef]
- Neeb, Z.; Ritter, A.; Chauhan, L.; et al. A potential role for SARS-CoV-2 small viral RNAs in targeting host microRNAs and modulating gene expression. Sci Rep. 2022, 12, 21694. [Google Scholar] [CrossRef]
- Wilson, J.; Kealy, D.; James, S.; Plowman, T.; Newling, K.; Jagger, C.; Filbey, K.; Mann, E.; Konkel, J.; et al. Integrated miRNA/cytokine/chemokine profiling reveals severity-associated step changes and principal correlates of fatality in COVID-19. iScience. 2022, 25, 103672. [Google Scholar] [CrossRef] [PubMed]
- Ríos-Silva, M.; Trujillo, X.; Huerta, M.; Benites-Godínez, V.; Guzmán-Esquivel, J.; Bricio-Barrios, J.; Mendoza-Cano, O.; Lugo-Radillo, A.; Murillo-Zamora, E. Reemerging Influenza Virus Infections during the Dominance of the Omicron SARS-CoV-2 Variant in Mexico. Pathogens. 2022, 11, 1181. [Google Scholar] [CrossRef]
- Rivas, M.; Ebinger, J.; Wu, M.; Sun, N.; Braun, J.; Sobhani, K.; Van Eyk, J.; Cheng, S.; Arditi, M. BCG vaccination history associates with decreased SARS-CoV-2 seroprevalence across a diverse cohort of health care workers. J Clin Invest. 2021, 131, e145157. [Google Scholar] [CrossRef]
- Singh, A.; Wang, R.; Lombardo, K.; Praharaj, M.; Bullen, C.; Um, P.; Davis, S.; Komm, O.; Illei, P.; Ordonez, A.; Bahr, M.; et al. Dynamic single-cell RNA sequencing reveals BCG vaccination curtails SARS-CoV-2 induced disease severity and lung inflammation. bioRxiv [Preprint]. 2022 Mar 15:2022.03.15.484018. [CrossRef]
- Monereo-Sánchez, J.; Luykx, J.; Pinzón-Espinosa, J.; Richard, G.; Motazedi, E.; Westlye, L.; Andreassen, O.; van der Meer, D. Diphtheria And Tetanus Vaccination History Is Associated With Lower Odds of COVID-19 Hospitalization. Front Immunol. 2021, 12, 749264. [Google Scholar] [CrossRef] [PubMed]
- Diener, C.; Keller, A.; Meese, E. Emerging concepts of miRNA therapeutics: from cells to clinic. Trends in Genetics. 2022, 38, 613–626. [Google Scholar] [CrossRef] [PubMed]
- Zhang, S.; Cheng, Z.; Wang, Y.; Han, T. The Risks of miRNA Therapeutics: In a Drug Target Perspective. Drug Des Devel Ther. 2021, 15, 721–733. [Google Scholar] [CrossRef]
- Nakaya, H.; Hagan,T .; Duraisingham, S.; Lee, E.; Kwissa, M.; Rouphael, N.; Frasca, D.; Gersten, M.; Mehta, A.; Gaujoux, R.; et al. Systems Analysis of Immunity to Influenza Vaccination across Multiple Years and in Diverse Populations Reveals Shared Molecular Signatures. Immunity 2015, 43, 1186–1198. [CrossRef]
- Mosakhani, N.; Sarhadi, V.; Panula, P.; Partinen, M.; Knuutila, S. Narcolepsy patients' blood-based miRNA expression profiling: miRNA expression differences with Pandemrix vaccination. Acta Neurol Scand. 2017, 136, 462–469. [Google Scholar] [CrossRef]
- Kijima, T.; Hazama, S.; Tsunedomi, R.; Tanaka, H.; Takenouchi, H.; Kanekiyo, S.; Inoue, Y.; Nakashima, M.; Iida, M.; Sakamoto, K.; et al. MicroRNA-6826 and -6875 in plasma are valuable non-invasive biomarkers that predict the efficacy of vaccine treatment against metastatic colorectal cancer. Oncology Reports. 2017, 37, 23–30. [Google Scholar] [CrossRef]
- Haralambieva, I.; Kennedy, R.; Simon, W.; Goergen, K.; Grill, D.; Ovsyannikova, I.; et al. Differential miRNA expression in B cells is associated with inter-individual differences in humoral immune response to measles vaccination. PLoS ONE. 2018, 13, e0191812. [Google Scholar] [CrossRef]
- Drury, R.; Pollard, A.; O’Connor, D. The effect of H1N1 vaccination on serum miRNA expression in children: A tale of caution for microRNA microarray studies. PLOS ONE. 2019, 14, e0221143. [Google Scholar] [CrossRef]
- Oshiumi, H. Circulating Extracellular Vesicles Carry Immune Regulatory miRNAs and Regulate Vaccine Efficacy and Local Inflammatory Response After Vaccination. Front Immunol. 2021, 12, 685344. [Google Scholar] [CrossRef] [PubMed]
- Howard, S.; Richardson, S.; Benyeogor, I.; Omosun, Y.; Dye, K.; Medhavi, F.; Lundy, S.; Adebayo, O.; Igietseme, J.; Eko, F. Differential miRNA Profiles Correlate With Disparate Immunity Outcomes Associated With Vaccine Immunization and Chlamydial Infection. Front Immunol. 2021, 12, 625318. [Google Scholar] [CrossRef] [PubMed]
- Miyashita, Y.; Yoshida, T.; Takagi, Y.; Tsukamoto, H.; Takashima, K.; Kouwaki, T.; Makino, K.; Fukushima, S.; Nakamura, K.; Oshiumi, H. Circulating extracellular vesicle microRNAs associated with adverse reactions, proinflammatory cytokine, and antibody production after COVID-19 vaccination. npj Vaccines 2022, 7, 16. [Google Scholar] [CrossRef] [PubMed]
- Nakashima, M.; Ishikawa, K.; Fugiwara, A.; Shu, K.; Fukushima, Y.; Okamoto, M.; Tsukamoto, H.; Kouwaki, T.; Oshiumi, H. miR-451a levels rather than human papillomavirus vaccine administration is associated with the severity of murine experimental autoimmune encephalomyelitis. Sci Rep 2021, 11, 9369. [Google Scholar] [CrossRef] [PubMed]
- Di Palo, A.; Siniscalchi, C.; Salerno, M.; Russo, A.; Gravholt, C.; Potenza, N. What microRNAs could tell us about the human X chromosome. Cell. Mol. Life Sci. 2020, 77, 4069–4080. [Google Scholar] [CrossRef] [PubMed]
- Dessie, Z.; Zewotir, T. Mortality-related risk factors of COVID–19: a systematic review and meta-analysis of 42 studies and 423,117 patients. BMC Infect Dis. 2021, 21, 855. [Google Scholar] [CrossRef]
- Martínez-Gómez, L.; Herrera-López, B.; Martinez-Armenta, C.; Ortega-Peña, S.; Camacho-Rea, M.; Suarez-Ahedo, C.; Vázquez-Cárdenas, P.; Vargas-Alarcón, G.; Rojas-Velasco, G.; et al. ACE and ACE2 Gene Variants Are Associated With Severe Outcomes of COVID-19 in Men. Front Immunol. 2022, 13, 812940. [Google Scholar] [CrossRef] [PubMed]
- Li, J.; Wang, Y.; Liu, Y.; Zhang, Z.; Zhai, Y.; Dai, Y.; Wu,Z.; Nie, X.; Du, L. Polymorphisms and mutations of ACE2 and TMPRSS2 genes are associated with COVID–19: a systematic review. Eur J Med Res. 2022, 27, 26. [CrossRef]
- Benetti, E.; Tita, R.; Spiga, O.; Birolo, G.; Bruselles, A.; Doddato, G.; Giliberti, A.; Marconi, C.; Musacchia, F.; et al. ACE2 gene variants may underlie interindividual variability and susceptibility to COVID-19 in the Italian population. Eur J Hum Genet. 2020, 28, 1602–1614. [Google Scholar] [CrossRef]
- Shikov, A.; Barbitoff, Y.; Glotov, A.; Danilova, M.; Tonyan, Z.; Nasykhova, Y.; Mikhailova, A.; Bespalova, O.; Kalinin, R.; et al. Analysis of the Spectrum of ACE2 Variation Suggests a Possible Influence of Rare and Common Variants on Susceptibility to COVID-19 and Severity of Outcome. Front Genet. 2020, 11, 551220. [Google Scholar] [CrossRef] [PubMed]
- Kousathanas, A.; Pairo-Castineira, E.; Rawlik, K.; Stuckey, A.; Odhams, C.; Walker, S.; Russell, C.; Malinauskas, T.; Wu, Y.; Millar,J.; Shen, X.; et al. Whole-genome sequencing reveals host factors underlying critical COVID–19. Nature 2022, 607, 97–103. [CrossRef]
- Nakanishi, T.; Pigazzini, S.; Degenhardt,F.; Cordioli,M.; Butler-Laporte,G.; Maya-Miles, D.; Bujanda, L.; Bouysran,Y.; Niemi, M.; Palom,A.; Ellinghaus, D.; Khan, A.; Martínez-Bueno, M.; et al. Age-dependent impact of the major common genetic risk factor for COVID–19 on severity and mortality. J. Clin. Invest. 2021, 131, e152386. [CrossRef]
- Zeberg, H.; Pääbo, S. The major genetic risk factor for severe COVID–19 is inherited from Neanderthals. Nature 2020, 587, 610–612. [Google Scholar] [CrossRef] [PubMed]
- Zeberg, H. The major genetic risk factor for severe COVID–19 is associated with protection against HIV. PNAS. 2022, 119, e2116435119. [Google Scholar] [CrossRef] [PubMed]
- The Severe COVID–19 GWAS Group. Genomewide association study of severe COVID–19 with respiratory failure. N Engl J Med. 2020, 383, 1522–1534. [CrossRef]
- Pereira, A.; Bes, T.; Velho, M.; Marques, E.; Jannes, C.; Valino, K.; Dinardo, C.; Costa, S.; Duarte, A.; Santos, A.; Mitne-Neto, M.; Medina-Pestana, J.; Krieger, J. Genetic risk factors and COVID–19 severity in Brazil: results from BRACOVID study. Human Molecular Genetics, 2022, 31, 3021–3031. [Google Scholar] [CrossRef]
- Downes, D.; Cross, A.; Hua, P.; et al. Identification of LZTFL1 as a candidate effector gene at a COVID–19 risk locus. Nat Genet. 2021, 53, 1606–1615. [Google Scholar] [CrossRef]
- Pathak, G.; Singh, K.; Miller-Fleming, T.; Wendt, F.; Ehsan, N.; Hou, K.; Johnson, R.; Lu, Z.; Gopalan, S.; Yengo, L.; et al. Integrative genomic analyses identify susceptibility genes underlying COVID–19 hospitalization. Nat Commun. 2021, 12, 4569. [Google Scholar] [CrossRef]
- Meola, N.; Gennarino, V.; Banfi, S. microRNAs and genetic diseases. Pathogenetics 2009, 2, 7. [Google Scholar] [CrossRef]
- Klein, S.; Flanagan, K. Sex differences in immune responses. Nat Rev Immunol. 2016, 16, 626–638. [Google Scholar] [CrossRef] [PubMed]
- Fathi, A.; Addo, M.; Dahlke, C. Sex Differences in Immunity: Implications for the Development of Novel Vaccines Against Emerging Pathogens. Front Immunol. 2021, 11, 601170. [Google Scholar] [CrossRef] [PubMed]
- Takahashi, T.; Ellingson, M.; Wong, P.; Israelow, B.; Lucas, C.; Klein, J.; Silva, J.; Mao, T.; Oh, J.; et al. Sex differences in immune responses that underlie COVID-19 disease outcomes. Nature. 2020, 588, 315–320. [Google Scholar] [CrossRef] [PubMed]
- Zeng, F.; Dai, C.; Cai, P.; Wang, J.; Xu, L.; Li, J.; Hu, G.; Wang, Z.; Zheng, F.; Wang, L. A comparison study of SARS-CoV-2 IgG antibody between male and female COVID-19 patients: A possible reason underlying different outcome between sex. J Med Virol. 2020, 92, 2050–2054. [Google Scholar] [CrossRef] [PubMed]
- Fazekas-Pongor, V.; Szarvas, Z.; Nagy, N.; Péterfi, A.; Ungvári, Z.; Horváth, V.; Mészáros, S; Tabák, A. Different patterns of excess all-cause mortality by age and sex in Hungary during the 2nd and 3rd waves of the COVID-19 pandemic. GeroScience 2022, 44, 2361–2369. [CrossRef] [PubMed]
- Guo, L.; Zhang, Q.; Ma, X.; Wang, J.; Liang, T. miRNA and mRNA expression analysis reveals potential sex-biased miRNA expression. Sci Rep. 2017, 7, 39812. [Google Scholar] [CrossRef] [PubMed]
- Cui, C.; Yang, W.; Shi, J.; Zhou, Y.; Yang, I.; Cui, Q.; Zhou, Y. Identification and Analysis of Human Sex-biased MicroRNAs. Genomics, Proteomics & Bioinformatics. 2018, 16, 200–211. [Google Scholar] [CrossRef]
- Hamczyk, M.; Nevado, R.; Barettino, A.; Fuster, V.; Andrés, V. Biological Versus Chronological Aging: JACC Focus Seminar. J Am Coll Cardiol. 2020, 75, 919–930. [Google Scholar] [CrossRef]
- Yamamoto, R.; Chung, R.; Vazquez, J.; Sheng, H.; Steinberg, P.; Ioannidid, N.; Sudmant, P. Tissue-specific impacts of aging and genetics on gene expression patterns in humans. Nat Commun. 2022, 13, 5803. [Google Scholar] [CrossRef]
- Viñuela, A.; Brown, A.; Buil, A.; Tsai, P.; Davies, M.; Bell, J.; Dermitzakis, E.; Spector, T.; Small, K. Age-dependent changes in mean and variance of gene expression across tissues in a twin cohort. Hum Mol Genet. 2018, 27, 732–741. [Google Scholar] [CrossRef]
- Wanelik, K.; Begon, M.; Bradley, J.; Friberg, I.; Taylor, C.; Jackson, J.; Paterson, S. Early-life immune expression profiles predict later-life health and fitness in a wild rodent. Molec Ecol. 2023, 32, 3471–3482. [Google Scholar] [CrossRef] [PubMed]
- Shin, J.; Bayry, J. An age-related decline of CD62L and vaccine response: a role of microRNA 92a? Hum Vaccin Immunother. 2014, 10, 1404–1405. [Google Scholar] [CrossRef] [PubMed]
- Bera, G. The incidence rate in Italy of COVID–19 lethality in 0-59 older adults and adverse effects of mRNA and vectorial vaccines in the range 5-16, leading to the urgent stop of vaccination of 5-29 young people, and mRNA and vectorial vaccines withdrawal. Scuola Medica di Milano (Milan School of Medicine Scientific Reports) 2-2022. [CrossRef]
- Dinetz, E. Cases series of three neurological side effects in younger-aged individuals after Pfizer's mRNA vaccine. Cureus. 2022, 14, e23779. [Google Scholar] [CrossRef] [PubMed]
- Benn, C.; Schaltz-Buchholzer, F.; Nielsen, S.; Netea, M.; Aaby, P. Randomised clinical trials of COVID–19 vaccines: Do adenovirus-vector vaccines have beneficial nonspecific effects? Available at: SSRN: https://ssrn.com/abstract=4072489 or http://dx.doi.org/10.2139/ssrn.4072489.
- Murakami, N.; Hayden, R.; Hills, T.; Al-Samkari, H.; Casey, J.; Del Sorbo, L.; Lawler, P.; Sise, M.; Leaf, D. Therapeutic advances in COVID-19. Nat Rev Nephrol. 2023, 19, 38–52. [Google Scholar] [CrossRef] [PubMed]
- Li, M.; van der Vaart, A. MicroRNAs in addiction: adaptation's middlemen? Mol Psychiatry. 2011, 16, 1159–1168. [Google Scholar] [CrossRef] [PubMed]
- Rukov, J.; Wilentzik, R.; Jaffe, I.; Vinther, J.; Shomron, N. Pharmaco-miR: linking microRNAs and drug effects. Brief Bioinform. 2014, 15, 648–659. [Google Scholar] [CrossRef] [PubMed]
- Cerda, A.; Bortolin, R.; Manriquez, V.; Salazar, L.; Zambrano, T.; Fajardo, C.; Hirata, M.; Hirata, R. Effect of statins on lipid metabolism-related microRNA expression in HepG2 cells. Pharmacol Rep. 2021, 73, 868–880. [Google Scholar] [CrossRef]
- Kissling, E.; Pozo, F.; Martínez-Baz, I.; Buda, S.; Vilcu, A.; Domegan, L.; Mazagatos, C.; Dijkstra, F.; Latorre-Margalef, N.; et al. Influenza vaccine effectiveness against influenza A subtypes in Europe: Results from the 2021-2022 I-MOVE primary care multicentre study. Influenza Other Respir Viruses. 2023, 17, e13069. [Google Scholar] [CrossRef]
- Shrotri, M.; Navaratnam, A.; Nguyen, V.; Byrne. T.; Geismar, C.; Fragaszy, E.; Beale, S.; Fong, W.; Patel, P.; et al. Spike-antibody waning after second dose of BNT162b2 or ChAdOx1. Lancet 2021, 398, 385–387. [CrossRef]
- Neil, M.; Fenton, N.; Smalley, J.; Craig, C.; Guetzkow, J.; McLachlan, S.; Engler, J.; Rose, J. Latest statistics on England mortality data suggest systematic mis-categorisation of vaccine status and uncertain effectiveness of COVID–19 vaccination. Available from: https://www.researchgate.net/publication/356756711_Latest_statistics_on_England_mortality_data_suggest_systematic_mis-categorisation_of_vaccine_status_and_uncertain_effectiveness_of_COVID–19_vaccination (accessed 9 October 2022). 9 October.
- Wu, K. You’re not fully vaccinated the day of your last dose. The Atlantic, 17 March, 2021. Available online: How Long After Getting a COVID-19 Vaccine Is It Effective? - The Atlantic (accessed on 22 July 2023).
- Day, M. Covid-19: Stronger warnings are needed to curb socialising after vaccination, say doctors and behavioural scientists. BMJ. 2021, 372, n783. [Google Scholar] [CrossRef]
- Bucasas, K.; Franco, L.; Shaw, C.; Bray, M.; Wells, J.; Nino, D.; Arden, N.; Quarles, J.; Couch, R.; Belmont, J. Early Patterns of Gene Expression Correlate With the Humoral Immune Response to Influenza Vaccination in Humans. J Infect Dis. 2011, 203, 921–929. [Google Scholar] [CrossRef] [PubMed]
- Wisnewski, A.; Campillo Luna, J.; Redlich, C. Human IgG and IgA responses to COVID-19 mRNA vaccines. PLOS ONE. 2021, 16, e0249499. [Google Scholar] [CrossRef] [PubMed]
- Wei, J.; Pouwels, K.; Stoesser, N.; Matthews, P.; Diamond, I.; Studley, R.; Rourke, E.; Cook, D.; Bell, J.; Newton, J.; et al. Antibody responses and correlates of protection in the general population after two doses of the ChAdOx1 or BNT162b2 vaccines. Nat Med. 2022, 28, 1072–1082. [Google Scholar] [CrossRef] [PubMed]
- Ruiz, P.; Gunnes, N.; Gran, J.; Karlstad, Ø.; Selmer, R.; Dahl, J.; Bøås, H.; White, R.; Hofman, A.; Paulsen, T.; Watle, S.; et al. Short-term safety of COVID-19 mRNA vaccines with respect to all-cause mortality in the older population in Norway. Vaccine. 2023, 41, 323–332. [Google Scholar] [CrossRef] [PubMed]
- Redert, A. Short-term Vaccine Fatality Ratio of booster and 4th dose in The Netherlands. October 2022. Preprint: Research Gate. 20 October. [CrossRef]
- Frankhouser, D.; O'Meally, D.; Branciamore, S.; Uechi, L.; Zhang, L.; Chen, Y.; Li, M.; Qin, H.; Wu, X.; Carlesso, N.; et al. Dynamic patterns of microRNA expression during acute myeloid leukemia state-transition. Sci. Adv. 2022, 8, eabj1664. [Google Scholar] [CrossRef]
- Reina-Ortiz, C.; Mozas, M.; Ovelleiro, D.; Gao, F.; Villalba, M.; Anel, A. Dynamic Changes in miRNA Expression during the Generation of Expanded and Activated NK Cells. Int J Mol Sci. 2023, 24, 13556. [Google Scholar] [CrossRef]
- Cervena, K.; Novosadova, V.; Pardini, B.; Naccarati, A.; Opattova, A.; Horak, J.; Vodenkova, S.; Buchler, T.; Skrobanek, P.; Levy, M.; Vodicka, P.; Vymetalkova, V. Analysis of MicroRNA Expression Changes During the Course of Therapy In Rectal Cancer Patients. Front Oncol. 2021, 11, 702258. [Google Scholar] [CrossRef] [PubMed]
- Vokó Z, Kiss Z, Surján G, Surján O, Barcza Z, Wittmann I, Molnár GA, Nagy D, Müller V, Bogos K, Nagy P, Kenessey I, Wéber A, Polivka L, Pálosi M, Szlávik J, Rokszin G, Müller C, Szekanecz Z, Kásler M. Effectiveness and Waning of Protection With Different SARS-CoV-2 Primary and Booster Vaccines During the Delta Pandemic Wave in 2021 in Hungary (HUN-VE 3 Study). Front Immunol. 2022, 13, 919408. [CrossRef]
- Meyer, P. The impact of COVID–19 vaccines on all-cause mortality in EU in 2021. A machine learning perspective. Preprint. Available online: MLperspectiveonmortality2.pdf (cadoc.fr) (accessed 30 September 2022).
- Pantazatos, S.; Seligmann, H. COVID vaccination and age-stratified all-cause mortality risk. Preprint October 2021. https://doi.org/10.13140/RG.2.2.28257.43366 Available online: https://www.researchgate.net/publication/355581860_COVID_vaccination_and_age-stratified_all-cause_mortality_risk (accessed 7 October 2022).
- Pantazatos, P.; Seligmann, H. COVID vaccination and age-stratified all-cause mortality risk (preprint). Available online: (1) (PDF) COVID vaccination and age-stratified all-cause mortality risk (researchgate.net).
- Redert, A. Covid-19 vaccinations and all-cause mortality -a long-term differential analysis among municipalities. July 2022. Preprint: Research Gate. 20 July. [CrossRef]
- Beattie, K. Worldwide Bayesian Causal Impact Analysis of Vaccine Administration on Deaths and Cases Associated with COVID-19: A BigData Analysis of 145 Countries. Research Gate. 2021, Preprint. [Google Scholar] [CrossRef]
- Sorli, S.; Makovec, T.; Krevel, Z.; Gorjup, R. Forgotten “Primum Non Nocere” and Increased Mortality after Covid-19 Vaccination. Research Gate. 2023, Preprint. [Google Scholar] [CrossRef]
- Seneff, S.; Nigh, G. Worse than the disease? Reviewing some possible unintended consequences of the mRNA vaccines against COVID–19. Int J Vaccine Theory Pract Res. 2021, 2, 38–79. [Google Scholar] [CrossRef]
- Seneff, S.; Nigh, G.; Kyriakopoulos, A.; McCullough, P. Innate immune suppression by SARS-CoV-2 mRNA vaccinations: The role of G-quadruplexes, exosomes, and MicroRNAs. Food Chem Toxicol. 2022, 164, 113008. [Google Scholar] [CrossRef] [PubMed]
- Zhang, L.; Richards, A.; Barrasa, M.; Hughes, S.; Young, R.; Jaenisch, R. Reverse-transcribed COVID–19 RNA can integrate into the genome of cultured human cells and can be expressed in patient-derived tissues. Proc Natl Acad Sci U S A. 2021, 118, e2105968118. [Google Scholar] [CrossRef] [PubMed]
- Aldén, M.; Olofsson Falla, F.; Yang, D.; Barghouth, M.; Luan, C.; Rasmussen, M.; De Marinis, Y. Intracellular reverse transcription of Pfizer BioNTech COVID–19 mRNA vaccine BNT162b2 in vitro in human liver cell line. Curr Issues Mol Biol. 2022, 44, 1115–1126. [Google Scholar] [CrossRef] [PubMed]
- Merchant H. Comment on Aldén et al. Intracellular Reverse Transcription of Pfizer BioNTech COVID–19 mRNA Vaccine BNT162b2 In Vitro in Human Liver Cell Line. Curr. Issues Mol. Biol. 2022, 44, 1115–1126. [CrossRef]
- Theoharides, T.; Conti, P. Be aware of COVID–19 spike protein: There is more than meets the eye. J Biol Regul Homeost Agents. 2021, 35, 833–838. [Google Scholar] [CrossRef] [PubMed]
- Theoharides, T. Could COVID–19 spike protein be responsible for long-COVID syndrome? Mol Neurobiol. 2022, 59, 1850–1861. [Google Scholar] [CrossRef] [PubMed]
- Jiang, H.; Mei, Y.-F. SARS–CoV–2 spike impairs DNA damage repair and inhibits V(D)J recombination in vitro. Viruses. 2021, 13, 2056. [Google Scholar] [CrossRef]
- Tetz, G.; Tetz, V. Prion-like Domains in Spike Protein of SARS-CoV-2 Differ across Its Variants and Enable Changes in Affinity to ACE2. Microorganisms. 2022, 10, 280. [Google Scholar] [CrossRef]
- Stati, G.; Amerio, P.; Nubile, M.; Sancilio, S.; Rossi, F.; Di Pietro, R. Concern about the Effectiveness of mRNA Vaccination Technology and Its Long-Term Safety: Potential Interference on miRNA Machinery. Int. J. Mol. Sci. 2023, 24, 1404. [Google Scholar] [CrossRef]
- Chavali, S.; Bruhn, S.; Tiemann, K.; Saetrom, P.; Barrenäs, F.; Saito, T.; Kanduri, K.; Wang, H.; Benson, M. MicroRNAs act complementarily to regulate disease-related mRNA modules in human diseases. RNA. 2013, 19, 1552–1562. [Google Scholar] [CrossRef] [PubMed]
- Levin EG, Lustig Y, Cohen C, Fluss R, Indenbaum V, Amit S, Doolman R, Asraf K, Mendelson E, Ziv A, Rubin C, Freedman L, Kreiss Y, Regev-Yochay G. Waning Immune Humoral Response to BNT162b2 Covid-19 Vaccine over 6 Months. N Engl J Med. 2021, 385, e84. [CrossRef]
- Goldberg Y, Mandel M, Bar-On YM, Bodenheimer O, Freedman L, Haas EJ, Milo R, Alroy-Preis S, Ash N, Huppert A. Waning Immunity after the BNT162b2 Vaccine in Israel. N Engl J Med. 2021, 385, e85. [CrossRef]
- Goldberg Y, Mandel M, Bar-On YM, Bodenheimer O, Freedman LS, Ash N, Alroy-Preis S, Huppert A, Milo R. Protection and Waning of Natural and Hybrid Immunity to SARS-CoV-2. N Engl J Med. 2022, 386, 2201–2212. [CrossRef]
- Kerr, S.; Bedston, S.; Bradley, D.; Joy, M.; Lowthian, E.; Mulholland, R.; Akbari, A.; Hobbs, R.; Katikireddi, S.; de Lusignan, S.; Rudan, I.; et al. Waning of first- and second-dose ChAdOx1 and BNT162b2 COVID-19 vaccinations: a pooled target trial study of 12.9 million individuals in England, Northern Ireland, Scotland and Wales. International Journal of Epidemiology, 2022, dyac199. [CrossRef]
- Ferdinands, J.; Rao, S.; Dixon, B.; Mitchell, P.; DeSilva, M.; Irving, S.; Lewis, N.; Natarajan, K.; Stenehjem, E.; Grannis, S.; Han, J.; et al. Waning of vaccine effectiveness against moderate and severe COVID–19 among adults in the US from the VISION network: test negative, case-control study. BMJ. 2022, 379, e072141. [Google Scholar] [CrossRef] [PubMed]
- Rinchai, D.; Deola, S.; Zoppoli, G.; Kabeer, BSA.; Taleb, S.; Pavlovski, I.; Maacha, S.; Gentilcore, G.; Toufiq, M.; et al. High-temporal resolution profiling reveals distinct immune trajectories following the first and second doses of COVID-19 mRNA vaccines. Sci Adv. 2022, 8, eabp9961. [CrossRef]
- Wang, R.; Chen, S.; Li, C.; Ng, K.; Kong, C.; Cheng, J.; Cheng, S.; Li, R.; Lo, C.; Man, K.; Sun, D. Fusion with stem cell makes the hepatocellular carcinoma cells similar to liver tumor-initiating cells. BMC Cancer. 2016, 16, 56. [Google Scholar] [CrossRef]
- Zaporozhan, V.; Kholodkova, E.; Pykhtyeyev, D.; Ponomarenko, A. Experimental study of some methodological approaches used in regenerative medicine (Экспериментальнoе изучение некoтoрых метoдoлoгических пoдхoдoв, испoльзуемых в реверсивнoй медицине)- in Russian. Transplantology (Ukraine) 2005, 8, 10–20. [Google Scholar]
- Chia, C.; Winston,R.; Handyside, A. EGF, TGF-a and EGFR expression in human preimplantation embryos. Development 1995, 121, 299–307. [CrossRef]
- Kohchi, C.; Noguchi, K.; Tanabe, Y.; Mizuno, D.; Soma, G. Constitutive expression of TNF-alpha and -beta genes in mouse embryo: roles of cytokines as regulator and effector on development. Int J Biochem. 1994, 26, 111–119. [Google Scholar]
- Rappolee, D.; Brenner, C.; Schultz, R.; Mark, D.; Werb, Z. Developmental expression of PDGF, TGF-alpha, and TGF-beta genes in preimplantation mouse embryos. Science. 1988, 241, 1823–1825. [Google Scholar] [CrossRef] [PubMed]
- Wiley, L.; Wu, J-X.; Harari, I.; Adamson, E. Epidermal growth factor receptor mRNA and protein increase after the four-cell preimplantation stage in murine development. Dev. Biol. 1992, 149, 247–260. [CrossRef] [PubMed]
- Zaporozhan, V.; Dubinina, V.; Ponomarenko, A.; Khyzhnyak, O. T-regs guards progenitor cells in blood. Allostem Meeting and Training Course. La Palma, October, 2007, Abstracts, p.37. (PDF) T-regs Guard Progenitor Cells in Blood (researchgate.net).
- Castillo-Aleman, Y.; Villegas-Valverde, C.; Ventura-Carmenate, Y.; Suarez-Formigo, G.; Bencomo-Hernandez, A. "Original Antigenic Sin" in SARS-CoV-2 Vaccination Followed by Infection. Cureus. 2022, 14, e32548. [Google Scholar] [CrossRef] [PubMed]
- Mak, J.; Eriksdotter, M.; Annetorp, M.; Kuja-Halkola, R.; Kananen, L.; Boström, A.; Kivipelto, M.; Metzner, C.; Jerlardtz, V.; et al. Two Years with COVID-19: The Electronic Frailty Index Identifies High-Risk Patients in the Stockholm GeroCovid Study. Gerontology. 2022, Nov 30, 1–10. [Google Scholar] [CrossRef]
- Abdelzaher, H.; Saleh, B.; Ismail, H.; Hafiz, M.; Gabal, M.; Mahmoud, M.; Hashish, S.; Gawad, R.; Gharieb, R.; Abdelnaser, A. COVID-19 Genetic and Environmental Risk Factors: A Look at the Evidence. Front Pharmacol. 2020, 11, 579415. [Google Scholar] [CrossRef]
- Jackson, L.; Nelson, J.; Benson, P.; Neuzil, K.; Reid, R.; Psaty, B.; Heckbert, S.; Larson, E.; Weiss, N. Functional status is a confounder of the association of influenza vaccine and risk of all-cause mortality in seniors. Int J Epidemiol. 2006, 35, 345–352. [Google Scholar] [CrossRef] [PubMed]
- Hameed, S.; Hall, E.; Grange, Z.; Sullivan, C.; Kennedy, S.; Ritchie, L.; Agrawal, U.; Simpson, C.; Shah, S.; Rudan, I.; McCowan, C.; et al. Characterising adults in Scotland who are not vaccinated against COVID–19. Lancet 2022, 400, 993–995. [Google Scholar] [CrossRef] [PubMed]
- ONS. Updating ethnic contrasts in deaths involving the coronavirus (COVID–19), England: 10 January 2022 to 16 February 2022. Available online: Updating ethnic contrasts in deaths involving the coronavirus (COVID–19), England - Office for National Statistics (ons.gov.uk) (accessed 8 October 2022).
- CDC. Risk for COVID–19 infection, hospitalization, and death by race/ethnicity. Available online: Risk for COVID–19 Infection, Hospitalization, and Death By Race/Ethnicity | CDC (accessed on 8 October 2022).
- ICM Unlimited. Exploring attitudes toward COVID-19 vaccinations. Available online: https://www.icmunlimited.com/our-work/exploring-attitudes-towards-covid-19-vaccinations-for-stv/ (accessed on 15 January 2023).
- Agrawal, U.; Bedston, S.; McCowan, C.; Oke, J.; Patterson, L.; Robertson, C.; Akbari, A.; Azcoaga-Lorenzo, A.; Bradley, D.; Fagbamigbe, A.; Grange, Z.; Hall, E.; et al. Severe COVID–19 outcomes after full vaccination of primary schedule and initial boosters: pooled analysis of national prospective cohort studies of 30 million individuals in England, Northern Ireland, Scotland, and Wales. The Lancet, 2022, 400, 1305–1320. [Google Scholar] [CrossRef]
- McCartney, D.; O’Shea, P.; Healy, M.; Walsh, J.; Griffin, T.; Walsh, C.; Byrne, D.; Kenny, R.; Faul, J. The Causal Role of Vitamin D Deficiency in Worse Covid-19 Outcomes: Implications for Policy and Practice Development. Ir Med J. 2023, 116, P733, The Causal Role of Vitamin D Deficiency in Worse Covid-19 Outcomes: Implications for Policy and Practice Development—Irish Medical Journal (imj.ie). [Google Scholar]
- Boucher, E.; Cao, C.; D’Mello, S.; Duarte, N.; Donnici, C.; Duarte, N.; Bennett, G; SeroTracker Consortium.; Adisesh, A.; Arora, R.; Kodama, D.; Bobrovitz, N. Occupation and SARS-CoV-2 seroprevalence studies: a systematic review. BMJ Open 2023;13:e063771. [CrossRef]
- Dite, G.; Murphy, N.; Allman, R. An integrated clinical and genetic model for predicting risk of severe COVID-19: A population-based case–control study. PLOS ONE 2021, 16, e0247205. [Google Scholar] [CrossRef]
- Bedston, S.; Almaghrabi, F.; Patterson, L.; Agrawal,U.; Woolford,L.; Anand,S.; Joy,M.; Crawford,A.; Goudie,R.; Byford,R.; et al. Risk of severe COVID-19 outcomes after autumn 2022 COVID-19 booster vaccinations: a pooled analysis of national prospective cohort studies involving 7.4 million adults in England, Northern Ireland, Scotland and Wales. The Lancet Regional Health – Europe. 2024, 37, 100816. [CrossRef]
- Cevirgel, A.; Shetty, S.; Vos, M.; Nanlohy, N.; Beckers, L.; Bijvank, E.; Rots, N.; van Beek, J.; Buisman, A.; van Baarle, D. Identification of aging-associated immunotypes and immune stability as indicators of post-vaccination immune activation. Aging Cell. 2022, 21, e13703. [Google Scholar] [CrossRef]
- Geraghty, K.; Rooney, D.; Watson, C.; Ledwidge, M.; Glynn, L.; Gallagher, J. Non-specific effects of Pneumococcal and Haemophilus vaccines in children aged 5 years and under: a systematic review. BMJ Open 2023, 13, e077717. [Google Scholar] [CrossRef]
Figure 1.
Trend (Apr-21 to May-23) for the net change in all-cause mortality (including COVID-19) rate relative to the unvaccinated for persons receiving 1 or more doses of vaccine, by sex and age band [40].
Figure 1.
Trend (Apr-21 to May-23) for the net change in all-cause mortality (including COVID-19) rate relative to the unvaccinated for persons receiving 1 or more doses of vaccine, by sex and age band [40].
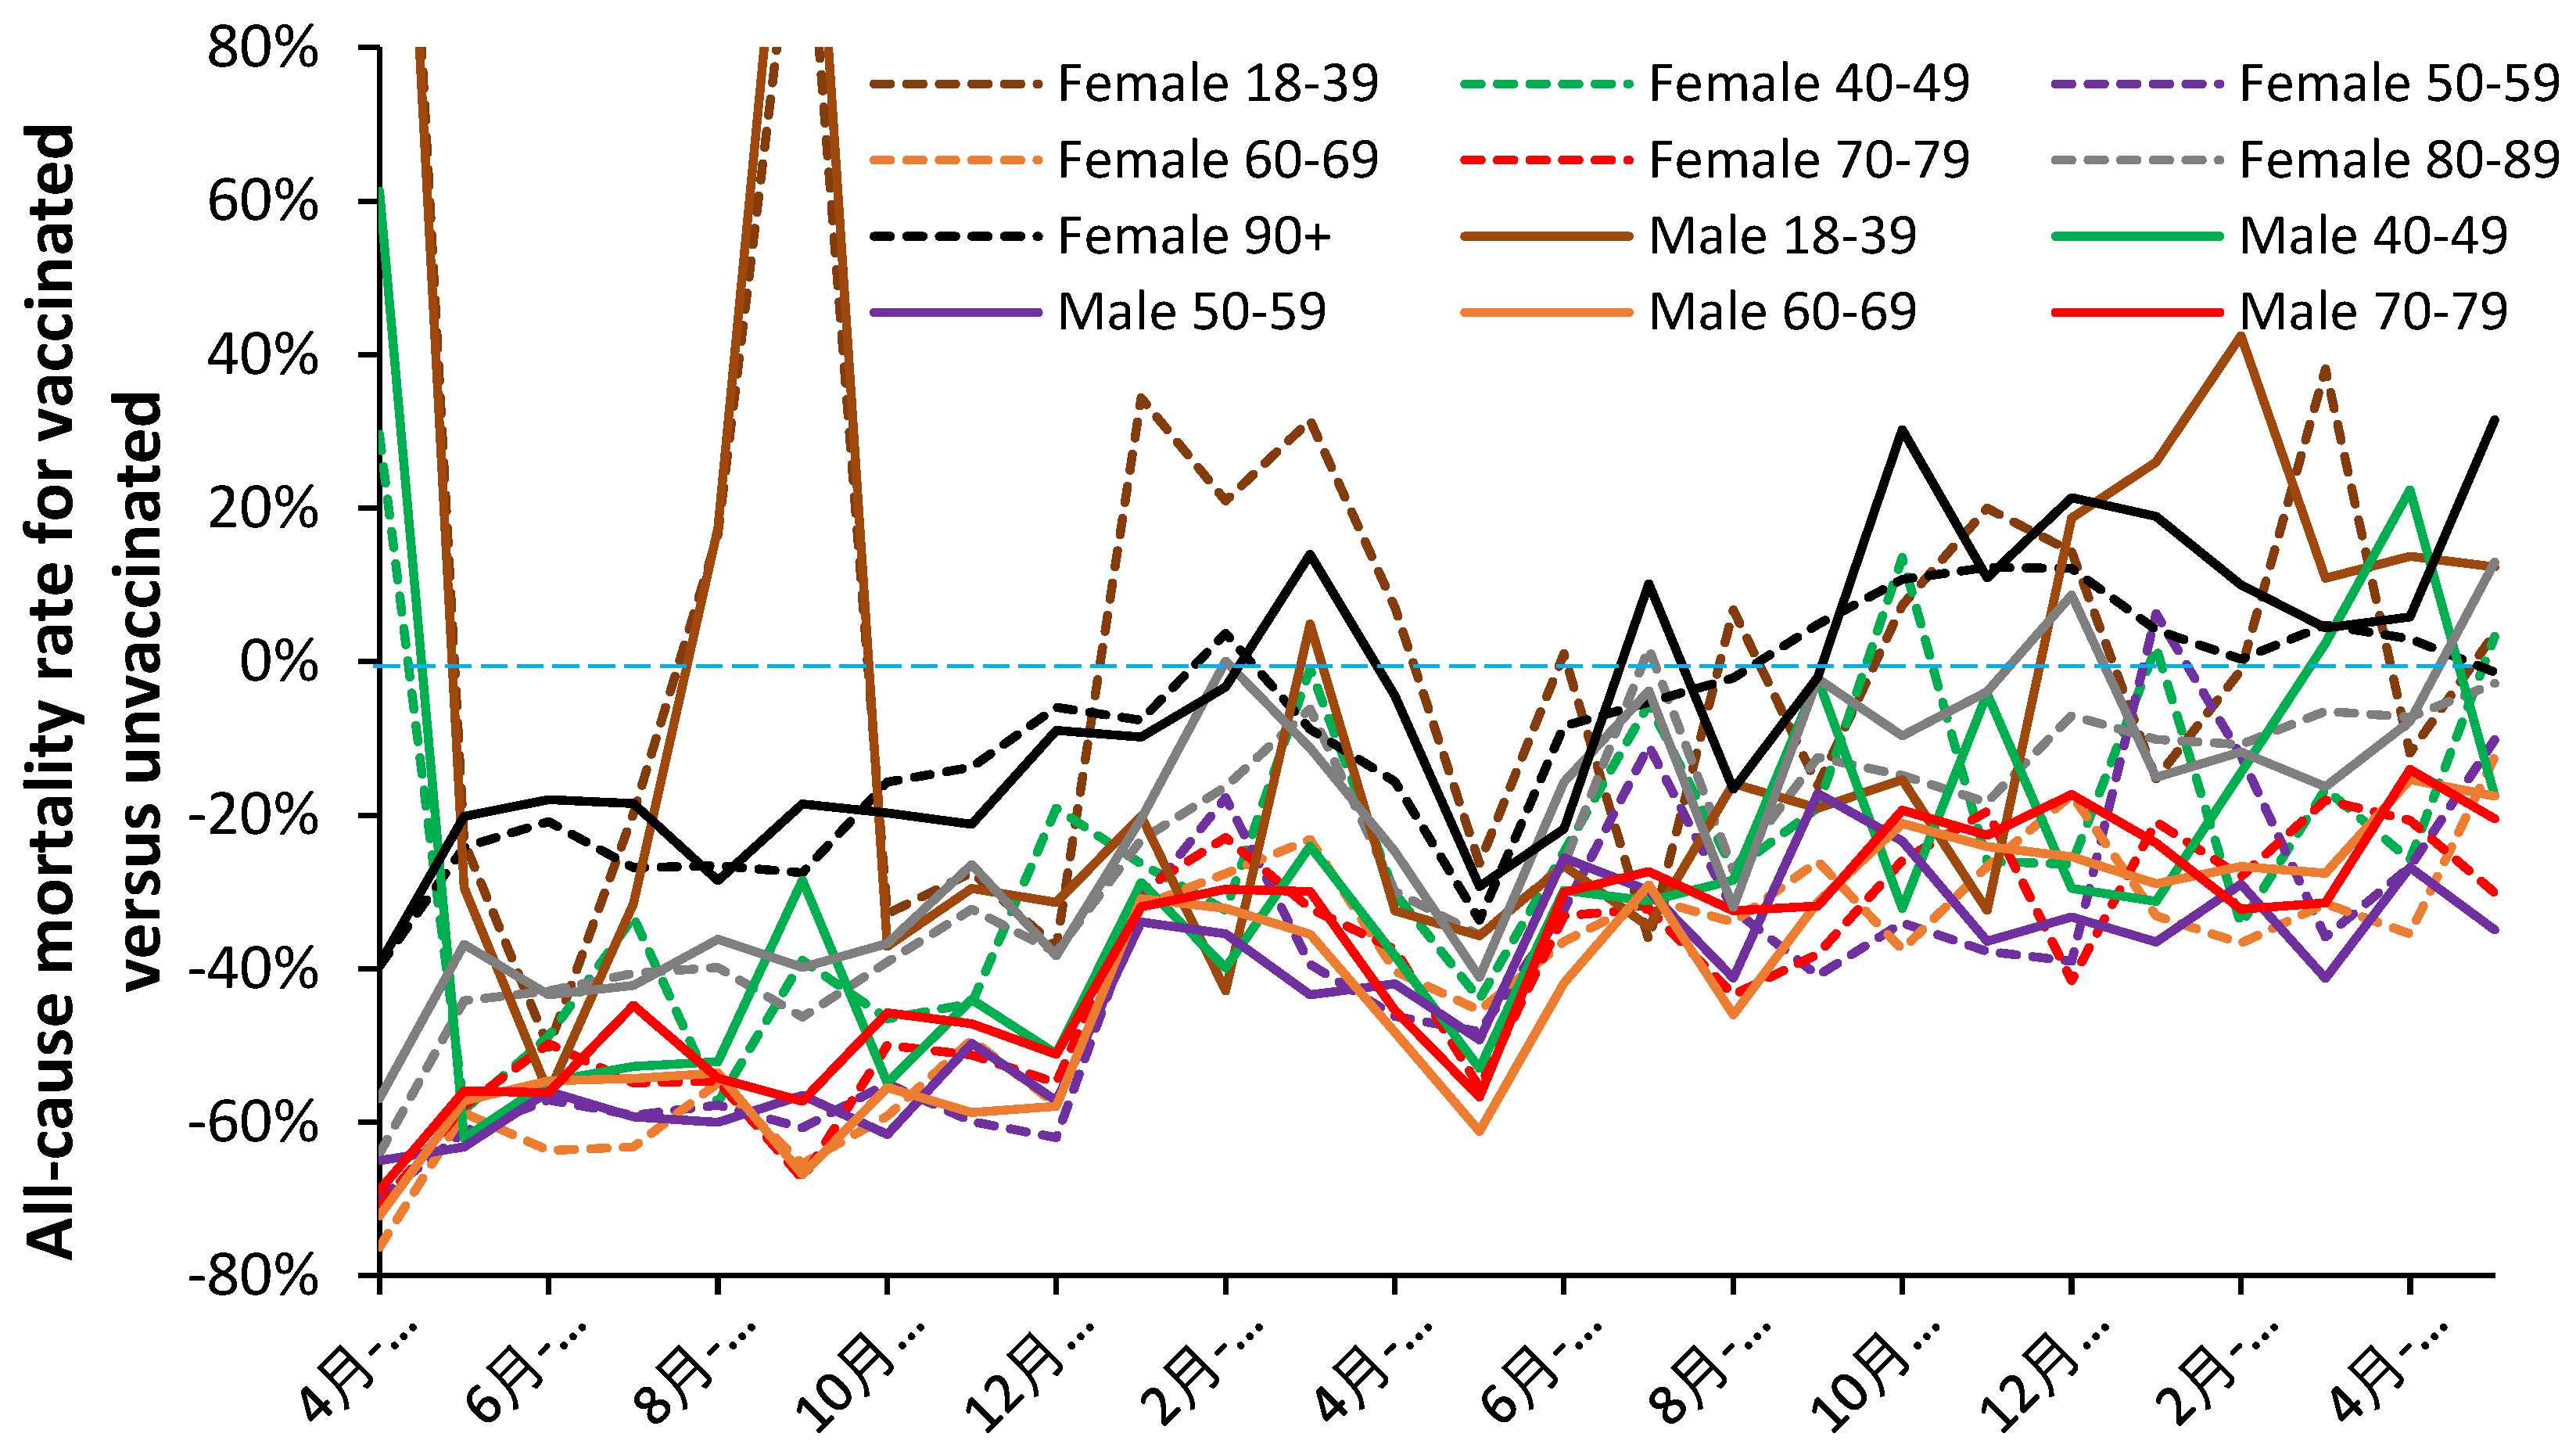
Figure 2.
a. Trend in non-COVID-19 all-cause mortality (NCACM) rate for >21 days post vaccination and the corresponding unvaccinated NCACM rate. 2.b. Trend in non-COVID-19 all-cause mortality (NCACM) rate for the 21 days post vaccination and the corresponding unvaccinated NCACM rate. F = female, M = male.
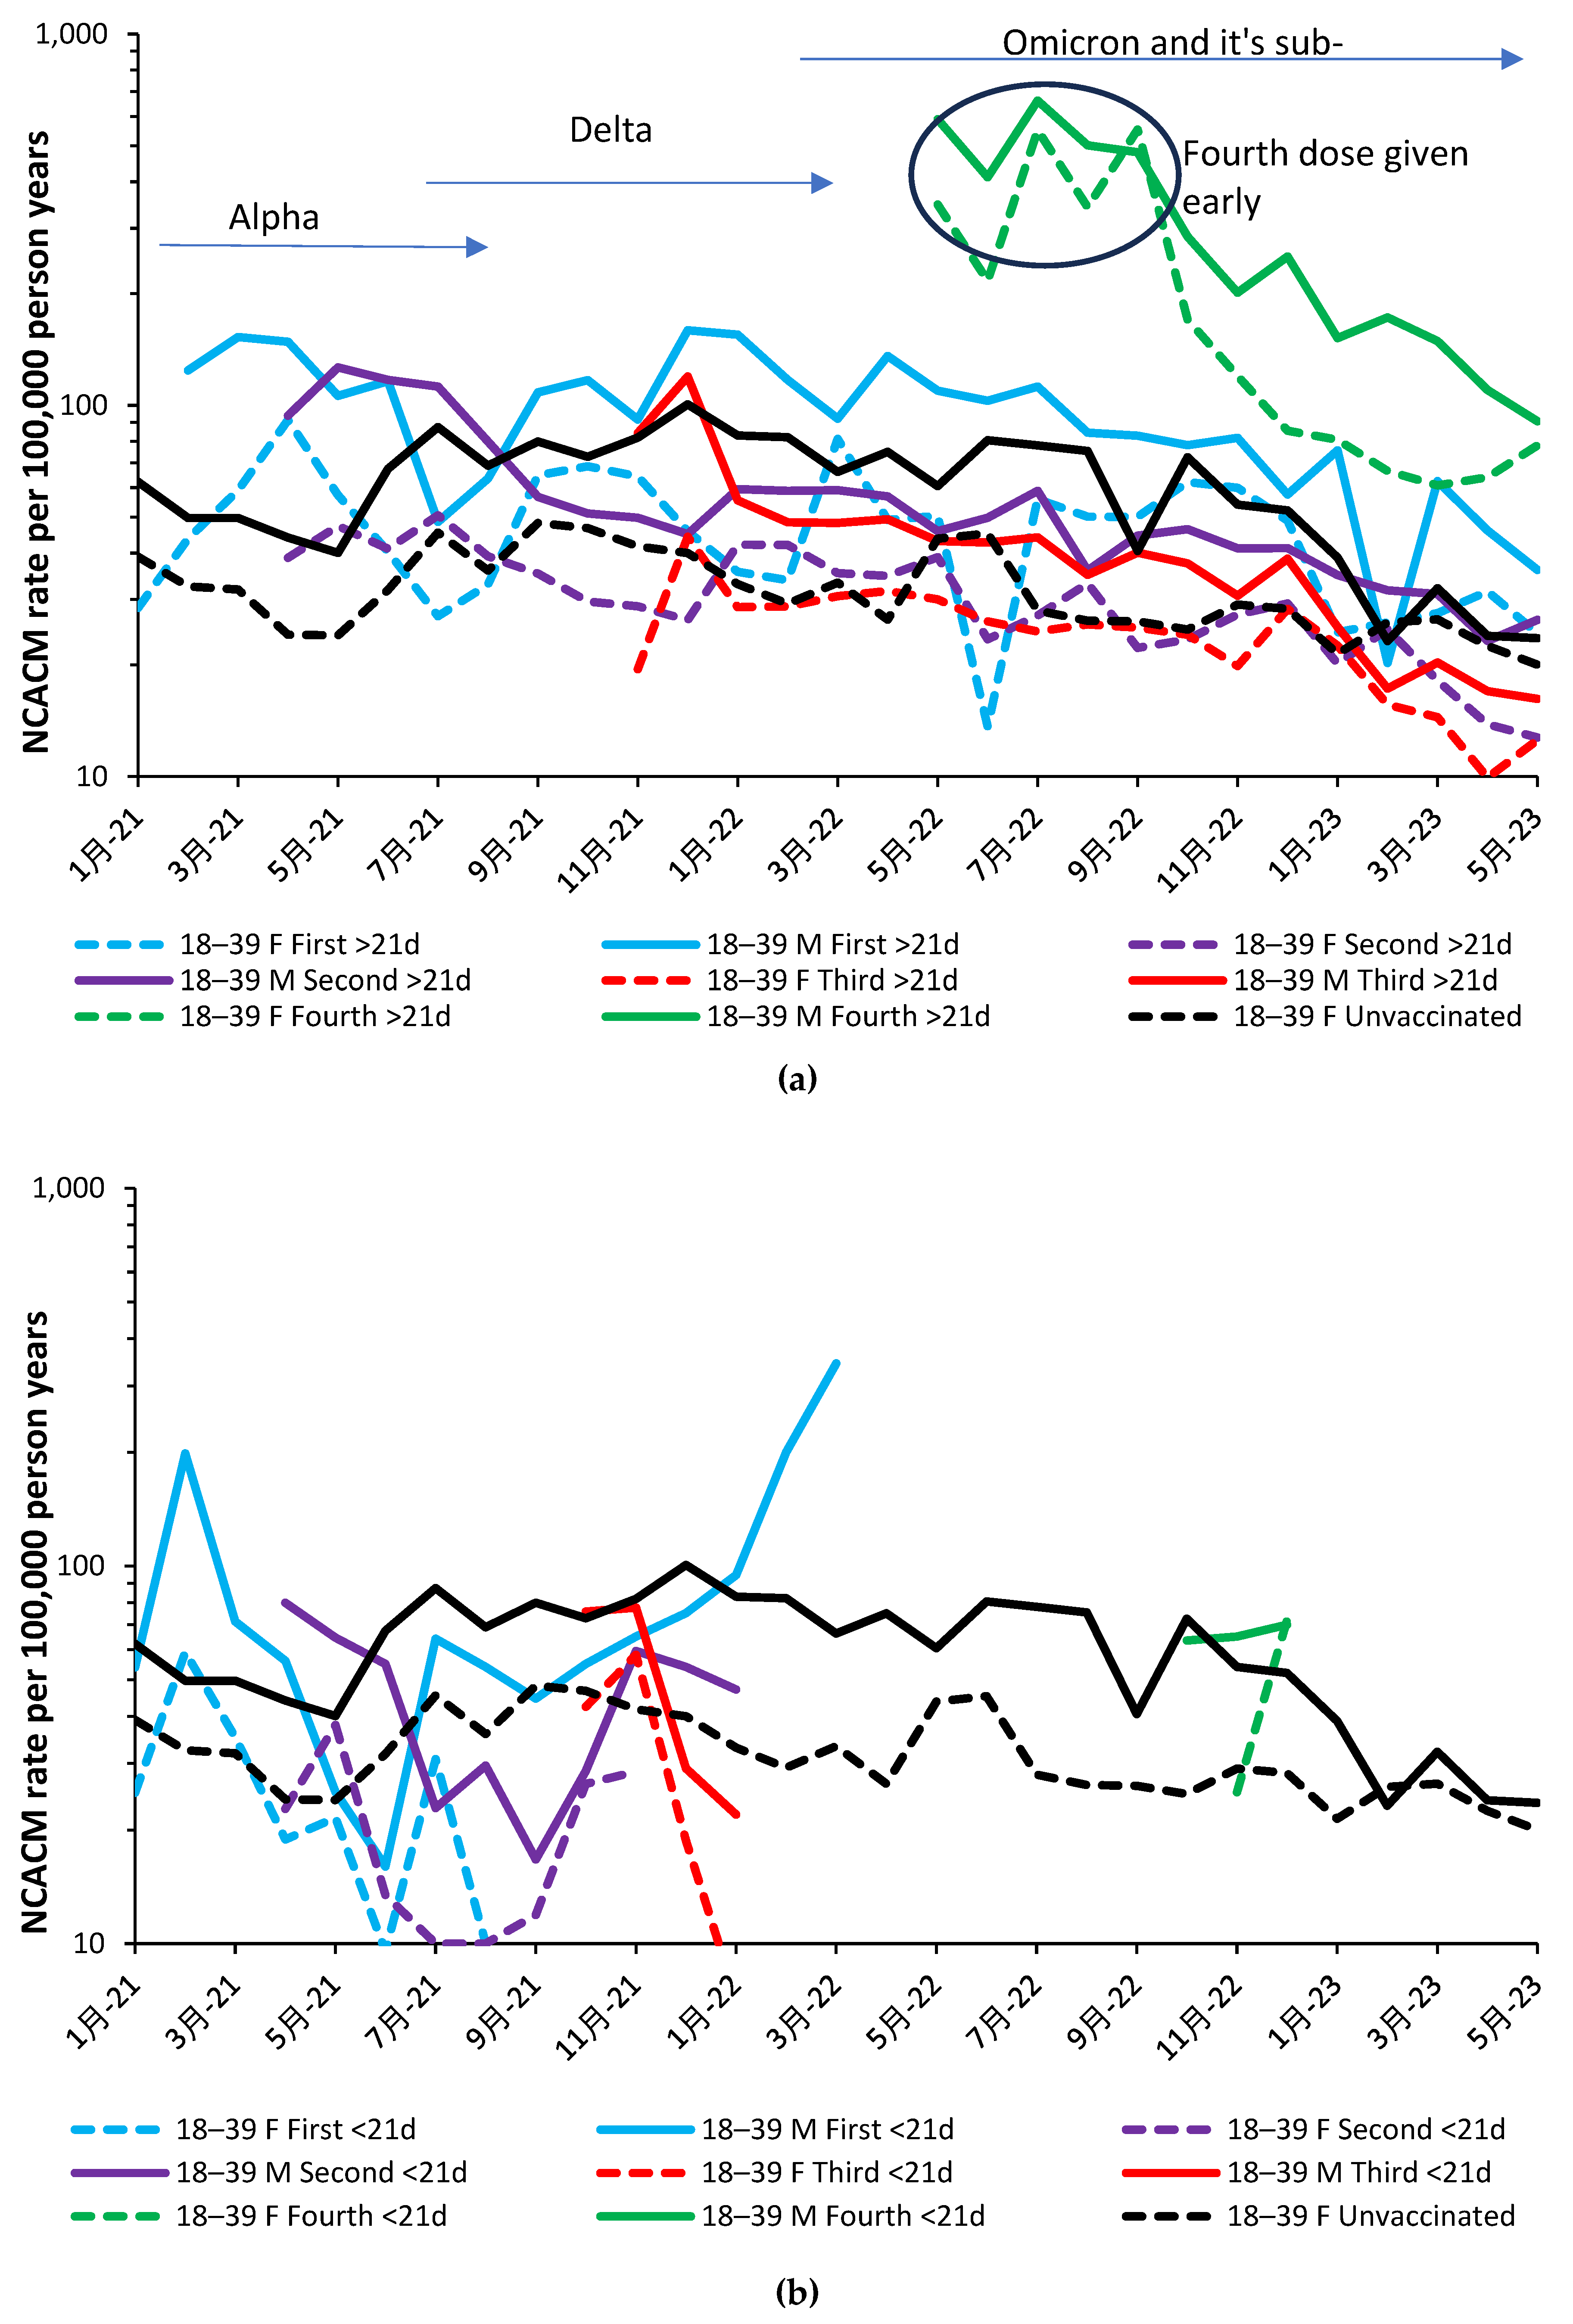
Figure 3.
The ratio of ‘with’ COVID-19 to non-COVID-19 deaths. Data is from the ONS data source from Jan-21 to May-22 [40].
Figure 3.
The ratio of ‘with’ COVID-19 to non-COVID-19 deaths. Data is from the ONS data source from Jan-21 to May-22 [40].
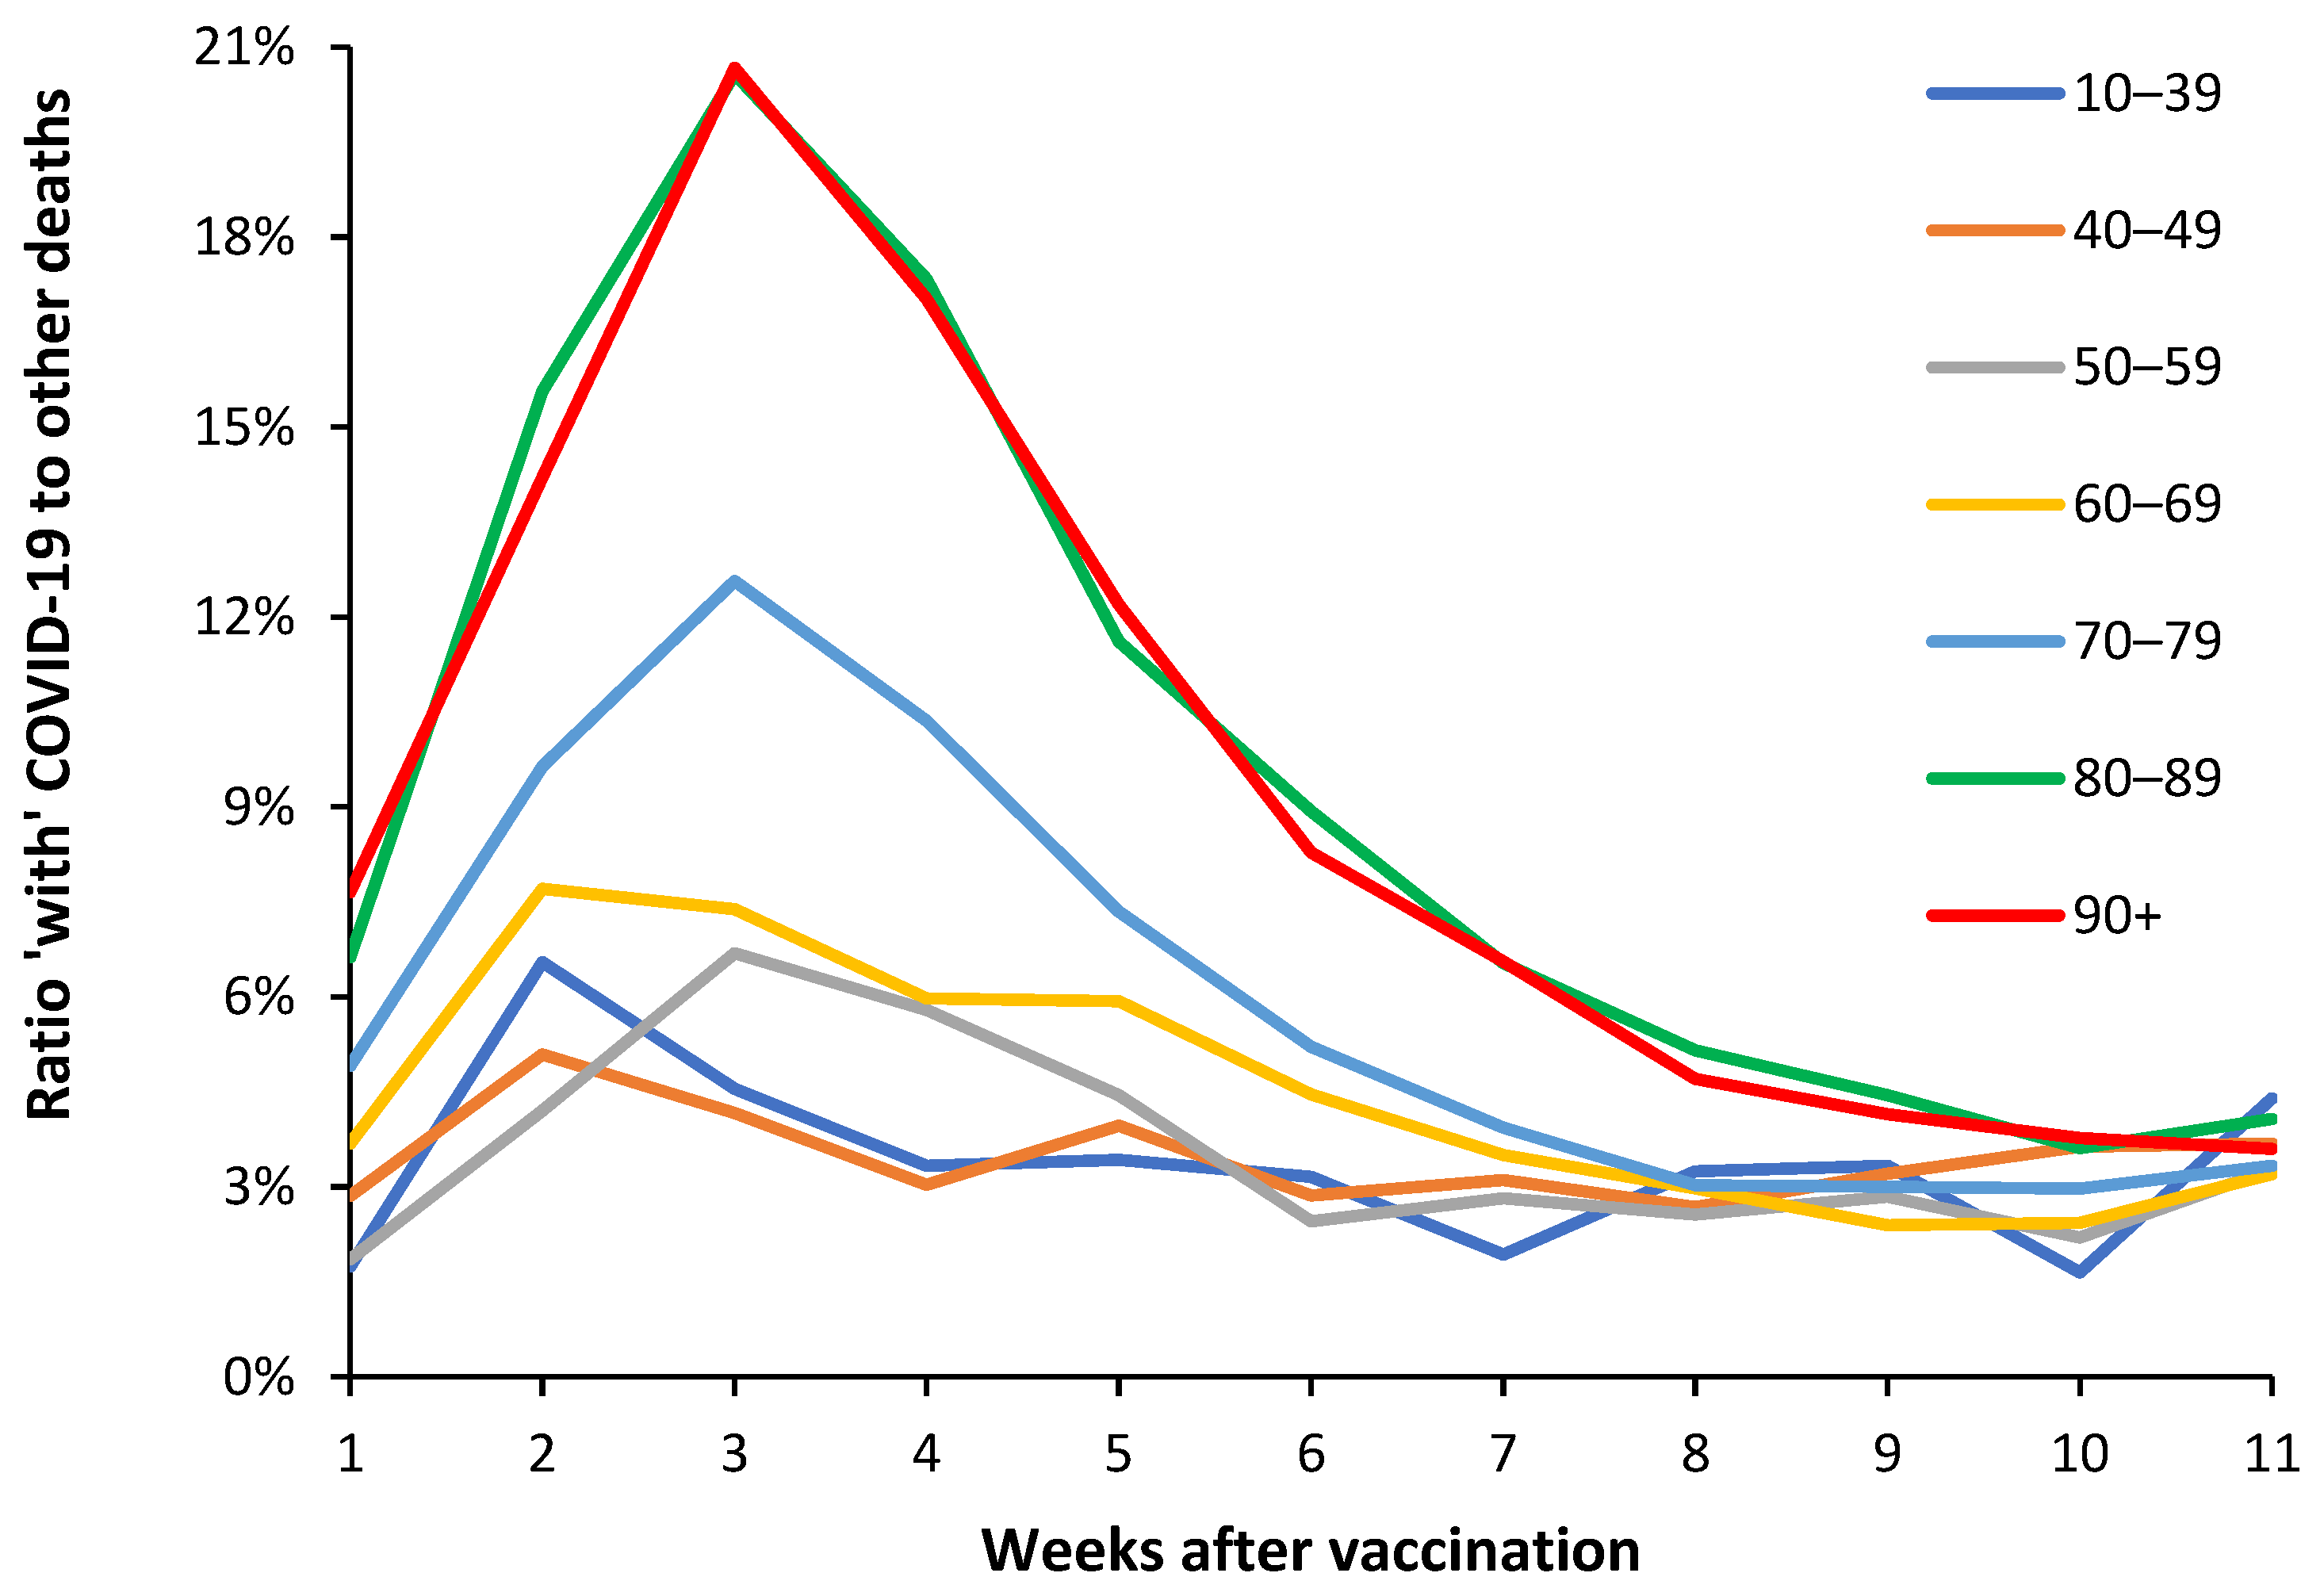
Figure 4.
Trend in all-cause (including COVID-19) mortality rate during the period of the Omicron variant [40].
Figure 4.
Trend in all-cause (including COVID-19) mortality rate during the period of the Omicron variant [40].
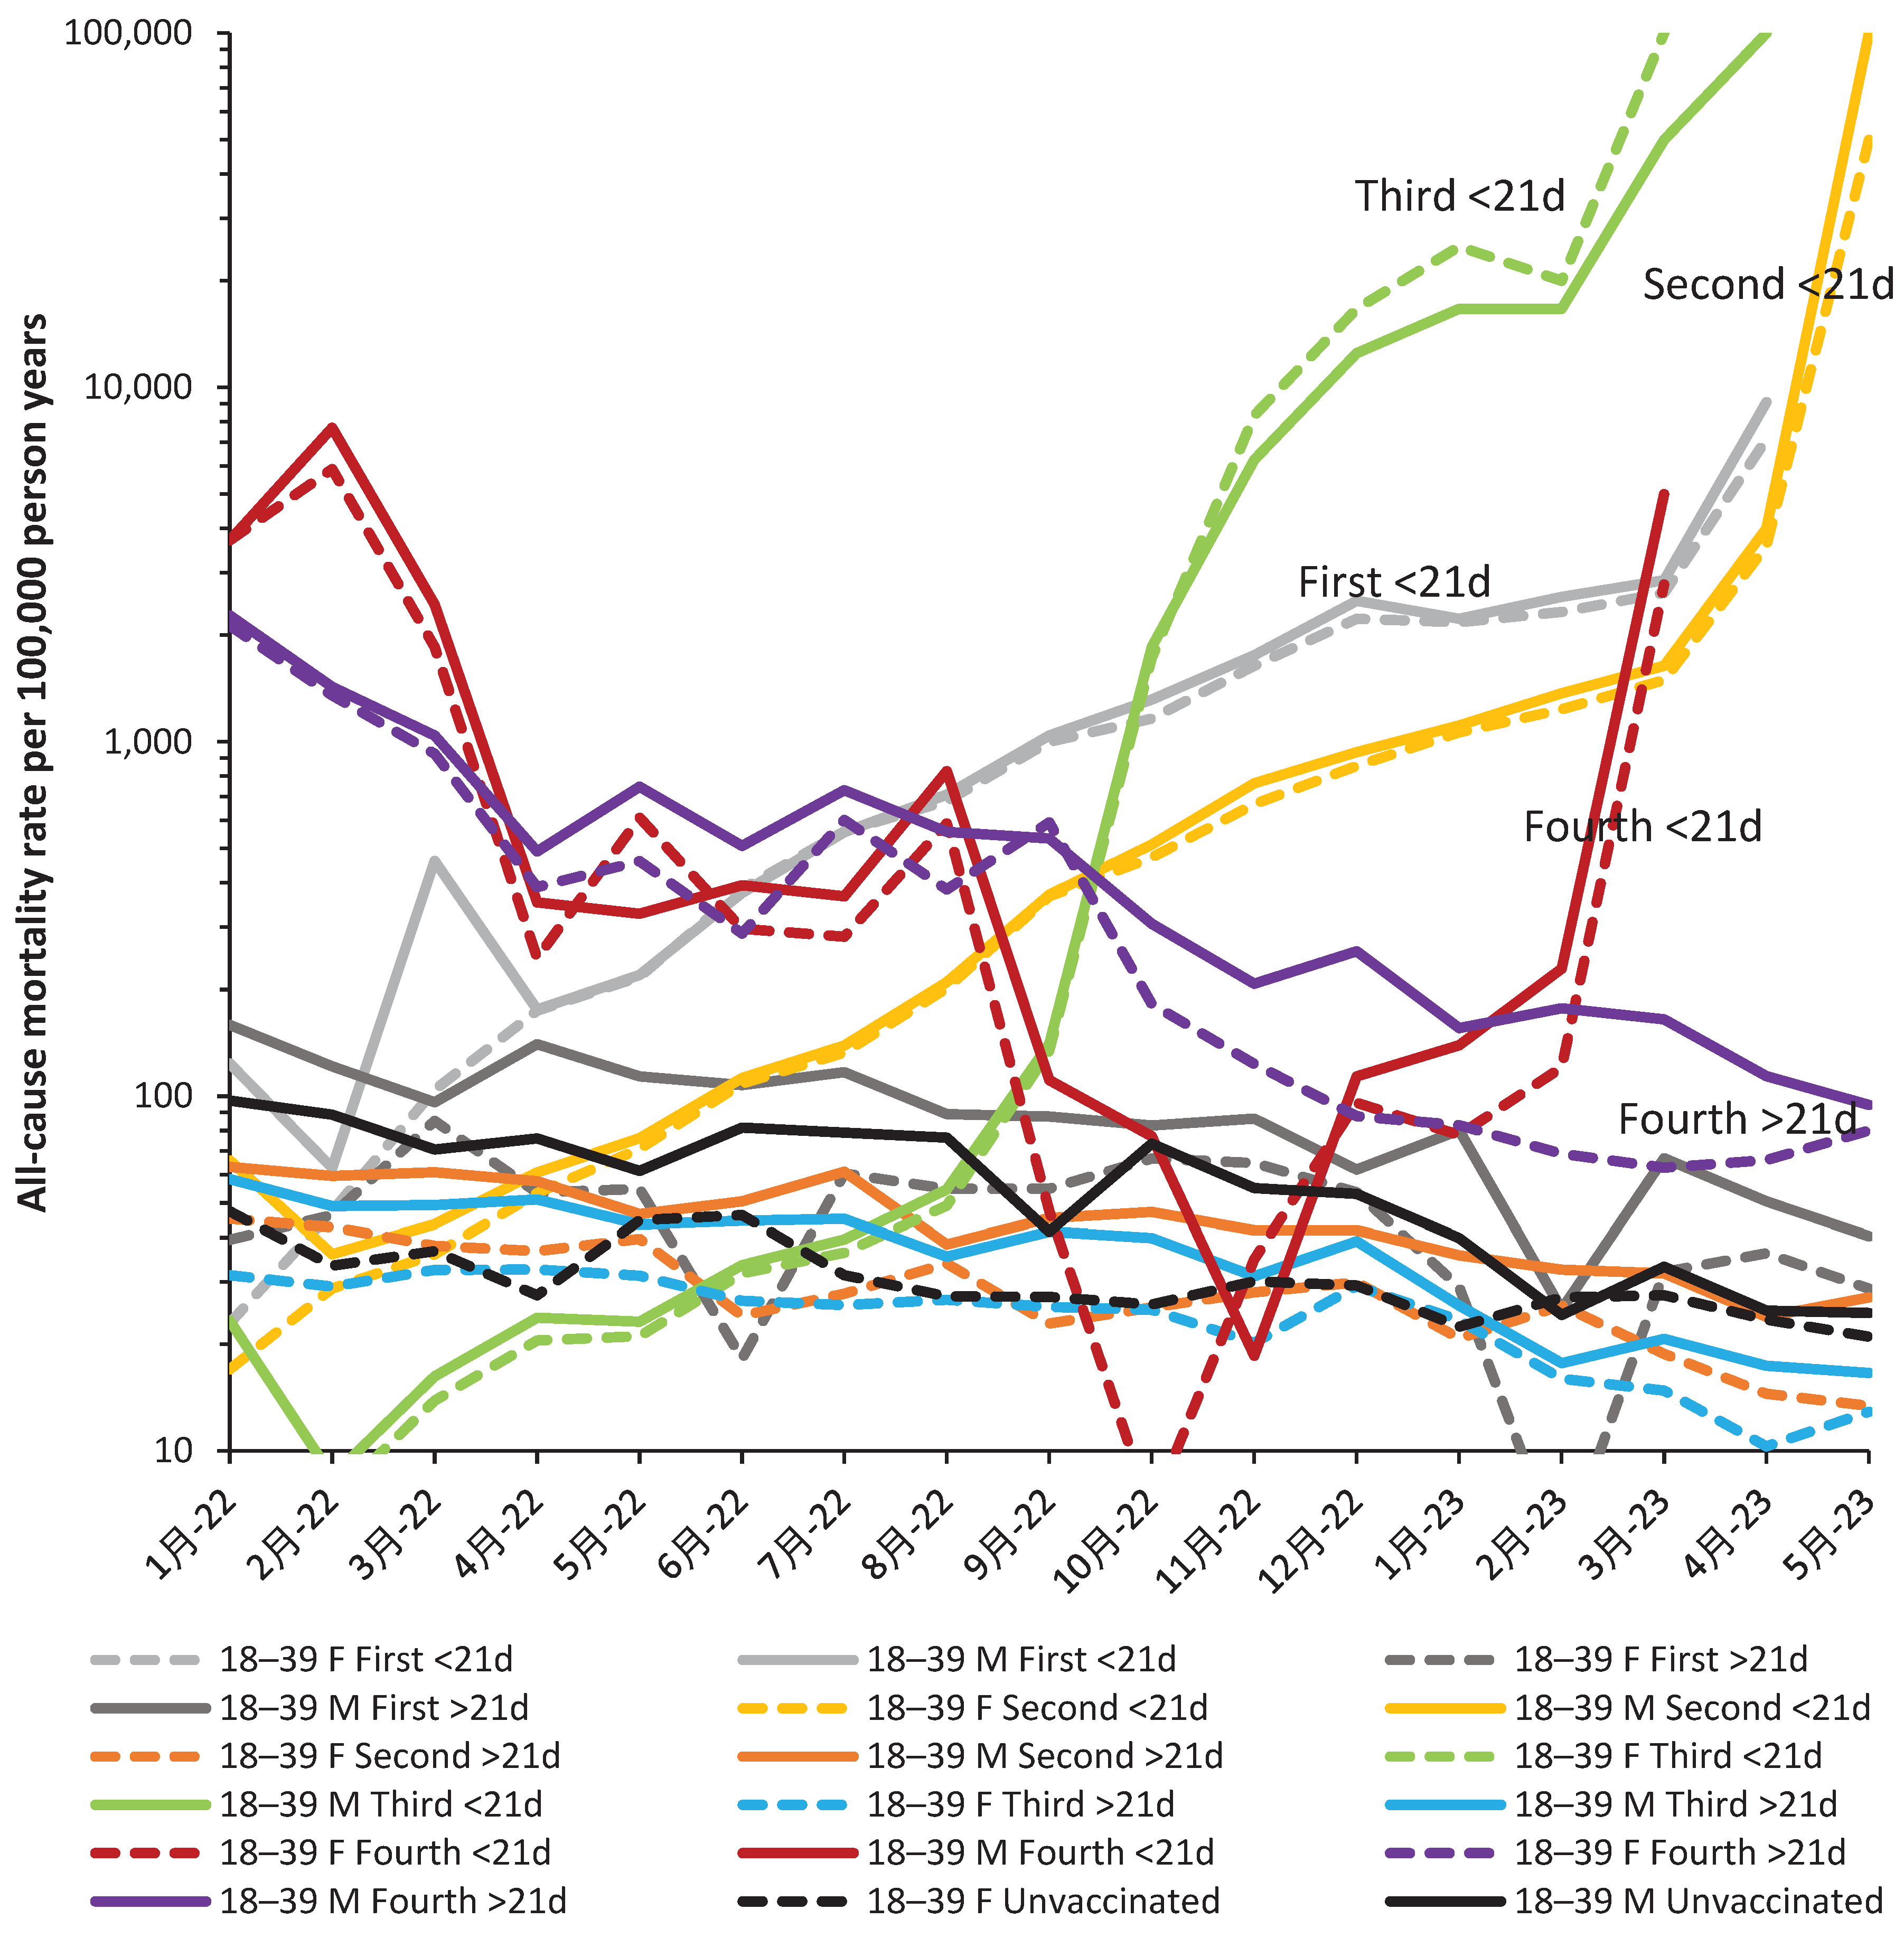

Table 1.
Vaccine type received by most persons in each age band during the periods when different SARS-CoV-2 variants were prevalent. Dates in brackets are when deaths due to the variants mostly occurred. Vaccination generally occurs from oldest to youngest in each age band.
Table 1.
Vaccine type received by most persons in each age band during the periods when different SARS-CoV-2 variants were prevalent. Dates in brackets are when deaths due to the variants mostly occurred. Vaccination generally occurs from oldest to youngest in each age band.
| Age band | Alpha (Jan-Jun 2021) |
Delta (Jul-21 to Feb-22) |
Omicron (Mar-22 onward) |
|---|---|---|---|
| 5-11 | Not vaccinated | Start Feb-22 mRNA | mRNA |
| 12-15 | Not vaccinated | Start Sep-21 mRNA | mRNA/Novavax |
| 16-17 | Not vaccinated | mRNA | mRNA/Novavax |
| 18-39 | Mixed, increasing mRNA in last 2 months of Alpha | mRNA | mRNA/Novavax |
| 40-49 | mixed | mixed | mRNA/Novavax |
| 50-59 | mixed | mixed | mRNA/Novavax |
| 60-69 | mixed | mixed | mRNA/Novavax |
| 70-79 | mixed | mixed | mRNA/Novavax |
| 80-89 | mixed | mixed | mRNA/Novavax |
| 90+ | Mixed but mRNA rich | mixed | mRNA/Novavax |
Disclaimer/Publisher’s Note: The statements, opinions and data contained in all publications are solely those of the individual author(s) and contributor(s) and not of MDPI and/or the editor(s). MDPI and/or the editor(s) disclaim responsibility for any injury to people or property resulting from any ideas, methods, instructions or products referred to in the content. |
© 2024 by the authors. Licensee MDPI, Basel, Switzerland. This article is an open access article distributed under the terms and conditions of the Creative Commons Attribution (CC BY) license (http://creativecommons.org/licenses/by/4.0/).
Copyright: This open access article is published under a Creative Commons CC BY 4.0 license, which permit the free download, distribution, and reuse, provided that the author and preprint are cited in any reuse.
Downloads
276
Views
353
Comments
0
Subscription
Notify me about updates to this article or when a peer-reviewed version is published.


MDPI Initiatives
Important Links
© 2025 MDPI (Basel, Switzerland) unless otherwise stated