1. Introduction
Various three-dimensional (3D) printers were introduced to fabricate the prosthesis that are used in dental practice. Their applications have been increasing in the fields of clinical dentistry due to the improvement in precision and convenience (Abduo et al., 2014). Most 3D printers use resin compounds to form the specific configurations to meet the purpose of restoration (Garcia et al., 2013). Although the ability to shape proper configuration and the integrity against functional and occlusal force are suitable for clinical use in dental fields, resin compound is susceptible to discoloration due to its composition and chemical structures.
Few studies have demonstrated the limitations of 3D-printed resin restoration in color stability. One study reported the color change of 3D-printed resin according to time (Shin et al., 2020). In the study, increasing changes in color value (ΔE) in 3D printed resin were shown according to the time that the specimens were exposed to discoloration agents. Another study also concluded that the 3D-printed restorations were more susceptible to discoloration compared to milled restorations and conventional temporization materials (Song et al., 2020). Although these studies demonstrated that 3D-printed resins show color changes, these studies used disk-shaped specimens which could not entirely reflect the clinical use of 3D-printed resins.
Recently developed post-curing machines decrease the concentration of oxygen in the air by filling the curing chamber with nitrogen, and it has been reported that post-curing in nitrogen saturated condition could reduce the contact of oxygen radicals on the surface of 3D printed resin and therefore, improve mechanical properties of 3D printed resins (Kim et al., 2020; Perea-Lowery et al., 2021; Suh, 2004; Wada et al., 2022). Also, many studies have demonstrated improvement in the surface characteristics of 3D printed resins that are post-cured in nitrogen-saturated conditions (Köroğlu et al., 2016; Reymus et al., 2019; Wada et al., 2023). However, there was no literature regarding the optical properties, such as color and translucency, of 3D printed resins post-cured under nitrogen-saturated condition so far.
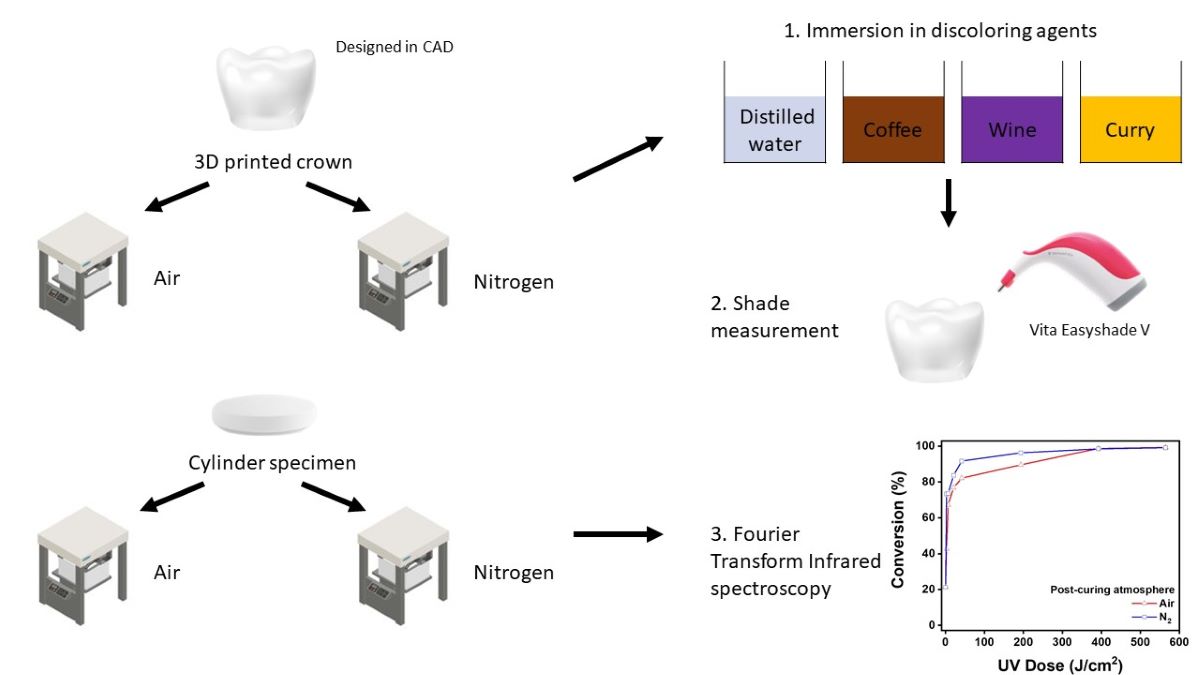
Therefore, the purpose of this study was to evaluate the color stability of 3D-printed resin crowns post-cured in nitrogen-saturated condition and to compare it with the crowns post-cured in normal air. Null hypothesis was that there is no difference in color stability of 3D printed resin crowns between two different post-curing conditions, nitrogen saturated condition, and normal air.
2. Materials and methods
2.1. Crown specimen preparation
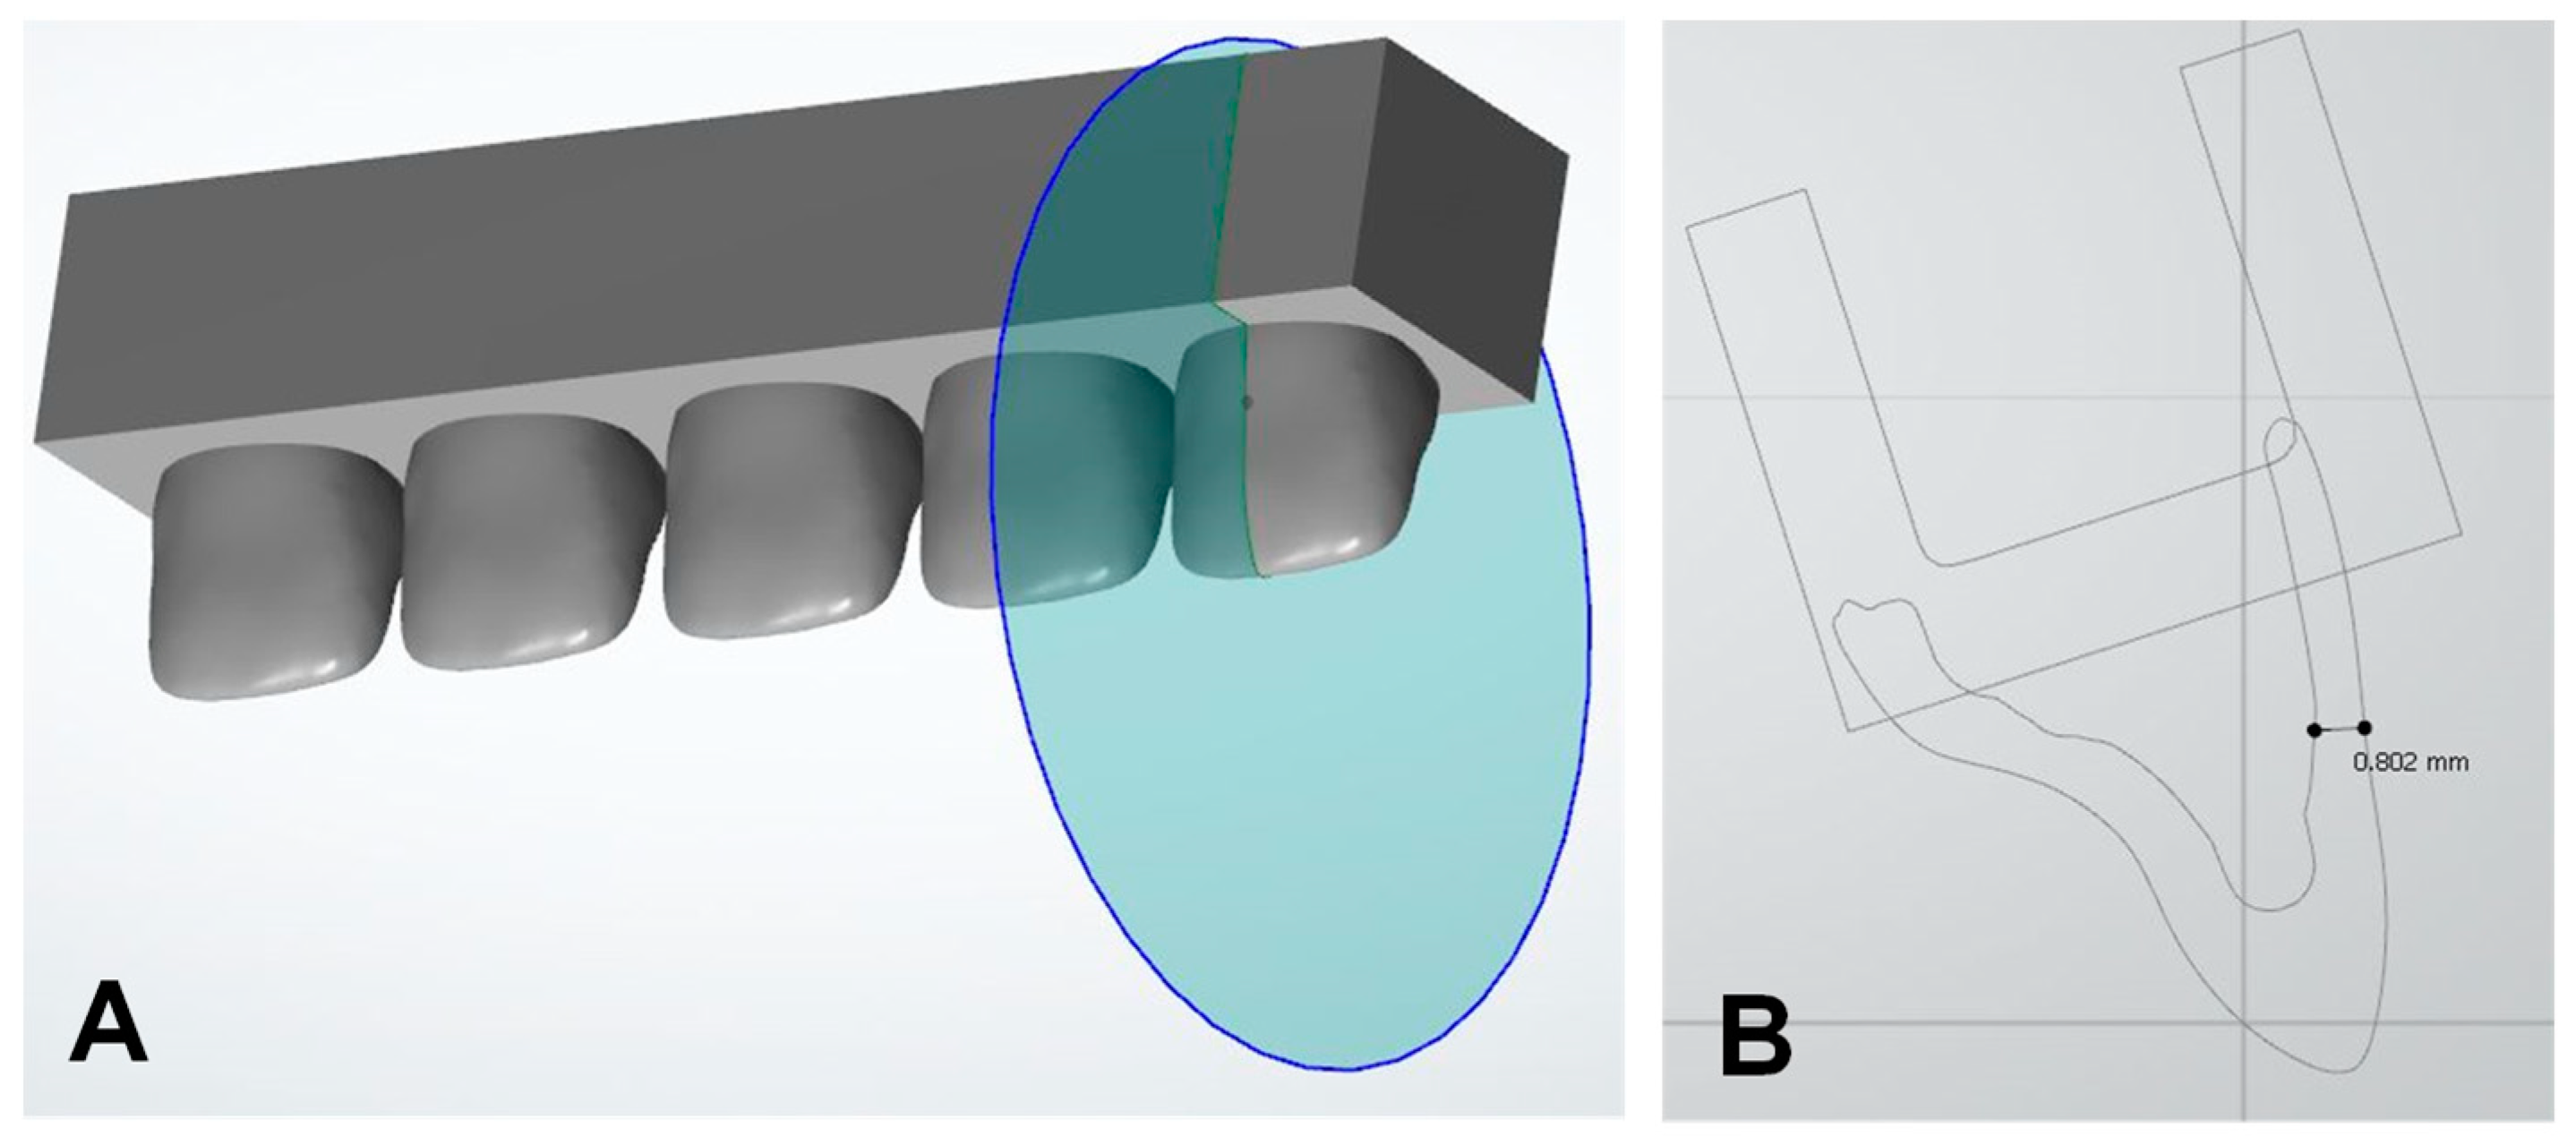
Crown specimens were designed using computer-aided design (CAD) software (3Shape Dental System; 3Shape, Copenhagen, Denmark) to make a typical anterior crown for maxillary incisors. The preferred typical incisor crown configuration consists of at least 2 mm of thickness on the incisor edge and 0.7mm of thickness on the buccal surface (Yoshiaki & Masahiro, 2015). Therefore, the crown in this study was constructed with 2.5 mm of thickness on the incisal edge and 0.8 mm of thickness on the buccal surface. After design, the crowns were integrated with a specially designed structure on the bottom, which would make the tip of the color-measuring instrument fit (
Figure 1). This was made to keep the measuring instrument in the same place in the color measurement process. Five crowns were integrated into a specially designed base structure in a row to form a printable form. Two pieces of integrated printable form were fabricated per subgroup to make 10 crown specimens per subgroup.
After the CAD process, the 3D design of the specimen was exported in an STL file, and the specimen was fabricated with the 3D printer (NBEE; Uniz, San Diego, CA, USA) using A2 shaded 3D printing resin (TC80; Graphy Inc, Seoul, Korea). TC80 is a suitable 3D printing resin used for printing crown and bridge prosthesis and thus selected for this specimen fabrication. Then the specimen was rinsed with 99% Isopropyl alcohol (Duksan, Seoul, Korea) in an ultrasonic bath (UCS-20; Jeiotech, Daejeon, Korea) for 1 minute according to its manufacturer’s instructions to remove the excessive resin remnants on the surface of specimens. The specimens were dried with compressed air and the specimens were divided into two groups depending on the curing process.
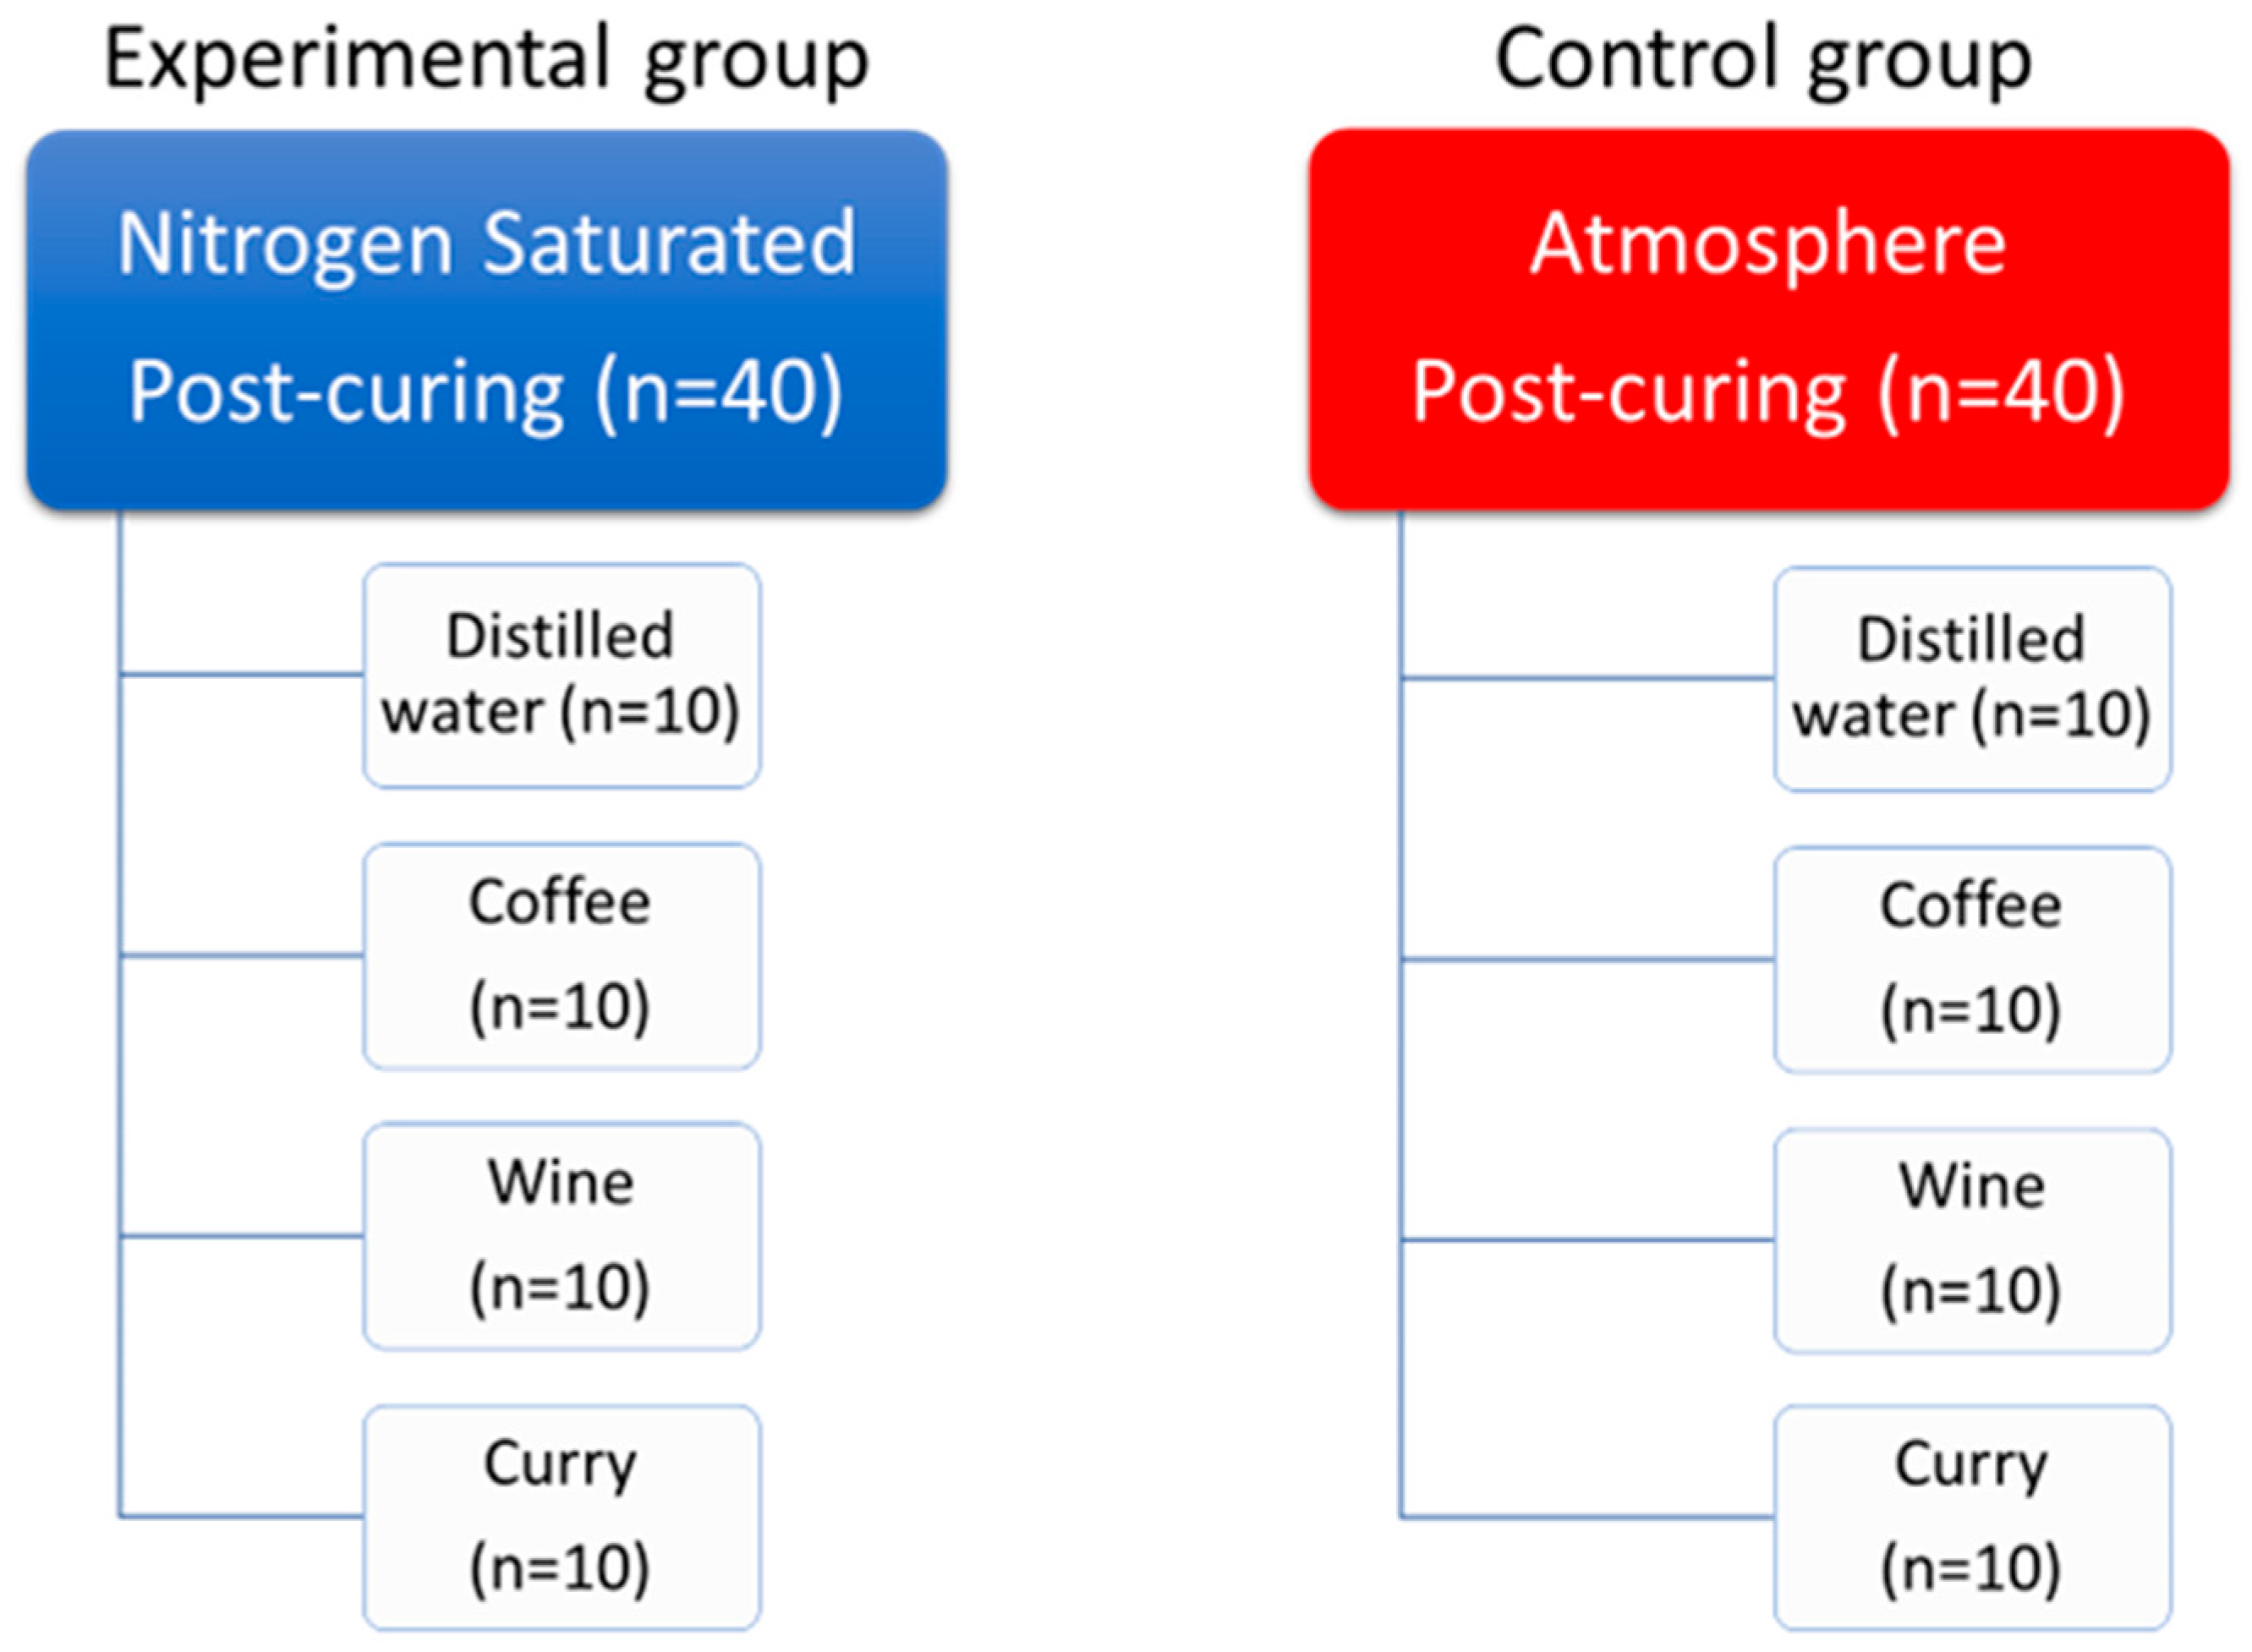
Specimens in the air group (control group) were cured in the condition of normal air using a post-curing instrument (Tera Harz Cure (THC); Graphy, Seoul, Korea) for 15 minutes. And the specimens in the nitrogen group were cured in nitrogen-saturated condition using the same THC curing machine, but with the nitrogen saturation mode for 15 minutes. All specimens were kept in a dark room before immersing them in the discoloring agent. A total of 80 specimens were fabricated, and each group consists of 40 specimens each.
2.2. Discoloration procedures
The discoloration agents were selected based on the previous studies that studied the color stability of computer-aided designed and computer-aided manufactured (CAD/CAM) prosthesis, and the crown specimens of each group were divided into four subgroups according to the discoloration agents that they were put in—distilled water, coffee, wine, and curry (
Figure 2) (Shin et al., 2020; Song et al., 2020). Coffee was made using Nescafe Crema Americano (Nestle; Vevey, Switzerland) according to the manufacturer’s instructions (3 g of pre-grinded powder mixed with 300 mL of distilled water). Wine was Roche Mazet, Cabernet Sauvignon (Groupe CASTEL, Bordeaux, France). Curry was made with Ottogi Curry (Ottogi, Anyang, Korea) according to the manufacturer’s instructions (25 g of powder mixed with 100 mL of distilled water), and this subgroup is the only subgroup that consists of main ingredient as hydrophobic (Stankovic, 2004). The specimens were immersed completely in the discoloration agents in tightly sealed containers. The containers were stored in a 37℃ constant-temperature water bath (HG-10WB; Hangil, Seoul, Korea) for 4 weeks. They were removed from the discoloration agents for color measurement in each measuring period.
2.3. Color measurement
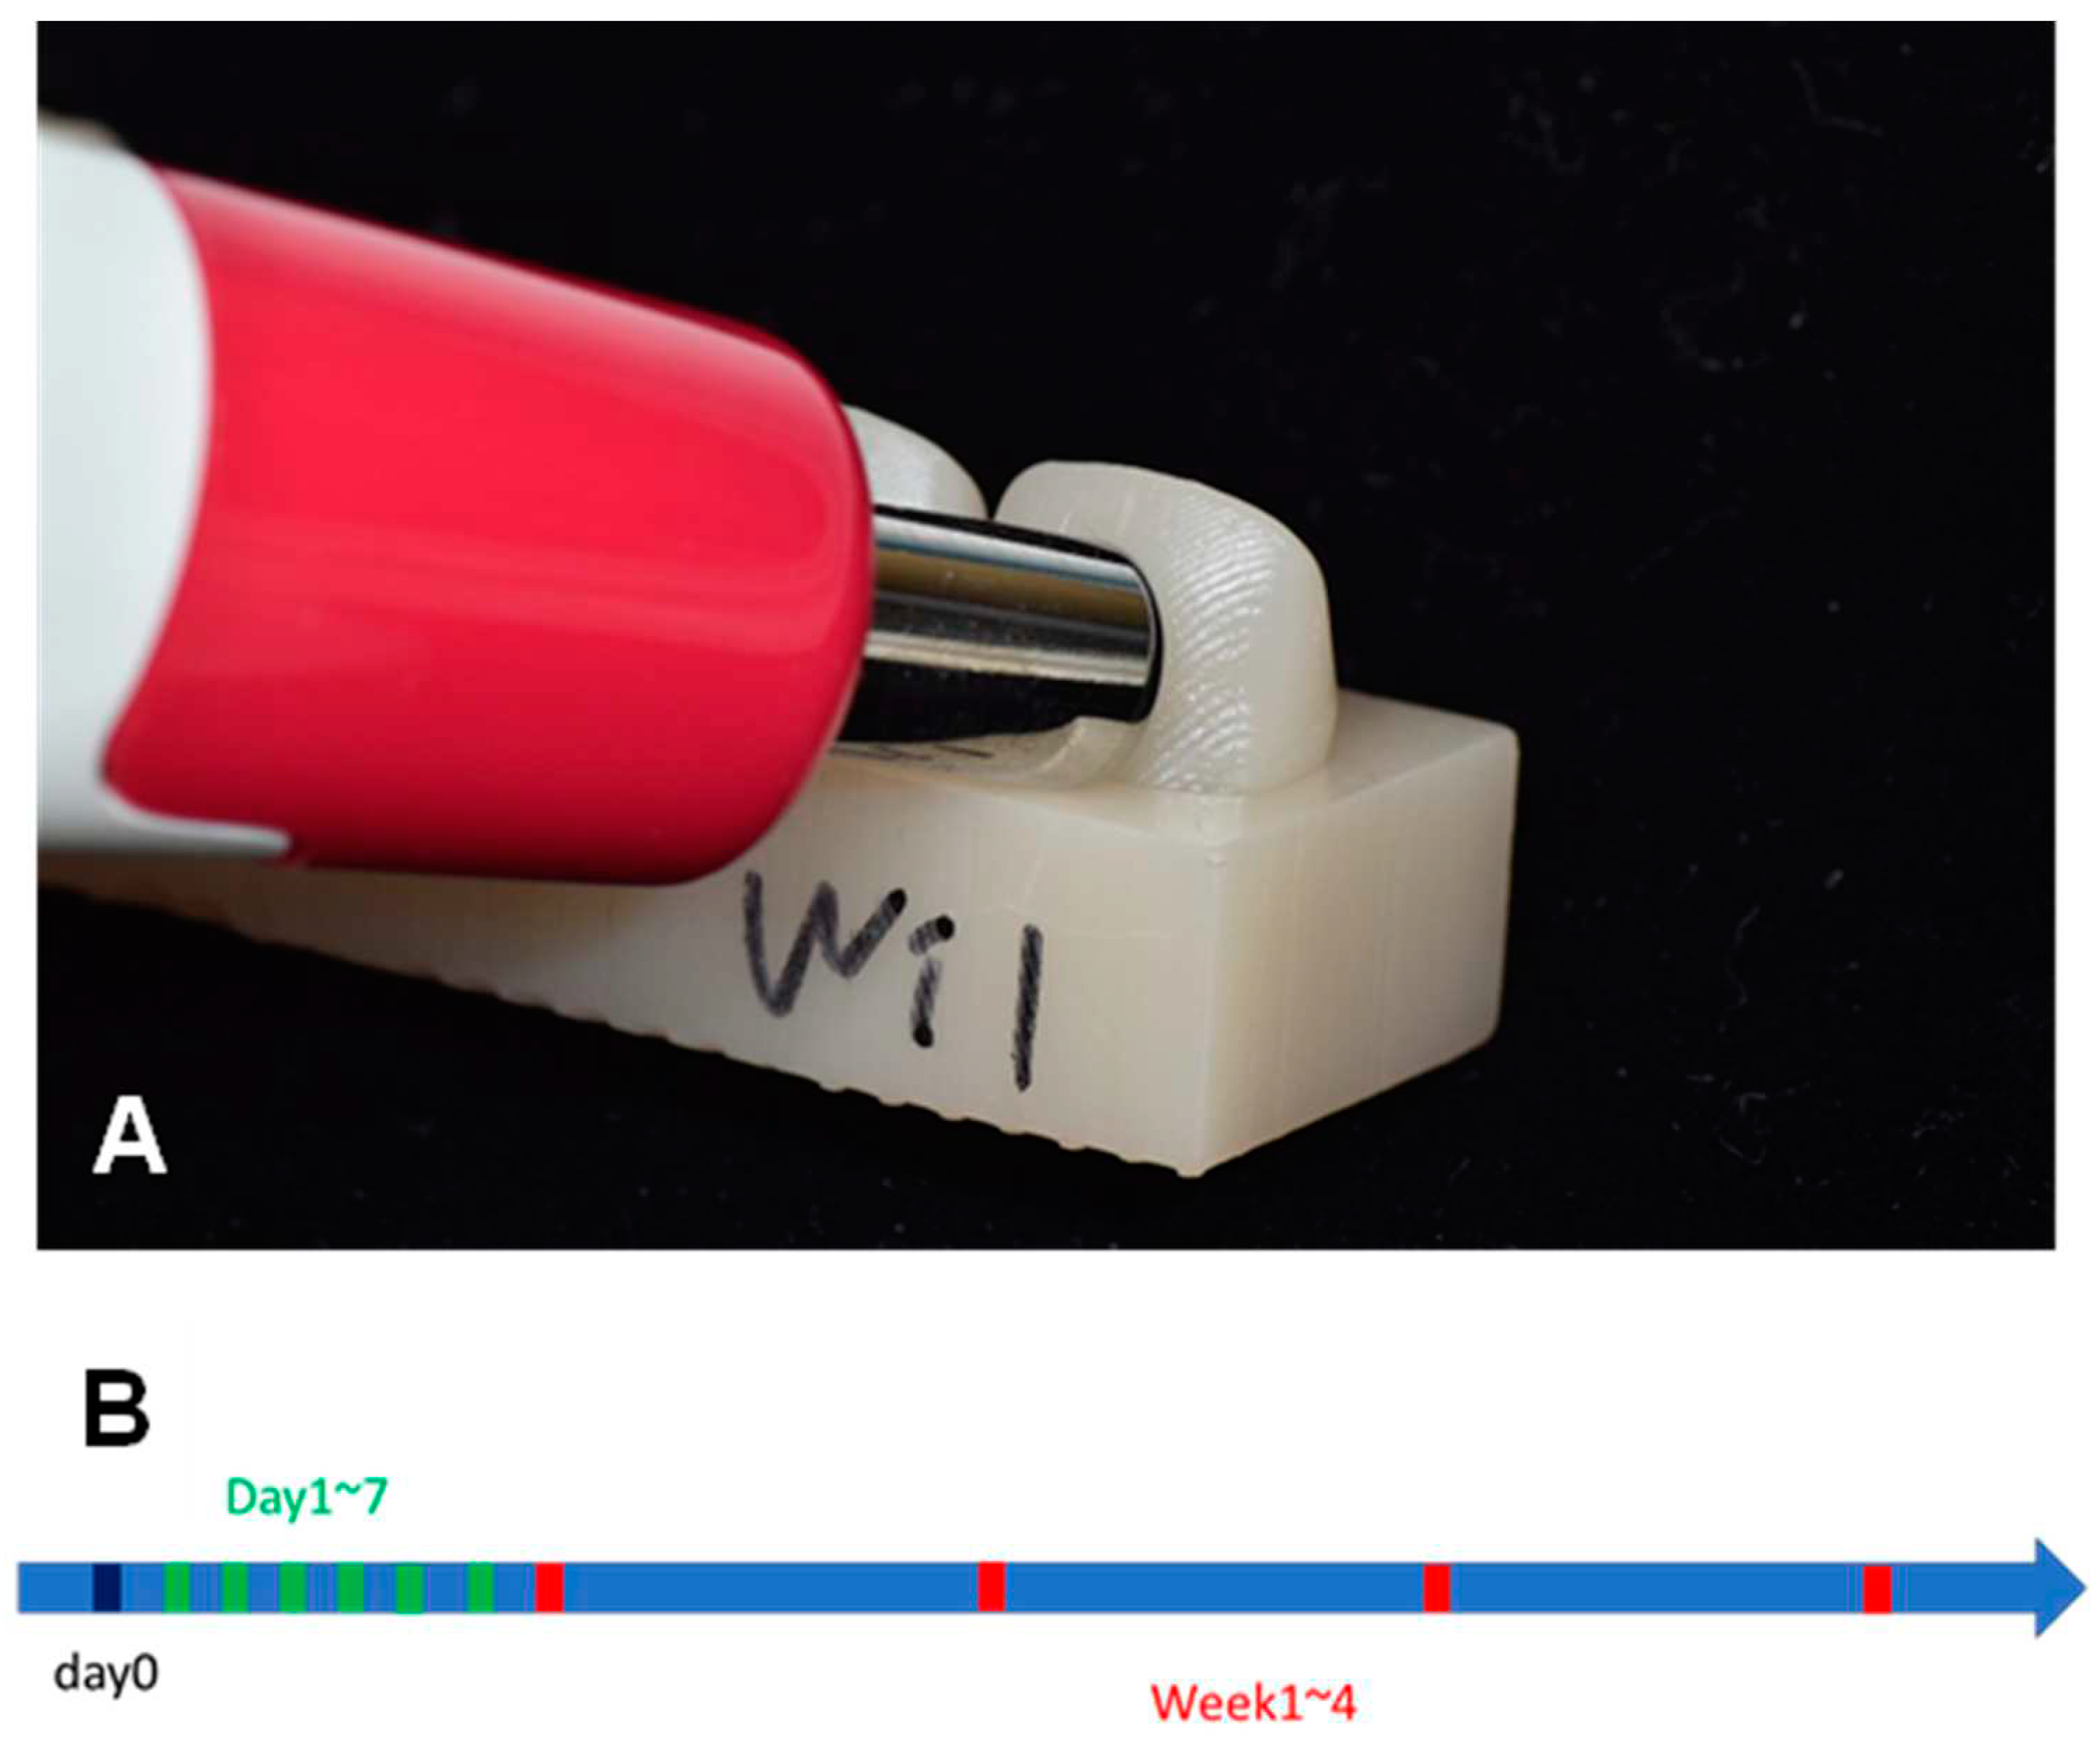
The baseline color of each specimen was measured before immersing the specimens in a discoloration agent (
Figure 3A). Then the color of each specimen was measured in every 24 hours for a week, and every week for a month (
Figure 3B). At the measurement, the specimens were removed from the discoloration agents and thoroughly washed with distilled water. Then they were dried with compressed air which made them ready for color measurement.
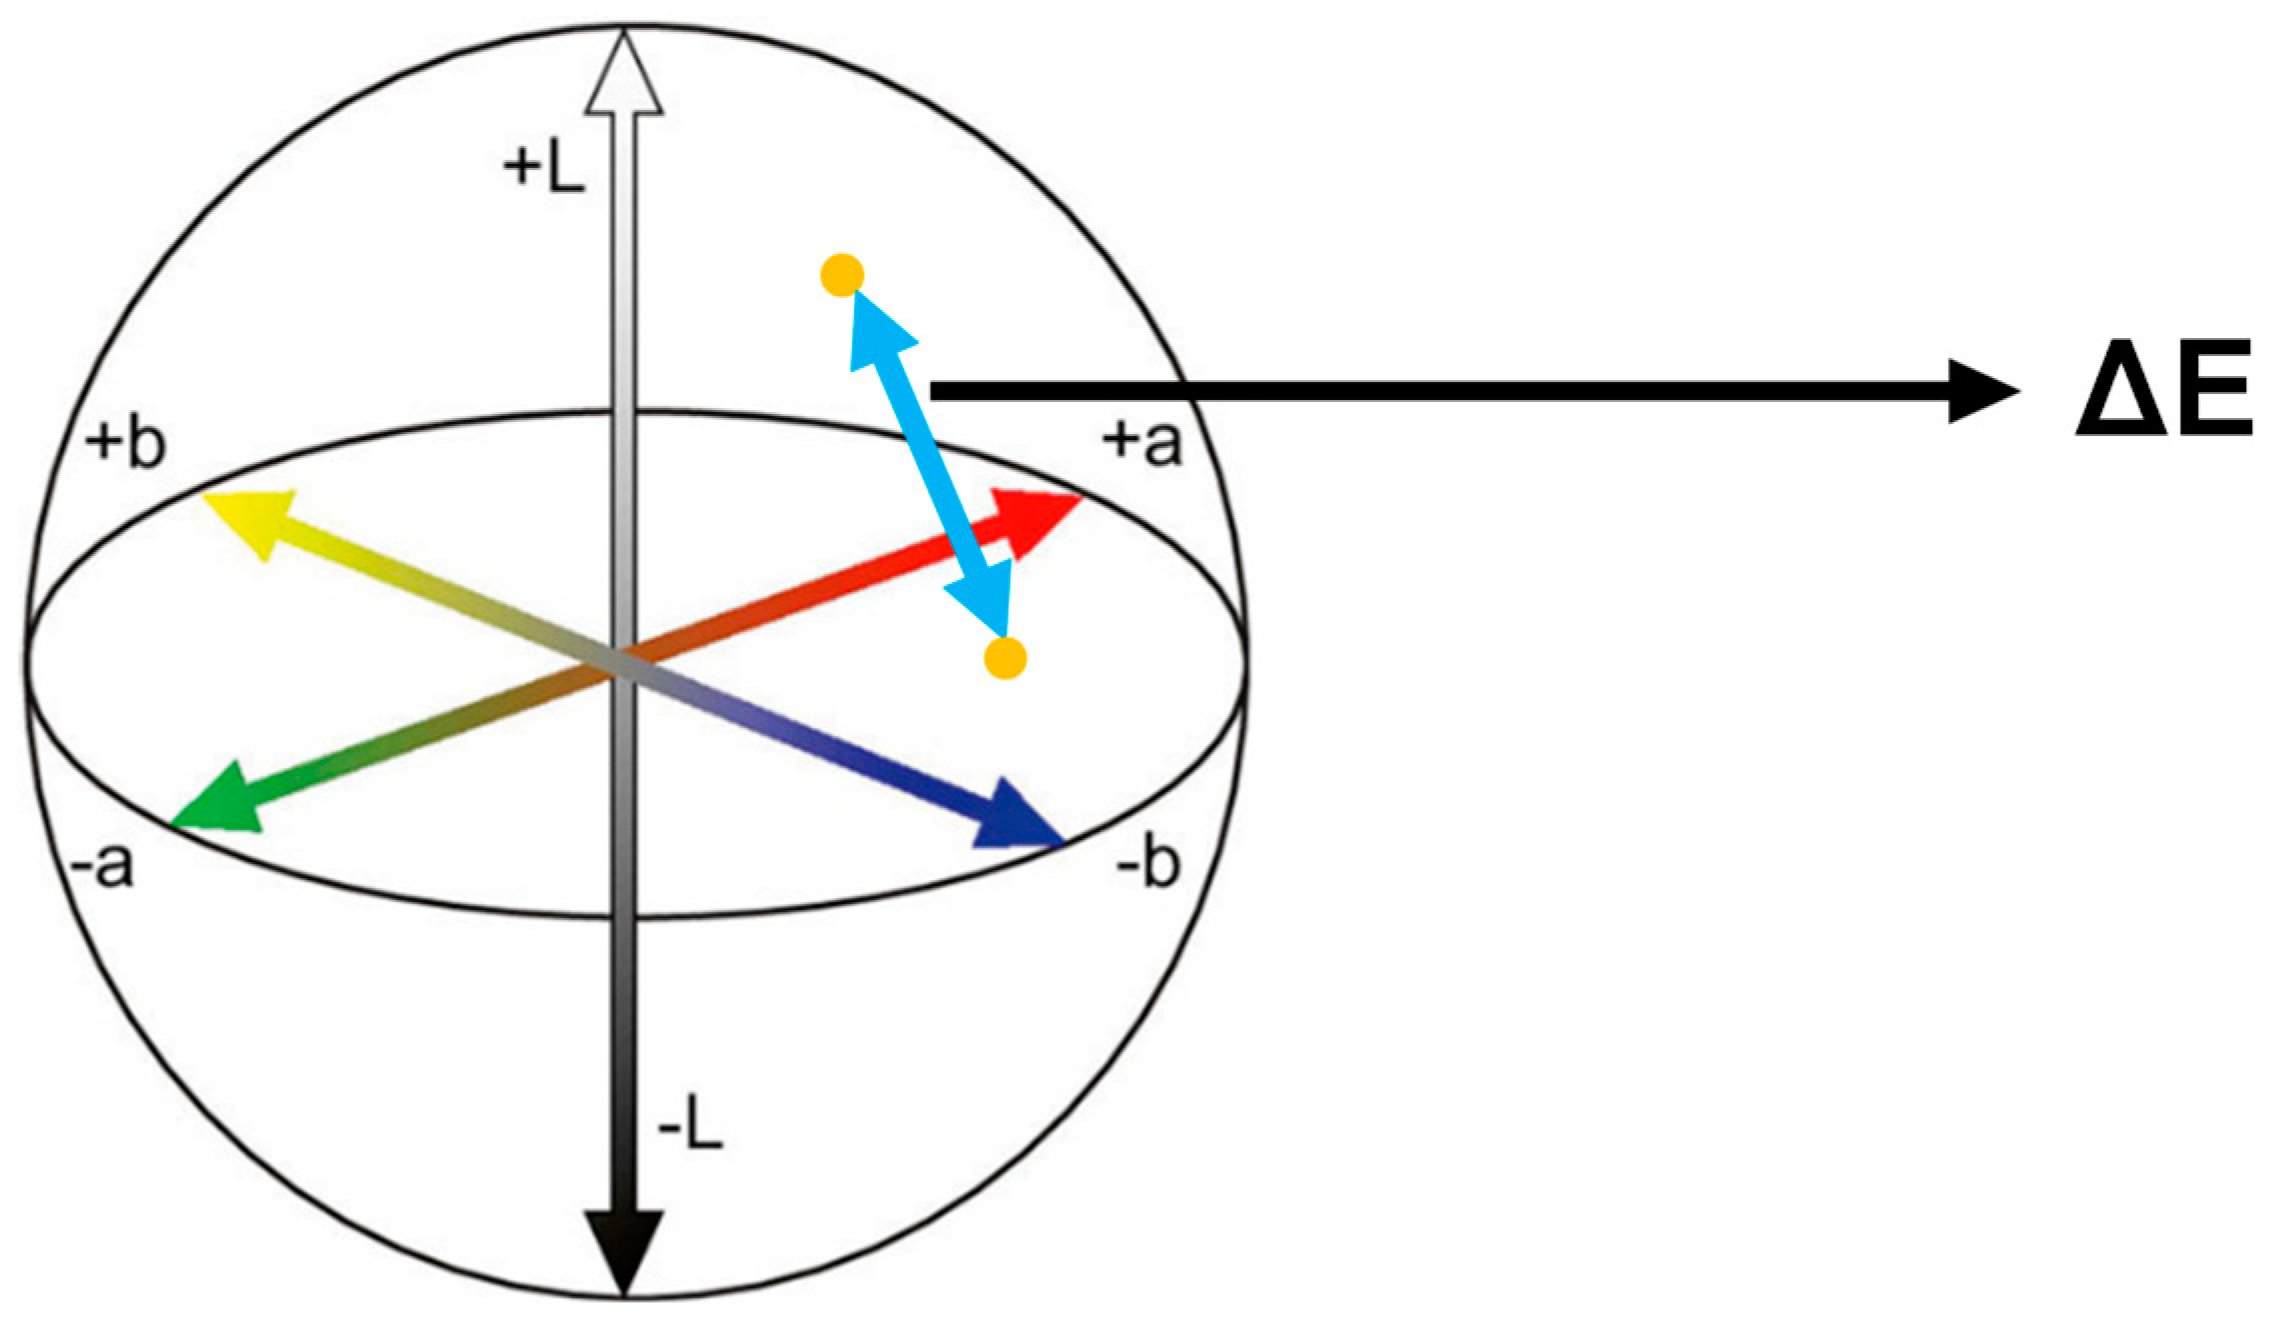
The color was measured with a portable digital spectrophotometer (EasyShade V; VITA Zahnfabrik, Bad Säckingen, Germany) to acquire the L, a, b values in the CIELAB color space. L, a, b values were recorded and ΔE was calculated according to the following equation (
Figure 4). (ΔE stands for the distance between the two points on the CIELAB color space.)
= Value of color orientating factor (L, a, b) in the time of measurement
= Value of color orientating factor (L, a, b) in the baseline (Day0)
If ΔE value was higher than 1.80, it was regarded as clinically perceptible, and if ΔE did not exceed 3.46, it was assumed to be clinically acceptable (Ghinea et al., 2010).
2.4. Fourier transform infrared spectroscopy analysis on the specimen surface
Fourier transform infrared spectroscopy (FT-IR) analysis of was conducted using Nicolet summit FT-IR spectrometer (Thermo Fisher Scientific, Waltham, MA, USA) with standard procedure to inspect the degree of conversion of resins according to its curing time and the difference between two post-curing conditions. Using TC80 resin with A2 shade, cylinder-shaped specimens with dimensions of 15 mm of radius and 3 mm of thickness were designed and 3D printed with UNIZ 4K Slash2 (UNIZ, San Diego, CA, USA). After fabrication, they were washed with 99% isopropyl alcohol in an ultrasonic bath for 30 seconds. The specimens were post-cured in THC for from 10 to 900 seconds. The conversion rates of specimens were recorded at the periods of 10, 30, 60, 300, 600, and 900 seconds after the operation of the post-curing unit. Peaks at 810 cm-1 and 1730 cm-1 were investigated. The peak at 810 cm-1 stands for C=C twisting of acrylate which represents the uncured resin monomers, and the peak at 1730 cm-1 represent C=O stretching peak which is used as a reference point to calibrate the peaks and 810 cm-1.
During the measurement, the total quantity of light exposure was also recorded with a UV energy meter (LS128; Linshang, Shenzhen, China). A detector was placed in the middle of the post-curing chamber and measured the light quantity to match the degree of conversion to the quantity of light.
2.5. Statistical Analysis
Statistical analysis was performed with IBM SPSS v26.0 software (IBM, Armonk, NY, USA) at a significance level of 0.05. Repeated measures one-way analysis of variance (RM-ANOVA) were performed to compare the effect of nitrogen-saturated post-curing on color stability over time. Tukey’s test was performed to evaluate the periods and time duration of significant color changes in the specimens in post-hoc.
3. Results
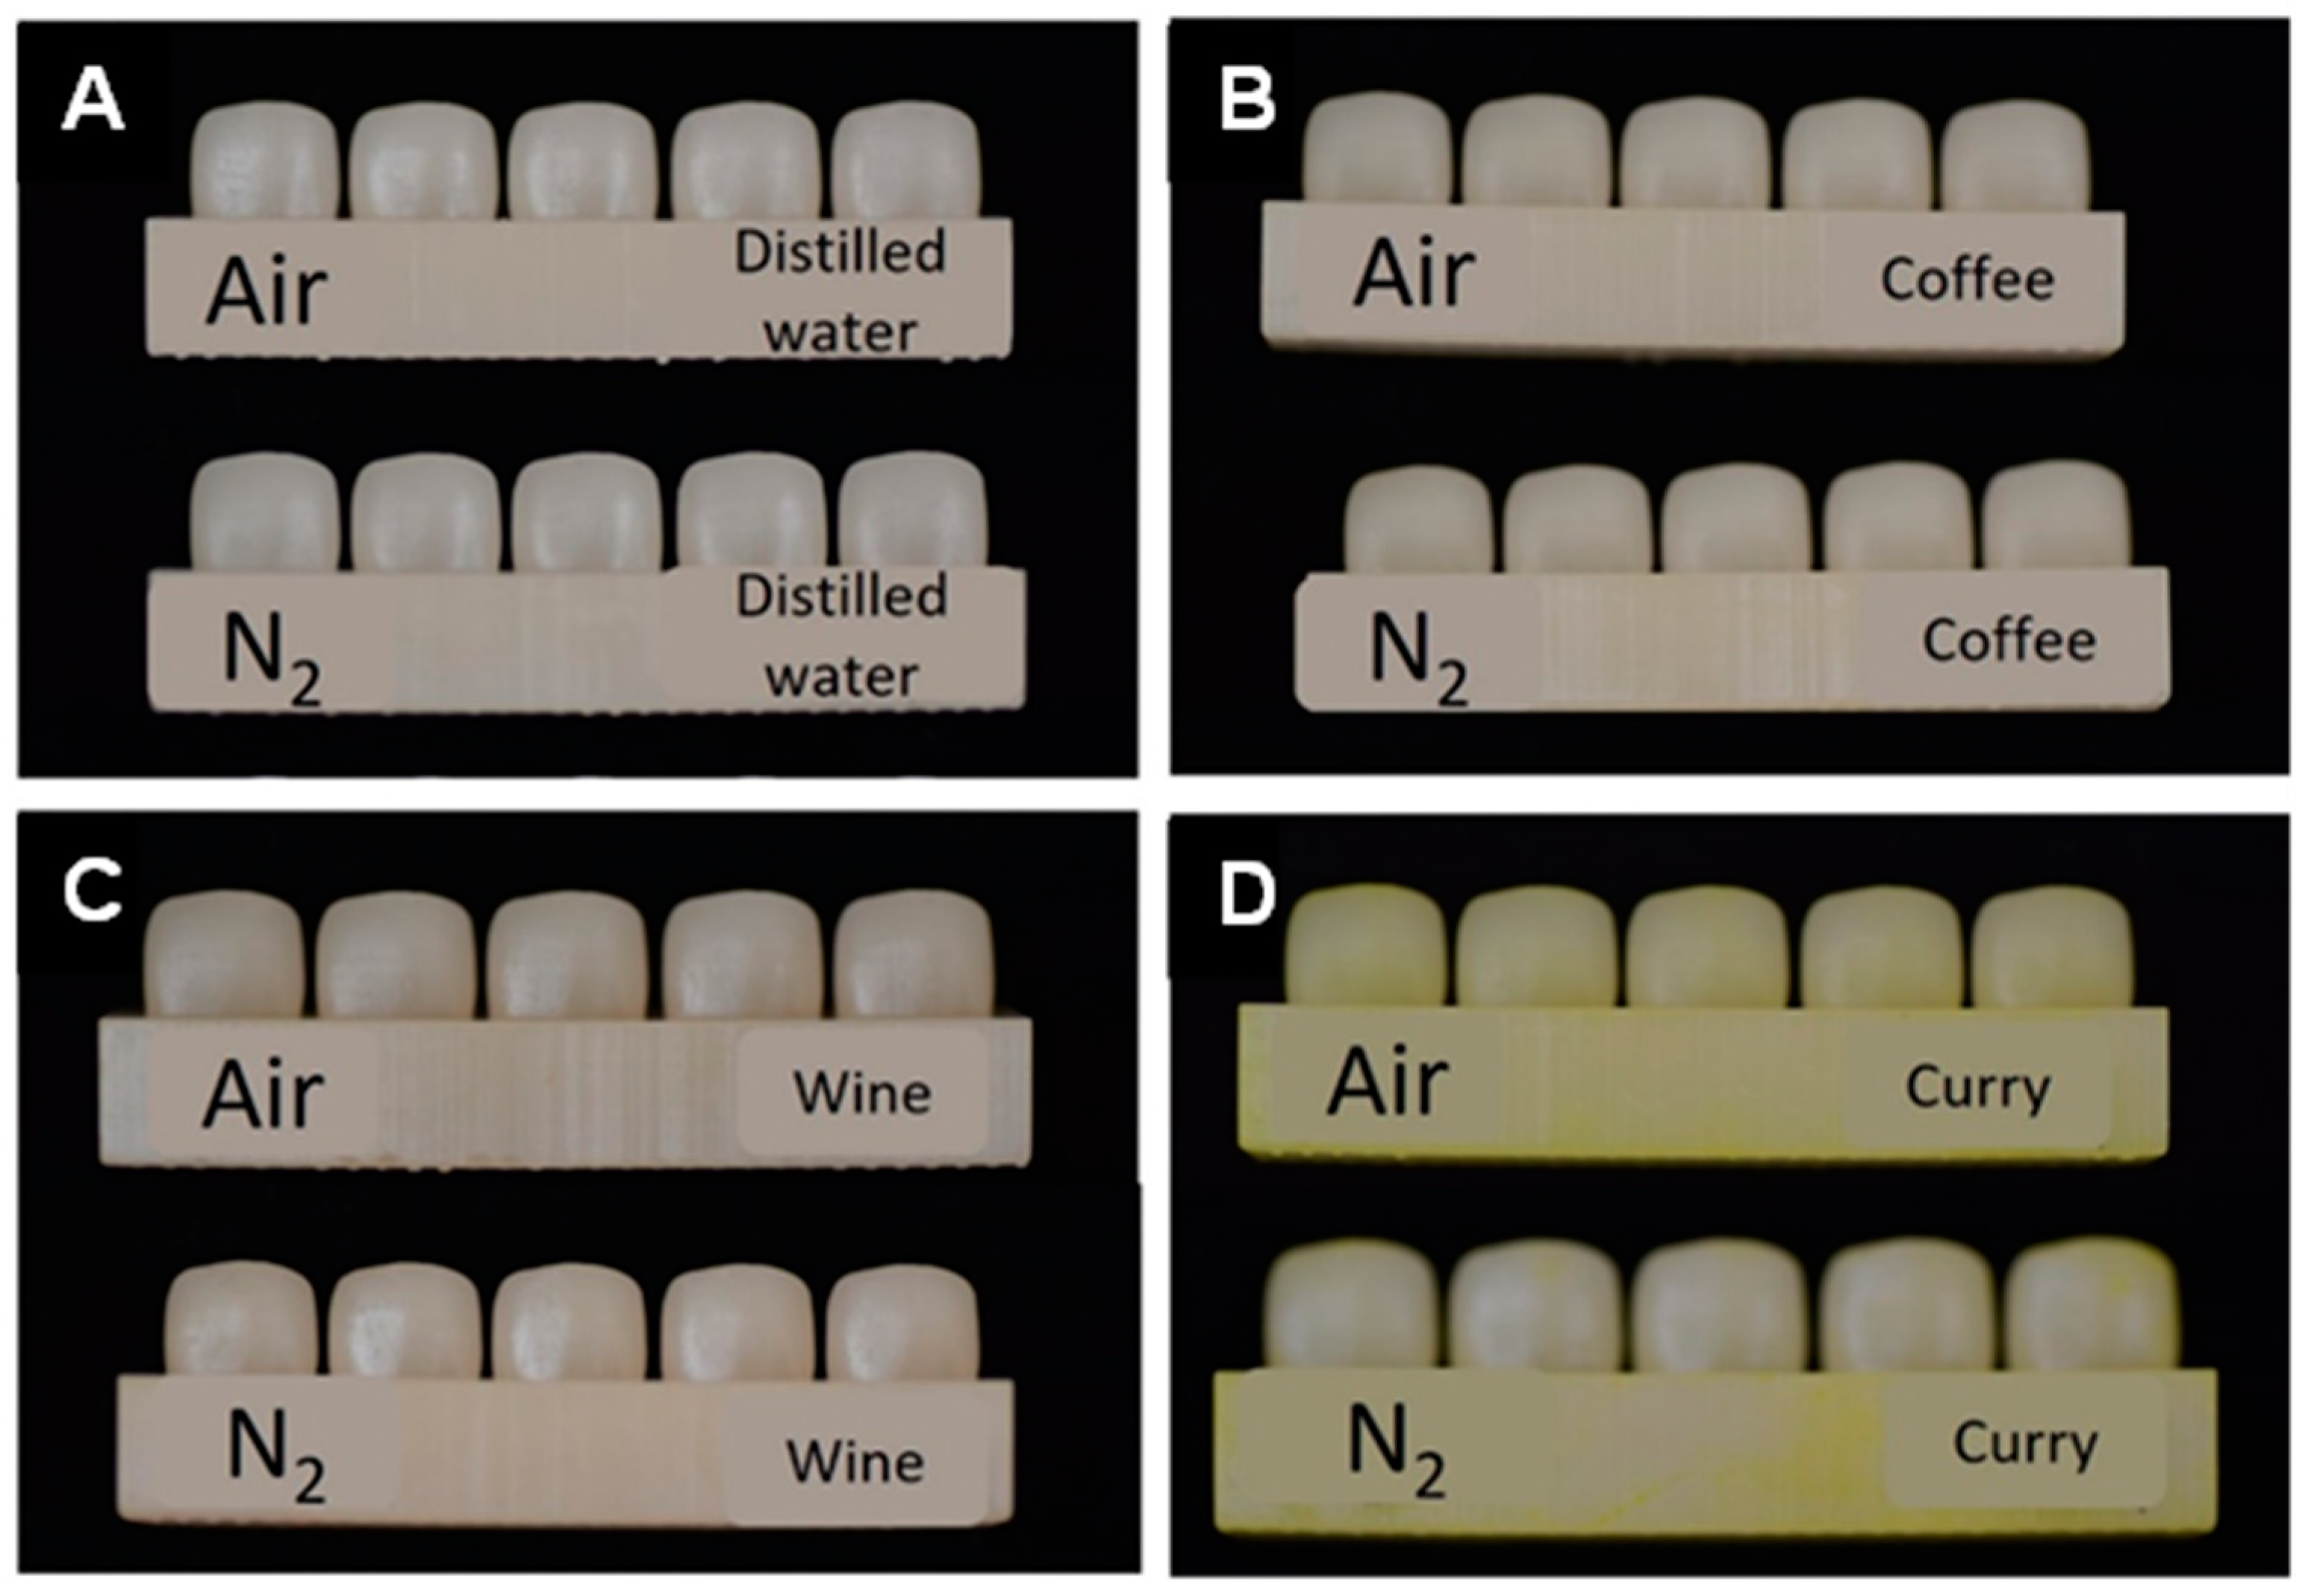
Clinical photo was taken on all specimens after a month of discoloration (
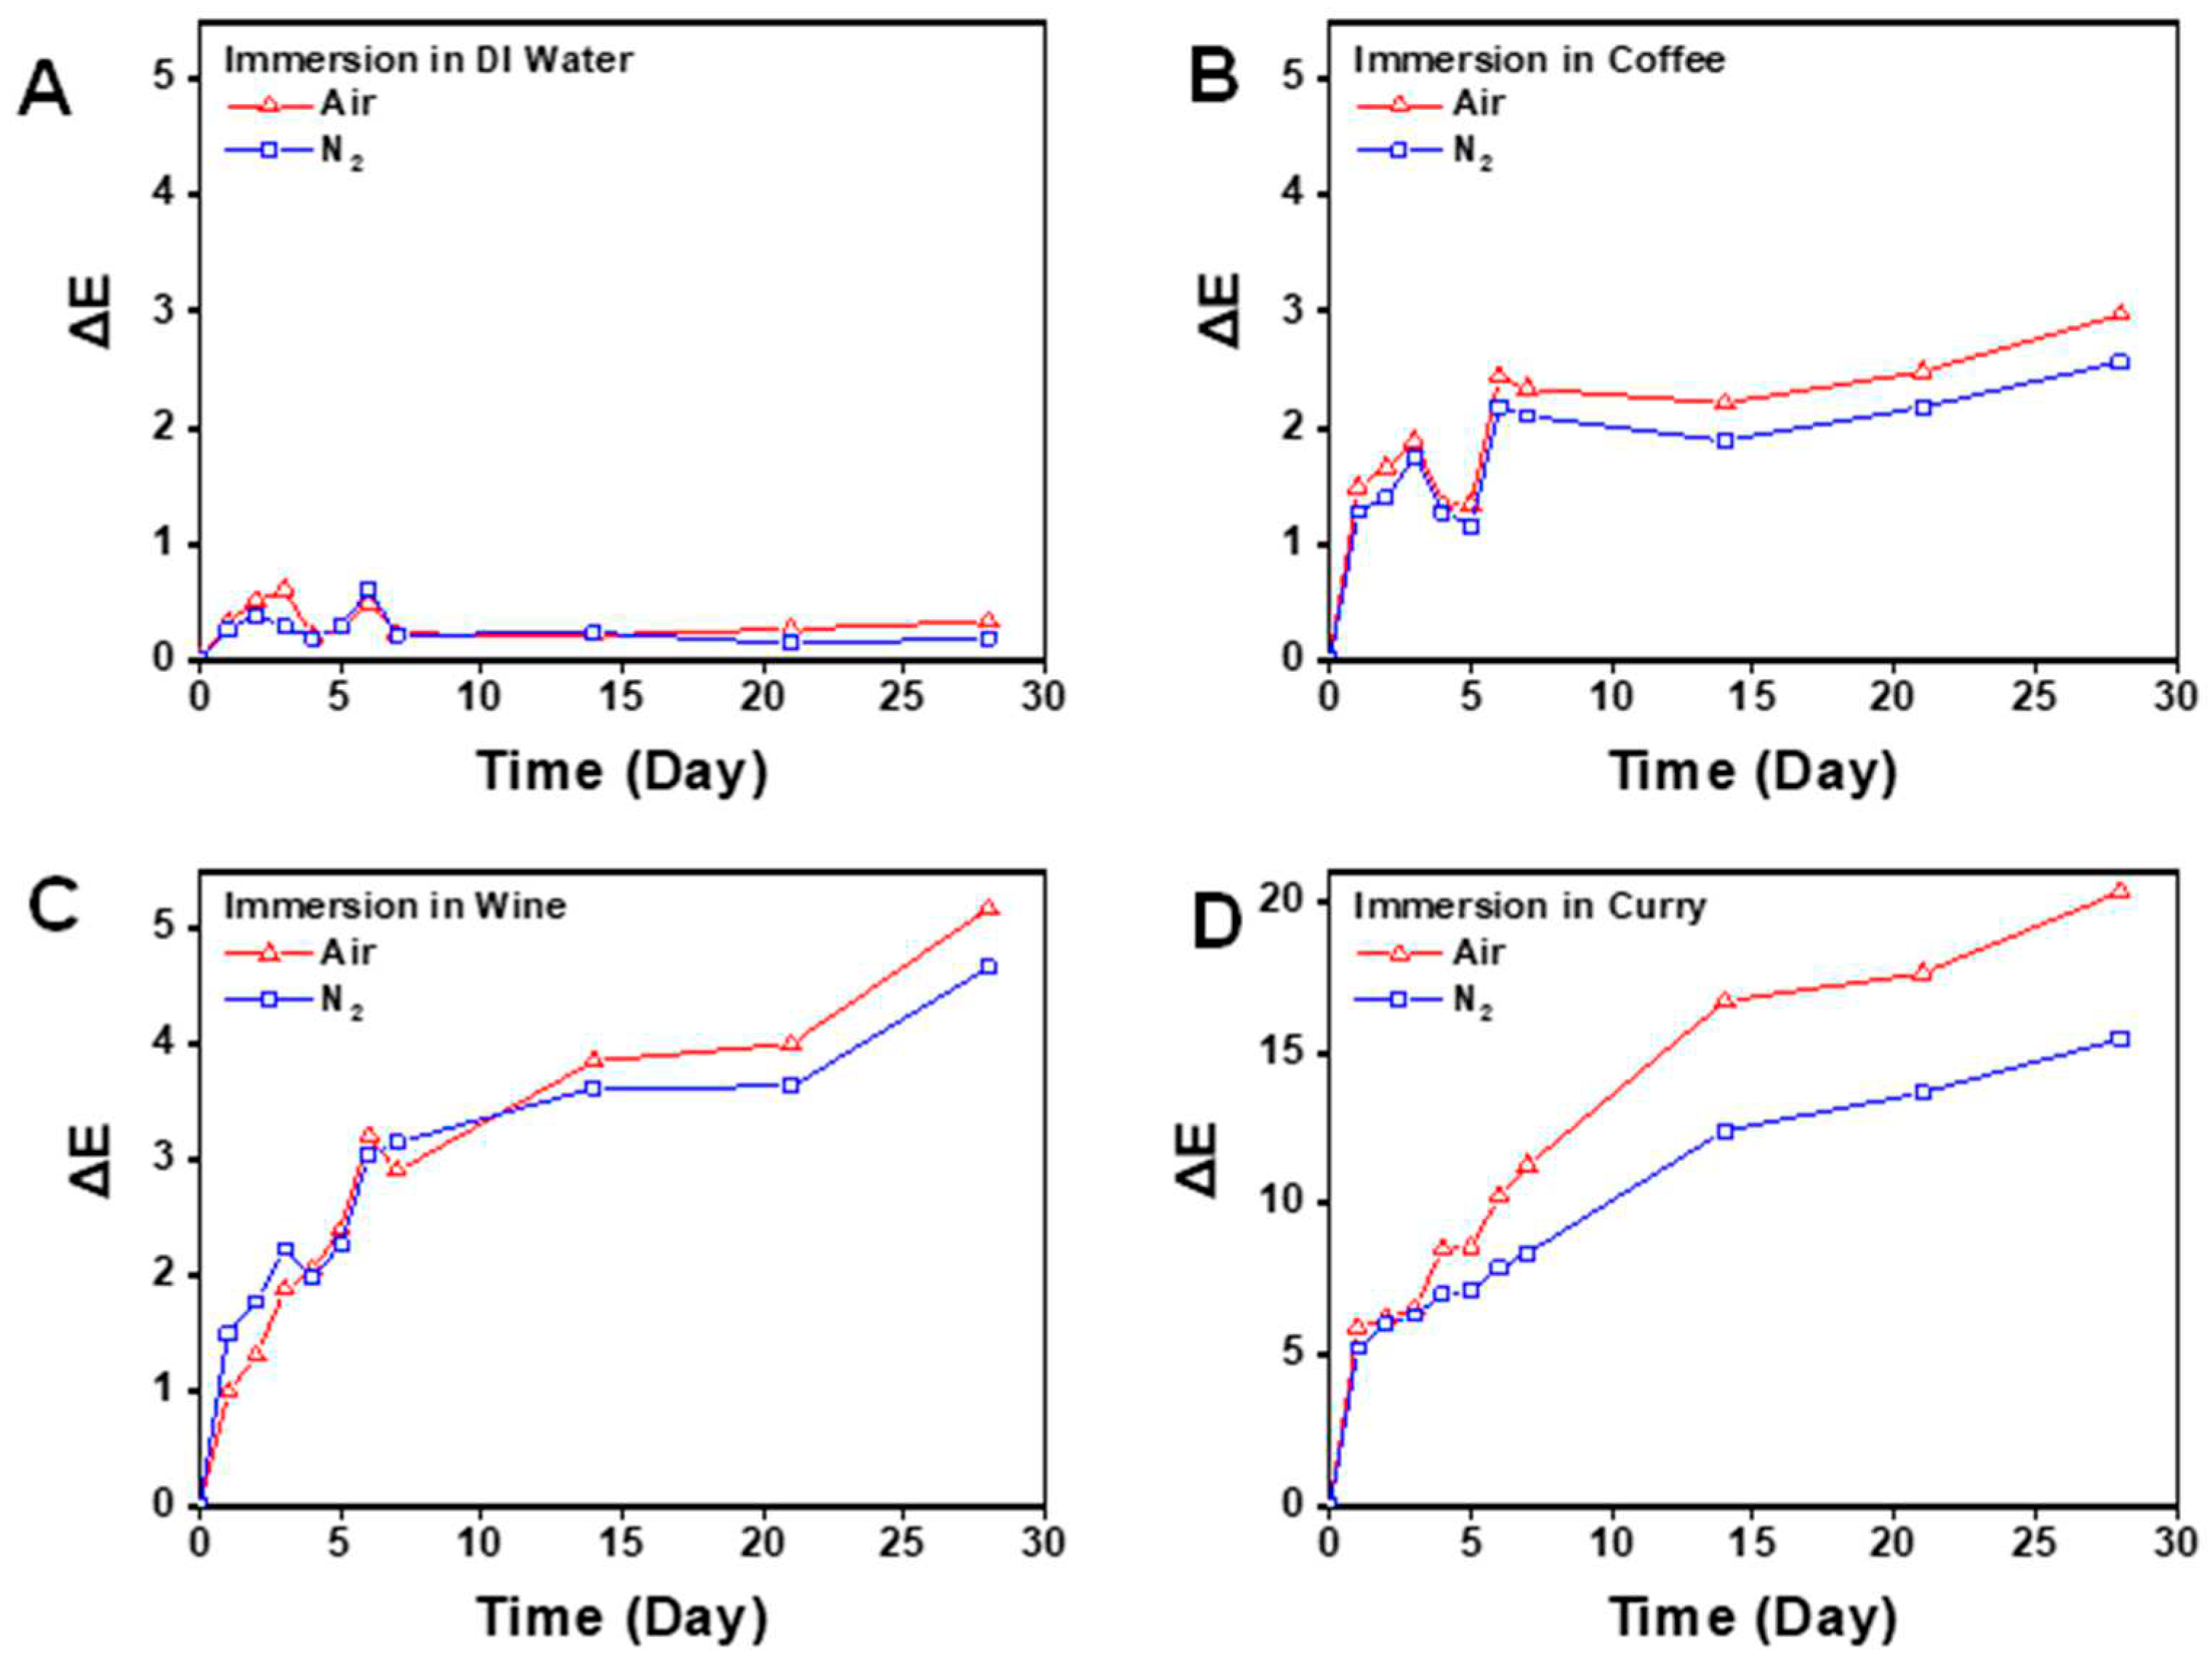
Figure 5). All groups and subgroups showed significant differences of color according to the immersion time regardless of curing condition or discoloration agent
(p < 0.001) (
Figure 6). However, when comparing the effect of post-curing methods, the nitrogen group and air group showed no significant difference over the experiment time in distilled water and coffee subgroups (
p > 0.05). The nitrogen group and air group showed significant differences over the immersion time in the wine and curry subgroup (
p < 0.05). The average value of color change (ΔE) in each specimen at day 3, day 7, and week 4 is described in
Table 1.
Also, in the discoloring agent of coffee, the ΔE value of the nitrogen group and air group showed a significant difference in the fourth week only (p < 0.05). In the condition of using curry as a discoloration agent, the significant difference between the nitrogen group and air group showed at day 5 and was continued to the end of the experiment (p < 0.05).
Degree of conversion was calculated by 810 cm
-1 peak volume decrease.
Figure 7 shows the degree of conversion ratio at 10, 30, 60, 300, 600, and 900 seconds. The post-curing unit provided the quantity of light during post-curing according to
Table 2. The nitrogen group and air group showed significant differences from 10~300 seconds, although degree of conversion from the air group caught up with the nitrogen group in 600, 900 of post-curing time.
4. Discussion
All groups and subgroups showed statistically significant differences in color according to the immersion time regardless of curing condition or discoloration agent, which means there was a change in the restoration color according to the time regardless of post-curing methods. This result is in accordance with Shin et al., which reported that 3D-printed resins are more susceptible to discoloration (Shin et al., 2020). The clinically acceptable limit of color difference (∆Eab) is known as 3.46 (Ghinea et al., 2010). Color difference above the acceptable limit was observed when 3D printing resins were after 2 weeks in wine, and after 1 day in curry.
The reason for this susceptibility to discoloration is thought to be due to its microstructure formed when the resin is cured. 3D-printed prosthesis is made by the additive method and this inevitably forms micro-spaces in between the layers of polymerization (Garcia et al., 2013). Also, full polymerization is not achieved during the printing session and is delayed until the post-curing session (Perea-Lowery et al., 2021). This delay can make wider space between the layers and this space can be a place where discoloring molecules can infiltrate to cause discoloration of prothesis.
The results showed that only in wine and curry, there was a statistically significant difference between the nitrogen-saturated post-curing and normal post-curing in discoloration according to time. So, the null hypothesis is partially rejected. For some discoloring agents like wine and curry, nitrogen-saturated post-curing increased color stability.
Still, distilled water and coffee in week 4 also showed a bigger ΔE value in the air group, which implies that there might have been a significant difference if the experiment was carried on. This difference in color stability is thought to be due to a greater degree of conversion in the early post-curing process in nitrogen-saturated condition (Kim et al., 2020). As results showed in the FT-IR spectroscopy, a significant difference in degree of conversion was observed during the early 300 seconds of post-curing. Nitrogen might prevent the formation of an oxygen inhibition layer that inhibits the complete polymerization of monomers on the surface (Suh, 2004). Although specimens in both the nitrogen group and air group reached similar degree of conversion after full five minutes of post-curing, monomers prior to polymerization have a tendency to diffuse from their condensed form and this delay between initial curing and post-curing can cause more spaces between the monomers, thus making more space for discoloring agent adhesion in the molecule structure.
Several studies have reported improved physical properties of 3D-printed resin prosthesis that are cured in nitrogen-saturated conditions. Reymus reported significantly improved degree of conversion in 3D printing resin cured in nitrogen saturated condition compared to atmospheric condition, which matches the results of current FT-IR spectroscopy results (Reymus et al., 2019). Also, a recent study demonstrates post-curing in nitrogen saturated condition improved Vickers hardness number and degree of double bond conversion (Wada et al., 2022). Although surface hardness is not directly related to color stability, surface hardness is related to polymerization rate and degree of conversion on the surface. A harder surface implies a higher degree of polymerization, and this higher polymerization rate could be the reason for color stability since unpolymerized resin monomers are more susceptible to discoloration. In addition, observation through SEM revealed resin surface post-cured in nitrogen-saturated condition was smoother than those post-cured in normal air, and this smoother surface might have prevented discoloring agents from easily being attached to the surface (Köroğlu et al., 2016).
Although most of the studies with nitrogen-saturated post-curing mode suggest improved physical properties on the surface, it is suggested that its advantageous effects are only restricted to the surface. If the post-cured surface is removed by polishing procedure, there was no significant difference in microhardness or degree of conversion rate (Wada et al., 2023). It might be obvious since nitrogen saturated atmosphere is only in contact to the surface of prosthesis. Therefore, if polishing is to be arranged before the delivery of prosthesis, post-curing in nitrogen condition might be unnecessary in terms of color stability. Still, the physical properties above are not directly connected to color stability, and further investigation is needed on the color stability itself.
Curry showed the most discoloring effect compared to other discoloring agents. Also, in post-hoc test, wine exhibited a significant difference only after the 4 weeks of immersion time and curry showed a significant difference after 5 days which was much faster than the other discoloring agents. The main component that causes discoloration in curry solution is curcumin. Curcumin is a hydrophobic organic molecule that exhibits keto-enol tautomerism (Stankovic, 2004). Unlike coffee and wine which are acidic and hydrophilic, curcumin has hydrophobic characteristics, and this might have caused more pigment attachment to the surface of prosthesis, which is also hydrophobic. The reason why the nitrogen group showed less discoloration might have been due to the dense molecular structure formed from rapid conversion rate in nitrogen-saturated condition as stated before.
Current study investigated the color stability of 3D printed resin cured in nitrogen-saturated condition, whereas most of previous studies were focused on physical properties and degree of conversion. Also, the specimens used in this study are fabricated according to their actual clinic use which is in crown configuration. This configuration mimics the actual clinical situation where these 3D printed prothesis are used and may present more clinically practical data.
However, this study also presented many limitations. The color measurement instrument might not have made perfect contact with the specimen since the veneer crown configuration has curves and the instrument tip is flat. This might have led to measuring errors in the study. Also, the specimens were not tested in real clinical situations where saliva acts as cleansing material and brushing teeth was absent in the whole experimental time. In those conditions, the resin prosthesis might have resulted in less discoloration. Thus, since this study is only limited in the in-vitro, additional study is needed to assess the efficacy of nitrogen-saturated post-curing in clinical applications.
5. Conclusions
Within the limitations of this current study, it was concluded that:
- 1)
3D-printed crowns were susceptible to discoloration in various discoloring agents, and discoloration increased with the time of contact.
- 2)
Post-curing in nitrogen saturated condition improved the color stability of 3D-printed crowns.
- 3)
On the surface of 3D-printed crowns, degree of conversion reached its full extent faster in nitrogen saturated condition compared to normal air curing conditions.
References
- Abduo, J., Lyons, K., & Bennamoun, M. (2014). Trends in computer-aided manufacturing in prosthodontics: a review of the available streams. Int J Dent, 2014, 783948. [CrossRef]
- Garcia, C. R., Rumpf, R. C., Tsang, H. H., & Barton, J. H. (2013). Effects of extreme surface roughness on 3D printed horn antenna. Electronics Letters, 49(12), 734-736. [CrossRef]
- Ghinea, R., Pérez, M. M., Herrera, L. J., Rivas, M. J., Yebra, A., & Paravina, R. D. (2010). Color difference thresholds in dental ceramics. J Dent, 38 Suppl 2, e57-64. [CrossRef]
- Kim, D., Shim, J. S., Lee, D., Shin, S. H., Nam, N. E., Park, K. H., Shim, J. S., & Kim, J. E. (2020). Effects of Post-Curing Time on the Mechanical and Color Properties of Three-Dimensional Printed Crown and Bridge Materials. Polymers (Basel), 12(11). [CrossRef]
- Köroğlu, A., Sahin, O., Dede, D., & Yilmaz, B. (2016). Effect of different surface treatment methods on the surface roughness and color stability of interim prosthodontic materials. J Prosthet Dent, 115(4), 447-455. [CrossRef]
- Perea-Lowery, L., Gibreel, M., Vallittu, P. K., & Lassila, L. (2021). Evaluation of the mechanical properties and degree of conversion of 3D printed splint material. J Mech Behav Biomed Mater, 115, 104254. [CrossRef]
- Reymus, M., Lümkemann, N., & Stawarczyk, B. (2019). 3D-printed material for temporary restorations: impact of print layer thickness and post-curing method on degree of conversion. Int J Comput Dent, 22(3), 231-237.
- Shin, J. W., Kim, J. E., Choi, Y. J., Shin, S. H., Nam, N. E., Shim, J. S., & Lee, K. W. (2020). Evaluation of the Color Stability of 3D-Printed Crown and Bridge Materials against Various Sources of Discoloration: An In Vitro Study. Materials (Basel), 13(23). [CrossRef]
- Song, S. Y., Shin, Y. H., Lee, J. Y., & Shin, S. W. (2020). Color stability of provisional restorative materials with different fabrication methods. J Adv Prosthodont, 12(5), 259-264. [CrossRef]
- Stankovic, I. (2004). CURCUMIN Chemical and Technical Assessment (CTA).
- Suh, B. I. (2004). Oxygen-inhibited layer in adhesion dentistry. J Esthet Restor Dent, 16(5), 316-323. [CrossRef]
- Wada, J., Wada, K., Gibreel, M., Wakabayashi, N., Iwamoto, T., Vallittu, P. K., & Lassila, L. (2022). Effect of Nitrogen Gas Post-Curing and Printer Type on the Mechanical Properties of 3D-Printed Hard Occlusal Splint Material. Polymers (Basel), 14(19). [CrossRef]
- Wada, J., Wada, K., Gibreel, M., Wakabayashi, N., Iwamoto, T., Vallittu, P. K., & Lassila, L. (2023). Effect of Surface Polishing on Physical Properties of an Occlusal Splint Material for Additive Manufacturing under Protection Gas Post-Curing Condition. Polymers (Basel), 15(3). [CrossRef]
- Yoshiaki, N., & Masahiro, K. (2015). Tooth Preparation (1 ed.). Daehannarae.
|
Disclaimer/Publisher’s Note: The statements, opinions and data contained in all publications are solely those of the individual author(s) and contributor(s) and not of MDPI and/or the editor(s). MDPI and/or the editor(s) disclaim responsibility for any injury to people or property resulting from any ideas, methods, instructions or products referred to in the content. |
© 2024 by the authors. Licensee MDPI, Basel, Switzerland. This article is an open access article distributed under the terms and conditions of the Creative Commons Attribution (CC BY) license (http://creativecommons.org/licenses/by/4.0/).
