
Submitted:
05 January 2024
Posted:
05 January 2024
You are already at the latest version
Abstract
The performance of Integrated Multisatellite Retrievals for GPM (V06B-IMERG) is evaluated at subdaily and daily scale using 10 years of heavy precipitation over a region in the Western Med-iterranean for different temporal aggregations with a dense network of rain gauges. On a half-hourly scale, the contribution of passive microwave (PMW) and infrared (IR) sources in the satellite estimates was considered, as well as the relation of various microphysical properties of cloud tops using Cloud Microphysics (CMIC- NWC SAF) data. IMERG shows a marked tendency to underestimate precipitation compared to rain gauges as the rainfall intensity threshold and temporal resolution increases. Results indicate that the negative bias is weaker when retrievals are due to PMW data. On the other hand, the benefits of filling the PMW gaps of IMERG by including IR information come at the expense of increasing the bias. IMERG performs dramatically better in the presence of precipitating ice clouds compared to warm and mixed phase clouds, which seems to be related with microphysical properties such as cloud optical thickness and cloud top effective radius. This work contributes to the understanding of the factors affecting satellite estimates of extreme precipitation and their relationship with the microphysical characteristics of clouds, which generates added value for further downstream applications and users’ decision making.
Keywords:
GPM IMERG
; extreme precipitation
; cloud microphysics
; NWC SAF
; PMW sources
; precipitation intensity
; amount
; and duration
1. Introduction
The Mediterranean basin is a particularly challenging mid-latitude area for remote rainfall estimation, as precipitation may be caused by weather systems of different nature such as mesoscale convective systems, intense extratropical cyclones and tropical-type cyclones [1,2,3,4,5]. This fact, coupled with the uncertainties involved in precipitation projections and the expected intensification of extreme precipitation in the next decades [6,7], makes studies in this area an important issue [8]. Precisely, reliable detection of the most intense precipitation events is crucial for the development of early warning systems, disaster management strategies and water resource management.
Satellite precipitation estimates such as the Integrated Multisatellite Estimates for GPM (IMERG) products provide valuable information over areas not covered by ground-based weather radars or rain gauge networks. The main basis of IMERG is to incorporate, merge and intercalibrate various infrared and microwave (MW) observations [9]. The resulting high spatio-temporal resolution (0.1° × 0.1° and 30 min) on a global scale makes IMERG one of the most interesting products for the study of convective phenomena that generate extreme precipitation [10,11,12].
IMERG Version 6B (V06B) spans a period of more than 20 years with three different latency runs targeting disaster response (EARLY), agricultural modelling and public health applications (LATE), and research (FINAL). The validation of IMERG is of paramount importance for understanding and addressing estimation errors, both for algorithm improvements and to document the capabilities and limitations for further applications developed by the scientific and operational communities [13]. Past research has confirmed IMERG ability to reproduce global spatial features of precipitation fields at yearly and seasonal scales [14,15,16]. However, spaceborne precipitation estimates at shorter time scales, particularly in case of heavy rainfall events, pose more challenges, with a general tendency to underestimation [12,16,17,18,19,20,21].
In addition to this, and despite the large amount of work aimed at evaluating IMERG in different regions around the world, Pradhan et al. [22] reviewed a number of limitations, gaps, and suggestions provided in recent studies. A relevant conclusion they reported was that the evaluation of IMERG products at multiple scales simultaneously rather than constraining the analysis to a single spatial and temporal resolution could help to better understand how the accuracy and errors vary with spatio-temporal aggregation and under different precipitation conditions. The latter can be addressed for different types of microphysical features of precipitating clouds, as well as on the effect of different sensors contributing in the final IMERG products. Indeed, the works by Tan et al. [23] and Gebregiorgis et al. [24] recommend an individual evaluation of the underlying PMW and IR sources to detect error cancelation effects. Some works such as Maranan et al. [11] and Rajagopal et al. [25] have addressed issues directly related to cloud microphysics in the retrieval process as well as the behavior of the different sensors contributing to the IMERG. They recommend extending these studies to different regions with their own characteristics from this perspective.
Based on these considerations and taking as reference a previous study comparing IMERG products at different time scales with a dense rain gauge network over Catalonia, in NE Spain [16], the objective of this work is the evaluation of IMERG V06B in the estimation of heavy rainfall events at daily and subdaily scales in this region considering different intensity thresholds. The validation strategy further seeks to identify the contribution of different sensors (infrared and passive microwave) that contribute to IMERG retrievals and in a subsequent step to identify the linkage of various microphysical properties of the precipitating cloud top in the estimation of heavy rainfall. Semi-hourly temporal evaluation based on IMERG sources and cloud properties can provide valuable information on the behavior, strengths, and weaknesses of IMERG in the detection of such events.
The rest of the article is organized as follows. Section 2 provide a detailed description of the methodology, data and assessment metrics used. Section 3.1 provides an overview of the rain gauge precipitation and the IMERG precipitation characteristics, while Section 3.2 compares the rain gauge observations and IMERG estimates at different time scales simultaneously under different intensity thresholds. Section 3.4, Section 3.5 and Section 3.6 focus on the half-hourly scale, considering sensor contributions and the relationship with cloud microphysical properties. The most significant results are discussed in Section 4, and finally a summary of the most relevant aspects is given in Section 5.
2. Materials and Methods
2.1. Datasets
2.1.1. GPM IMERG V06B data
The GPM core satellite and the rest of GPM constellation satellites contribute to the IMERG algorithm [9] where data are used to calibrate, fuse, and interpolate precipitation estimates from several microwave and infrared sensor sources every 30 minutes, at a spatial resolution of 0.1°x 0.1° and global coverage from -90° S to 90° N latitude. The GPM core satellite has a dual-frequency precipitation radar and a 13-channel PMW GMI imager. The IMERG Early and Late V06B level 3 data with a latency of 4 and 14 hours respectively were considered in this study focused on the low latency IMERG products. The IMERG Final run, with 3.5 month latency required for gauge data climatological adjustment, was discarded for its much higher latency and also because provided worse results for heavy rainfall at daily and sub daily scales according to some studies [16,26].
The IMERG algorithm starts from an initial calibration of all PMW sensors associated with the GPM Combined Radar-Radiometer (CORRA) precipitation estimates and merges them from their original spatial resolution into the IMERG grid [13]. In areas without a direct PMW pass, these are spatio-temporally transformed forward in the Early version and backward and forward in the Late product using numerical model-derived motion vectors of total column water vapor (through the so-called MORPH method) [27]. Beyond a forecast time of ± 30 minutes from the near direct PMW observation, PMW-calibrated precipitation estimates from geostationary IR satellites via a Kalman filter principles are included [13,28].
IMERG semi-hourly NetCDF files (here downloaded from https://disc.gsfc.nasa.gov/) contain explicit information on the data type used in the precipitation estimate through the “PrecipitationCal” variable. In this work, we consider four categories associated with each precipitation estimate: (1) direct PMW overpasses (PMW-direct), (2) MORPH, (3) combination of PMW and transformed IR and (4) direct IR. These categories were obtained from the IMERG variables “HQprecipitation” (High-Quality precipitation from all available passive microwave sources) and “IRKalmanFilterWeight” (IR-data weights in MW Kalman smoothing). While the former is used to identify direct PMW, the latter quantifies the weight of IR observations wherever PMW direct is absent and varies from 0% (MORPH only) to 100% (IR only) [11].
2.1.2. Rain gauge data
The validation of the IMERG products was performed using rain gauge records (hereafter RG) from the network of automatic stations of the Meteorological Service of Catalonia (SMC). Semi-hourly records with a resolution of 0.1 mm were obtained in UTC time between 01/03/2014 and 11/10/2023, a period starting with the availability of GPM data. A quality control scheme is applied to SMC rain gauge records based on comparisons with nearby stations and correlation analysis [29,30]. Of the 417 IMERG pixels covering the region of Catalonia, 164 of them were associated with the 186 rain gauges considered in this study. According to the spatial distribution, this means that 40% of the IMERG pixels contain at least one rain gauge and 5% contain two rain gauges (Figure 1). This corresponds to an overall density of 1.13 rain gauges per 100 km², which represents more than six times the threshold recommended by the World Meteorological Organization (WMO) for inland flat and undulating areas [31].
2.1.3. CMIC NW SAF product
The relationship between heavy rainfall events recorded both by rain gauges and IMERG estimates with cloud top microphysical properties was investigated from data provided by the Cloud Microphysics (CMIC) product, developed by the EUMETSAT's Nowcasting Satellite Application Facility (NWC SAF) [32].
CMIC was developed to support nowcasting applications, allowing the characterization of rapidly developing storms [33]. In this work four CMIC variables are used: (1) Cloud top phase, of which only those time intervals with liquid, ice or mixed presence are analyzed; (2) Cloud top effective radius (), defined as the weighted mean of the droplet size distribution; (3) Cloud optical thickness (COT); and, (4) Cloud liquid water path (LWP) and Cloud ice water path (IWP) that quantify the vertically integrated amount of liquid and frozen water droplets respectively. These two quantities can be estimated from:
where subindices l and i refer to liquid and ice respectively, so and represent the density and cloud top effective particle radius of liquid water and ice.
Note that the CMIC product has a spatial resolution of 3 km and 15-minutes of temporal resolution. To compensate for spatial differences in rain gauges and IMERG, values were taken at the closest grid point to each meteorological station. In terms of temporal resolution, the 15-minute CMIC data were aggregated to 30-minute resolution. The cloud top phase variable was aggregated according to the criteria described in Appendix A, table A.1 and for the rest of the variables the mean value of the two 15-minute intervals were taken. When one 15-minute interval detected ice and the other one liquid, then the phase was defined as mixed. For these cases, the variable Total water path (TWP) is generated as the sum of the IWP and the LWP recorded in the two 15-minute intervals that contribute to the semi-hourly aggregation.
2.3. Methodology
2.3.1. Definition and selection of extreme precipitation events
The IMERG validation process performed here is based on a pixel-to-point comparison [17,34] applied in such a way that information was obtained from the grid closest to each weather station. This method allows a pairwise comparison between concurrent the precipitation data of the RG and IMERG pixels at each time step. This approach avoids uncertainties arising from interpolating RG data, in a region characterized by high orographic and climatic variability [16]. As mentioned in Section 2.1.2, IMERG pixels contained two rain gauges but, as gauge data are independent, they were treated as two different data points.
The first part of this study focused on evaluating the behavior of the IMERG Early and Late versions in the estimation of intense precipitation, considering different sub-daily temporal aggregations in the period 2014-2023. The temporal resolutions 1 h, 3 h, 6 h, 9 h, 12 h and 24 h were obtained from the aggregation of the semi-hourly accumulations of the initially created database. This initial database was constructed with records of at least 0.1 mm accumulated in 30 minutes present in both the rain gauges and IMERG. Note that 0.1 mm is the minimum precipitation threshold detected by the RG and by the GPM Ka band radar [35].
To obtain the different extreme precipitation thresholds for different temporal aggregations, the method described by Jenings [36] and recent works [37,38,39,40] was applied. This method is since a linear relationship between the maximum precipitation amount P and the temporal duration D in a log-log space can be found, so that the data follow a power law equation:
where a is the prefactor and b is the scaling coefficient.
Instead of directly using the curve fit of the extreme data to characterize the extreme precipitation records in Catalonia, the upper envelope method was used, i.e. that curve which is greater than or equal to all the data, with a power-law scaling line. The specific method for deriving the envelope line is described in the paper Gonzalez and Bech [39] and allows to derive curves estimating maximum precipitation amounts for different time periods based on observed records.
The scaling law of adjusted extreme precipitation derived from equation (2) expressed as a linear function is:
Once the upper envelope fitting curve corresponding to the reference data from the rain gauges was created, proportional curves (1 %, 5 %, 10 % and 18 %) of equal slope were produced for the generation of various intensity thresholds. Results and thresholds selected by this method are shown in Section 4.1.
The second part of the paper focuses on the evaluation of only IMERG Early product and sources at half-hourly resolution only under different extreme precipitation criteria based on the envelope curve. The results are stratified according to the characteristics of the precipitating cloud phase: liquid, ice and mixed. Due to the availability of NWC SAF data, 17 case studies between 2021 and 2023 are selected for this analysis. The selected cases, are characterized by extreme precipitation events both in RG and by IMERG at multiple weather station locations, exceeding the heavy rainfall threshold set by the Meteorological Service of Catalonia (20 mm in 30 minutes). In this way, the sample is selected to allow for a detailed study of the properties of clouds related to episodes of intense precipitation observed at ground level by RG and estimated by IMERG.
2.3.2. Point-pixel validation measures
IMERG products were validated through two approaches: categorical scores based on contingency tables, and continuous statistical scores. The first approach considered a 2x2 contingency table with four possible scenarios for a given threshold (see Table 1) from which several categorical scores used were computed (Table 2): The Probability of Detection (POD), representing the proportion of events correctly detected by IMERG out of the total observed rainfall events, and the False Alarm Ratio (FAR) representing the fraction of false detected rainfall events.
Continuous statistical scores used were Spearman's correlation coefficient, BIAS, Rbias, MAE and RMSE (Table 3). BIAS is a measure of the average error between IMERG and RG, while Rbias describes the systematic error. Positive (negative) values of BIAS and Rbias denote overestimation (underestimation) by the satellite products. MAE shows the average size of the absolute errors and, finally, the RMSE measures the size of the average error, giving more weight to large errors without showing the direction of deviation between IMERG and RG.
3. Results
3.1. General characteristics of extreme precipitation events
Figure 2 shows the log-log plot of the precipitation accumulations or depth (mm) versus duration (D) in minutes of the extreme precipitation records from 2014 to 2023 in Catalonia from both the RG and from IMERG Early and Late runs taken at the grid points closest to the location of the rainfall events. In all three datasets, the line fit (equation 2) has been calculated using a least squares linear regression and expressed in power law. Using the method described in Section 2.3.1 the envelope curve is also plotted for the RG records.
A graphical inspection allows us to detect a great similarity between the maximum values estimated by IMERG Early and Late. Both products show a large underestimation of the maximum threshold detected by the RGs in time aggregations below 6 h, more marked at the half-hourly scale. In fact, from 6 h to 18 h IMERG shows a change in the trend overestimating precipitation records compared to the upper envelope curve of the RG. The higher exponent of b in the fitting equation of the IMERG products suggests that satellite estimates of extreme rainfall increase at a higher rate with duration than the RG extreme precipitation records. This is related to a higher frequency of extreme precipitation events (Figure 3), especially in areas of northeastern Catalonia. It should be mentioned that these IMERG extremes are only evaluated on the pixels closest to the location of the RG rainfall events, discarding other IMERG values that can be higher.
Finally, 1 %, 5 %, 10 % and 18 % of the envelope curve of the RG are considered to take the threshold values of reference intensity in each temporal aggregation. Table 4 lists the precipitation threshold values taken as reference for each temporal aggregation. Note that 18% of the envelope curve at the half-hourly scale represents an amount of 20 mm in 30 minutes, a considerable precipitation amount at this scale and also a very close value to the reference threshold for short term heavy rainfall considered by Meteorological Service of Catalonia [41].
3.2. Evaluation of IMERG at multiple time scales and intensity thresholds
The evaluation of the IMERG Early and Late products compared with RG records was performed for selected sub-daily and daily time aggregations. Figure 4 shows boxplots of BIAS and MAE for both products considering as precipitation intensity threshold 18 % of the envelope curve. In this figure, the first quartile, the median and the third quartile of the distribution are identifiable considering errors calculated at all stations in the study region, boxplot whiskers extend to 1.5 interquartile range and outliers extending further away are also plotted. For consistency between aggregations, the results are shown in mm/h.
According to the BIAS found, there is a tendency for IMERG rainfall values to be underestimated, decreasing for longer aggregation periods. The underestimation increases as the precipitation intensity threshold increases. The best results with values between -0.07 and -0.03 mm/h of BIAS and 0.74 mm/h of MAE are observed at daily scales for the lowest intensity threshold evaluated (1 %)(see Table 5). On the other hand, the worst results are observed on a semi-hourly scale, which shows the deficiencies of IMERG in the quantification of extreme precipitation at the shortest time resolution available. This agrees with previous studies [12,18,42,43] where similar results were found.
A good approximation for the detection of heavy precipitation with near real-time application was obtained for aggregation intervals equal to or greater than 6 h, with an average error mean absolute of 1.36 mm/h for a 1% threshold and 5.44 mm/h for an 18 % threshold. Although IMERG Late shows slight improvements over the Early version for most of the time aggregations, it is not possible to identify a statistically significant difference. The use of one over the other would be conditioned to the advantages that the latency in which the data is generated may offer.
3.2.1. Categorical scores
Figure 5 shows POD and FAR values based on the contingency table elements for each temporal aggregation and according to the envelope curve-based precipitation intensities. The detection of precipitation events with acceptable skill (dark reddish shaded colors on Figure 5, i.e. POD ≥ 0.5 and FAR ≤ 0.5 is limited in both products mostly for precipitation intensities greater than or equal to 1 % and greater than 6 h of temporal aggregation. The ability of IMERG to identify extreme rainfall events decreases substantially with increasing rainfall intensity and temporal resolution. If we consider thresholds greater than or equal to 5 % of the envelope curve, no temporal aggregation exceeds 50 % of correctly detected cases. This behavior is more critical in the detection of events at 30 minutes and 1 h, where thresholds higher than 10% of the curve do not exceed 8 % (30 min) and 15 % in 1 h. According to these results IMERG lacks the ability to detect events above or equal to 5 % of the envelope curve.
While event detection may be acceptable (greater or equal than 0.50) for 1 % rainfall rate envelope thresholds they decrease rapidly for higher rainfall rates, reaching only 0.02 or 0.03 at 30 minutes for the 18 % threshold, the SMC standard for heavy rainfall. IMERG products also show significant deficiencies in the generation of false alarms. For both Early and Late products, limitations are significant at all temporal aggregations with intensities above 5 % of the envelope curve and even at a half-hourly timescale at or above 1 % of the envelope curve, FAR exceed 0.50 values systematically.
From thresholds above 10 % of the curve for time aggregations below 3 h, false alarm rates are close to 0.90 (1.0 at 30 minutes) and above 0.70 for lower resolutions, illustrating the low skill of IMERG products with heavy rainfall at high temporal resolution.
3.3. Assessing the contribution of sensors on a semi-hourly scale.
To get a better understanding of the limitations of IMERG 30-minute precipitation estimates, a deeper analysis using precipitation cloud microphysical characteristics is performed considering 17 heavy rainfall days that occurred from 2021 to 2023. The analysis was performed with both IMERG Early and Late runs but only results based on Early runs are presented here, as they were very similar, and the shorter latency of Early products compared to Late runs (4 h instead of 14 h) make them more useful for near real time applications. This is of particular interest for early warning systems devoted to the surveillance of extreme precipitation and subsequent flash floods.
IMERG precipitation estimates are based on direct PMW overpasses (PMW - direct), spatio-temporal advected PMW information (MORPH), the combination of MORPH and IR (MORPH+IR) and observations based on IR information only. In the semi-hourly data for the 17 selected days, IMERG precipitation estimates from MORPH+IR sources dominate (61.6 %), followed by PMW-direct (20.2 %) and MORPH (16 %). Only a small fraction is represented by IR-only sources (2.1 %), which are not considered in this error analysis.
In Figure 6 (Top row) a clear underestimation for all IMERG sources is evident as all fit lines and associated 90 % error areas are well below the diagonal of the scatter plot. This is even more marked in the case of MORPH+IR for higher rainfall intensity thresholds. Figure 6 (Bottom row) shows the elements of the contingency table for each source contributing to the IMERG estimate according to the selected intensity threshold. Note that correct negatives, which represent more than 90% of the cases, are not shown. As expected, the hit fraction degrades with increasing rainfall rate thresholds and in all cases the estimates showing the highest skill in event detection come from the direct PMW sensors followed by MORPH. In fact, for thresholds greater than or equal to 20 mm/30 min, the few cases detected by IMERG are due to them. Previous studies [13,44,45] identified that PMW data generally represent precipitation rates better than IR data, since PMW radiometers are sensitive to hydrometer precipitation in the atmospheric column, unlike IR sensors which are limited to cloud top measurements. Maranan et al. [11] mention that IR retrievals misjudge cold cloud features as rain, not precipitation anvils.
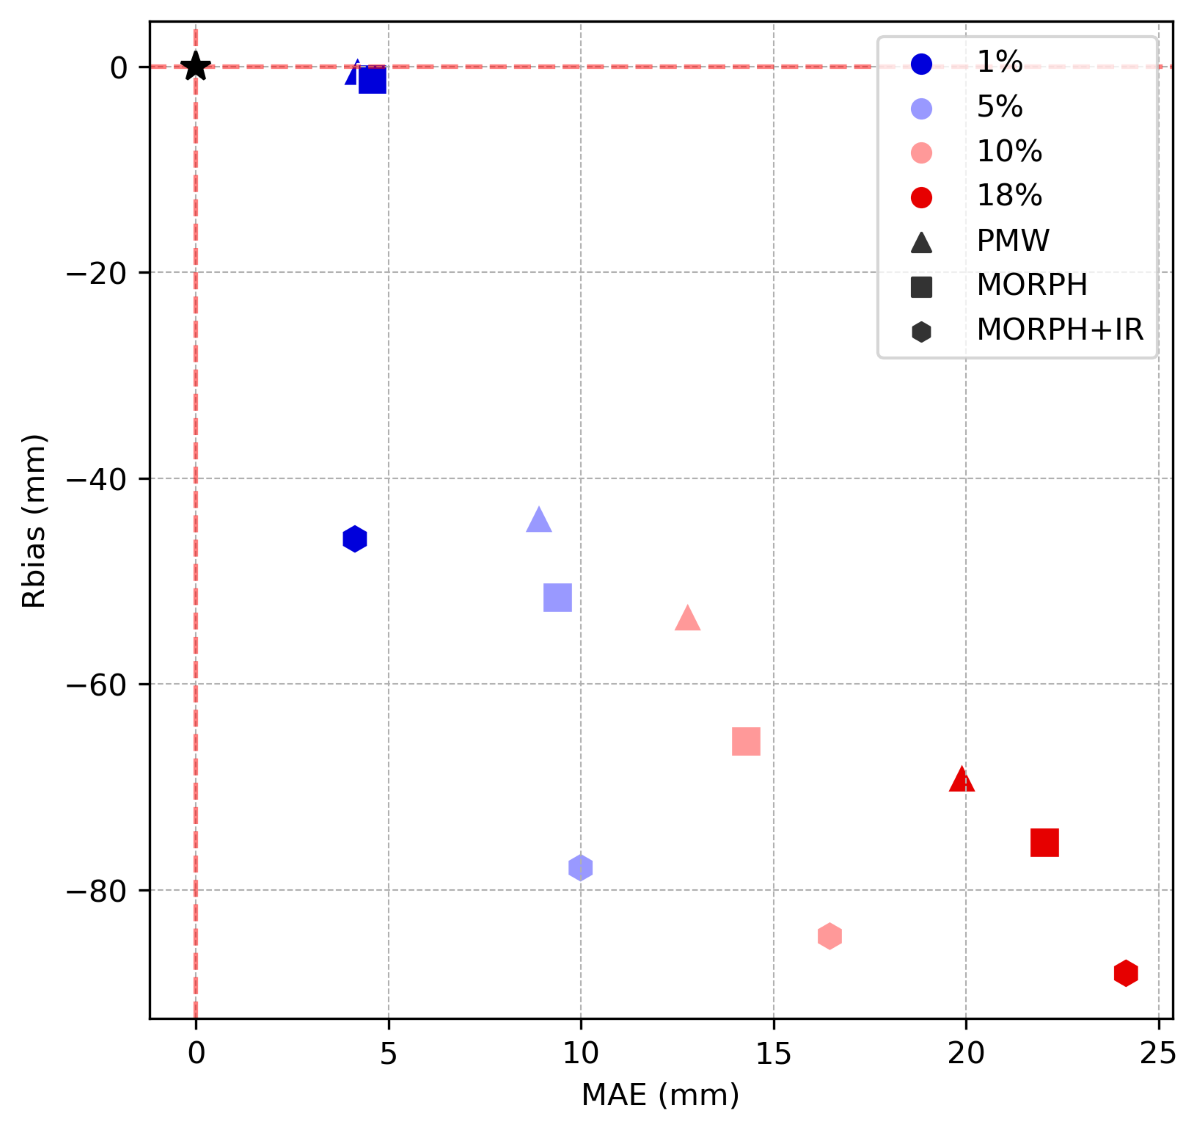
While the underestimation of high rainfall rates in IMERG comes from all sources, the negative bias is the lowest for PMW-direct and low rainfall rate thresholds (i.e. 1 % of the envelope curve, close to ideal top left location of Figure 7). However, this bias appears to be an inherent problem with the PMW algorithm, which is amplified by the MORPH and IR data. On the contrary, worst results are obtained for MORPH+IR and the highest rainfall rate threshold considered (18 %), located at the worst location (bottom right) of Figure 7.
The benefits of filling the IMERG PMW gaps by including MORPH and IR information come at the expense of increasing Rbias and MAE for heavy rainfall rates. The above analysis of categorical variables agrees with the trend seen in the analysis of continuous errors. The BIAS errors for thresholds >= 18% of the curve are close to 20 mm, which means an almost null ability of the IMERG to detect these events.
3.4. Relationship between IMERG sources and microphysical properties of the clouds
In this section, the IMERG comparison with rain gauges is broken down according to the cloud phases and different microphysical properties of the precipitating clouds. The incorporation of high-resolution cloud top information from CMIC NWC SAF provides additional and independent information that allows us to better understand the behavior of IMERG and its data sources under different RG rainfall intensity thresholds.
Table 6 shows error and skill measures from IMERG, and its sources stratified by warm, ice or mixed heavy precipitation clouds. In our study area, as expected, the highest number of heavy precipitation events occur under ice clouds in the order 4601:117:275 (ice, liquid, mixed), where numbers indicate the individual 30 minute records.
The cases of heavy precipitation associated with warm clouds show the worst results, quite like the cases with clouds in mixed phase. In the latter cases, the BIAS and Rbias values are even greater than twice the errors reported in ice cases in all sources simultaneously, with the PMW-direct records showing the largest differences between one class and the other. For intensities greater than or equal to 1 %, the PMW sources in ice conditions are the only ones that overestimate precipitation, thus cutting the underestimation trend of the rest of the IMERG data sources. The MAE and RMSE values are higher in ice clouds precisely because heavy rainfall is mainly associated with deep moist convection.
Similarly, POD values are much higher for glaciated clouds, especially at lower precipitation intensities. In observations from PMW-direct and MORPH sources in the ice phase, POD values reflect a hit rate of 0.76 and 0.69 compared to only 0.11 and 0.24 in the liquid phase. Although false alarm rates also increase from ice phase to liquid phase clouds, they follow the same pattern of best scores for PMW based estimates compared to those where IR sources are considered.
For events above 5 % precipitation thresholds, the cases under liquid and mixed clouds provided poor results. For events above 18% thresholds the ability of IMERG is almost null under all cloud phases, but specifically in the liquid and mixed phase (with 2 cases each) it is totally null.
3.5. Relation to microphysical cloud properties
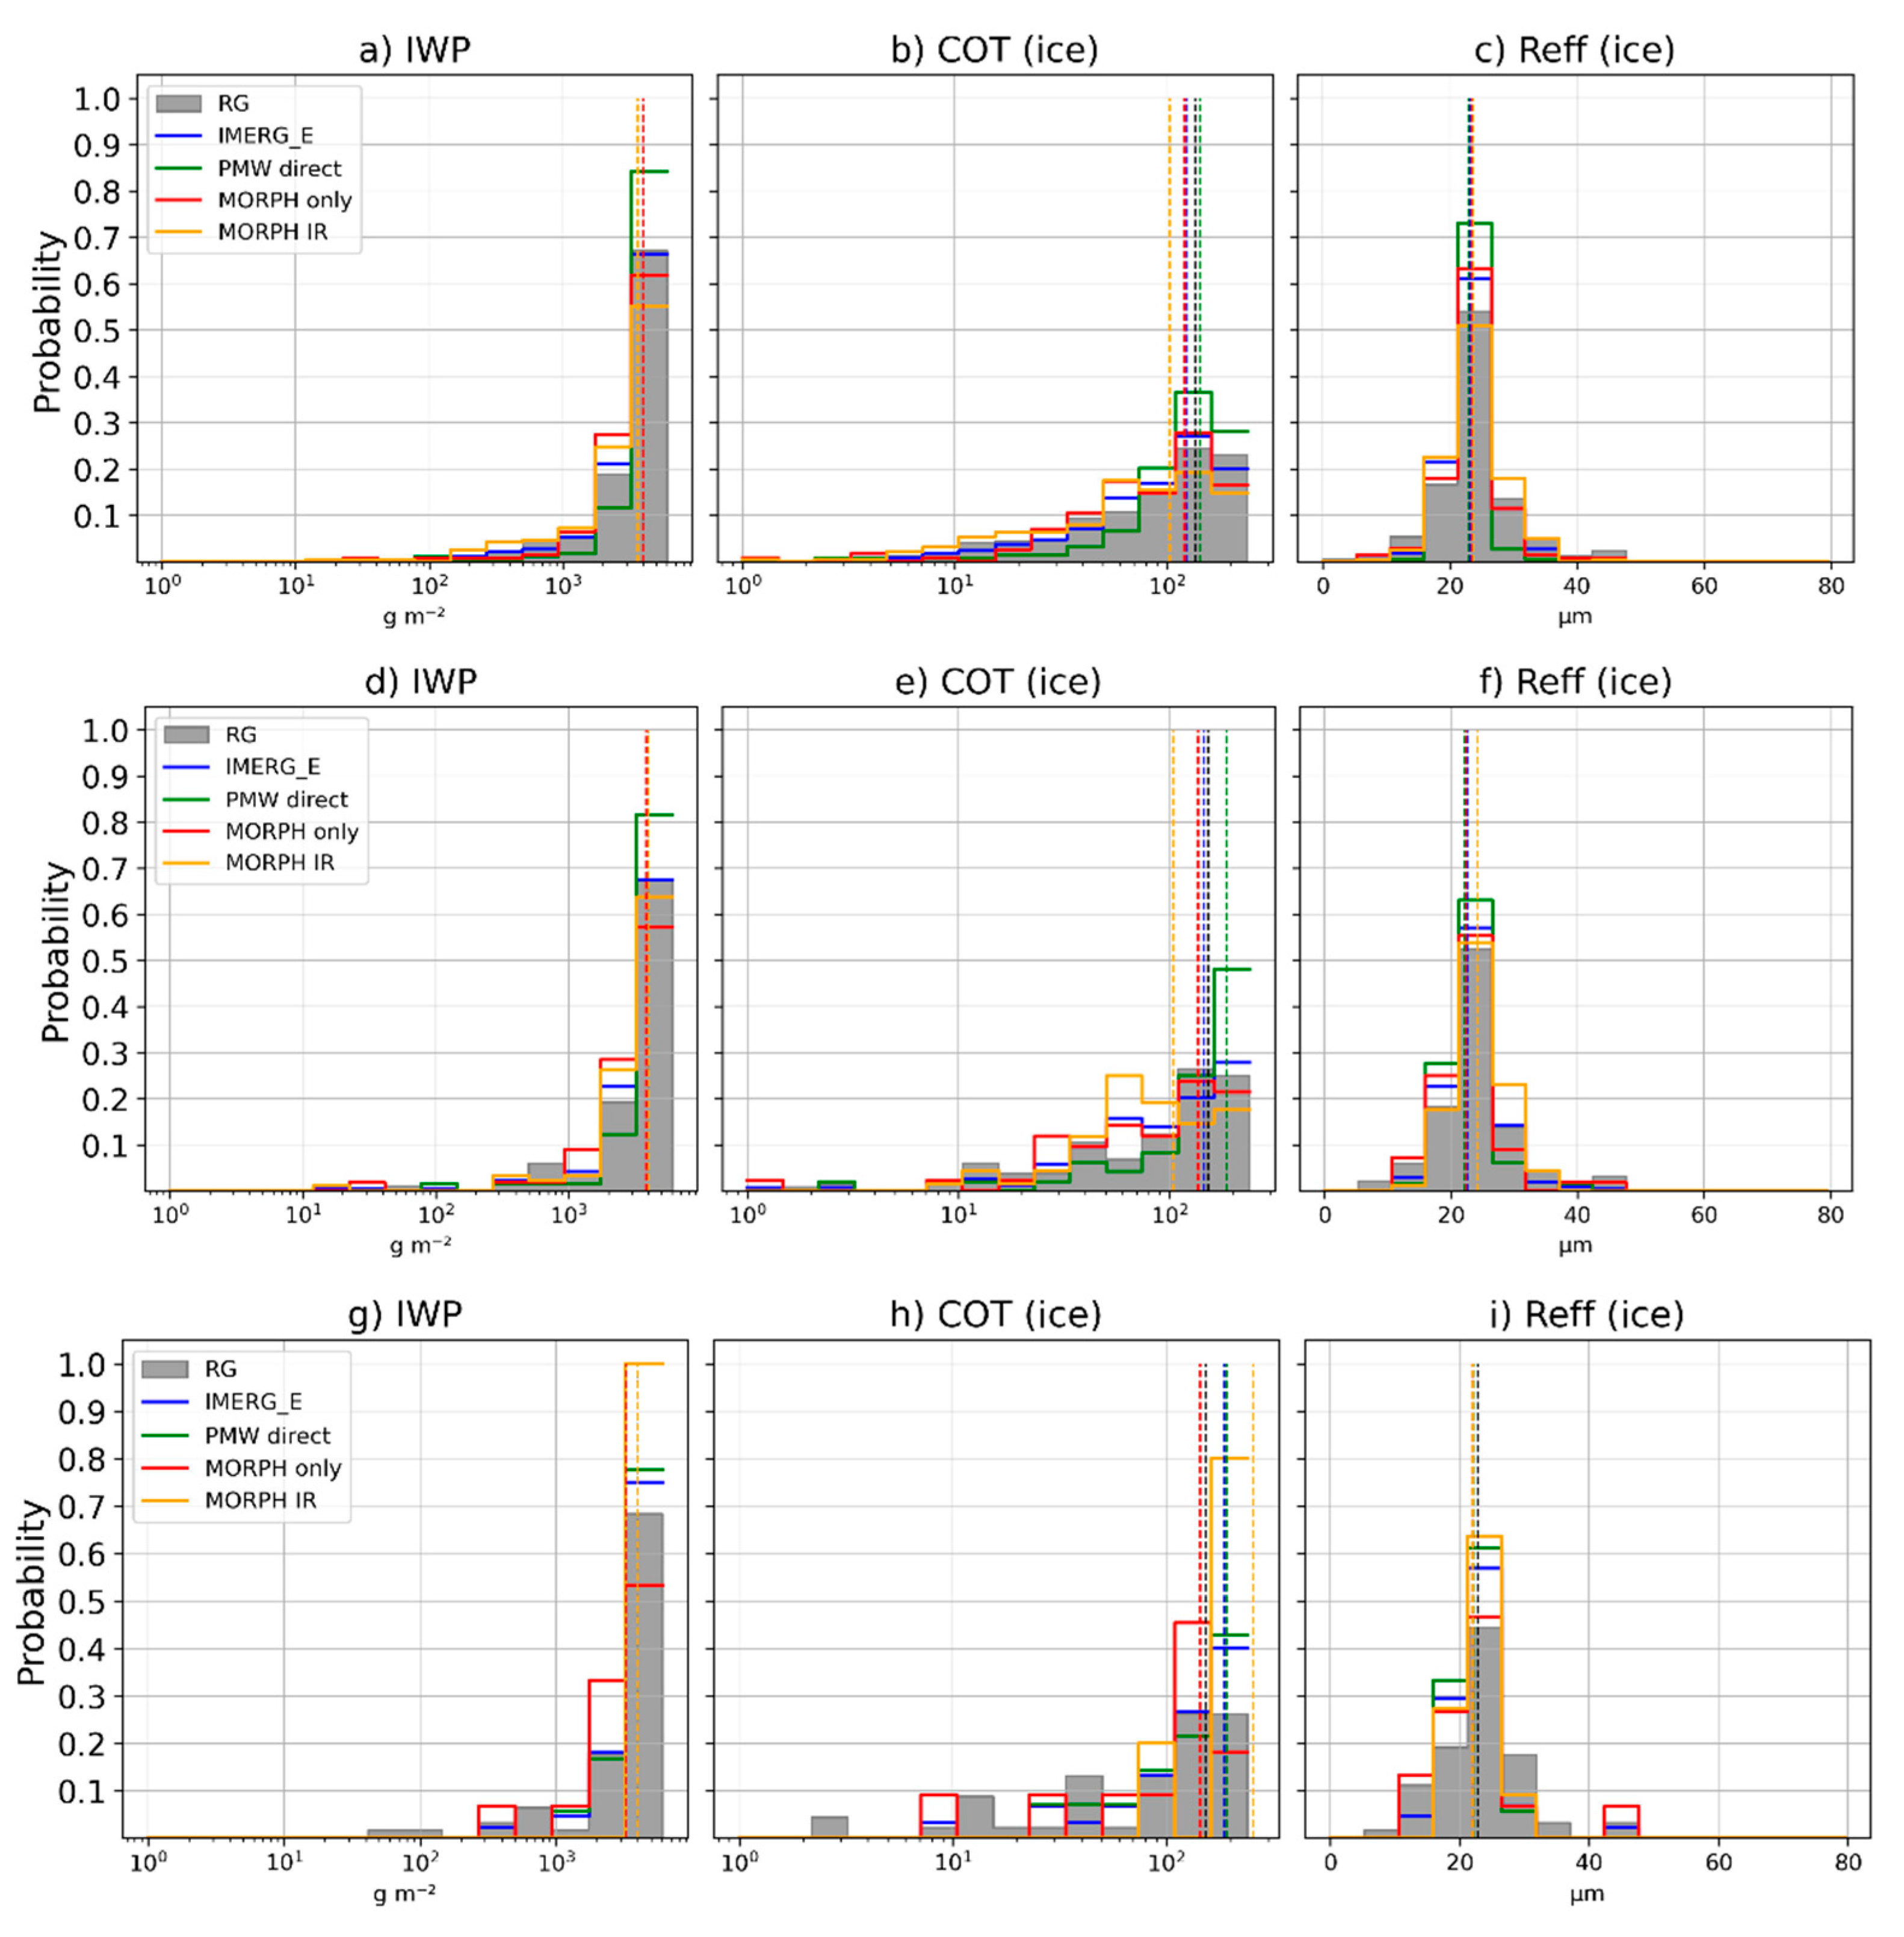
Figure 8 compares the probability distribution of cloud top properties around all time steps of intense precipitation greater than or equal to 1%. IMERG Early estimates as well as different sources are considered for comparison with RG. Only daytime precipitation samples are represented, since COT and retrievals are not available during night. The IWP, LWP and TWP, although available always, are limited to the same time set for consistency.
It should be noted that the case studies selected for the analysis were chosen precisely because of the occurrence of heavy rainfall. This behavior is reflected in the high probability of occurrence of high IWP, LWP and TWP values. IMERG and its sources overestimate the precipitation related to IWP values below 500 g m-2 and underestimate the precipitation rates related to higher IWP values compared to RG. This oversensitivity is also evident for lower COT values. The estimates generated by PMW- direct are the closest to the distribution of the RG, their median values being very similar. The distributions of the sensors related to warm clouds are much more pronounced. A high overestimation is observed for all sources related to TWP values < 1000 g m-2 and for higher values an underestimation, especially of IMERG MORPH+IR. Although once again, this behavior is reflected for lower COT values and on the contrary, overestimation is observed for higher values.
Regarding , IMERG and its sources do quite well for ice clouds but show significant overestimates particularly below 10 µm and underestimate when the is equal to or higher than the median of the observations. In the mixed phase, although there is an overestimation related to low TWP values, it is worth noting that the PMW-direct estimates maintain this overestimation directly related to a marked sensitivity to high COT values.
The PMW-direct sources, although the most accurate, are often the most sensitive to the different cloud phases. While uncertainties in rainfall occurrence associated with ice and mixed clouds are directly related to COT characteristics during the liquid phase, they are related to COT and behavior.
In a context of more intense precipitation (5 %, 10 %, 18 %) (see Figure B1, Appendix B) associated with ice clouds, a large oversensitivity related to high IWP and COT values, especially by the PMW-direct, can be noted. In all cases, extreme precipitation is overestimated with values close to the median of those recorded by the rain gauges. While observations associated with PMW-direct play a key role for intensities of 5 % and 10 %, MORPH+IR sources play a key role for intensities >= 18 %.
3.6. Origin of Hits, misses and false alarms.
Figure 9 shows distributions of percentages of each IMERG source causing hits, false alarms and misses compared to the RG. This analysis is also done considering various precipitation intensity thresholds according to all the case study data and divided according to the phase of the precipitating cloud.
While for intensity thresholds above 1 % there are no clear differences between the IMERG sources that contribute most to the hits; this behavior changes for the strongest intensity extremes (above 5 %). The PMW-direct source is responsible for the detection of these more intense precipitation events coupled with MORPH. In fact, for extremes greater than or equal to 18 % they represent 100 % of the detected cases. However, just as they contribute to the hits, they are responsible for the generation of high false alarm rates, especially for ice phase.
As far as the miss rate is concerned, it is the MORPH+IR sensors, even IR direct (although in very few cases) that have the most influence. This is evident for cases related to ice clouds from thresholds >= 1% and rather clear for liquid and mixed phases from thresholds >= 5 %. The losses of extreme events >= 20 mm/30 min are entirely associated to sensors with IR information.
A similar analysis to the one performed in the previous section is shown in Figure 10, this time focused on the distribution of the elements of the contingency table for IMERG based on precipitation events above 1 %.
The distribution of the hits is very similar to the distribution of the RG. This implies that taking the IWP as a reference, especially for high values, IMERG can detect precipitation events measured by the RG. Although it is also evident that for lower values of IWP the rate of false alarms and misses increases dramatically, which is directly related to the COT detection behavior. Although very similar to Maranan et al. [11] in this case, hits, false alarms, and misses can hardly be predicted with .
In the case of liquid and mixed phase clouds, as indicated by the low POD and high FAR values in Table 6, the IMERG performance decreases dramatically. Taking LWP as a reference, there are predominantly false alarms towards low LWP values, and many losses associated with higher values. The fact that the median of the distribution of losses in the COT and is almost identical to the distribution of the RG suggests that under this phase, IMERG misinterprets the results. In the mixed phase, false alarms are associated with low TWP and COT values. In contrast, the highest frequency of hits occurs when TWP values are quite high.
4. Discussion
The errors found in IMERG at daily and subdaily temporal aggregations and under different precipitation intensity thresholds focused on heavy rainfall show several limitations that should be considered by users of these products. There is a clear underestimation of precipitation rain gauge records, which becomes much more marked as the precipitation intensity threshold increases, and the temporal aggregation becomes shorter. The best performance in terms of the ability to detect precipitation events by IMERG is limited to relatively moderate rainfall rates (1 % of the extreme rain gauge envelope curve) and the errors measuring the accuracy of the estimates indicate that for temporal aggregations greater than 6 h, they start to become acceptable in terms of standard criteria (i.e. POD > FAR, POD ≥ 0.5, FAR ≤ 0.5). Mazzoglio et al. [12] showed similar results when defining an unacceptable probability of detection for aggregation intervals of less than 12 h. In the same way, works such as [12,46] show that with decreasing temporal resolution the ratio between observations and satellite estimates improves due to the balancing effect of the temporal aggregation of rainfall over a longer period. According to results shown in this work, for intensity thresholds higher than 5 % envelope curve, high underestimation of IMERG, lack of detection, and the manifestation of high false alarm rates start to be inherent in all temporal aggregations.
Another important aspect to consider is related to the fact that IMERG Late shows little and in some cases no improvement over IMERG Early. This means that IMERG_E, due to its shorter latency, is consolidated as the most reliable source in a near-real-time rainfall detection system. This fact strongly suggests that the negative BIAS in the identification of heavy rainfall events is not solved by increasing the amount of satellite data available later, but it is intrinsic to the algorithm used for the detection and estimation of these events.
Understanding the relationship and contribution of the different data sources that are used in IMERG estimates is essential to understand their limitations. Information from direct microwave sensors (PMW-direct) provides the best results in the estimation of rainfall extremes, while those that rely more on IR information are linked to the poorest verification scores. This is directly related to the fact that microwave estimates are often better to represent precipitation than IR retrievals [44,47] because they are more sensitive to hydrometeor precipitation in the atmospheric column, unlike IR sensors that are mostly limited to cloud top measurements [13].
Despite the advantages of direct microwave sources in event detection, they are associated with the highest false alarm rate, which is even higher than miss rate under all intensity thresholds. This means that, using these sources, IMERG can detect high precipitation intensity values, but they do not generally coincide with the time and space of rain gauge records. In this sense, it should be noted that in addition to the instrumental limitations, the results of this work must be understood from the perspective of a pixel-to-point evaluation. By comparing area-averaged rainfall data within a 0.1° grid with a point measurement within this area, we are assuming that each rain gauge represents with sufficient accuracy the average rainfall of this area, which entails certain limitations [48,49,50] much more dominant at sub-daily scales [13].
Considering the microphysical characteristics of the precipitating clouds, IMERG sources, especially PMW-direct data, are sensitive to different cloud phases and other cloud characteristics. The worst results were often related to warm clouds and mixed clouds. This reflects the dependence of the IMERG on the time at which ice particles finally form within a convective cloud. Results reported here, although representative of a semiarid climate area in the Western Mediterranean, are largely in agreement with those of Maranan et al. [11] carried out in a forested area of West Africa. Although with slight differences, the biases found in this study, especially for higher intensities, seem to be related to the IMERG processing algorithm and not so much to the dynamic mechanisms that originate the precipitation in each region.
5. Conclusions
The present study focused on the evaluation of IMERG Early and Late in the estimation of extreme precipitation. Based on information from 186 meteorological stations located in a Western Mediterranean region (Catalonia), several intensity thresholds derived from rain gauge records were taken as a reference. The evaluation also considered different temporal aggregations from the original GPM maximum temporal resolution to a daily scale between 2014 and 2023. A selection of cases with semi-hourly episodes of extreme precipitation was considered to evaluate the dependencies of IMERG retrievals and their sources on cloud microphysical properties and rain gauge observations. The main conclusions of the study are:
- IMERG shows a marked tendency to underestimate precipitation as the rainfall intensity threshold increases and the temporal resolution increases. IMERG_L does not offer relevant advantages over the IMERG_E product in the detection of extreme events.
- Although the underestimate of intense precipitation in IMERG is found for all source types, the negative bias is weaker when recoveries are due to PMW-direct data and increases when information from IR sensors is incorporated.
- PMW-direct sensors generate high false alarm rates, while the recovery algorithm with MORPH+IR sources is associated with the highest miss rates of precipitation events.
- IMERG performs dramatically better in the presence of precipitating ice clouds compared to warm and mixed clouds. Uncertainties in the occurrence of extreme precipitation associated with ice clouds are related to COT characteristics, as in the mixed phase. However, the estimation of intense precipitation associated with warm clouds shows the worst results and is related to other microphysical characteristics such as COT and
The assessment presented here is made during the changeover from IMERG 06 to 07, which includes significant changes such as the introduction of the SHARPEN scheme. Therefore, this work contributes to understanding the mechanisms of extreme precipitation satellite estimates and their relationship to cloud microphysical features. It stands for one of the few works that considers a semi-hourly resolution to study this type of event in the Mediterranean and in mid-latitudes in general. Future studies will focus on the one hand, on the evaluation of the V07 version and check if the updates to the algorithm improve its performance regarding V06. It will also be a priority to focus on the validation of GPM core satellite observations such as DPR and GMI in the estimation of heavy rainfall events.
Author Contributions
Conceptualization, E.P. and J.B.; methodology, E.P. and J.B.; formal analysis, E.P.; data curation, E.P.; writing—original draft preparation, E.P. and J.B; writing—review and editing, all the authors.; visualization, E.P.; supervision, J.B. and M.U. All authors have read and agreed to the published version of the manuscript.
Funding
This research was partly funded by the project ARTEMIS, PID2021-124253OB-I00 MINECO/FEDER) and the Water Research Institute (IdRA) of the University of Barcelona.
Acknowledgments
Satellite and gauge data for this study were provided by NASA/JAXA and meteo.cat respectively. CMIC NWC SAF data were provided by the Spanish State Meteorological Agency (AEMET)as leading entity and approved by EUMETSAT. The authors wish to thank the support from the Secretariat for Universities and Research of the Ministry of Business and Knowledge of the Government of Catalonia and the European Social Fund.
Conflicts of Interest
The authors declare no conflicts of interest.
Appendix A

Table A1.
Semi-hourly configuration of the new cloud phases from the original resolution phases (15 minutes) of the CMIC NW SAF product.
Table A1.
Semi-hourly configuration of the new cloud phases from the original resolution phases (15 minutes) of the CMIC NW SAF product.
| Interval 1 (15 min) | Interval 2 (15 min) | Resulting phase (30 min) |
|---|---|---|
| liquid | ice | mixed |
| liquid | liquid | liquid |
| ice | ice | ice |
| mixed | mixed | mixed |
| liquid/ice | mixed | liquid/ice |
| liquid/ice/mixed | cloud free/undefined | liquid/ice/mixed |
Appendix B
Figure B1.
Probability distributions of the cloud properties described in section 2.1.3 based on all time steps of intense precipitation greater than or equal to (a-c) 5 % (d-f) 10 % (g-i) 18 % of the envelope curve in the RG (gray shading), IMERG and its sources (colored lines), only for ice cloud tops. The vertical-colored lines in each plot indicate the median values of the respective distribution.
References
- Insua-Costa, D.; Lemus-Cánovas, M.; Miguez-Macho, G.; Llasat, M.C. Climatology and Ranking of Hazardous Precipitation Events in the Western Mediterranean Area. Atmospheric Research 2021, 255, 105521.
- Michaelides, S.; Karacostas, T.; Sánchez, J.L.; Retalis, A.; Pytharoulis, I.; Homar, V.; Romero, R.; Zanis, P.; Giannakopoulos, C.; Bühl, J. Reviews and Perspectives of High Impact Atmospheric Processes in the Mediterranean. Atmospheric Research 2018, 208, 4–44.
- Panegrossi, G.; Casella, D.; Dietrich, S.; Marra, A.C.; Sanò, P.; Mugnai, A.; Baldini, L.; Roberto, N.; Adirosi, E.; Cremonini, R.; et al. Use of the GPM Constellation for Monitoring Heavy Precipitation Events Over the Mediterranean Region. IEEE Journal of Selected Topics in Applied Earth Observations and Remote Sensing 2016, 9, 2733–2753.
- Rigo, T.; Llasat, M.C. A Methodology for the Classification of Convective Structures Using Meteorological Radar: Application to Heavy Rainfall Events on the Mediterranean Coast of the Iberian Peninsula. Natural Hazards and Earth System Sciences 2004, 4, 59–68.
- Siena, M.; Levizzani, V.; Marra, F. A Method to Derive Satellite-Based Extreme Precipitation Return Levels in Poorly Gauged Areas. Journal of Hydrology 2023, 626, 130295.
- del Jesus, M.; Diez-Sierra, J. Climate Change Effects on Sub-Daily Precipitation in Spain. Hydrological Sciences Journal 2023.
- Toreti, A.; Naveau, P.; Zampieri, M.; Schindler, A.; Scoccimarro, E.; Xoplaki, E.; Dijkstra, H.A.; Gualdi, S.; Luterbacher, J. Projections of Global Changes in Precipitation Extremes from Coupled Model Intercomparison Project Phase 5 Models. Geophysical Research Letters 2013, 40, 4887–4892. [CrossRef]
- Zittis, G.; Bruggeman, A.; Lelieveld, J. Revisiting Future Extreme Precipitation Trends in the Mediterranean. Weather and Climate Extremes 2021, 34, 100380. [CrossRef]
- Huffman, G.J.; Bolvin, D.T.; Braithwaite, D.; Hsu, K.-L.; Joyce, R.J.; Kidd, C.; Nelkin, E.J.; Sorooshian, S.; Stocker, E.F.; Tan, J.; et al. Integrated Multi-Satellite Retrievals for the Global Precipitation Measurement (GPM) Mission (IMERG). In Satellite Precipitation Measurement: Volume 1; Levizzani, V., Kidd, C., Kirschbaum, D.B., Kummerow, C.D., Nakamura, K., Turk, F.J., Eds.; Advances in Global Change Research; Springer International Publishing: Cham, 2020; pp. 343–353 ISBN 978-3-030-24568-9.
- Li, Z.; Tang, G.; Kirstetter, P.; Gao, S.; Li, J.-L.F.; Wen, Y.; Hong, Y. Evaluation of GPM IMERG and Its Constellations in Extreme Events over the Conterminous United States. Journal of Hydrology 2022, 606, 127357. [CrossRef]
- Maranan, M.; Fink, A.H.; Knippertz, P.; Amekudzi, L.K.; Atiah, W.A.; Stengel, M. A Process-Based Validation of GPM IMERG and Its Sources Using a Mesoscale Rain Gauge Network in the West African Forest Zone. Journal of Hydrometeorology 2020, 21, 729–749. [CrossRef]
- Mazzoglio, P.; Laio, F.; Balbo, S.; Boccardo, P.; Disabato, F. Improving an Extreme Rainfall Detection System with GPM IMERG Data. Remote Sensing 2019, 11, 677. [CrossRef]
- Watters, D.C.; Gatlin, P.N.; Bolvin, D.T.; Huffman, G.J.; Joyce, R.; Kirstetter, P.; Nelkin, E.J.; Ringerud, S.; Tan, J.; Wang, J.; et al. Oceanic Validation of IMERG-GMI Version 6 Precipitation Using the GPM Validation Network. Journal of Hydrometeorology 2023, 1. [CrossRef]
- G. Nascimento, J.; Althoff, D.; C. Bazame, H.; M. U. Neale, C.; N. Duarte, S.; L. Ruhoff, A.; Z. Gonçalves, I. Evaluating the Latest IMERG Products in a Subtropical Climate: The Case of Paraná State, Brazil. Remote Sensing 2021, 13, 906. [CrossRef]
- Moazami, S.; Na, W.; Najafi, M.R.; de Souza, C. Spatiotemporal Bias Adjustment of IMERG Satellite Precipitation Data across Canada. Advances in Water Resources 2022, 168, 104300. [CrossRef]
- Peinó, E.; Bech, J.; Udina, M. Performance Assessment of GPM IMERG Products at Different Time Resolutions, Climatic Areas and Topographic Conditions in Catalonia. Remote Sensing 2022, 14, 5085. [CrossRef]
- Fang, J.; Yang, W.; Luan, Y.; Du, J.; Lin, A.; Zhao, L. Evaluation of the TRMM 3B42 and GPM IMERG Products for Extreme Precipitation Analysis over China. Atmospheric Research 2019, 223, 24–38. [CrossRef]
- Guo, H.; Chen, S.; Bao, A.; Behrangi, A.; Hong, Y.; Ndayisaba, F.; Hu, J.; Stepanian, P.M. Early Assessment of Integrated Multi-Satellite Retrievals for Global Precipitation Measurement over China. Atmospheric Research 2016, 176–177, 121–133. [CrossRef]
- Tian, F.; Hou, S.; Yang, L.; Hu, H.; Hou, A. How Does the Evaluation of the GPM IMERG Rainfall Product Depend on Gauge Density and Rainfall Intensity? Journal of Hydrometeorology 2018, 19, 339–349. [CrossRef]
- Wang, T.; Li, Z.; Ma, Z.; Gao, Z.; Tang, G. Diverging Identifications of Extreme Precipitation Events from Satellite Observations and Reanalysis Products: A Global Perspective Based on an Object-Tracking Method. Remote Sensing of Environment 2023, 288, 113490. [CrossRef]
- Zhang, D.; Yang, M.; Ma, M.; Tang, G.; Wang, T.; Zhao, X.; Ma, S.; Wu, J.; Wang, W. Can GPM IMERG Capture Extreme Precipitation in North China Plain? Remote Sensing 2022, 14, 928. [CrossRef]
- Pradhan, R.K.; Markonis, Y.; Vargas Godoy, M.R.; Villalba-Pradas, A.; Andreadis, K.M.; Nikolopoulos, E.I.; Papalexiou, S.M.; Rahim, A.; Tapiador, F.J.; Hanel, M. Review of GPM IMERG Performance: A Global Perspective. Remote Sensing of Environment 2022, 268, 112754. [CrossRef]
- Tan, J.; Petersen, W.A.; Tokay, A. A Novel Approach to Identify Sources of Errors in IMERG for GPM Ground Validation. Journal of Hydrometeorology 2016, 17, 2477–2491. [CrossRef]
- Gebregiorgis, A.S.; Kirstetter, P.-E.; Hong, Y.E.; Gourley, J.J.; Huffman, G.J.; Petersen, W.A.; Xue, X.; Schwaller, M.R. To What Extent Is the Day 1 GPM IMERG Satellite Precipitation Estimate Improved as Compared to TRMM TMPA-RT? Journal of Geophysical Research: Atmospheres 2018, 123, 1694–1707.
- Rajagopal, M.; Zipser, E.; Huffman, G.; Russell, J.; Tan, J. Comparisons of IMERG Version 06 Precipitation at and between Passive Microwave Overpasses in the Tropics. Journal of Hydrometeorology 2021, 22, 2117–2130. [CrossRef]
- Furl, C.; Ghebreyesus, D.; Sharif, H.O. Assessment of the Performance of Satellite-Based Precipitation Products for Flood Events across Diverse Spatial Scales Using GSSHA Modeling System. Geosciences 2018, 8, 191. [CrossRef]
- Tan, J.; Huffman, G.J.; Bolvin, D.T.; Nelkin, E.J. IMERG V06: Changes to the Morphing Algorithm. Journal of Atmospheric and Oceanic Technology 2019, 36, 2471–2482. [CrossRef]
- Hong, Y.; Hsu, K.-L.; Sorooshian, S.; Gao, X. Precipitation Estimation from Remotely Sensed Imagery Using an Artificial Neural Network Cloud Classification System. Journal of Applied Meteorology and Climatology 2004, 43, 1834–1853. [CrossRef]
- Llabrés-Brustenga, A.; Rius, A.; Rodríguez-Solà, R.; Casas-Castillo, M.C.; Redaño, A. Quality Control Process of the Daily Rainfall Series Available in Catalonia from 1855 to the Present. Theor Appl Climatol 2019, 137, 2715–2729. [CrossRef]
- Llabrés-Brustenga, A.; Rius, A.; Rodríguez-Solà, R.; Casas-Castillo, M.C. Influence of Regional and Seasonal Rainfall Patterns on the Ratio between Fixed and Unrestricted Measured Intervals of Rainfall Amounts. Theor Appl Climatol 2020, 140, 389–399. [CrossRef]
- WMO E-Library Available online: https://library.wmo.int (accessed on 30 December 2023).
- CMIC_description - NWCSAF Available online: https://www.nwcsaf.org/cmic_description (accessed on 19 December 2023).
- NWC SAF, EUMETSAT Algorithm Theoretical Basis Document for the Cloud Product Processors of the NWC/GEO MTG-I Day-1 | EUMETSAT 2019.
- Mahmoud, M.T.; Mohammed, S.A.; Hamouda, M.A.; Mohamed, M.M. Impact of Topography and Rainfall Intensity on the Accuracy of IMERG Precipitation Estimates in an Arid Region. Remote Sensing 2021, 13, 13. [CrossRef]
- Lasser, M.; O, S.; Foelsche, U. Evaluation of GPM-DPR Precipitation Estimates with WegenerNet Gauge Data. Atmospheric Measurement Techniques 2019, 12, 5055–5070. [CrossRef]
- Jennings, A.H. World’s Greatest Observed Point Rainfalls. Monthly Weather Review 1950, 78, 4–5.
- Breña-Naranjo, J.A.; Pedrozo-Acuña, A.; Rico-Ramirez, M.A. World’s Greatest Rainfall Intensities Observed by Satellites. Atmospheric Science Letters 2015, 16, 420–424. [CrossRef]
- Galmarini, S.; Steyn, D.G.; Ainslie, B. The Scaling Law Relating World Point-Precipitation Records to Duration. International Journal of Climatology 2004, 24, 533–546. [CrossRef]
- Gonzalez, S.; Bech, J. Extreme Point Rainfall Temporal Scaling: A Long Term (1805–2014) Regional and Seasonal Analysis in Spain. International Journal of Climatology 2017, 37, 5068–5079. [CrossRef]
- González-Herrero, S.; Vasallo, F.; Bech, J.; Gorodetskaya, I.; Elvira, B.; Justel, A. Extreme Precipitation Records in Antarctica. International Journal of Climatology 2023, 43, 3125–3138. [CrossRef]
- Catalunya, S.M. de C.G. de Situació Meteorològica de Perill Available online: https://www.meteo.cat/wpweb/divulgacio/la-prediccio-meteorologica/situacio-meteorologica-de-perill/ (In Catalan, accessed on 11 December 2023).
- Gaona, M.F.R.; Overeem, A.; Leijnse, H.; Uijlenhoet, R. First-Year Evaluation of GPM Rainfall over the Netherlands: IMERG Day 1 Final Run (V03D). Journal of Hydrometeorology 2016, 17, 2799–2814. [CrossRef]
- Khodadoust Siuki, S.; Saghafian, B.; Moazami, S. Comprehensive Evaluation of 3-Hourly TRMM and Half-Hourly GPM-IMERG Satellite Precipitation Products. International Journal of Remote Sensing 2017, 38, 558–571. [CrossRef]
- Kirstetter, P.-E.; Petersen, W.A.; Kummerow, C.D.; Wolff, D.B. Integrated Multi-Satellite Evaluation for the Global Precipitation Measurement: Impact of Precipitation Types on Spaceborne Precipitation Estimation. In Satellite Precipitation Measurement: Volume 2; Levizzani, V., Kidd, C., Kirschbaum, D.B., Kummerow, C.D., Nakamura, K., Turk, F.J., Eds.; Advances in Global Change Research; Springer International Publishing: Cham, 2020; pp. 583–608 ISBN 978-3-030-35798-6.
- Petersen, W.A.; Kirstetter, P.E.; Wang, J.; Wolff, D.B.; Tokay, A. The GPM GV Program 2019.
- Kühnlein, M.; Thies, B.; Nauß, T.; Bendix, J. Rainfall-Rate Assignment Using MSG SEVIRI Data—A Promising Approach to Spaceborne Rainfall-Rate Retrieval for Midlatitudes. Journal of Applied Meteorology and Climatology 2010, 49, 1477–1495. [CrossRef]
- Petersen, W.A.; Kirstetter, P.-E.; Wang, J.; Wolff, D.B.; Tokay, A. The GPM Ground Validation Program. In Satellite Precipitation Measurement: Volume 2; Levizzani, V., Kidd, C., Kirschbaum, D.B., Kummerow, C.D., Nakamura, K., Turk, F.J., Eds.; Advances in Global Change Research; Springer International Publishing: Cham, 2020; pp. 471–502 ISBN 978-3-030-35798-6.
- Kazamias, A.-P.; Sapountzis, M.; Lagouvardos, K. Evaluation of GPM-IMERG Rainfall Estimates at Multiple Temporal and Spatial Scales over Greece. Atmospheric Research 2022, 269, 106014. [CrossRef]
- Yu, C.; Hu, D.; Liu, M.; Wang, S.; Di, Y. Spatio-Temporal Accuracy Evaluation of Three High-Resolution Satellite Precipitation Products in China Area. Atmospheric Research 2020, 241, 104952. [CrossRef]
- Freitas, E. da S.; Coelho, V.H.R.; Xuan, Y.; Melo, D. de C.D.; Gadelha, A.N.; Santos, E.A.; Galvão, C. de O.; Ramos Filho, G.M.; Barbosa, L.R.; Huffman, G.J.; et al. The Performance of the IMERG Satellite-Based Product in Identifying Sub-Daily Rainfall Events and Their Properties. Journal of Hydrology 2020, 589, 125128. [CrossRef]
Figure 1.
Digital elevation model and number of rain gauges per IMERG pixel over the region of Catalonia, located in the Western Mediterranean area.
Figure 1.
Digital elevation model and number of rain gauges per IMERG pixel over the region of Catalonia, located in the Western Mediterranean area.
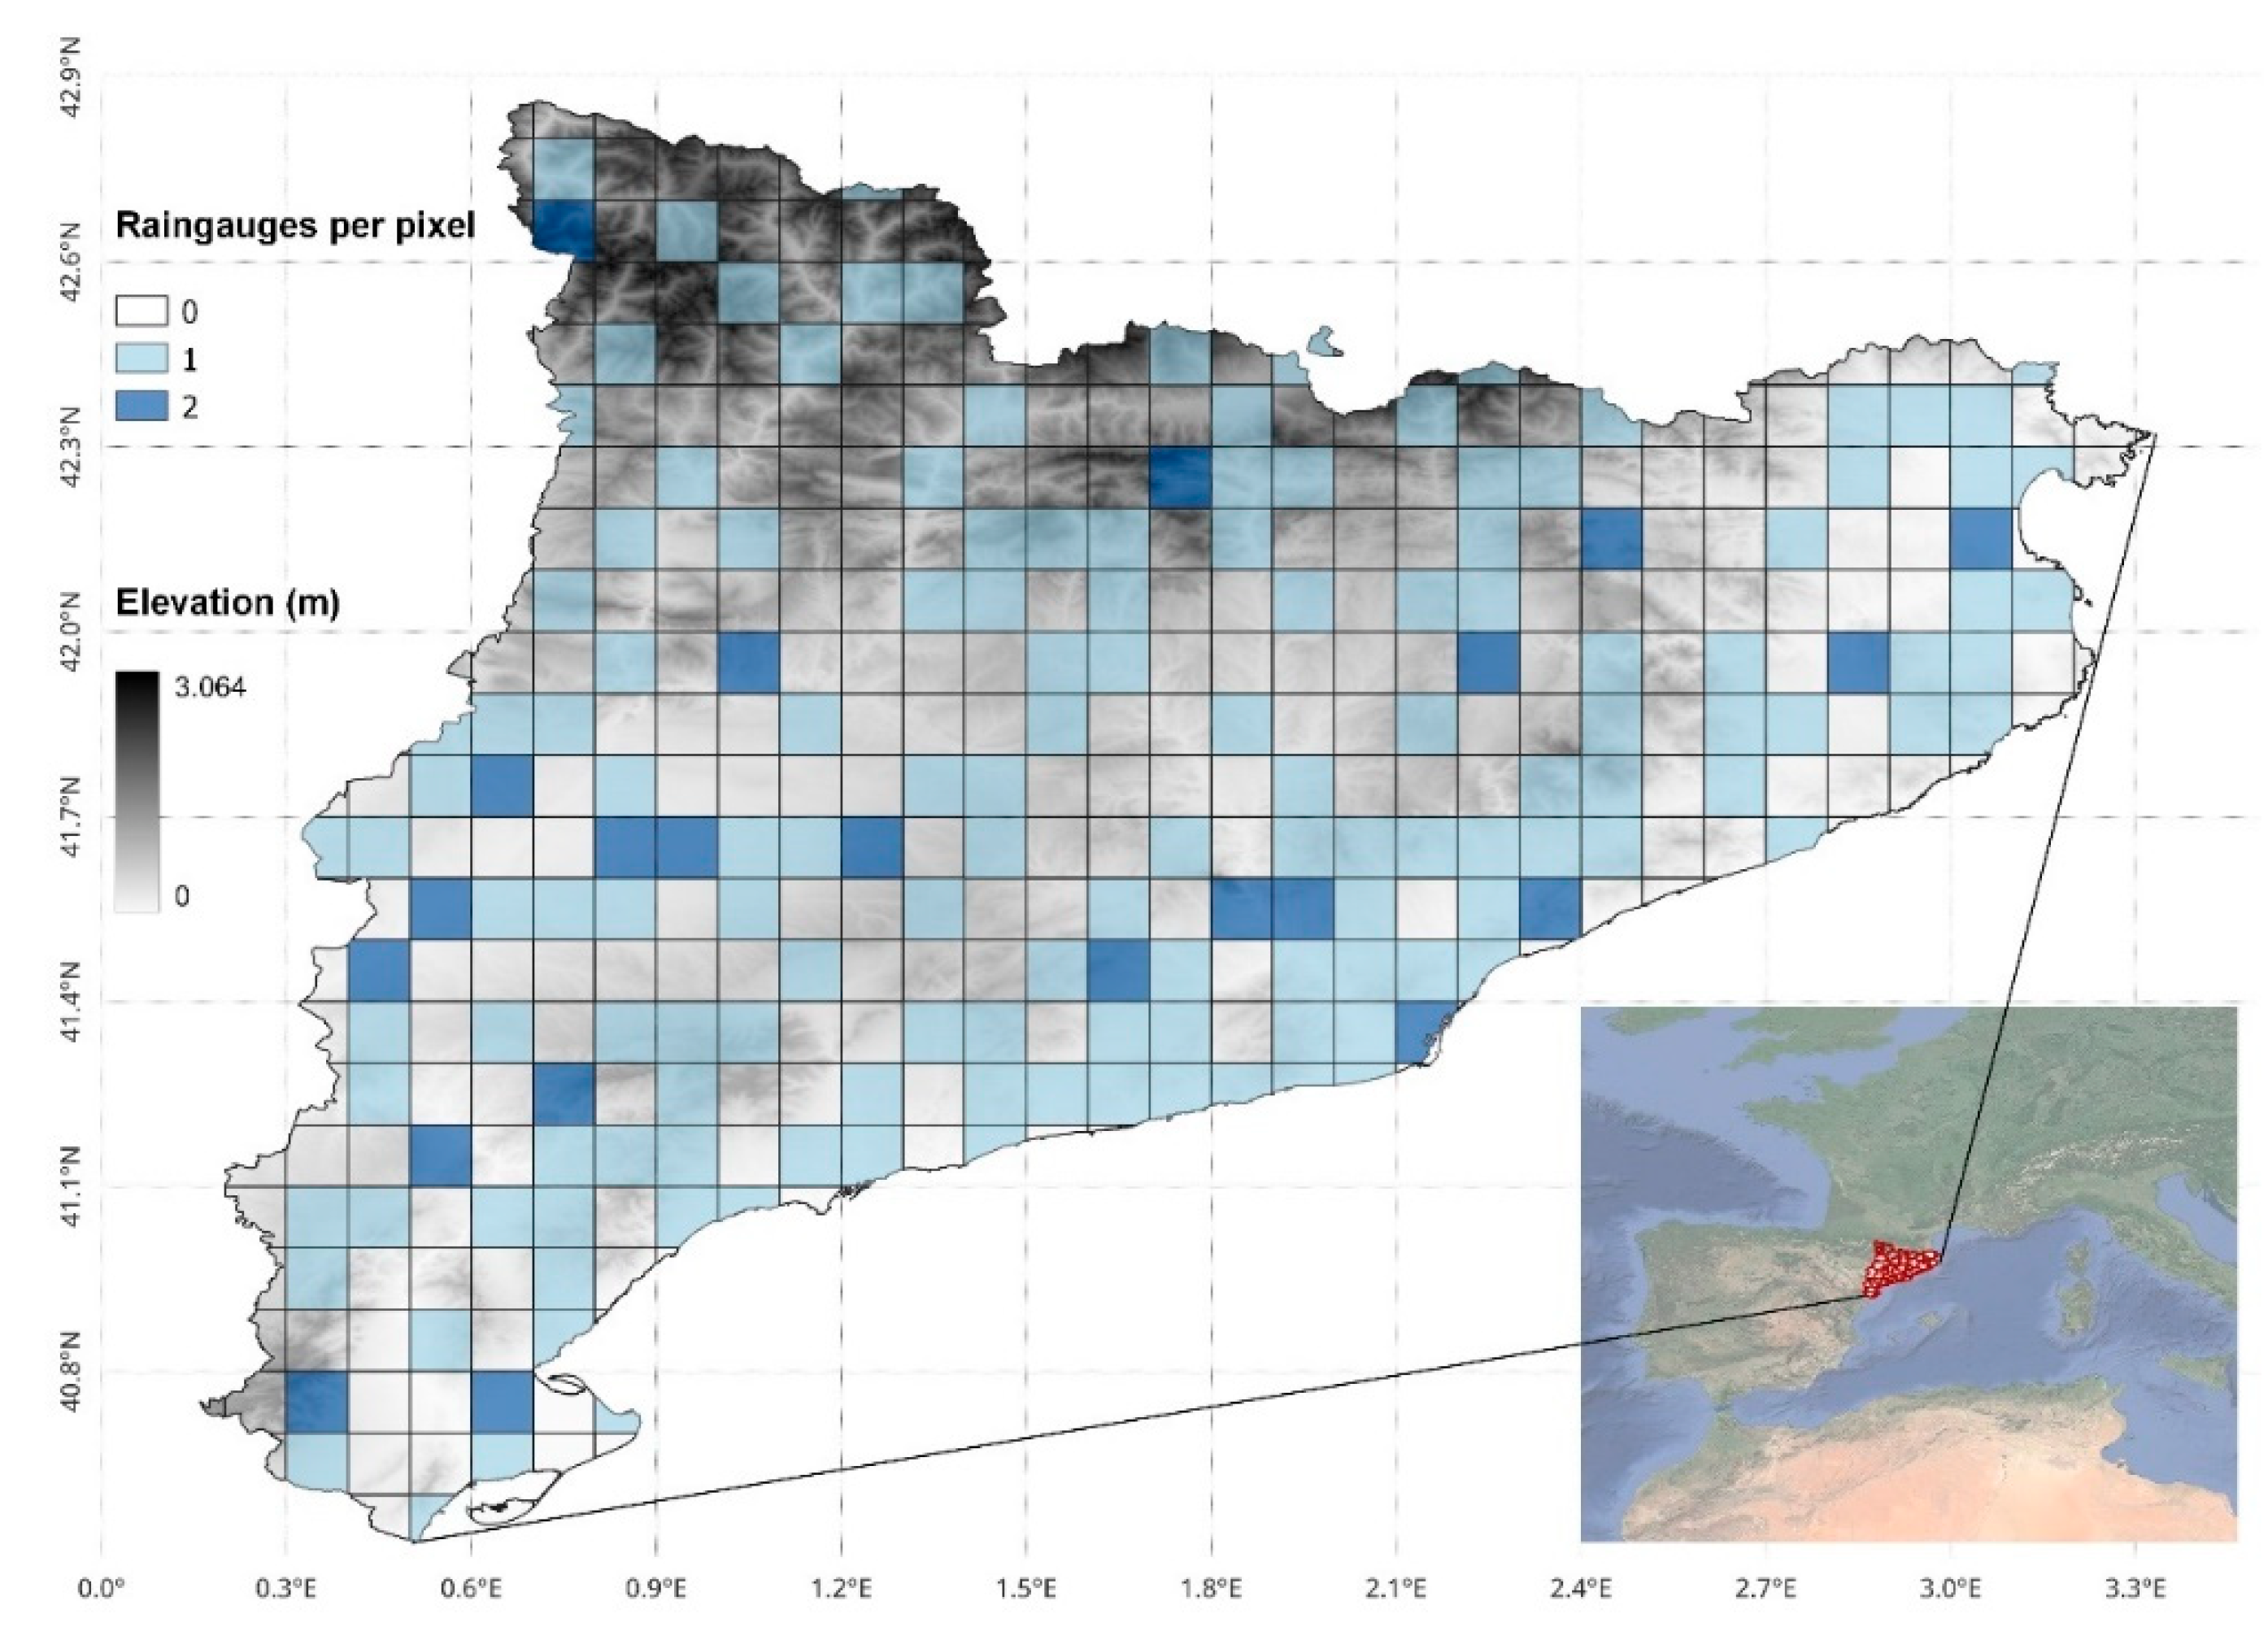
Figure 2.
Point precipitation extremes for different temporal aggregations observed by RG (black) and estimated by IMERG Late (blue) and Early (green) in Catalonia between 2014-2023. The solid lines correspond to power-law fits, and the black dashed line to the scaling of the upper envelope of the observed data. The dashed red lines show different ratios regarding the upper reference envelope.
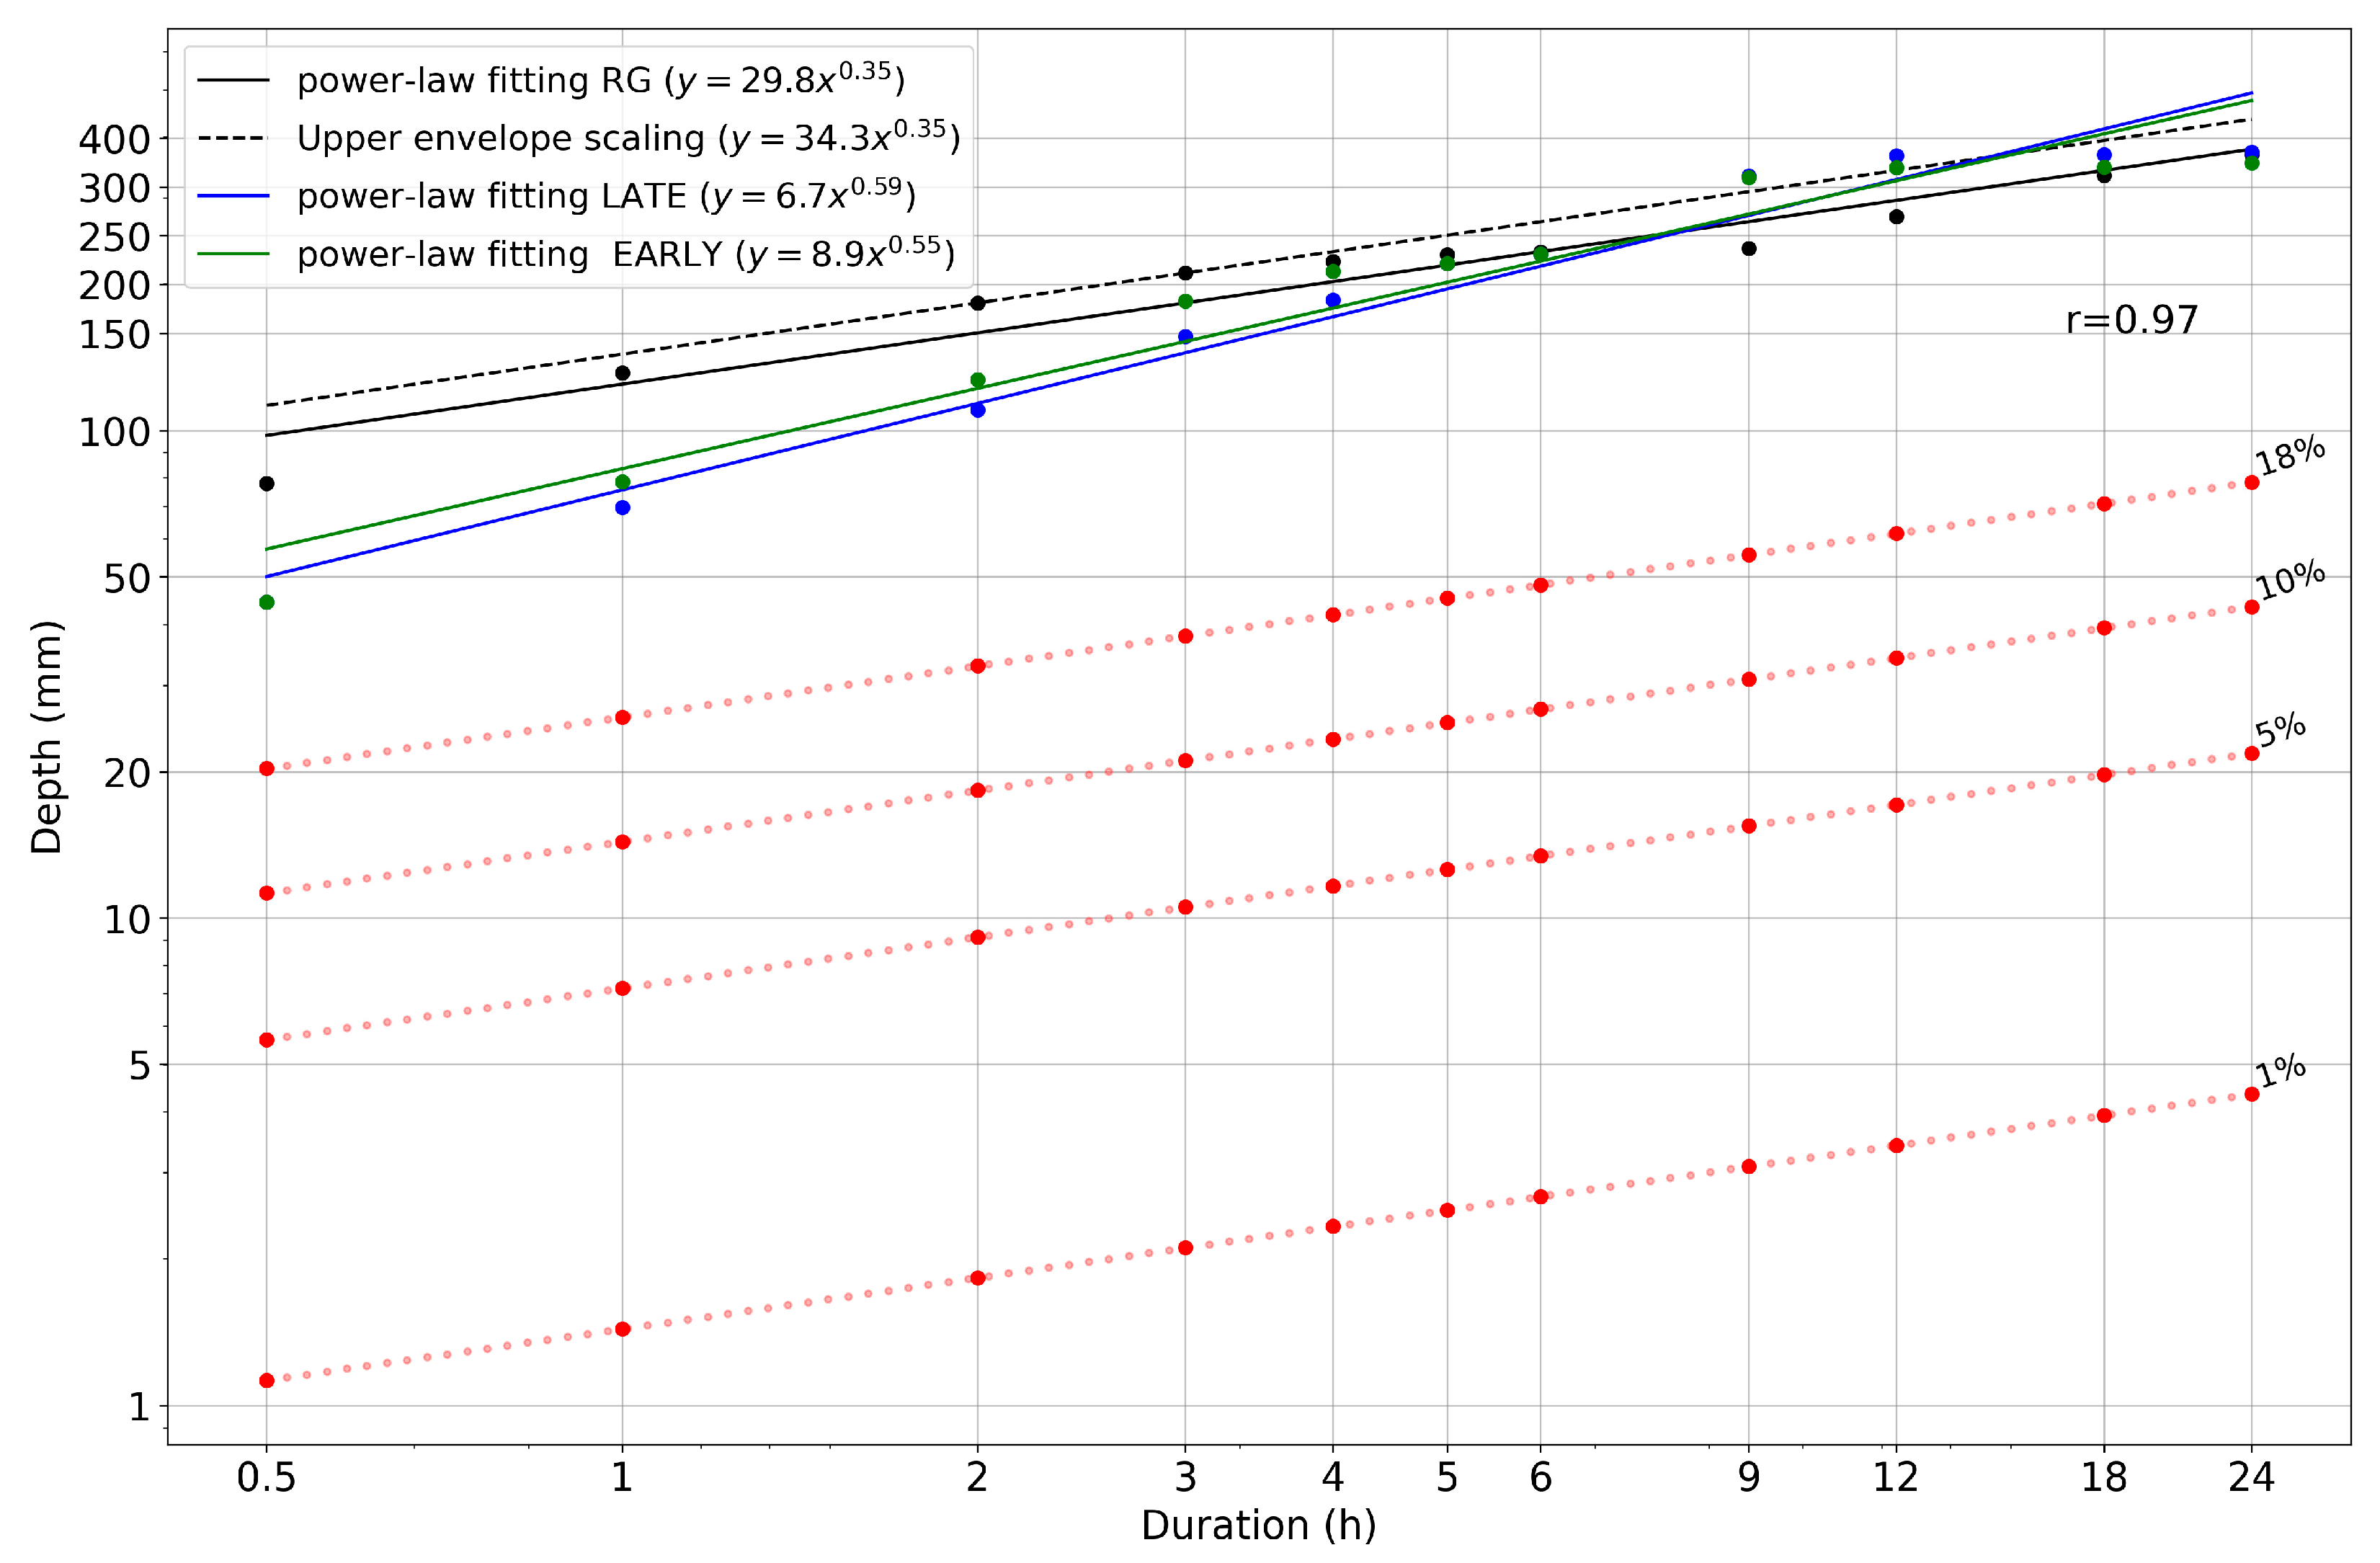
Figure 3.
Spatial representation of the half-hourly IMERG and RG extremes, taking 18 % of the envelope curve. The frequency of IMERG extremes include events identified by both EARLY and LATE. The grid represents the grid at the original IMERG resolution.
Figure 3.
Spatial representation of the half-hourly IMERG and RG extremes, taking 18 % of the envelope curve. The frequency of IMERG extremes include events identified by both EARLY and LATE. The grid represents the grid at the original IMERG resolution.
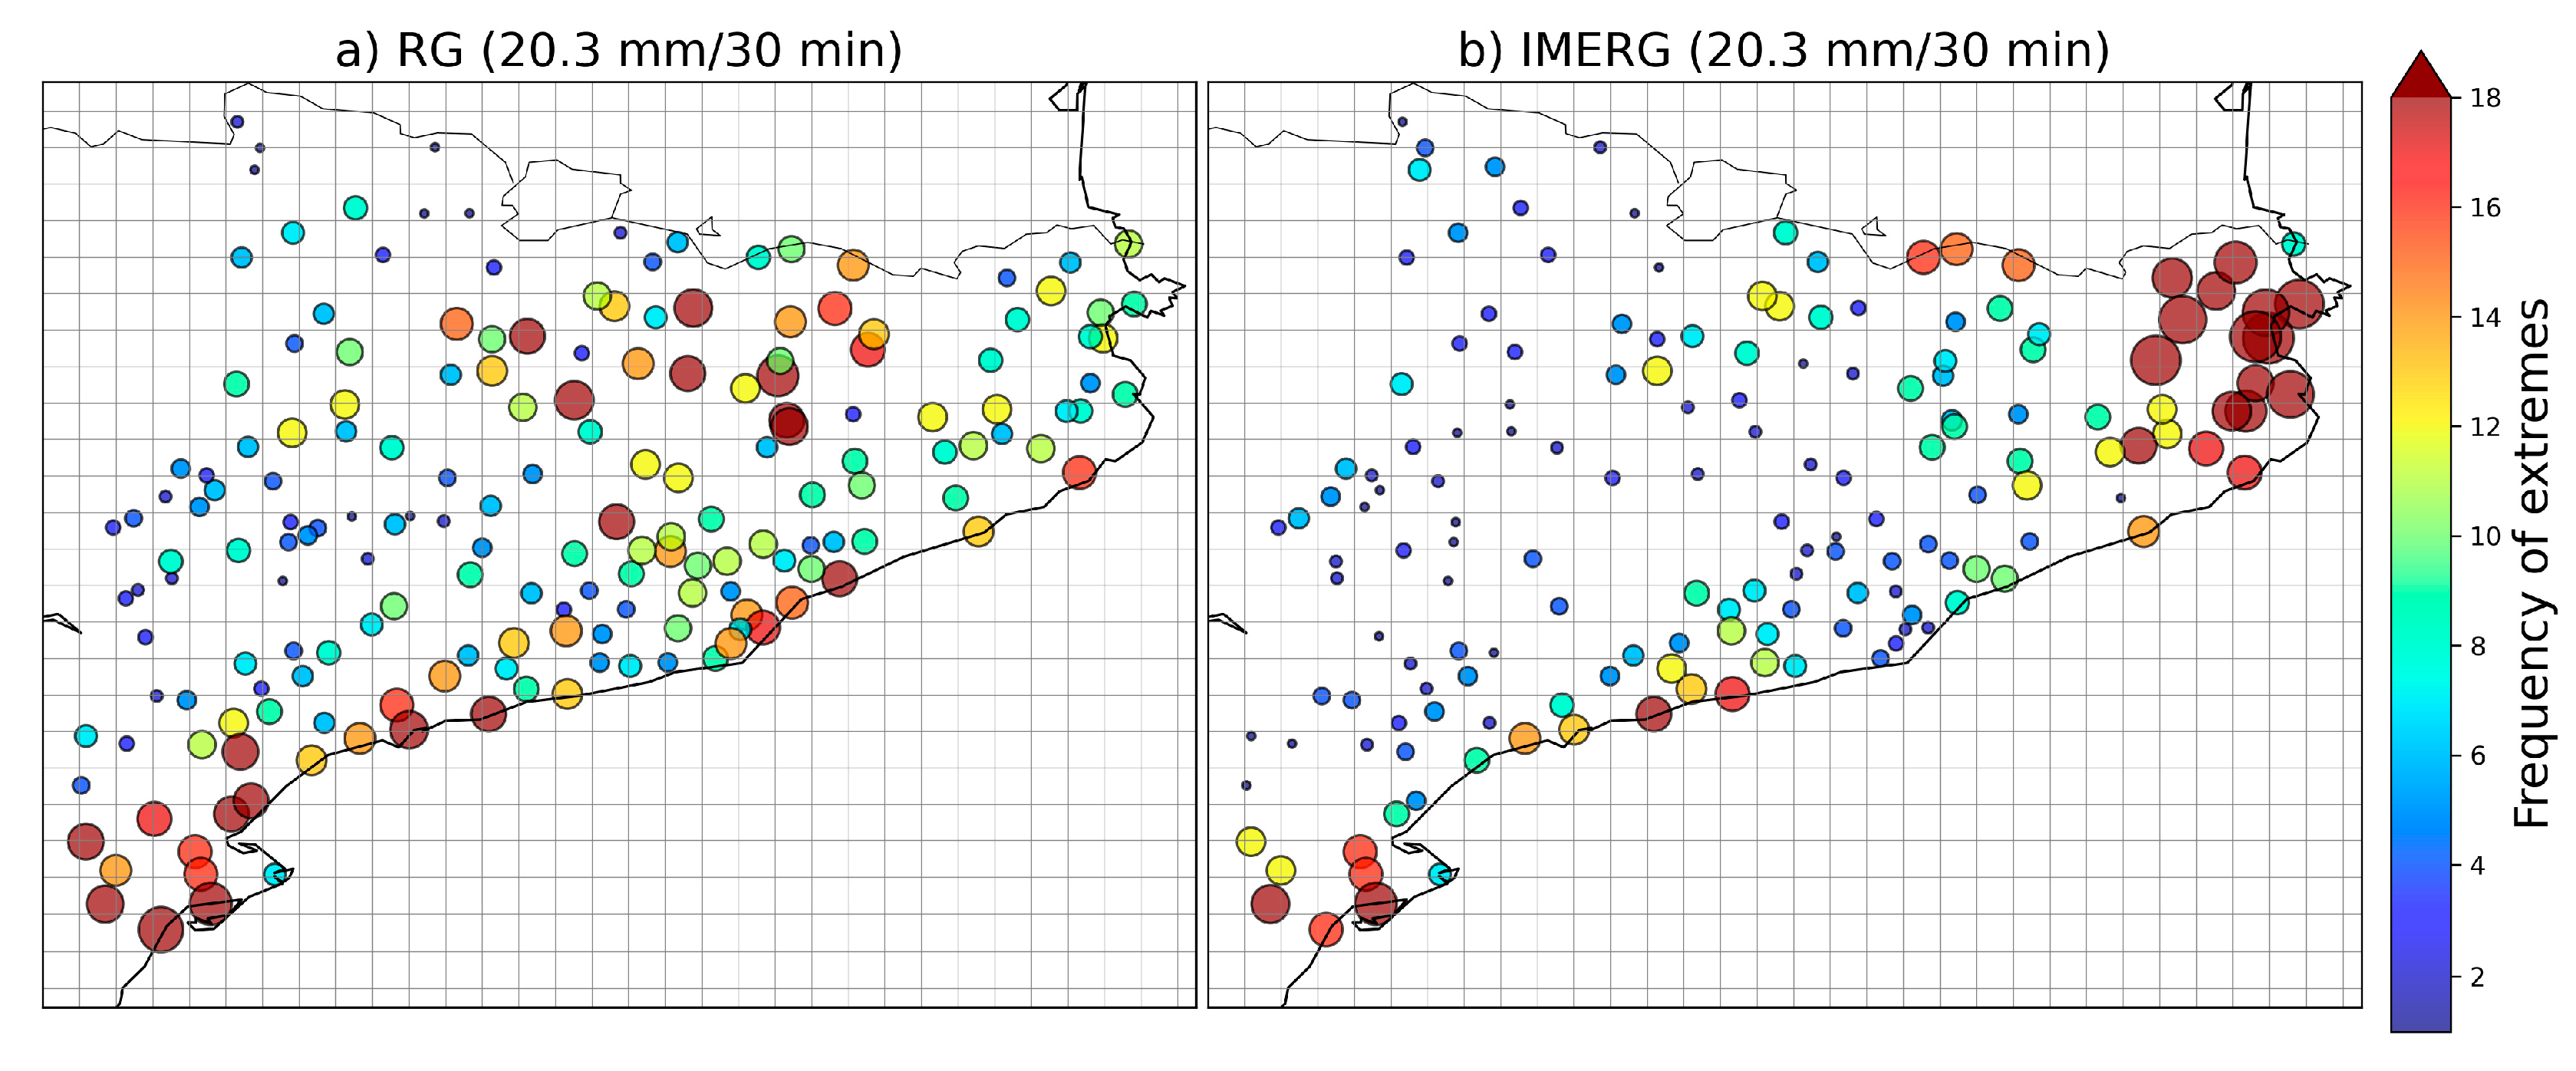
Figure 4.
(Top panel) BIAS and (Bottom panel) MAE comparing IMERG Early (IMERG_E) and IMERG Late (IMERG_L) products and RG records greater than or equal to 18 % of the envelope curve. For reference, dotted red lines indicate perfect scores.
Figure 4.
(Top panel) BIAS and (Bottom panel) MAE comparing IMERG Early (IMERG_E) and IMERG Late (IMERG_L) products and RG records greater than or equal to 18 % of the envelope curve. For reference, dotted red lines indicate perfect scores.
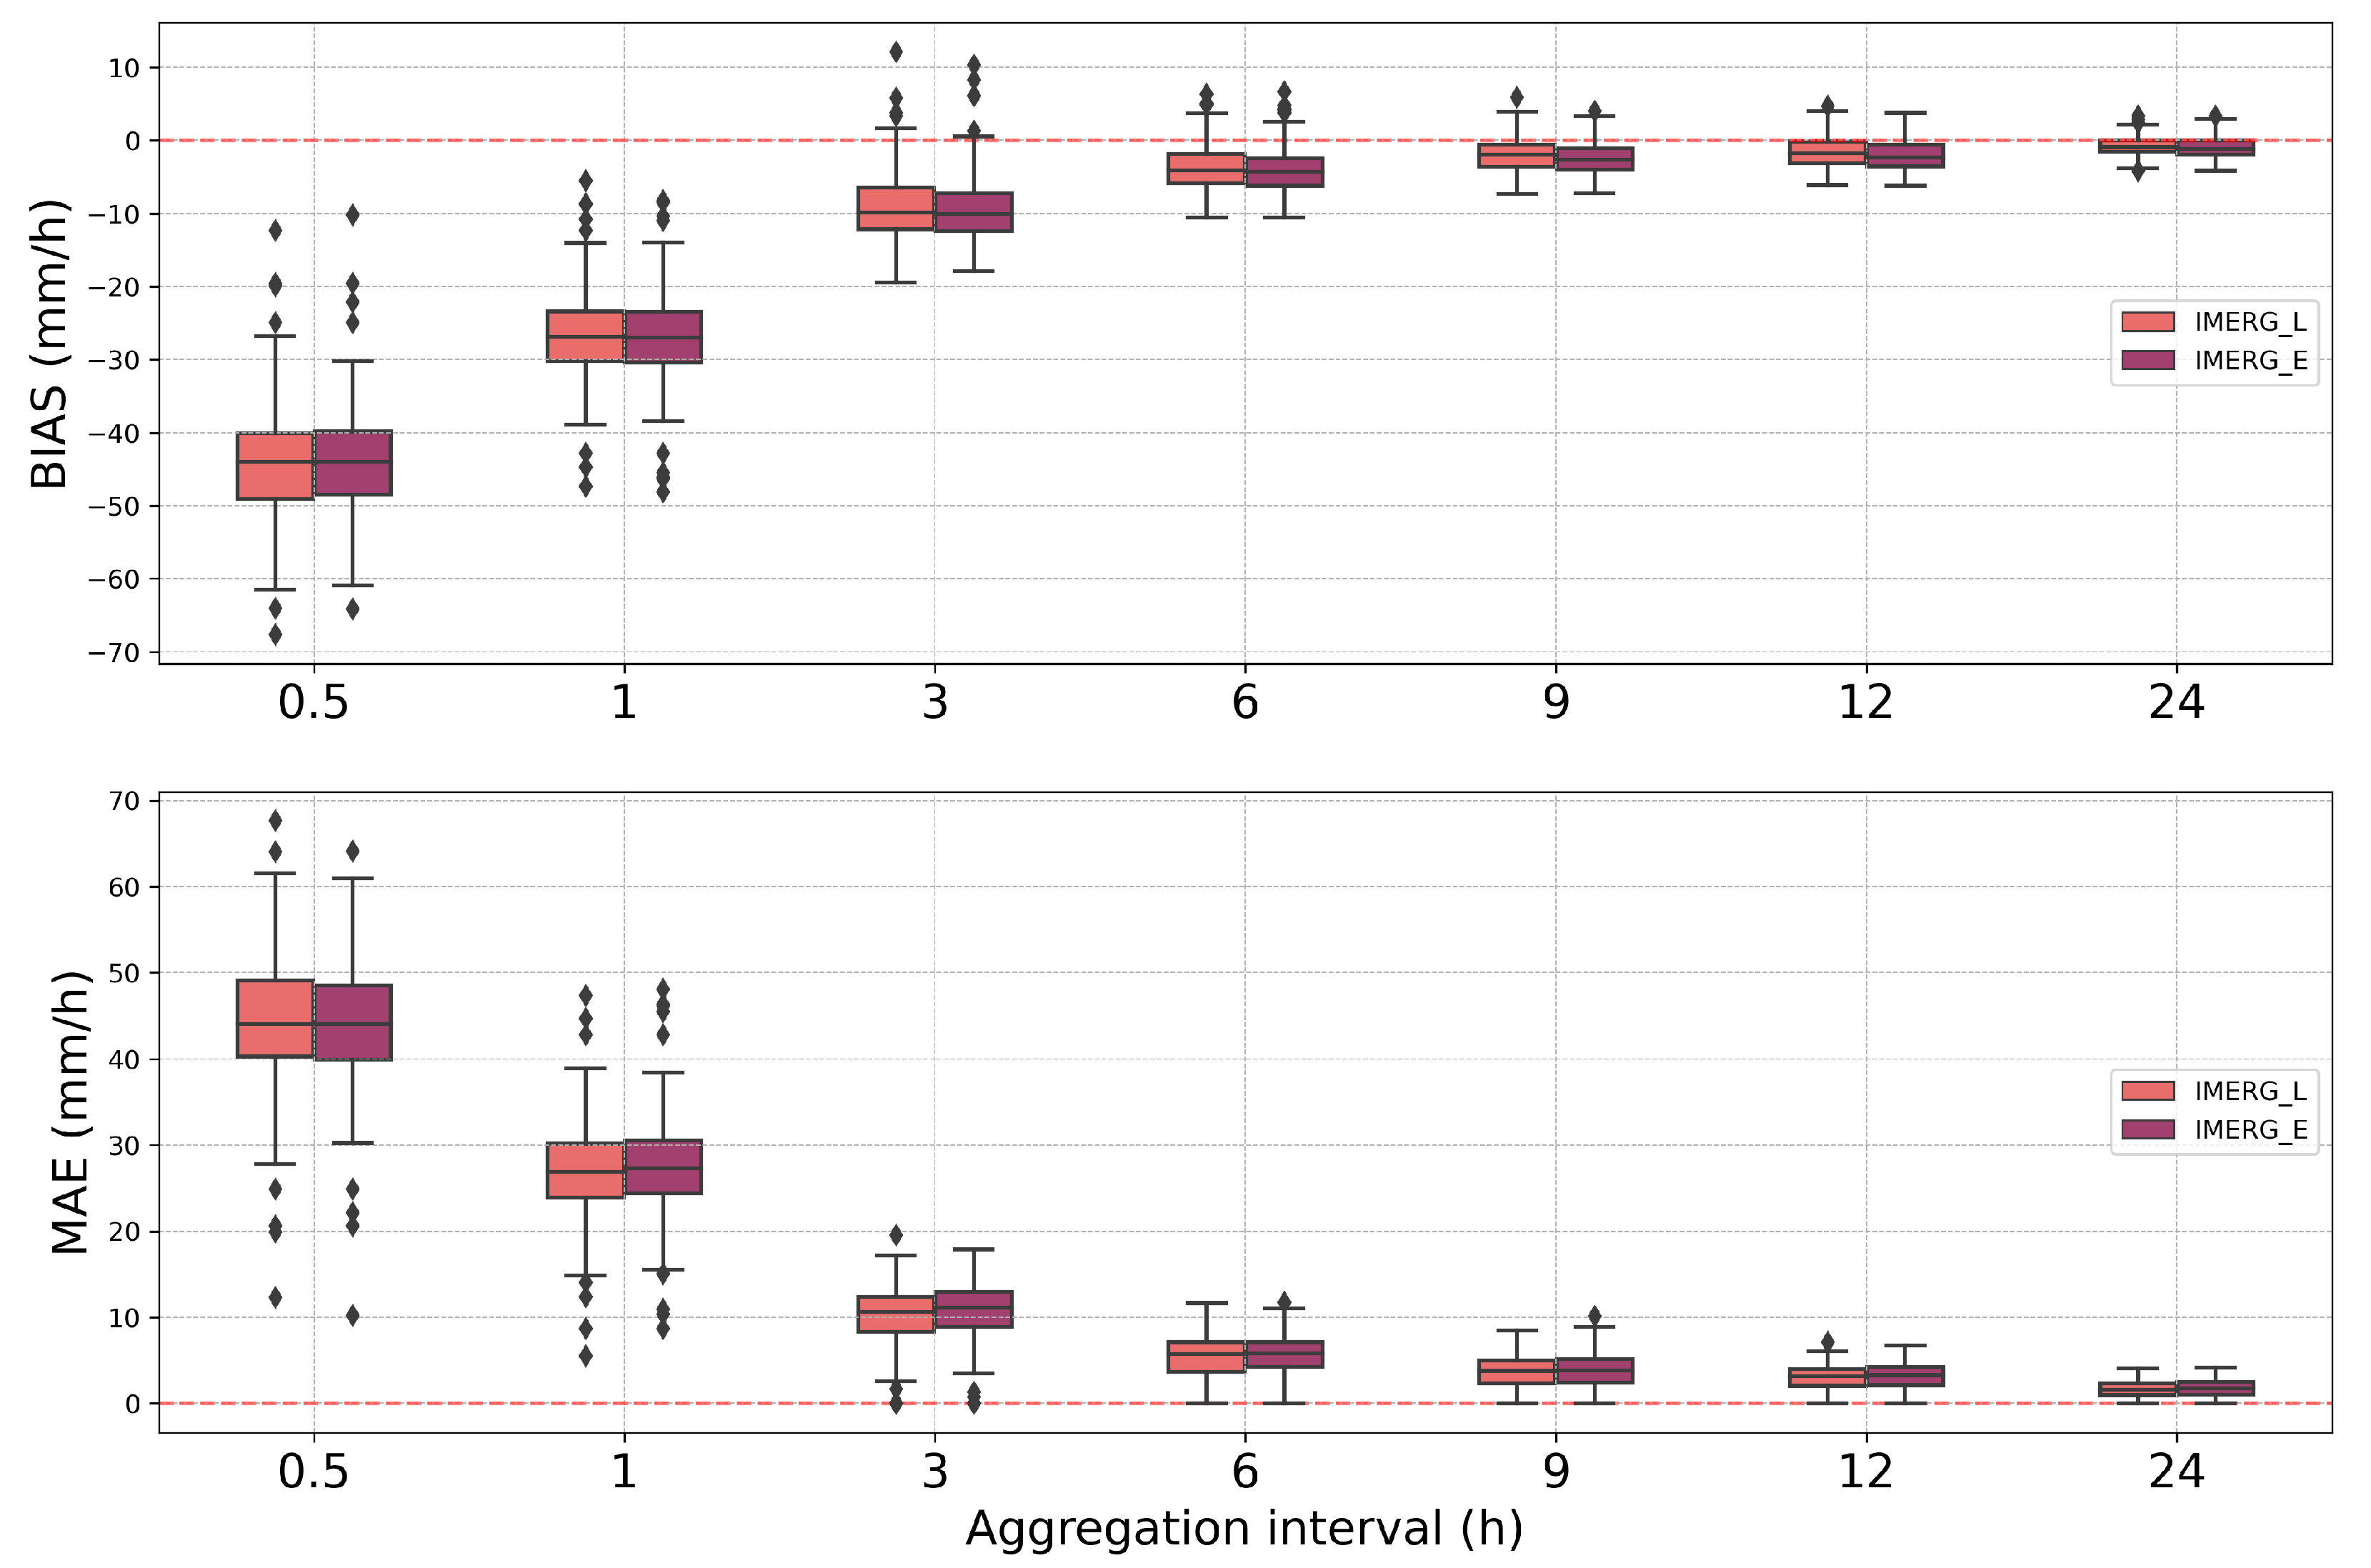
Figure 5.
(a-b) POD (c-d) FAR scores for different temporal aggregations and precipitation intensity thresholds of IMERG Early (IMERG_E) and Late (IMERG_L) products.
Figure 5.
(a-b) POD (c-d) FAR scores for different temporal aggregations and precipitation intensity thresholds of IMERG Early (IMERG_E) and Late (IMERG_L) products.
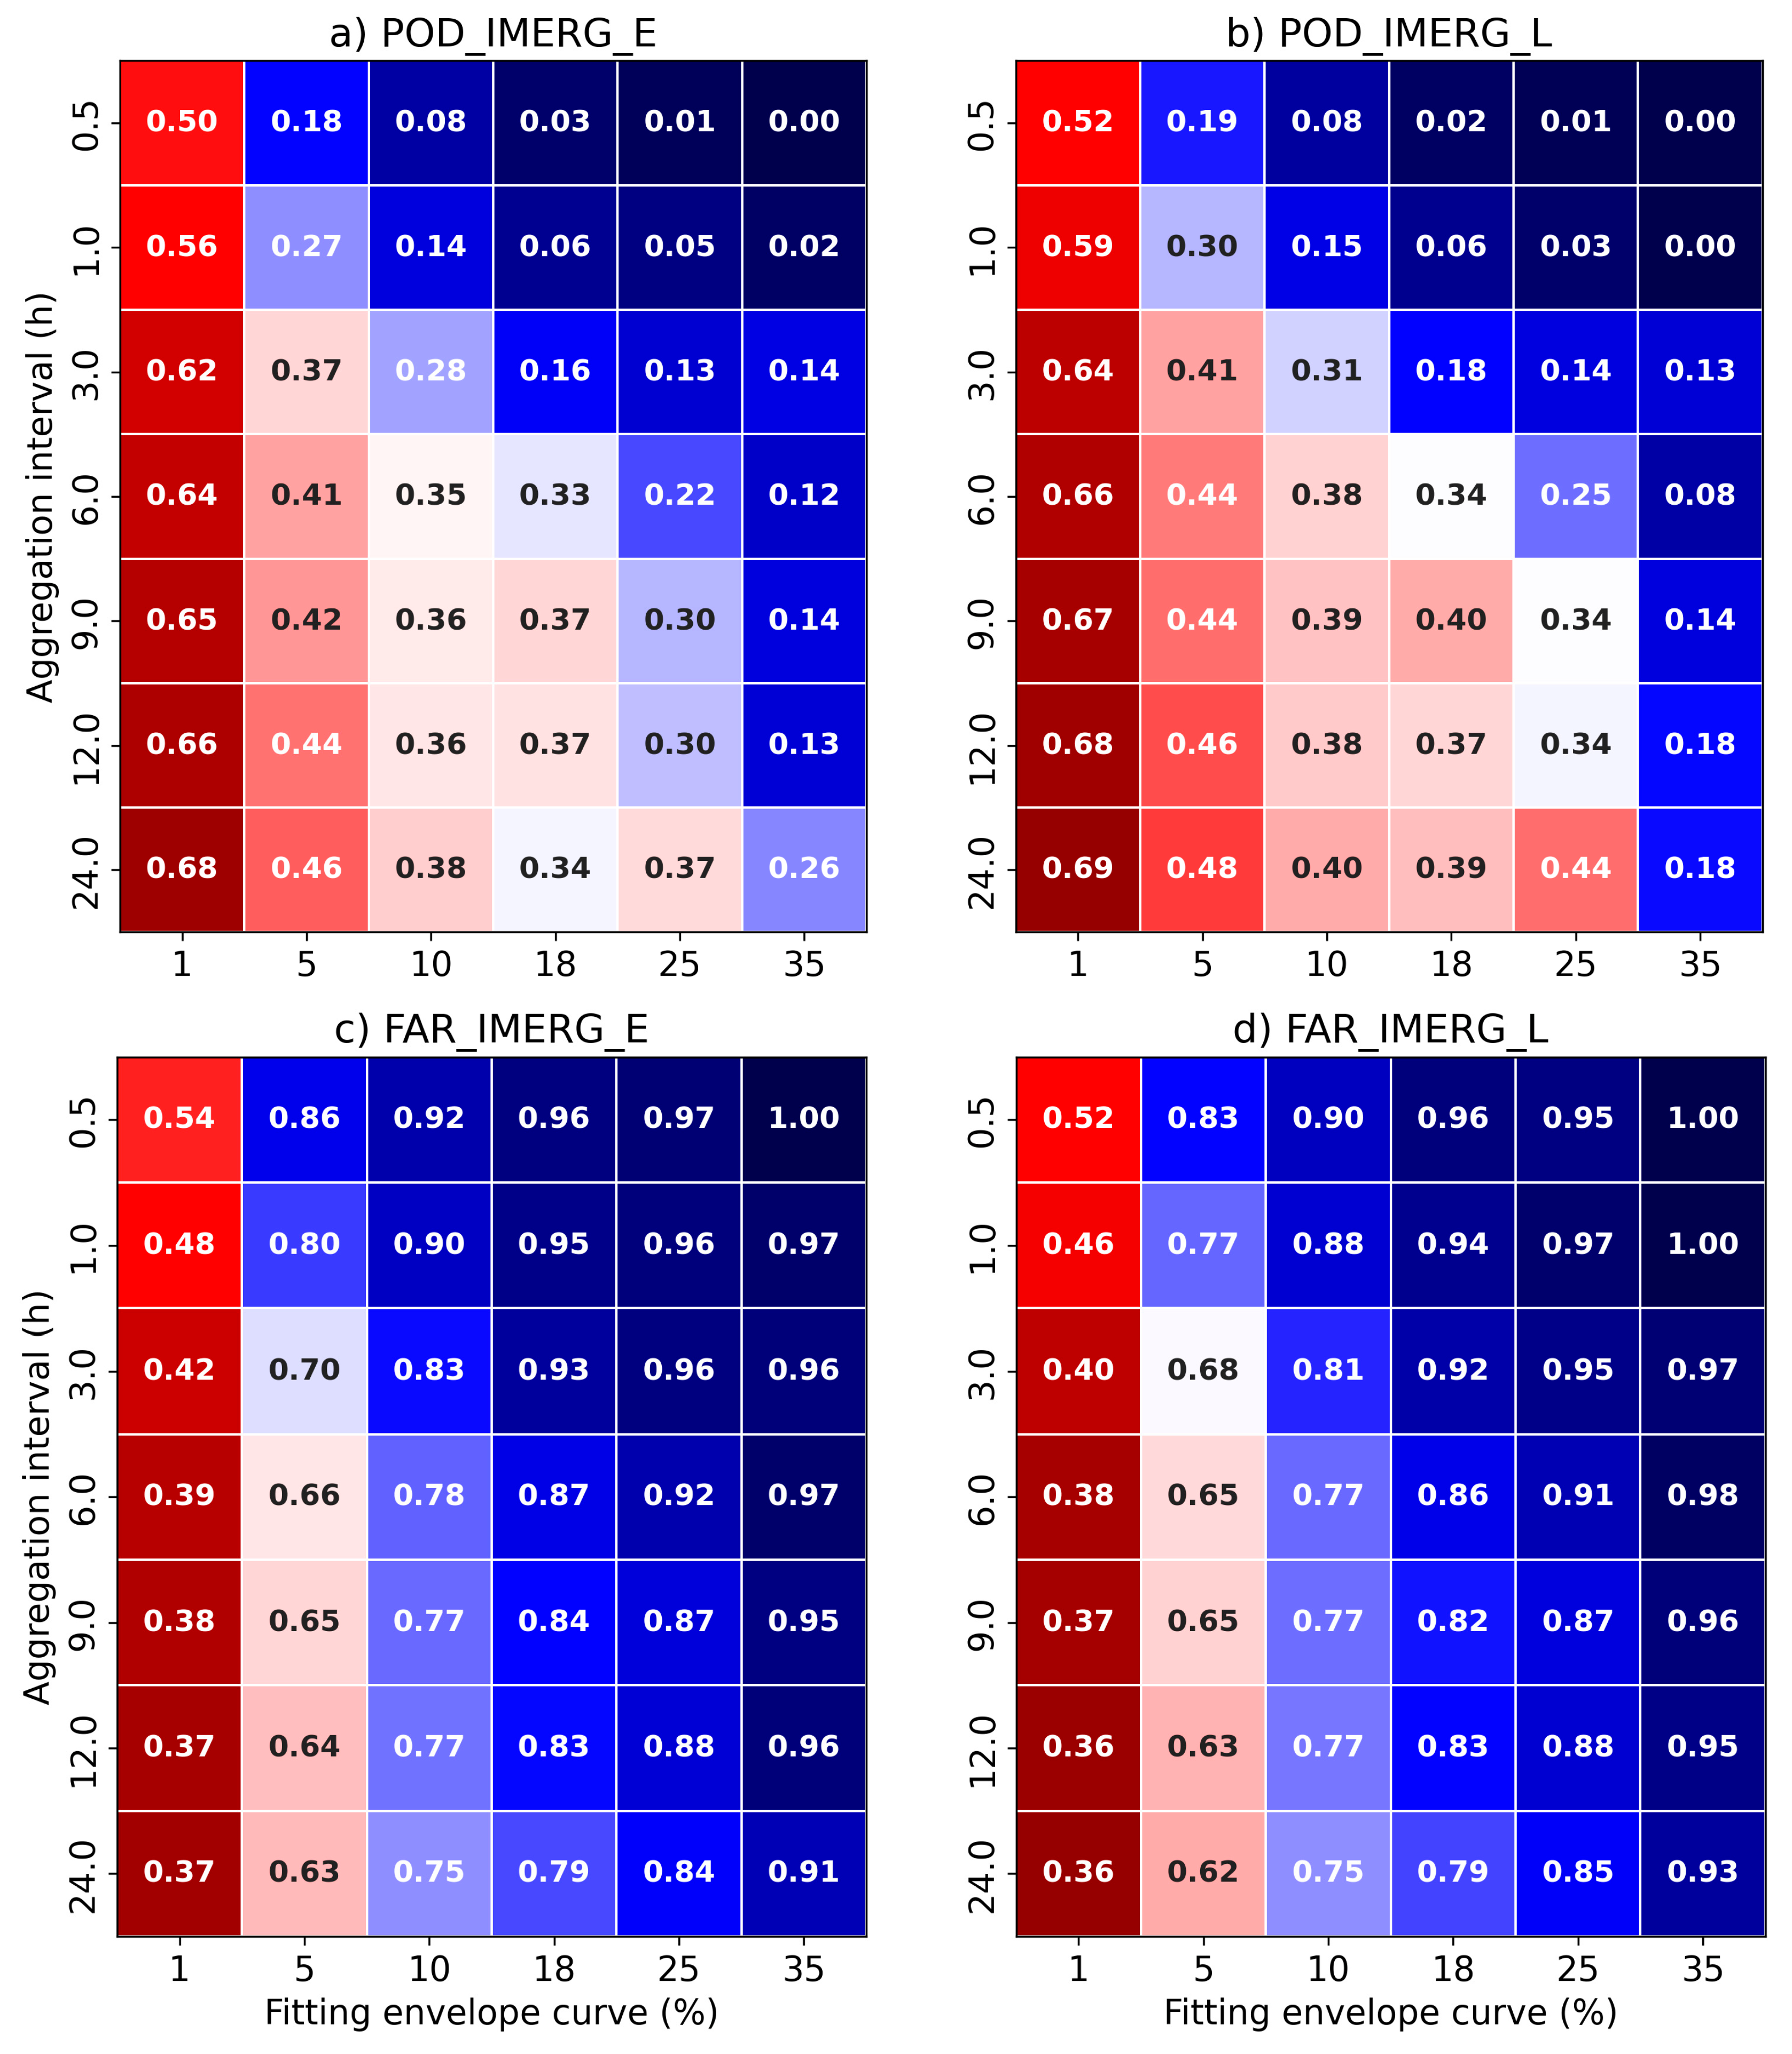
Figure 6.
(Top row) Scatter plot for each IMERG source vs rain gauge observations. RG rainfall intensities stratified in different envelope curve thresholds (1%, 5%, 10%, and 18%) are plotted in different colors. The regression adjustment line with 95% confidence error is also plotted (grey line with greyish shading) (Bottom row) Percentage of distributions of hits, false alarms and misses for each IMERG source and for each rain gauge precipitation intensity.
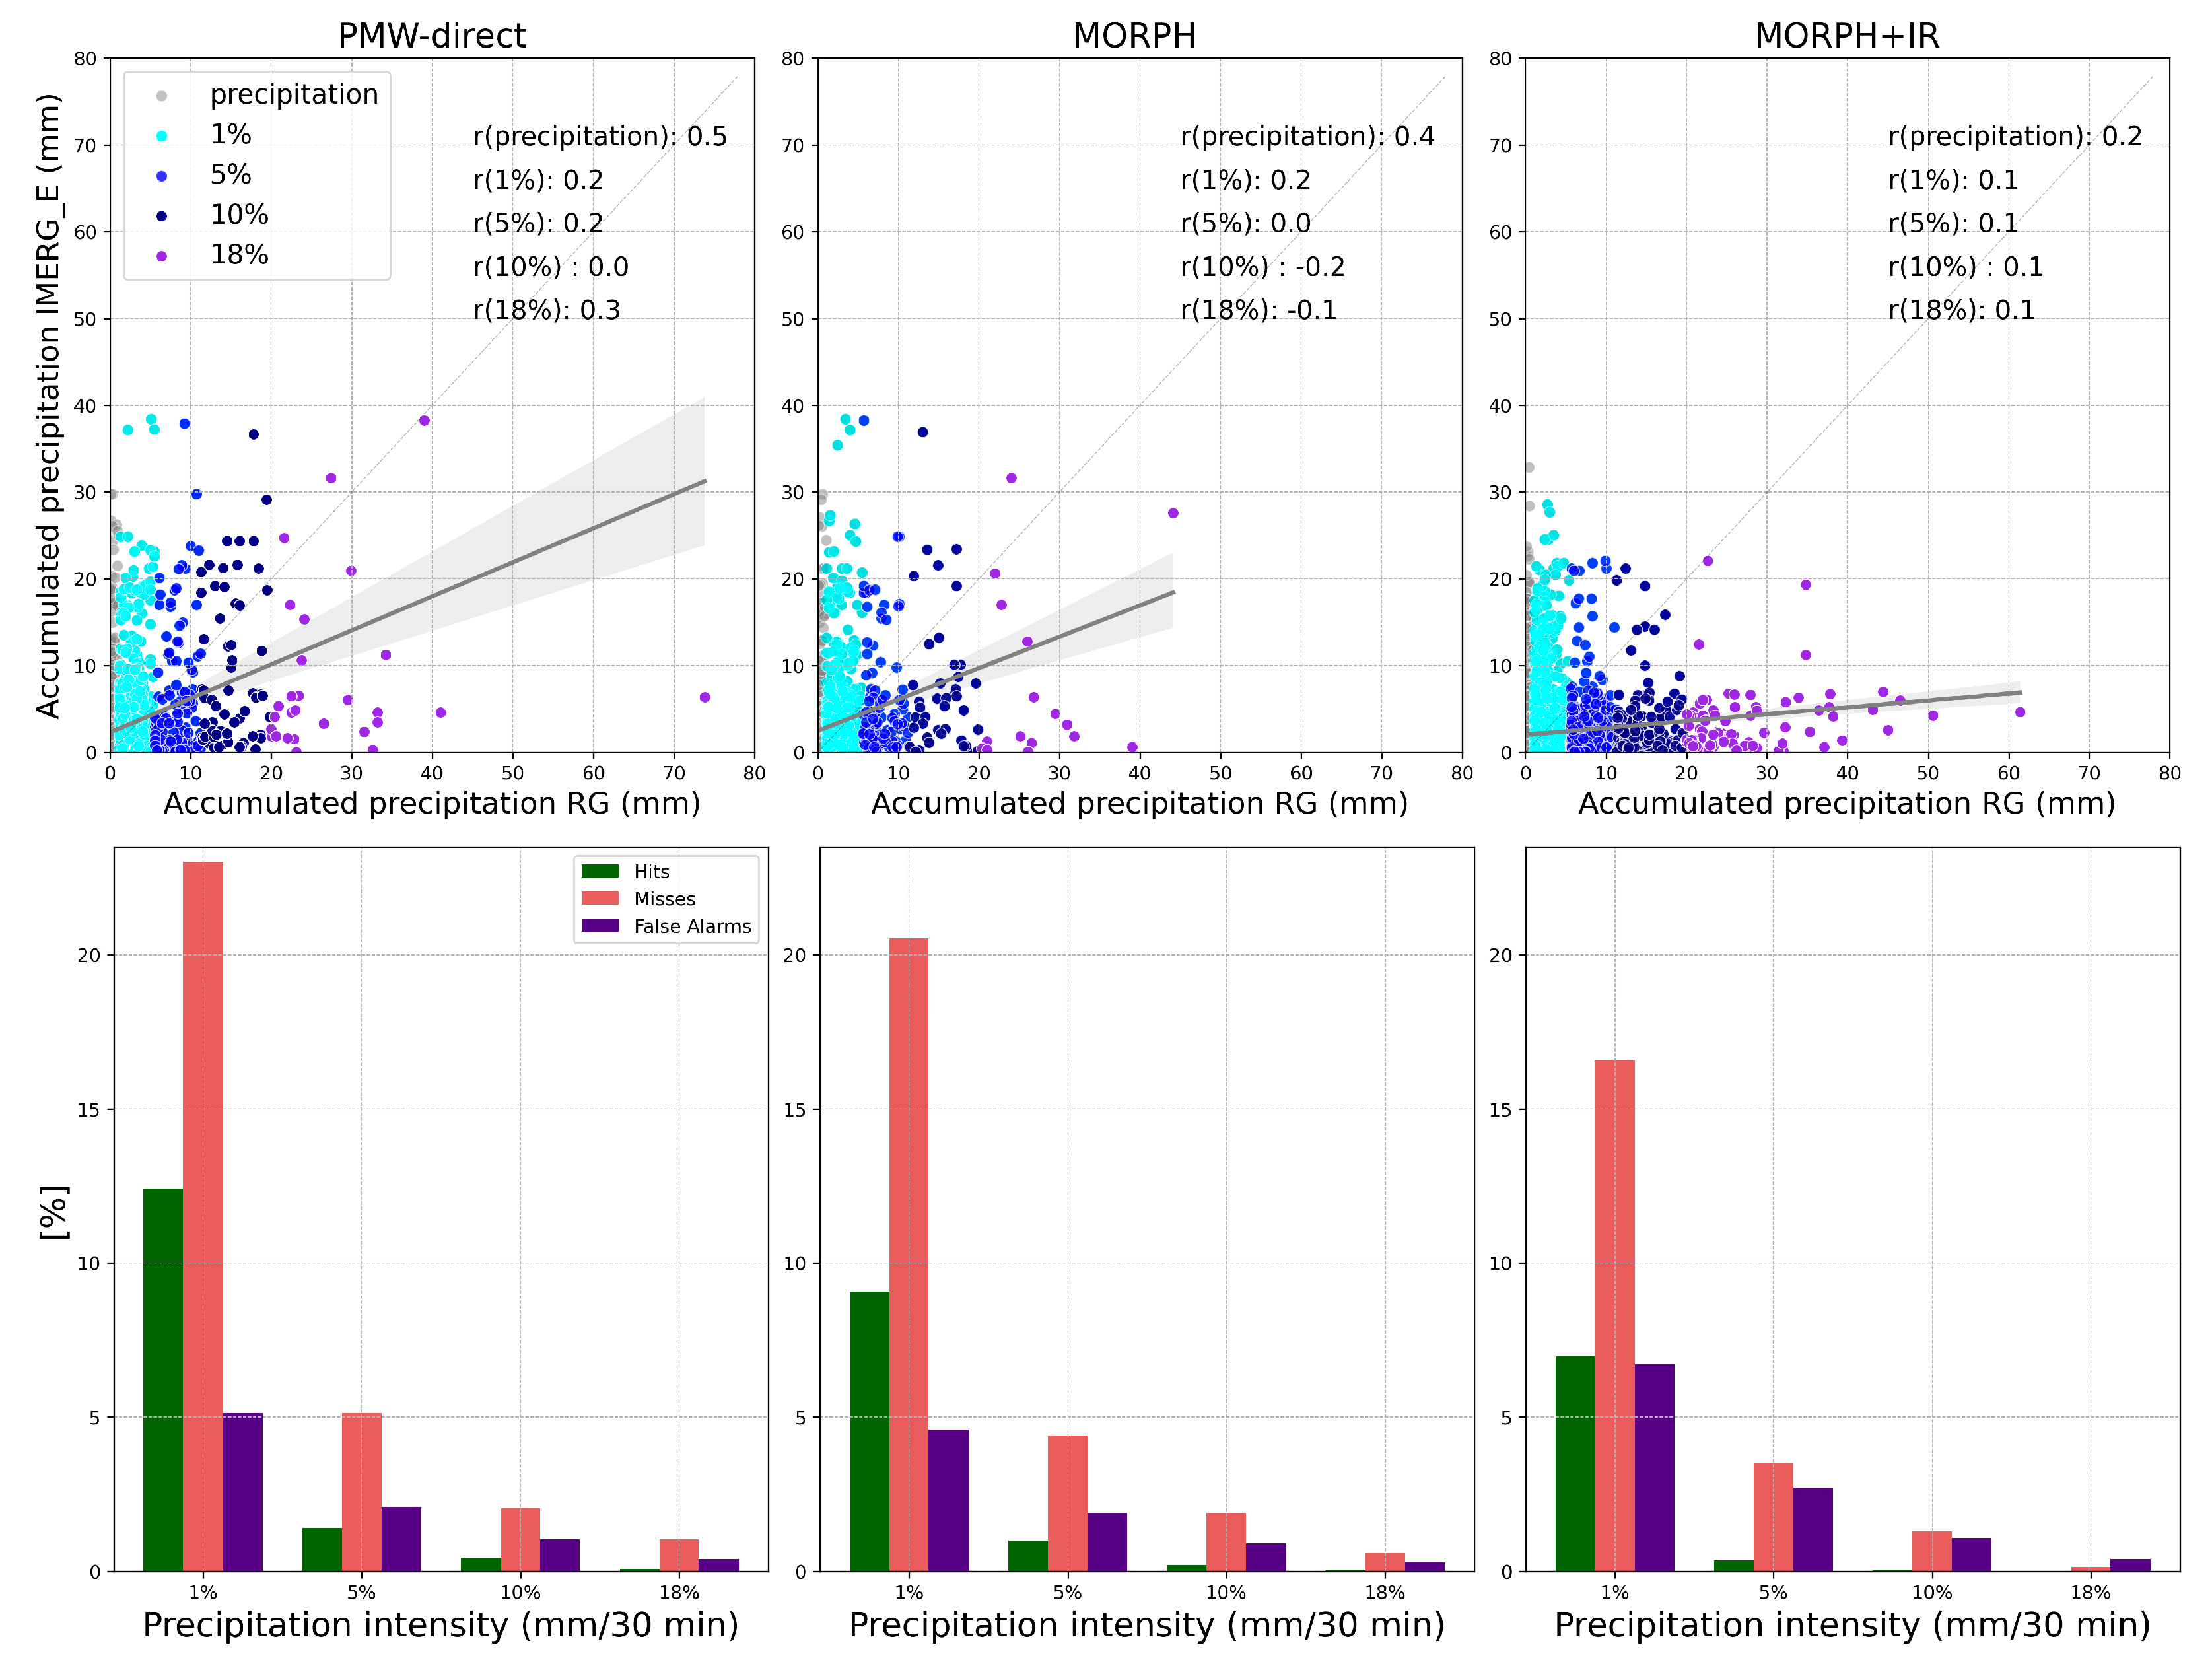
Figure 7.
Scatter plot of Rbias (mm) vs MAE (mm) for each IMERG data source (PMW, MORPH and MORPH+IR) and stratified according to rain gauge precipitation intensities (1 %, 5 %, 10 % and 18 %). The marked point (0;0), is the reference for no errors while the bottom right is the location for the highest errors.
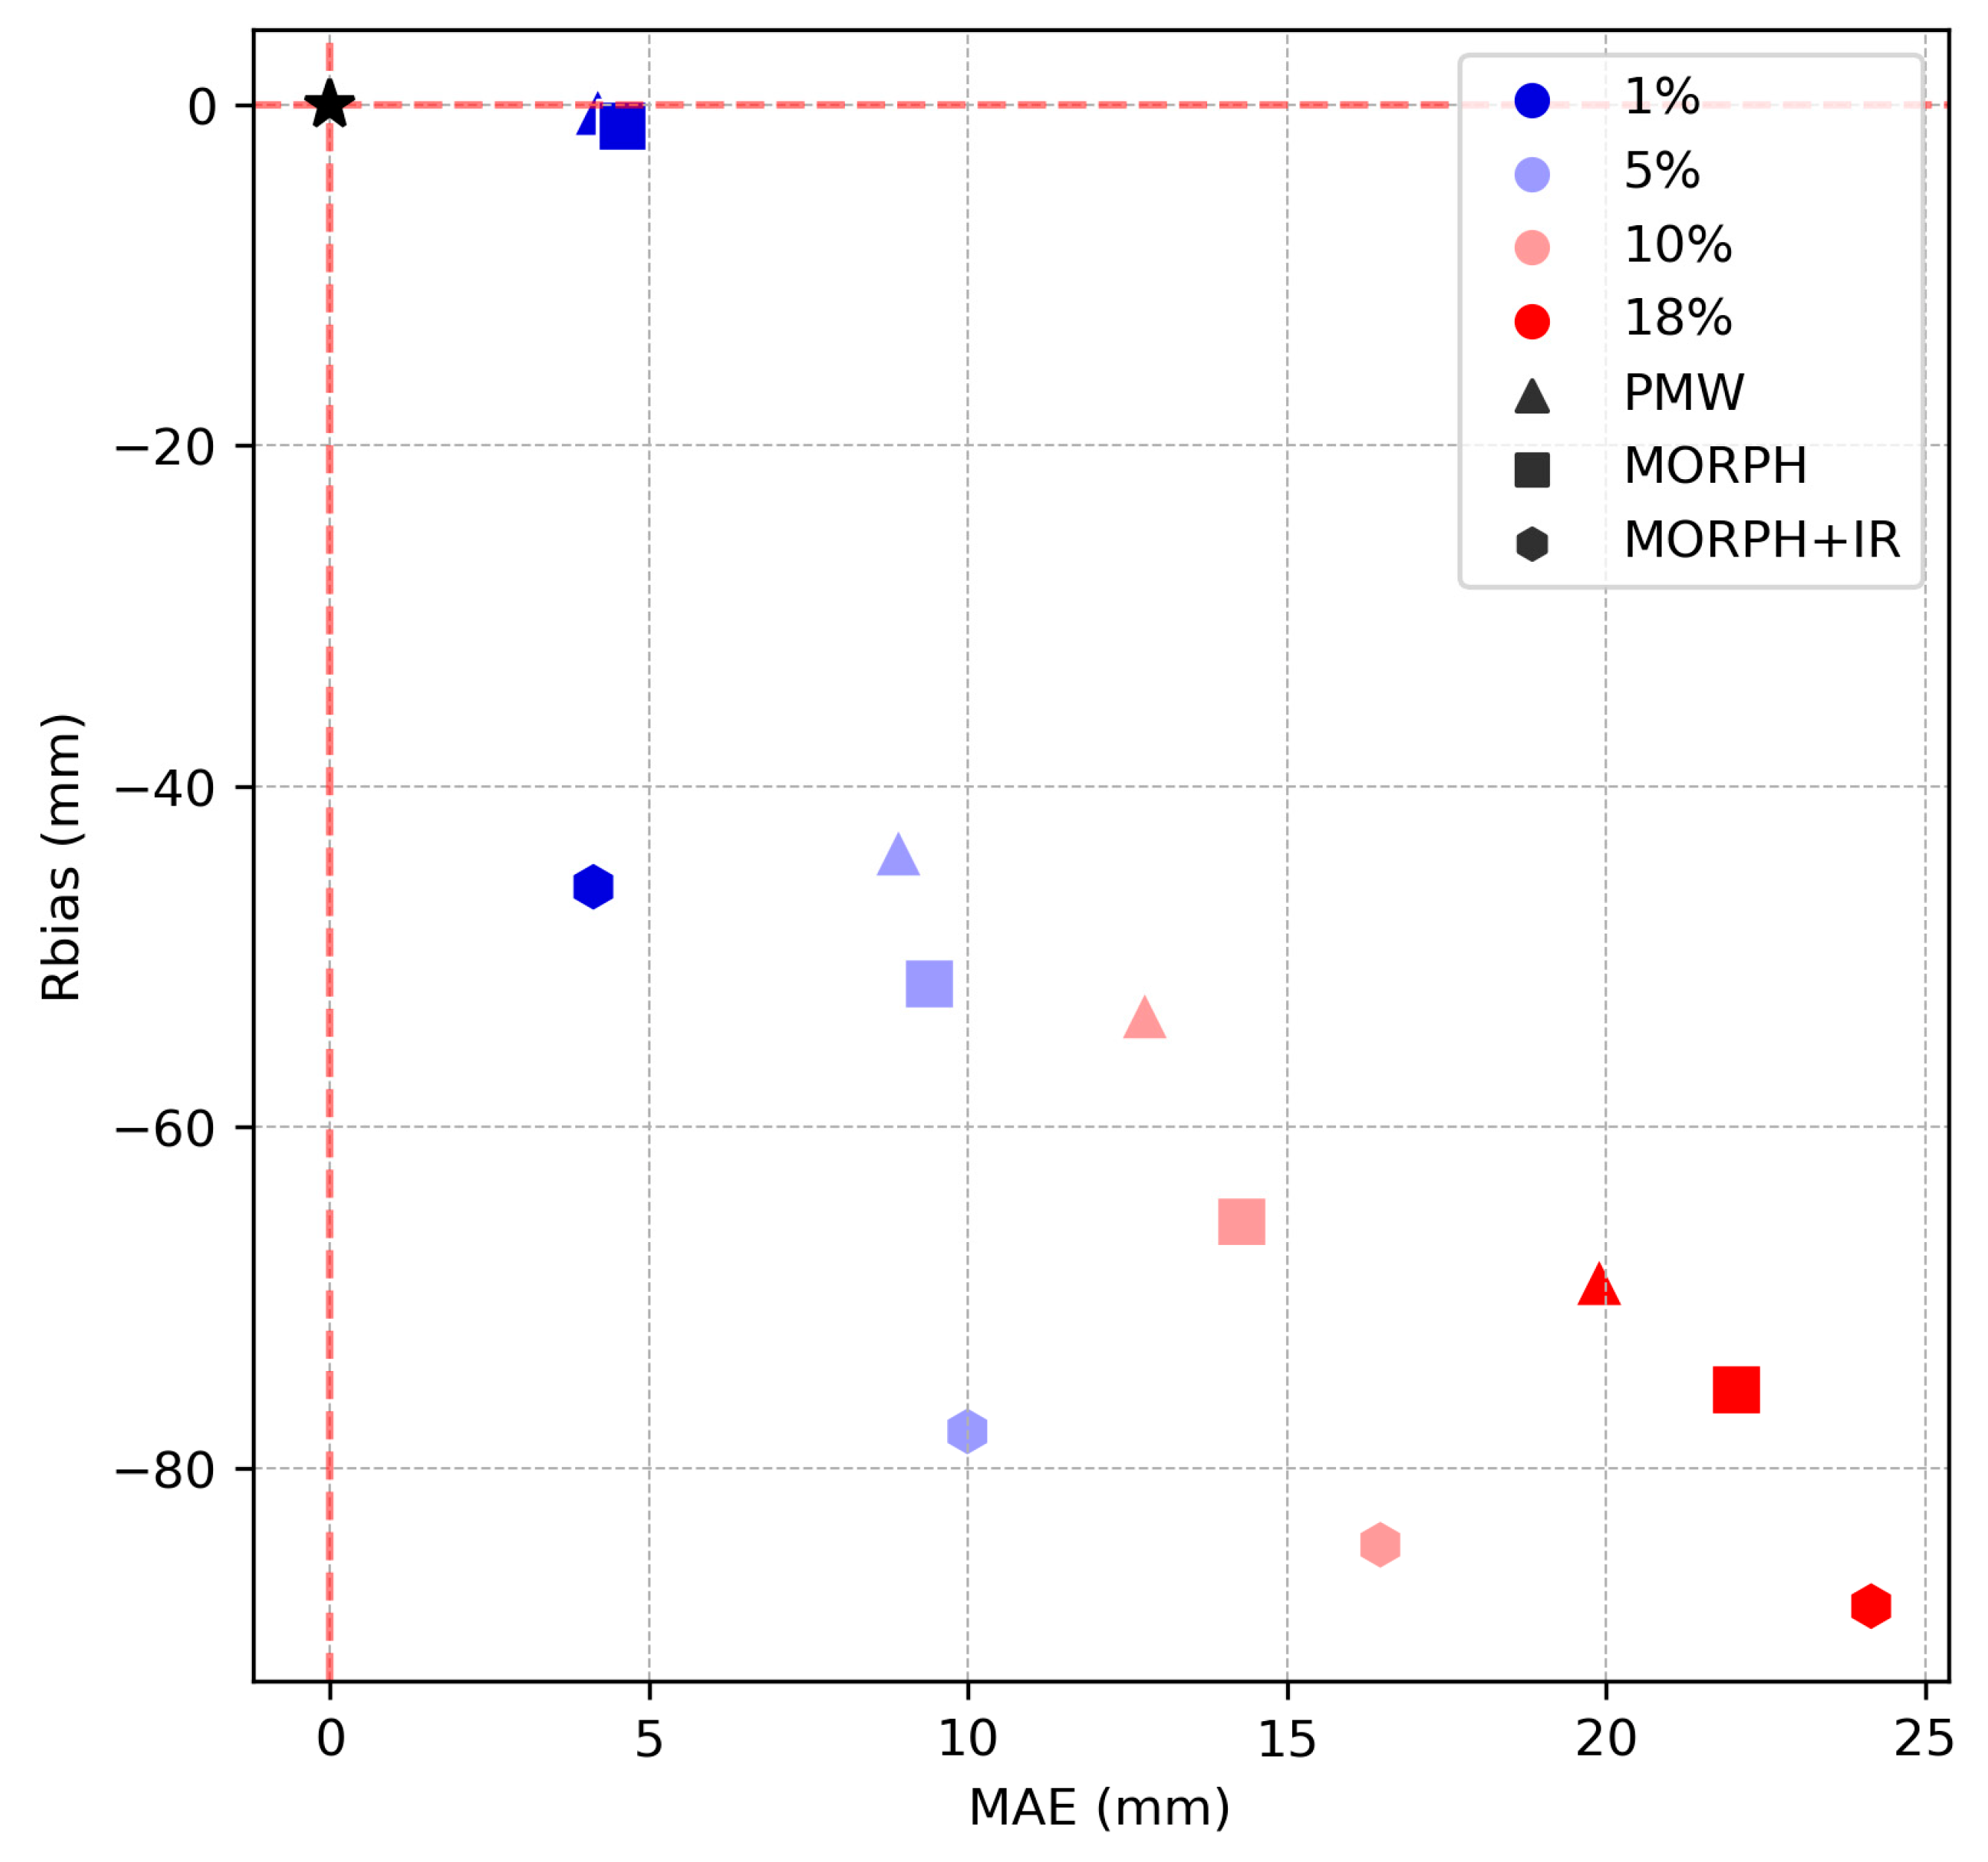
Figure 8.
Probability distributions of the cloud properties described in Section 2.1.3 based on all time steps of intense precipitation greater than or equal to 1% of the envelope curve in the RG (gray shading), IMERG and its sources (colored lines), separated into (a-c) ice cloud tops and (d-f) warm/liquid cloud tops, (g-i) mixed cloud tops. The vertical-colored lines in each plot indicate the median values of the respective distribution.
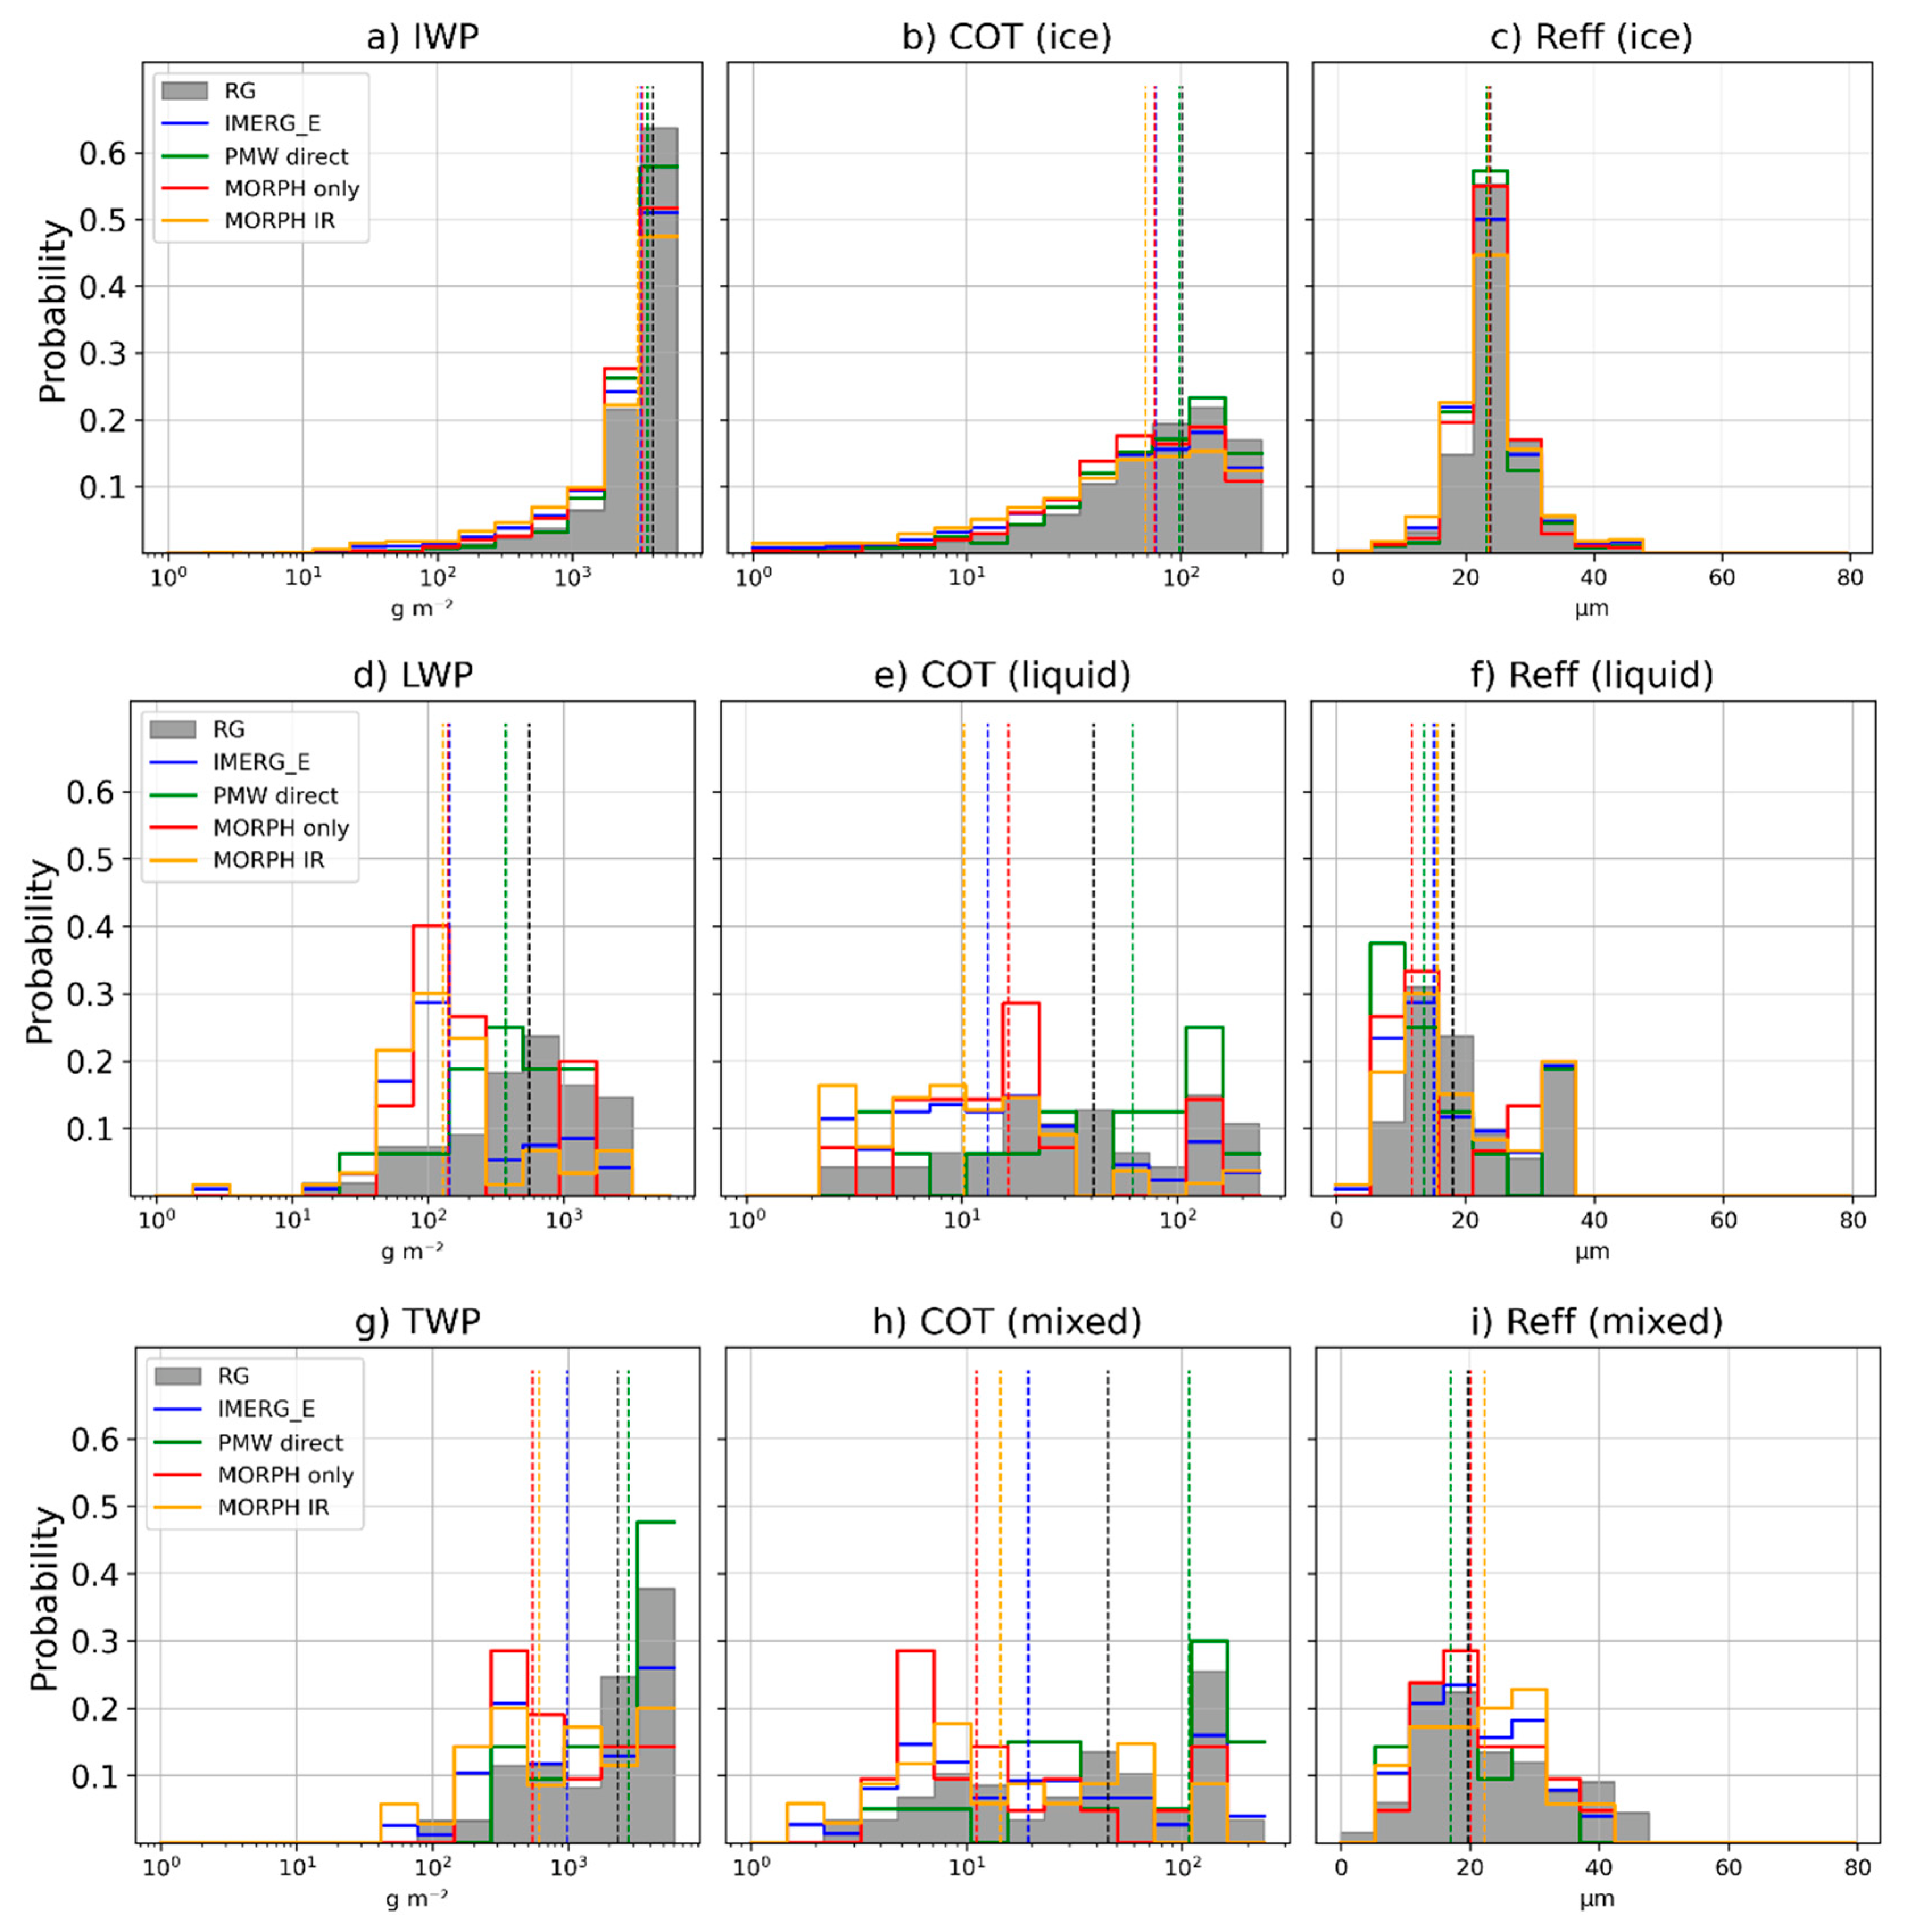
Figure 9.
Percentage of sensors contributing to hits, false alarms and misses of IMERG estimates according to cloud phase (a-c) Ice (d-f) Liquid (g-i) Mixed and the RG intensity thresholds. The missing intensity's representation (panels d and g) is due to the absence of data for those cases.
Figure 9.
Percentage of sensors contributing to hits, false alarms and misses of IMERG estimates according to cloud phase (a-c) Ice (d-f) Liquid (g-i) Mixed and the RG intensity thresholds. The missing intensity's representation (panels d and g) is due to the absence of data for those cases.
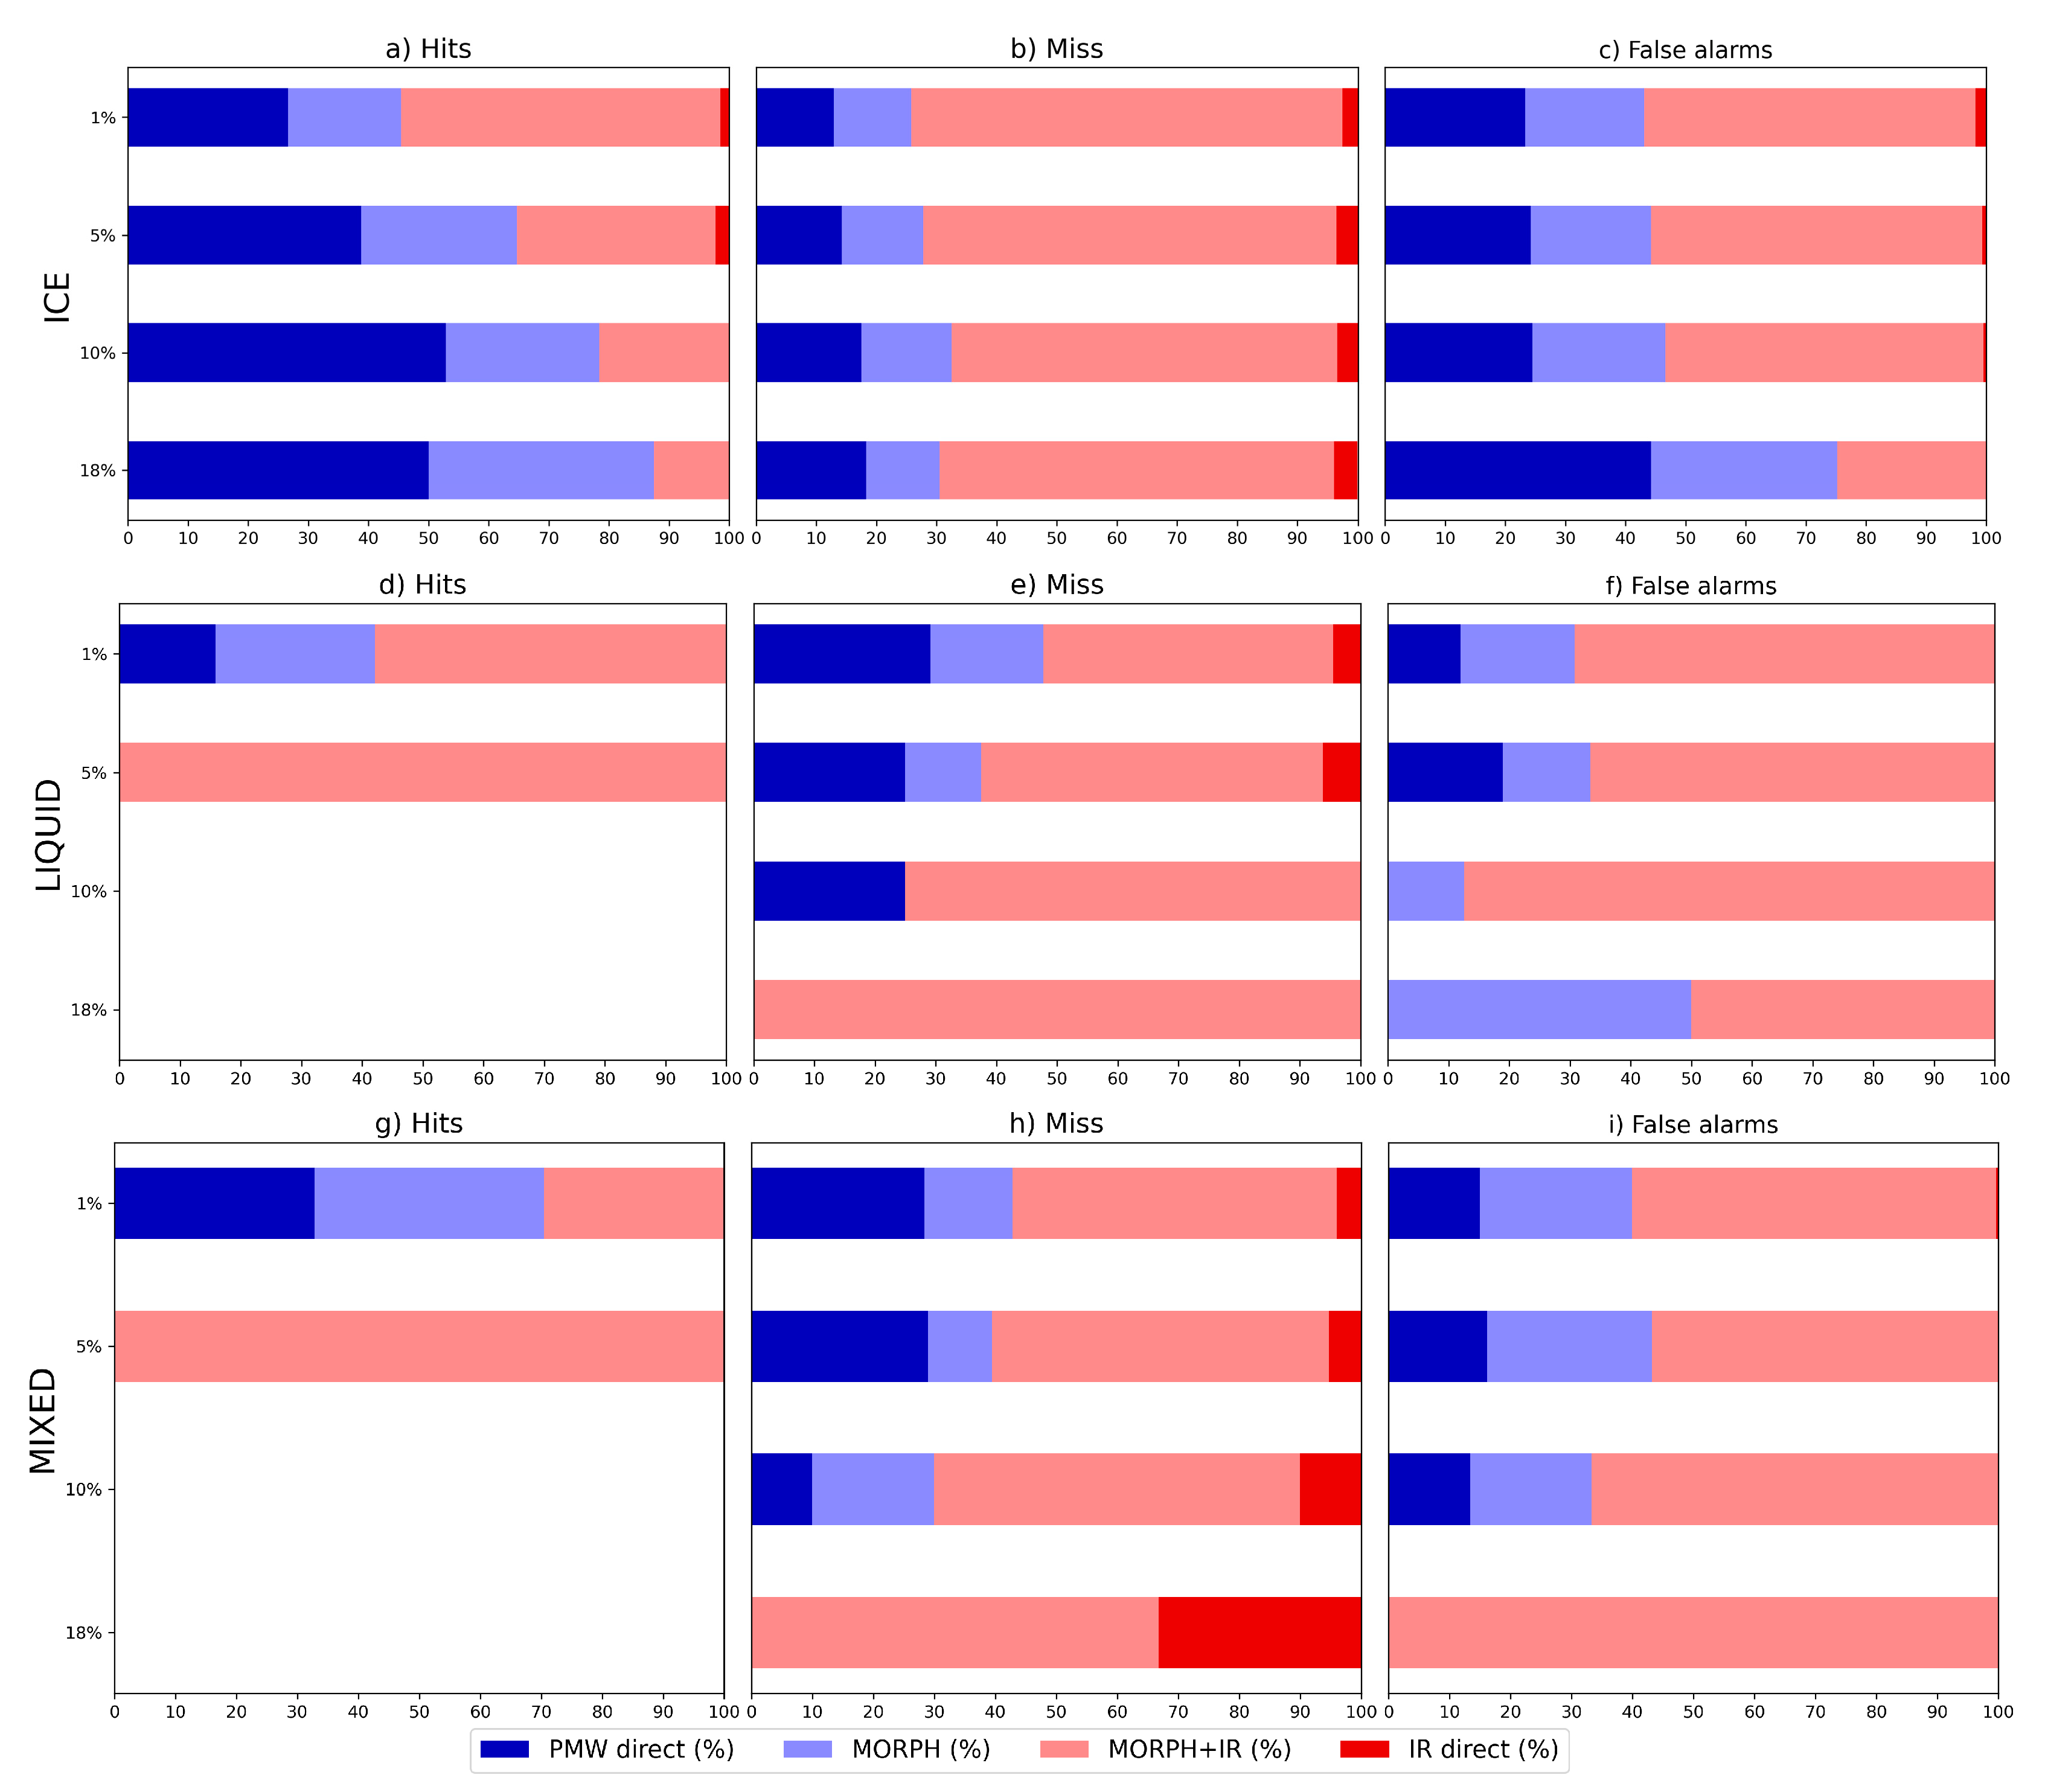
Figure 10.
As in Figure 8, but for the elements of the standard contingency table.
Figure 10.
As in Figure 8, but for the elements of the standard contingency table.
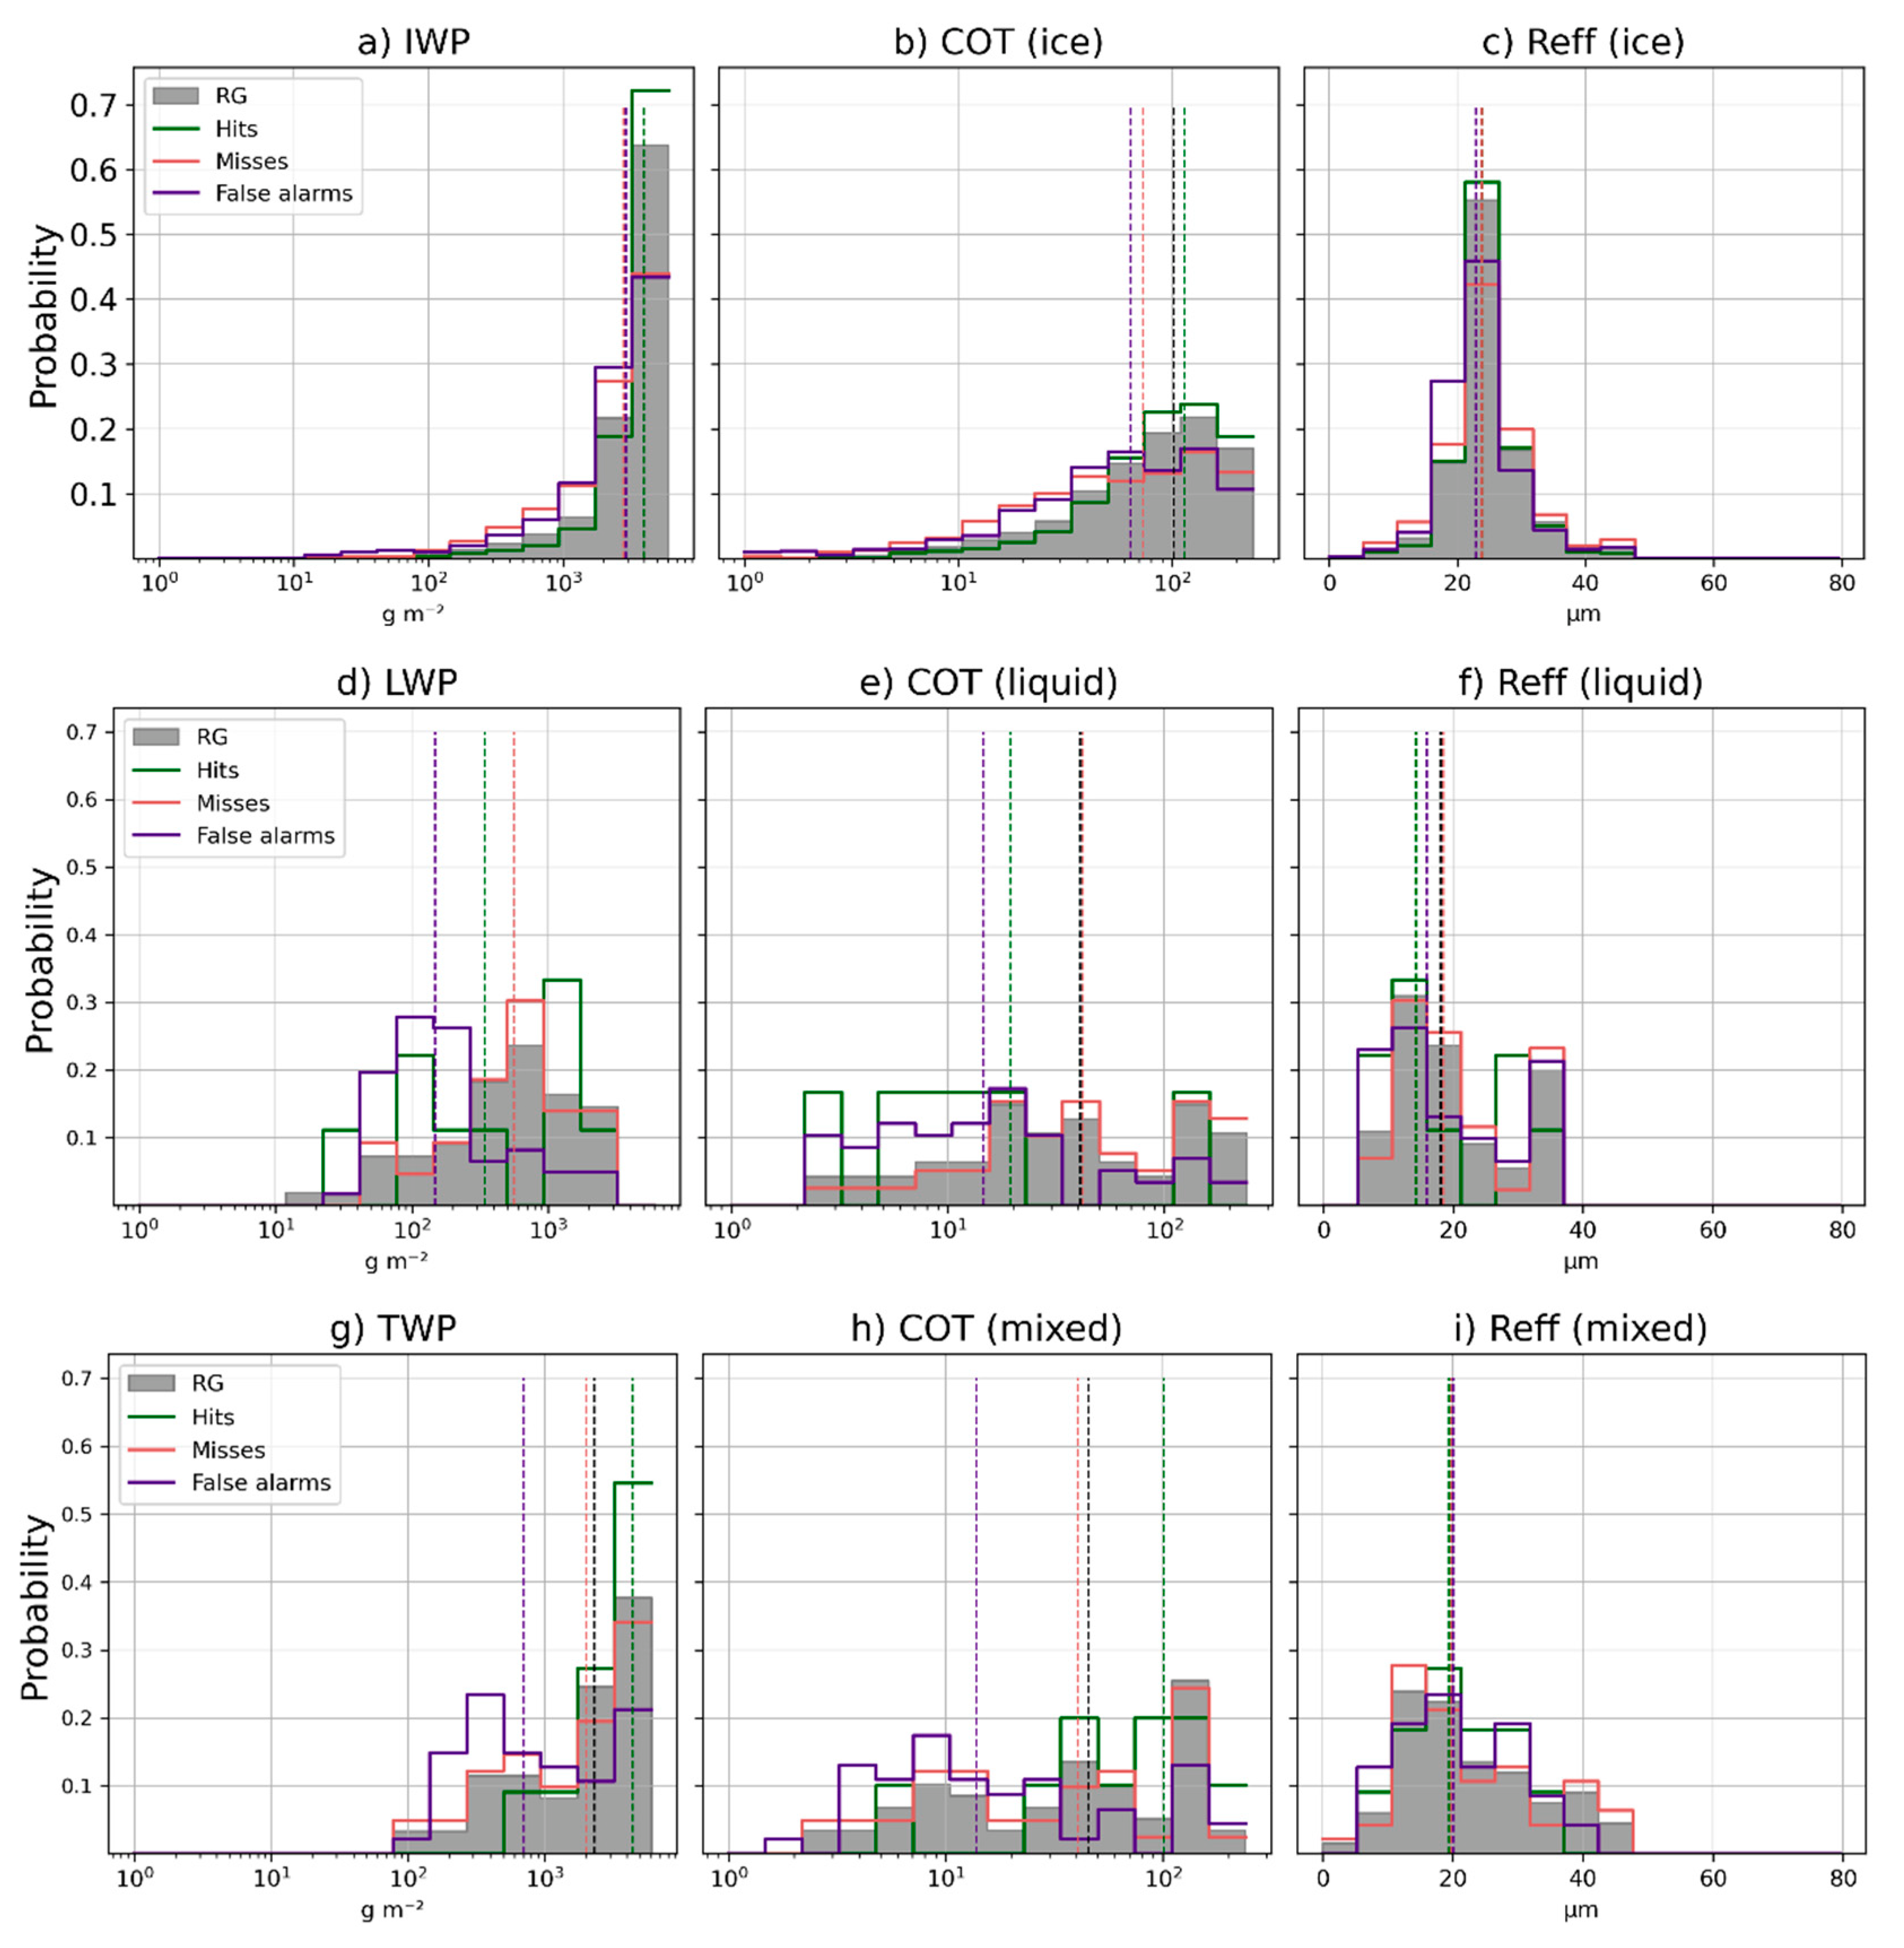
Table 1.
Contingency table comparing observed rainfall by rain gauges and estimated rainfall by IMERG for a given threshold.
Table 1.
Contingency table comparing observed rainfall by rain gauges and estimated rainfall by IMERG for a given threshold.
| Estimated rainfall | Observed rainfall | |
|---|---|---|
| Gauge ≥ threshold | Gauge < threshold | |
| IMERG ≥ threshold | Hits (H) | False alarms (F) |
| IMERG < threshold | Misses (M) | Correct Negatives |
Table 2.
List of categorical verification metrics used to evaluate IMERG products.
| Name | Formula | Perfect score |
|---|---|---|
| Probability of detection (POD) | 1 | |
| False Alarm Ratio (FAR) | 0 | |
| False Alarms Rate (POFD) | 0 | |
| Hansen and Kuipers (HK) | 1 |
Table 3.
List of the continuous verification scores used to evaluate IMERG products.
| Name | Formula | Unit | Perfect score |
|---|---|---|---|
| Spearman's correlation coefficient | - | 1 | |
| Mean Error (Bias) | mm | 0 | |
| Relative Bias (Rbias) | % | 0 | |
| Mean Absolute Error (MAE) | mm | 0 | |
| Root Mean Square Error (RMSE) | mm | 0 | |
Si - is the value of satellite/model precipitation estimates for the ith event, Oi - is the value of rain-gauge observation for the ith event, n - is the number of observed records, - is the covariance of the rank variables, and - are the standard deviations of the rank variables.
Table 4.
Rainfall thresholds taken for each time aggregation based on the extreme rainfall upper envelope curve.
Table 4.
Rainfall thresholds taken for each time aggregation based on the extreme rainfall upper envelope curve.
| Temporal aggregation (h) | 1 % (mm) | 5 % (mm) | 10 % (mm) | 18 % (mm) |
|---|---|---|---|---|
| 0.5 | 1.1 | 5.6 | 11.3 | 20.3 |
| 1 | 1.4 | 7.2 | 14.3 | 25.8 |
| 3 | 2.1 | 10.5 | 21.1 | 37.9 |
| 6 | 2.7 | 13.4 | 26.8 | 48.3 |
| 9 | 3.1 | 15.4 | 30.9 | 55.6 |
| 12 | 3.4 | 17.1 | 34.2 | 61.5 |
| 24 | 4.4 | 21.8 | 43.5 | 78.3 |
Table 5.
BIAS and MAE (both in mm/h) for each temporal aggregation and different precipitation intensity threshold considered (1 %, 5 %, 10 % and 18 % of the maximum envelope curve).
Table 5.
BIAS and MAE (both in mm/h) for each temporal aggregation and different precipitation intensity threshold considered (1 %, 5 %, 10 % and 18 % of the maximum envelope curve).
| Section | Score | IMERG | 0.5h | 1h | 3h | 6h | 9h | 12h | 24h |
|---|---|---|---|---|---|---|---|---|---|
| >=1 % | |||||||||
| A | BIAS | E | -1.81 | -0.88 | -0.21 | -0.08 | -0.05 | -0.02 | -0.07 |
| L | -1.83 | -0.79 | -0.11 | 0.00 | 0.02 | 0.03 | -0.03 | ||
| MAE | E | 4.87 | 3.52 | 2.06 | 1.37 | 1.03 | 0.86 | 0.74 | |
| L | 4.63 | 3.39 | 2.02 | 1.36 | 1.03 | 0.86 | 0.74 | ||
| >=5 % | |||||||||
| B | BIAS | E | -14.42 | -7.16 | -2.09 | -1.03 | -0.75 | -0.55 | -0.33 |
| L | -14.20 | -6.80 | -1.82 | -0.85 | -0.59 | -0.44 | -0.26 | ||
| MAE | E | 16.01 | 9.30 | 4.24 | 2.62 | 1.93 | 1.57 | 0.92 | |
| L | 15.58 | 8.94 | 4.09 | 2.56 | 1.90 | 1.56 | 0.92 | ||
| >=10 % | |||||||||
| C | BIAS | E | -26.75 | -15.07 | -4.92 | -2.18 | -1.55 | -1.17 | -0.68 |
| L | -26.54 | -14.68 | -4.51 | -1.87 | -1.23 | -0.98 | -0.52 | ||
| MAE | E | 27.48 | 16.30 | 6.80 | 4.01 | 2.94 | 2.34 | 1.39 | |
| L | 27.17 | 15.86 | 6.46 | 3.87 | 2.89 | 2.29 | 1.34 | ||
| >=18 % | |||||||||
| D | BIAS | E | -44.02 | -26.83 | -9.24 | -3.94 | -2.55 | -2.00 | -1.05 |
| L | -44.21 | -26.68 | -8.82 | -3.62 | -2.01 | -1.63 | -0.79 | ||
| MAE | E | 44.17 | 27.30 | 10.65 | 5.69 | 3.74 | 3.15 | 1.71 | |
| L | 44.31 | 27.02 | 10.13 | 5.44 | 3.65 | 3.00 | 1.61 | ||
Table 6.
Summary of IMERG error statistics for each cloud phase considering a rainfall threshold intensity of 1 %.
Table 6.
Summary of IMERG error statistics for each cloud phase considering a rainfall threshold intensity of 1 %.
| Contingency-table based measures | Continuous errors measures | ||||||||
|---|---|---|---|---|---|---|---|---|---|
| Cloud Phase | Source | POD | HK | FAR | BIAS (mm) | Rbias (%) | MAE (mm) | RMSE (mm) | |
| Ice phase | IMERG_E | 0.61 | 0.38 | 0.68 | -1.28 | -27.44 | 4.30 | 6.98 | |
| PMW-direct | 0.76 | 0.46 | 0.64 | 0.23 | 4.91 | 4.36 | 7.12 | ||
| MORPH-only | 0.69 | 0.44 | 0.69 | -0.35 | -7.62 | 4.15 | 6.71 | ||
| MORPH+IR | 0.54 | 0.33 | 0.68 | -2.04 | -43.89 | 3.89 | 6.44 | ||
| Liquid phase | IMERG_E | 0.16 | 0.07 | 0.91 | -3.00 | -82.24 | 3.22 | 4.98 | |
| PMW-direct | 0.11 | 0.02 | 0.88 | -2.32 | -84.79 | 2.42 | 3.28 | ||
| MORPH-only | 0.24 | 0.12 | 0.88 | -2.43 | -79.35 | 2.43 | 2.96 | ||
| MORPH+IR | 0.21 | 0.10 | 0.92 | -3.74 | -85.43 | 3.85 | 6.66 | ||
| Mixed phase | IMERG_E | 0.22 | 0.11 | 0.80 | -2.64 | -71.55 | 3.58 | 5.63 | |
| PMW-direct | 0.26 | 0.16 | 0.64 | -2.26 | -70.55 | 2.87 | 4.01 | ||
| MORPH-only | 0.44 | 0.29 | 0.72 | -1.34 | -42.11 | 2.90 | 4.28 | ||
| MORPH+IR | 0.14 | 0.02 | 0.89 | -3.12 | -78.87 | 3.70 | 6.11 | ||
Disclaimer/Publisher’s Note: The statements, opinions and data contained in all publications are solely those of the individual author(s) and contributor(s) and not of MDPI and/or the editor(s). MDPI and/or the editor(s) disclaim responsibility for any injury to people or property resulting from any ideas, methods, instructions or products referred to in the content. |
© 2024 by the authors. Licensee MDPI, Basel, Switzerland. This article is an open access article distributed under the terms and conditions of the Creative Commons Attribution (CC BY) license (http://creativecommons.org/licenses/by/4.0/).
Copyright: This open access article is published under a Creative Commons CC BY 4.0 license, which permit the free download, distribution, and reuse, provided that the author and preprint are cited in any reuse.


