Submitted:
05 January 2024
Posted:
08 January 2024
You are already at the latest version
Abstract
Keywords:
1. Introduction
2. Materials and Methods
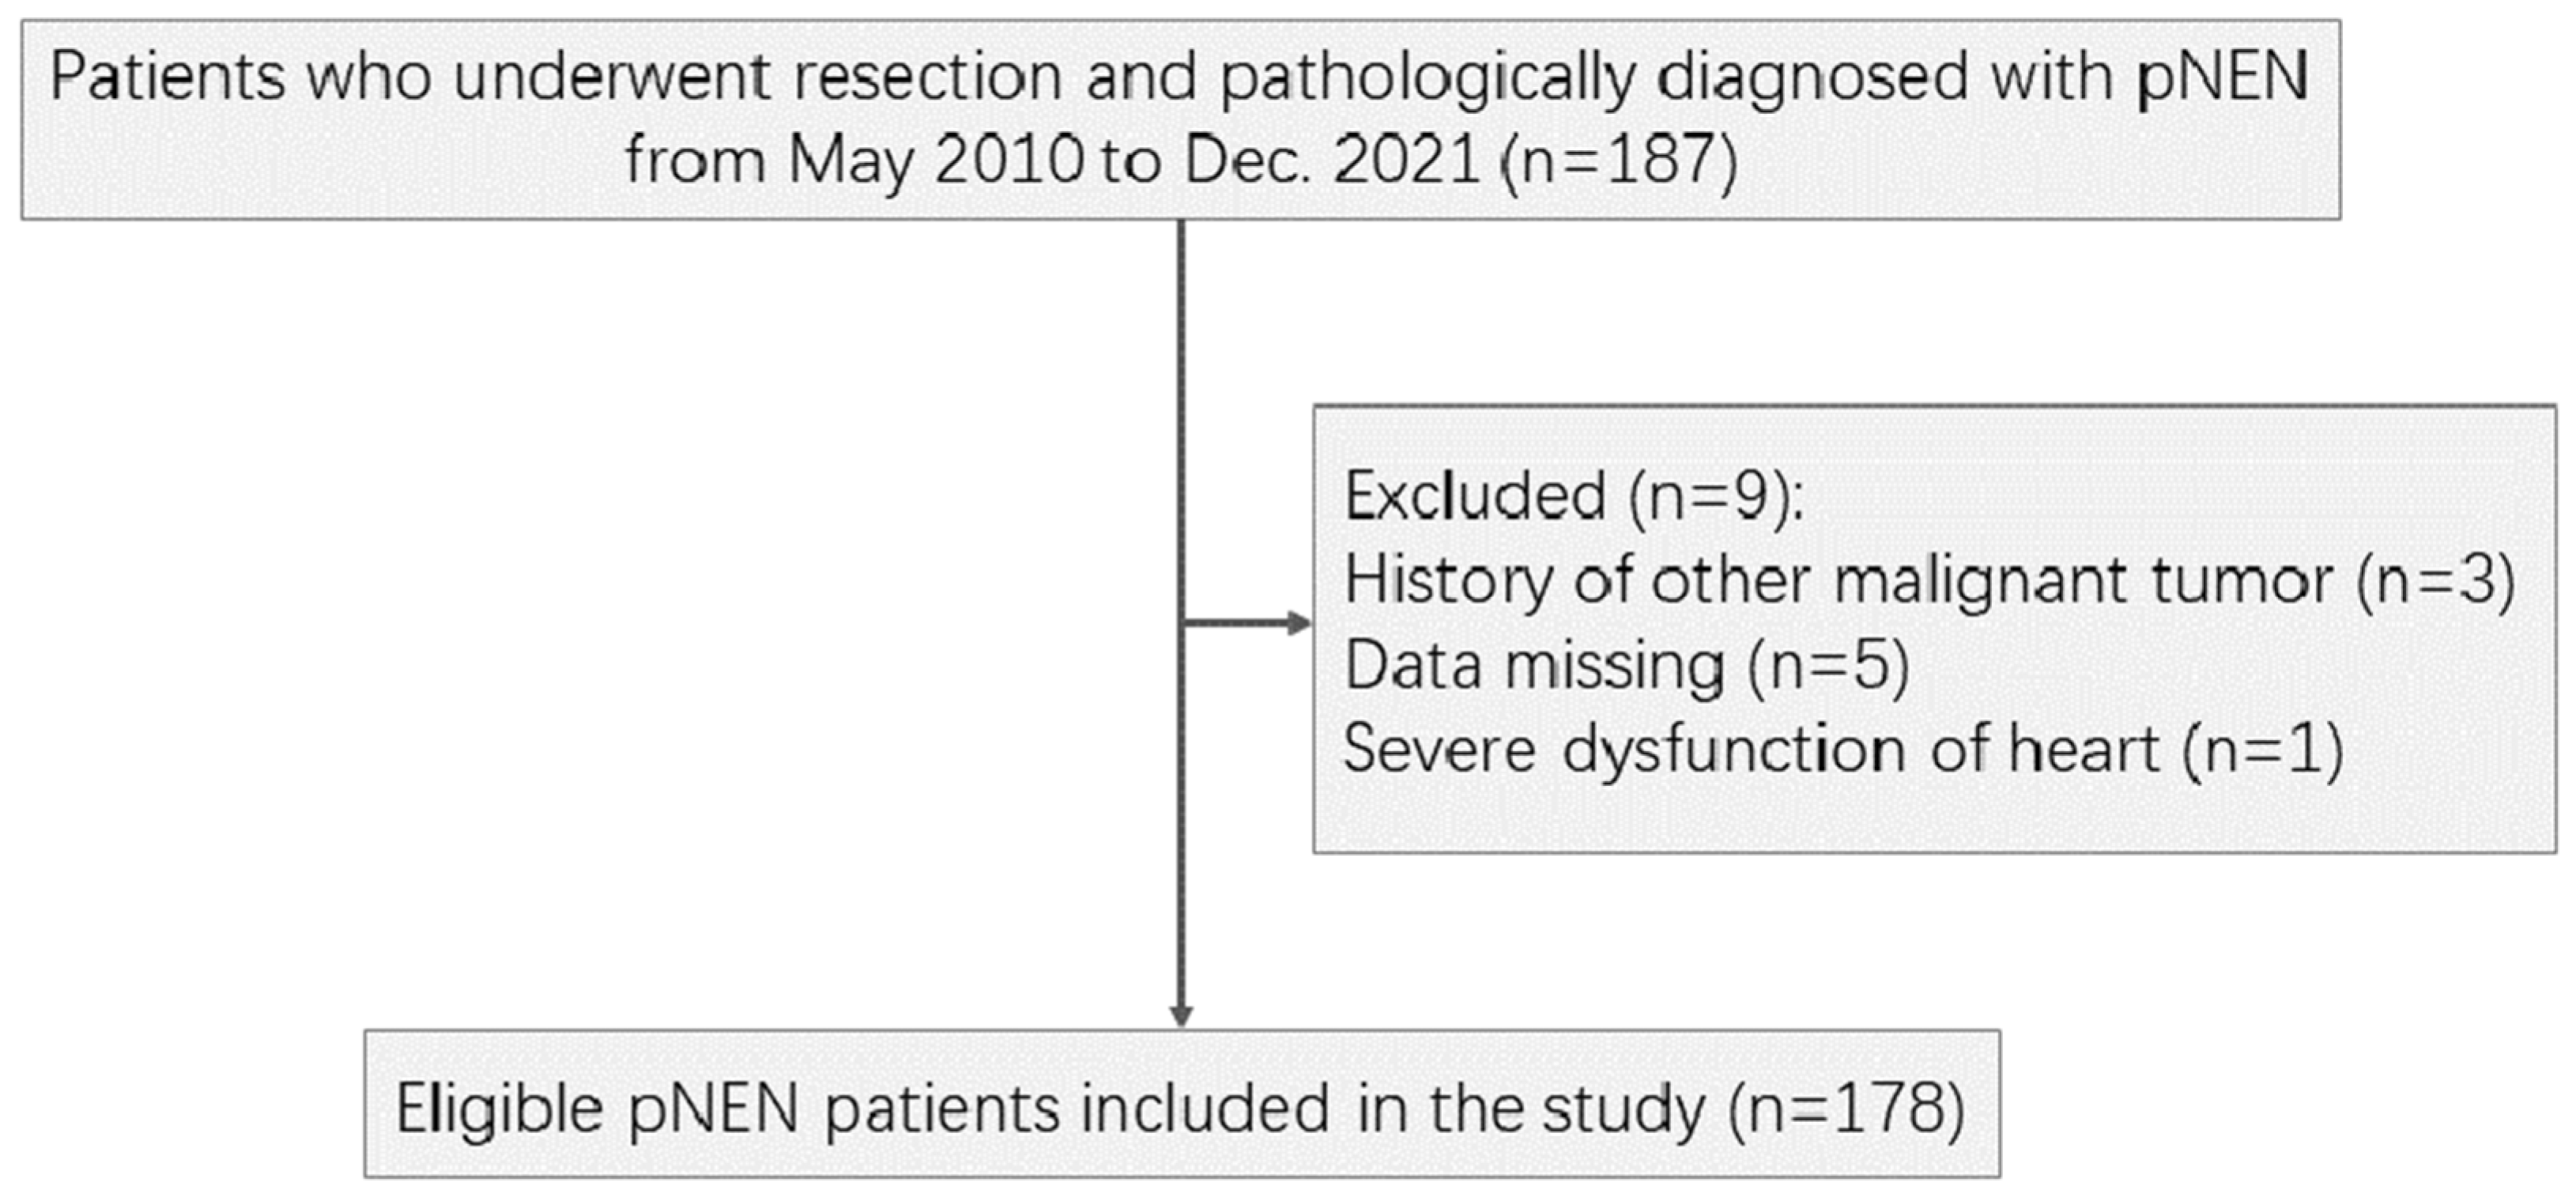
2.1. Patient Selection
2.2. Follow-Up
2.3. Statistical Analysis
3. Results
3.1. Baseline Characteristics
3.2. Cutoff Values of Fasting Blood Glucose-Based Novel Indexes
3.3. Prediction Roles of Fasting Blood Glucose-Based Indexes for PFS
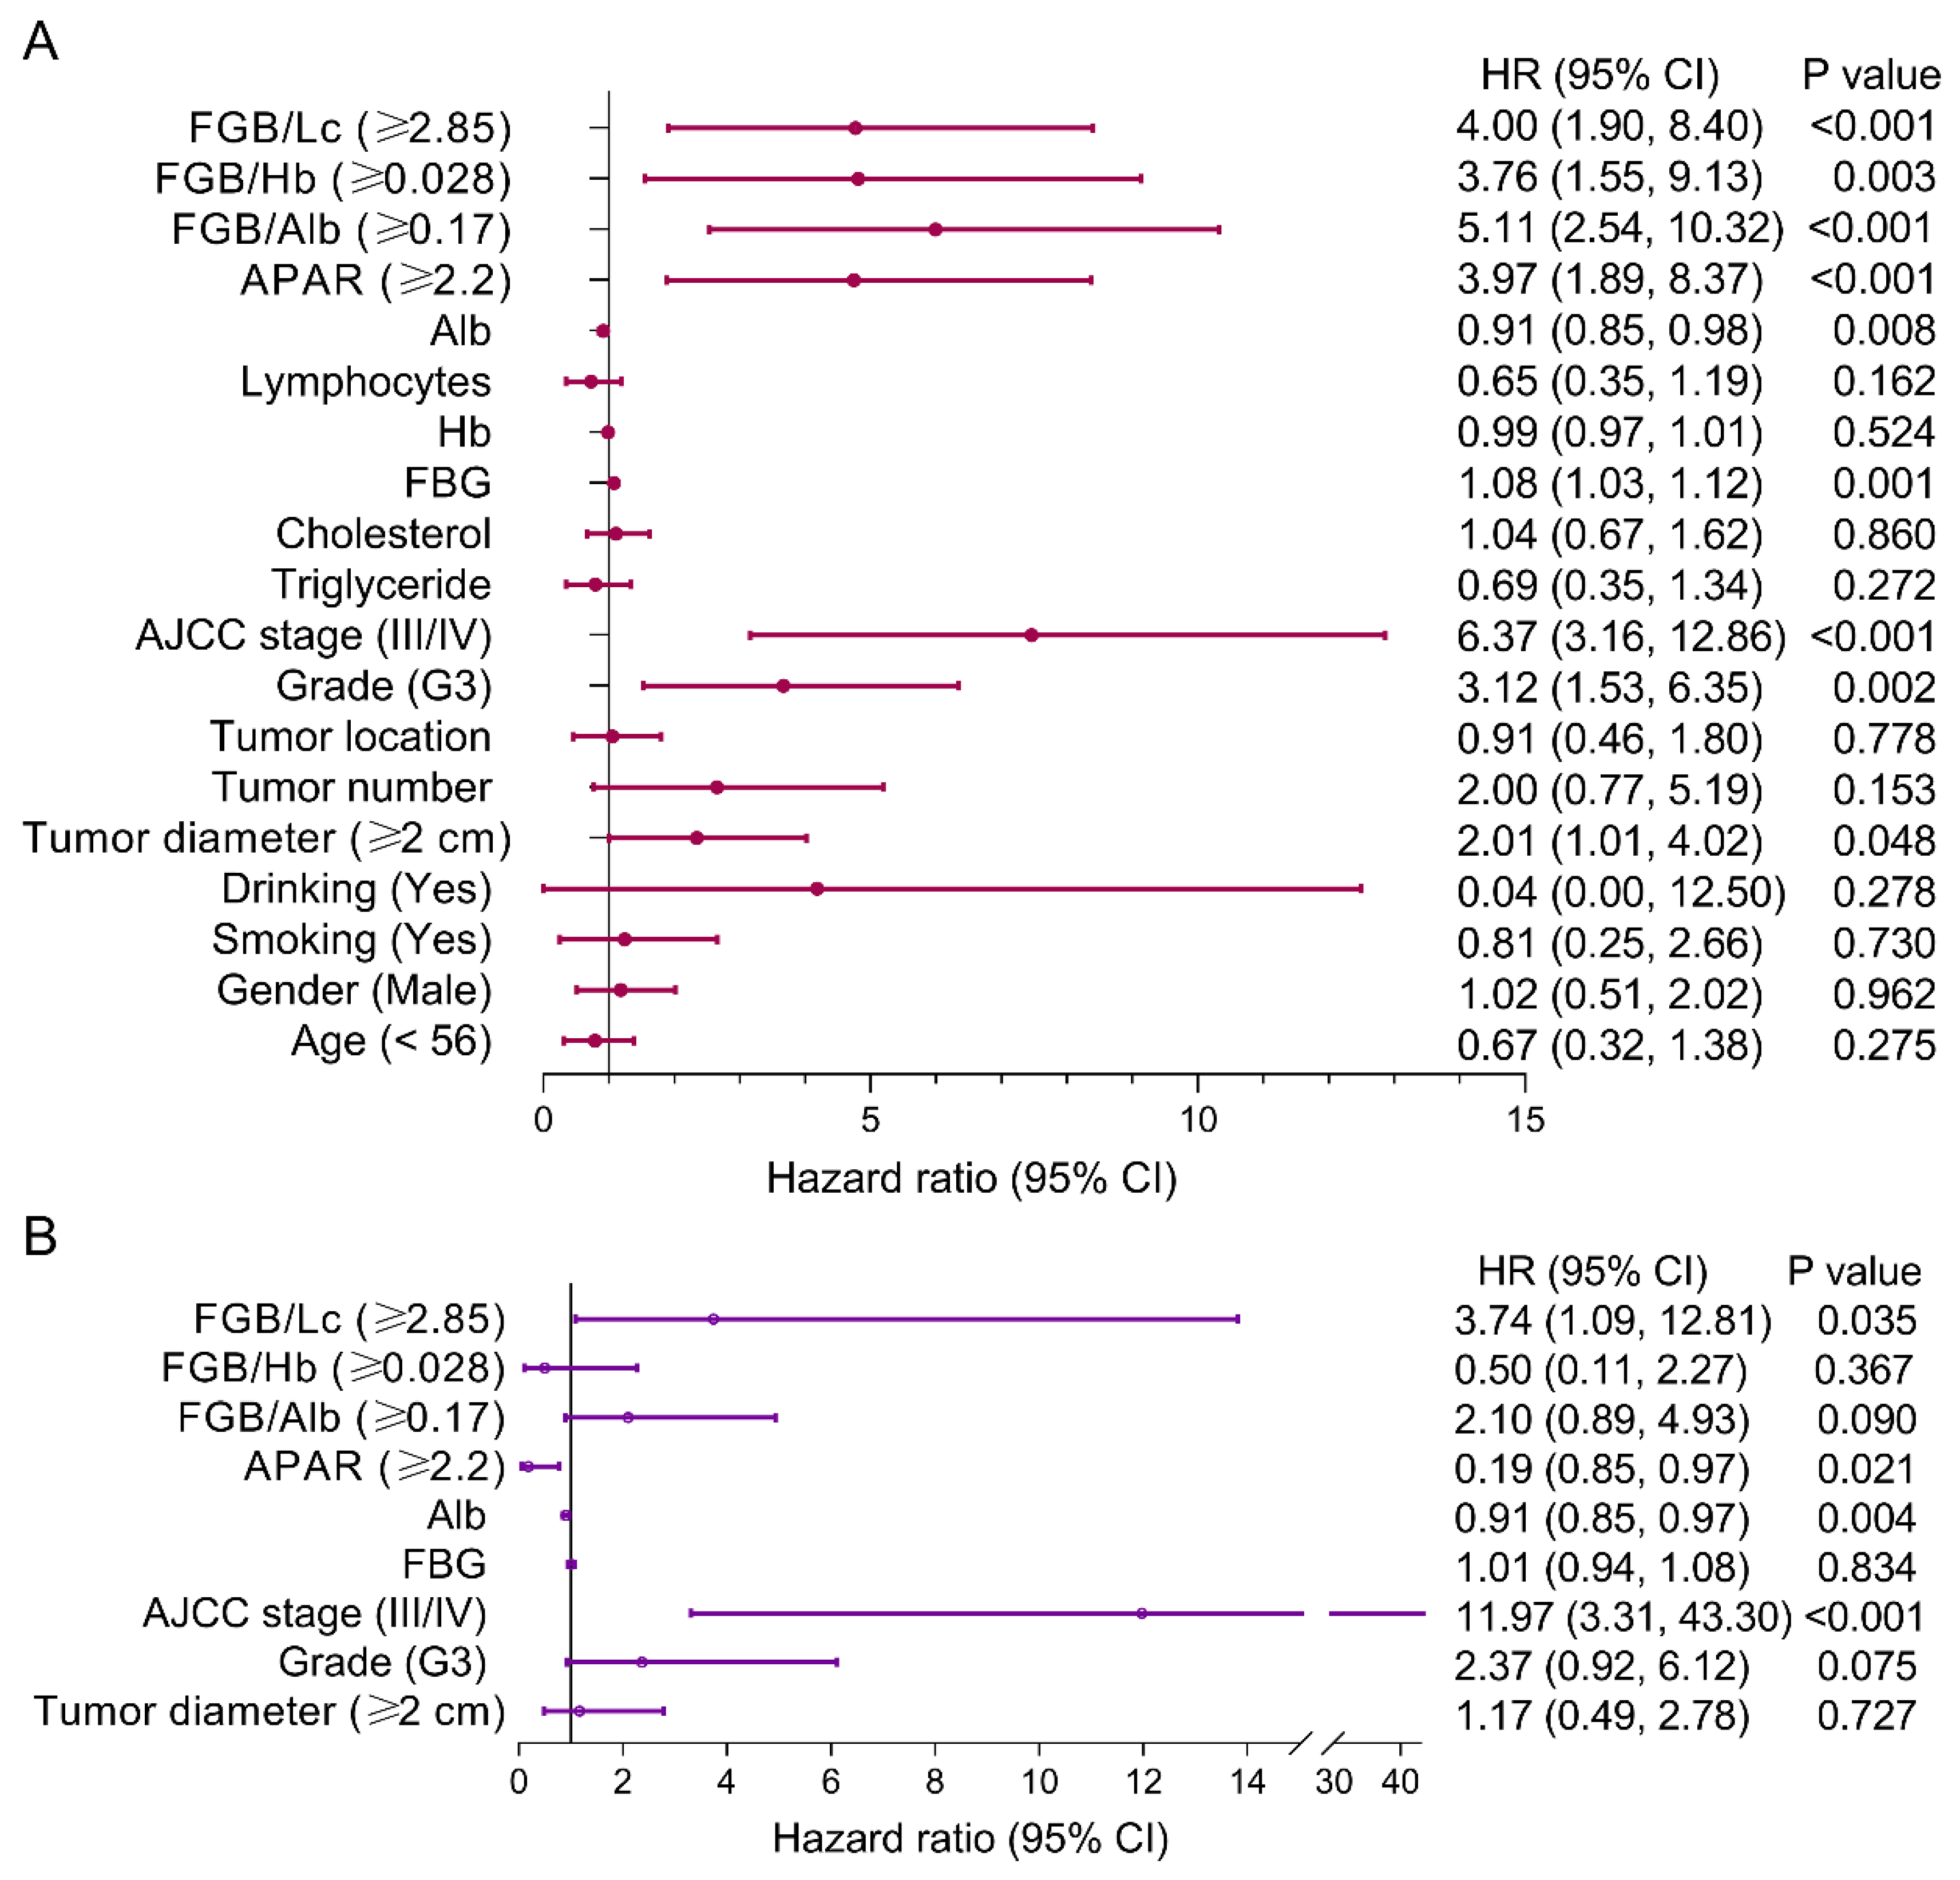
3.4. Risk Factors of PFS for pNEN Patients
3.5. Prediction Roles of Fasting Blood Glucose-Based Indexes for OS
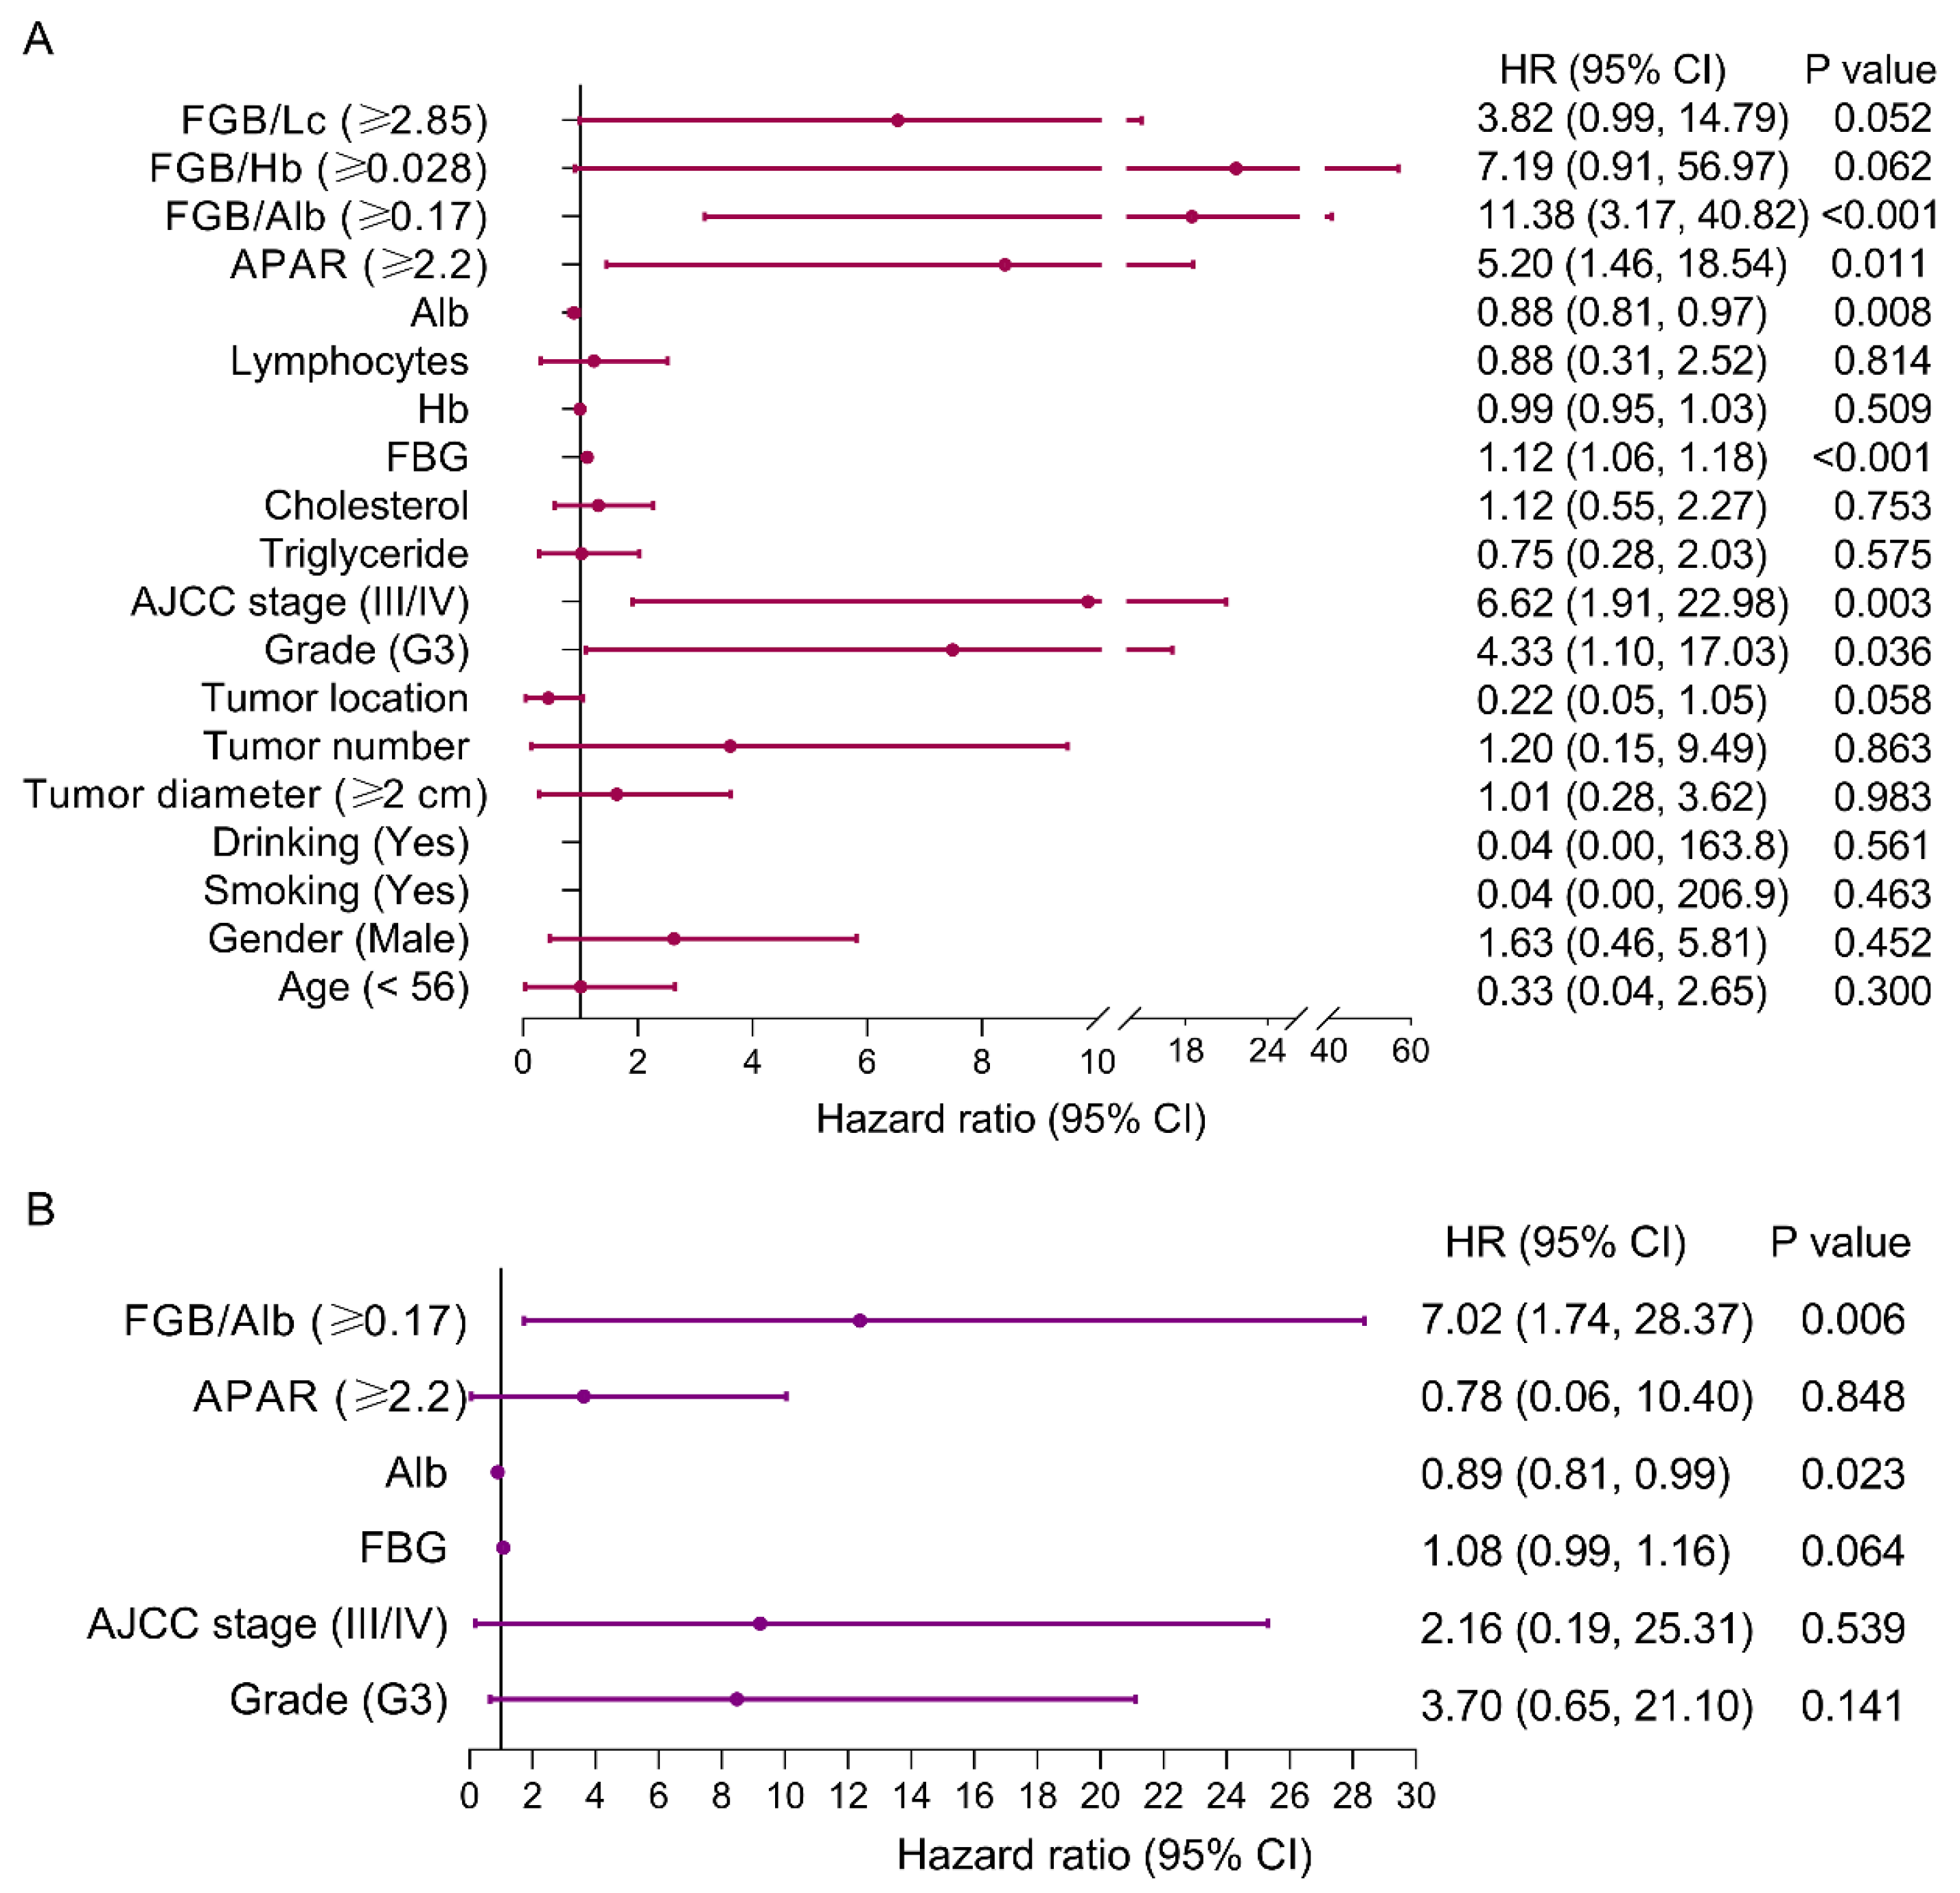
3.6. Risk Factors of OS for pNEN Patients
3.7. Baseline Characteristics and Risk Factors of PFS for Patients with pNEN and Metastasis
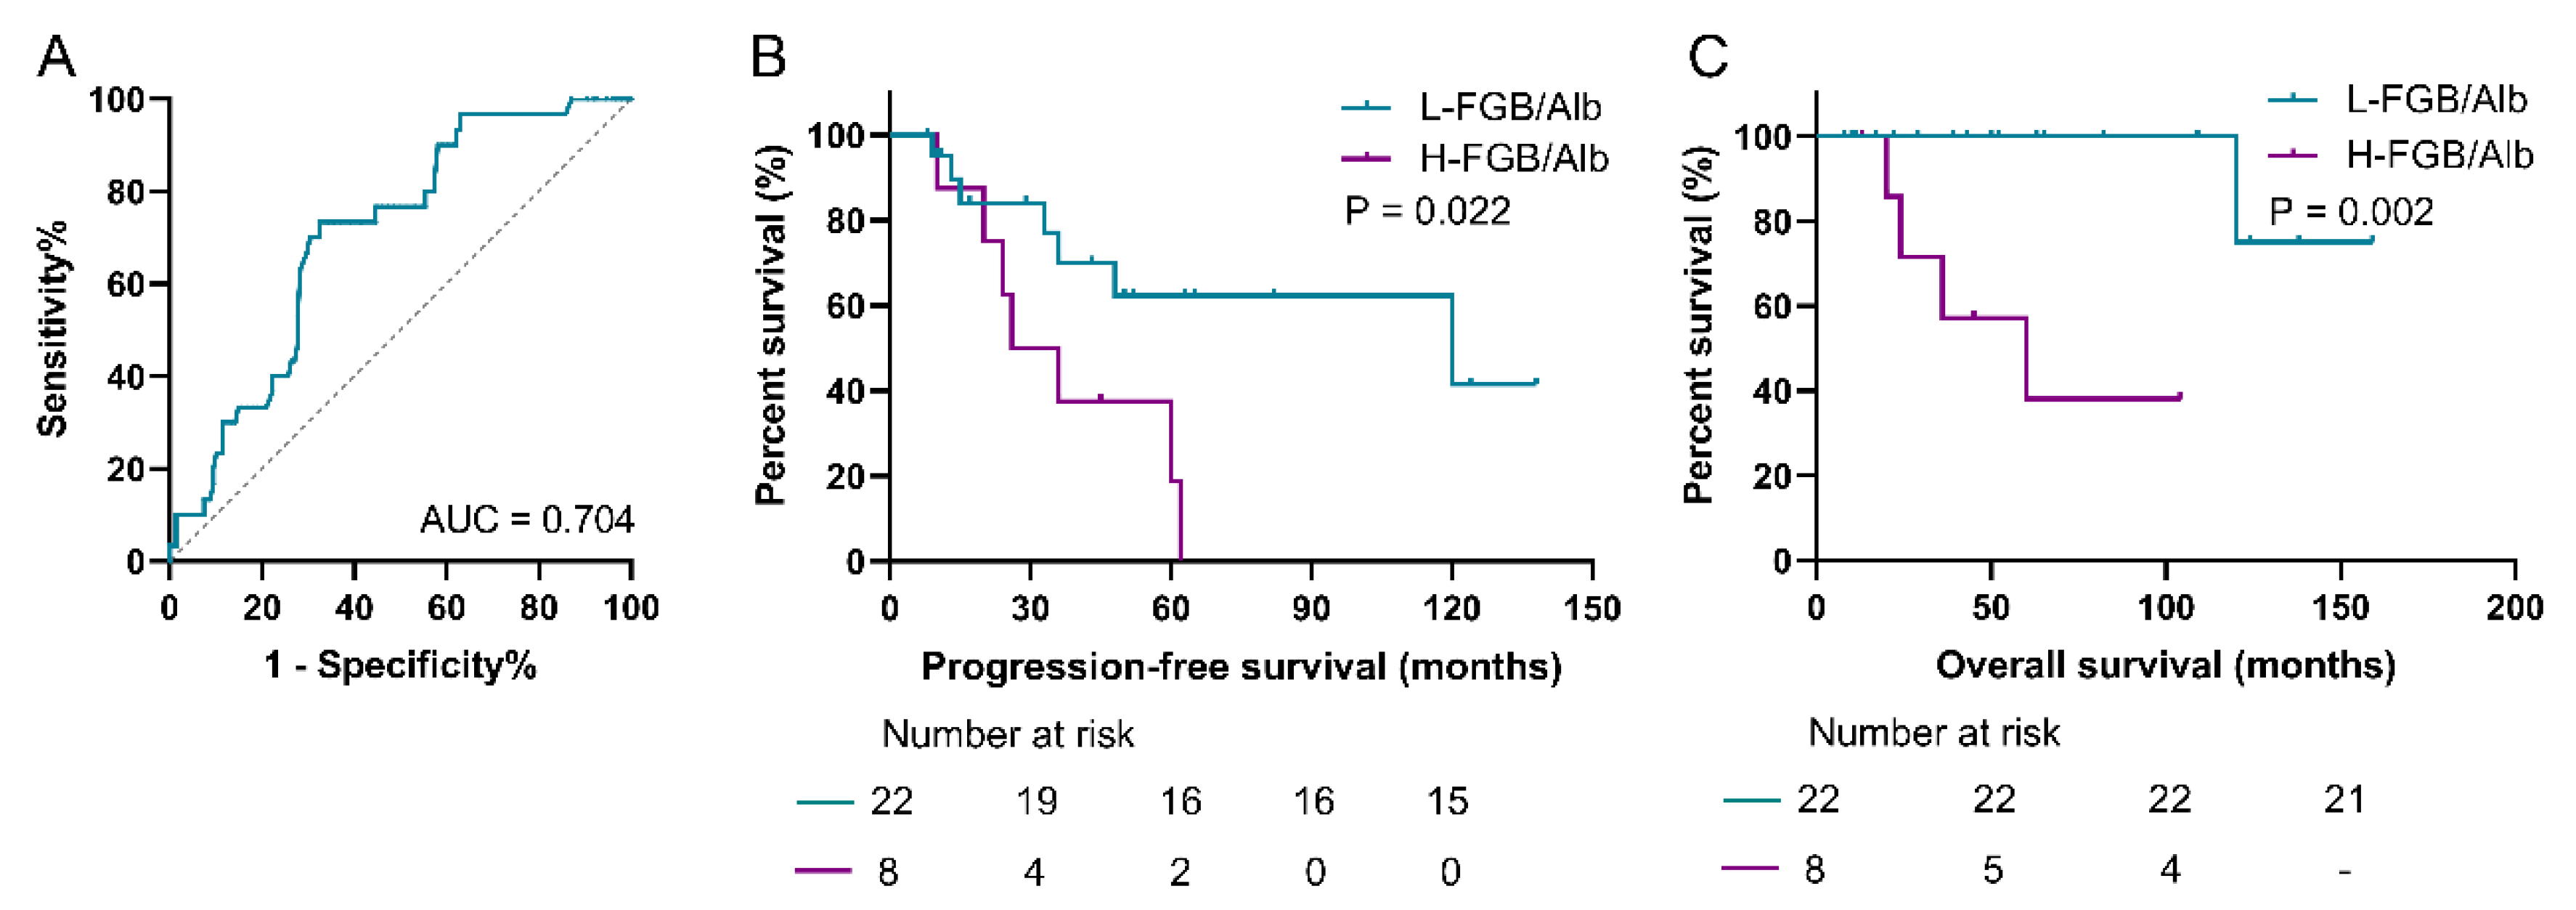
3.8. Prediction Role of FAR for Patients with pNEN and Metastasis
4. Discussion
5. Conclusions
Author Contributions
Funding
Institutional Review Board Statement
Informed Consent Statement
Data Availability Statement
Conflicts of Interest
Abbreviations
References
- Dasari, A.; Shen, C.; Halperin, D.; Zhao, B.; Zhou, S.; Xu, Y.; Shih, T.; Yao, J.C. Trends in the incidence, prevalence, and survival outcomes in patients with neuroendocrine tumors in the United States. JAMA Oncol. 2017, 3, 1335–1342. [Google Scholar] [CrossRef]
- Falconi, M.; Eriksson, B.; Kaltsas, G.; Bartsch, D.K.; Capdevila, J.; Caplin, M.; Kos-Kudla, B.; Kwekkeboom, D.; Rindi, G.; Klöppel, G.; et al. ENETS consensus guidelines update for the management of patients with functional pancreatic neuroendocrine tumors and non-functional pancreatic neuroendocrine tumors. Neuroendocrinology 2016, 103, 153–171. [Google Scholar] [CrossRef]
- Forsythe, S.D.; Pu, T.; Andrews, S.G.; Madigan, J.P.; Sadowski, S.M. Models in pancreatic neuroendocrine neoplasms: Current perspectives and future directions. Cancers 2023, 15, 3756. [Google Scholar] [CrossRef]
- Chun, Y.S.; Pawlik, T.M.; Vauthey, J.N. 8th edition of the AJCC cancer staging manual: Pancreas and hepatobiliary cancers. Ann. Surg. Oncol. 2018, 25, 845–847. [Google Scholar] [CrossRef]
- Zhou, W.; Fang, Y.; Han, X.; Kuang, T.; Xu, X.; Lou, W.; Wang, D. The value of alkaline phosphatase-to-albumin ratio in detecting synchronous metastases and predicting postoperative relapses among patients with well-differentiated pancreatic neuroendocrine neoplasms. J. Oncol. 2020, 2020, 8927531. [Google Scholar] [CrossRef]
- Pu, N.; Gao, S.; Xu, Y.; Zhao, G.; Lv, Y.; Nuerxiati, A.; Li, J.-A.; Wang, D.; Xu, X.; Kuang, T.; et al. Alkaline phosphatase-to-albumin ratio as a prognostic indicator in pancreatic ductal adenocarcinoma after curative resection. J. Cancer 2017, 8, 3362–3370. [Google Scholar] [CrossRef]
- Wang, Y.; Bi, X.; Zhao, H.; Li, Z.; Zhao, J.; Zhou, J.; Huang, Z.; Zhang, Y.; Chen, X.; Zhang, C.; et al. Prognostic significance of the preoperative alkaline phosphatase-to-albumin ratio in patients with hepatocellular carcinoma after hepatic resection. Oncol. Lett. 2023, 25, 1–9. [Google Scholar] [CrossRef] [PubMed]
- Vulichi SR, Runthala A, Begari N, Rupak K, Chunduri VR, Kapur S, Chippada AR, Sistla DSM. Type-2 diabetes mellitus-associated cancer risk: In pursuit of understanding the possible link. Diabetes Metab Syndr, 2022, 16(9):102591. [CrossRef]
- van Holstein, Y.; Berkmortel, P.J.E.v.D.; Trompet, S.; van Heemst, D.; Bos, F.v.D.; Rhijn, M.R.-V.; de Glas, N.A.; Beekman, M.; Slagboom, P.E.; Portielje, J.E.; et al. The association of blood biomarkers with treatment response and adverse health outcomes in older patients with solid tumors: A systematic review. J. Geriatr. Oncol. 2023, 14, 101567. [Google Scholar] [CrossRef] [PubMed]
- Zhou, W.; Kuang, T.; Han, X.; Chen, W.; Xu, X.; Lou, W.; Wang, D. Prognostic role of lymphocyte-to-monocyte ratio in pancreatic neuroendocrine neoplasms. Endocr. Connect. 2020, 9, 289–298. [Google Scholar] [CrossRef] [PubMed]
- Pan, X.-F.; He, M.; Yu, C.; Lv, J.; Guo, Y.; Bian, Z.; Yang, L.; Chen, Y.; Wu, T.; Chen, Z.; et al. Type 2 diabetes and risk of incident cancer in China: A prospective study among 0.5 million Chinese adults. Am. J. Epidemiology 2018, 187, 1380–1391. [Google Scholar] [CrossRef] [PubMed]
- Chen, Y.; Wu, F.; Saito, E.; Lin, Y.; Song, M.; Luu, H.N.; Gupta, P.C.; Sawada, N.; Tamakoshi, A.; Shu, X.-O.; et al. Association between type 2 diabetes and risk of cancer mortality: A pooled analysis of over 771,000 individuals in the Asia cohort consortium. Diabetologia 2017, 60, 1022–1032. [Google Scholar] [CrossRef] [PubMed]
- Buono R, Longo VD. Starvation, stress resistance, and cancer. Trends Endocrinol Metab, 2018, 29(4):271-280. [CrossRef]
- Klil-Drori AJ, Azoulay L, Pollak MN. Cancer, obesity, diabetes, and antidiabetic drugs: Is the fog clearing? Nat Rev Clin Oncol, 2017, 14(2):85-99.
- Goncalves MD, Hopkins BD, Cantley LC. Phosphatidylinositol 3-kinase, growth disorders, and cancer. N Engl J Med, 2018, 379(21):2052-2062. [CrossRef]
- Ramteke, P.; Deb, A.; Shepal, V.; Bhat, M.K. Hyperglycemia associated metabolic and molecular alterations in cancer risk, progression, treatment, and mortality. Cancers 2019, 11, 1402. [Google Scholar] [CrossRef]
- Biswas, S.; Chakrabarti, S. Increased extracellular matrix protein production in chronic diabetic complications: Implications of non-coding RNAs. Non-Coding RNA 2019, 5, 30. [Google Scholar] [CrossRef] [PubMed]
- Yan, B.; Tao, Z.-F.; Li, X.-M.; Zhang, H.; Yao, J.; Jiang, Q. Aberrant expression of long noncoding RNAs in early diabetic retinopathy. Investig. Opthalmology Vis. Sci. 2014, 55, 941–951. [Google Scholar] [CrossRef] [PubMed]
- Yang, M.; Vousden, K.H. Serine and one-carbon metabolism in cancer. Nat. Rev. Cancer 2016, 16, 650–662. [Google Scholar] [CrossRef] [PubMed]
- Carnero A, Lleonart M. The hypoxic microenvironment: A determinant of cancer stem cell evolution. Bioessays, 2016, 38 Suppl 1:S65-74. [CrossRef]
- Shi, Y.; Shen, G.; Zeng, Y.; Ju, M.; Chen, X.; He, C.; Liang, L.; Ge, X.; Sun, X.; Di, X. Predictive values of the hemoglobin, albumin, lymphocyte and platelet score (HALP) and the modified -Gustave Roussy immune score for esophageal squamous cell carcinoma patients undergoing concurrent chemoradiotherapy. Int. Immunopharmacol. 2023, 123, 110773. [Google Scholar] [CrossRef] [PubMed]
- Tuncel, E.T.; Parvizi, M.; Kut, E.; Aydin, M.; Kasap, E. Prognostic significance of hemoglobin/prognostic nutritional index and hemoglobin/red blood cell distribution in rectal cancer. Turk. J. Gastroenterol. 2023, 34, 128–134. [Google Scholar] [CrossRef] [PubMed]
- Zhao ST, Chen XX, Yang XM, He SC, Qian FH. Application of monocyte-to-albumin ratio and neutrophil percentage-to-hemoglobin ratio on distinguishing non-small cell lung cancer patients from healthy subjects. Int J Gen Med, 2023, 16:2175-2185.
- Ryan, A.M.; Power, D.G.; Daly, L.; Cushen, S.J.; Bhuachalla, Ē.N.; Prado, C.M. Cancer-associated malnutrition, cachexia and sarcopenia: The skeleton in the hospital closet 40 years later. Proc. Nutr. Soc. 2016, 75, 199–211. [Google Scholar] [CrossRef]
- Efremova, M.; Rieder, D.; Klepsch, V.; Charoentong, P.; Finotello, F.; Hackl, H.; Hermann-Kleiter, N.; Löwer, M.; Baier, G.; Krogsdam, A.; et al. Targeting immune checkpoints potentiates immunoediting and changes the dynamics of tumor evolution. Nat. Commun. 2018, 9, 32. [Google Scholar] [CrossRef]
- Chen, J.-L.; Wu, J.-N.; Lv, X.-D.; Yang, Q.-C.; Chen, J.-R.; Zhang, D.-M. The value of red blood cell distribution width, neutrophil-to-lymphocyte ratio, and hemoglobin-to-red blood cell distribution width ratio in the progression of non-small cell lung cancer. PLOS ONE 2020, 15, e0237947. [Google Scholar] [CrossRef]
- Wei, Y.-S.; Zhou, Y.-G.; Wang, G.-Y.; Liang, Z.-H.; Luo, M.-R.; Yang, T.-A.; Huang, J. The impact of chemotherapy-associated hemoglobin on prognosis of colorectal cancer patients receiving adjuvant chemotherapy. Cancer Biomarkers 2017, 20, 627–635. [Google Scholar] [CrossRef] [PubMed]
- De Francesco, E.M.; Pellegrino, M.; Santolla, M.F.; Lappano, R.; Ricchio, E.; Abonante, S.; Maggiolini, M. GPER mediates activation of HIF1α/VEGF signaling by estrogens. Cancer Res 2014, 74, 4053–4064. [Google Scholar] [CrossRef] [PubMed]
- Mori, K.; Janisch, F.; Mostafaei, H.; Lysenko, I.; Karakiewicz, P.I.; Enikeev, D.V.; Briganti, A.; Kimura, S.; Egawa, S.; Shariat, S.F. Prognostic value of hemoglobin in metastatic hormone-sensitive prostate cancer: A systematic review and meta-analysis. Clin. Genitourin. Cancer 2020, 18, e402–e409. [Google Scholar] [CrossRef] [PubMed]
- Magrowski, Ł.; Masri, O.; Ciepał, J.; Depowska, G.; Nowicka, Z.; Stando, R.; Chimiak, K.; Bylica, G.; Czapla, B.; Masri, M.; et al. Pre-treatment hemoglobin concentration and absolute monocyte count as independent prognostic factors for survival in localized or locally advanced prostate cancer patients undergoing radiotherapy. Biomedicines 2022, 10, 2514. [Google Scholar] [CrossRef]
- Katz, S.C.; Donkor, C.; Glasgow, K.; Pillarisetty, V.G.; Gönen, M.; Espat, N.J.; Klimstra, D.S.; D’Angelica, M.I.; Allen, P.J.; Jarnagin, W.; et al. T cell infiltrate and outcome following resection of intermediate-grade primary neuroendocrine tumours and liver metastases. HPB 2010, 12, 674–683. [Google Scholar] [CrossRef]
- Bai, J.; Song, J.; Zhang, Y.; Li, X.; Yan, L.; Hu, P.; Tang, Q. Transcatheter arterial embolization in patients with neuroendocrine neoplasms related to liver metastasis with different blood supplies. Cancer Med. 2023, 12, 18578–18587. [Google Scholar] [CrossRef]


| Characteristics | All (N=178) | Recover (N=145) | Progress (N=33) | P value |
|---|---|---|---|---|
| Onset age (years) | 48.1 ± 13.5 | 47.6 ± 13.7 | 50.6 ± 12.3 | 0.247 |
| Operative age (years) | 50.6 ± 13.0 | 49.8 ± 13.4 | 54.0 ± 10.6 | 0.095 |
| Gender | 0.312 | |||
| Male | 83 (46.6%) | 65 (44.8%) | 18 (54.5%) | |
| Female | 95 (53.4%) | 80 (55.2%) | 15 (45.5%) | |
| BMI (kg/m2) | 23.9 ± 3.7 | 24.3 ± 3.6 | 22.2 ± 3.6 | 0.003 |
| Region | 0.185 | |||
| Urban | 94 (52.8%) | 80 (55.2%) | 14 (42.4%) | |
| Rural | 84 (47.2) | 65 (44.8%) | 19 (57.6%) | |
| Smoking | 21 (11.8%) | 18 (12.4%) | 3 (9.1%) | 0.593 |
| Drinking | 12 (6.7%) | 12 (8.1%) | 1 (3.0%) | 0.296 |
| Hypertension | 21 (11.8%) | 14 (9.7%) | 7 (21.2%) | 0.063 |
| Diabetes | 16 (9.0%) | 11(7.6%) | 5 (15.2%) | 0.170 |
| Tumor | ||||
| Diameter (cm) | 2.4 ± 1.6 | 2.2 ± 1.3 | 3.1 ± 2.3 | 0.002 |
| Number | 0.670 | |||
| Single | 164 (92.1%) | 133 (91.7%) | 31 (93.9%) | |
| Multiple | 14 (7.9%) | 12 (8.3%) | 2 (6.1%) | |
| Location | 0.791 | |||
| Head-neck | 88 (50.6%) | 71 (49.0%) | 17 (51.5%) | |
| Body-tail | 90 (49.4%) | 74 (51.0%) | 16 (48.5%) | |
| Type | 0.031 | |||
| Function | 84 (47.2%) | 74 (51.0%) | 10 (30.3%) | |
| Nonfunction | 94 (52.8%) | 71 (49.0%) | 23 (69.7%) | |
| Metastasis | <0.001 | |||
| Yes | 30 (16.9%) | 0 (0%) | 3 (9.1%) | |
| No | 148 (83.1%) | 145 (100.0%) | 30 (90.9%) | |
| Ki-67 index | 4.4 ± 6.5 | 3.1 ± 3.6 | 10.2 ± 11.6 | <0.001 |
| Histological grade | <0.001 | |||
| G1 | 98 (55.1%) | 89 (61.45) | 9 (27.3%) | |
| G2 | 68 (38.2%) | 53 (36.6%) | 15 (45.5%) | |
| G3 | 12 (6.7%) | 5 (2.1%) | 9 (27.3%) | |
| AJCC stage | <0.001 | |||
| I | 134 (75.3%) | 132 (91.0%) | 2 (6.1%) | |
| II | 17 (9.6%) | 13 (9.0%) | 4 (12.1%) | |
| III | 6 (3.4) | 0 (0%) | 6 (18.2%) | |
| IV | 21 (11.8%) | 0 (0%) | 21 (63.6%) | |
| FBG (mmol/L) | 4.7 ± 3.8 | 4.1 ± 2.3 | 7.3 ± 6.9 | <0.001 |
| Albumin (g/L) | 39.2 ±4.4 | 39.2 ± 4.5 | 39.4 ± 3.6 | 0.803 |
| ALP (U/L) | 85.7 ± 56.1 | 78.6 ± 42.3 | 117.1 ± 90.0 | <0.001 |
| Lymphocytes | 1.7 ± 0.6 | 1.7 ± 0.6 | 1.6 ± 0.7 | 0.126 |
| Hb | 128.2 ± 16.5 | 128.8 ± 17.0 | 125.7 ± 13.8 | 0.335 |
| Cholesterol (mmol/L) | 4.4 ± 1.0 | 4.4 ± 1.1 | 4.4 ± 0.9 | 0.964 |
| Triglycerides (mmol/L) | 1.4 ± 1.2 | 1.5 ± 1.2 | 1.2 ± 0.7 | 0.315 |
| Characteristics | All (N=30) |
|---|---|
| Onset age (years) | 49.8 ± 11.6 |
| Operative age (years) | 52.7 ± 9.9 |
| Gender | |
| Male | 17 (43.3%) |
| Female | 13 (56.7%) |
| BMI (kg/m2) | 22.0 ± 3.5 |
| Region | |
| Urban | 14 (46.7%) |
| Rural | 16 (53.3%) |
| Smoking | 2 (6.7%) |
| Drinking | 1 (3.3%) |
| Hypertension | 3 (10.0%) |
| Diabetes | 3 (10.0%) |
| Tumor | |
| Diameter (cm) | 3.1 ± 2.4 |
| Number | |
| Single | 28 (93.3%) |
| Multiple | 2 (6.7%) |
| Location | |
| Head-neck | 14 (46.7%) |
| Body-tail | 16 (53.3%) |
| Type | |
| Function | 9 (30.0%) |
| Nonfunction | 21 (70.0%) |
| Ki-67 index | 10.1 ± 11.9 |
| Histological grade | |
| G1 | 8 (26.7%) |
| G2 | 14 (46.7%) |
| G3 | 8 (26.7%) |
| AJCC stage | |
| I | 0 |
| II | 0 |
| III | 6 (20.0%) |
| IV | 21 (70%) |
| FBG (mmol/L) | 6.6 ± 5.4 |
| Albumin (g/L) | 39.4 ± 3.8 |
| ALP (U/L) | 120.0 ± 93.9 |
| Lymphocytes | 1.6 ± 0.7 |
| Hb | 126.1 ± 13.7 |
| Cholesterol (mmol/L) | 4.4 ± 0.9 |
| Triglycerides (mmol/L) | 1.2 ± 0.7 |
| n | Univariate analysis | Multivariate analysis | ||
|---|---|---|---|---|
| HR (95% CI) | P value | HR (95% CI) | P value | |
| Age | 0.88 (0.24, 3.20) | 0.845 | ||
| <56 | ||||
| ≥56* | ||||
| Gender | 0.50 (0.17, 1.44) | 0.199 | ||
| Male | ||||
| Female* | ||||
| Smoking | 0.04 (0.00, 178.2) | 0.448 | ||
| Yes | ||||
| No* | ||||
| Drinking | 0.04 (0.00, 178.2) | 0.448 | ||
| Yes | ||||
| No* | ||||
| Tumor | ||||
| Diameter | 0.48 (0.19, 1.18) | 0.109 | ||
| <2 cm | ||||
| ≥2 cm* | ||||
| Number | 1.56 (0.20, 12.28) | 0.671 | ||
| Location | 1.70 (0.58, 4.97) | 0.337 | ||
| Head-Neck | ||||
| Body-Tail* | ||||
| Grade | 1.30 (0.36, 4.70) | 0.685 | ||
| G1/2 | ||||
| G3* | ||||
| AJCC stage | 32.51 (0.12, 9220) | 0.227 | ||
| I/II | ||||
| III/IV* | ||||
| Triglyceride | ||||
| Cholesterol | ||||
| FBG | 1.06 (0.98, 1.14) | 0.152 | ||
| Hb | 0.99 (0.96, 1.03) | 0.712 | ||
| Lymphocytes | 0.82 (0.37, 1.79) | 0.611 | ||
| Alb | 0.99 (0.86, 1.14) | 0.880 | ||
| APAR | 1.53 (0.48, 4.88) | 0.476 | ||
| <2.2 | ||||
| ≥2.2* | ||||
| FBG/Alb | 3.34 (1.11, 10.06) | 0.032 | 3.34 (1.11, 10.06) | 0.032 |
| <0.17 | ||||
| ≥0.17* | ||||
| FBG/Hb | 2.13 (0.27, 16.59) | 0.470 | ||
| <0.028 | ||||
| ≥0.028* | ||||
| FBG/Lc | 2.02 (0.62, 6.55) | 0.243 | ||
| <2.85 | ||||
| ≥2.85* | ||||
| Characteristics | Univariate analysis | Multivariate analysis | ||
|---|---|---|---|---|
| HR (95% CI) | P value | HR (95% CI) | P value | |
| Age | 2.30 (0.38, 13.86) | 0.365 | ||
| <56 | ||||
| ≥56* | ||||
| Gender | 0.31 (0.05, 1.88) | 0.204 | ||
| Male | ||||
| Female* | ||||
| Smoking | 0.04 (0.00, 20227) | 0.626 | ||
| Yes | ||||
| No* | ||||
| Drinking | 0.04 (0.00, 20227) | 0.626 | ||
| Yes | ||||
| No* | ||||
| Tumor | ||||
| Diameter | 0.84 (0.21, 3.33) | 0.799 | ||
| <2 cm | ||||
| ≥2 cm* | ||||
| Number | 0.05 (0.00, 355142) | 0.738 | ||
| Location | 6.21 (0.67, 57.56) | 0.108 | ||
| Head-Neck | ||||
| Body-Tail* | ||||
| Grade | 1.58 (0.18, 14.25) | 0.685 | ||
| G1/2 | ||||
| G3* | ||||
| AJCC stage | 29.18 (0.00, 41576) | 0.489 | ||
| I/II | ||||
| III/IV* | ||||
| Triglyceride | ||||
| Cholesterol | ||||
| FBG | 1.15 (1.03, 1.28) | 0.012 | ||
| Hb | 1.03 (0.96, 1.10) | 0.448 | ||
| Lymphocytes | 0.88 (0.25, 3.03) | 0.837 | ||
| Alb | 1.10 (0.88, 1.38) | 0.392 | ||
| APAR | 2.38 (0.26, 21.60) | 0.441 | ||
| <2.2 | ||||
| ≥2.2* | ||||
| FBG/Alb | 250.7 (0.01, 59184) | 0.282 | ||
| <0.17 | ||||
| ≥0.17* | ||||
| FBG/Hb | 27 (0.00, 1398079) | 0.552 | ||
| <0.028 | ||||
| ≥0.028* | ||||
| FBG/Lc | 3.32 (0.37, 30.07) | 0.285 | ||
| <2.85 | ||||
| ≥2.85* | ||||
Disclaimer/Publisher’s Note: The statements, opinions and data contained in all publications are solely those of the individual author(s) and contributor(s) and not of MDPI and/or the editor(s). MDPI and/or the editor(s) disclaim responsibility for any injury to people or property resulting from any ideas, methods, instructions or products referred to in the content. |
© 2024 by the authors. Licensee MDPI, Basel, Switzerland. This article is an open access article distributed under the terms and conditions of the Creative Commons Attribution (CC BY) license (http://creativecommons.org/licenses/by/4.0/).


