Submitted:
24 September 2024
Posted:
25 September 2024
Read the latest preprint version here
Abstract
Previous high throughput screening studies indicated trans-eQTLs tend to be tissue specific. In this study, I probed if this feature can be used to identify tissue-specific gene regulatory networks. eQTL data (P<5e-8) for 16,259 genes were identified and their summary association statistics were obtained from the eQTLGen database. Next, eQTLs that display both cis and trans regulatory effects were selected and the association between their corresponding genes were examined by Mendelian randomization. 253 genes that exerted trans-regulatory impacts on 1,439 genes were identified. Majority of the identified gene-pairs aggregated into a gene regulatory network significantly enriched in hemo-immune processes. The robustness of finding was confirmed through simulation. Genes with higher gene expression heritabilities displayed broader regulatory impact in the network. The network displayed the scale-free topology, this provided the reason to examine the association of the network’s hub genes with the phenome. The outcome of analyses revealed GSDMB and ORMDL3 impact several disorders of immune origin and higher expression of HHEX is associated with lower triglycerides and risk of type 2 diabetes. This study reports trans-eQTLs can be used to identify tissue-specific gene regulatory networks and describes a workflow to achieve this purpose. The identified network displayed scale-free topology indicating the hub genes of a tissue-specific network could be targeted to prevent disease outcomes.
Keywords:
trans-eQTLs
; tissue specificity
; gene regulatory network
; scale-free network
; Mendelian randomization
Introduction
The combination of active genes and the interactions between them within a cell generates a gene regulatory network (GRN) that enables a cell to specialize in fulfilling its function. Therefore, an improved understanding of GRNs paves the way to use such information not only as a means to understand the principles of gene regulation but also as a tool to drive cell fate for purposes such as cellular engineering, or to prevent disease outcome [1]. There are several approaches to infer GRNs from omics data [1,2,3]. These approaches rely on a combination of biological and statistical information to identify pairs of related genes for the construction of GRNs. Approaches such as co-expression network analysis aim to build a network by identifying genes whose expression profiles are correlated. While these approaches systematically examine the genome and as such are hypothesize-free, the retrieved network is undirected due to the symmetrical nature of correlations. Other methods try to resolve this issue by including biological information. Notably, they use data from CHIP-seq and cis-regulatory elements to identify transcription factors that bind to target genes and as such turn the undirected network into a network that its edges indicate causality. The gene regulatory network obtained from such approaches does not cover the interactions among gene products, (e.g., functional interaction at the level of pathways). Furthermore, they assign transcription factors to their target genes based on genomic proximity which could introduce bias in the presence of distal regulatory effects [1,2,3]. Another factor that limits the practicability of current approaches is that they require access to individual level data which is not always feasible for reasons such as participants privacy or logistical considerations. In this study, I describe a method based on eQTLs that can address the aforementioned issues.
An eQTL or an expression quantitative trait locus is a site on DNA that variation in its sequence impacts the expression of a gene. If an eQTL is located near the gene it acts upon, it is referred to as a cis-eQTL; however, if it is located distant from its gene of origin, sometimes on a different chromosome, it is referred to as a trans-eQTL. Over the past decades, high throughput studies have been developed to map the eQTLs. Results from these studies which basically summarize the magnitudes and the natures of associations between genomic variants (eQTLs) and genes then are considered collectively to investigate the genetics of transcriptome. An insight from these studies is the evidence that trans-eQTLs tend to be tissue specific [4,5,6]. A new development in this field is the advent of statistical methods that can leverage publicly available GWAS summary statistics including eQTLs to investigate the nature of relation between two biological entities (e.g., two genes) [7,8]. A prominent method in this regard is Mendelian randomization (MR) that can not only test the association between two genes, but also differentiate between causation and correlation [9,10]; moreover, because MR uses a set of independent SNPs for association testing, the results are immune to the bias that may be introduced by the environmental (non-genetic) factors. Building upon these notions, in this study, I devised a workflow that can complement the previous approaches for constructing tissue-specific GRNs.
Methods
Data Sources
Previously, the eQTLGen consortium [11] has investigated the genetic architecture of blood gene expression. The data in the eQTLGen Consortium consist of 31,684 blood and PBMC samples (19.6% of samples) obtained mainly from studies conducted in European populations. Gene expression profiling of samples were carried out using expression arrays and RNA-seq (20.3% of samples). By conducting a meta-analysis, the authors combined the eQTL summary association statistics from 37 studies [11]. The outcome of the meta-analysis revealed cis-eQTLs for 16,987 genes; furthermore, by selecting 10,317 trait-associated variants, the authors identified trans-eQTL for 6,298 genes. Given that 95% of samples in the eQTLGen database are obtained from subjects of European origin. I used the genotype data from the 1000 Genomes-European population to compute the degree of linkage diseqlubrium (LD) among SNPs. Similarly, to examine the association between gene expression data and phenome, GWAS summary statistics for traits was obtained from studies conducting using samples from the European population.
Mendelian Randomization
I used the procedure outlined in Figure 1 to identify gene(s) through which a trans-eQTL exerts its impact. Initially, trans-eQTLs that mapped to the HLA region (coordinates: chr6:28,477,797-33,448,354, based on GRCh37) were removed. This is due to the complex linkage disequilibrium structure of the HLA region and the bias it may introduce in the results. Then trans-eQTLs and cis-eQTLs were matched to find eQTLs that show both cis and trans regulatory effects. Through this procedure, I identified 55,582 gene pairs that shared at least an eQTL (P<5e-8). Next, I used Mendelian randomization to investigate if change in the expression of the source gene (gene that was linked to the cis-effect of an eQTL) impacts the expression of the target gene (gene that was linked to the trans-effect of the eQTL). Mendelian randomization is a statistical test that can investigate the nature of relation between two biological entities by comparing their magnitudes of association to several genetic markers. The test uses a set of independent (in linkage equilibrium) SNPs that are associated with the predictor (e.g., the expression of the source gene) to investigate the impact of change in the level of the predictor on the outcome. For the purpose of this study, I used the GSMR algorithm to conduct the MR analysis [12]. By comparing the files containing eQTL summary statistics for the source gene and the target gene, the algorithm finds a set of shared SNPs that are in linkage equilibrium (r2<0.05) and significantly associated (P<5e-8) with the expression of the source gene to conclude whether change in the expression of the source gene impacts the expression of the target gene. Of note, given that a significant association between the two genes could indicate correlation. Namely, the situation that the expressions of both genes are controlled by a transcription factor. SNPs with pleiotropic effect (i.e., source gene ← SNP → target gene) were identified and removed from the analysis using the pleiotropy test implemented in the GSMR algorithm. The test which is known as heterogeneity in dependent instruments (HEIDI) can identify a pleiotropic eQTL by comparing the association of its adjacent SNPs with expression of both genes. In this context, if a heterogeneity is not observed in the pattern of associations, it indicates a pleiotropic effect. As compared to other methods, GSMR algorithm accounts for the sampling variance in β (beta) estimates and the linkage disequilibrium (LD) among SNPs, as such it provides more statistical power. GSMR also incorporates a variety of quality assurance and helpful functions, notably aligning both GWAS summary datasets to the same reference allele at each SNP and a clumping function to only keep non-correlated (r2<0.05) significant SNPs (with association P-value < 5e-8) in the instrument.
Following MR analysis, gene pairs (N=2,350) that showed significant evidence of association (P<5e-8) were selected and plotted using the Cytoscape software (version 3.10.1 ) [13] in order to find if they form a network. DAVID functional tool (version 2023q4) [14] was used to identify biological processes that are overrepresented among the identified genes.
Conditional Analysis
To investigate if the association between a gene and a trait is mediated through a blood trait conditional analysis was conducted. For this purpose, I adjusted the entire GWAS summary statistics of the trait for the covariate of interest using the mtCOJO algorithm [10]. Next, the association between the gene expression and the trait was re-calculated and compared with the results from the initial model (unadjusted for the covariate). mtCOJO uses a number of parameters, including genetic correlation, heritability and causal effect, to produce the adjusted data. It requires only GWAS summary statistics and is known to be free of bias due to shared environmental or genetic effects [10].
eQTL Pruning
To understand the properties of eQTLs underlying a gene for downstream analyses. I generated a list of independent (r2<0.05) eQTLs per gene using the clump algorithm implemented in PLINK (v.1.9) [15]. In summary, the algorithm takes a list of eQTLs and their P-values, conducts LD pruning, and returns a list of eQTLs in linkage equilibrium and prioritized by P-values.
Following the LD pruning, the phenotypic variance (, proportion of variation in a gene expression) attributed to an eQTL was calculated, as previously described[16] using the equation:
where is the frequency of effect allele and is its regression coefficient derived from the association model. eQTLGen consortium reported Z-scores instead of regression coefficients. As such, a conversion was made using the equation (Zhu et al., 2016):
Results
The Identified Gene Pairs
I used the analytical pipeline described in Figure 1 to identify gene pairs that share interaction. Initially, I searched for eQTLs (P<5e-8) that display both trans and cis effects. Next, Mendelian randomization was used to examine if change in the expression of the source gene impacts the expression of the target gene. Through, this procedure I identified 253 source genes that exerted trans-regulatory effect on 1,439 genes (a total of 2,350 gene-pairs, Table S1). Nex, I used Cystoscape to plot the identified gene-pairs and visualize the possible connections between them. I found the majority of gene-pairs (N=2,241) aggregated into one network. The identified network displayed a scale-free topology (Figure 2). Distribution of the nodes by the frequency of their edges also indicated a power law distribution (Figure S1). While 77% of the nodes had in average 1.3 edges, a group of 8 nodes (CREB5, NFE2, SCGB1C1, GSDMB, ORMDL3, SMOX, ITGA4, HHEX) accounted for 20% of interactions.
The network genes were then subjected to gene-set enrichment analysis to investigate the function of the network. The outcome of gene ontology (GO) enrichment analysis highlighted overrepresentation of hemo-immune processes among genes of the network (Table 1). To examine the validity of the results, a simulation step was undertaken by extracting 1000 random gene-sets from the eQTLGen database that had similar size to the network (N=1,460 genes). Next in each gene-set, gene ontology (GO) enrichment analysis was performed using gprofiler2[17] that allows systematic search for enriched GO biological processes through its R package (version 0.2.2). The outcome of the analyses was mainly null and revealed a few unrelated biological processes (Table S2).
In a scale-free network, targeting the hub nodes (nodes with highest number of connections) are key in regulating the function of the network. As such, I investigated the association of the identified hub genes with the phenome by conducting MR analysis. Majority of observed associations were with blood traits (Table S3); moreover, I noted associations between several disorders with genes on chromosome band 17q21, ORMDL3, and GSDMB. Both genes appeared to be co-expressed as their underpinning eQTLs display correlated effect sizes (Figure S2). Mendelian randomization indicated higher expression of these genes contribute to higher risks of allergic disease [18], asthma [19], atrial fibrillation [20] and higher levels of Alkaline phosphatase [21]; furthermore, a negative association was also observed between expression of these genes and risk of primary biliary cholangitis [22], inflammatory bowel disease [23], rheumatoid arthritis [24] and HDL levels [25] (Table 2). As presented in Table S3, ORMDL3, and GSDMB were also associated with several blood traits. As such, conditional analysis was performed to investigate if the impact of ORMDL3, and GSDMB on its related disorders are mediated through blood traits. As detailed in Table S4, the outcome of analyses were mainly insignificant indicating the path through which ORMDL3, and GSDMB impact the disorders is independent of the blood traits.
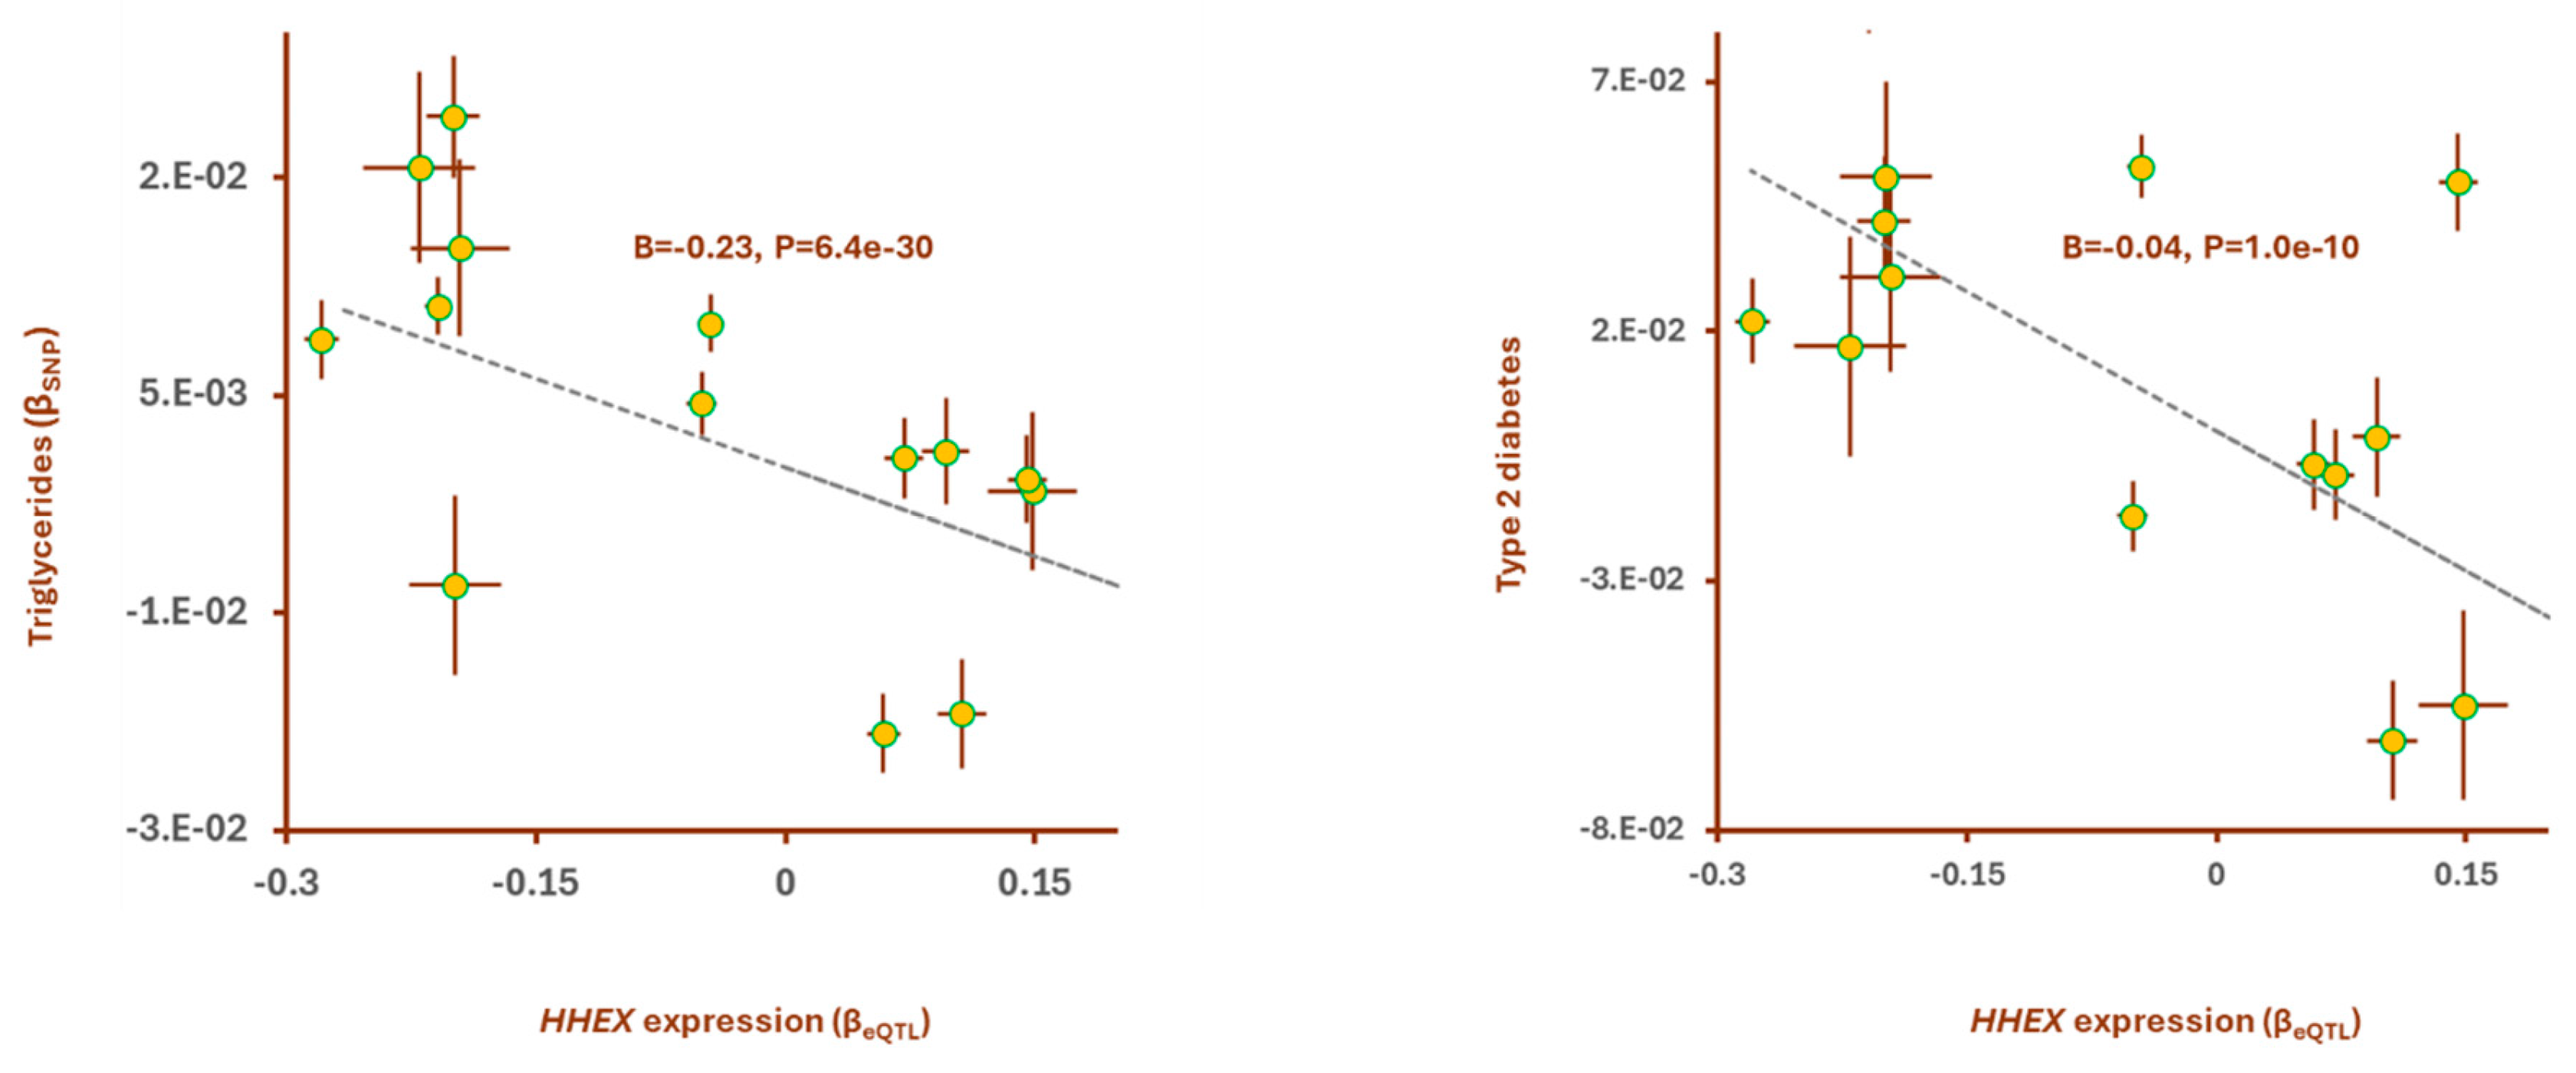
HHEX gene also showed significant association with metabolic traits, type 2 diabetes (T2D) [26] and triglycerides [25]. The outcome of Mendelian randomization revealed higher expression of HHEX contributes to lower TG levels and risk of T2D. (Figure 3 and Table S3). Conditional analysis indicated the impact of HHEX on these traits is independent of blood traits; however, the impact of HHEX on triglycerides is in part mediated through T2D (Table S4).
Figure 2.
Overview of the gene network identified in this study. Mendelian randomization revealed 2,350 gene-pairs. Majority of these gene pairs (N= 2,241) aggregated into one network. The identified network displayed a scale-free topology (Figure 2). An edge with an arrow end indicates as the expression of the source gene increases, the expression of the target gene increases as well; whereas, an edge with a T end indicates an inverse association. Summary association statistics detailing the nature of association between gene pairs are provided in Table S1.
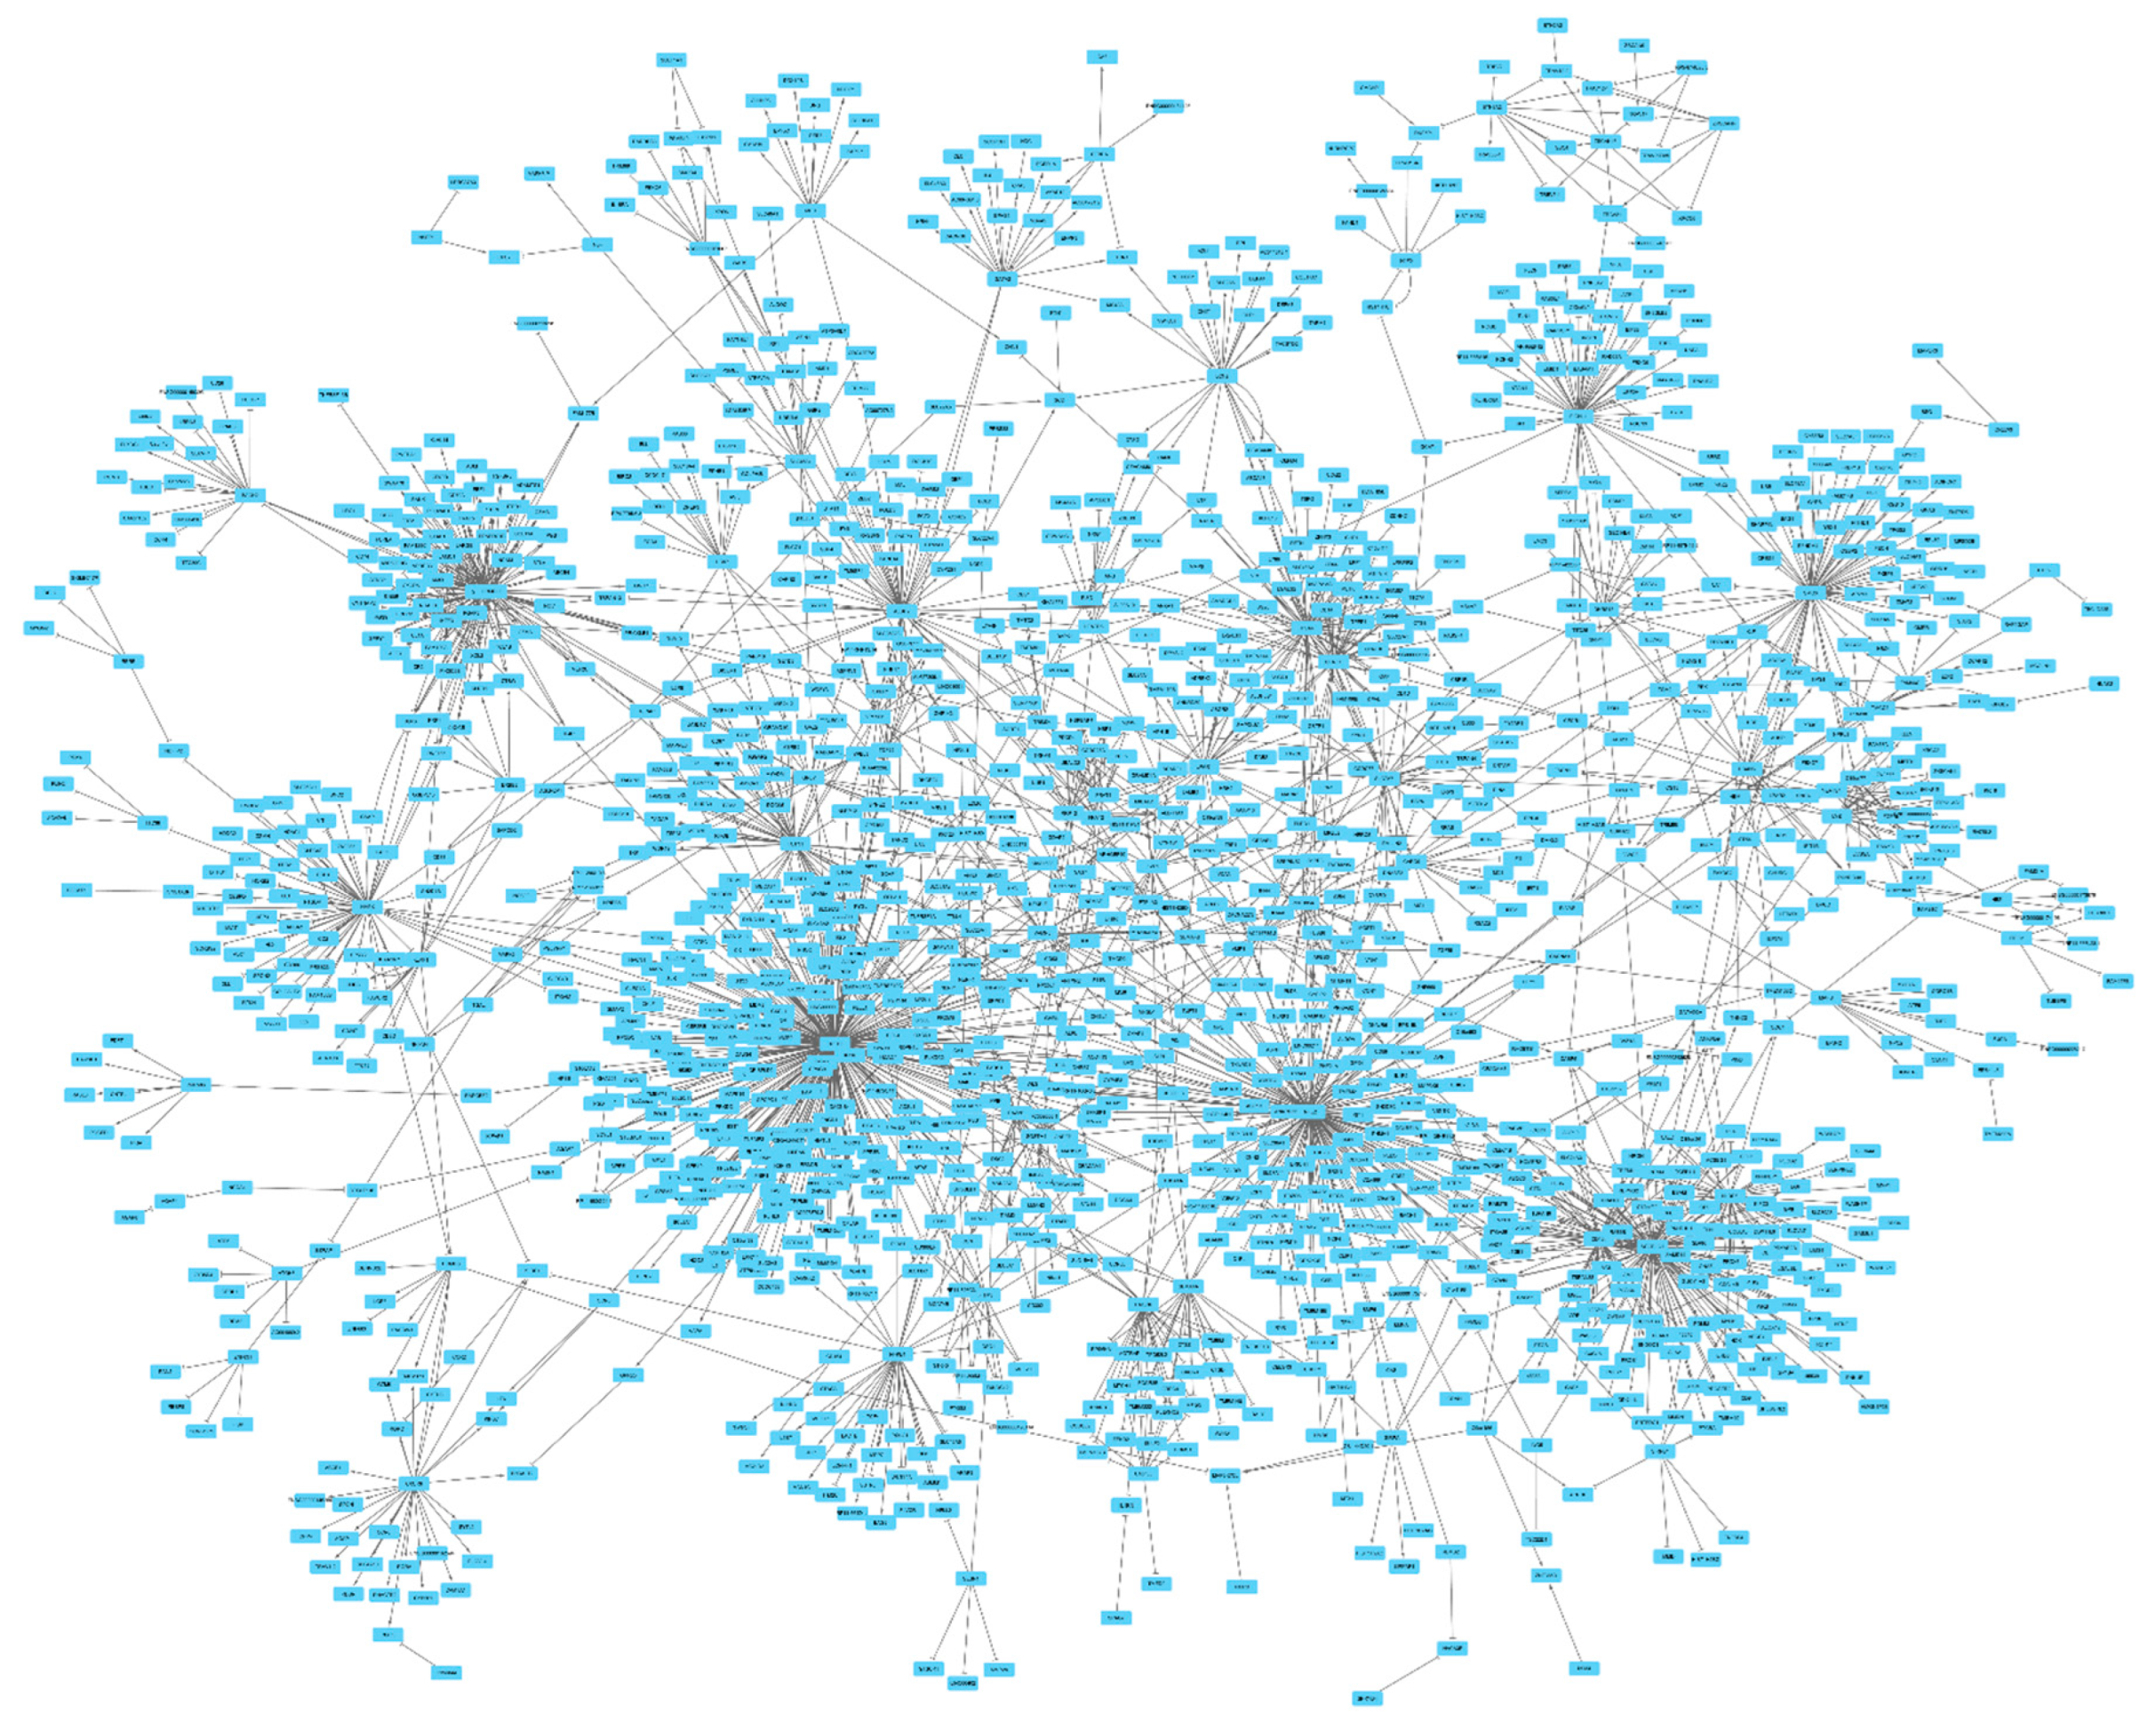
Figure 3.
Higher expression of HHEX contributes to lower level of Triglycerides and lower risk of type 2 diabetes. Mendelian randomization detected a consistent association between eQTLs of the hub gene, HHEX and their corresponding impact on triglycerides level and the risk of T2D. Points on the plots represent SNPs; the x-value of a SNP is its effect size (β) on the predictor, and the horizontal error bar indicates standard error. Similarly, the y-value of the SNP indicates its effect size on the outcome, and the vertical error bar indicates the standard error. The dashed line represents the line of best fit (a line with the intercept of 0 and the slope of β from the MR test).
Properties of eQTLs Underpinning the Genes of the Network
To investigate the characteristics of eQTLs underlying the network for subsequent applications. A pruning step was carried out using the clump algorithm implemented in PLINK (version 1.90b6.18) [15] in order to identify independent eQTLs underpinning the genes of the network. In summary, the algorithm takes a list of eQTLs (P<5e-8), conducts pruning based on linkage disequilibrium, and returns a list of eQTLs that are in linkage equilibrium (r2<0.05) and prioritized by P-values. Following the clumping analysis, I noted that on average a gene in the network is under the regulatory impact of 18 independent cis-eQTLs (Median=12, IQR=20). A cis-eQTL on average explained 0.8% (SE=0.001, N=24666) of variation in expression of a gene which was higher (P<0.001) than the computed value for a trans-eQTL (Mean=0.4%, SE=0.001, N=6175). Altogether, these findings indicated Mendelian randomization is well-suited to identify functional interactions and consequently tissue-specific regulatory networks from eQTL data; however, given the percentage of the phenotypic variation explained by a trans-eQTLs (Vp=0.04%) and assuming 80% of power, eQTL data should obtain from studies with a minimum sample size of about 10,000 subjects inorder to identify a significant trans- eQTL (P=5e-8).
I found genes in the network that tend to act as source genes have higher gene expression heritability values as compared to those acting as target genes (P=3e-6). For example, while on average a non-hub gene displayed a heritability of 0.17 (SE=0.006, N=1452). A hub genes had a heritability of 0.46 (SE=0.16, N=8). If the correlation between higher gene expression heritability and higher regulatory effect holds true in other studies, then gene expression heritability can be used as a metric to prioritize genes and identify key genes in a tissue-specific GRN.
Discussion
Gene regulatory network (GRN) enables a cell to specialize in carrying out its function. There are various cell types in the body and identification of their GRNs are important for various biological purposes including to better diagnose and treat diseases. There are currently several approaches that can investigate such networks by analyzing the raw data available at individual levels. This hinders the possibility of collaboration among researchers in order to combine their data and to map gene-regulatory networks with higher statistical power. Furthermore, as indicated in the introduction, the existing methods make a number of assumptions for generating GRNs; however, such assumptions could introduce bias in presence of alternative scenarios. The method proposed in this study provides several benefits. First, it can scan the genome systematically (hypothesis-free) and identify genes whose transcripts are related. Second, it uses SNPs (eQTLs) to test the association between two gene transcripts as such, it is undisturbed by the impact of confounding environmental factors, because the distribution of alleles at conception is a random process (Mendel’s law of segregation). Third, it can differentiate between causation and correlation because it relies on non-pleiotripic, independent SNPs to investigate the nature of association between two transcripts. Finally, it relies on summary association statistics that are publicly available as such, it provides a convenient path for researchers who wish to share their data or combine findings from several studies to identify GRNs with higher statistical power and without privacy concerns.
By applying the devised workflow to eQTL data for blood, I detected gene-pairs that aggregated into a gene-regulatory network. Examining the function of the network revealed it is associated with hemo-immune processes which is expected considering the examined eQTL data are from blood. The topology of the network resembled the properties of a scale free network [27]. A core of 8 genes accounted for 20% of the interactions and the distribution of interactions per gene followed a power law distribution (Figure S1). If this happens to be the case in other cell types then this provides a convenient path for therapeutic interventions, because a scale free network is manageable by targeting its hub genes.
In this study, I noted that a gene in the network is under the regulatory impact of about 18 eQTLs as such, mendelian randomization is a well-suited tool tend to detect functional interactions, however, to fairly examine the association between two genes, access to full GWAS summary statistics data is required. This is important considering that two genes could be on different chromosomes and under the influence of different trans-regulatory elements. Access to full GWAS summary statistics is also important to compute gene expression heritability estimates. In this study, I noted a positive correlation between higher values of gene expression heritability and likelihood of a gene exerting regulatory impact on the network. If this is proven to be true in other studies, such as twin or population studies that have access to genotype data. Then gene expression heritability can be used to identify genes in a tissue that have high regulatory impact.
By examining the association of the network’s hub genes with the phenome. I found GSDMB and ORMDL3 impact several diseases of immune origin. Higher expression of these genes contributed to higher risks of allergic disease, asthma, atrial fibrillation but lower risks of primary biliary cholangitis, inflammatory bowel disease, rheumatoid arthritis and lower levels of HDL. This finding indicates therapeutic approaches that aim to change the expression of these genes, should find an optimal threshold that balances the antagonistic peliotropic effect of these genes. Otherwise, side effects are expected.
ORMDL3 is localized to the endoplasmic reticulum and regulates downstream pathways including sphingolipids, metalloproteases, airway remodeling, and chemokines. GSDMB encodes gasdermin B, a member of gasdermin domain containing proteins which are involved in different processes associated with cellular state, such as cell cycle control, differentiation, and apoptosis [28] . The analyses revealed higher expression of these genes have concordant effects on several disorders of immune origin. Therefore, they may act through the same molecular pathway to impact diseases of immune origin. In this regard, inflammation is notable because ORMDL3 is involved in the development of the unfolded protein response, which triggers an inflammatory response including the formation of gasdermin pores on cellular wall and pyroptosis.
I also found an association between higher expression of HHEX gene, with lower level of triglycerides and lower risk of T2D diabetes. Previous studies have documented the role of HHEX gene in metabolism. HHEX encodes a transcription factor that is required for the normal development of organs such as pancreas, gall bladder, bile duct and liver. Within adult endocrine pancreas, HHEX is selectively expressed in somatostatin-secreting delta cells, which are important for maintaining islet function [29]. HHEX was initially discovered for its role in hematopoiesis; however, I found adjusting for the impact of blood traits, does not change the observed association with triglycerides level and the risk of type 2 diabetes indicating the association of this gene with metabolic traits is independent of its function in hematopoiesis.
This study is not without limitation, although eQTLGen [11], consortium has a descent sample size and as such well-powered for detecting trans-eQTLs; however, the authors provided summary association statistics for only 10,317 trans-eQTLs that previously showed association with the phenome. Of note, this could introduce a selection bias if trans-eQTLs are selected with regard to a specific category of traits; however, this was not the case in the eQTLGen study [11], namely, the selection of SNPs for trans-eQTL mapping was not with regard to a specific category of traits (Table S5).
In summary, this study describes a workflow to identify tissue-specific gene-regulatory networks. It indicates eQTLs can provide insight into cellular processes, if such data become available for various cell types through statistically well-powered studies. The identified network showed scale-free topology, if further researches substantiate this finding, then in each network, targeting the hub genes could provide a solution to treat disease outcomes.
Supplementary Materials
The following supporting information can be downloaded at the website of this paper posted on Preprints.org.
Funding
This research received no external funding.
Institutional Review Board Statement
Not applicable
Informed Consent Statement
Not applicable
Data Availability Statement
eQTL summary association statistics were obtained from the eQTLGen consortium (https://www.eqtlgen.org/phase1.html). 1000 Genomes genotype data (phase 3) was obtained from https://www.cog-genomics.org/plink/2.0/resources#phase3_1kg.
Acknowledgments
This research work was enabled in part by computational resources and support provided by the Compute Ontario and the Digital Research Alliance of Canada.
Competing interests
The author declares no competing interests.
References
- Badia-i-Mompel, P.; Wessels, L.; Müller-Dott, S.; Trimbour, R.; Ramirez Flores, R.O.; Argelaguet, R.; Saez-Rodriguez, J. Gene regulatory network inference in the era of single-cell multi-omics. Nat. Rev. Genet. 2023, 1–16. [Google Scholar] [CrossRef] [PubMed]
- McCalla, S.G.; Fotuhi Siahpirani, A.; Li, J.; Pyne, S.; Stone, M.; Periyasamy, V.; Shin, J.; Roy, S. Identifying strengths and weaknesses of methods for computational network inference from single-cell RNA-seq data. G3 GenesGenomesGenetics 2023, 13. [Google Scholar] [CrossRef]
- Mercatelli, D.; Scalambra, L.; Triboli, L.; Ray, F.; Giorgi, F.M. Gene regulatory network inference resources: A practical overview. Biochim. Biophys. Acta BBA - Gene Regul. Mech. 2020, 1863, 194430. [Google Scholar] [CrossRef]
- Consortium, Gte. The GTEx Consortium atlas of genetic regulatory effects across human tissues. Science 2020, 369, 1318–1330. [Google Scholar] [CrossRef]
- Price, A.L.; Helgason, A.; Thorleifsson, G.; McCarroll, S.A.; Kong, A.; Stefansson, K. Single-tissue and cross-tissue heritability of gene expression via identity-by-descent in related or unrelated individuals. PLoS Genet. 2011, 7, e1001317. [Google Scholar] [CrossRef] [PubMed]
- Nica, A.C.; Dermitzakis, E.T. Expression quantitative trait loci: present and future. Philos. Trans. R. Soc. B Biol. Sci. 2013, 368, 20120362. [Google Scholar] [CrossRef]
- Pasaniuc, B.; Price, A.L. Dissecting the genetics of complex traits using summary association statistics. Nat. Rev. Genet. 2017, 18, 117–127. [Google Scholar] [CrossRef] [PubMed]
- Zhu, Z.; Zhang, F.; Hu, H.; Bakshi, A.; Robinson, M.R.; Powell, J.E.; Montgomery, G.W.; Goddard, M.E.; Wray, N.R.; Visscher, P.M.; et al. Integration of summary data from GWAS and eQTL studies predicts complex trait gene targets. Nat Genet 2016, 48, 481–487. [Google Scholar] [CrossRef]
- Davey Smith, G.; Hemani, G. Mendelian randomization: genetic anchors for causal inference in epidemiological studies. Hum. Mol. Genet. 2014, 23, R89–R98. [Google Scholar] [CrossRef]
- Zhu, Z.; Zheng, Z.; Zhang, F.; Wu, Y.; Trzaskowski, M.; Maier, R.; Robinson, M.R.; McGrath, J.J.; Visscher, P.M.; Wray, N.R.; et al. Causal associations between risk factors and common diseases inferred from GWAS summary data. Nat. Commun. 2018, 9, 224. [Google Scholar] [CrossRef]
- Võsa, U.; Claringbould, A.; Westra, H.-J.; Bonder, M.J.; Deelen, P.; Zeng, B.; Kirsten, H.; Saha, A.; Kreuzhuber, R.; Kasela, S.; et al. Unraveling the polygenic architecture of complex traits using blood eQTL metaanalysis. bioRxiv 2018, 447367. [Google Scholar] [CrossRef]
- Baccarelli, A.; Bollati, V. Epigenetics and environmental chemicals. Curr Opin Pediatr 2009, 21, 243–251. [Google Scholar] [CrossRef] [PubMed]
- Shannon, P.; Markiel, A.; Ozier, O.; Baliga, N.S.; Wang, J.T.; Ramage, D.; Amin, N.; Schwikowski, B.; Ideker, T. Cytoscape: a software environment for integrated models of biomolecular interaction networks. Genome Res. 2003, 13, 2498–2504. [Google Scholar] [CrossRef] [PubMed]
- Huang, D.W.; Sherman, B.T.; Lempicki, R.A. Systematic and integrative analysis of large gene lists using DAVID bioinformatics resources. Nat. Protoc. 2009, 4, 44–57. [Google Scholar] [CrossRef]
- Chang, C.C.; Chow, C.C.; Tellier, L.C.; Vattikuti, S.; Purcell, S.M.; Lee, J.J. Second-generation PLINK: rising to the challenge of larger and richer datasets. GigaScience 2015, 4. [Google Scholar] [CrossRef]
- Park, J.-H.; Wacholder, S.; Gail, M.H.; Peters, U.; Jacobs, K.B.; Chanock, S.J.; Chatterjee, N. Estimation of effect size distribution from genome-wide association studies and implications for future discoveries. Nat Genet 2010, 42, 570–575. [Google Scholar] [CrossRef]
- Kolberg, L.; Raudvere, U.; Kuzmin, I.; Adler, P.; Vilo, J.; Peterson, H. g:Profiler—interoperable web service for functional enrichment analysis and gene identifier mapping (2023 update). Nucleic Acids Res. 2023, 51, W207–W212. [Google Scholar] [CrossRef] [PubMed]
- Ferreira, M.A.; Vonk, J.M.; Baurecht, H.; Marenholz, I.; Tian, C.; Hoffman, J.D.; Helmer, Q.; Tillander, A.; Ullemar, V.; van Dongen, J.; et al. Shared genetic origin of asthma, hay fever and eczema elucidates allergic disease biology. Nat. Genet. 2017, 49, 1752–1757. [Google Scholar] [CrossRef] [PubMed]
- Han, Y.; Jia, Q.; Jahani, P.S.; Hurrell, B.P.; Pan, C.; Huang, P.; Gukasyan, J.; Woodward, N.C.; Eskin, E.; Gilliland, F.D.; et al. Genome-wide analysis highlights contribution of immune system pathways to the genetic architecture of asthma. Nat. Commun. 2020, 11, 1776. [Google Scholar] [CrossRef]
- Miyazawa, K.; Ito, K.; Ito, M.; Zou, Z.; Kubota, M.; Nomura, S.; Matsunaga, H.; Koyama, S.; Ieki, H.; Akiyama, M.; et al. Cross-ancestry genome-wide analysis of atrial fibrillation unveils disease biology and enables cardioembolic risk prediction. Nat. Genet. 2023, 55, 187–197. [Google Scholar] [CrossRef]
- Pazoki, R.; Vujkovic, M.; Elliott, J.; Evangelou, E.; Gill, D.; Ghanbari, M.; van der Most, P.J.; Pinto, R.C.; Wielscher, M.; Farlik, M.; et al. Genetic analysis in European ancestry individuals identifies 517 loci associated with liver enzymes. Nat. Commun. 2021, 12, 2579. [Google Scholar] [CrossRef]
- Liu, J.Z.; Almarri, M.A.; Gaffney, D.J.; Mells, G.F.; Jostins, L.; Cordell, H.J.; Ducker, S.J.; Day, D.B.; Heneghan, M.A.; Neuberger, J.M.; et al. Dense fine-mapping study identifies new susceptibility loci for primary biliary cirrhosis. Nat. Genet. 2012, 44, 1137–1141. [Google Scholar] [CrossRef]
- Liu, J.Z.; van Sommeren, S.; Huang, H.; Ng, S.C.; Alberts, R.; Takahashi, A.; Ripke, S.; Lee, J.C.; Jostins, L.; Shah, T.; et al. Association analyses identify 38 susceptibility loci for inflammatory bowel disease and highlight shared genetic risk across populations. Nat. Genet. 2015, 47, 979–986. [Google Scholar] [CrossRef]
- Okada, Y.; Wu, D.; Trynka, G.; Raj, T.; Terao, C.; Ikari, K.; Kochi, Y.; Ohmura, K.; Suzuki, A.; Yoshida, S.; et al. Genetics of rheumatoid arthritis contributes to biology and drug discovery. Nature 2014, 506, 376–381. [Google Scholar] [CrossRef]
- Richardson, T.G.; Sanderson, E.; Palmer, T.M.; Ala-Korpela, M.; Ference, B.A.; Davey Smith, G.; Holmes, M.V. Evaluating the relationship between circulating lipoprotein lipids and apolipoproteins with risk of coronary heart disease: A multivariable Mendelian randomisation analysis. PLoS Med. 2020, 17, e1003062. [Google Scholar] [CrossRef]
- Mahajan, A.; Taliun, D.; Thurner, M.; Robertson, N.R.; Torres, J.M.; Rayner, N.W.; Payne, A.J.; Steinthorsdottir, V.; Scott, R.A.; Grarup, N.; et al. Fine-mapping type 2 diabetes loci to single-variant resolution using high-density imputation and islet-specific epigenome maps. Nat Genet 2018, 50, 1505–1513. [Google Scholar] [CrossRef]
- Barabási, A.-L.; Albert, R. Emergence of scaling in random networks. Science 1999, 286, 509–512. [Google Scholar] [CrossRef]
- Das, S.; Miller, M.; Broide, D.H. Chapter One - Chromosome 17q21 Genes ORMDL3 and GSDMB in Asthma and Immune Diseases. In Advances in Immunology, Alt, F.W. ed; Academic Press; Vol. 135, 2017; pp. 1–52. ISBN 0065-2776. [Google Scholar]
- Jackson, J.T.; Nutt, S.L.; McCormack, M.P. The Haematopoietically-expressed homeobox transcription factor: roles in development, physiology and disease. Front. Immunol. 2023, 14. [Google Scholar] [CrossRef]
Figure 1.
eQTL-based analytical pipeline that was used to identify and characterize gene-regulatory networks in blood. Initially, eQTLs that mapped to the HLA region were excluded due to the complex LD structure of this region and a possible impact it may have on the results. Then, eQTLs (P<5e-8) that display both trans and cis effects were selected. Next, Mendelian randomization was used to examine if change in the expression of the source gene (associated with the cis effect) impacts (P<5e-8) the expression of the target gene (associated with the trans effect). The gene pairs obtained from this step, then were plotted to view the nature of relation between them. Functional analysis was performed on the generated network to identify significantly enriched biological processes. The properties of eQTLs underlying the network were investigated for molecular insight.
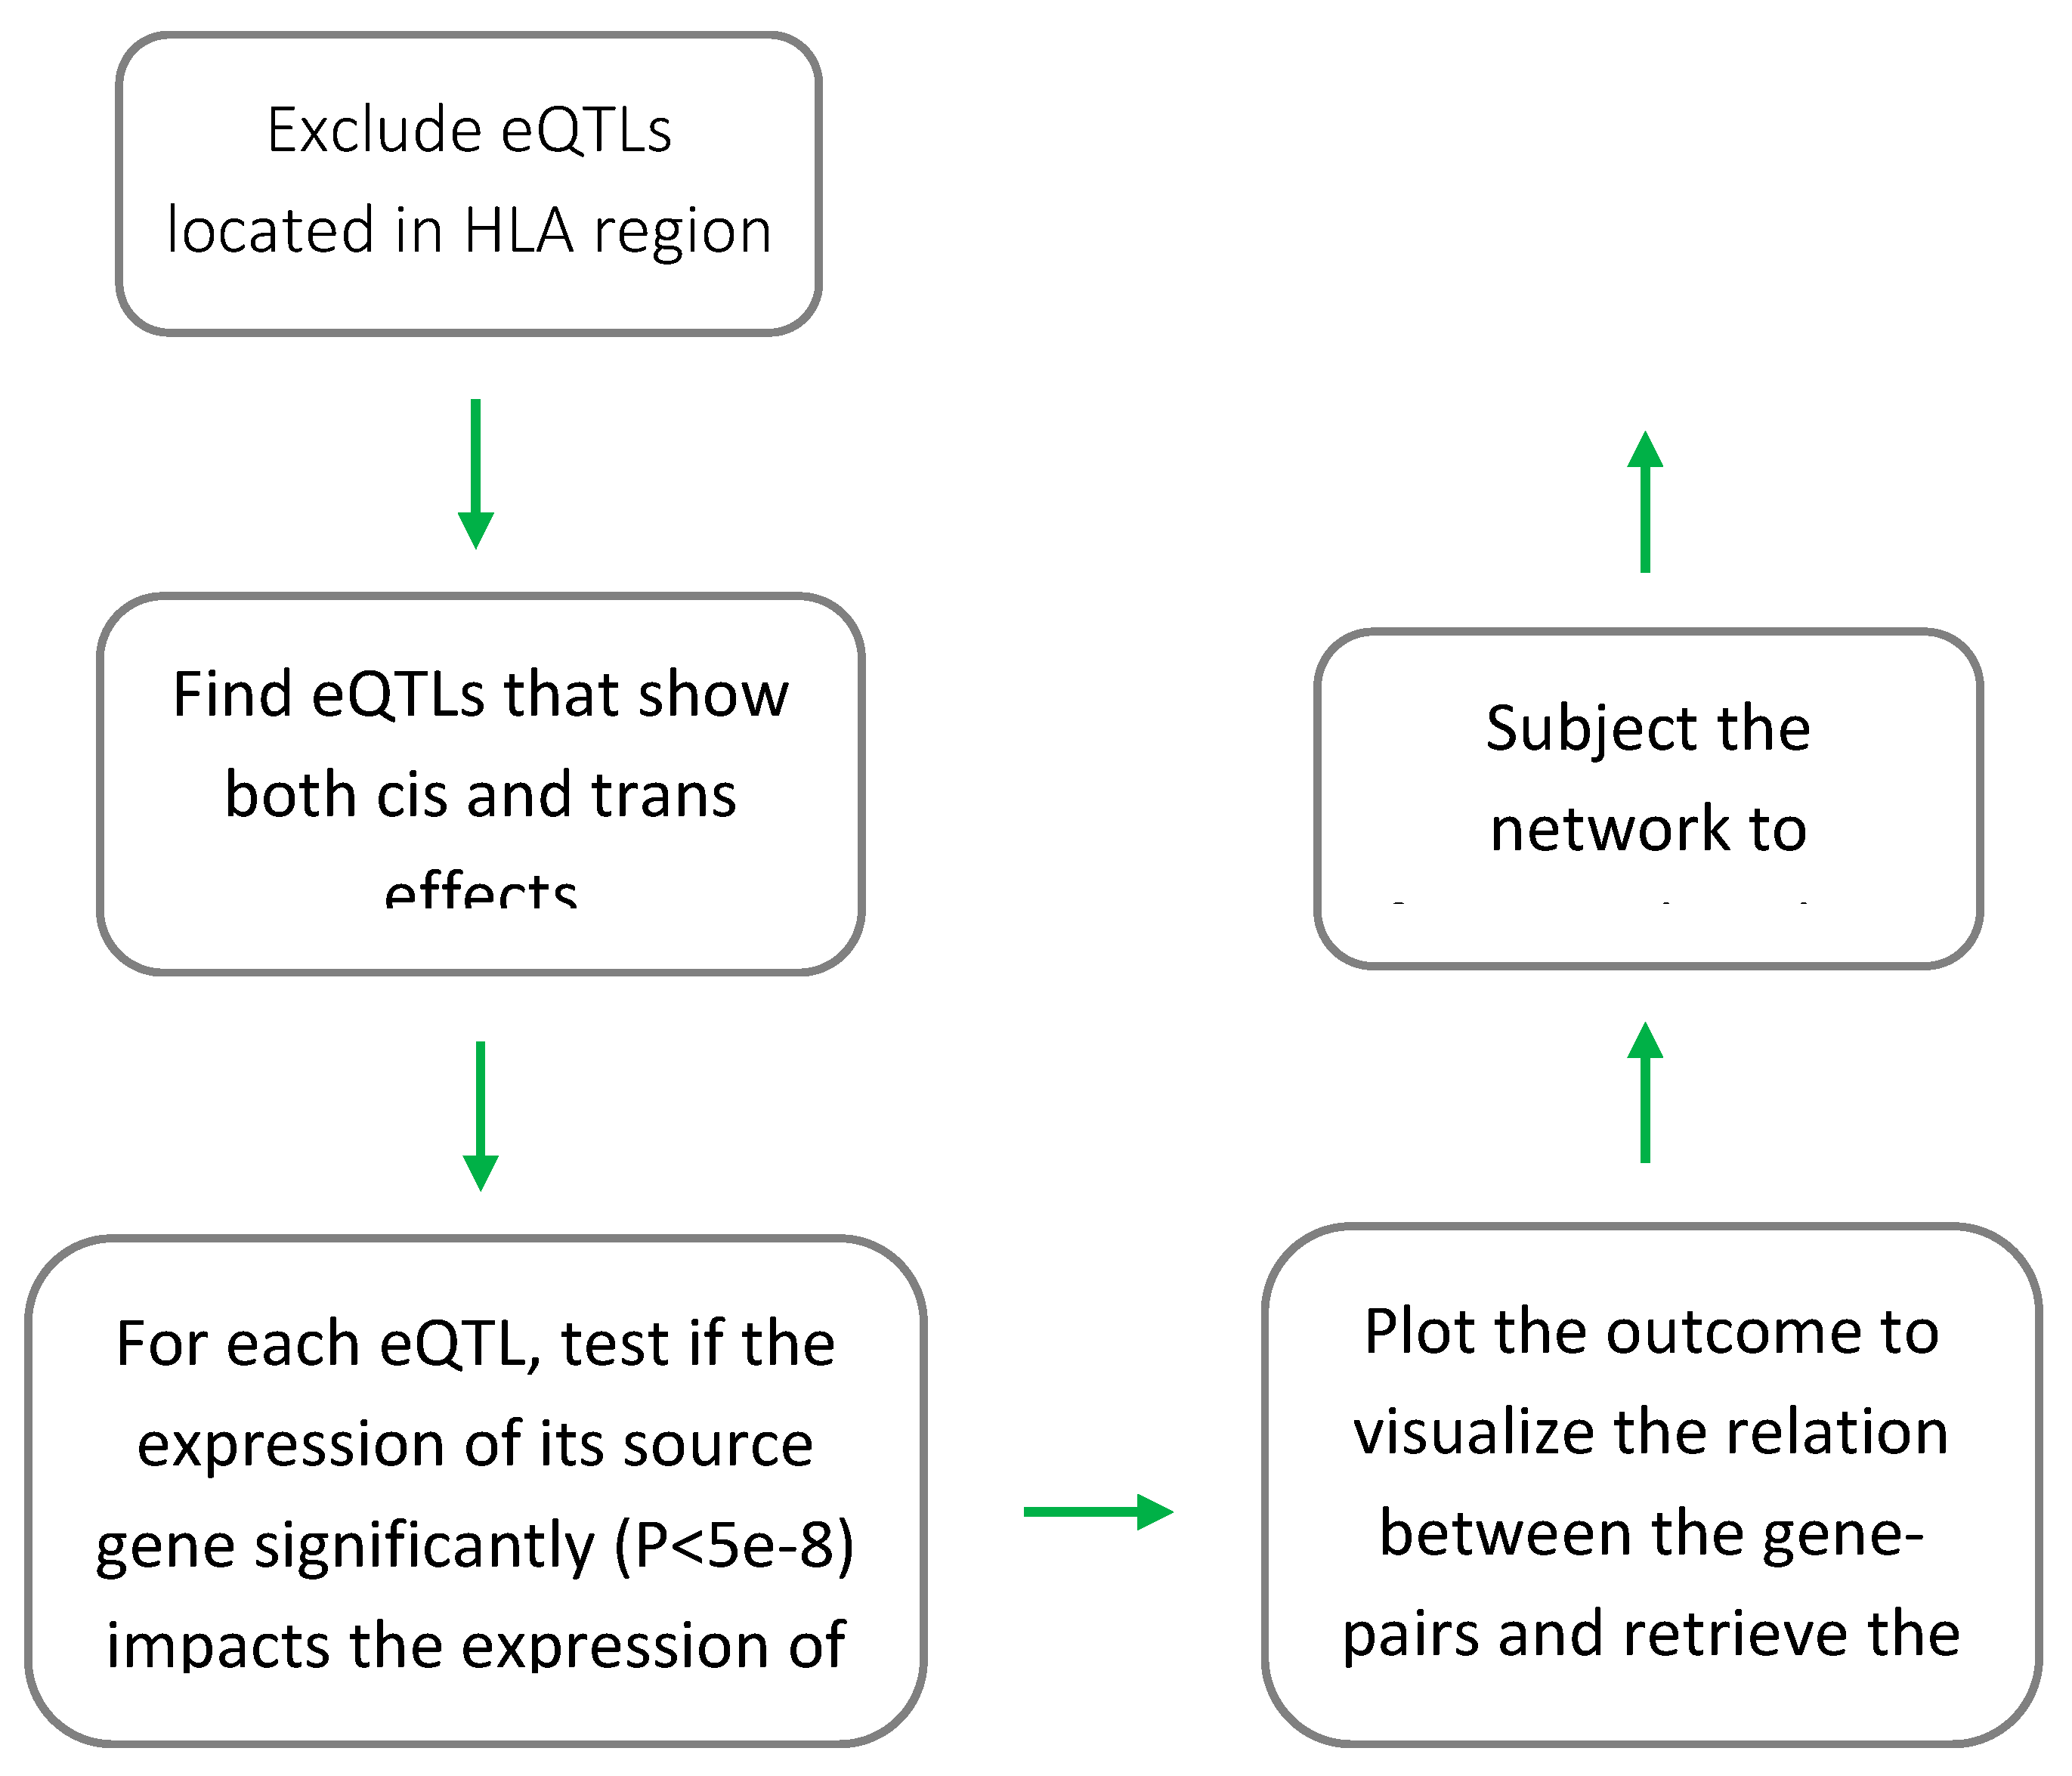

Table 1.
Biological processes that are overrepresented in genes of the main network.
| Go-Term | Description | Fold Enrichment |
P | Corrected P* |
| 0006954 | Inflammatory response | 2.8 | 2.2E-15 | 1.1E-11 |
| 0071222 | Cellular response to lipopolysaccharide | 3.5 | 1.4E-12 | 6.8E-09 |
| 0045087 | Innate immune response | 2.3 | 2.4E-11 | 1.1E-07 |
| 0006915 | Apoptotic process | 2.2 | 3.8E-11 | 1.8E-07 |
| 0006955 | Immune response | 2.2 | 3.8E-10 | 1.8E-06 |
| 0043123 | Regulation of NF-kB signal transduction | 2.6 | 1.6E-07 | 7.6E-04 |
| 0007155 | Cell adhesion | 2.0 | 3.5E-07 | 1.7E-03 |
| 0051607 | Defense response to virus | 2.5 | 5.4E-07 | 2.6E-03 |
| 0043066 | Negative regulation of apoptotic process | 1.9 | 8.1E-07 | 3.9E-03 |
| 0098609 | Cell-cell adhesion | 2.5 | 1.0E-06 | 4.9E-03 |
| 0050729 | Regulation of inflammatory response | 3.2 | 1.7E-06 | 7.9E-03 |
| 0007596 | Blood coagulation | 3.5 | 1.8E-06 | 8.5E-03 |
| * P-value corrected for multiple testing | ||||
Table 2.
Higher expression of GSDMB and ORMDL3 impact several diseases of polygenic nature.
| Trait information | GSDMB expression | ORMDL3 expression | |||||
| Name | PMID | B | SE | P | B | SE | P |
| Asthma | 32296059 | 0.11 | 0.01 | 3.9E-73 | 0.13 | 0.01 | 1.7E-65 |
| Allergic disease | 29083406 | 0.06 | 0.01 | 2.9E-29 | 0.07 | 0.01 | 1.1E-25 |
| Atrial fibrillation | 36653681 | 0.05 | 0.01 | 1.8E-14 | 0.05 | 0.01 | 1.5E-13 |
| Type 1 diabetes | 34127860 | -0.14 | 0.01 | 2.1E-26 | -0.14 | 0.02 | 4.4E-21 |
| Rheumatoid arthritis | 24390342 | -0.11 | 0.01 | 3.8E-16 | -0.12 | 0.01 | 1.4E-15 |
| HDL cholesterol | 32203549 | -0.02 | 0.002 | 6.5E-34 | -0.03 | 0.002 | 2.0E-37 |
| Primary biliary cirrhosis | 22961000 | -0.26 | 0.03 | 3.1E-15 | -0.28 | 0.04 | 7.5E-13 |
| Crohn's disease | 26192919 | -0.16 | 0.02 | 6.2E-12 | -0.16 | 0.03 | 6.0E-10 |
| Ulcerative colitis | 26192919 | -0.15 | 0.02 | 4.8E-13 | -0.17 | 0.02 | 5.3E-12 |
| Alkaline phosphatase | 33972514 | 0.003 | 0.0003 | 5.2E-17 | 0.003 | 0.0004 | 3.8E-15 |
Disclaimer/Publisher’s Note: The statements, opinions and data contained in all publications are solely those of the individual author(s) and contributor(s) and not of MDPI and/or the editor(s). MDPI and/or the editor(s) disclaim responsibility for any injury to people or property resulting from any ideas, methods, instructions or products referred to in the content. |
© 2024 by the authors. Licensee MDPI, Basel, Switzerland. This article is an open access article distributed under the terms and conditions of the Creative Commons Attribution (CC BY) license (http://creativecommons.org/licenses/by/4.0/).
Copyright: This open access article is published under a Creative Commons CC BY 4.0 license, which permit the free download, distribution, and reuse, provided that the author and preprint are cited in any reuse.


