1. Introduction
In recent years, lithium-ion batteries (LiB) have gradually expanded from the application of portable power (~1 - 100 W) in portable electronics to the application of mobile power (~50 - 300 kW) in various vehicles. This is because of LiB has high energy density and is commercialized at low cost. Now with the vigorous development of renewable energies such as wind power and photovoltaics and the demand of grid stability and power quality, LiB becomes popular as large-scale energy storage (~ MW). At present, hydraulic pumped energy storage is widely used as centralized large-scale energy storage. However, this storage is limited by the geographical and environmental constrains. Low energy density (less than 0.01 kWh m-3) of this storage makes it impossible for local community application. Battery energy storage becomes the best option for distributed regional energy storage. At present, there are many demonstrations of MW-level LiB storages around the world.
Some of the storages were caught on fires during these demonstrations. Fire often causes huge losses of storage facilities. One of the causes is poor cabinet heat dissipation. LiB uses flammable organic materials as the electrolyte. Elevated temperature causes overheat of the battery and catch it on fire. Storage safety is particular importance for large-scale applications.
Capable of operating at high C-rate is one of the goals of battery storage development. Battery operates at high C-rate, reducing storage cost and space for a given power load.
The heat generated by the battery is proportional to the C-rate of battery charging and discharging. Therefore, one of the challenges to be overcome is the ability of the storage to dissipate heat.
At present, the safety and heat dissipation of LiB have received considerable attention, mainly on the development of electric vehicles. The electric vehicle space is limited and is demanding high power charging/discharging from the battery. LiB in electric vehicle requires high energy density and power density (350 W/kg for a single battery and 200 W/kg for a battery pack). They often operate at high C-rates and generate a lot of heat. Cooling of LiB in electric vehicle is essential.
1.1. Thermal Runaway
Thermal runaway of LiB could be caused by the following conditions 1-7: Battery overcharge, high charge and discharge current, battery short circuit, high temperature environment and mechanical damage, etc. The thermal runaway of the battery is due to the temperature of the electrolyte exceeding its boiling point (above ~ 100°C). Electrolyte above this temperature begins to evaporate. This causes the increasing of battery internal pressure. The high-temperature electrolyte sprays out of the battery and mixes with air to cause combustion. Although present LiB have quite complete safety considerations8-9. Keeping the battery operating temperature below 80°C is still an important factor to ensure the safety of power storage systems.
Proper battery cooling is critical due to space constraints in electric vehicles and the need to charge and discharge at high C-rates (large currents > 1C). Power storage systems usually use circulating coolant or forced cold air to ensure that the battery does not overheat. The thermal management strategies of electric vehicles are natural air convection, forced air convection, liquid (water, ethylene glycol, acetone, etc.) cooling, phase change materials and heat pipe.
1.2. Classification of Thermal Runaway Simulation
The charging and discharging C-rate of large-scale storage operation is lower than that of electric vehicles (< 1.5 C), and the storage system only uses the cooling mechanism of air convection or air conditioning. In order to properly design the battery module and pack and to understand the heat dissipation phenomena among batteries, many thermal models have been proposed in the literature. These models can be divided into three categories: (1) solid-state electrochemical models, (2) bulk semi-empirical models, and (3) RC equivalent circuit models. The solid-state electrochemical model considers the diffusion process of active species in porous media, electrochemical reactions occurring at electrodes, ion transport in electrolytes, heat transfer in porous media and electrolytes, current and electrochemical potential distributions. The bulk semi-empirical model treats the battery (electrodes, separator, casing, etc.) as a single material that material properties are treated as a single material with proper values. This bulk semi-empirical model is used for calculations at the multi-cell or battery module level. The RC equivalent circuit model is used at system-level modeling. The battery characteristic is modeled with RC circuit composed of multiple series or parallel resistors and capacitors. It is usually used to simulate the dynamic behavior of the storage behavior during charging/discharging.
1.3. Research Scope
The main goal of this work is to compare different battery layout designs, to find out the fluid dynamics and temperature distribution of various layouts and operating conditions. This will improve the storage charging and discharging performance. The storage of this study is an outdoor expandable energy storage. The normal storage charge/discharge power is 200 kW. The operating voltage is 900~1000V. The heat is dissipated by fan produced forced convection.
Present hydrodynamic and thermal modeling adopts bulk semi-empirical model. The hydrodynamics and thermal modeling are carried out on components, including single cells, modules, packs, and cabinets. This study analyzes the flow velocity, pressure, and temperature distribution of the air around those components and the temperature distribution inside the components under different C-rates, air flow rates, and layouts. The parameter values (heat generation rate density, Q) used for calculation were corrected with the experimental measured data of a single cell and a battery pack. Part of single cell, module, and pack modeling results were published elsewhere10. This article reports unpublished modeling results of single cell, module, pack, and cabinet.
2. Literature Survey on Heat Transfer Modeling of Lithium-ion Battery (LiB)
Most of LiB heat transfer modeling was studied the heat transfer phenomena of LiB for electrical vehicle application. We give a brief survey of heat transfer modeling of LiB in this section. This survey may not be thoroughly, but it gives us an glance of the battery type, configuration, model, and software used for the heat transfer of LiB modeling.
2.1. Type of Lithium-ion Battery under Study for Temperature Distribution
Table 1 lists the battery configuration and battery type have been studied in some of the literature
11-24. The heat transfer of single cell and battery module were studied. The “pack” or “stack” was used in the literature. We call a group of cells that connected together as the “module” for consistency here. The “pack” is used for a unit that contains cell module, outside casing, fan, and control electronics. The module contains multiple pouch cells laminated together
11,16 or an array of cylindrical cell gathered in different patterns
12-14. In pouch cell module, the heat is transfer from one cell to the other through thermal conduction within the cell and between cells. In cylindrical cell module, heat is transferred through the conduction and radiation (some cases) between cells and conduction between the cell contact interface. Several types of LiB were studied and their corresponding material properties were used in the modeling, such as thermal conductivity, density, heat capacity, etc. Battery under studied can be classified by the cathode material used:
a. Li(NCM), lithium nickel cobalt manganese, LiNiMnCoO2;
b. LTO, lithium titanate, Li2TiO3;
c. LCO, lithium cobalt oxide, LiCoO2;
d. LFP, lithium iron phosphate, LiFePO4.
2.2. Model and Transfer Mechanism Considered
Depending on the major problem to be studied and available resources, researcher proposed various mathematical models for single cell and module. Models may contain detail battery structure or module with overall lumped models as listed on
Table 2. Detail numerical model considers material properties of various components, such as, cathode, separator, SEI (solid electrolyte interface), anode, and current collector. The electrochemical reactions on cathode and anode, chemical reactions during thermal runaway were considered.
Governing equation includes:
Since no fluid motion inside the cell, no fluid flow was considered that means momentum conservation is not considered in general. On the cell/air boundary, convective heat transfer was considered. When battery temperature excessed 180 oC during thermal runaway, radiative heat transfer between cylindrical cells was also considered.
Lumped equivalent resistance model simplifies the model and can be solved in a short time. It treated heat transfer resistance as electrical resistance and by solving the RC equivalent circuit. Unsteady state current and voltage change during charge/discharge, or external perturbation can be calculated. The voltage and current is corresponding to cell temperature and heat flux, respectively.
2.3. Digital Solution Method and Software use
For electric equivalent circuit, the voltage and current at each location can be converted into an matrix by Kirchhoff’s voltage law. They can be solved via matrix manipulation and Matlab is a commercial package ready for this application, as shown on
Table 2. To solve governing equations, as mentioned before, the model has to be divided (meshed) into many small segment throughout the entire domain. Variables in the previously mentioned governing equations are converted into first order or second order equations. These variables are then solved by one of the following numerical methods.
FDM: finite differential method
FEM: finite element method
FVM: finite volume method
BEM: boundary element method
Commercial software COMSOL uses FEM and ANSYS Fluent uses FVM. Some author uses in-house program written in FORTRAN, C++, or Python.
3. Simulation Method and Steps
3.1. Model Geometry and Boundary Conditions
The geometry diagrams and boundaries of single cell, module, and pack are given on previous literature10. The single cell used for the modeling is a LFP (LiFePO4) rectangular cell (DJY-32173250). It has an operating voltage of 3.2 V, a capacity of 123 Ah, and a dimensions of 17.3 cm x 3.2 cm x 25 cm (x, y, z). In the single cell model, the cell is locating in the middle of a cubic space. The air enters the cubic space (60 cm x 60 cm x 31 cm) at a rate of 1 m s-1, 25 cm from the cell x-z surface. The opposite side is the air outlet. The pressure relative to the atmospheric pressure is 0 Pa. The other sides (including the cell wall) are set as solid walls, and the air velocity on the walls is 0 m s-1 (No slip assumption). The setting in the heat transfer simulation is that the air inlet temperature is at 25 oC. Other faces are assumed to be insulating faces (heat flux = 0). Assuming that the single cell is the heat source, the heat generation rate density is 1 x 10⁴ W m-3 ~ 4 x 10⁴ W m-3. The relations between discharge C-rate and heat generation rate density are correlated by experimental measurements as described on section 2.2
The module consists of 4 to 16 single cells. The air inlet and outlet boundary conditions are the same as those of a single cell. Temperature distribution of the module at different air flow rates and cell spacings are calculated. The purpose of module modeling is to understand the influence of multiple cell arrangement on each other.
The pack in this study has 16 single cells arranged in series. The output voltage of the pack is 51.2 V, and the size of the pack shell is 20 cm x 65.4 cm x 30.3 cm (x, y, z). The 16-cell module is located at the center of the pack in the x-direction and is 7.95 cm from the pack front side. Air inside the pack is expelled by a fan on the front side, and cold air is drawn in through six circular holes on the pack back side. Each air inlet is covered with a screen. The air velocity on the battery walls and the battery pack case are set to be 0 m s-1 (No slip assumption). The cell in the pack is treated as a heat source, and the heat generation rate density is 1 x 10³ W m-3 ~ 7 x 10³ W m-3. The relation between pack discharge C-rate and heat production rate density is correlated by the experimental measurements as described on section 2.2.
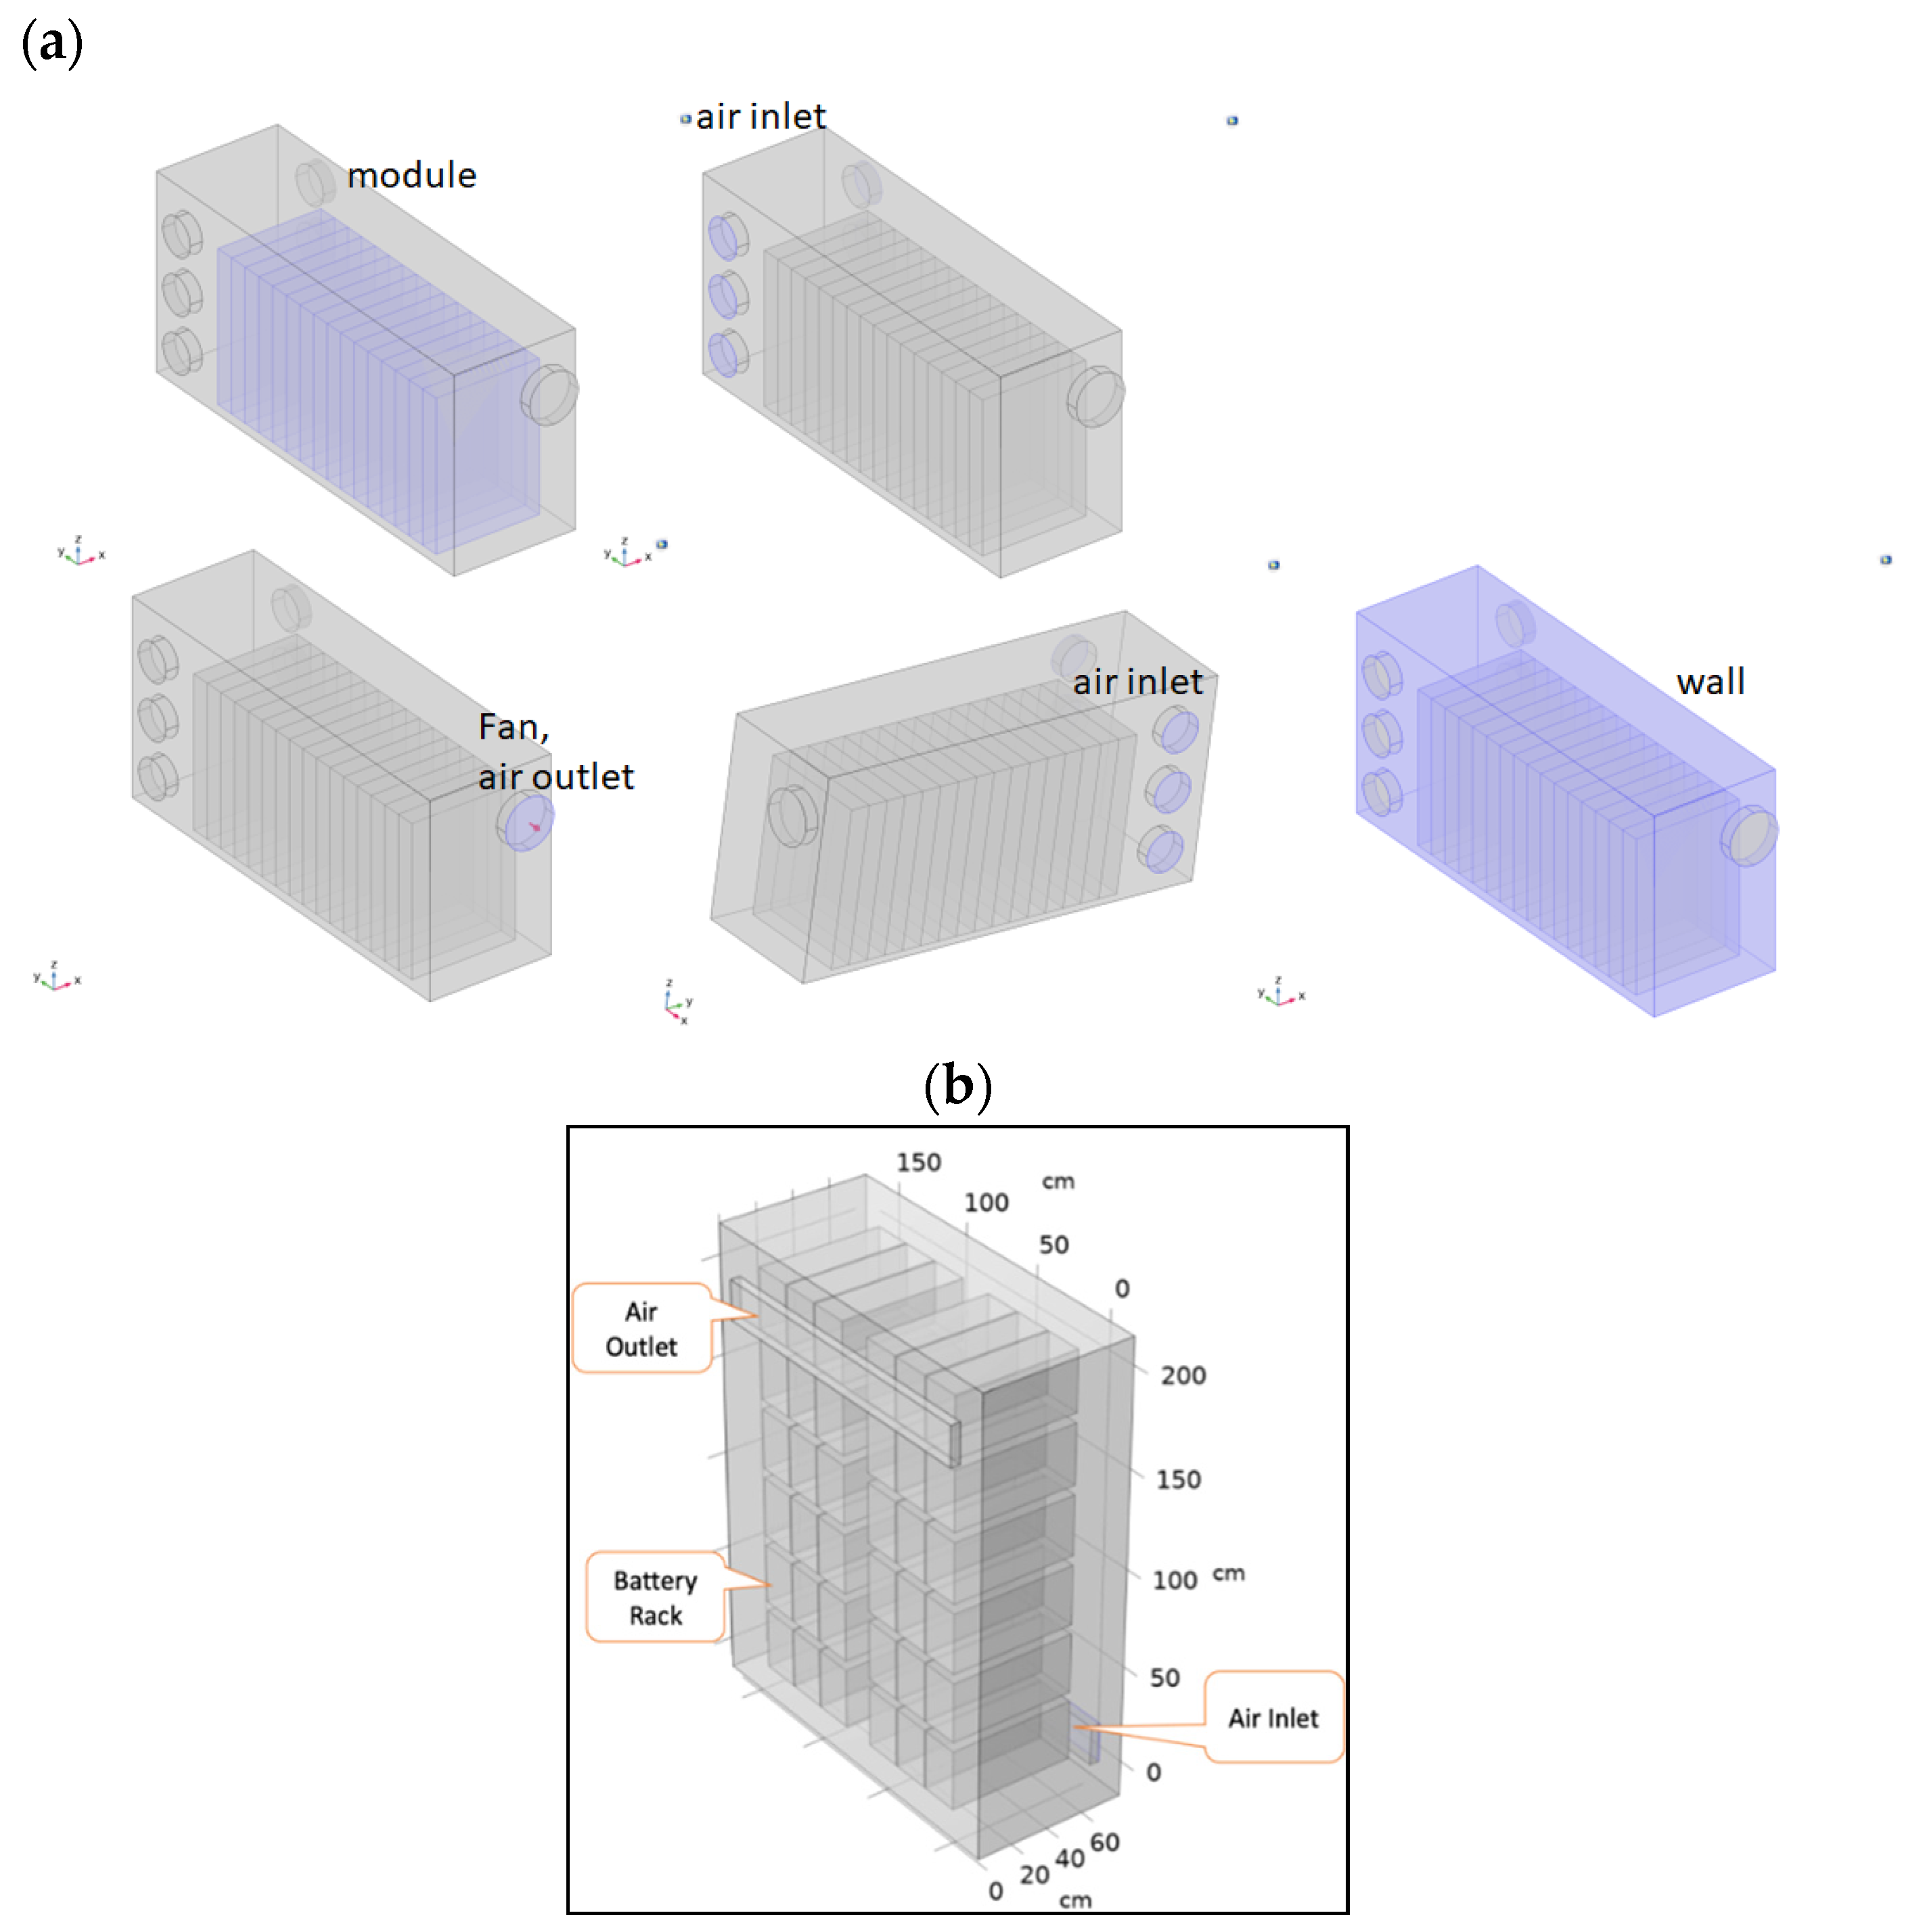
As shown on
Figure 1a, the pack model has a module with 16 cells located at the middle of the battery pack. The pack output voltage is 51.2 V, and the size of the pack is 65.4 cm x 20 cm x 30.3 cm. Air inside the pack is expelled by a fan, and air is drawn in through six circular holes on the opposite end of the pack. Each air inlet is covered with a screen, and the calculation formula and parameters of COMSOL 6.0 are used for the fan and air inlet screen. The air velocity on the battery wall and the battery pack case is set to 0 m s
-1 (No slip assumption). The battery is treated as a heat source, and the heat generation rate density is 1 x 10
3 W m
-3 ~ 7 x 10
3 W m
-3. The relationbetween pack discharge C-rate and heat production rate density is corrected by the experimental measurement results.
The cabinet model (
Figure 1b) has 6 racks side by side in the cabinet. Each rack has 6 modules stacked on top of each other. The air flow in the cabinet is forced convection and the natural convection is ignored in the model. Air enters from cabinet back side at a rate of 1 m s
-1 in the y direction. The air outlet is located on the cabinet front side, and the outlet pressure is set to be 0 Pa relative to the atmospheric pressure. The other walls (including the cell wall) are set as solid walls, and the air velocity on the walls is 0 m s
-1 (no slip assumption). The air inlet temperature is 25°C. The cabinet outside casing are set to be isothermal surfaces (T = 25°C). The module is treated as the heat source, and the heat production rate density is 25 W m
-3, 50 W m
-3, 100 W m
-3, 125 W m
-3, 150 W m
-3. Due to the lack of relevant experimental results at present, these heat production rate densities are assumed to correspond to the battery discharge C-rate: 0.25 C, 0.5 C, 1.0 C, 1.25 C, 1.5 C.
3.2. Calculation Steps
The hydrodynamics and heat transfer behavior of single cell, module, pack, and cabinet are calculated using the commercial software COMSOL 6.0. The “Laminar Flow (spf)” in “Fluid Flow” module and “Heat Transfer in Solids and Fluids (ht)” in “Heat Transfer” modules from COMSOL 6.0 are used in calculations. The geometric models of these components are established first, and then the materials of each region are defined.
Air property in COMSOL 6.0 is used in all models mentioned here. During calculation the air density (ρa) is expressed as a function of pressure (Pa) and temperature (T), the air thermal conductivity (ka) is a function of T, and the heat capacity (Cp,a) is a function of T. The dependance of ρa, ka, and Cp,a on T and Pa can be found in COMSOL 6.0, air, material contents. The heat transfer property of polymer electrolyte (LiPF6 in 1:2 EC:DMC and p(VdF-HFP) ) is assigned to the cell property in single cell, module, and pack model. It is assigned to the pack in cabinet model. They are density (1200 kg m-3), heat capacity (1200 J kg-1 K-1), and thermal conductivity (10 W m-1 K-1).
The COMSOL heat transfer module needs the heat production rate density (Q, W m
-3) as the input parameter for the calculation. Initial value of Q can be estimated from the cell voltage-current curve during charge/discharge. As shown on equation [1], part of the heat is generated from the battery voltage loss during charge/discharge (I η). Where “η” is the cell over-potential and “I” is the cell current density during charge/discharge. The other part is from thermodynamics (
). Where “
” is the entropy change of cell electrochemical reactions at standard condition and “T” is the cell temperature. The total heat generated from the cell (Q) is depending on the C-rate or charge/discharge current density. It can be calculated from equation [1].
A rough estimate of the Q value from single cell (DJY-32173250) voltage-current data at 1-C rate is about 4500 W m-3.
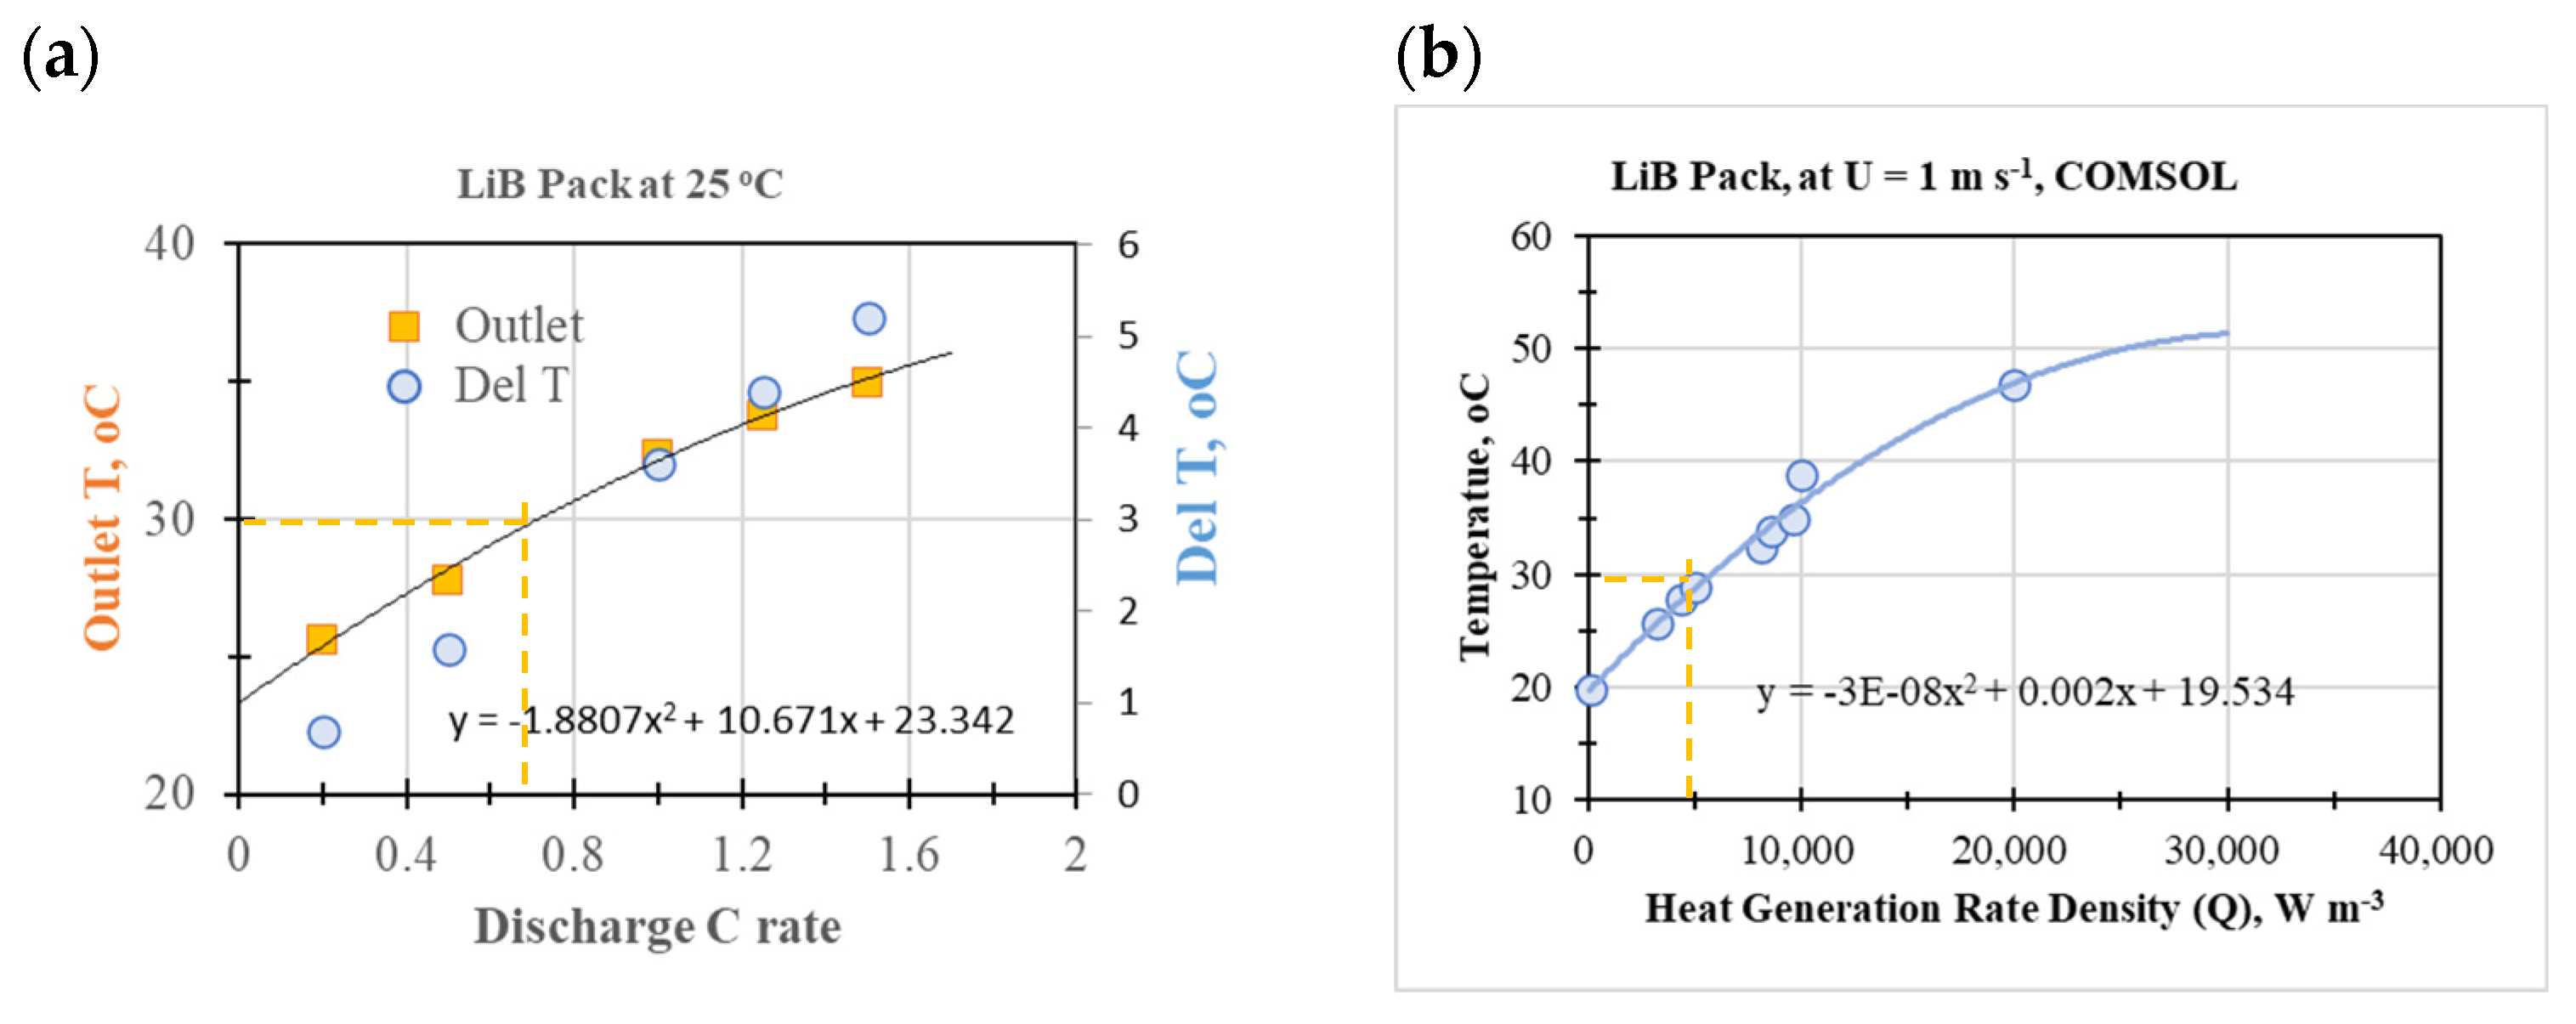
Above Q value is used as the initial value for calculation of cell and pack. The Q values is correlated with C-rate and correct from experimental measurement
10 as illustrated on
Figure 2.
Figure 2a is the plot of measured air temperature at fan exit of a pack versus cell discharging C-rate.
Figure 2b is the plot of calculated air temperature at fan exit of a pack versus heat generation rate density.
Figure 2a and 2b can be used to estimate the heat generation rate density corresponding to the cell discharging C-rates. For example, if the cell discharge at C-rate of 0.7, it can be seen from
Figure 2a that the pack temperature should be 30
oC. At this temperature, the corresponding heat generation rate density is 5000 W m
-3 from
Figure 2b. This is the heat generation rate density relative to a 0.7 C cell discharging rate.
The geometric model is then meshed where "normal mesh" or “coarse mesh” is chosen. The calculation is set "steady state" simulation.
4. Results and Discussions
4.1. Fluid dynamics and heat transfer of a single cell
The influences of air flow rate, cell heat generation rate density (Q), and inlet air flow direction were studied. The air fluid dynamics, air temperature distribution, and temperature distribution inside the cell at different Q values corresponding to 0.25 C to 3.0 C discharging rates were also calculated. We found that the cell surface temperature is linear proportional to the C-rate.
Figure 3a is the color coded fluid flow distribution and flow direction as indicated by the red arrows. The fluid flows at velocity of 1 m s
-1 at the entrance. It is deflected at the cell front surface. All the fluid velocity in the y-direction is change to the x-direction and z-direction as it approaches to the cell front surface. After the fluid flow across the cell edge, the flow direction is chang to y-direction. A back flow in the back side of the cell is also observed.
Figure 3b is a typical distribution of temperature (T) of a single cell and Fig. 3c is the distribution of temperature gradient (dT/dn) of a single cell and its surroundings. The “n” is the direction normal to the cell surface. The air hydrodynamics has strong effect on the cooling of the single cell. A uniform inlet air flows in along the y direction. Inlet air is deflected into the x and z directions on cell front x-z surface. This region is also called impinging region. Air flows around the left and right edges of the cell, rejoining rapidly into a y-directed flow. Slow air flow (blue color part) is observed in the back of the cell and its surrounding. Rapid air flow is observed at both cell edges where the air flow at the cell front in the x-z direction is changed to the y-direction. The velocity gradient on the front side and the back side of the cell is high. This is due to the rapid changing of flow direction in a narrow region where flow impinging effect on the front side and vortex effect on the back side.
The internal temperature of single cell is high as compared to the temperature around the single cell peripheral as given on
Figure 3b. The air flow rate is 1 m s
-1 and the Q value is 1 × 10
5 W m
-3. Temperature at the left and right edges (~ 50
oC) is lower than temperature at the cell center (above 65
oC). The cell is operated in the safe temperature region (below 80
oC). However, cell operated at large internal temperature difference may affect the cell durability and life cycle.
The temperature gradient (dT/dn) distribution is plotted on
Figure 3c. High temperature gradient is observed on the cell surface as it compared to the temperature gradient inside the cell. It indicates that high thermal conductivity inside the cell and low heat transfer rate or low heat dissipating rate is observed on the cell surface due to low air thermal conductivity and slow air flow rate. In this case, air convection around the cell is the main factor that slow down the cell heat dissipation rate.
The temperature distribution of the air and the cell at different air flow rates were also calculated. The Q is equal to 5 × 10
4 W m
-3 which is corresponding to 2 C discharge rate.
Figure 3d is the side-view of the temperature distribution at air flow rate at 0.1 m s
-1. Almost of the entire cell temperature is around 150
oC.
Figure 3e-3g are the side-view of the temperature distribution of single cell at different air flow rates. As the air flow rate increased from 0.1 m s
-1 to 5.0 m s
-1, the cell temperature drops from 150
oC to around 40
oC. Fast air flow rate is necessary for the cell operated at safe temperature (below 80
oC). However, the cost and electricity consumed by the fan must be considered.
Figure 4 shows the top-view of temperature distribution inside the cell when the direction of the air flow is at different angles of 30
o, 45
o, 60
o, and 90
o. At 0°, the heat dissipation at the left and right ends of the cell is relatively high, and the temperature there is low. As the angle gradually increases from 30
o, 45
o, and to 60
o, the temperature at the cell leading end (
Figure 4a~4c, point A) is decreased, and the temperature at the cell tailing end (
Figure 4a~4c, point B) is gradually increased. At the angle of 90
o, the low temperature region at the cell leading end is maximized (Fig. 4d, point A). Due to the high air flow rate on the left and right sides of the cell, the heat dissipation effect will also be improved; however, the temperature distribution of the cell itself is not uniform. By increasing the air inlet angle, it reduces the temperature of the cell leading end; but it also makes the cell temperature distribution more uneven.
4.2. Fluid dynamics and heat transfer of a module
The air velocity distributions of a module with 16 cells at cell spacing of 0 cm, 8 cm, and 16 cm, were calculated. When the cell spacing is 0 cm, there is no air circulation between the cells, which is equivalent to an air flowing around a block with a size of 17 cm x 48 cm x 24 cm. When the cell spacing is 8 cm and 16 cm, there is low-velocity air circulation between the cells, especially between the third to sixth cell in the leading-end. The circulation of air between the cells helps to dissipate heat from the cells.
Figure 5a ~ 5c are the temperature distribution of a module with 16-cell connected in series, wherethe cell spacing is 0 cm, 8 cm, and 16 cm, respectively. When the cell spacing is 0 cm, there is no air circulation between the cells. The overall temperature of the cell is the highest among these 3 cases. When the cell spacing is 8 cm and 16 cm, there is a low-speed air circulation between the cells (
Figure 5b, 5c, orange, yellow, and cyan region between the cells). The circulation of air between the cells reduces the temperature of the cells. Especially for the first to sixth cells in the leading-end of case 3 (
Figure 5c), the air circulation between the cells is helpful for the heat dissipation of the cells. This makes the cell temperature of cases 2 and 3 lower than that of case 1. However, the space need for a given power output is increased. The power density or energy density of the module is reduced.
Air velocity has a significant effect on cell temperature for large cell-spacing module. This can be seen on
Figure 5d~5f. At a cell spacing of 16 cm,
Figure 5d, 5e, and 5f are the cell temperature distribution at air flow rates of 1 m s
-1, 6 m s
-1, and 10 m s
-1, respectively. The increase in air flow rate significantly reduces the cell temperature.
4.3. Fluid dynamics and heat transfer of a battery pack
Figure 6 depicts the air flow distribution inside the pack.
Figure 6a, 6b, and 6c are the isometric view, side view, and top view of the air velocity profile inside the pack. Air is drawn from six intake holes on the pack back. The air inside the pack is draw to a fan located on the pack front surface. Most of the air flows quickly through the module headspace as shown in
Figure 6a and 6b (red colored). Slow air flow is observed on the lower back side of the pack. Rapid air flow is observed on both sides of the module, especially at the air inlet region and at the fan air outlet region.
Figure 7 is the pack temperature distribution at different cell discharge C-rates. The inlet air temperature is 25
oC. Models assume that pack is well cooling outside; and the pack wall temperature is also 25
oC. Calculated results indicated that cell temperature inside the pack is below 80
oC if the discharge C-rate is below 1 C. This is consisted with experimental measurement where pack is tested in an environmental controlled chamber where temperature is controlled at 25
oC with force air circulation.
Cell temperature inside the module is higher than the cell temperature at both ends of the module. Lack of air circulation and compact packing of cell are the causes of cell elevate temperature distribution. As discussed in the previous section, large cell spacing and high air flow rate may lower the cell temperature and allow the pack operate at high C-rate. However, it is difficult to achieve that goal when the battery is aiming at small volume and low parasite energy consumption.
One-point worth noting is that the temperature of the module bottom portion is lower than the temperature of the module top portion. This is due to the wall boundary condition is set at 25 oC. This suggests that a good cooling at the bottom of the pack is more effective than increasing the air circulation inside the pack.
The same model with insulated wall boundary condition were also calculated. Results suggested that if the battery pack housing is insulated, slow heat dissipation or high cell temperatures are observed. But if the battery pack case has high thermal conductivity, a high heat dissipation rate or low cell temperature will be observed. With good thermal conductive pack wall and with good cooling under the pack, the temperature of the battery modules within the pack is low and relatively uniform as shown in
Figure 7.
4.4. Fluid dynamics and heat transfer of a bettery cabinet
The space in the battery container is limited and no other heat dissipation design can be done. If electric vehicles need to meet the design concept of high C-rate charge and discharge, coolant circulation can be used to increase the heat dissipation rate. In addition, heat pipe technology can remove a large amount of heat in a small space; however, these methods will greatly increase the complexity and cost of the cabinet, so the present study will focus on the variation outside the cabinet.
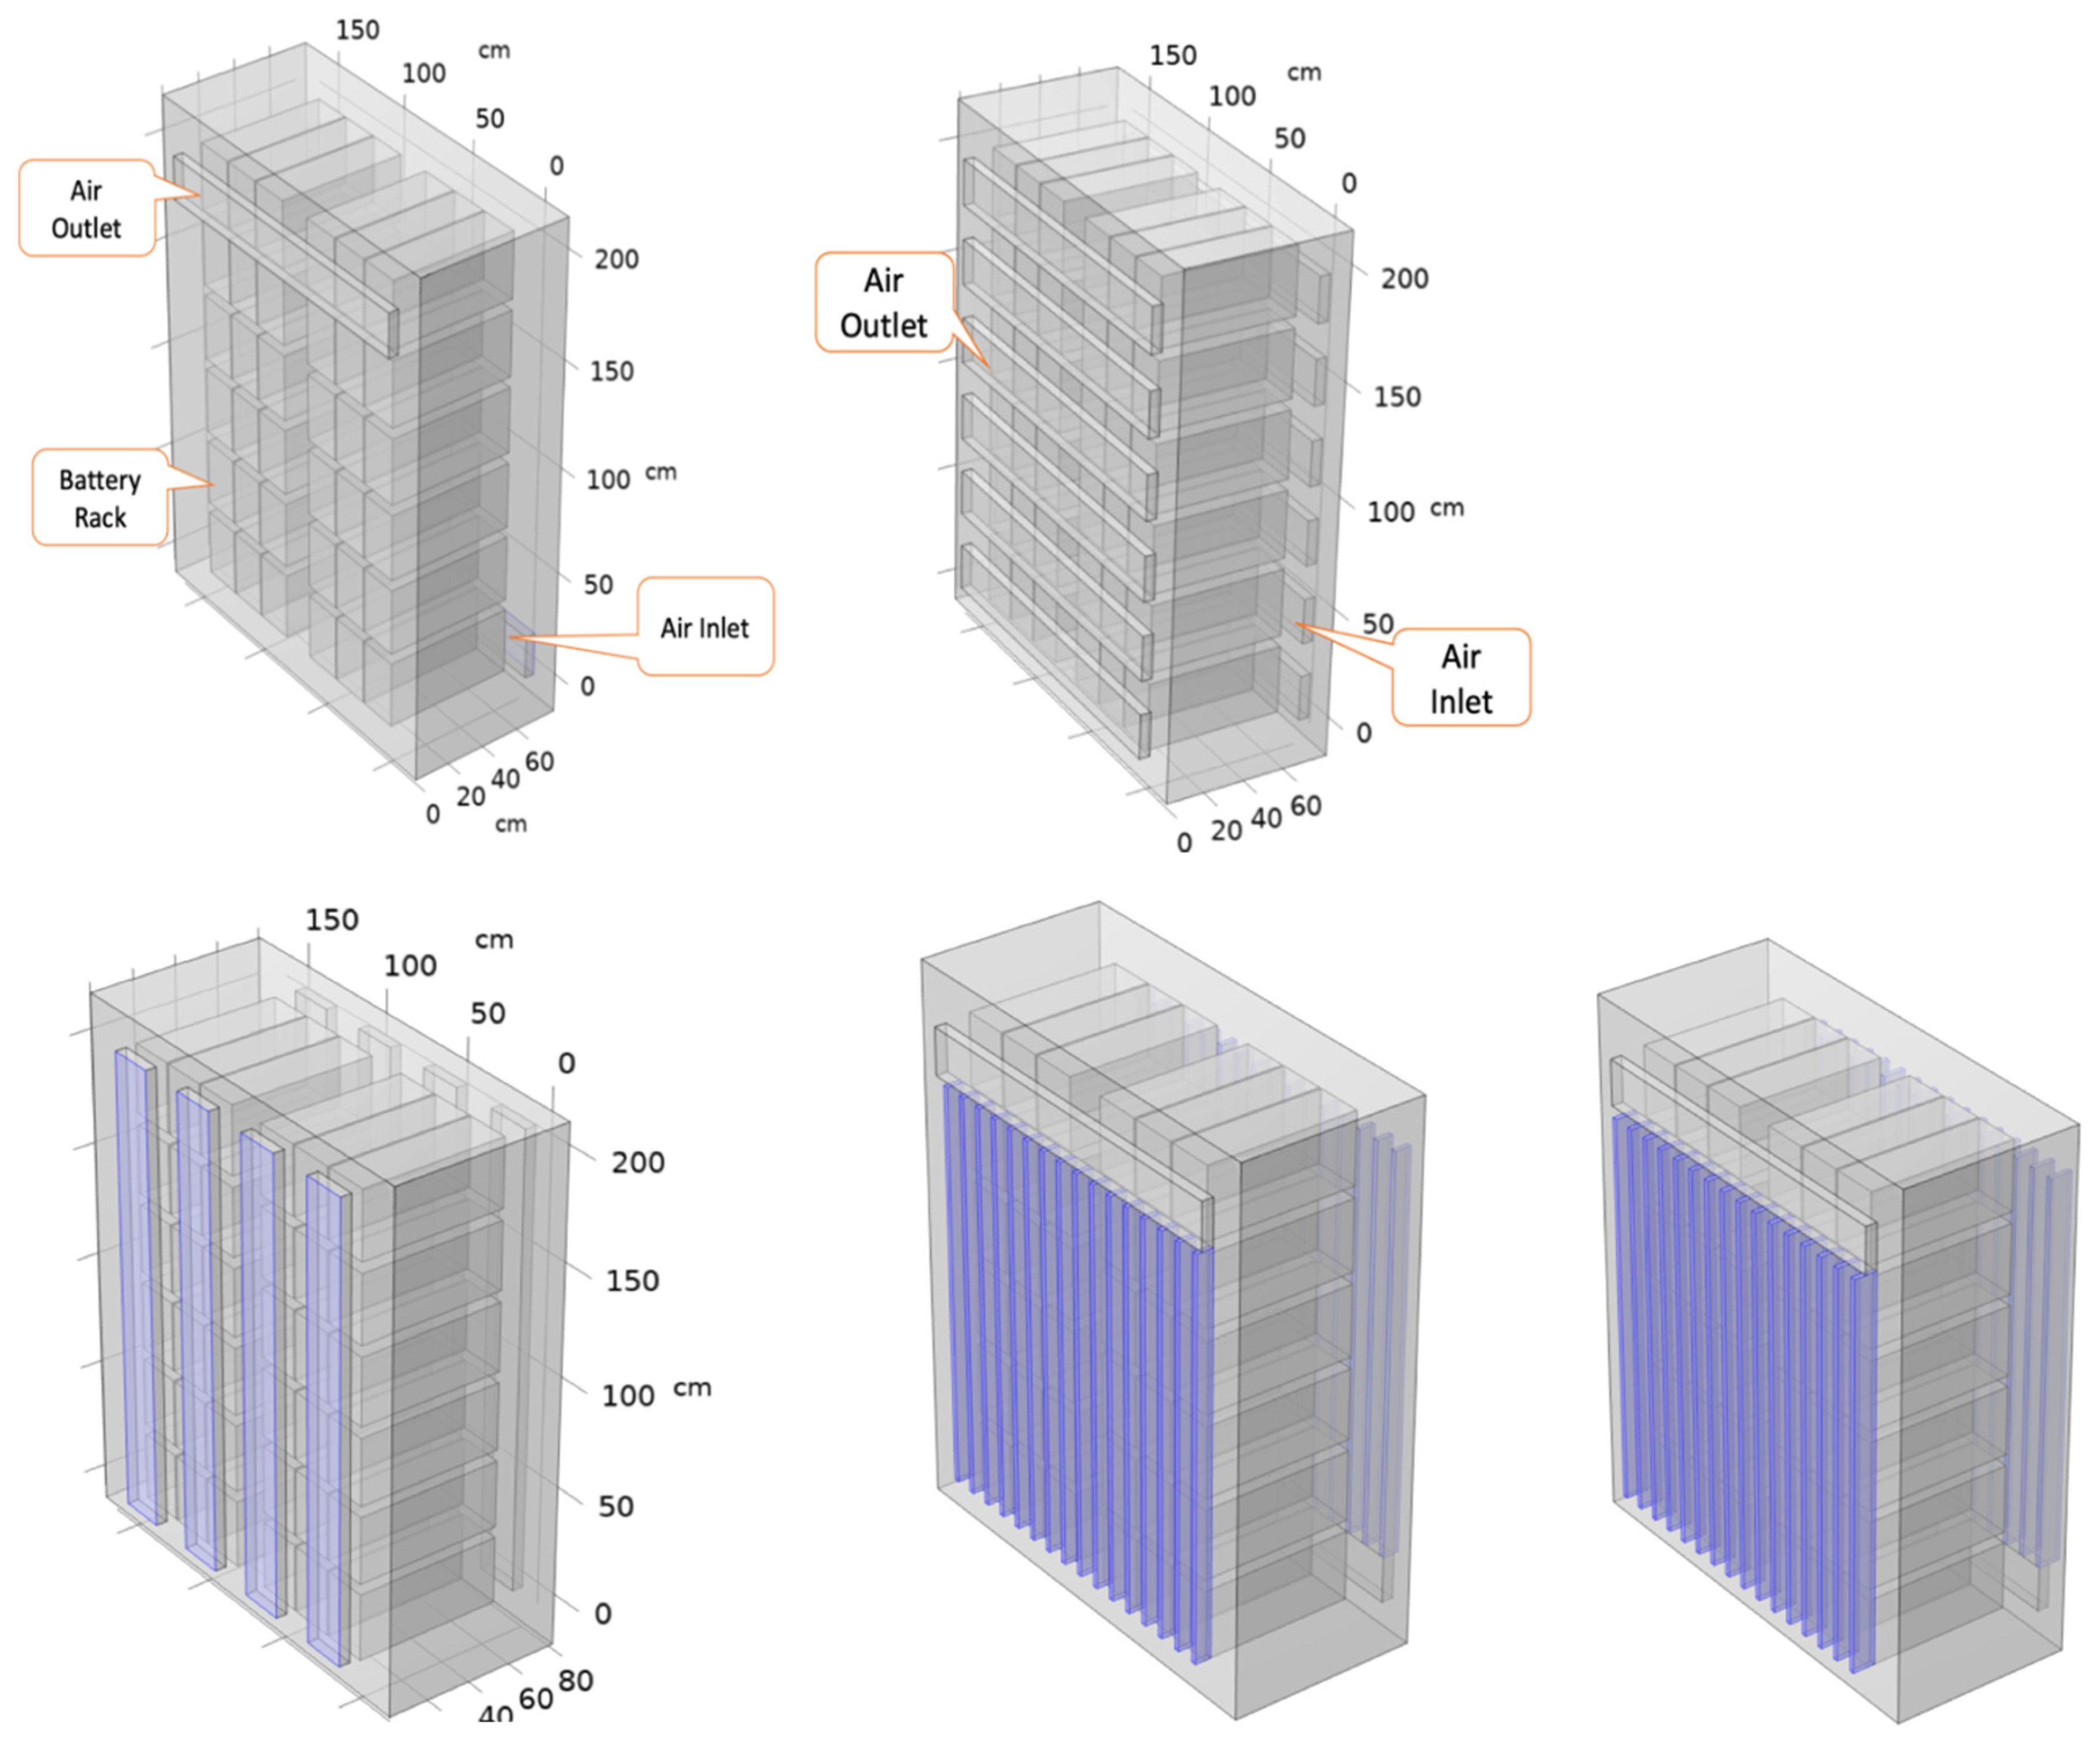
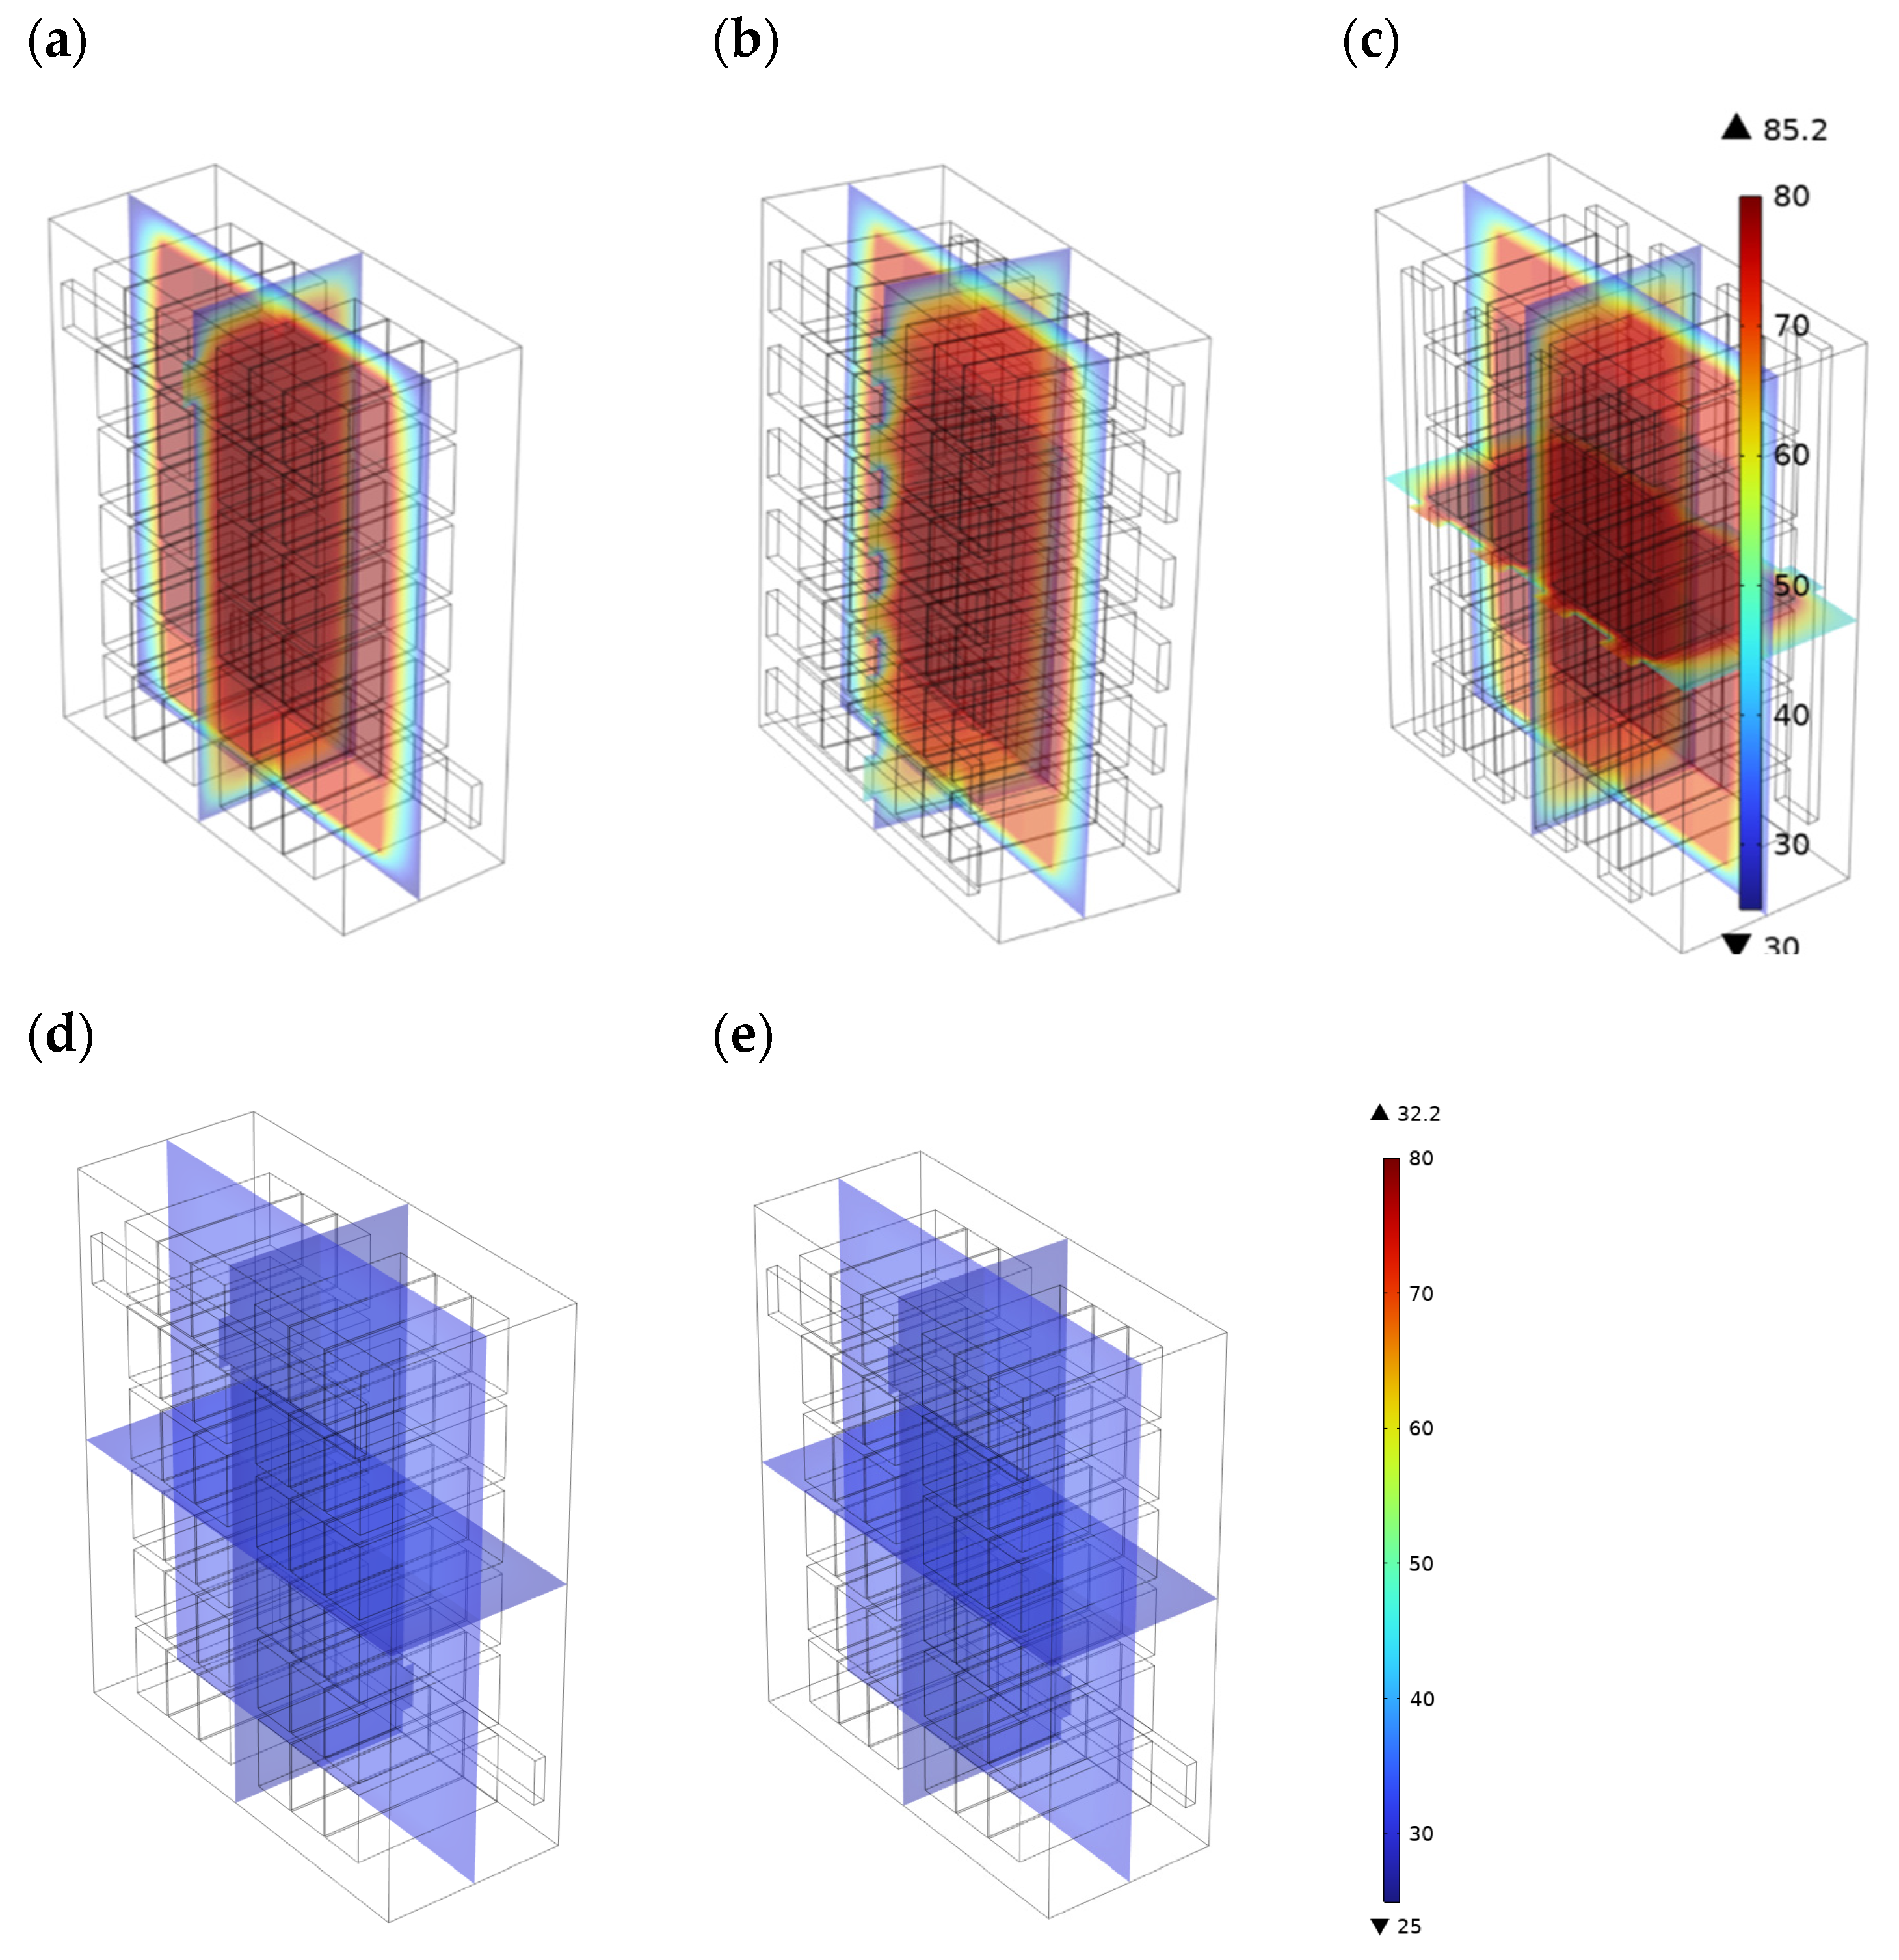
Figure 8 is the geometry of five different designs of battery cabinet. Case 1 (
Figure 8a) is a one-in/one-out cabinet design. Fresh air is sucked in the cabinet through the horizontal opening at the rear lower part of the cabinet. Hot air is exhausted through the horizontal opening at the front upper part of the cabinet. Case 2 (
Figure 8b) is a six-inlet/six-outlet cabinet design. Fresh air is sucked in the cabinet through six horizontal openings at the rear of the cabinet. Hot air is exhausted through six horizontal openings at the front of the cabinet. The opening size is 5 cm x 160 cm x 20 cm. Case 3 (
Figure 8c) is a four-inlet/four-outlet cabinet design. Fresh air is sucked in the cabinet through four longitudinal openings at the rear of the cabinet. Hot air is exhausted through four longitudinal openings at the front of the cabinet. The opening size is 5 cm x 205 cm x 20 cm. Case 4 (
Figure 8d) is a cabinet with horizontal one-in/one-out with a short heat sink design (10 cm x 2 cm x 171 cm). Case 5 (Fig. 8e) is the cabinet geometry of horizontal one-in/one-out with extended heat sink (10 cm x 4 cm x 171 cm).
The model takes the battery module as a unit, and 18 (3 × 6) battery modules are stacked to form a rack. Two racks are arranged side by side to form a cabinet. The air flow into the cabinet is forced convection. Air enters from the air inlet at a rate of 1 m s-1 in the y-direction. The opposite side is the air outlet. And the calculation ignores the influence of natural convection. The outlet pressure is set to 0 Pa relative to the atmospheric pressure. The other sides (including the cell wall) are set as solid walls, and the air velocity on the walls is 0 m s-1 (No slip assumption). The setting for the heat transfer simulation is an air inlet temperature of 25oC. The cabinet outside surfaces are set as isothermal surfaces (T = 25oC). The calculation assumes that the battery module is the source of heat generation, and the heat generation rate density is 25 W m-3 ~ 150 W m-3.
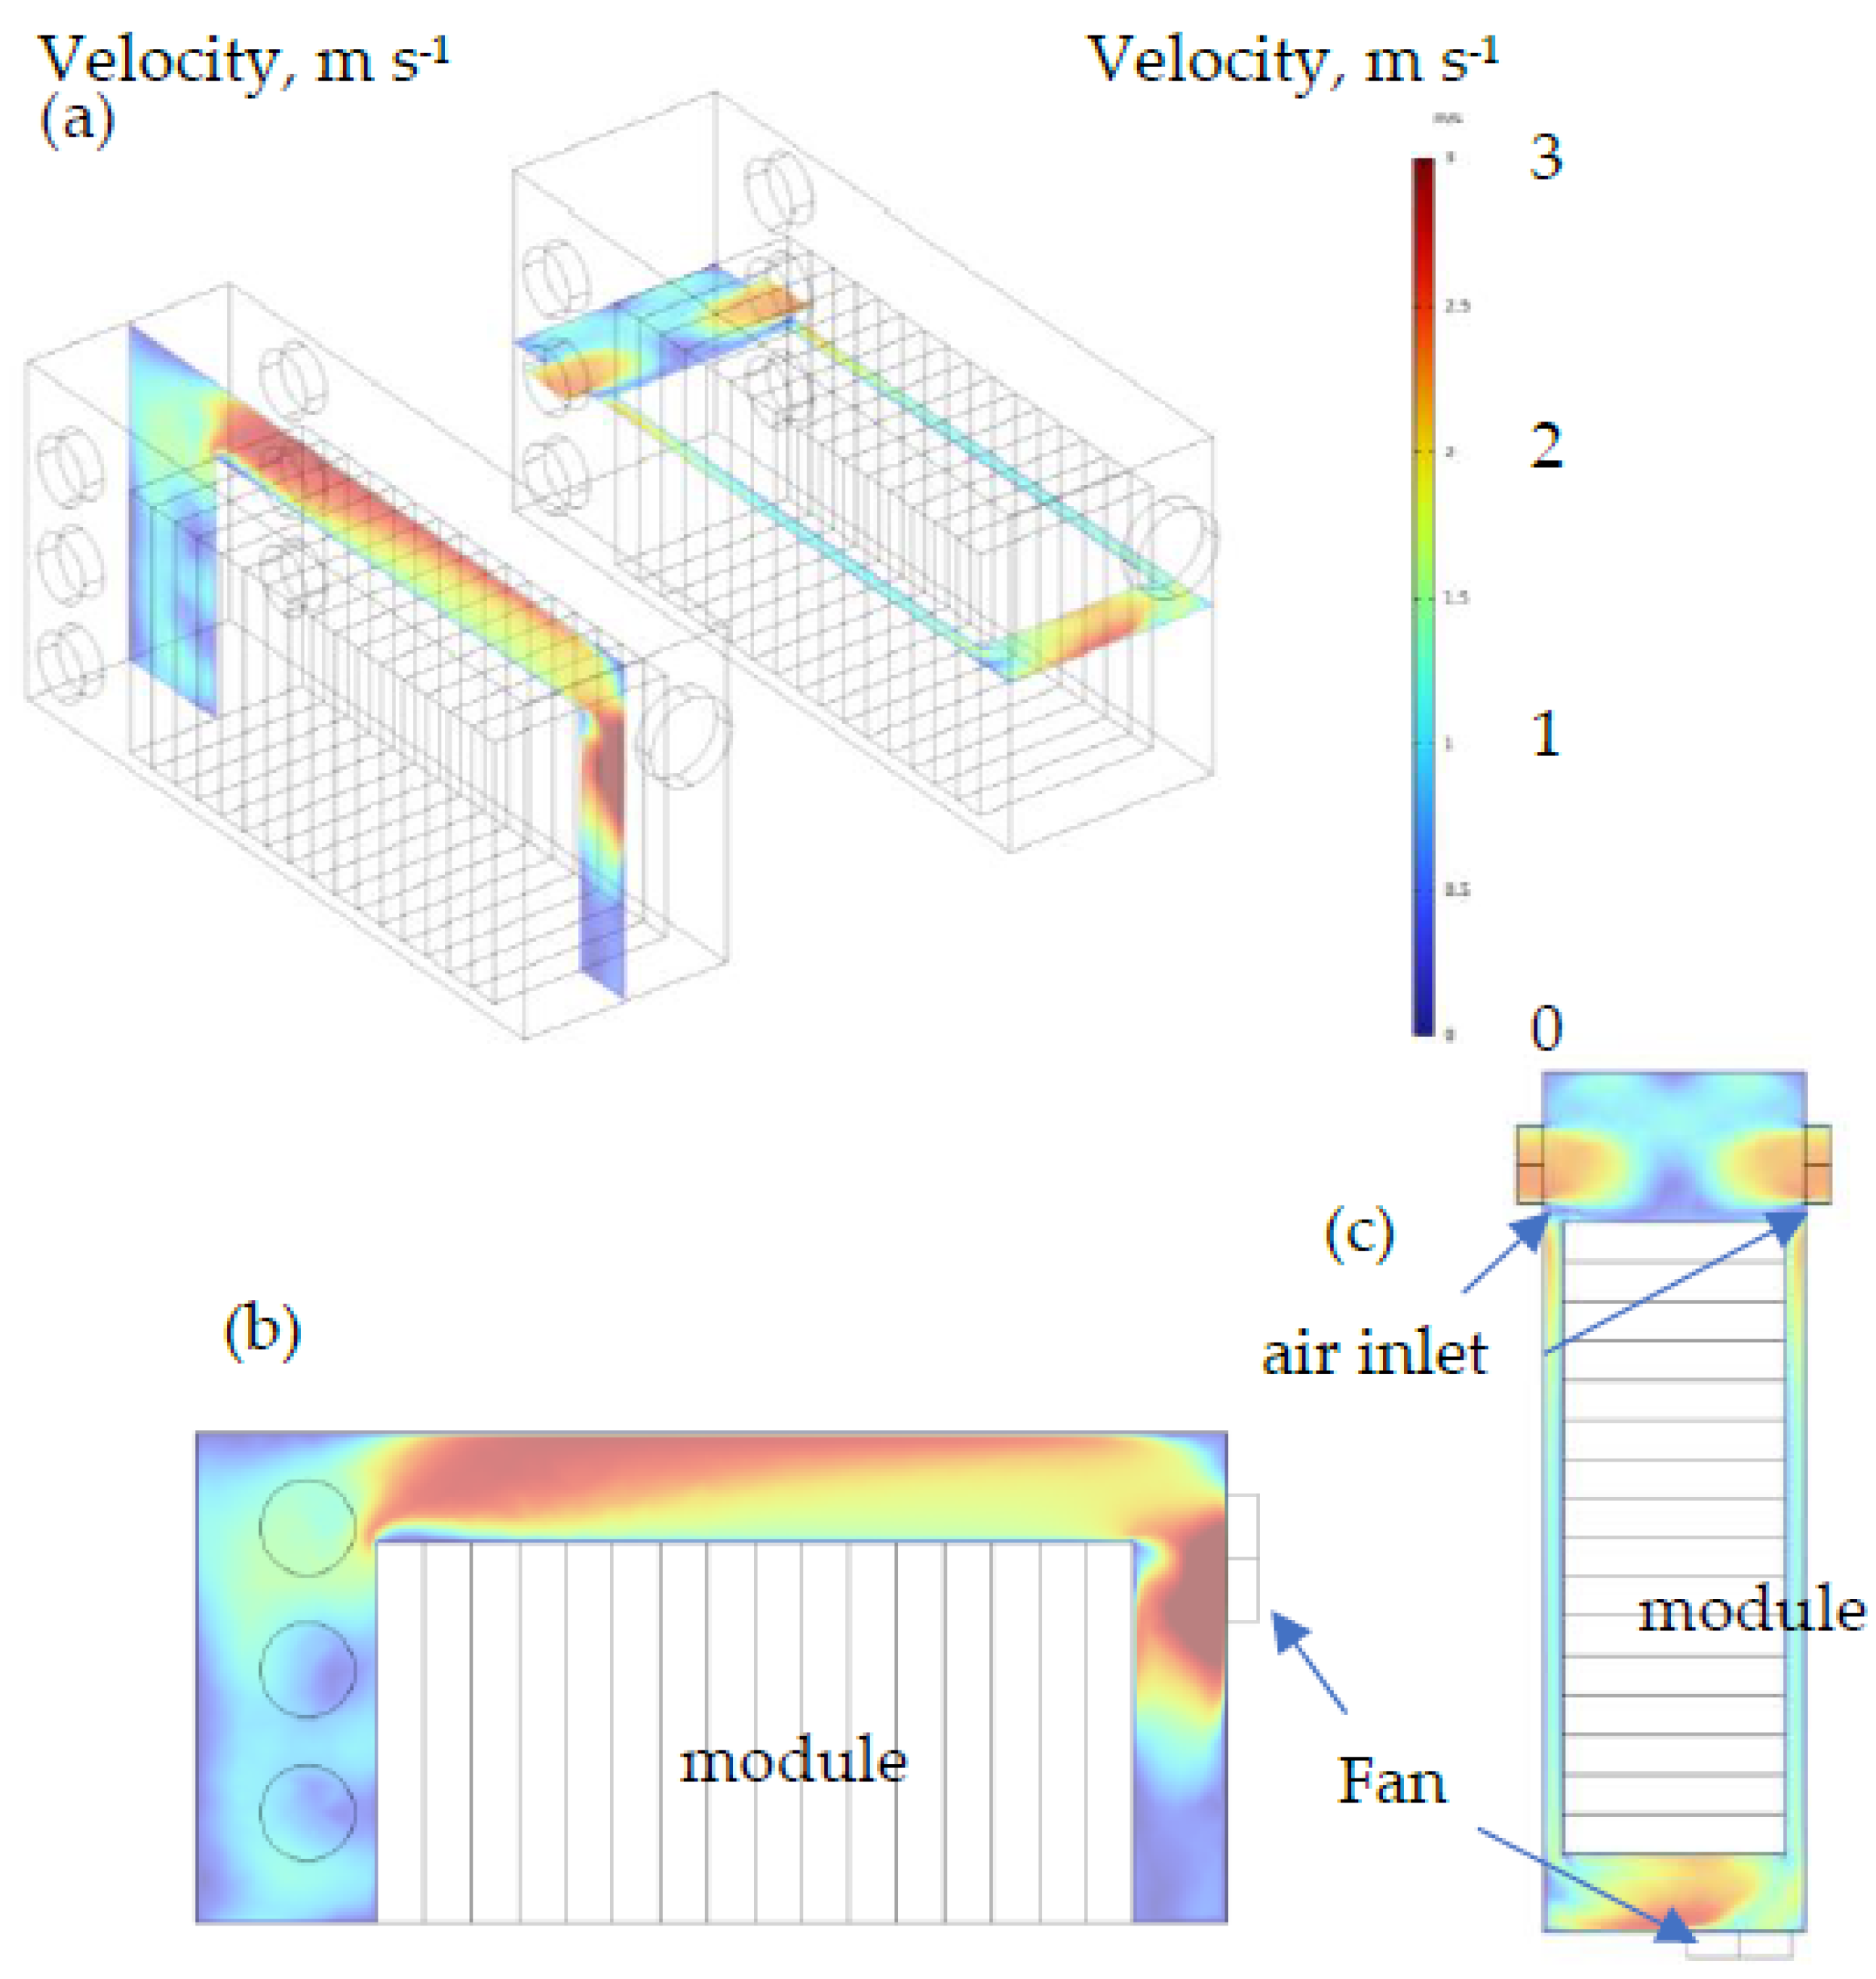
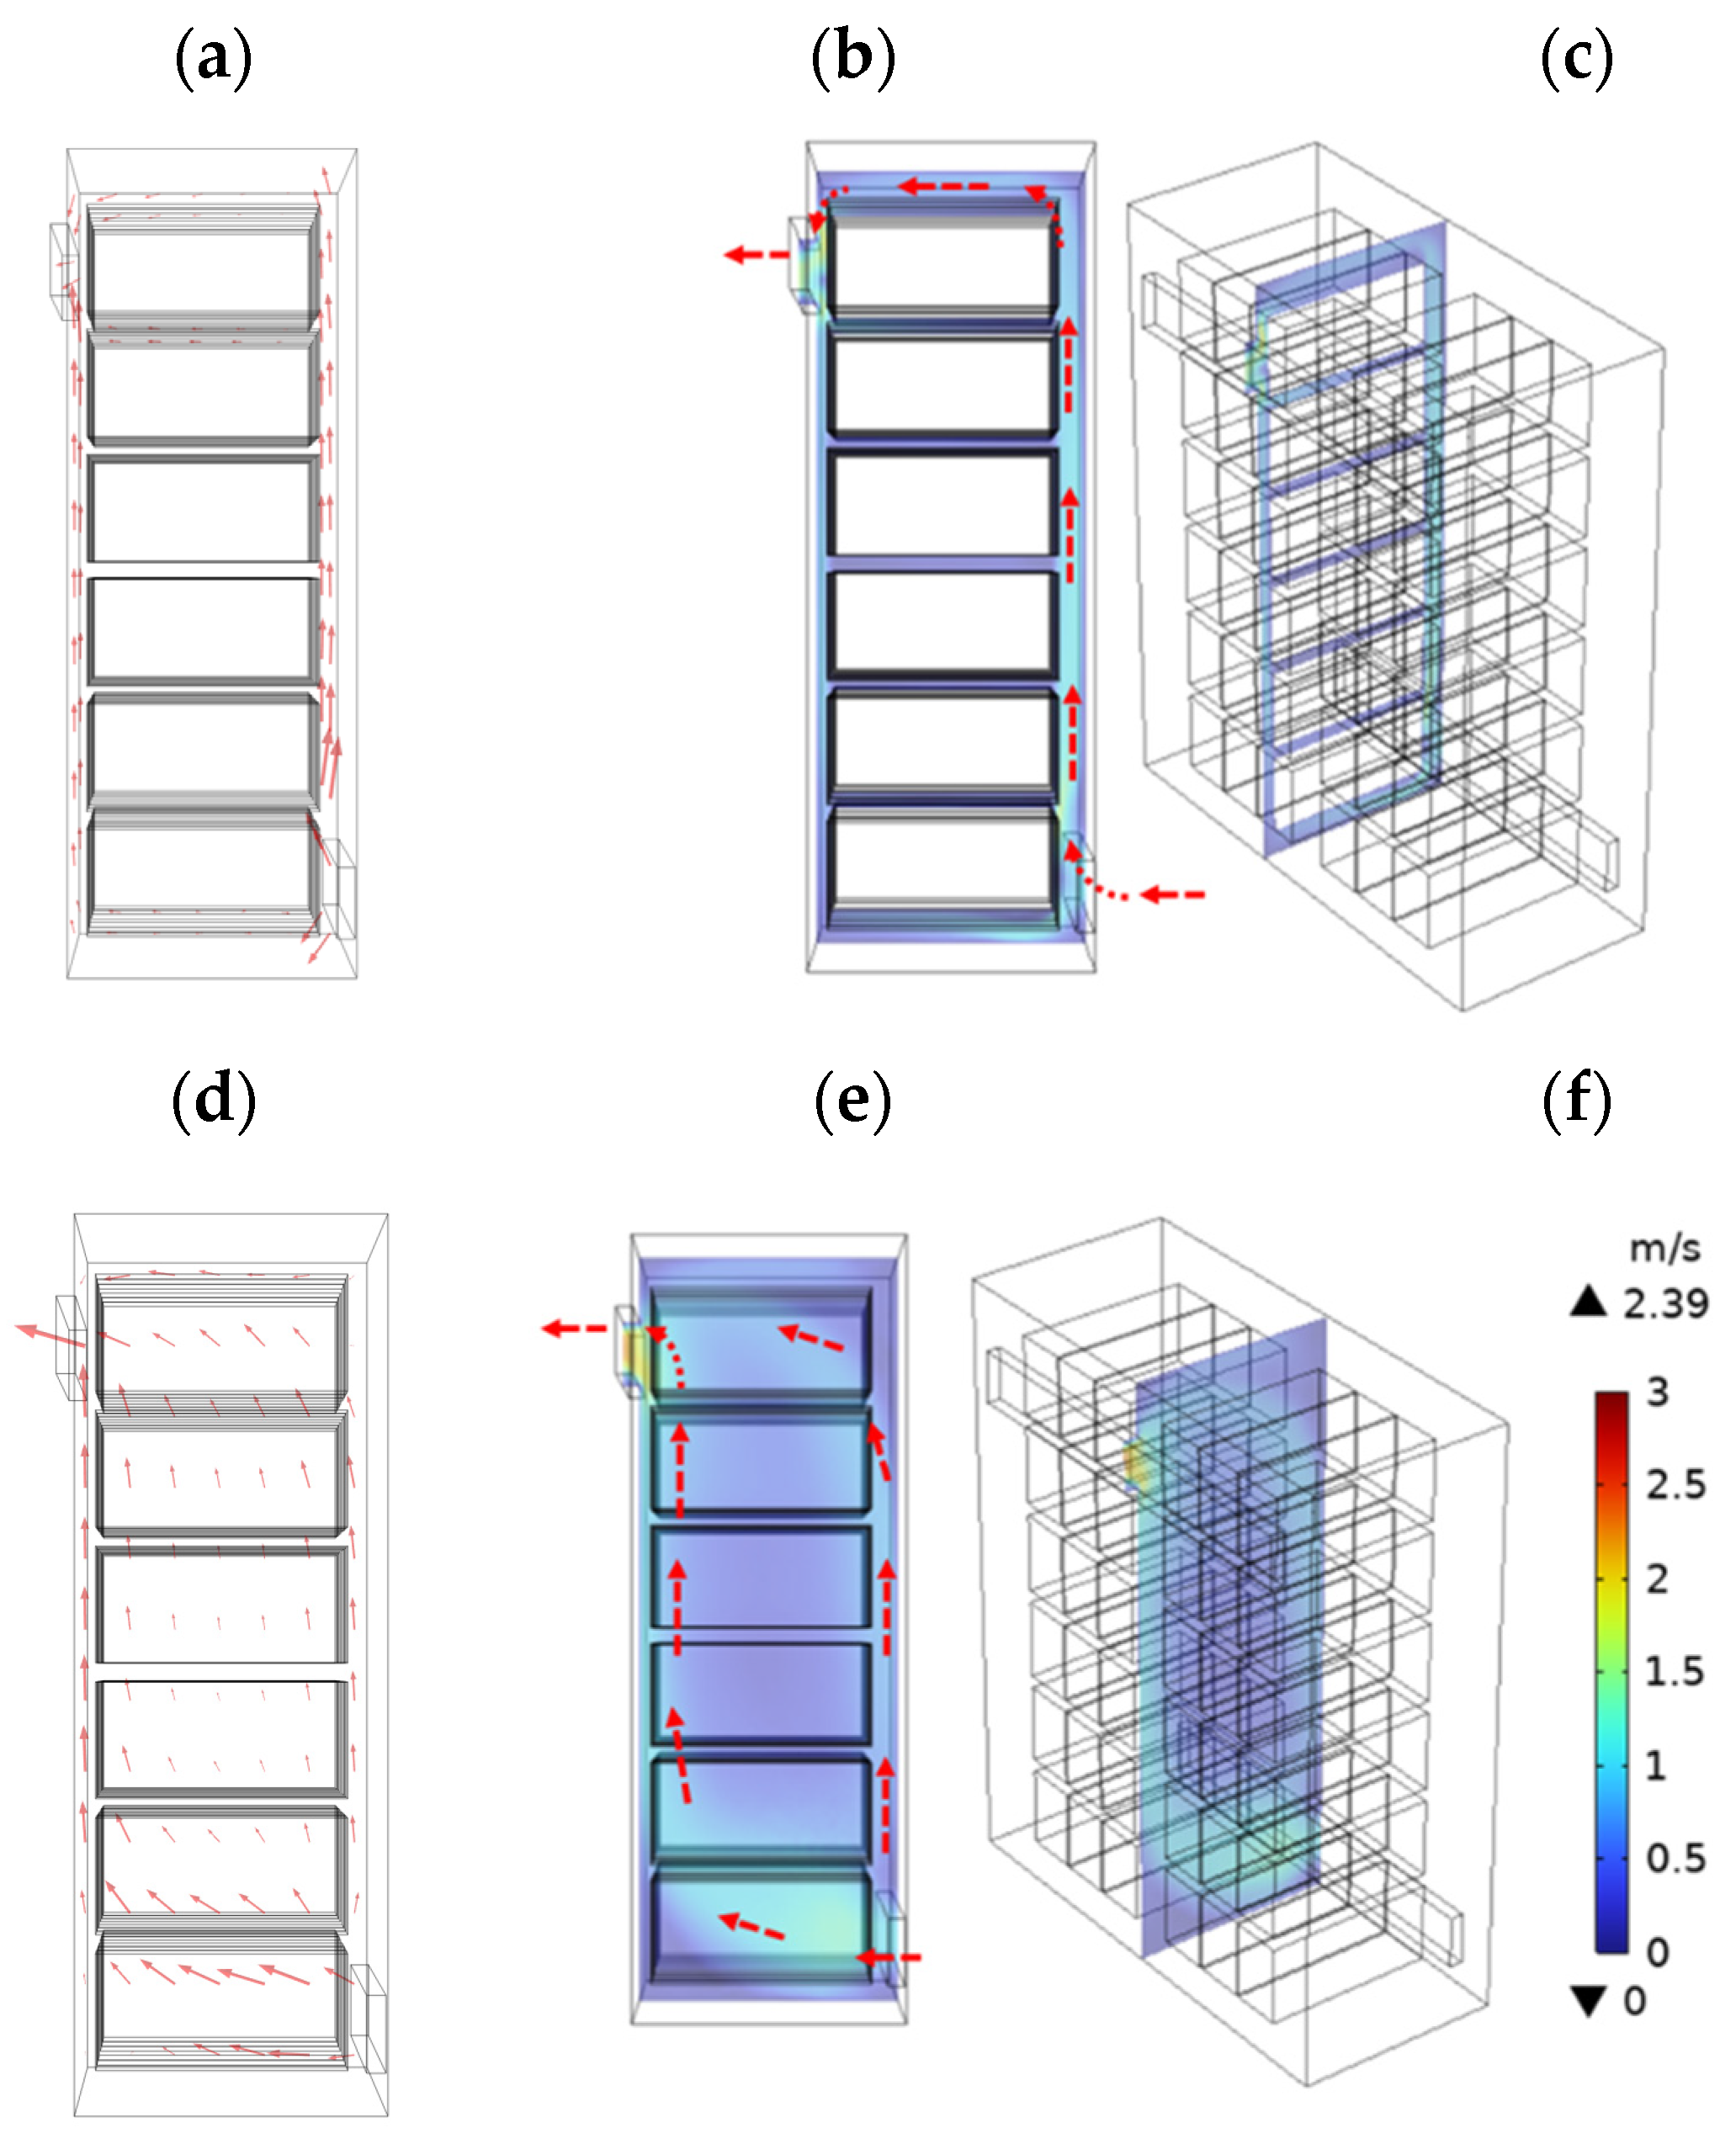
Figure 9 is the velocity distribution and flow direction of air in the cabinet of case 1. The velocity distribution and flow direction on two cross-sections are plotted on this figure. The flow conditions on a cross-section offset by 20 cm from the center of the cabinet are depicted on
Figure 9a-9c.
Figure 9a is an arrow plot of the air flow direction.
Figure 9b is color-coded velocity distribution of air flow. The relative position of the cross-section is depicted on
Figure 9c. The arrows show the direction of the main flow of air. As shown on
Figure 9a, the space between rack and the cabinet back wall is large. Main air flows through this space. Air flow among space between battery module is slow or nearly stagnant. The flow conditions on a cross-section at the center of the cabinet are depicted on
Figure 9d-9f.
Figure 9d is an arrow plot of the air flow direction.
Figure 9e is color-coded velocity distribution of air flow. The relative position of the cross-section is depicted on
Figure 9f. As shown on
Figure 9d and 9e, one stream of air flows through the space in the middle of the cabinet, and the other air stream flows through the space between the module and cabinet wall. Fast air flow is observed at the center and at the edges of both sides of the cabinet. At the front upper outlet, the maximum air velocity reaches 2.4 m s
-1. This is because there is a large space in the center and edge of the cabinet for air circulation. Air flow pattern inside the cabinet affects the temperature distribution inside the cabinet.
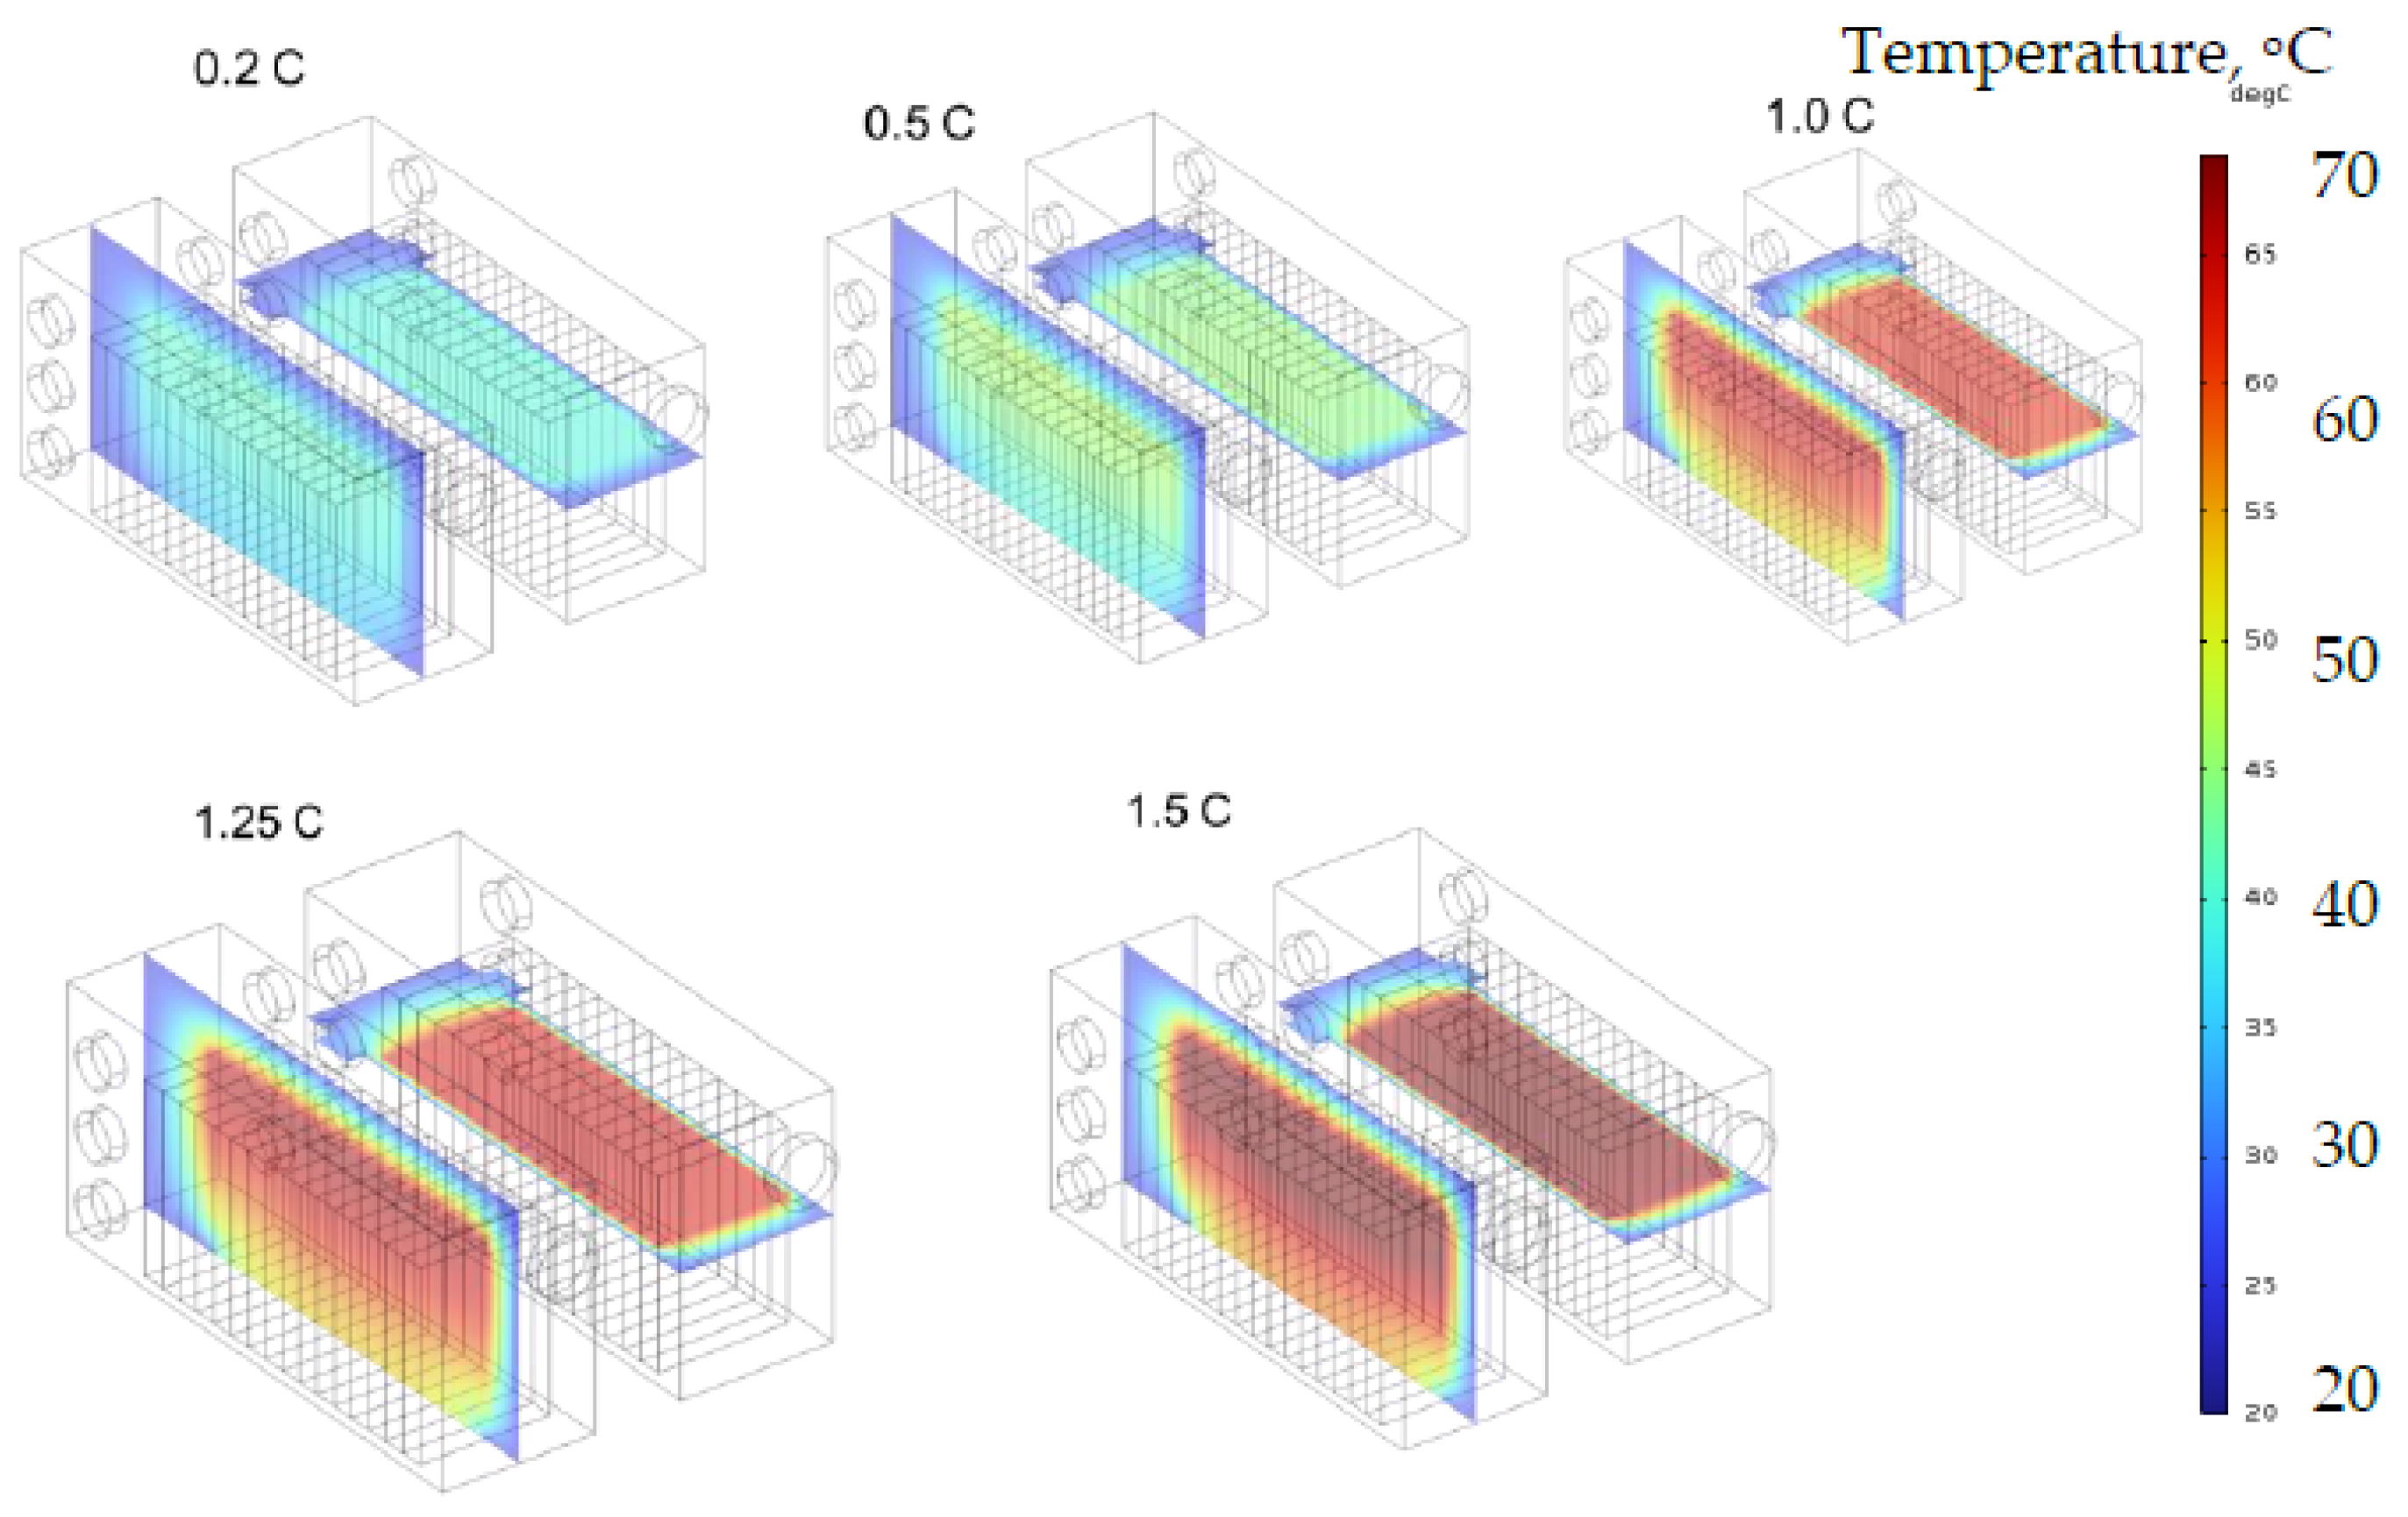
Figure 10a~10e are the temperature distribution inside the cabinet of case 1 where the temperature of the cabinet wall is assumed to be 25
oC. Cabinet maximum temperature experimentally measured at 0.2 C, 1.0 C, and 1.2 C were 38.5
oC, 60
oC, and 65
oC, respectively. Follow the correlation steps as mentioned in
Figure 2, the module heat generation rate density of discharging rate of 0.2 C, 0.5 C, 1.0 C, 1.25C, and 1.5 C is set to be Q = 20 W m
-3, 50 W m
-3, 100 W m
-3, 125 W m
-3, and 150 W m
-3, respectively. When discharging at 0.2 C (
Figure 10a), the battery temperature is not high and is below ~45
oC. The battery module on the lowest layer has the lowest temperature among others, which is due to the low-temperature air being sucked in from lower portion of the cabinet back side. When discharging at 0.5 C (
Figure 10b), the battery temperature is relatively high, but it is kept in the safe zone below ~55
oC. When discharging at 1.0 C (
Figure 10c), the temperature of the battery inside the container has risen to ~70
oC, and the temperature of the battery module on the bottom layer can still be maintained at ~60
oC. When discharging at 1.25 C (
Figure 10d), the temperature of the battery inside the container has exceeded ~80
oC, and the temperature of the battery module at the bottom layer has reached ~70
oC. The battery pack has entered the dangerous area of operating temperature. When charging and discharging at 1.5 C (
Figure 10e), the temperature of the battery inside the container has exceeded ~80
oC, and the battery has entered the dangerous zone of operating temperature.
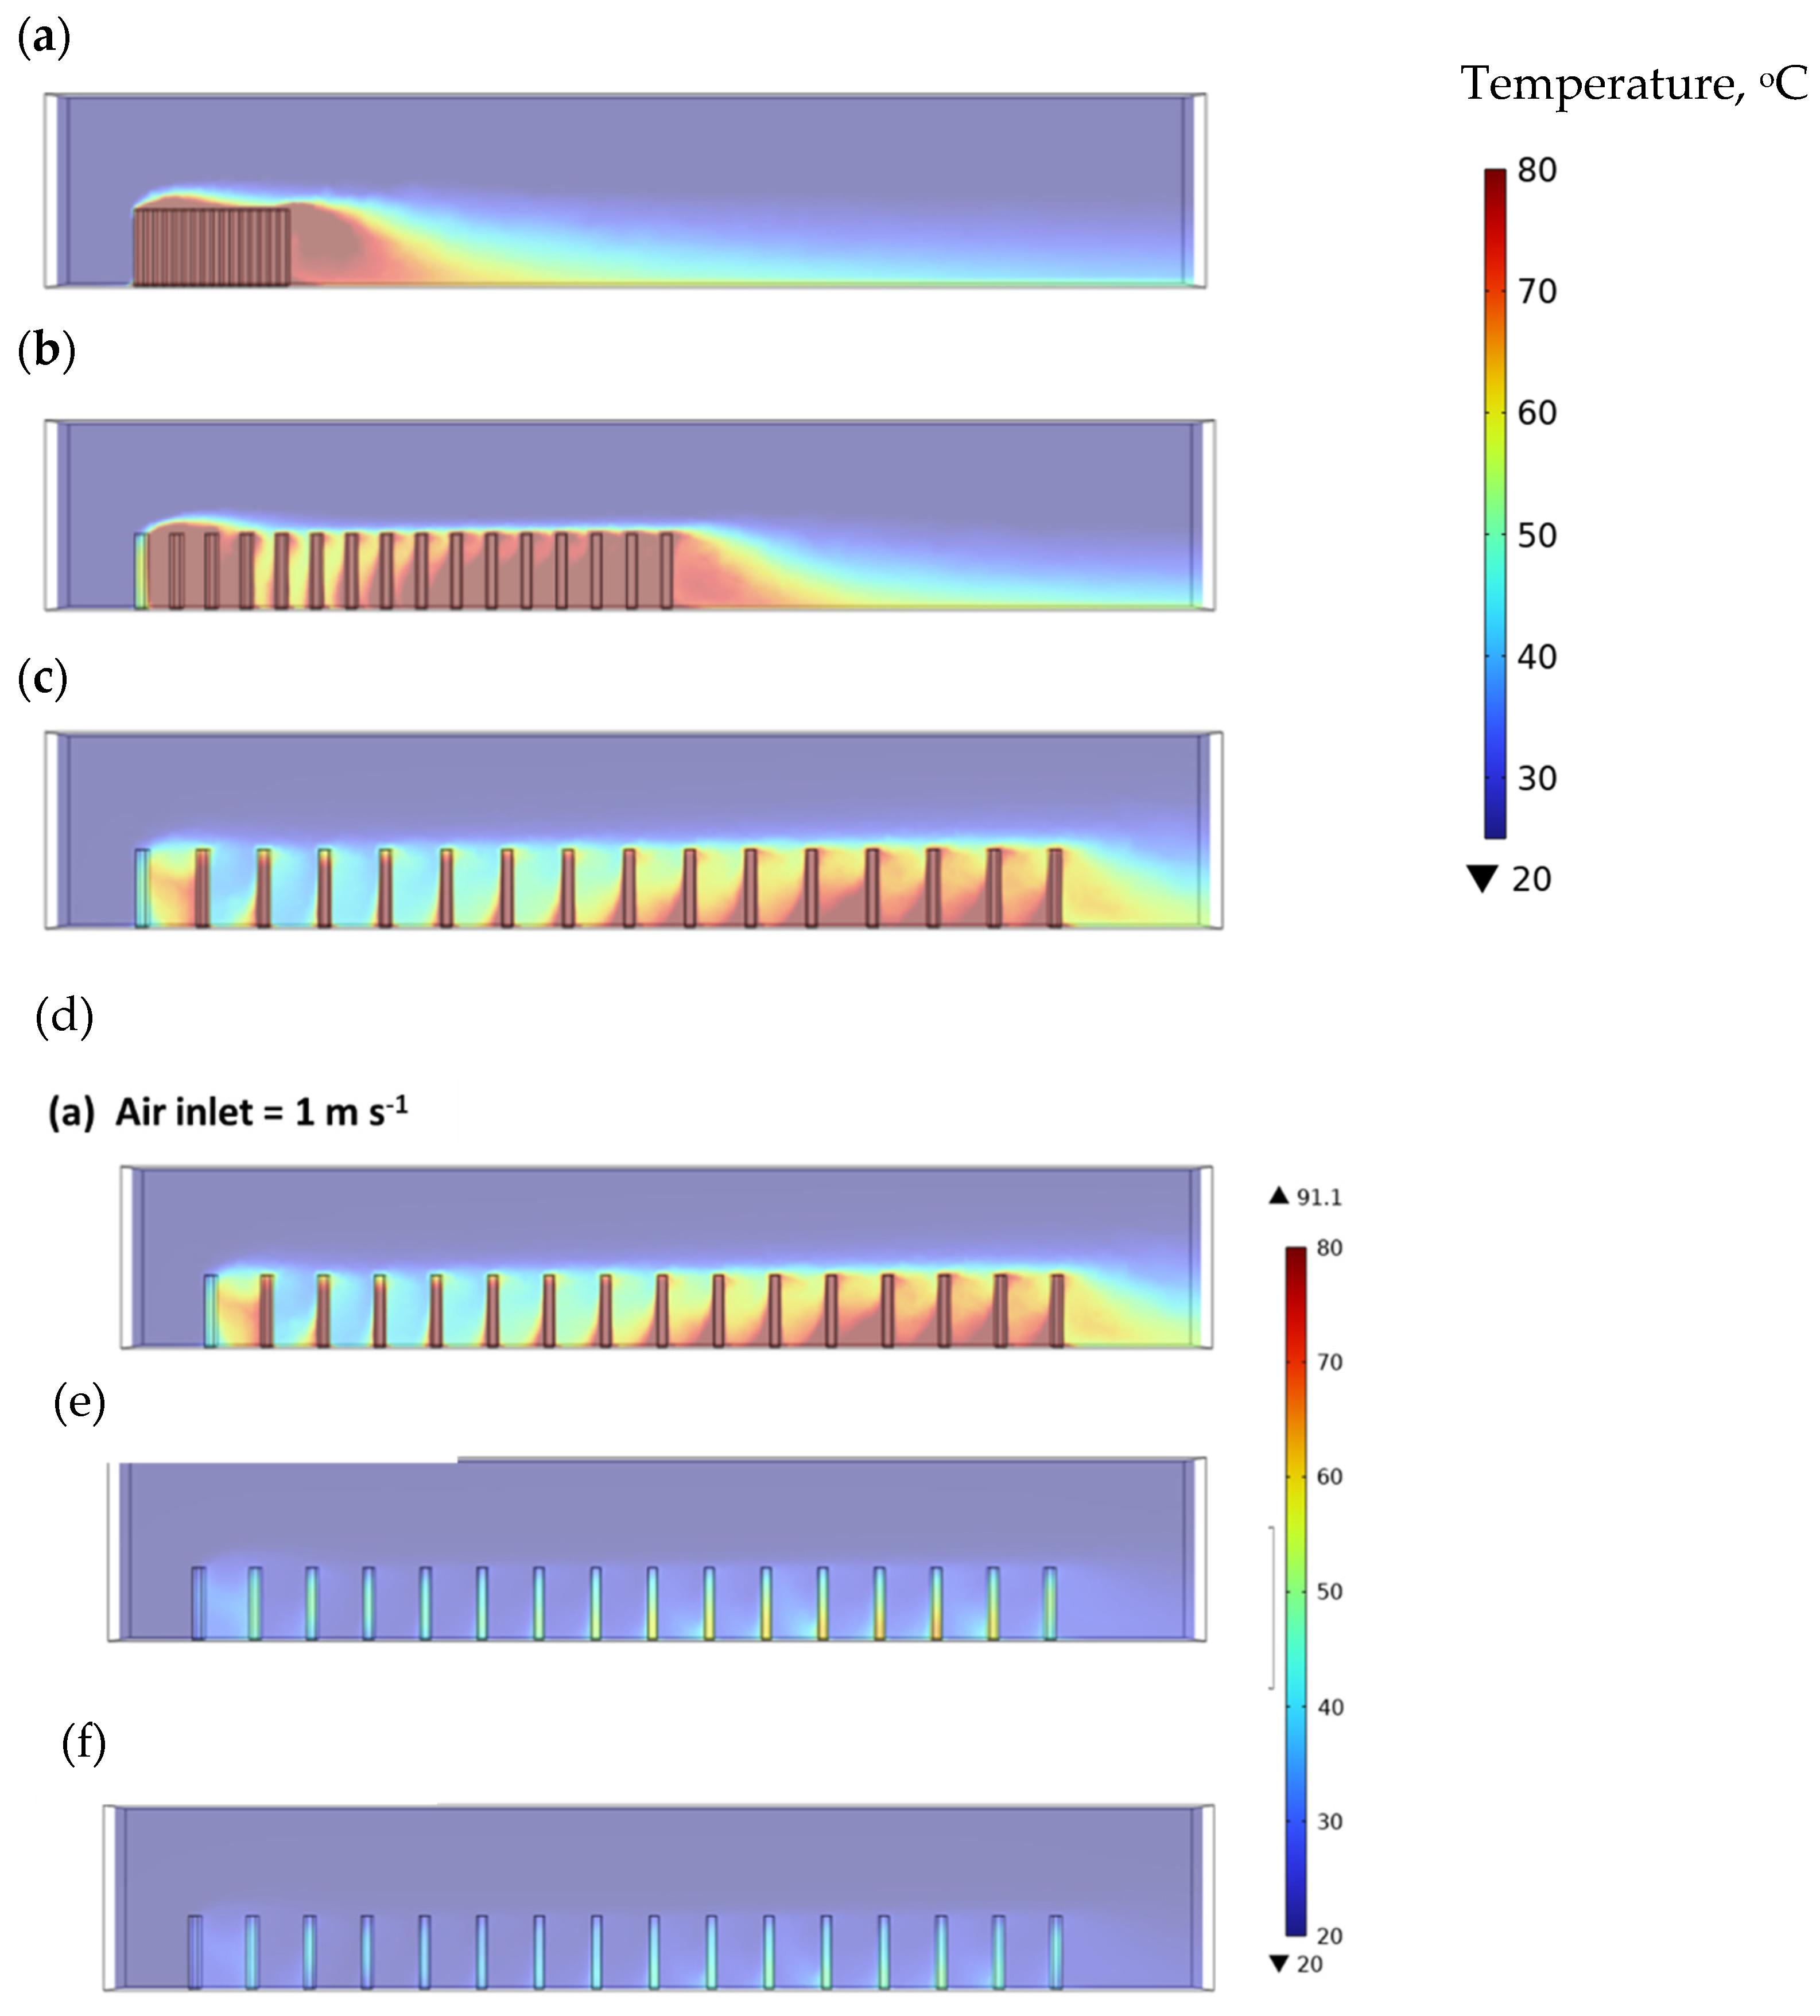
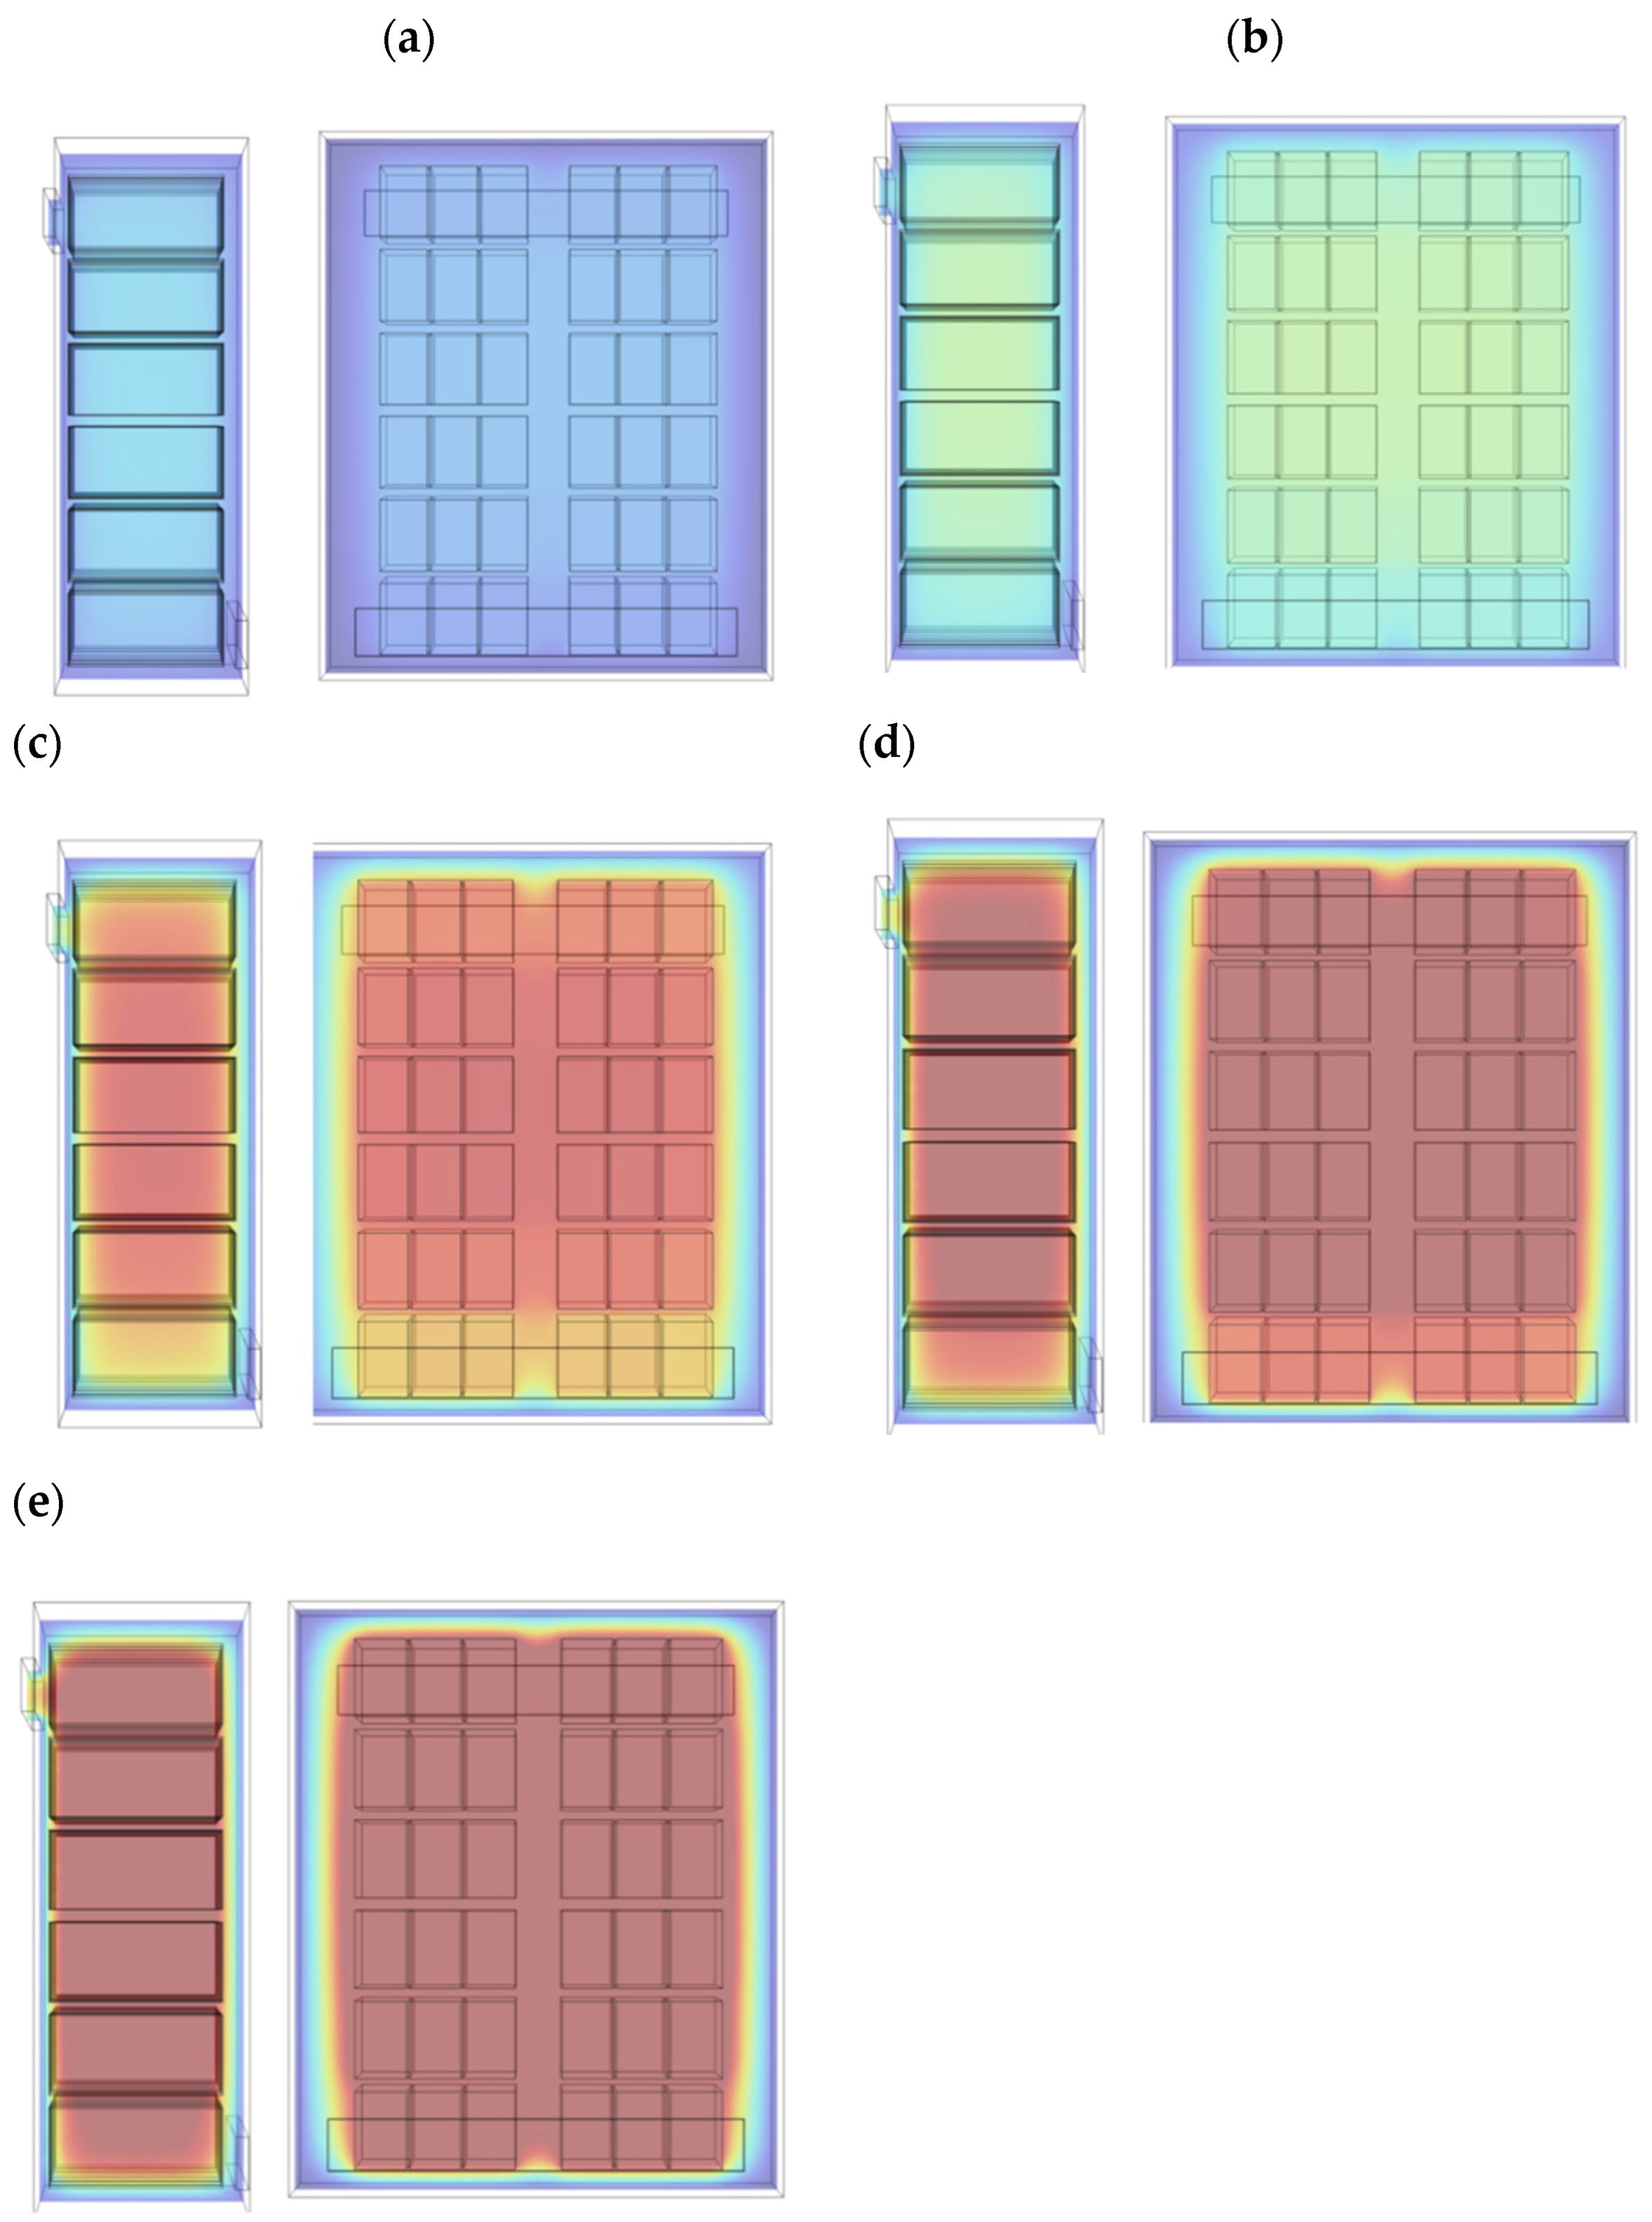
Figure 11a~11c are the temperature distribution inside the cabinet of cases 1, 2, and 3 (the temperature of the cabinet wall is 25
oC). In these cases, the cabinet are operated at a discharge rate of 1.0 C. Case 2 (
Figure 11b) has six horizontal air inlets at the rear of the cabinet and six horizontal air outlets at the front of the cabinet. Case 3 (Fig. 11c) has four longitudinal air inlets at the rear of the cabinet and four longitudinal air outlets at the front of the cabinet. These additional air inlets and outlets lowered the temperature of the pack somewhat; however, no significant temperature drop of the pack was observed.
The temperature distribution of pack in the cabinet of case 4 and 5 were also calculated. Narrow heat dissipation fins (7 cm x 2 cm x 171 cm) and wide heat dissipation fins (7 cm x 4 cm x 171 cm) are added to the cabinet outside back wall of case 4 and 5. The fins reduce the temperature inside the cabinet, especially the upper layer of pack; however, the effect is not significant. This may be because the cabinet wall temperature is set to 25oC. This makes the cooling fins less effective than expected.
4.5. Fluid dynamics of a pack with cylindrical cell modules
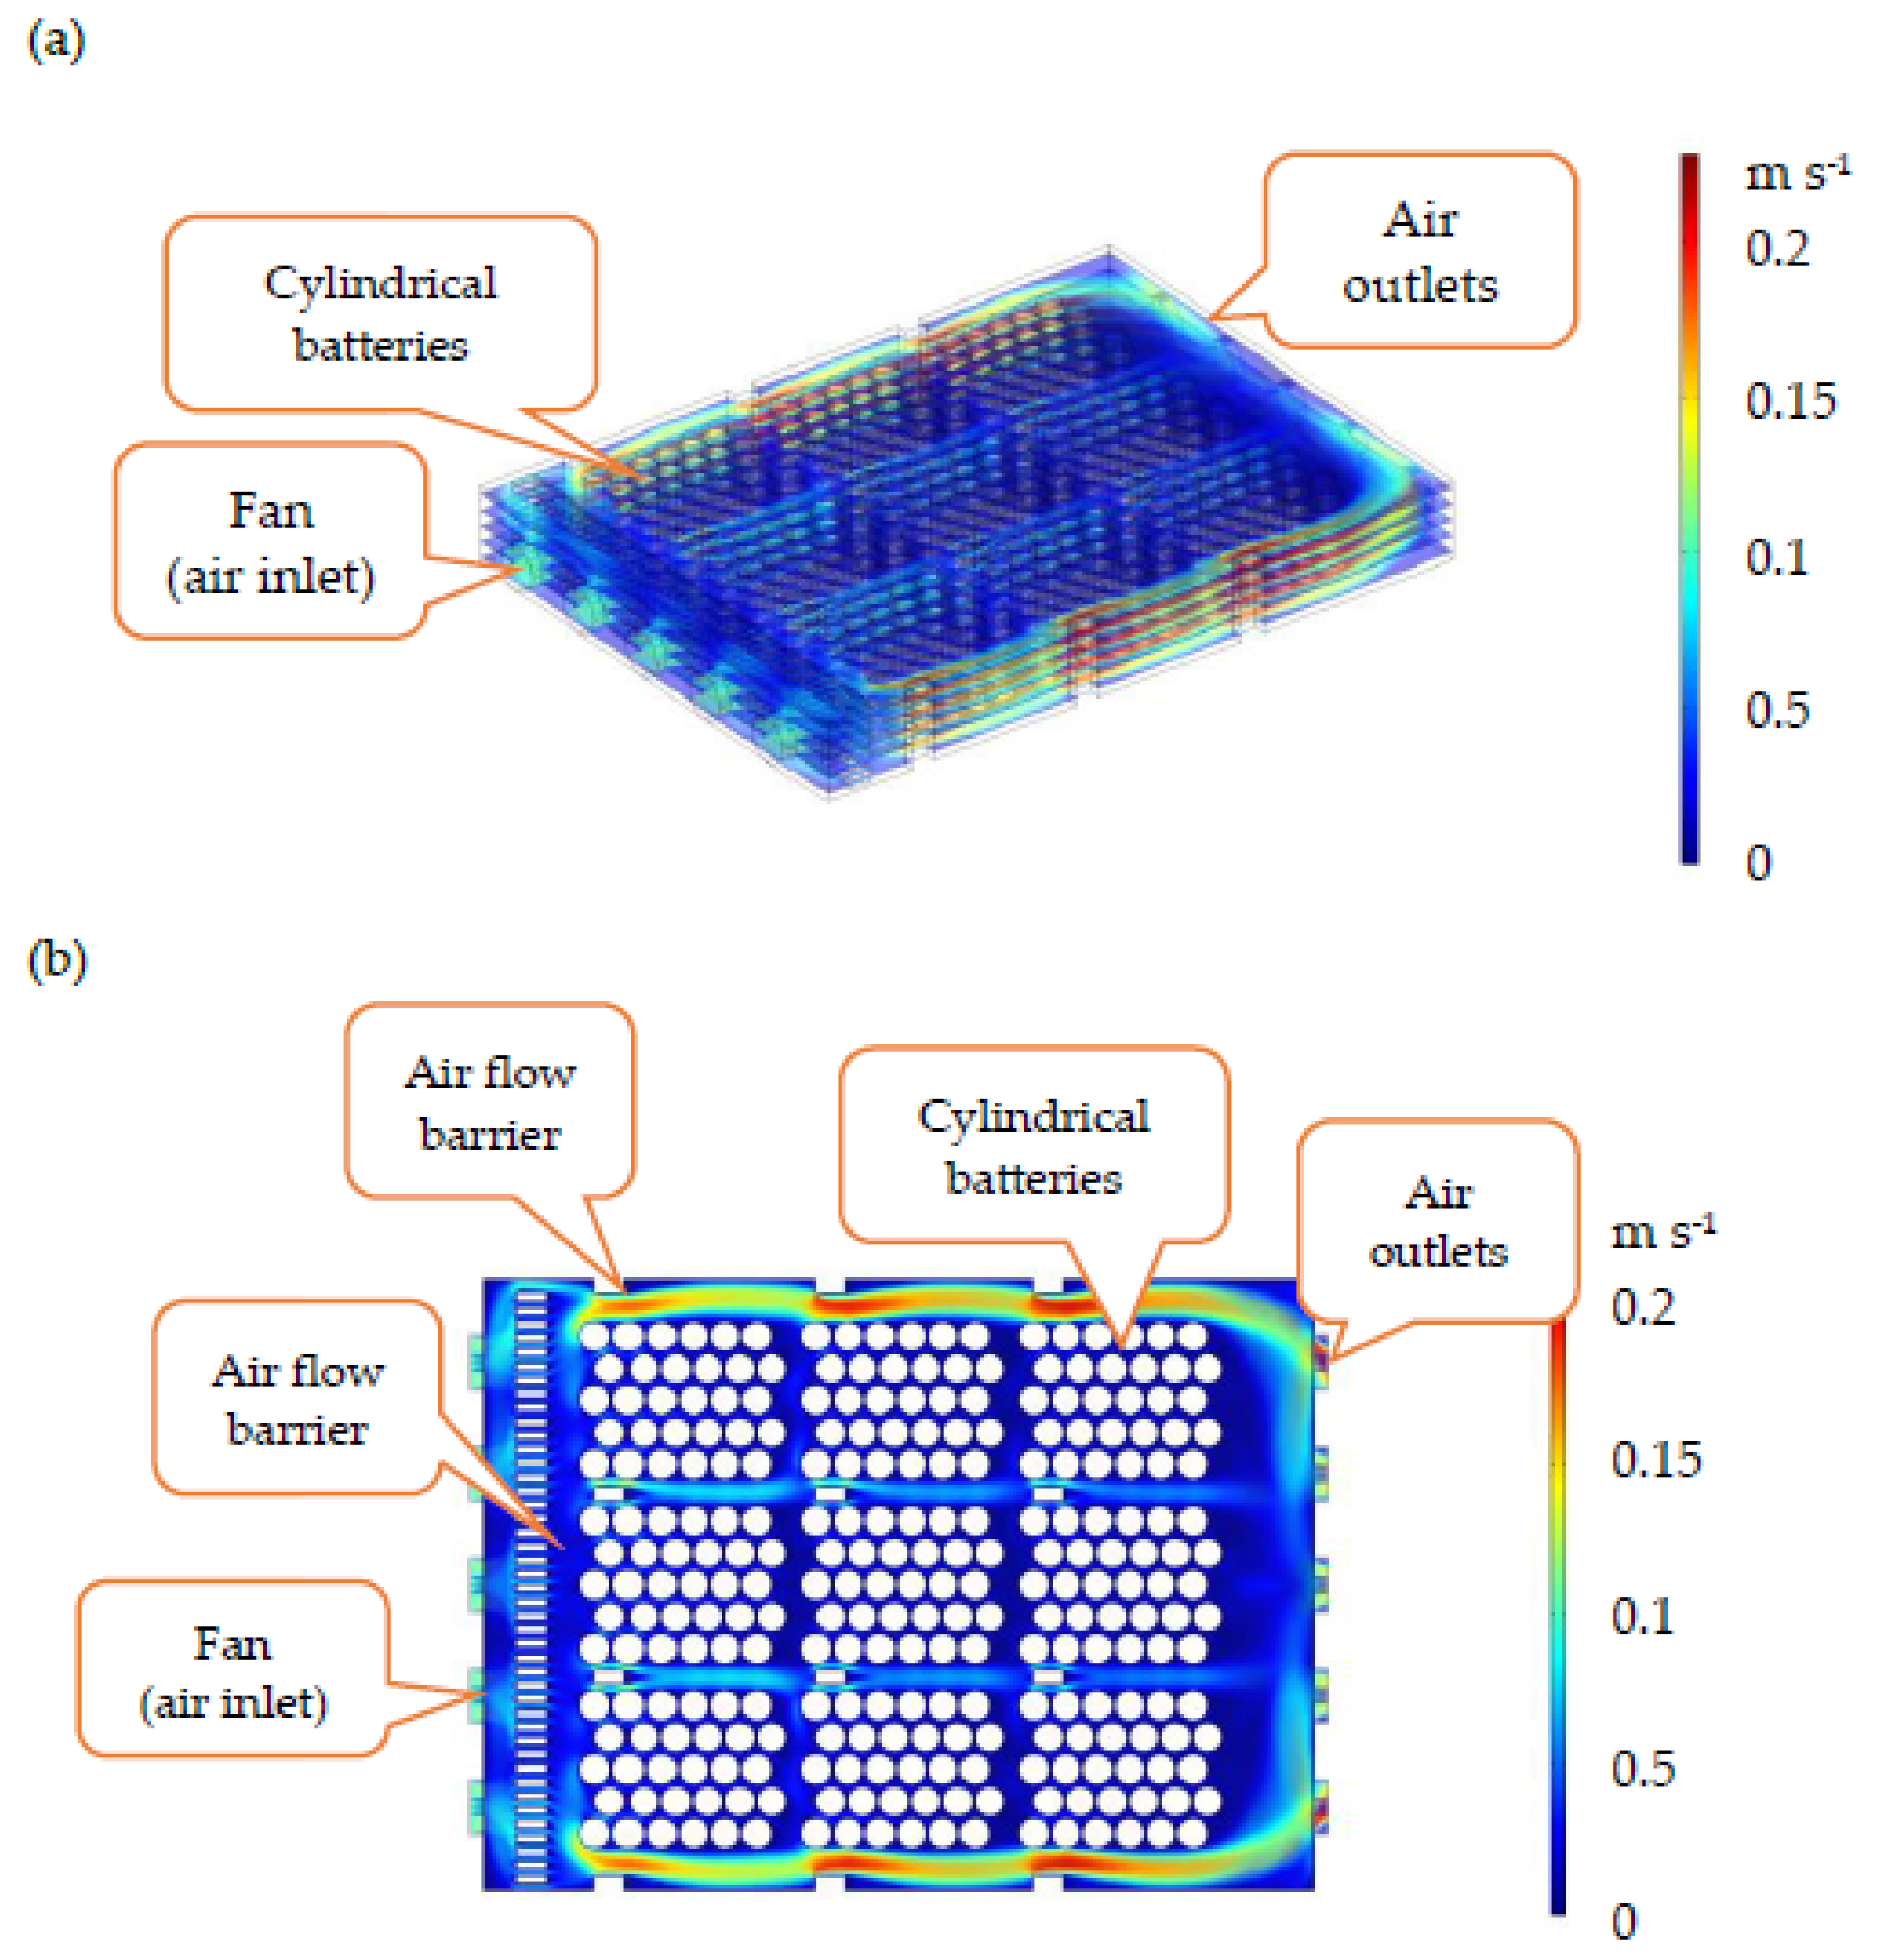
For comparison purpose, the fluid dynamics of alternate battery pack was also calculated. Cylindrical lithium-ion battery (21700, cell diameter 21 mm, height 70 mm) is used for the model. Each module contains 30 cells (6 x 5) and each pack contains 9 (3 x 3) modules as shown on
Figure 12. These cells are connected in series and the pack outputs 972 V (3.6 V x 30 x 9). Air intake through five fans which are located on the front surface of the pack. Air is exhaust through five outlets on the back side of the pack. Fan blow the air through a layer of flow distribution barrier and then enter the battery modules.
The velocity distribution inside the battery pack is also depicted on
Figure 12a (isometric view) and on
Figure 12b (top view). Air is distributed relatively uniform through a layer of flow distribution barrier. High air velocity is flow through the space between battery modules and space between the module and pack wall is observed due to low air flow resistance in these spaces. The air inside module or between the cells is relative still due to small gap between cells. Similar behavior is observed for cell spacing 2 mm or 4 mm apart. Additional flow barriers are installed at the space between modules and at space between module and pack wall. However, these are not effective at present outlay.
4.6. Effect of heat transfer medium on heat dissipation rate
An extremely high air flow rate is needed to carry heat generated from the battery as illustrated on
Figure 5. Due to compact cell arrangement and low electric energy consumption of fan, effective air cooling of battery from cell, module, pack, to cabinet is difficult. One of the reasons is due to low thermal conductivity of air (k
air) and low heat capacity (C
p,air). The heat transfer rate in laminar air flow region can be expressed in dimensionless form as following.
where the Nu
air, Re
air, Pr
air is the Nusselt number of air, Reyolds number of air, and Prandtl number of air. They are defined as following.
The
hair and
kair, are the heat transfer coefficient of air and the thermal conductivity of air. The L is the characteristic length (i.e., single cell length) and u is the air flow rate. The ρ
air, μ
air, and C
p,air are the air density, air viscosity, and air heat capacity. The heat transfer rate (
jair) is proportional to the battery heat transfer area (
Abattery) and temperature difference between the temperature at the battery surface (
Tbattery) and air temperature next to the battery surface (
Tair) as given by following equation.
The ratio of heat transfer rate of air to the heat transfer rate of water at the same Reynolds number and heat transfer area is given by equation [4].
Numbers given on equation [4] are approximated values. They are depending on pressure and temperature. The heat transfer ratio of air to water is about 0.019. This suggested that the heat transfer rate of air is about 1.9% of the heat transfer rate of water. The water has better heat transfer capability than air. For comparison, Temperature distribution of water cooling of case 1 cabinet at U = 1 m s
-1 and 0.1 m s
-1 are given on
Figure 11d and 11e, respectively. The module temperature is drop to 35
oC below. However, immerse battery in water has the risk of electric shortage and leakage problem.
5. Conclusions
In this study, the fluid dynamics and heat transfer phenomena are analyzed and calculated for (1) a single cell, (2) a module with 16 single cells, (3) a pack with 16-cell module, (4) a cabinet containing 2 racks and 18 packs for each rack. The air inlet flow rate condition in most cases is 1 m s--1. The simulation results show that:
(1) The single cell temperature is reduced as the air flow rate increased. The cell needs to face the air flow to have a relatively uniform temperature distribution, and the air blowing to the battery at an angle will make the temperature distribution at both ends of the cell uneven.
(2) For a module containing 16 cells, the gap between cell does not make the cells inside the module to have better heat dissipation, and cells in the middle of the module still have a relatively high temperature. High air flow rate with cell far apart did cool off the module.
(3) The outside surface of the pack plays an important role in the heat dissipation of the pack. Due to small internal space of the pack, the air flow only carries out part of the heat generated by the module. If the surrounding provides good cooling mechanism, a good thermally conductive enclosure of the pack is a very important design consideration to ensure good heat dissipation and operation at a relatively high C-rate.
(4) The space in the battery cabinet is also very limited, and no other heat dissipation design can be done. Current heat dissipation design changes for battery cabinet are mainly placed on the outside of the cabinet. Additional air inlets and outlets can be opened, so that the temperature of the pack can be lowered; but the simulation results did not observe a significant temperature drop of the pack. In addition, installing fins on the outside of the battery cabinet can slightly reduce the internal temperature of the cabinet; but the effect is not significant. These results may be because the cabinet outside surface temperature is set to 25oC in the model, which makes the heat dissipation fins ineffective.
(5) Air is poor heat transfer medium as compared to water or other liquid. However, electric shortage may be a potential risk of water cooling.
If battery for electric vehicles need to meet the constrain of high C-rate charge and discharge, water cooling or refrigerant cycle design can be adopted to increase the heat dissipation rate. In addition, heat pipe technology can remove a large amount of heat in a small space; however, these methods will greatly increase the complexity and cost of the cabinet,
6. Patents
No patent is filed.
Supplementary Materials
No addition materials.
Author Contributions
This modeling work was carried out at National United University (NUU). The model setup, calculation, and analysis were done by Prof. Hsueh (NUU). He also wrote the first draft of this article. Dr. Sung (TRI), Dr. Teng (ITRI), and Dr. Huang (ITRI) measured, analyzed, and provided the temperature distribution data of single cell and pack. The specification, basic layout, and technical support of cell, module, pack, cabinet were provided by Dr. Wu (FEII). Prof. Lu contributed on the literature survey, proofreading, and administrative work throughout this project.
Funding
Dr. Wu would like to thank the Energy Administration, Ministry of Economic Affairs, R.O.C. for the financial support (Contract No. 110-D0711, 112-D0113, 113-D0113) to Formosa Electronics Industrial Inc. and Formosa Electronics Industrial Inc. for their experimental measurement of the pack and cabinet and for demonstration.
Data Availability Statement
We encourage all authors of articles published in MDPI journals to share their research data. In this section, please provide details regarding where data supporting reported results can be found, including links to publicly archived datasets analyzed or generated during the study. Where no new data were created, or where data is unavailable due to privacy or ethical restrictions, a statement is still required. Suggested Data Availability Statements are available in section “MDPI Research Data Policies” at
https://www.mdpi.com/ethics.
Acknowledgments
This research report is jointly completed by Prof. Hsueh and Prof. Lu from the National United University, Dr. Sung, Dr. Teng, and Dr. Huang from the Green Energy Research Laboratories of ITRI, Dr. Wu from Formosa Electronics Industrial Inc. Part of the research results had been published as a poster on the “International Symposium on Electrochemical Energy Storage of Advanced Li-ion Batteries and Hydrogen Fuel Cells” Taiwan and on the "Journal of Solar Energy and New Energy 2022", Taiwan in Chinese.
Conflicts of Interest
The authors declare no conflict of interest.
References
- Feng, X.; Ouyang, M.; Liu, X.; Lu, L.; Xia, Y.; He, X. Thermal runaway mechanism of lithium-ion battery for electric vehicles: A review, Energy Storage Materials 2018, 10, 246-267. [CrossRef]
- Ramadesigan, V.; Northrop, P. W.; Santhanagopalan, S. De S.; Braatz, R. D.; Subramanian, V. R. Modeling and simulation of lithium-ion batteries from a systems engineering perspective. J. Electrochemical Society 2012, 159, R31–R45. [Google Scholar] [CrossRef]
- Ye, J. N.; Wang, Q. S. Thermal behavior and failure mechanism of lithium-ion cells during overcharge under adiabatic conditions. Applied Energy 2016, 182, 464–474. [Google Scholar] [CrossRef]
- Zhao, W.; Wang, C.Y. Modeling internal shorting process in large-format Li-ion cells, J. Electrochemical Society 2015, 162, A1352–A1364. [Google Scholar] [CrossRef]
- Huang, P.F.; Li, K.; Chen, H.D.; Wang, Q. S.; Wen, J.; Sun, J. H. Experimental and modeling analysis of thermal runaway propagation over the large format energy storage battery module with Li4Ti5O12 anode, Applied Energy 2016, 183, 659-673. [CrossRef]
- Meng, X.D.; Zhang, M. J.; Gao, F. , Liu, Y. J.; Duan, Q., L.; and Wang, Q., S. Experimental study on combustion behavior and fire extinguishing of lithium iron phosphate battery. J. Energy Storage 2020, 30, 101532. [Google Scholar] [CrossRef]
- Wang, Q. S.; Stoliarov, S. I.; Sun, J. H.; and More, S. A review of lithium-ion battery failure mechanisms and fire prevention strategies, Progress in Energy and Combustion Science 2019, 73, 95-131. [CrossRef]
- Chen, Y.; Kang, Y.; Zhao, Y.; Wang, L.; Liu, J; Li, Y.; Liang, Z.; He, X.; Li, X.; Tavajohi, N.; Li, B. A review of lithium-ion battery safety concerns: The issues, strategies, and testing standards, J. Energy Chemistry 2021, 59, 83-99. [CrossRef]
- Feng, X.; Ren, D.; He, X.; and Ouyang, M. Mitigating thermal runaway of lithium-ion batteries, Joule 2020, 4, 743-770. [CrossRef]
- Hsueh, K-L., Lu, C-T., Sung, L-Y., Wu, D., Yang, P-Y. Heat dissipation modeling of lithium-ion battery module, J. Solar and New Energy 2022, 24(2). 9-13 (in Chinese).
- Feng, X.; He, X.; Ouyang, M.; Lu, L.; Wu, P.; Kulp, C.; Prasser, S. Thermal runaway propagation model for designing a safer battery pack with 25 Ah LiNixCoyMnzO2 large format lithium ion battery. Appl. Energy 2015, 154, 74–91. [Google Scholar] [CrossRef]
- Zhai, H.; Li, H.; Ping, P.; Huang, Z.; Wang, Q. An experimental-based Domino prediction model of thermal runaway propagation in 18,650 lithium-ion battery modules. Int. j. heat mass transf. 2021, 181, 122024. [Google Scholar] [CrossRef]
- Chen,M.; Sun,Q.; Li, Y.; Wu, K.; Liu, R.; Peng, P.; Wang, Q. A Thermal Runaway Simulation on a Lithium Titanate Battery and the Battery Module. Energies 2015, 8, 490–500. [CrossRef]
- Melcher, A.; Ziebert, C.; Rohde, M.; Seifert, H. J. Modeling and Simulation of the Thermal Runaway Behavior of Cylindrical Li-Ion Cells-Computing of Critical Parameters. Energies 2016, 9, 292. [Google Scholar] [CrossRef]
- Sun, Q.; Wang, Q.; Zhao, X.; Sun, J.; Lin, Z. Numerical study on lithium titanate battery thermal response under adiabatic condition. Energy Convers. Manag. 2015, 92, 184–193. [Google Scholar] [CrossRef]
- Jaguemont, J.; Omar, N.; Martel, F.; Bossche, P. V. D.; Mierlo, J. V. Streamline three-dimensional thermal model of a lithium titanate pouch cell battery in extreme temperature conditions with module simulation. J. Power Sources 2017, 367, 24–33. [Google Scholar] [CrossRef]
- Coman, P. T.; Darcy, E.C.; White, R. E. Simplified Thermal Runaway Model for Assisting the Design of a Novel Safe Li-Ion Battery Pack. J. Electrochem. Soc. 2022, 169, 040516. [Google Scholar] [CrossRef]
- Hatchard, T. D.; MacNeil, D. D.; Basu, A.; Dahnd J. R. Thermal Model of Cylindrical and Prismatic Lithium-Ion Cells. J. Electrochem. Soc. 2001, 148, A755–A761. [CrossRef]
- He, Y.; He, R.;Guo, B.; Zhang, Z.; Yang,S.; Liu, X.; Zhao, X.; Pan, Y.; Yan, X.; Shen Li, S. Modeling of Dynamic Hysteresis Characters for the Lithium-Ion Battery. J. Electrochem. Soc. 2020, 167, 090532. [CrossRef]
- Kim, J.; Mallarapu, A.; Santhanagopalan, S. Transport Processes in a Li-ion Cell during an Internal Short-Circuit. J. Electrochem. Soc. 2020, 167, 090554. [Google Scholar] [CrossRef]
- Kostetzer, L.; Nebl, C.; Stich, M.; Bund, A.; Schweiger, H. G. Physics-Based Modeling and Parameter Identification for Lithium Ion Batteries Under High Current Discharge Conditions. J. Electrochem. Soc. 2020, 167, 140549. [Google Scholar] [CrossRef]
- Pang, M. -C.;Wei, Y.;Wang, H.; Marinescu, M.; Yan, Y.; Offer, G. J. Large-Format Bipolar and Parallel Solid-State Lithium-Metal Cell Stacks: A Thermally Coupled Model-Based Comparative Study. J. Electrochem. Soc. 2021, 167, 160555. [CrossRef]
- Yin, Y.; Bi, Y.; Hu, Y.; Choez, S.-Y. Optimal Fast Charging Method for a Large-Format Lithium-Ion Battery Based on Nonlinear Model Predictive Control and Reduced Order Electrochemical Model. J. Electrochem. Soc. 2021, 167, 160559. [Google Scholar] [CrossRef]
- Yamanaka, T.; Takagishi, Y.; Yamaue, Y. An Electrochemical-Thermal Model for Lithium-Ion Battery Packs during Driving of Battery Electric Vehicles. J. Electrochem. Soc. 2021, 168, 050545. [Google Scholar] [CrossRef]
Figure 1.
Pack(a) and cabinet(b) geometry and components used in this study.
Figure 1.
Pack(a) and cabinet(b) geometry and components used in this study.
Figure 2.
(a)Plot of the measured air temperature at the fan exit of a pack against the cell discharging C-rates. (b) Plot of the calculated air temperature at the fan exit of a pack against the heat generation rate density value used in calculation.
Figure 2.
(a)Plot of the measured air temperature at the fan exit of a pack against the cell discharging C-rates. (b) Plot of the calculated air temperature at the fan exit of a pack against the heat generation rate density value used in calculation.
Figure 3.
At inlet air flow rate of 1 m s-1 with Q value of 1 × 10⁵ W m-3, (a) Flow velocity distribution and flow direction, (b) top view of the temperature distribution of a single cell. (c) top view of the temperature gradient around a single cell. At Q = 5 × 10⁴ W m-3, the side view of the temperature distribution of a single cell at different flow velocities, (d) at U = 0.1 m s-1, (e) U = 0.3 m s-1, (f) U = 2.0 m s-1, (g) U = 5.0 m s-1.
Figure 4.
The temperature distribution of single cell when the direction of air flow is at different angle. (a)30o, (b) 45o, (c)60o, (d)90o.
Figure 4.
The temperature distribution of single cell when the direction of air flow is at different angle. (a)30o, (b) 45o, (c)60o, (d)90o.
Figure 5.
The module temperature distribution at Q = 5000 W m-3, U = 1 m s-1, air inlet temperature = 20 oC. Three kinds of cell spacing (a) 0 cm, (b) 8 cm, (c) 16 cm. Module temperature distribution under three air flow rates, (d) 1 m s-1, (e) 6 m s-1, (f) 10 m s-1. The cell spacing is 16 cm.
Figure 5.
The module temperature distribution at Q = 5000 W m-3, U = 1 m s-1, air inlet temperature = 20 oC. Three kinds of cell spacing (a) 0 cm, (b) 8 cm, (c) 16 cm. Module temperature distribution under three air flow rates, (d) 1 m s-1, (e) 6 m s-1, (f) 10 m s-1. The cell spacing is 16 cm.
Figure 6.
Air velocity distribution inside a pack. Fan volumetric velocity = 0.1 m3 s-1, static pressure at no-flow = 100 Pa, air inlet pressure = 0 Pa.
Figure 6.
Air velocity distribution inside a pack. Fan volumetric velocity = 0.1 m3 s-1, static pressure at no-flow = 100 Pa, air inlet pressure = 0 Pa.
Figure 7.
Pack temperature distribution at different C-rates. Fan volumetric velocity = 0.1 m3 s-1, static pressure at no-flow = 100 Pa, air inlet pressure = 0 Pa, air inlet temperature = 25 oC,.
Figure 7.
Pack temperature distribution at different C-rates. Fan volumetric velocity = 0.1 m3 s-1, static pressure at no-flow = 100 Pa, air inlet pressure = 0 Pa, air inlet temperature = 25 oC,.
Figure 8.
Case of cabinet design. (a) Case 1: single horizontal air inlet, single horizontal air outlet, (b) Case 2: 6 horizontal air inlets, 6 horizontal air outlets, (c) Case 3: 4 straight air inlets, 4 horizontal air outlets, (d) Case 4 : narrow heat dissipation fin, single horizontal air inlet, single horizontal air outlet, (e) Case 5: wide heat dissipation fin, single horizontal air inlet, single horizontal air outlet.
Figure 9.
Flow direction and velocity distribution of air inside the cabinet of case 1. Velocity and flow direction of a cross-section off-set by 20 cm of the cabinet center (a) arrow plot of flow direction, (b) color-coded velocity distribution, (c) location of the off-set cross section. Velocity and flow direction of a cross-section at the center of the cabinet, (d) arrow plot of flow direction, (e) color-coded velocity distribution, (f) location of the cross-section at the center of the cabinet.
Figure 10.
Temperature distribution inside the cabinet of case 1 (the cabinet wall temperature is 25oC)。The module heat generation rate density Q is (a) Q = 20 W m-3, (b) Q = 50 W m-3, (c) Q = 100 W m-3, (d) Q = 125 W m-3, (d) Q = 150 W m-3 which is roughly equivalent to the discharging rate of (a) 0.2 C, (b) 0.5 C, (c) 1.0 C, (d) 1.25 C, (e) 1.5 C.
Figure 11.
Temperature distribution inside the cabinet (assuming cabinet wall temperature is 25oC, air inlet velocity U = 1 m s-1). (a) case 1, (b) case 2, (c) case 3, (d) case 1 with water cooling at U = 1 m s-1, (e) case 1 with water cooling at 0.1 m s-1.
Figure 11.
Temperature distribution inside the cabinet (assuming cabinet wall temperature is 25oC, air inlet velocity U = 1 m s-1). (a) case 1, (b) case 2, (c) case 3, (d) case 1 with water cooling at U = 1 m s-1, (e) case 1 with water cooling at 0.1 m s-1.
Figure 12.
Air velocity distribution inside a pack. Six fans at the pack front surface blow air into the pack. (a) isometric view, (b) top view.
Figure 12.
Air velocity distribution inside a pack. Six fans at the pack front surface blow air into the pack. (a) isometric view, (b) top view.
Table 1.
List of battery configuration and type studied for Temperature Distribution.
Table 1.
List of battery configuration and type studied for Temperature Distribution.
| No. |
Battery Configuration |
Battery Type |
References |
| 1 |
Module
2x1 and 12x1 cells |
Li(NCM)
pouch cell |
11 |
| 2 |
Module
3x3 and 4x4 cells |
Li(NCM)
18650 cylindrical cell |
12 |
| 3 |
Module
3x7 cells |
LTO
65260 cylindrical cell |
13 |
| 4 |
Module
3x3 and 4x4 cells |
LCO
18650 cylindrical cell |
14 |
| 5 |
Single cell |
LTO/Li(NCM)
Pouch cell |
15 |
| 6 |
Single cell
Module contains 12x1 cells |
LTO
Pouch cell |
16 |
| 7 |
Module
48x1 cells |
LCO
18650 cylindrical cell |
17 |
| 8 |
Single cell |
LCO
Cylindrical and prismatic cell |
18 |
| 9 |
Single cell |
LFP
18650 cylindrical cell
Li(NCM) prismatic cell |
19 |
| 10 |
Single cell |
-- |
20 |
| 11 |
Single cell |
18650 cylindrical cell |
21 |
| 12 |
Module
63x1 cells |
LCO
Bipolar stack and parallel stack |
22 |
| 13 |
Module |
Pouch cell |
23 |
| 14 |
Module
18x1 cells |
Li(NCM) |
24 |
Table 2.
List of simulation model transportation mechanism considered, digital calculation method, and software used.
Table 2.
List of simulation model transportation mechanism considered, digital calculation method, and software used.
| No. |
Model |
Transport
Mechanism |
Digital
Calculation Method |
Commercial
Software |
Ref. |
| 1 |
Lumped equivalent resistance
Lumped thermal runaway propagation |
Conduction and convection |
-- |
-- |
11 |
| 2 |
Lumped equivalent resistance
Experimental-based Domino prediction |
Conduction and convection |
-- |
Matlab |
12 |
| 3 |
Electrochemical-thermal decomposition |
Conduction, convection, and radiation |
FEM |
|
13 |
| 4 |
Electrochemical-thermal |
Conduction, convection, and radiation |
FEM |
COMSOL 4.4 |
14 |
| 5 |
Electrochemical-thermal model under adiabatic condition |
Unsteady state conduction |
-- |
Matlab |
15 |
| 6 |
Equivalent RC circuit for 0D model
Lumped thermal runaway propagation model |
Unsteady state conduction/convection on boundary |
FEM |
COMSOL |
16 |
| 7 |
Lumped thermal runaway propagation |
Unsteady state conduction |
FEM |
COMSOL 5.4 |
17 |
| 8 |
Thermal runaway propagation |
Unsteady state conduction |
FDM |
Fortran/C++
|
18 |
| 9 |
Equivalent RC circuit |
Unsteady state charging/discharging |
-- |
Matlab |
19 |
| 10 |
Electrochemical-thermal |
Unsteady state conduction and diffusion |
FVM |
ANSYS Fluent 19.2 |
20 |
| 11 |
Electrochemical pseudo-2D model |
Unsteady state conduction and diffusion |
FVM |
C/Python/ANSYS |
21 |
| 12 |
1-D model - Equivalent electrical circuit
2-D model - Electrochemical-thermal model |
1-D model - voltage balance
2D model - Unsteady state conduction |
FEM |
COMSOL 5.4 |
22 |
| 13 |
ROM -P2D +SPM with degradation sub-model |
Unsteady state diffusion |
-- |
Matlab |
23 |
| 14 |
Module: equivalent circuit - single particle model
Short circuit module: electrochemical-thermal model |
Module: voltage balance
Short circuit module: conduction and diffusion |
Short circuit module: FEM |
Short circuit module: COMSOL 5.4 |
24 |
|
Disclaimer/Publisher’s Note: The statements, opinions and data contained in all publications are solely those of the individual author(s) and contributor(s) and not of MDPI and/or the editor(s). MDPI and/or the editor(s) disclaim responsibility for any injury to people or property resulting from any ideas, methods, instructions or products referred to in the content. |
© 2024 by the authors. Licensee MDPI, Basel, Switzerland. This article is an open access article distributed under the terms and conditions of the Creative Commons Attribution (CC BY) license (http://creativecommons.org/licenses/by/4.0/).
