Submitted:
08 January 2024
Posted:
08 January 2024
You are already at the latest version
Abstract
Keywords:
1. Introduction
2. Results
2.1. Shale oil migration in different hydrophilic nanopores during imbibition.
2.2. Microscopic advancement mechanism of imbibition front
2.3. Forced imbibition under pressure difference
3. Models and Methodology
3.1. Model system
3.2. Simulation Details
4. Conclusions
Supplementary Materials
Author Contributions
Funding
Institutional Review Board Statement
Informed Consent Statement
Data Availability Statement
Acknowledgments
Conflicts of Interest
References
- Xia, D.; Yang, Z.; Gao, T.; Li, H.; Lin, W. Characteristics of micro-and nano-pores in shale oil reservoirs. Journal of Petroleum Exploration and Production 2021, 11,, 157–169. [Google Scholar] [CrossRef]
- Dai, C.; Wang, K.; Liu, Y.; Fang, J.; Zhao, M., Study on the reutilization of clear fracturing flowback fluids in surfactant flooding with additives for Enhanced Oil Recovery (EOR). PloS one 2014, 9, (11), e113723. [CrossRef]
- Shaibu, R.; Guo, B. The dilemma of soaking a hydraulically fractured horizontal shale well prior to flowback–A decade literature review. Journal of Natural Gas Science and Engineering 2021, 94, 104084. [Google Scholar] [CrossRef]
- Hu, Y.; Ren, F.; Li, J.; Wu, Z.; Peng, H.; Hou, J. Effect of dynamic imbibition on the development of ultralow permeability reservoir. Geofluids 2021, 2021, 1–12. [Google Scholar] [CrossRef]
- Sobhani, A.; Ghasemi Dehkordi, M., The effect of nanoparticles on spontaneous imbibition of brine into initially oil-wet sandstones. Energy Sources, Part A: Recovery, Utilization, and Environmental Effects 2019, 41, (22), 2746-2756. [CrossRef]
- Morrow, N. R.; Mason, G., Recovery of oil by spontaneous imbibition. Current Opinion in Colloid & Interface Science 2001, 6, (4), 321-337. [CrossRef]
- Nguyen, D.; Wang, D.; Oladapo, A.; Zhang, J.; Sickorez, J.; Butler, R.; Mueller, B. In Evaluation of surfactants for oil recovery potential in shale reservoirs, SPE Improved Oil Recovery Symposium, 2014; OnePetro.
- Hatiboglu, C. U.; Babadagli, T., Experimental and visual analysis of co-and counter-current spontaneous imbibition for different viscosity ratios, interfacial tensions, and wettabilities. Journal of Petroleum Science and Engineering 2010, 70, (3-4), 214-228.
- Sukee, A.; Nunta, T.; Haruna, M. A.; Kalantariasl, A.; Tangparitkul, S. Influence of sequential changes in the crude oil-water interfacial tension on spontaneous imbibition in oil-wet sandstone. Journal of Petroleum Science and Engineering 2022, 210, 110032. [Google Scholar] [CrossRef]
- Darvishi, H.; Goudarznia, I.; Esmaeilzadeh, F., Effects of rock permeability on capillary imbibition oil recovery from carbonate cores. 2010.
- Strand, S.; Puntervold, T.; Austad, T., Effect of temperature on enhanced oil recovery from mixed-wet chalk cores by spontaneous imbibition and forced displacement using seawater. Energy & Fuels 2008, 22, (5), 3222-3225. [CrossRef]
- Zhao, H.; Kang, W.; Yang, H.; Zhang, H.; Zhu, T.; Wang, F.; Li, X.; Zhou, B.; Sarsenbekuly, B.; Aidarova, S., Imbibition enhancing oil recovery mechanism of the two surfactants. Physics of Fluids 2020, 32, (4), 047103. [CrossRef]
- Wang, F.; Wang, L.; Jiao, L.; Liu, Z.; Yang, K. Experimental Mechanism for Enhancing Oil Recovery by Spontaneous Imbibition with Surfactants in a Tight Sandstone Oil Reservoir. Energy & Fuels 2023. [Google Scholar] [CrossRef]
- Wang, Y.; Xu, H.; Yu, W.; Bai, B.; Song, X.; Zhang, J. Surfactant induced reservoir wettability alteration: Recent theoretical and experimental advances in enhanced oil recovery. Petroleum Science 2011, 8, 463–476. [Google Scholar] [CrossRef]
- Pal, N.; Saxena, N.; Laxmi, K. D.; Mandal, A. Interfacial behaviour, wettability alteration and emulsification characteristics of a novel surfactant: Implications for enhanced oil recovery. Chemical Engineering Science 2018, 187, 200–212. [Google Scholar] [CrossRef]
- Haghighi, O. M.; Zargar, G.; Khaksar Manshad, A.; Ali, M.; Takassi, M. A.; Ali, J. A.; Keshavarz, A., Effect of environment-friendly non-ionic surfactant on interfacial tension reduction and wettability alteration; implications for enhanced oil recovery. Energies 2020, 13, (15), 3988. [CrossRef]
- Meng, Q.; Liu, H.; Wang, J., A critical review on fundamental mechanisms of spontaneous imbibition and the impact of boundary condition, fluid viscosity and wettability. Advances in Geo-Energy Research 2017, 1, (1), 1-17. [CrossRef]
- Meng, M.; Ge, H.; Ji, W.; Shen, Y.; Su, S. Monitor the process of shale spontaneous imbibition in co-current and counter-current displacing gas by using low field nuclear magnetic resonance method. Journal of Natural Gas Science and Engineering 2015, 27, 336–345. [Google Scholar] [CrossRef]
- Chakraborty, N.; Karpyn, Z.; Liu, S.; Yoon, H. Permeability evolution of shale during spontaneous imbibition. Journal of Natural Gas Science and Engineering 2017, 38, 590–596. [Google Scholar] [CrossRef]
- Zhou, Z.; Abass, H.; Li, X.; Bearinger, D.; Frank, W. Mechanisms of imbibition during hydraulic fracturing in shale formations. Journal of Petroleum Science and Engineering 2016, 141, 125–132. [Google Scholar] [CrossRef]
- Jing, W.; Huiqing, L.; Genbao, Q.; Yongcan, P.; Yang, G. Investigations on spontaneous imbibition and the influencing factors in tight oil reservoirs. Fuel 2019, 236, 755–768. [Google Scholar] [CrossRef]
- Chang, Q.; Huang, L.; Wu, X., A Molecular Dynamics Study on Low-Pressure Carbon Dioxide in the Water/Oil Interface for Enhanced Oil Recovery. SPE Journal 2023, 28, (02), 643-652. [CrossRef]
- Goodarzi, F.; Zendehboudi, S., Effects of salt and surfactant on interfacial characteristics of water/oil systems: molecular dynamic simulations and dissipative particle dynamics. Industrial & Engineering Chemistry Research 2019, 58, (20), 8817-8834. [CrossRef]
- Boldon, L.; Laliberte, F.; Liu, L., Review of the fundamental theories behind small angle X-ray scattering, molecular dynamics simulations, and relevant integrated application. Nano reviews 2015, 6, (1), 25661. [CrossRef]
- Wang, X.; Xiao, S.; Zhang, Z.; He, J., Effect of nanoparticles on spontaneous imbibition of water into ultraconfined reservoir capillary by molecular dynamics simulation. Energies 2017, 10, (4), 506. [CrossRef]
- Yang, S.; Dehghanpour, H.; Binazadeh, M.; Dong, P. A molecular dynamics explanation for fast imbibition of oil in organic tight rocks. Fuel 2017, 190, 409–419. [Google Scholar] [CrossRef]
- Karna, N. K.; Oyarzua, E.; Walther, J. H.; Zambrano, H. A., Effect of the meniscus contact angle during early regimes of spontaneous imbibition in nanochannels. Physical Chemistry Chemical Physics 2016, 18, (47), 31997-32001. [CrossRef]
- Sang, Q.; Zhao, X.-Y.; Liu, H.-M.; Dong, M.-Z., Analysis of imbibition of n-alkanes in kerogen slits by molecular dynamics simulation for characterization of shale oil rocks. Petroleum Science 2022, 19, (3), 1236-1249. [CrossRef]
- Wang, S.; Wang, J.; Liu, H.; Liu, F., Impacts of polar molecules of crude oil on spontaneous imbibition in calcite nanoslit: a molecular dynamics simulation study. Energy & Fuels 2021, 35, (17), 13671-13686. [CrossRef]
- Shun, W.; Jing, W.; Huiqing, L., Forced Imbibition to Enhanced Tight/Shale Oil Recovery: A Molecular Dynamics Simulation Study. 2021.
- Kang, W.-L.; Zhou, B.-B.; Issakhov, M.; Gabdullin, M. , Advances in enhanced oil recovery technologies for low permeability reservoirs. Petroleum Science 2022, 19(4), 1622–1640. [Google Scholar] [CrossRef]
- Liu, B.; Liu, W.; Pan, Z.; Yu, L.; Xie, Z.; Lv, G.; Zhao, P.; Chen, D.; Fang, W., Supercritical CO2 breaking through a water bridge and enhancing shale oil recovery: A molecular dynamics simulation study. Energy & Fuels 2022, 36, (14), 7558-7568. [CrossRef]
- Wei, B.; Gao, K.; Song, T.; Zhang, X.; Pu, W.; Xu, X.; Wood, C., Nuclear-magnetic-resonance monitoring of mass exchange in a low-permeability matrix/fracture model during CO2 cyclic injection: a mechanistic study. SPE Journal 2020, 25, (01), 440-450. [CrossRef]
- Tu, J.; Sheng, J. J. Experimental and numerical study of surfactant solution spontaneous imbibition in shale oil reservoirs. Journal of the Taiwan Institute of Chemical Engineers 2020, 106, 169–182. [Google Scholar] [CrossRef]
- Yuan, L.; Zhang, Y.; Liu, S.; Zhang, Y.; Chen, C.; Song, Y. Study on the slip behavior of CO2-crude oil on nanopore surfaces with different wettability. International Journal of Heat and Mass Transfer 2024, 218, 124787. [Google Scholar] [CrossRef]
- Wang, S.; Javadpour, F.; Feng, Q. Molecular dynamics simulations of oil transport through inorganic nanopores in shale. Fuel 2016, 171, 74–86. [Google Scholar] [CrossRef]
- Zhang, C.; Dai, H.; Lu, P.; Wu, L.; Zhou, B.; Yu, C., Molecular dynamics simulation of distribution and diffusion behaviour of oil–water interfaces. Molecules 2019, 24, (10), 1905. [CrossRef]
- Wang, Z.; Yu, C.; Zhao, J.; Guo, P.; Liu, H. Molecular dynamics simulation for quantitative characterization of wettability transition on silica surface. Journal of Materials Research and Technology 2022, 19, 4371–4380. [Google Scholar] [CrossRef]
- Li, G.; Su, Y.; Guo, Y.; Hao, Y.; Li, L. Frontier enhanced oil recovery (EOR) research on the application of imbibition techniques in high-pressure forced soaking of hydraulically fractured shale oil reservoirs. Geofluids 2021, 2021, 1–17. [Google Scholar] [CrossRef]
- Dong, H.; Zhu, Q.; Wang, L.; Yue, X.; Fang, H.; Wang, Z.; Liu, S.; Wei, S.; Lu, X., Effects of Shale Pore Size and Connectivity on scCO2 Enhanced Oil Recovery: A Molecular Dynamics Simulation Investigation. Langmuir 2023, 39, (17), 6287-6299. [CrossRef]
- Shi, P.; Luo, H.; Tan, X.; Lu, Y.; Zhang, H.; Yang, X., Molecular dynamics simulation study of adsorption of anionic–nonionic surfactants at oil/water interfaces. RSC advances 2022, 12, (42), 27330-27343. [CrossRef]
- Xu, G.; Shi, Y.; Jiang, Y.; Jia, C.; Gao, Y.; Han, X.; Zeng, X., Characteristics and influencing factors for forced imbibition in tight sandstone based on low-field nuclear magnetic resonance measurements. Energy & Fuels 2018, 32, (8), 8230-8240. [CrossRef]
- Albers, B. Modeling the hysteretic behavior of the capillary pressure in partially saturated porous media: a review. Acta Mechanica 2014, 225, 2163–2189. [Google Scholar] [CrossRef]
- Wu, P.; Nikolov, A. D.; Wasan, D. T., Capillary rise: validity of the dynamic contact angle models. Langmuir 2017, 33, (32), 7862-7872. [CrossRef]
- Zhang, L.; Ping, J.; Tang, B.; Kang, L.; Imani, G.; Yang, Y.; Sun, H.; Zhong, J.; Yao, J.; Fan, D., Mathematical Model of Two-Phase Spontaneous Imbibition with Dynamic Contact Angle. Transport in Porous Media 2023, 148, (1), 157-172. [CrossRef]
- Martic, G.; Gentner, F.; Seveno, D.; Coulon, D.; De Coninck, J.; Blake, T., A molecular dynamics simulation of capillary imbibition. Langmuir 2002, 18, (21), 7971-7976. [CrossRef]
- Sun, E. W.-H.; Bourg, I. C., Molecular dynamics simulations of mineral surface wettability by water versus CO2: Thin films, contact angles, and capillary pressure in a silica nanopore. The Journal of Physical Chemistry C 2020, 124, (46), 25382-25395. [CrossRef]
- Wu, P.; Nikolov, A. D.; Wasan, D. T. Two-phase displacement dynamics in capillaries-nanofluid reduces the frictional coefficient. Journal of colloid and interface science 2018, 532, 153–160. [Google Scholar] [CrossRef]
- Pan, L.; Dai, F.; Li, G.; Liu, S. A TGA/DTA-MS investigation to the influence of process conditions on the pyrolysis of Jimsar oil shale. Energy 2015, 86, 749–757. [Google Scholar] [CrossRef]
- Dong, X.; Xu, W.; Liu, H.; Chen, Z.; Lu, N.; Wang, W. On the replacement behavior of CO2 in nanopores of shale oil reservoirs: Insights from wettability tests and molecular dynamics simulations. Geoenergy Science and Engineering 2023, 223, 211528. [Google Scholar] [CrossRef]
- Huang, P.; Shen, L.; Gan, Y.; Maggi, F.; El-Zein, A.; Pan, Z., Atomistic study of dynamic contact angles in CO2–water–silica system. Langmuir 2019, 35, (15), 5324-5332. [CrossRef]
- Le, T. T. B.; Striolo, A.; Gautam, S. S.; Cole, D. R., Propane–water mixtures confined within cylindrical silica nanopores: structural and dynamical properties probed by molecular dynamics. Langmuir 2017, 33, (42), 11310-11320. [CrossRef]
- Xu, J.; Zhan, S.; Wang, W.; Su, Y.; Wang, H. Molecular dynamics simulations of two-phase flow of n-alkanes with water in quartz nanopores. Chemical Engineering Journal 2022, 430, 132800. [Google Scholar] [CrossRef]
- Liu, L.; Ye, Z.; Lai, N., Characterization Method for Non-uniform Wettability of Shale Oil Reservoir. International Core Journal of Engineering 2022, 8, (4), 179-186. [CrossRef]
- Koretsky, C. M.; Sverjensky, D. A.; Sahai, N., A model of surface site types on oxide and silicate minerals based on crystal chemistry; implications for site types and densities, multi-site adsorption, surface infrared spectroscopy, and dissolution kinetics. American Journal of Science 1998, 298, (5), 349-438. [CrossRef]
- Cygan, R. T.; Liang, J.-J.; Kalinichev, A. G., Molecular models of hydroxide, oxyhydroxide, and clay phases and the development of a general force field. The Journal of Physical Chemistry B 2004, 108, (4), 1255-1266. [CrossRef]
- Nie, X.; Chen, J.; Sheng, N.; Zeng, L.; Yang, H.; Wang, C., Effect of water molecules on nanoscale wetting behaviour of molecular ethanol on hydroxylated SiO. 2017. [CrossRef]
- Hong, X.; Yu, H.; Xu, H.; Wang, X.; Jin, X.; Wu, H.; Wang, F. Competitive adsorption of asphaltene and n-heptane on quartz surfaces and its effect on crude oil transport through nanopores. Journal of Molecular Liquids 2022, 359, 119312. [Google Scholar] [CrossRef]
- Zhan, S.; Su, Y.; Jin, Z.; Wang, W.; Li, L. Effect of water film on oil flow in quartz nanopores from molecular perspectives. Fuel 2020, 262, 116560. [Google Scholar] [CrossRef]
- Deng, Y.; Wu, Q.; Li, Z.; Huang, X.; Rao, S.; Liang, Y.; Lu, H. , Crystal face dependent wettability of α-quartz: Elucidation by time-of-flight secondary ion mass spectrometry techniques combined with molecular dynamics. Journal of Colloid and Interface Science 2022, 607, 1699–1708. [Google Scholar] [CrossRef]
- Mayo, S. L.; Olafson, B. D.; Goddard, W. A., DREIDING: a generic force field for molecular simulations. Journal of Physical chemistry 1990, 94, (26), 8897-8909. [CrossRef]
- Jorgensen, W. L.; Maxwell, D. S.; Tirado-Rives, J., Development and testing of the OPLS all-atom force field on conformational energetics and properties of organic liquids. Journal of the American Chemical Society 1996, 118, (45), 11225-11236. [CrossRef]
- Wang, S.; Feng, Q.; Javadpour, F.; Xia, T.; Li, Z. Oil adsorption in shale nanopores and its effect on recoverable oil-in-place. International Journal of Coal Geology 2015, 147, 9–24. [Google Scholar] [CrossRef]
- Berendsen, H.; Grigera, J.; Straatsma, T., The missing term in effective pair potentials. Journal of Physical Chemistry 1987, 91, (24), 6269-6271. [CrossRef]
- Zhao, J.; Yao, G.; Ramisetti, S. B.; Hammond, R. B.; Wen, D. Molecular dynamics investigation of substrate wettability alteration and oil transport in a calcite nanopore. Fuel 2019, 239, 1149–1161. [Google Scholar] [CrossRef]
- Quezada, G. R.; Jeldres, M.; Toro, N.; Robles, P.; Toledo, P. G.; Jeldres, R. I. Understanding the flocculation mechanism of quartz and kaolinite with polyacrylamide in seawater: A molecular dynamics approach. Colloids and Surfaces A: Physicochemical and Engineering Aspects 2021, 608, 125576. [Google Scholar] [CrossRef]
- Shen, X.; Bourg, I. C. Molecular dynamics simulations of the colloidal interaction between smectite clay nanoparticles in liquid water. Journal of Colloid and Interface Science 2021, 584, 610–621. [Google Scholar] [CrossRef]
- Meng, J.; Li, C.; Yan, S.; Zhang, S.; Zhang, H.; Wang, G.; Yang, X. Atomic-level insights into the mechanism of saline-regulated montmorillonite (001)-salt droplet interface wetting: A molecular dynamics study. Applied Clay Science 2022, 224, 106513. [Google Scholar] [CrossRef]
- Plimpton, S., Fast parallel algorithms for short-range molecular dynamics. Journal of computational physics 1995, 117, (1), 1-19. [CrossRef]
- Humphrey, W.; Dalke, A.; Schulten, K., VMD: visual molecular dynamics. Journal of molecular graphics 1996, 14, (1), 33-38. [CrossRef]
- Guo, L.; Tang, G.; Kumar, S., Droplet morphology and mobility on lubricant-impregnated surfaces: A molecular dynamics study. Langmuir 2019, 35, (49), 16377-16387. [CrossRef]

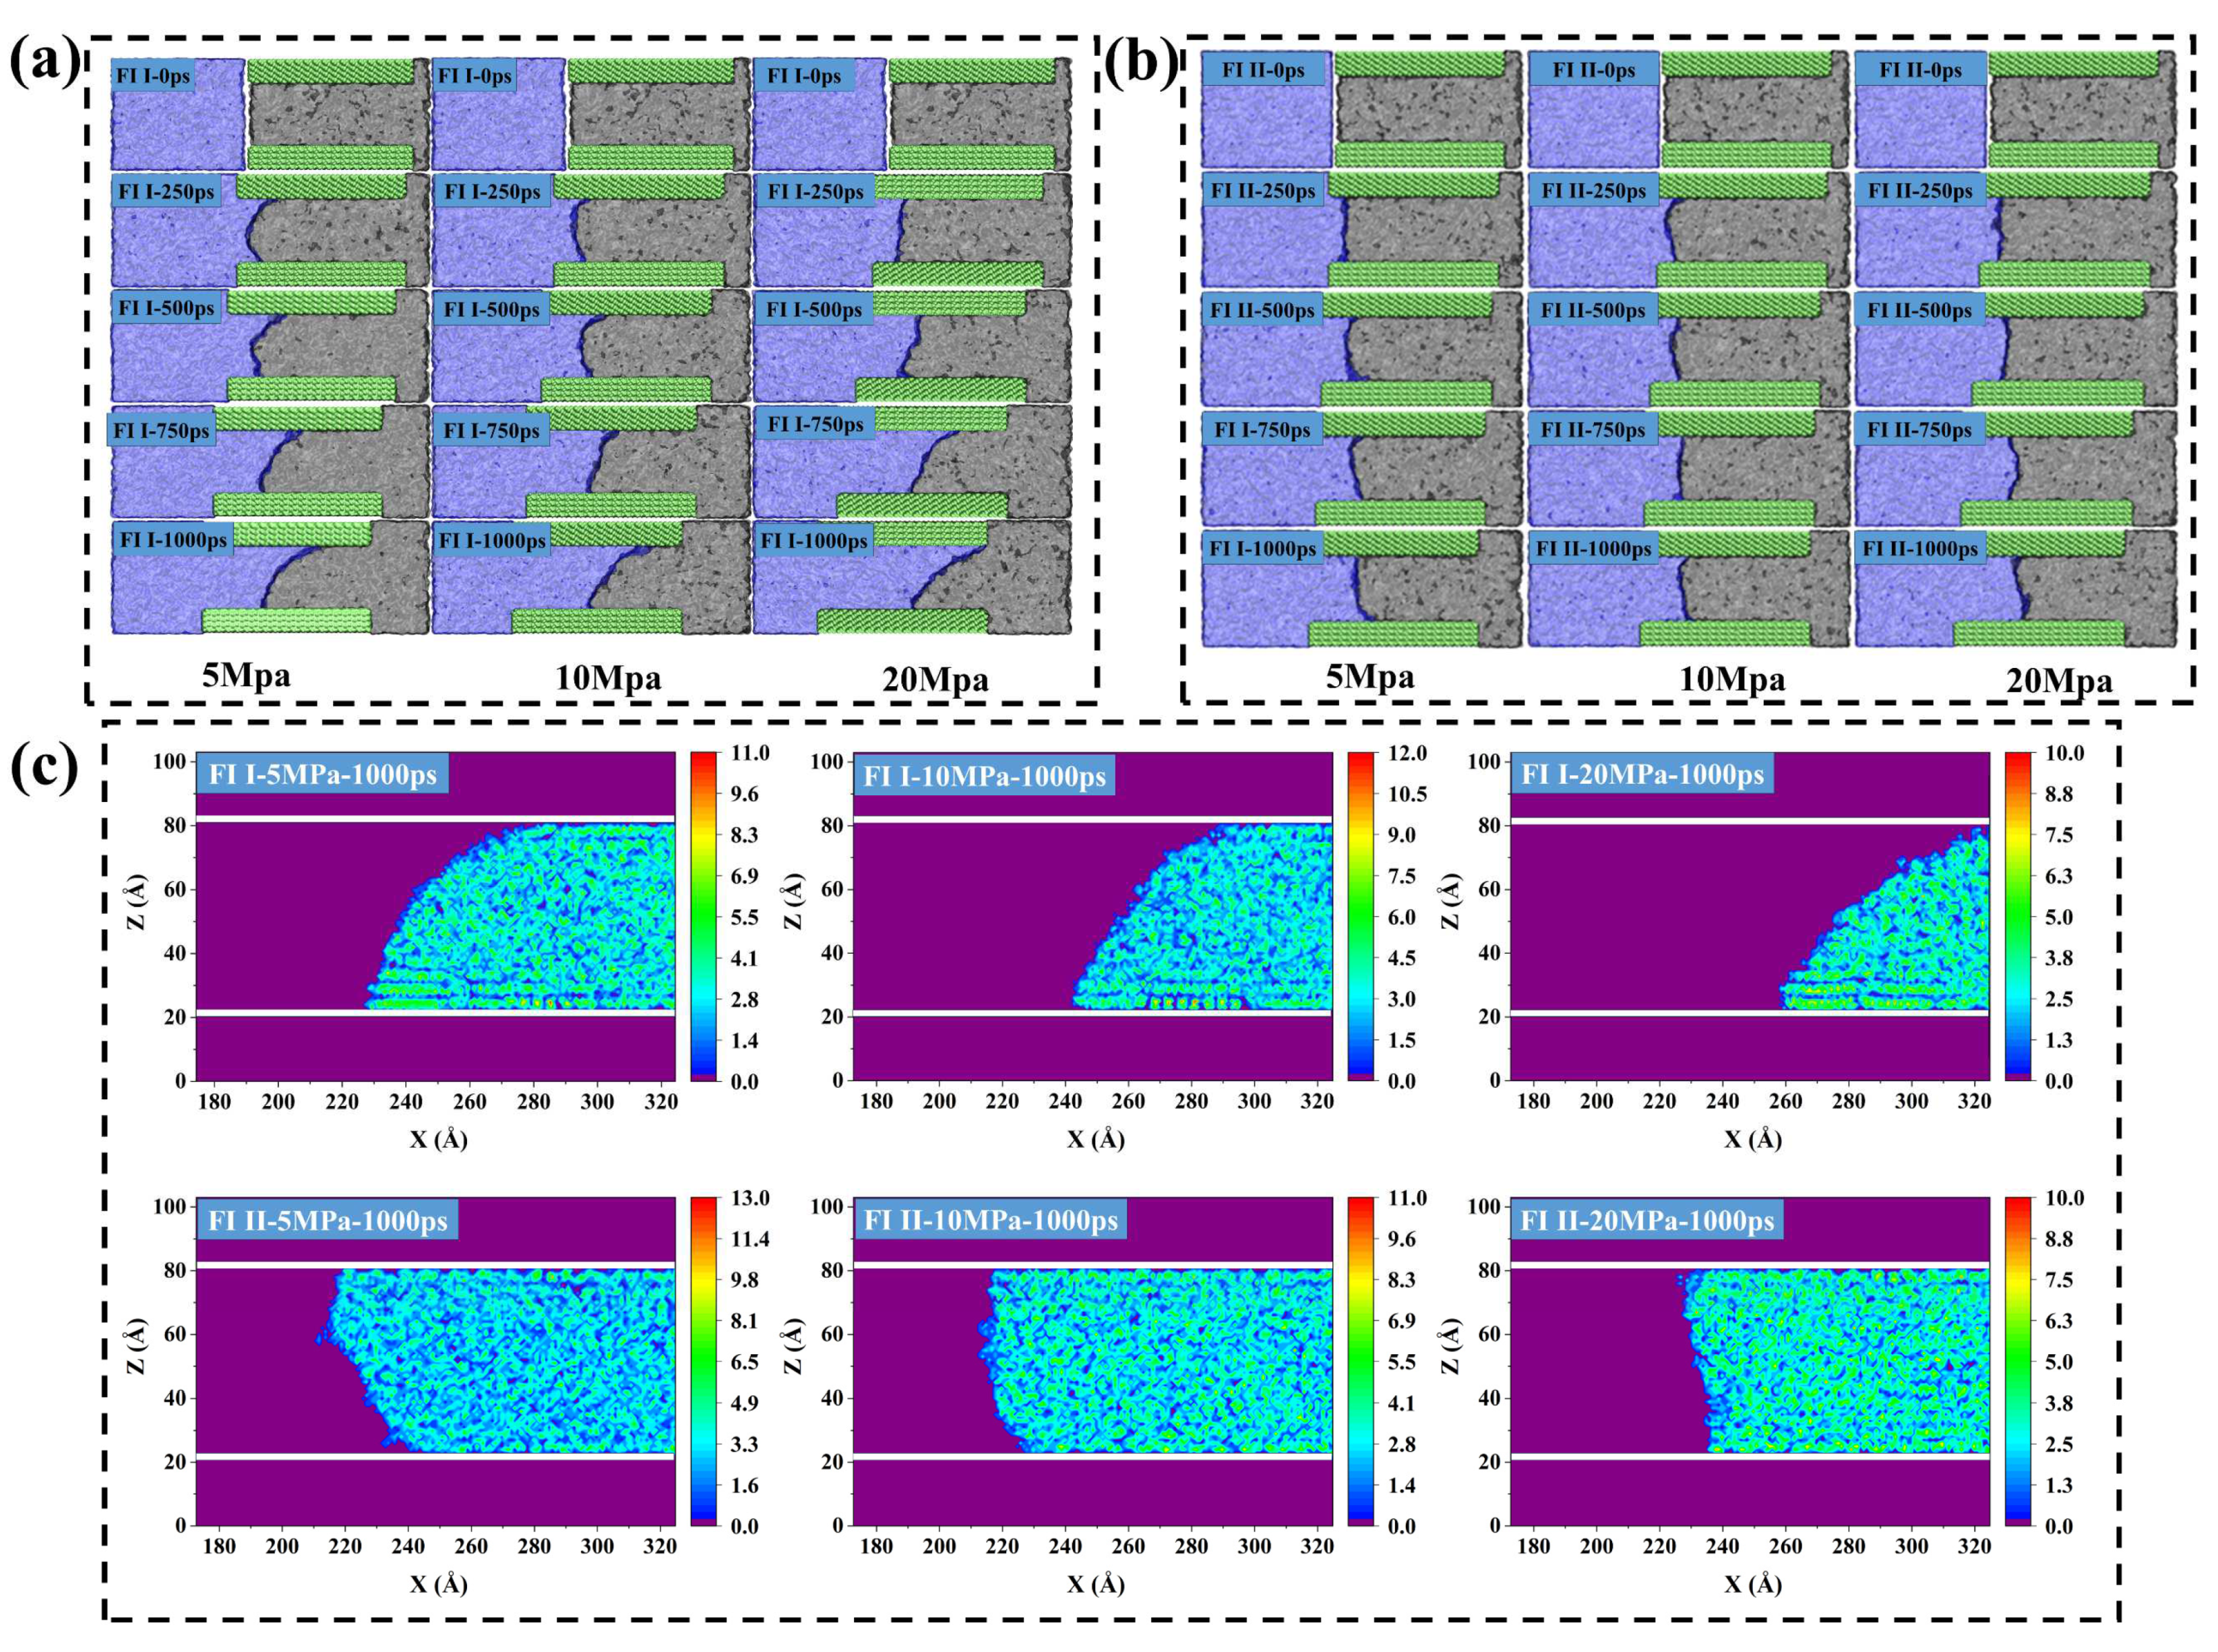
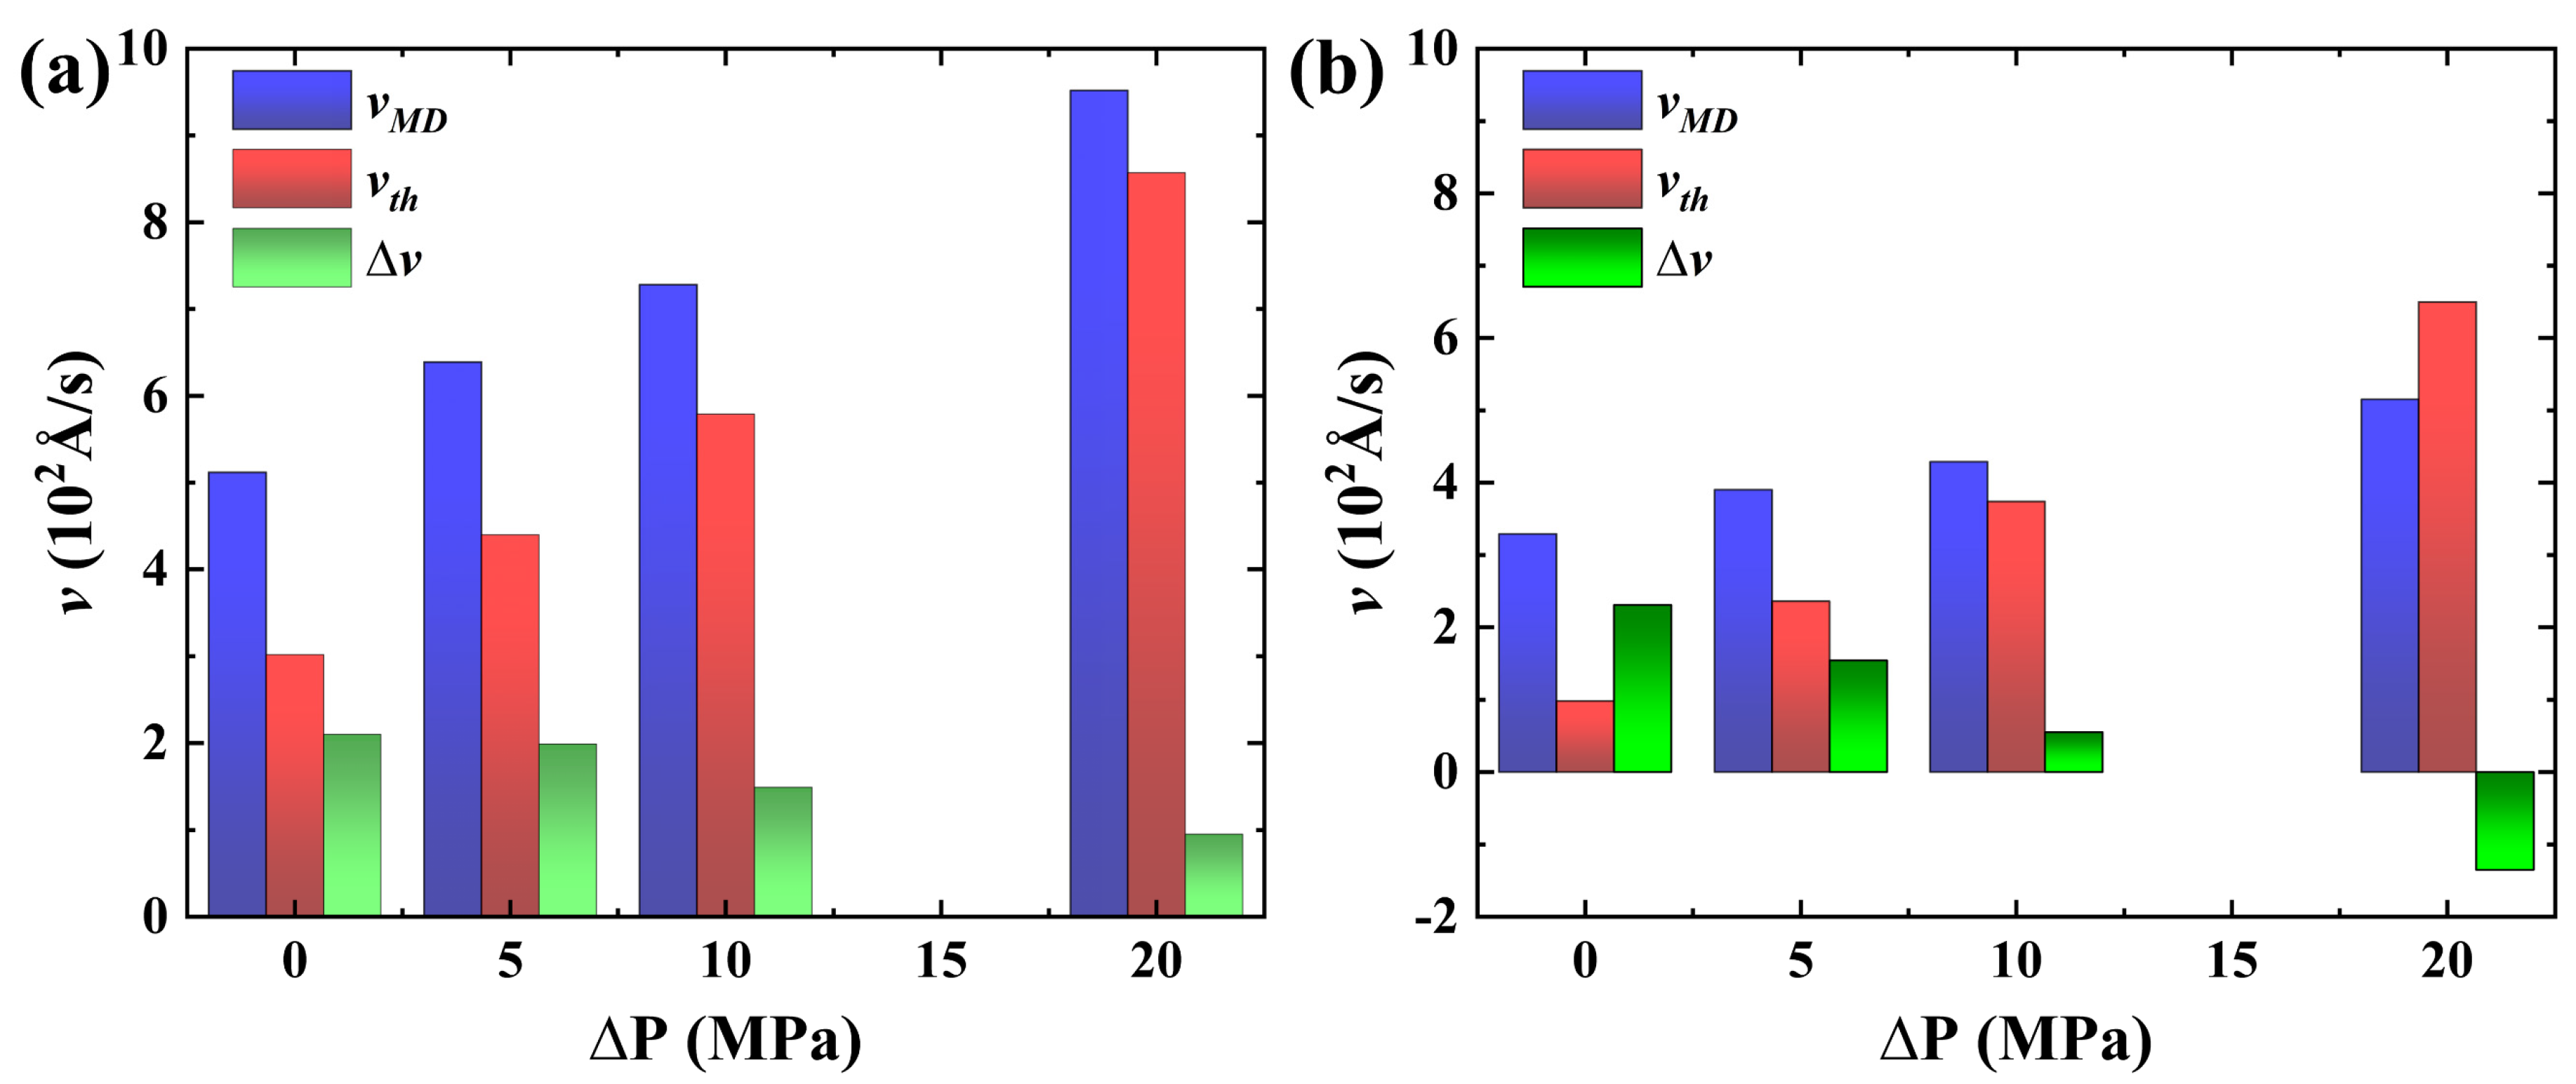
| (MPa) | 0 | 5 | 10 | 20 | |
| (m/s) | system I | 5.12 | 6.39 | 7.28 | 9.52 |
| system II | 3.29 | 3.90 | 4.29 | 5.15 | |
| system I | 1 | 1.24 | 1.42 | 1.85 | |
| system II | 1 | 1.185 | 1.3 | 1.56 | |
Disclaimer/Publisher’s Note: The statements, opinions and data contained in all publications are solely those of the individual author(s) and contributor(s) and not of MDPI and/or the editor(s). MDPI and/or the editor(s) disclaim responsibility for any injury to people or property resulting from any ideas, methods, instructions or products referred to in the content. |
© 2024 by the authors. Licensee MDPI, Basel, Switzerland. This article is an open access article distributed under the terms and conditions of the Creative Commons Attribution (CC BY) license (https://creativecommons.org/licenses/by/4.0/).


