Submitted:
05 January 2024
Posted:
08 January 2024
You are already at the latest version
Abstract
Keywords:
1. Introduction
2. EDSH Functionality and Proposed Metamodel
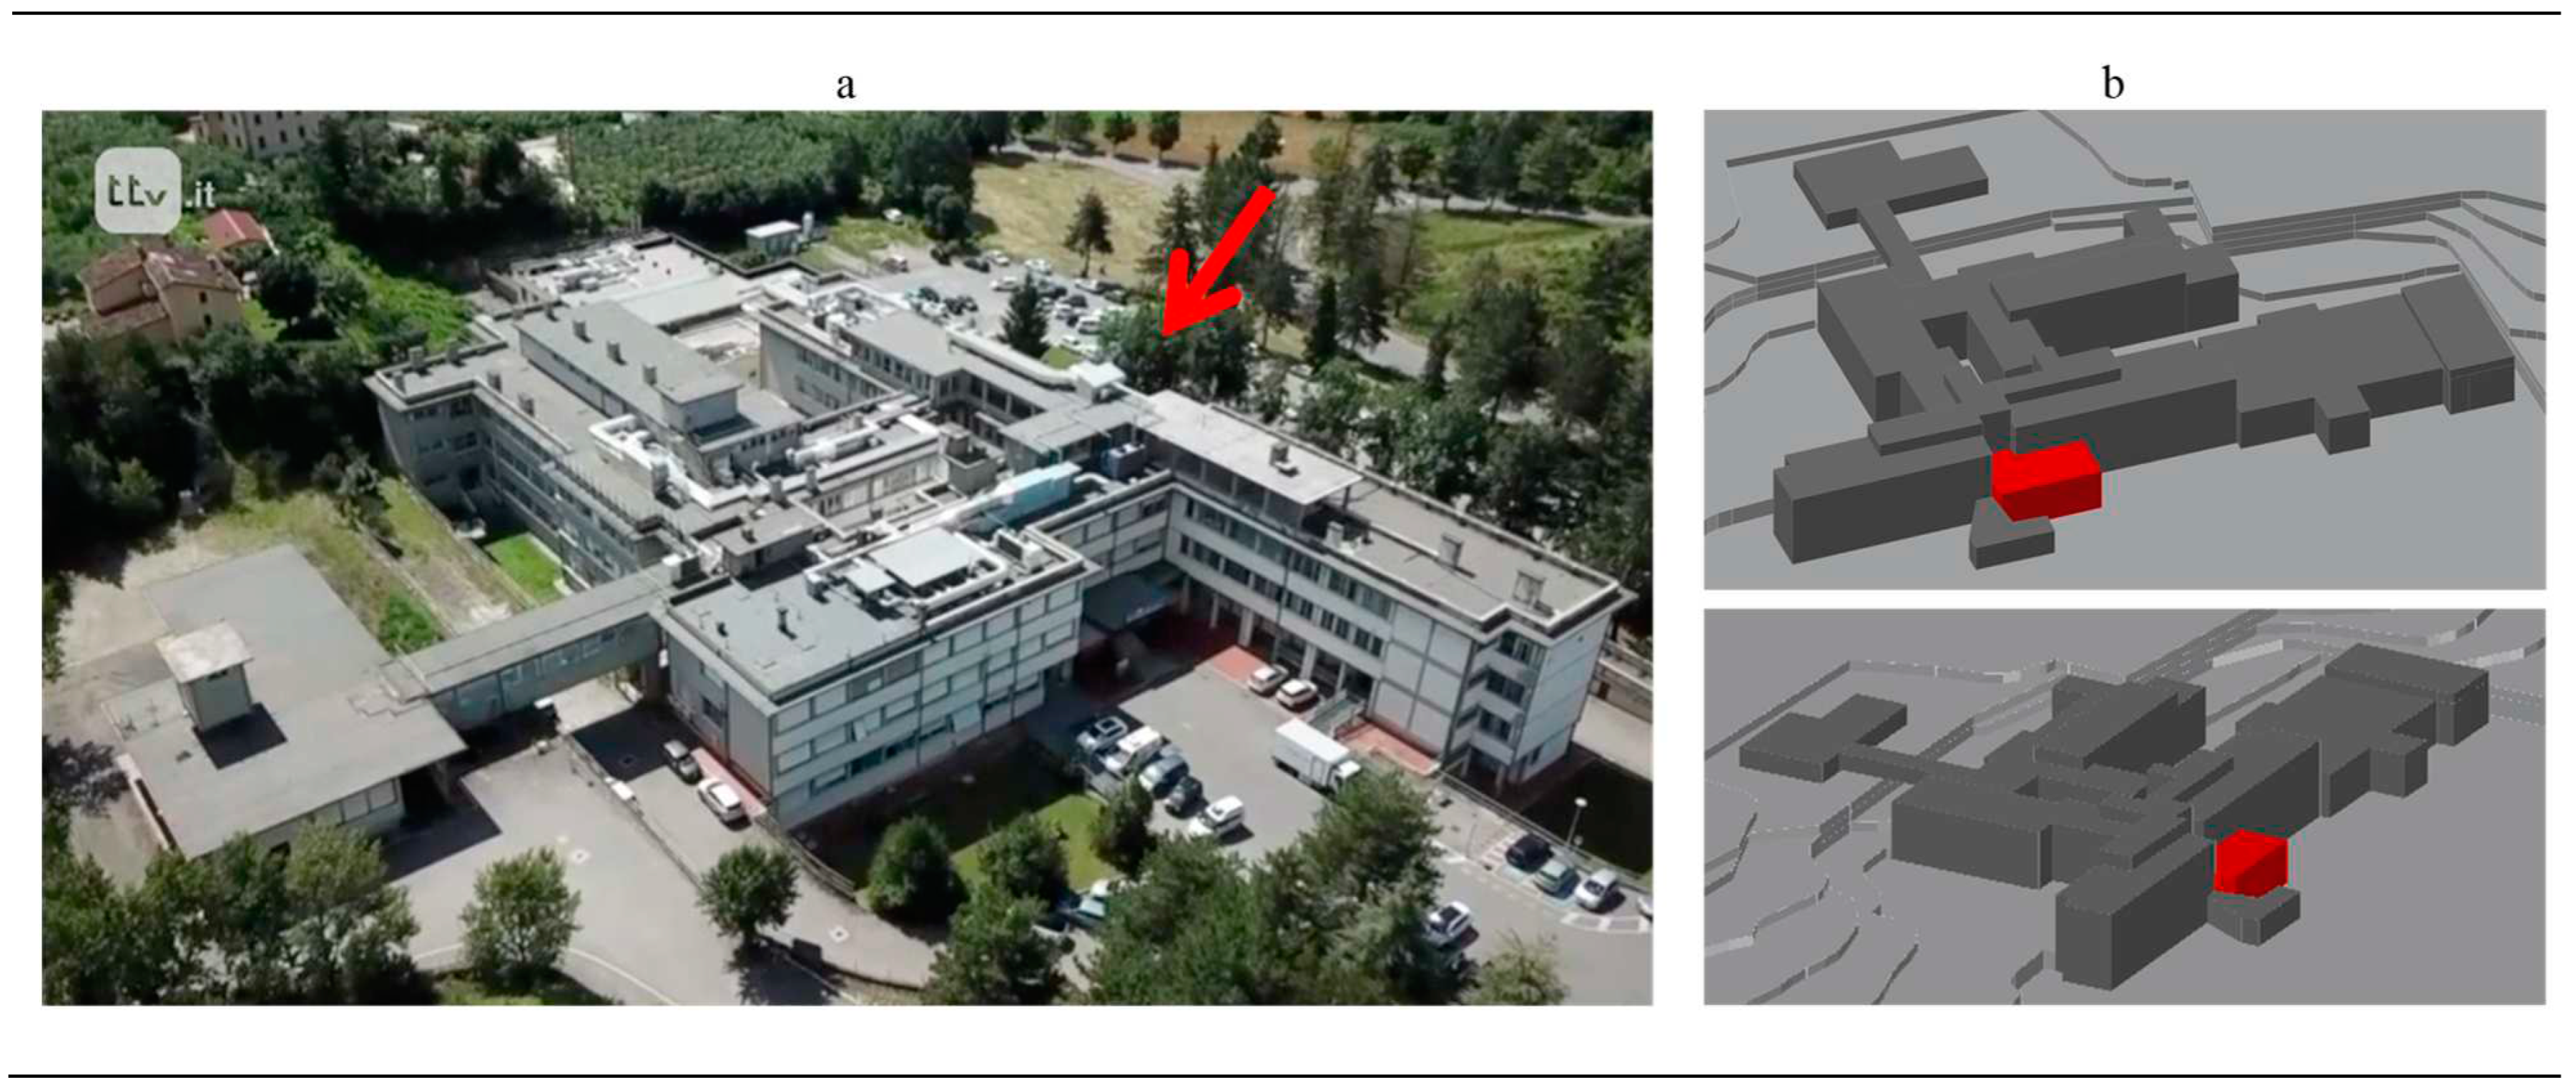
2.1. Case-Study: Emergency Department of the Sansepolcro Hospital (EMDH)
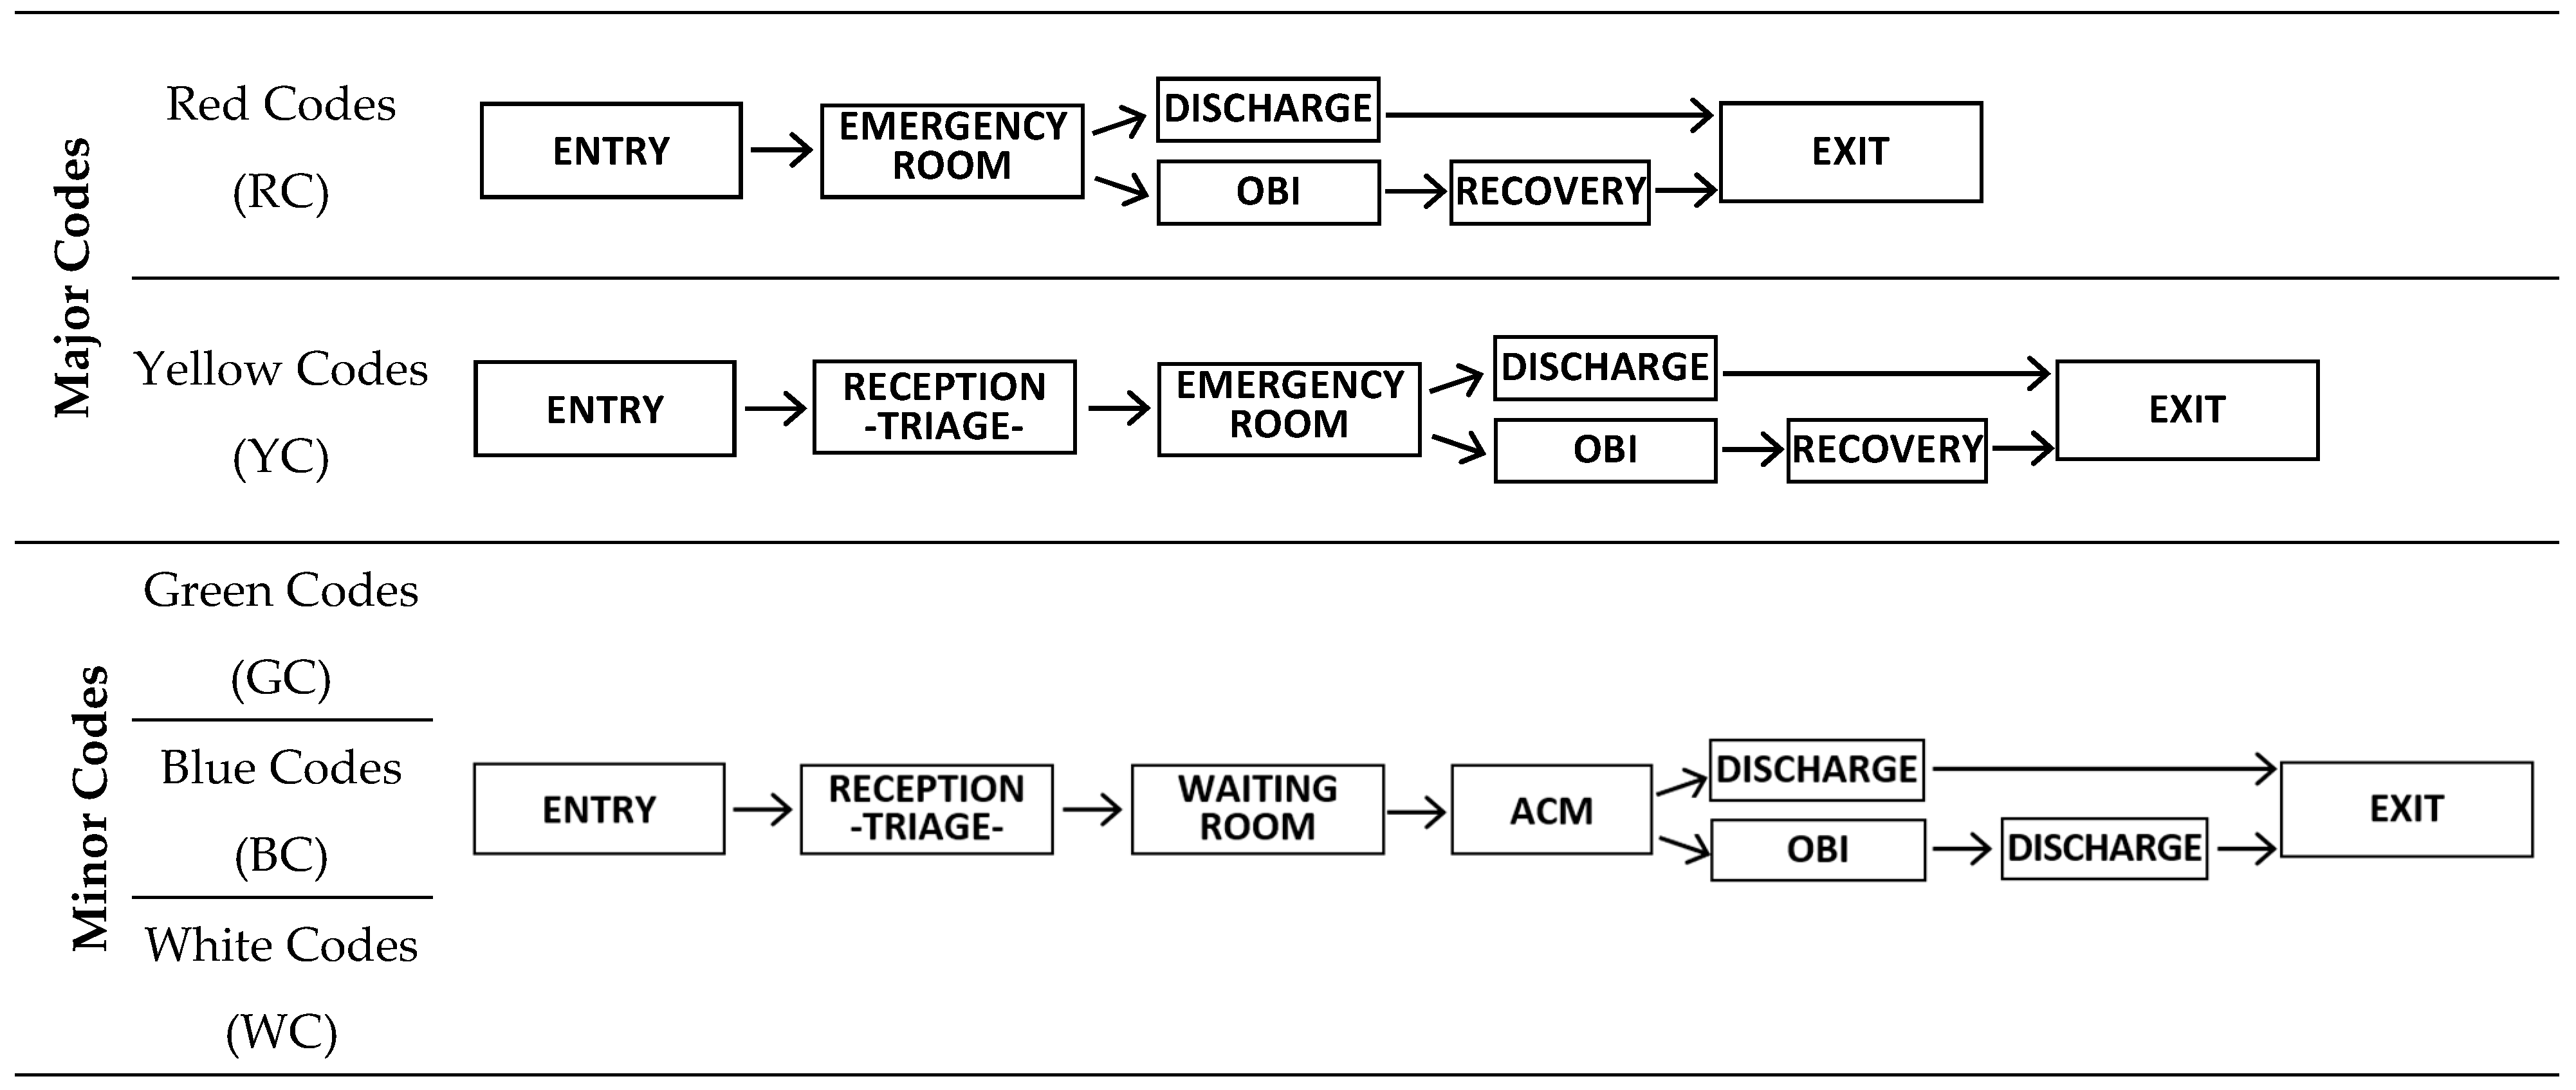
2.2. The EMDH Functioning and the Assumed Response Parameter
- -
- Reception (REC), where the patients arrive;
- -
- Waiting Room (WR), where patients classified as “Minor Codes” wait for the assistance.
- -
- Minor Codes Ambulatory (ACM) where patients classified as “Minor Codes” the patients are visited.
- -
- Short Intensive Observation (OBI), where the patients are left to check their response to the treatment.
- -
- Emergency Room (ER), where patients classified as “Major Codes” receive the first rescue.
- -
- Recovery, patients classified as “Major Codes” are recovered.
2.3. Systems Affecting the EMDH Functioning
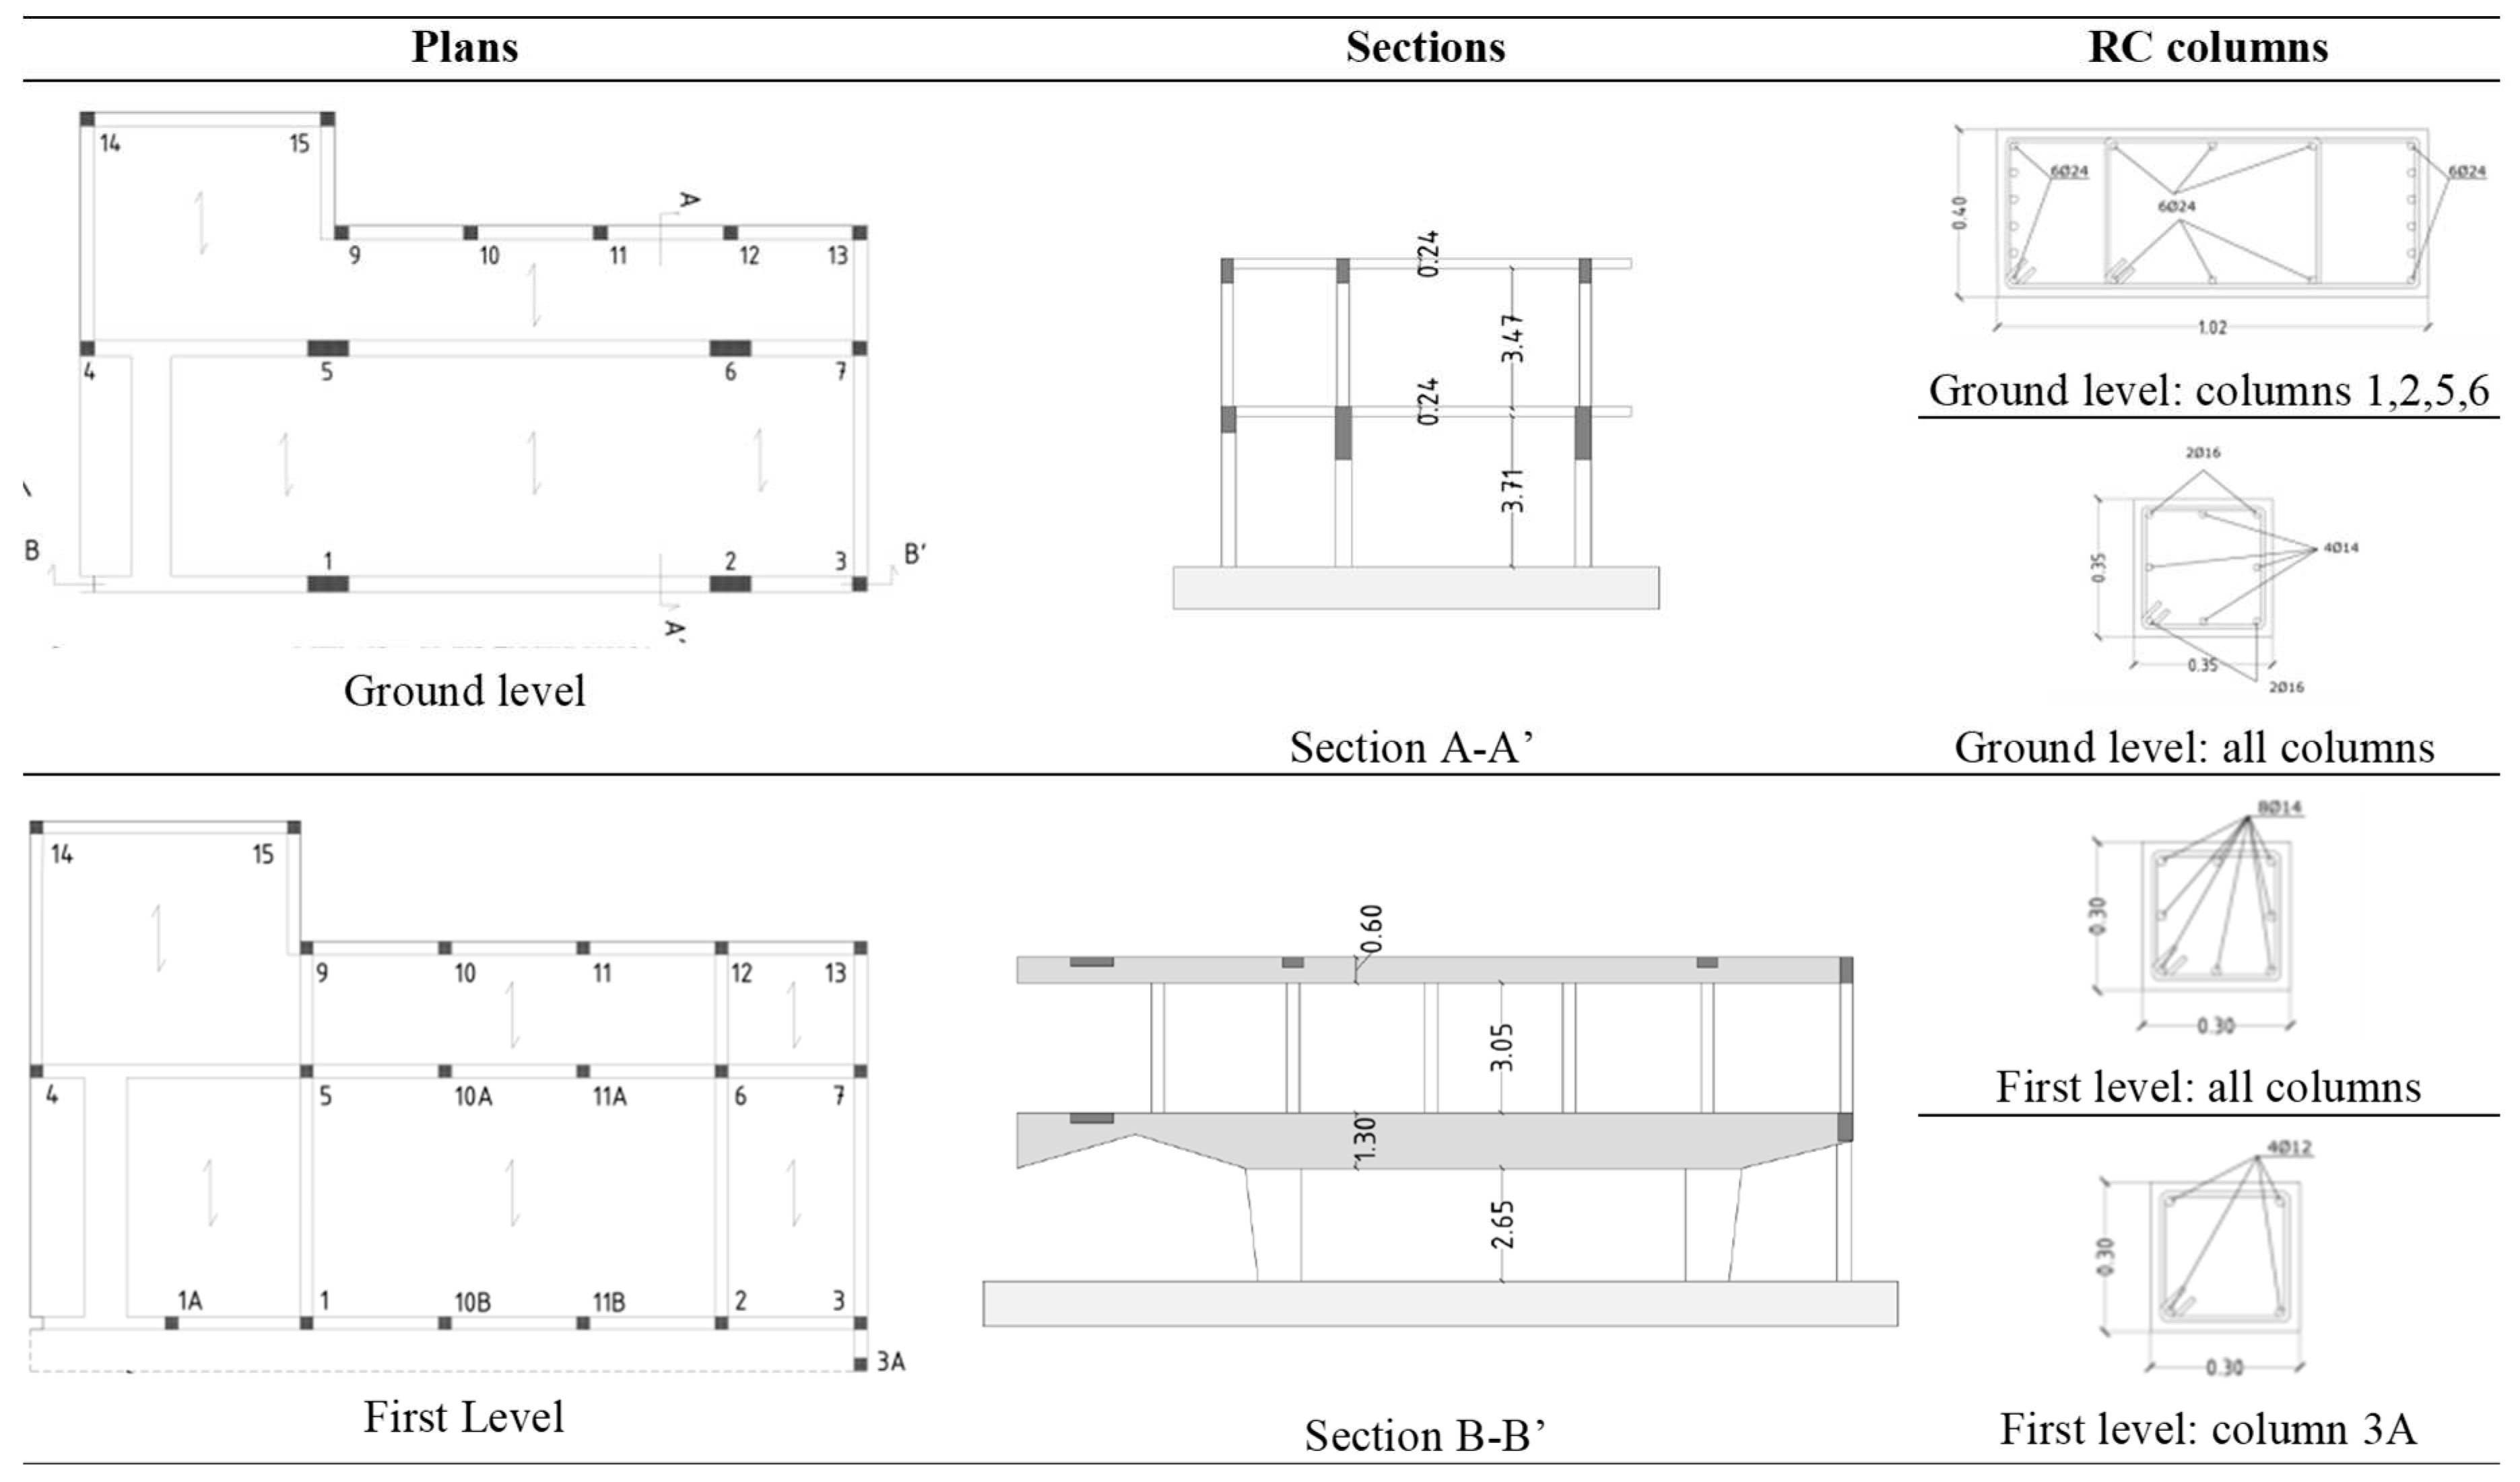
2.3.1. The Structure
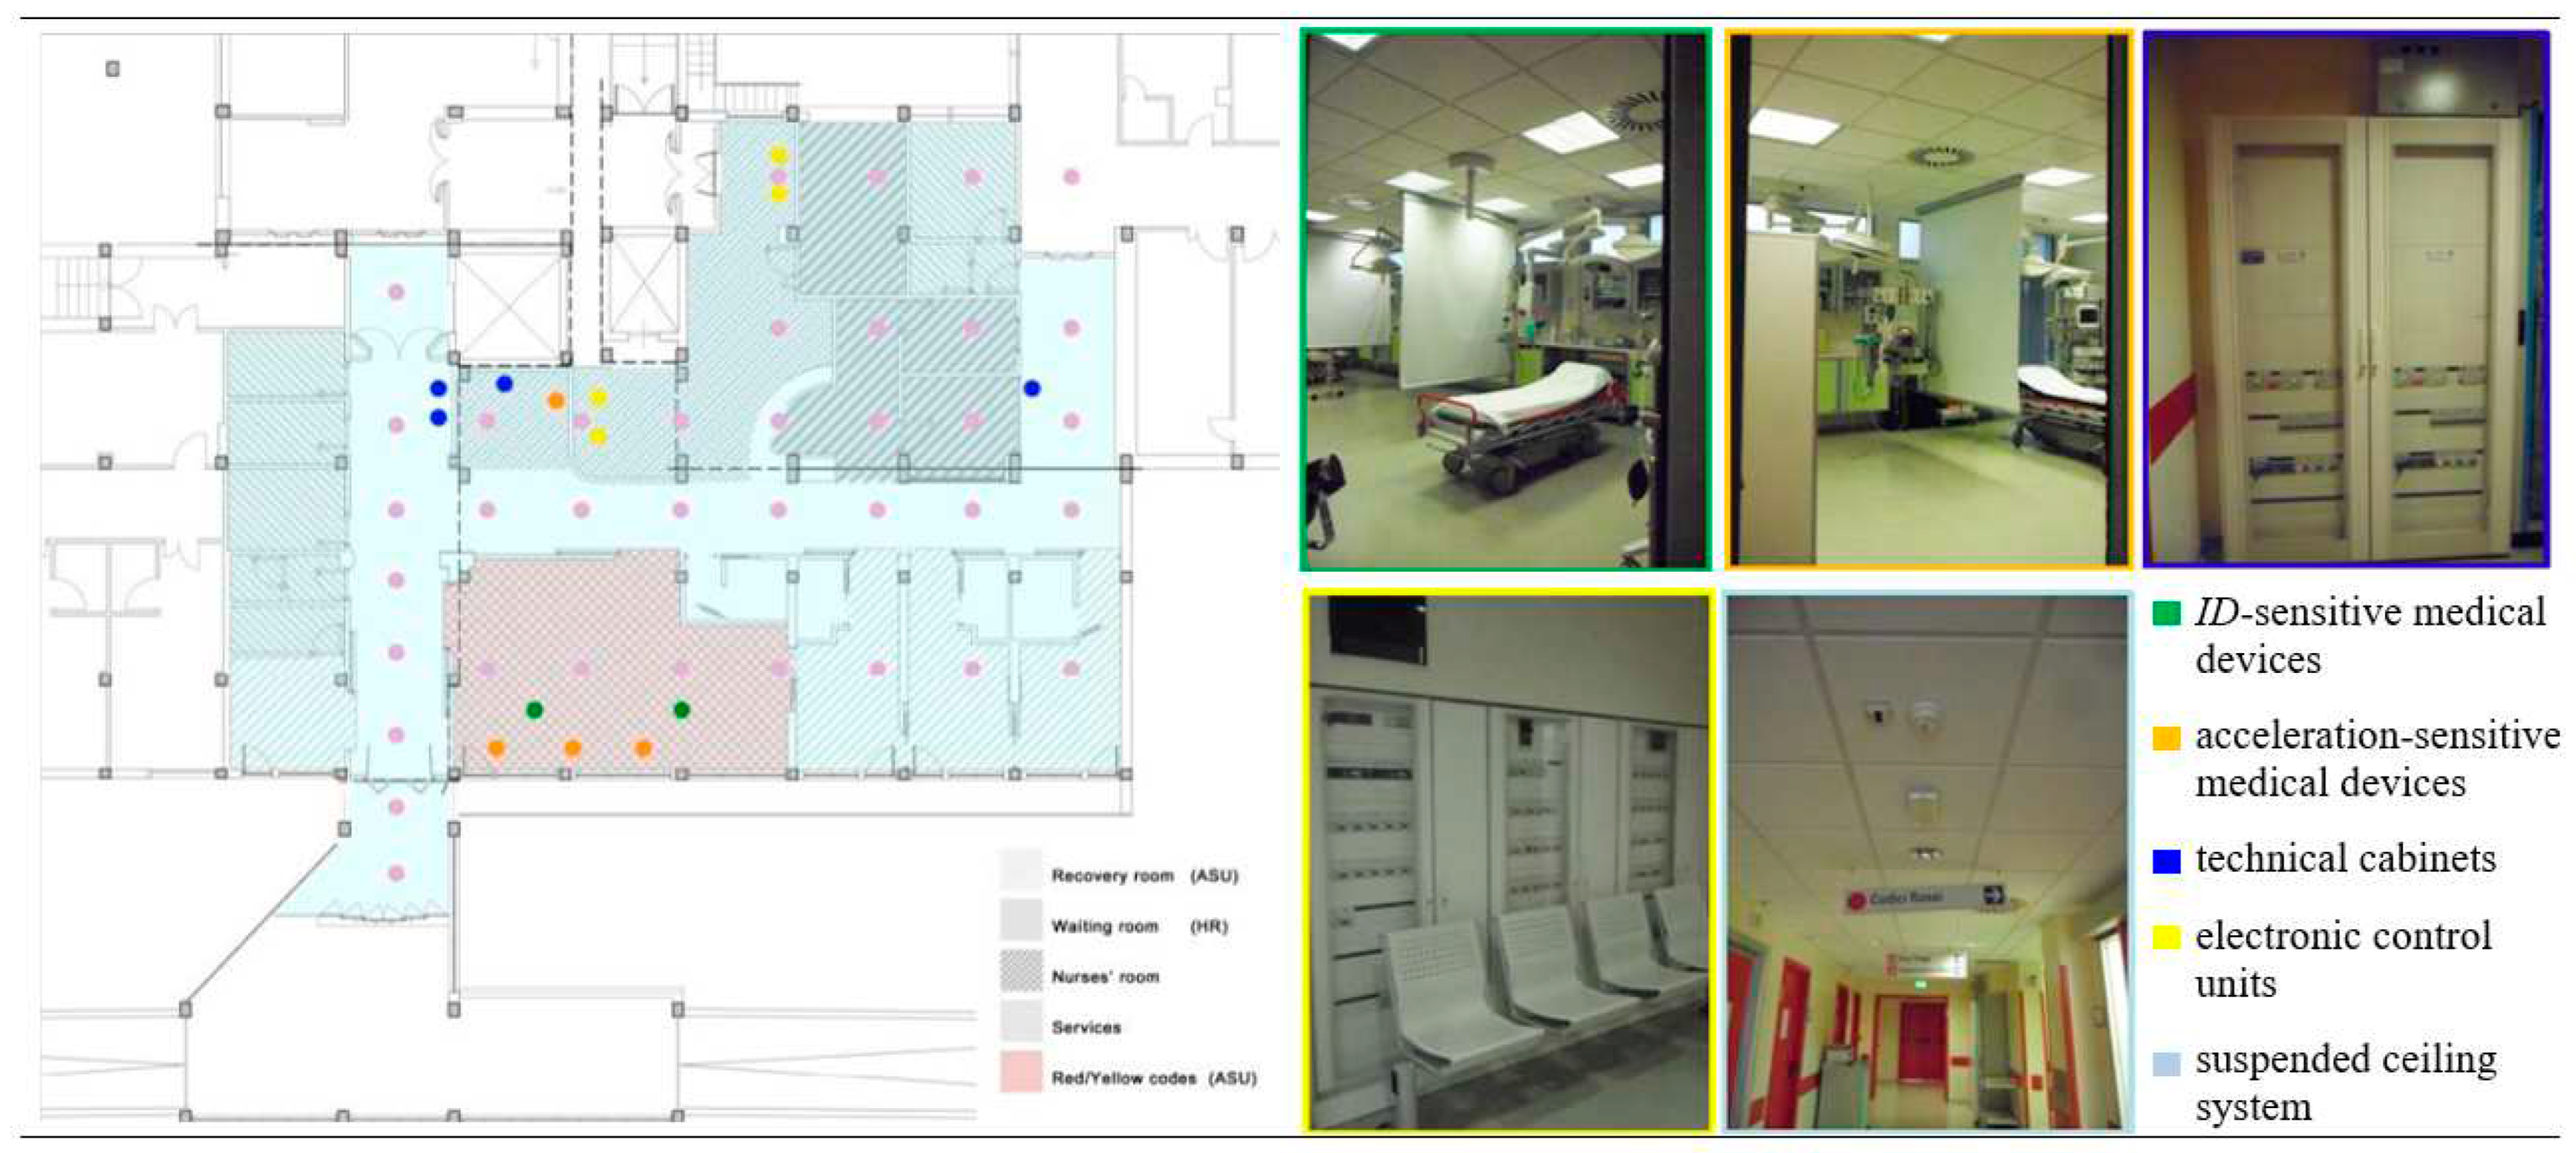
2.3.2. The Nonstructural Components
2.3.3. The Organizational System
2.4. The Metamodel
2.4.1. Assessment of the WT in Standard Conditions
2.4.2. Assessment of the WT in Emergency Conditions
3. The Seismic Response of the EDSH
3.1. Seismic Hazard of the Area
3.2. The Seismic Input
3.3. Effect of the Earthquake on the Physical Systems
3.3.1. Fragility Curves of the Structure
3.3.2. Fragility Curves of the Nonstructural Components
3.3.3. Damages Scenarios at the Occurring of Seismic Excitation
3.4. Effects of the Earthquake on the Organizational System
3.4.1. Changes in the Rescue Demand
3.4.2. Changes in the EDSH Organization
3.5. The EDSH Functionality at the Occurring of a Seismic Emergency
4. EDSH Resilience
4.1. Resilience Modeling
4.2. Resilience of the EDSH
5. Conclusive Remarks
Author Contributions
Funding
Data Availability Statement
Acknowledgments
Conflicts of Interest
References
- Bruneau M & Reinhorn AM, 2006. Overview of the Resilience Concept. Proceedings of the 8th US National Conference on Earthquake Engineering, (2040).
- Bruneau M. & Reinhorn AM, 2007. Exploring the Concept of Seismic Resilience for Acute Care Facilities. Earthquake Spectra, 23(1), pp.41–62. Available online: http://earthquakespectra.org/doi/abs/10.1193/1.2431396 (accessed on 1 July 2014).
- Cimellaro GP, Reinhorn AM & Bruneau M, 2010. Framework for analytical quantification of disaster resilience. Engineering Structures, 32, pp.3639–3649. [CrossRef]
- Cimellaro GP, Reinhorn AM & Bruneau M, 2011. Performed-based metamodel for healthcare facilities. Earthquake Engineering & Structural Dynamics, 40(December 2010), pp.1197–1217. Available at: http://onlinelibrary.wiley.com/doi/10.1002/eqe.2230/full. December.
- Liu J, Zhai C, Yu P (2022). A probabilistic framework to evaluate seismic resilience of hospital buildings using baysian networks. Reliability Engineering and System Safety 226, 1086444.
- Chang S & Shinozuka M, 2004. Measuring improvements in the disaster resilience of communities. Earthquake Spectra, 20(3), pp.739–755. [CrossRef]
- Ardagh MW, Richardson SK, Robinson V, Than M, Gee P, Henderson S, Khodaverdi L, McKie J, Robertson G, Schroeder PP, Deely JM, 2012. The initial health-system response to the earthquake in Christchurch, New Zealand, in February 2011. The Lancet, 379, pp.2109–2115. 20 February. [CrossRef]
- Bruneau M, Chang, Eguchi RT, Lee GC, O’Rourke TD, Reinhorn AM, Masanobu Shinozuka M, Tierney K, Wallace WA, Winterfeldt D, 2003. A Framework to Quantitatively Assess and Enhance the Seismic Resilience of Communities. Earthquake Spectra, 19(4), pp.733–752.
- Ceferino L, Mitrani-Reiser J, Kiremidjian A, Deierlein G & Bambarén C, 2020. Effective plans for hospital system response to earthquake emergencies. Nature Communications volume 11, Article number: 4325 (2020). [CrossRef]
- Tariverdi M, Miller-Hooks E, Kirsch T, 2018. Strategies for improved hospital response to mass casualty incidents, Disaster Med. Public Health Prep. 12 (6) (2018) 778–790. [CrossRef]
- Cimellaro GP, Piquet M, 2016. Resilience of a hospital emergency department under seismic event, Advances in Structural Engineering 19 (5) (2016) 825–836.
- Hassan EM, Mahmoud H, 2020. An integrated socio-technical approach for postearthquake recovery of interdependent healthcare system, Reliab. Eng. Syst. Saf. 201 (2020) 106953. [CrossRef]
- Viti S, Cimellaro GP & Reinhorn AM, 2006. Retrofit of hospital through strength reduction and enhanced damping. Smart Structures and Systems, 2(4), pp.339–335. [CrossRef]
- Nuti C & Vanzi I, 1998. Assessment of post-earthquake availability of hospital system and upgrading strategies. Earthquake Engineering & Structural Dynamics, 27(12), pp.1403– 423.
- WHO, 2006. Health facility seismic Health facility seismic vulnerability evaluation. World Health.
- Badillo-Almarez H, Reinhorn AM & Whittaker A, 2007. Seismic Fragility of Suspended Ceiling Systems. Earthquake Spectra, 23. [CrossRef]
- Myrtle RC, Masri SF, Nigbor RL, Caffrey JP, 2005. Classification and prioritization of essential systems in hospitals under extreme events. Earthquake Spectra, 21, pp.779–802. [CrossRef]
- Miniati R & Iasio C, 2012. Methodology for rapid seismic risk assessment of health structures: Case study of the hospital system in Florence, Italy. International Journal of Disaster Risk Reduction, 2, pp.16–24. [CrossRef]
- Masi A, Santarsiero G & Chiauzzi L, 2012. Vulnerability Assessment and Seismic Risk Reduction Strategies of Hospitals in Basilicata Region (Italy). In Proceedings of the 15th World Conference on Earthquake Engineering - WCEE, pp.1–10.
- Uma SR & Beattie GJ, 2010. Seismic Assessment of Engineering Systems in Hospitals – A Challenge for Operational Continuity. In New Zealand Society for Earthquake Engineering Annual Meeting.
- Davenport PN, 2004. Review of seismic provisions of historic New Zealand loading codes. In New Zealand Society for Earthquake Engineering Annual Meeting.
- IoM, 2006. 2Hospital-Based Emergency Care: At the Breaking Point, IPDED, I.P.D. and E.D., 2010. Project retrofitting Studies.
- ASPR, 2013. Hospital Preparedness Program. Available at: available at http://www.phe.gov/preparedness/plann.
- Hossain L & Kit DC, 2012. Modeling coordination in hospital emergency departments through social network analysis. Disasters, 36(2), pp. 338–364.
- Fawcett W & Oliveira CS, 2000. Casualty treatment after earthquake disasters: Development of a regional simulation model. Disasters, 24(3), pp.271–287. [CrossRef]
- Porter K & Ramer K, 2012. Estimating earthquake-induced failure probability and downtime of critical facilities. Journal of Business Continuity and Emergency Planning, 5, pp.352– 364.
- Unanwa CO, McDonald JR, Mehta KC, Smith DA, 2000. The development of wind damage bands for buildings. Journal of Wind Engineering and Industrial Aerodynamics, 84, pp.119–149.
- Jacques CC, McIntosh J, Giovinazzi S, Kirsch TD, Wilson T, Mitrani-Reiser J, 2014. Resilience of the Canterbury Hospital System to the 2011 Christchurch Earthquake. Earthquake Spectra, 30(1), pp.533–554. [CrossRef]
- Alowad A, Samaranayake P, Ahshan KB, Karim A, 2020. Enhancing patient flow in emergency department (ED) using lean strategies–an integrated voice of customer and voice of process perspective, Business Process Management Journal. [CrossRef]
- Sabir SM, Mustafa FA (2023). Performance-based building design: Impact of emergency department layout on its functional performance efficiency – the case of Erbil hospitals. Open House International.
- Ali AA, Azharul KA, Hisham AH, Kazi AK, Premaratne S (2020). Enhancing patient flow in emergency department (ED) using lean strategies–an integrated voice of customer and voice of process perspective. Business Process Management Journal.
- Setola R, 2007. Availability of healthcare services in a networkbased scenario. International Journal Networking Visual Organization, 4(2). [CrossRef]
- Kuwata Y & Takada S, 2007. Seismic risk assessment of lifeline considering hospital functions. Asian Journal of Civil Engineering, 21(3), pp.315–28.
- Yao G, 2000. Identification of earthquake damaged operational and functional components in hospital buildings. Journal of the Chinese Institute of Engineers, 23(4). [CrossRef]
- Lupoi G, Franchin P, Lupoi A, Pinto PE & Calvi GM, 2008. Probabilistic seismic assessment for hospitals and complex-social systems IUSS Press., Pavia.
- Leontief WW, 1986. Input-Output Economics, 2nd ed. Oxford University Press.
- Haimes YY, Horovitz BM, Lambert JH, Santos JR, Lian C, Crowther KG, 2005. Inoperability input–output model for interdependent infrastructures sectors. I: Theory and methodology. Journal of Infrastructure System, 11(2), pp.67–79.
- Lee EE, Mitchell JE, and Wallace WA, 2003. Restoration of services in interdependent infrastructure systems: a network flows approach, Troy, N.Y. [CrossRef]
- Arboleda CA, Abraham DM & Lubitz RM, 2007. Simulation as a tool to assess the vulnerability of the operation of a health care facility. Journal of Performance of Construction Facility, 21(4), pp.302–312. [CrossRef]
- Yavari S, Chang SE & Elwood KJ, 2010. Modeling post-earthquake functionality of regional health care facilities. Earthquake Spectra, 26, pp.869–892. [CrossRef]
- McCabe OL, Barnett DJ, Taylor HG, Links JM, 2010. Ready, willing, and able: A framework for improving the public health emergency preparedness system. Disaster medicine and public health preparedness,4, pp.161–168. [CrossRef]
- Cimellaro GP, Fumo C, Reinhorn AM and Bruneau M, 2008. Seismic resilience of health care facilities. 14th World Conference on Earthquake Engineering (14WCEE), Beijing, China, 12-17 October, 2008.
- Miles SB & Chang SE, 2006. Modeling community recovery from earthquakes. Earthquake Spectra, 22(2), pp.439–458. [CrossRef]
- Pianigiani M & Viti S, (2021). Functionality analysis of emergency departments: A case study. JOURNAL OF BUILDING ENGINEERING, vol. 40, pp. 1-13, ISSN:2352-7102.
- McCarthy K, McGee HM & O’Boyle CA, 2000. Outpatient clinic waiting times and nonattendance as indicators of quality. Psychology, Health and Medicine, 5, p.287. [CrossRef]
- Thompson DA & Yarnold PR, 1995. Relating patient satisfaction to waiting time perceptions and expectations: the disconfirmation paradigm. Academic emergency medicine: official journal of the Society for Academic Emergency Medicine, 2(12), pp.1057–1062. [CrossRef]
- Thompson DA Paul R Yarnold PR, Williams DR, Adams SL, 1996. Effects of actual waiting time, perceived waiting time, information delivery, and expressive quality on patient satisfaction in the emergency department. Annals of Emergency Medicine, 28(6), p.657. [CrossRef]
- Richards ME, Crandall CS & Hubble MW, 2006. Influence of ambulance arrival on emergency department time to be seen. Prehospital Emergency Care, 12(1-7), pp.440–446. [CrossRef]
- Przelazloski K, 2014. Collapse Fragility Analysis on Sansepolcro Hospital Structure. Master Degree Dissertation, Università degli Studi di Pavia.
- NTC 2008. Norme tecniche per le costruzioni. Decreto Ministeriale 14 gennaio 2008, Ministero Infrastrutture e Trasporti G.U.R.I. 4 Febbraio 2008, Roma, Italy (in Italian).
- Pianigiani M, 2016. Seismic Resilience of Hospital Systems. PhD Dissertation, Università degliu Studi di Firenze.
- Price RN, 1999. ProModel Manufacturing Simulation Software: Reference Guide, Version 4.2, ProModel Corporation, Orem, UT.
- NTC 2018. Aggiornamento delle Norme Tecniche per le Costruzioni; Decreto Ministeriale 17 gennaio 2018, Ministero delle Infrastrutture e dei Trasporti, G.U.R.I. n. 42 del 20 febbraio 2018. Roma, Italy (In Italian).
- Viti S, Tanganelli M, D’Intinosante V & Baglione M (2017): Effects of Soil Characterization on the Seismic Input, Journal of Earthquake Engineering. [CrossRef]
- FEMA, 2009, Quantification of Building Seismic Performance Factors, FEMA P-695, prepared by Applied Technology Council for the Federal Emergency Management Agency, Washington, D.C.
- Pianigiani M, Przelazloski K, Christovasilis IP, Cimellaro GP, De Stefani M, Filiatrault A, Sullivan TJ, Tanganelli M, 2014. A comprehensive methodology for evaluating the seismic resilience of health care facilities considering nonstructural components and organizational models. In Second European Conference on Earthquake andn seismology. Istanbul, Turkey, pp. 1–4.
- Cosenza E, Di Sarno L, Maddaloni G, Maddaloni, Magliulo G, Petrone C, Prota A, 2014. Shake table tests for the seismic fragility evaluation of hospital rooms. Earthquake Engineering & Structural Dynamics. Available at: http://onlinelibrary.wiley.com/doi/10.1002/eqe.2230/full.
- Aroni S & Durkin M, 1987. Injuries and occupant behavior in earthquakes. Samuel Aroni and Romulus Constantinescu. Washington D.C.
- Cheu DH, 1994. Northridge earthquake, January 17, 1994: the hospital response. 17 January.
- Durkin ME, 1995. Fatalities, non-fatal injuries and medical aspects of a Northridge earthquake. EEFIT, 2009. The L’Aquila, Italy, Earthquake of 6 April 2009. pp.1–54. 6 April.
- Mahue M, 1996. Methodologies for Comparing Injury Data: Impact of Northridge Injuries on Emergency Department in Los Angeles County.
- Olson RA & Alexander DE, 1996. Summary of Proceedings. In Jesuit Retreat House, Los Altos, California. Second National Workshop on Modelling Earthquake Casualties for Planning and Response.
- Salinas C, Salinas C. & Kurata J, 1998. The effects of Northridge Earthquake on the Pattern of Emergency Department Care. American Journal of Emergency Medicine, 16(3), pp.254–256.
- Kafali C & Grigoriu M, 2005. Rehabilitation decision analysis. In: ICOSSAR’05. In Proceedings of the 9th international conference on structural safety and reliability.
- Chang S, Svekla WD & Shinouza M, 2002. Linking infrastructure and urban economy – Simulation of water disruption impacts in Earthquakes. Environment and Planning B: Planning and Design, 29(2), pp.281–301.




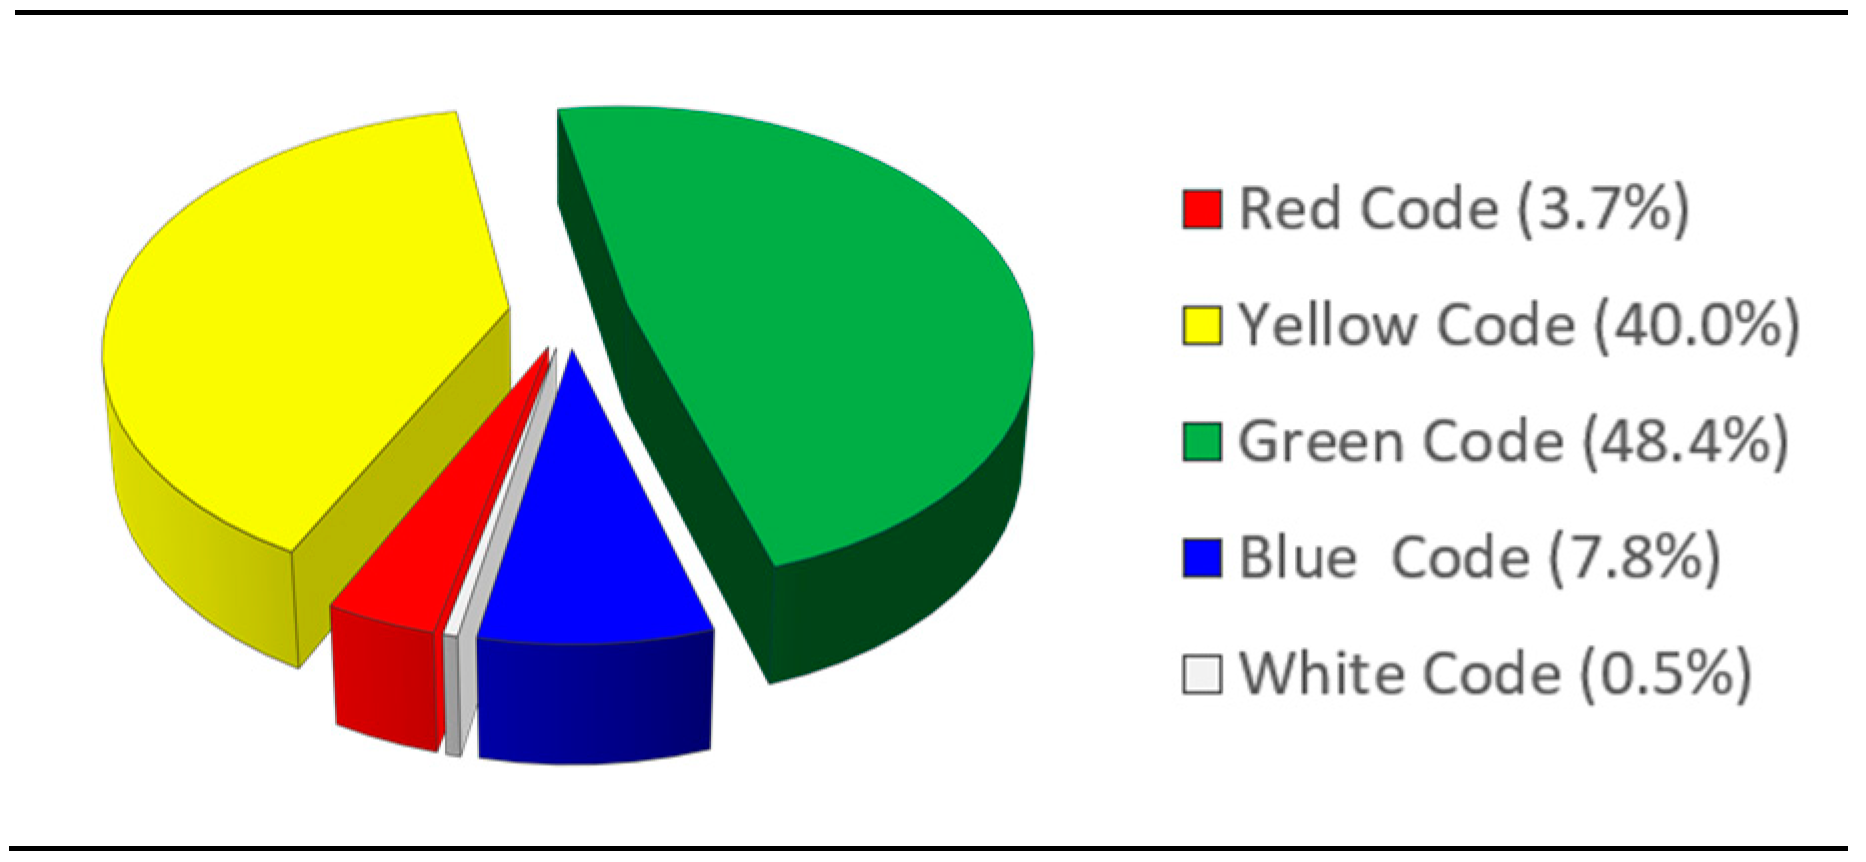


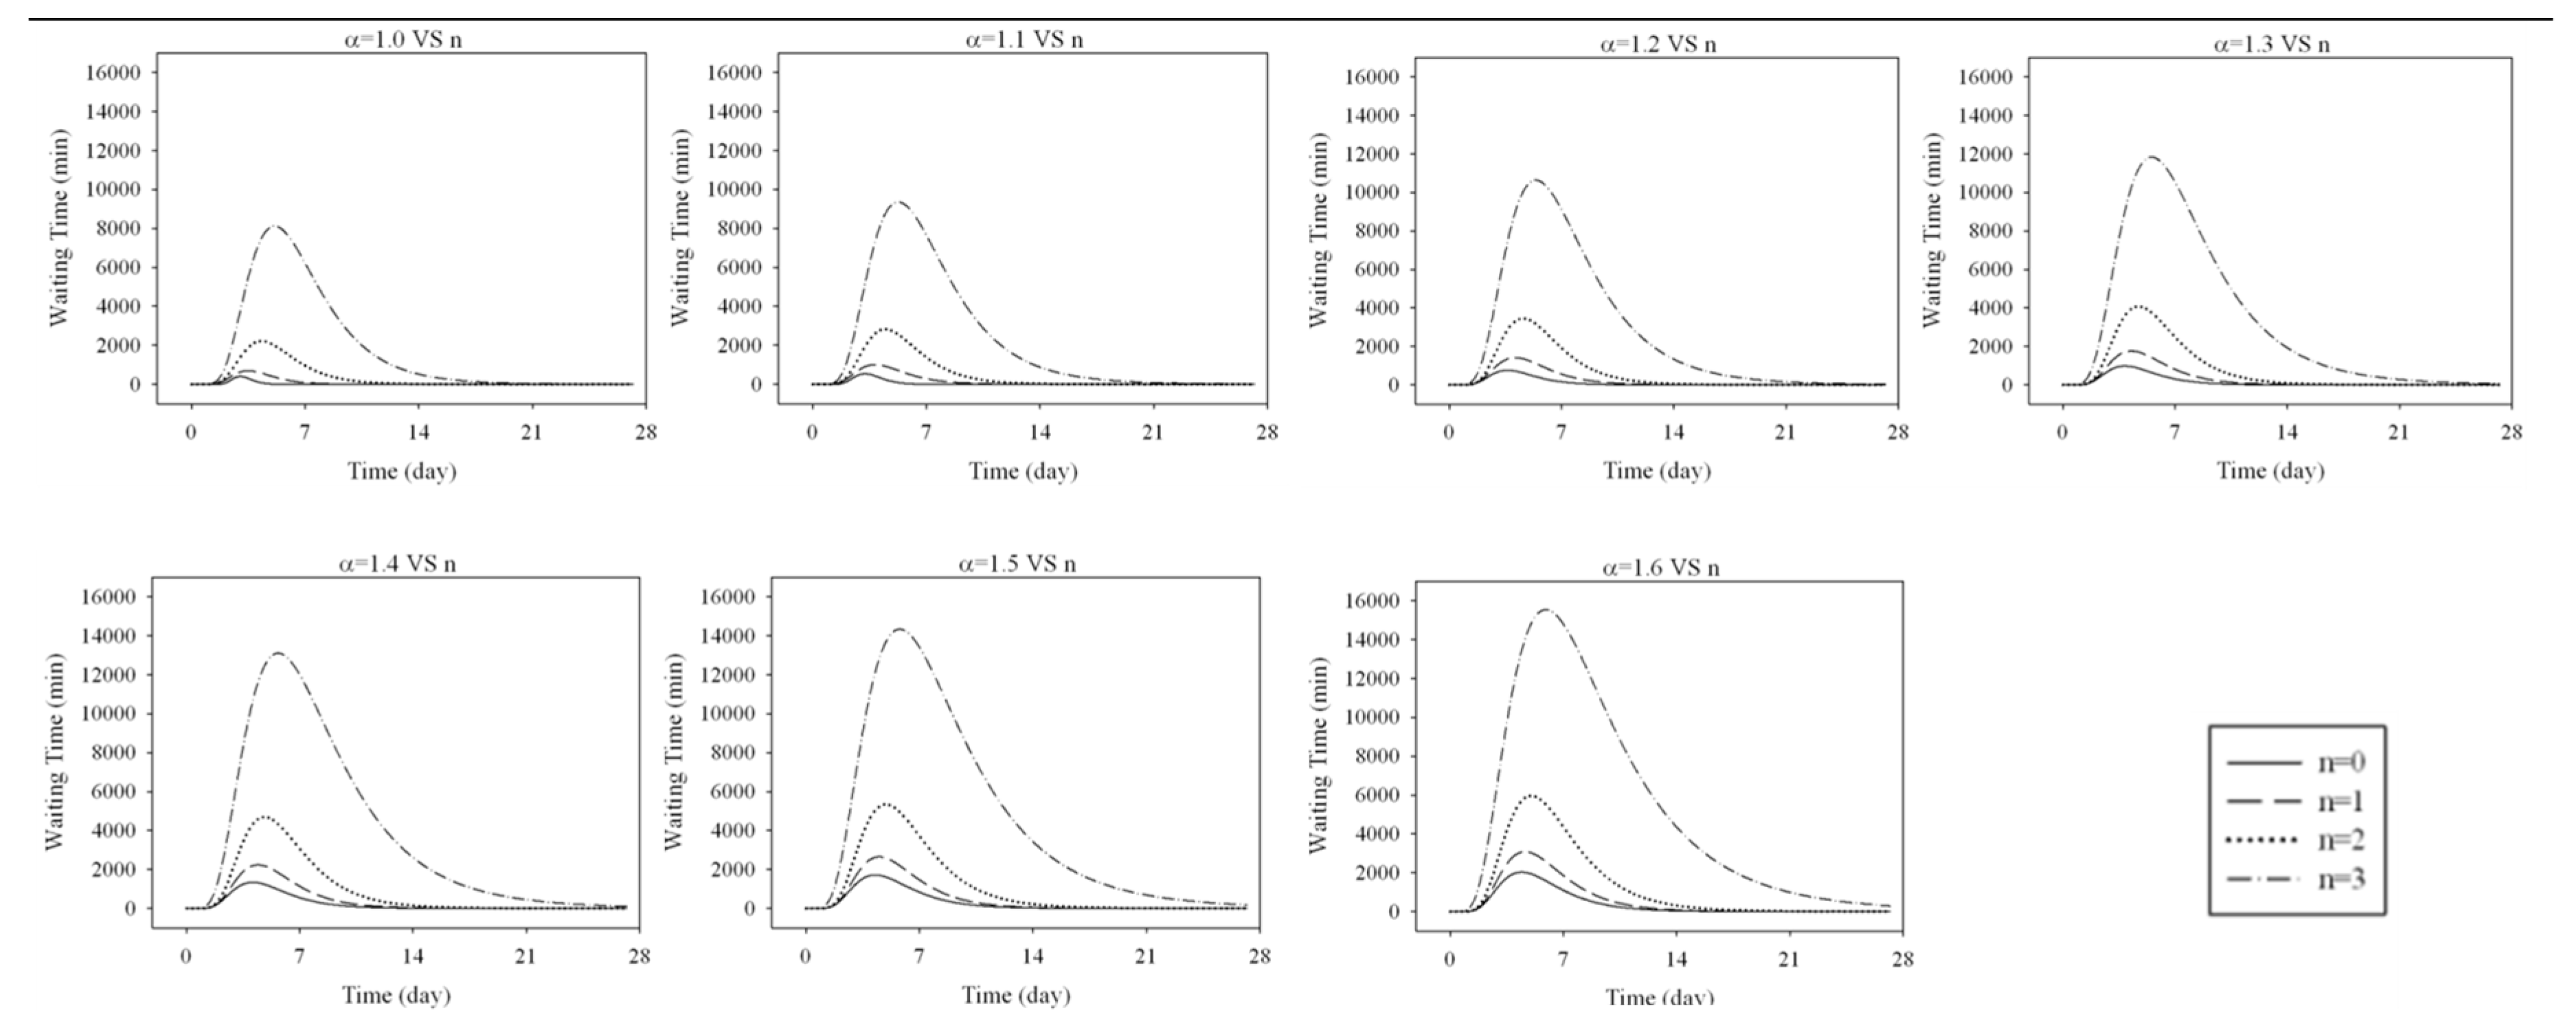
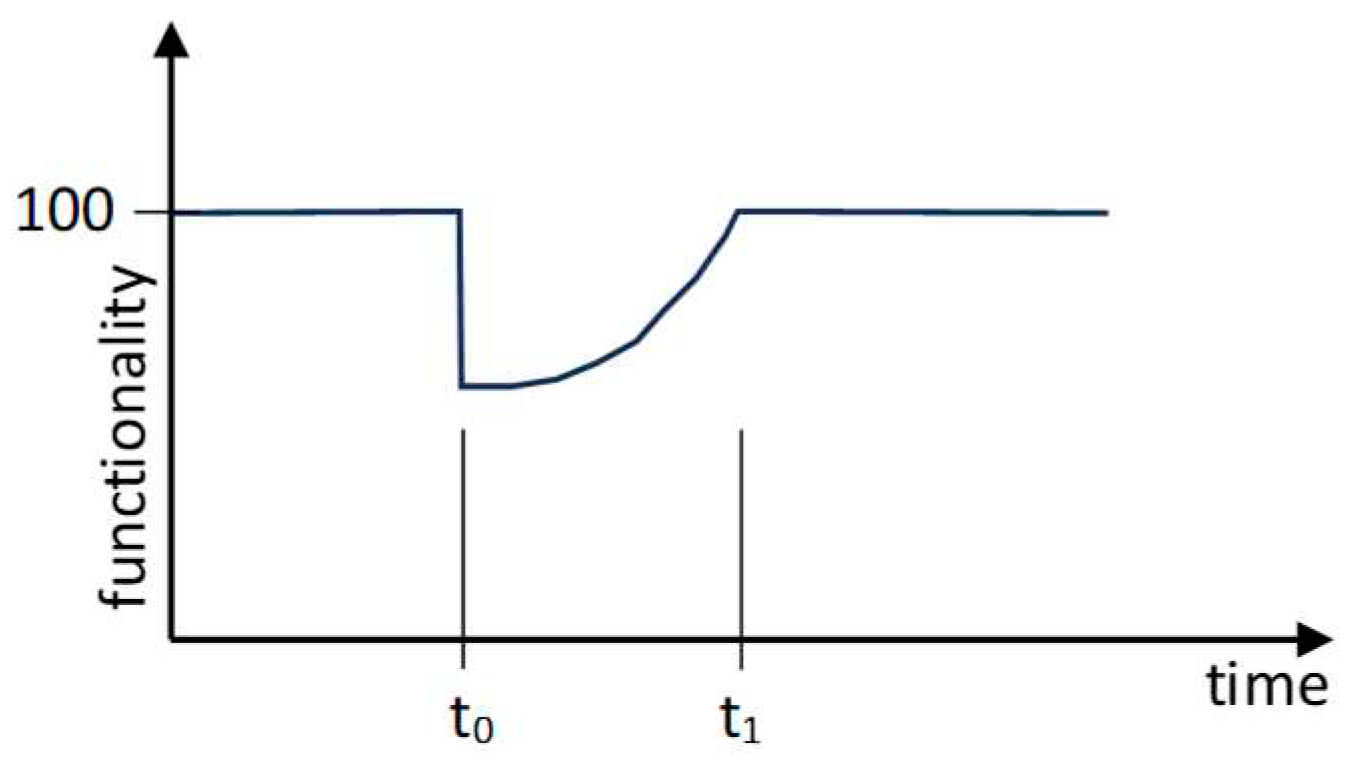


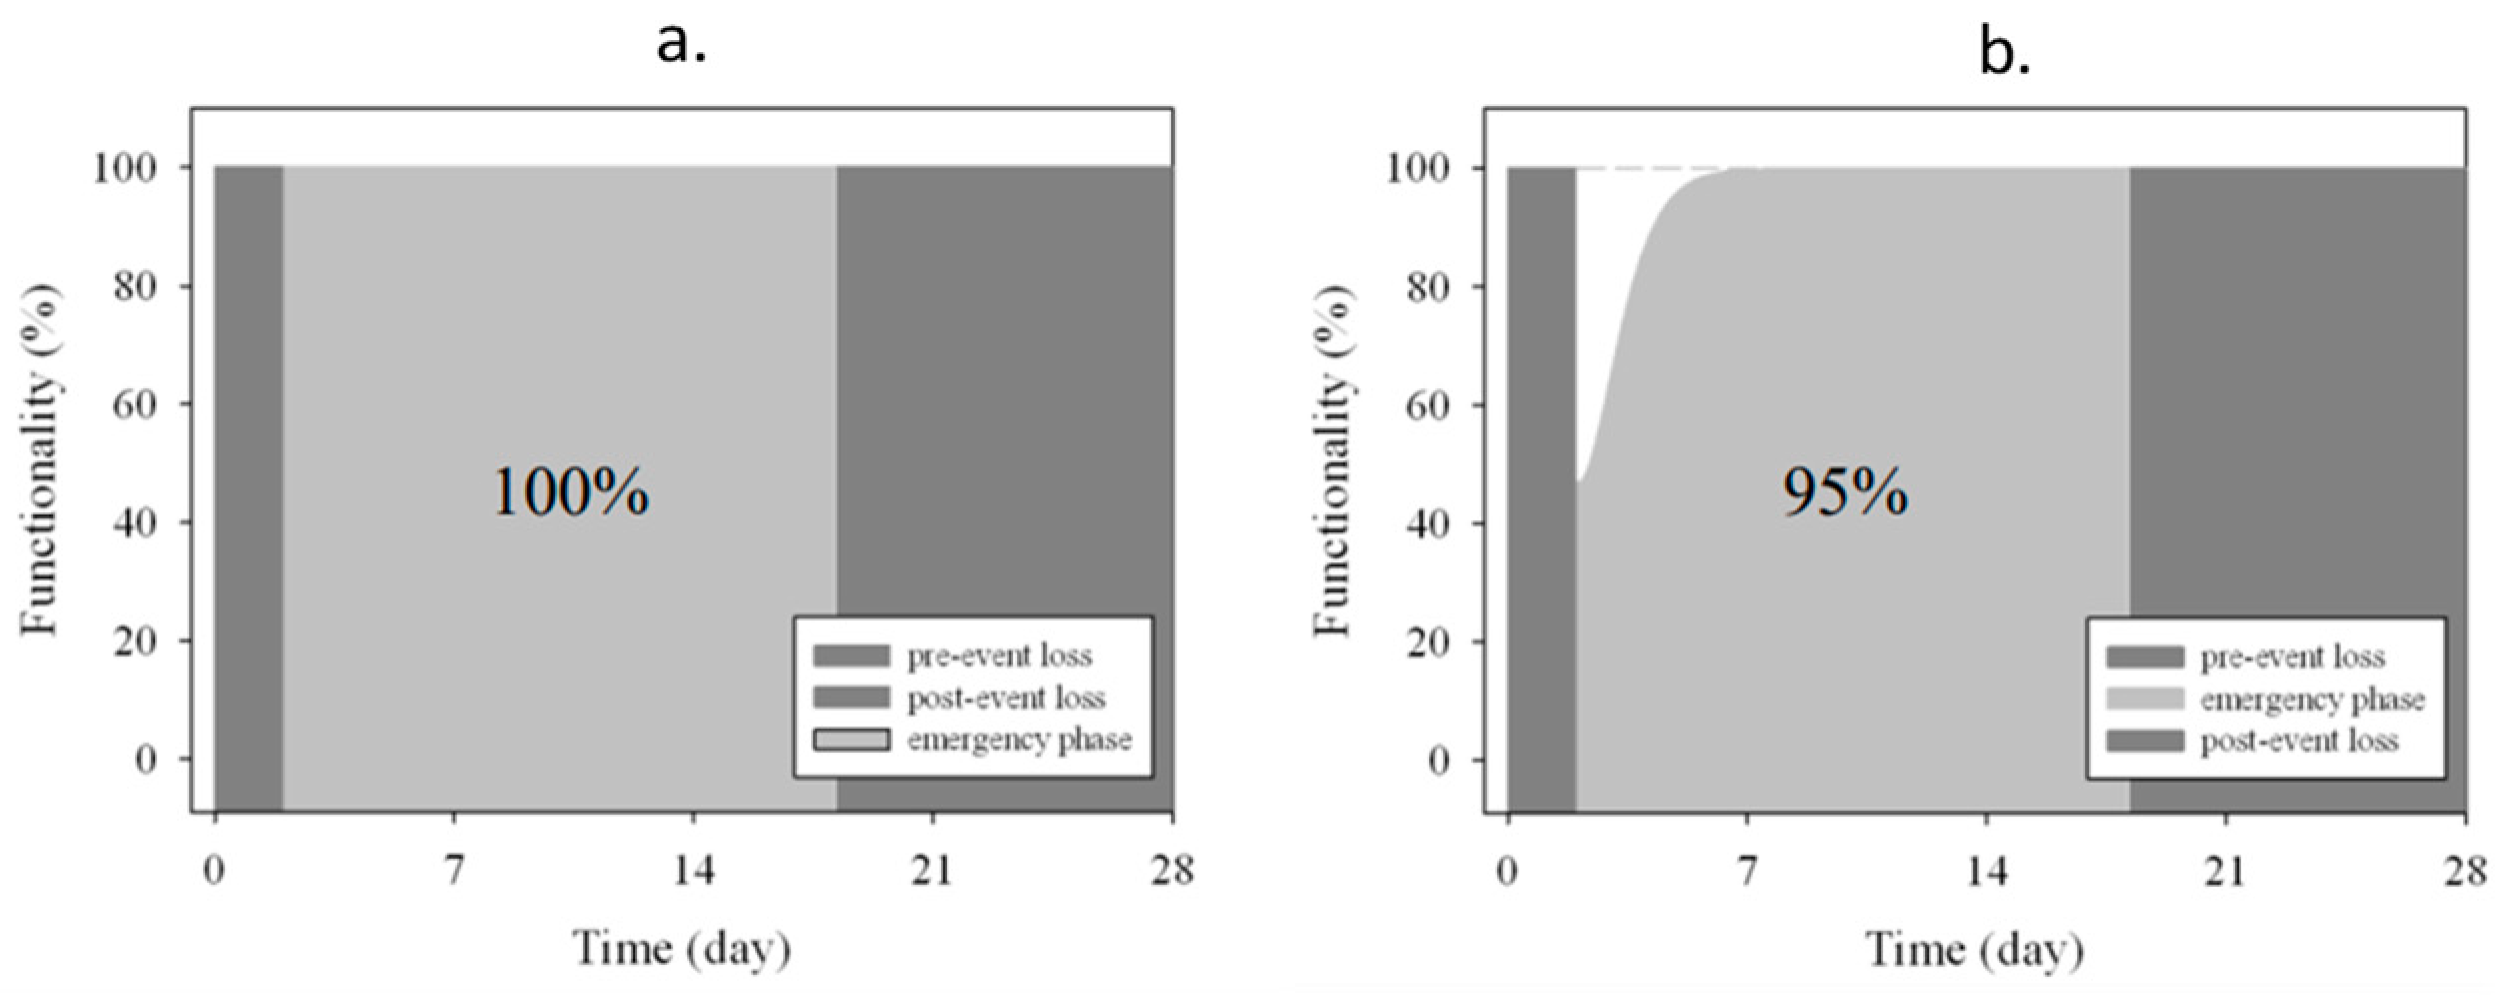


| Estimate time (in minutes) of staying for each color code | Mutual distances (in meters) | |||||||||||
| Red | Yellow | Green | Blue | White | Entry | REC | ER | WR | ACM | OBI | ||
| (0.5%) | (10.6%) | (45.1%) | (1.72%) | (41.8%) | Entry | 0 | 20 | 9 | 25 | 25 | 25 | |
| Entry | REC | 0 | 10 | 3 | 10 | 10 | ||||||
| REC | 2-5 | 2-5 | 5-10 | 5-10 | 5-10 | ER | 0 | 12.5 | 17.5 | 13 | ||
| ER | 15-30 | 15-30 | WR | 0 | 12 | 12 | ||||||
| ACM | 10-20 | 10-15 | 5-10 | ACM | 0 | 18 | ||||||
| OBI | 240-2880 | OBI | 0 | |||||||||
| ID | Event Name | Recording Station | PGA | ID | Event Name | Recording Station | PGA |
| 1 | Northridge, CA | Beverly Hills - 14145 Mulhol | 0.52 | 12 | Lander, CA | Coolwater | 0.42 |
| 2 | Northridge, CA | Canyon Country - W Lost Cany | 0.48 | 13 | Loma Prieta, CA | Capitola | 0.53 |
| 3 | Duzce, Turkey | Bolu | 0.82 | 14 | Loma Prieta, CA | Gilroy Array #3 | 0.56 |
| 4 | Hector Mine, CA | Hector | 0.34 | 15 | Manjil, Iran | Abbar | 0.51 |
| 5 | Imperial Valley, CA | Delta | 0.35 | 16 | Superstition Hills, CA | El Centro Imp. Co. Cent | 0.36 |
| 6 | Imperial Valley, CA | El Centro Array #11 | 0.38 | 17 | Superstition Hills, CA | Poe Road (temp) | 0.45 |
| 7 | Kobe, Japan | Nishi-Akashi | 0.51 | 18 | Cape Mendocino, CA | Rio Dell Overpass - FF | 0.55 |
| 8 | Kobe, Japan | Shin-Osaka | 0.24 | 19 | Chi-Chi, Taiwan | CHY101 | 0.44 |
| 9 | Kocaelia, Turkey | Duzce | 0.36 | 20 | Chi-Chi, Taiwan | TCU045 | 0.51 |
| 10 | Kocaelia, Turkey | Arcelik | 0.22 | 21 | San Fernando, CA | LA - Hollywood Stor FF | 0.21 |
| 11 | Lander, CA | Yermo Fire Station | 0.24 | 22 | Friuli, Italy | Tolmezzo | 0.35 |
| 22% in 50 years | 10% in 50 years | ||||||||||||||||
| No | Event name | Recording Station | PGA | No | Event name | Recording Station | PGA | ||||||||||
| 1 | Northridge, CA | LA - N Figueroa St | 0.29 | 1 | Coalinga, CA | Palmer Ave | 0.29 | ||||||||||
| 2 | Whittier Narrows, CA | LA - Baldwin Hills | 0.18 | 2 | Chi-Chi, Taiwan | CHY032 | 0.18 | ||||||||||
| 3 | Northridge, CA | Burbank - Howard Rd. | 0.20 | 3 | Northridge, CA | Manhattan Beach - Manhattan | 0.20 | ||||||||||
| 4 | Northwest China | Jiashi | 0.37 | 4 | Coalinga, CA | Skunk Hollow | 0.37 | ||||||||||
| 5 | Northridge, CA | Newhall - Fire Station | 0.45 | 5 | Sierra Madre, CA | Altadena - Eaton Canyon | 0.45 | ||||||||||
| 6 | Northridge, CA | Santa Barbara - UCSB Goleta | 0.23 | 6 | Northridge, CA | Downey - Co Maint Bldg | 0.23 | ||||||||||
| 7 | Hector Mine, CA | Fun Valley | 0.22 | 7 | Chi-Chi, Taiwan | TCU075 | 0.22 | ||||||||||
| 8 | Chi-Chi, Taiwan | CHY088 | 0.34 | 8 | Chi-Chi, Taiwan | TCU079 | 0.34 | ||||||||||
| 9 | Landers, CA | Fort Irwin | 0.28 | 9 | Sierra Madre, CA | Pasadena - USGS/NSMP Office | 0.28 | ||||||||||
| 10 | Chi-Chi, Taiwan | CHY015 | 0.49 | 10 | Northridge, CA | LA - Univ. Hospital | 0.49 | ||||||||||
| 11 | Taiwan SMART1 | SMART1 M07 | 0.18 | 11 | Mammoth Lakes, CA | Convict Creek | 0.18 | ||||||||||
| 12 | Chi-Chi, Taiwan | TCU129 | 0.14 | 12 | Taiwan SMART1 | SMART1 E02 | 0.14 | ||||||||||
| 13 | Irpinia, Italy | Rionero In Vulture | 0.20 | 13 | Hollister, CA | Hollister City Hall | 0.20 | ||||||||||
| 14 | Northridge, CA | Compton - Castlegate St | 0.14 | 14 | Northridge, CA | Lakewood - Del Amo Blvd | 0.14 | ||||||||||
| 15 | Imperial Valley, CA | Niland Fire Station | 0.27 | 15 | Prarkfield, CA | Cholame - Shandon Array #8 | 0.27 | ||||||||||
| 16 | Whittier Narrows, CA | La Habra - Briarcliff | 0.21 | 16 | Northridge, CA | LA - 116th St School | 0.21 | ||||||||||
| 17 | Chi-Chi, Taiwan | HWA058 | 0.26 | 17 | Northridge, CA | San Gabriel - E Grand Ave | 0.26 | ||||||||||
| 18 | Whittier Narrows, CA | San Marino - SW Academy | 0.27 | 18 | Kalamata, Greece | Kalamata | 0.27 | ||||||||||
| 19 | Mammoth Lakes, CA | Mammoth Lakes H. S. | 0.19 | 19 | Loma Prieta, CA | Fremont - Emerson Court | 0.19 | ||||||||||
| 20 | Sierra Madre, CA | Cogswell Dam - Right Abutment | 0.23 | 20 | Whittier Narrows, CA | El Monte - Fairview Av | 0.23 | ||||||||||
| 21 | Northridge, CA | Northridge - 17645 Saticoy St | 0.61 | 21 | Coalinga, CA | Coalinga-14th & Elm (Old CHP) | 0.61 | ||||||||||
| 22 | Northwest China | Jiashi | 0.18 | 22 | Northridge, CA | Moorpark - Fire Station | 0.18 | ||||||||||
| 5% in 50 years | 2% in 50 years | ||||||||||||||||
| No | Event name | Recording Station | PGA | No | Event name | Recording Station | PGA | ||||||||||
| 1 | Prarkfield, CA | Cholame - Shandon Array #5 | 0.44 | 1 | Tabas, Iran | Dayhook | 0.41 | ||||||||||
| 2 | Northridge, CA | Pacific Palisades - Sunset | 0.47 | 2 | North Palm Springs, CA | Desert Hot Springs | 0.33 | ||||||||||
| 3 | Northridge, CA | LA - N Westmoreland | 0.40 | 3 | Northridge, CA | Beverly Hills - 12520 Mulhol | 0.62 | ||||||||||
| 4 | Whittier Narrows, CA | Downey - Birchdale | 0.30 | 4 | Northridge, CA | LA 00 | 0.39 | ||||||||||
| 5 | Kern County, CA | Taft Lincoln School | 0.18 | 5 | Chi-Chi, Taiwan | TCU080 | 0.54 | ||||||||||
| 6 | Chi-Chi, Taiwan | TCU075 | 0.22 | 6 | Coalinga, CA | Cantua Creek School | 0.28 | ||||||||||
| 7 | Chi-Chi, Taiwan | CHY088 | 0.26 | 7 | Coyote Lake, CA | Gilroy Array #6 | 0.43 | ||||||||||
| 8 | San Fernando, CA | LA - Hollywood Stor FF | 0.21 | 8 | Northwest China | Jiashi | 0.30 | ||||||||||
| 9 | Chi-Chi, Taiwan | CHY010 | 0.23 | 9 | Northridge, CA | Stone Canyon | 0.39 | ||||||||||
| 10 | Chi-Chi, Taiwan | CHY047 | 0.14 | 10 | Chalfant Valley, CA | Bishop - LADWP South St | 0.25 | ||||||||||
| 11 | San Fernando, CA | Castaic - Old Ridge Route | 0.32 | 11 | Chi-Chi, Taiwan | TCU078 | 0.47 | ||||||||||
| 12 | Chalfant Valley, CA | Bishop - LADWP South St | 0.25 | 12 | Managua, Nicaragua | Managua, ESSO | 0.42 | ||||||||||
| 13 | Imperial Valley, CA | Calexico Fire Station | 0.27 | 13 | Chi-Chi, Taiwan | TCU078 | 0.39 | ||||||||||
| 14 | Northridge, CA | LA - Fletcher Dr | 0.24 | 14 | Northridge, CA | LA - Chalon Rd | 0.23 | ||||||||||
| 15 | Kobe, Japan | Tadoka | 0.29 | 15 | Corinth, Greece | Corinth | 0.30 | ||||||||||
| 16 | Chi-Chi, Taiwan | ILA067 | 0.20 | 16 | Imperial Valley, CA | SAHOP Casa Flores | 0.51 | ||||||||||
| 17 | Whittier Narrows, CA | LA - Fletcher Dr | 0.21 | 17 | Friuli, Italy | Tolmezzo | 0.35 | ||||||||||
| 18 | Whittier Narrows, CA | Garvey Res. - Control Bldg | 0.46 | 18 | North Palm Springs, CA | Whitewater Trout Farm | 0.61 | ||||||||||
| 19 | Loma Prieta, CA | Gilroy - Gavilan Coll. | 0.36 | 19 | Coalinga, CA | Oil City | 0.87 | ||||||||||
| 20 | Chi-Chi, Taiwan | TCU129 | 0.95 | 20 | Chi-Chi, Taiwan | TCU095 | 0.71 | ||||||||||
| 21 | Prarkfield, CA | Cholame - Shandon Array #5 | 0.29 | 21 | Northridge, CA | Pacoima Dam (downstr) | 0.43 | ||||||||||
| 22 | Northridge, CA | Pacific Palisades - Sunset | 0.39 | 22 | Yountville, CA | Napa Fire Station #3 | 0.51 | ||||||||||
| Staff functioning | Mutual distances (in meters) between the zones | ||||||
| Staff Role | Number | Working time | ENTRY | R-zone | Y-zone | OR | |
| Nurse | 9 | H24 | ENTRY | 0 | 7.5 | 30 | 60 |
| Help Operator | 4 | H24 | R-zone | - | 0 | 10 | 60 |
| Doctors | 7 | H24 | Y-zone | - | - | 0 | 70 |
| Other | 2 | H24 | OR | - | - | - | 0 |
| WT curve | Functionality curve | ||||||||
| Point | X-coordinate (days) | Y-coordinate (minutes) | Point | X-coordinate (days) | Y-coordinate (%) | ||||
| general | α=1, n=3 | general | α=1, n=3 | general | α=1, n=3 | general | α=1, n=3 | ||
| A | 0 | 0 | 0 | 0 | A | 0 | 0 | 100 | 100 |
| B | t0 | 2 | 0 | 0 | B | t0 | 2 | 100 | 100 |
| C | t0 | 2 | WT peak | 8195.8 | C | t0 | 2 | Residual functionality | 0 |
| D | t0 + normalized recovery time | 10.636 | 0 | 0 | D | t0 + equivalent recovery time | 10.636 | 100 | 100 |
| E | Simulation end | 27,77 | 0 | 0 | E | Simulation end | 27,77 | 0 | 100 |
Disclaimer/Publisher’s Note: The statements, opinions and data contained in all publications are solely those of the individual author(s) and contributor(s) and not of MDPI and/or the editor(s). MDPI and/or the editor(s) disclaim responsibility for any injury to people or property resulting from any ideas, methods, instructions or products referred to in the content. |
© 2024 by the authors. Licensee MDPI, Basel, Switzerland. This article is an open access article distributed under the terms and conditions of the Creative Commons Attribution (CC BY) license (http://creativecommons.org/licenses/by/4.0/).


