1. Introduction
The impact of natural products on new medicines’ discoveries has been indispensable. Over the past 30 years, molecules inspired by nature constituted the mainstay of chemotherapy [
1]. Moreover, natural products continue to provide novel lead structures which serve as templates for the synthesis of more potent and safer compounds [
2], highlighting the importance of continued research for new anticancer agents from nature.
Apoptosis-based chemotherapy constitutes a core focus for anticancer drug development as achieving this goal is expected to profoundly improve clinical response [
3,
4]. However, apoptosis evasion is a cancer hallmark [
5], and non-apoptotic death mechanisms e.g. senescence have also been shown to improve the clinical outcome of anticancer chemotherapy [
6]. While apoptosis can induce early killing of rapidly dividing cancer cells by high doses of anticancer agents; tumour recurrence, drug resistance and normal tissue damage are common complications [
6]. Alternatively, senescence may exert its tumour-suppressive effect at sub-apoptotic doses via induction of permanent cell cycle arrest offering an effective strategy against cancer with fewer adverse effects [
3,
7].
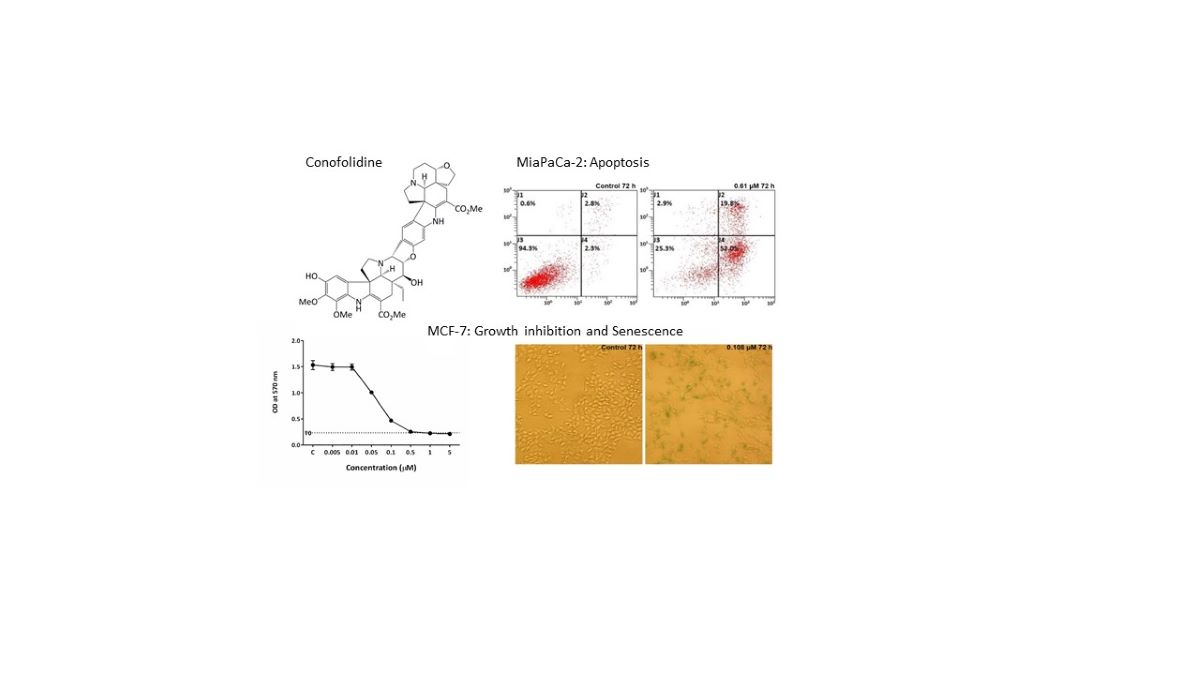
Tabernaemontana corymbosa (Apocynaceae) is a Malaysian rainforest species and a rich source of promising anticancer agents. We report herein for the first time in vitro dual apoptosis- and senescence-inducing abilities of a novel
Aspidosperma-Aspidosperma bisindole, conofolidine from this plant. Conofolidine’s indole moieties closely resemble that of jerantinines A and B also isolated from
Tabernaemontana corymbosa; jerantinines A and B displayed potent antiproliferative activities via suppression of tubulin polymerization [
8,
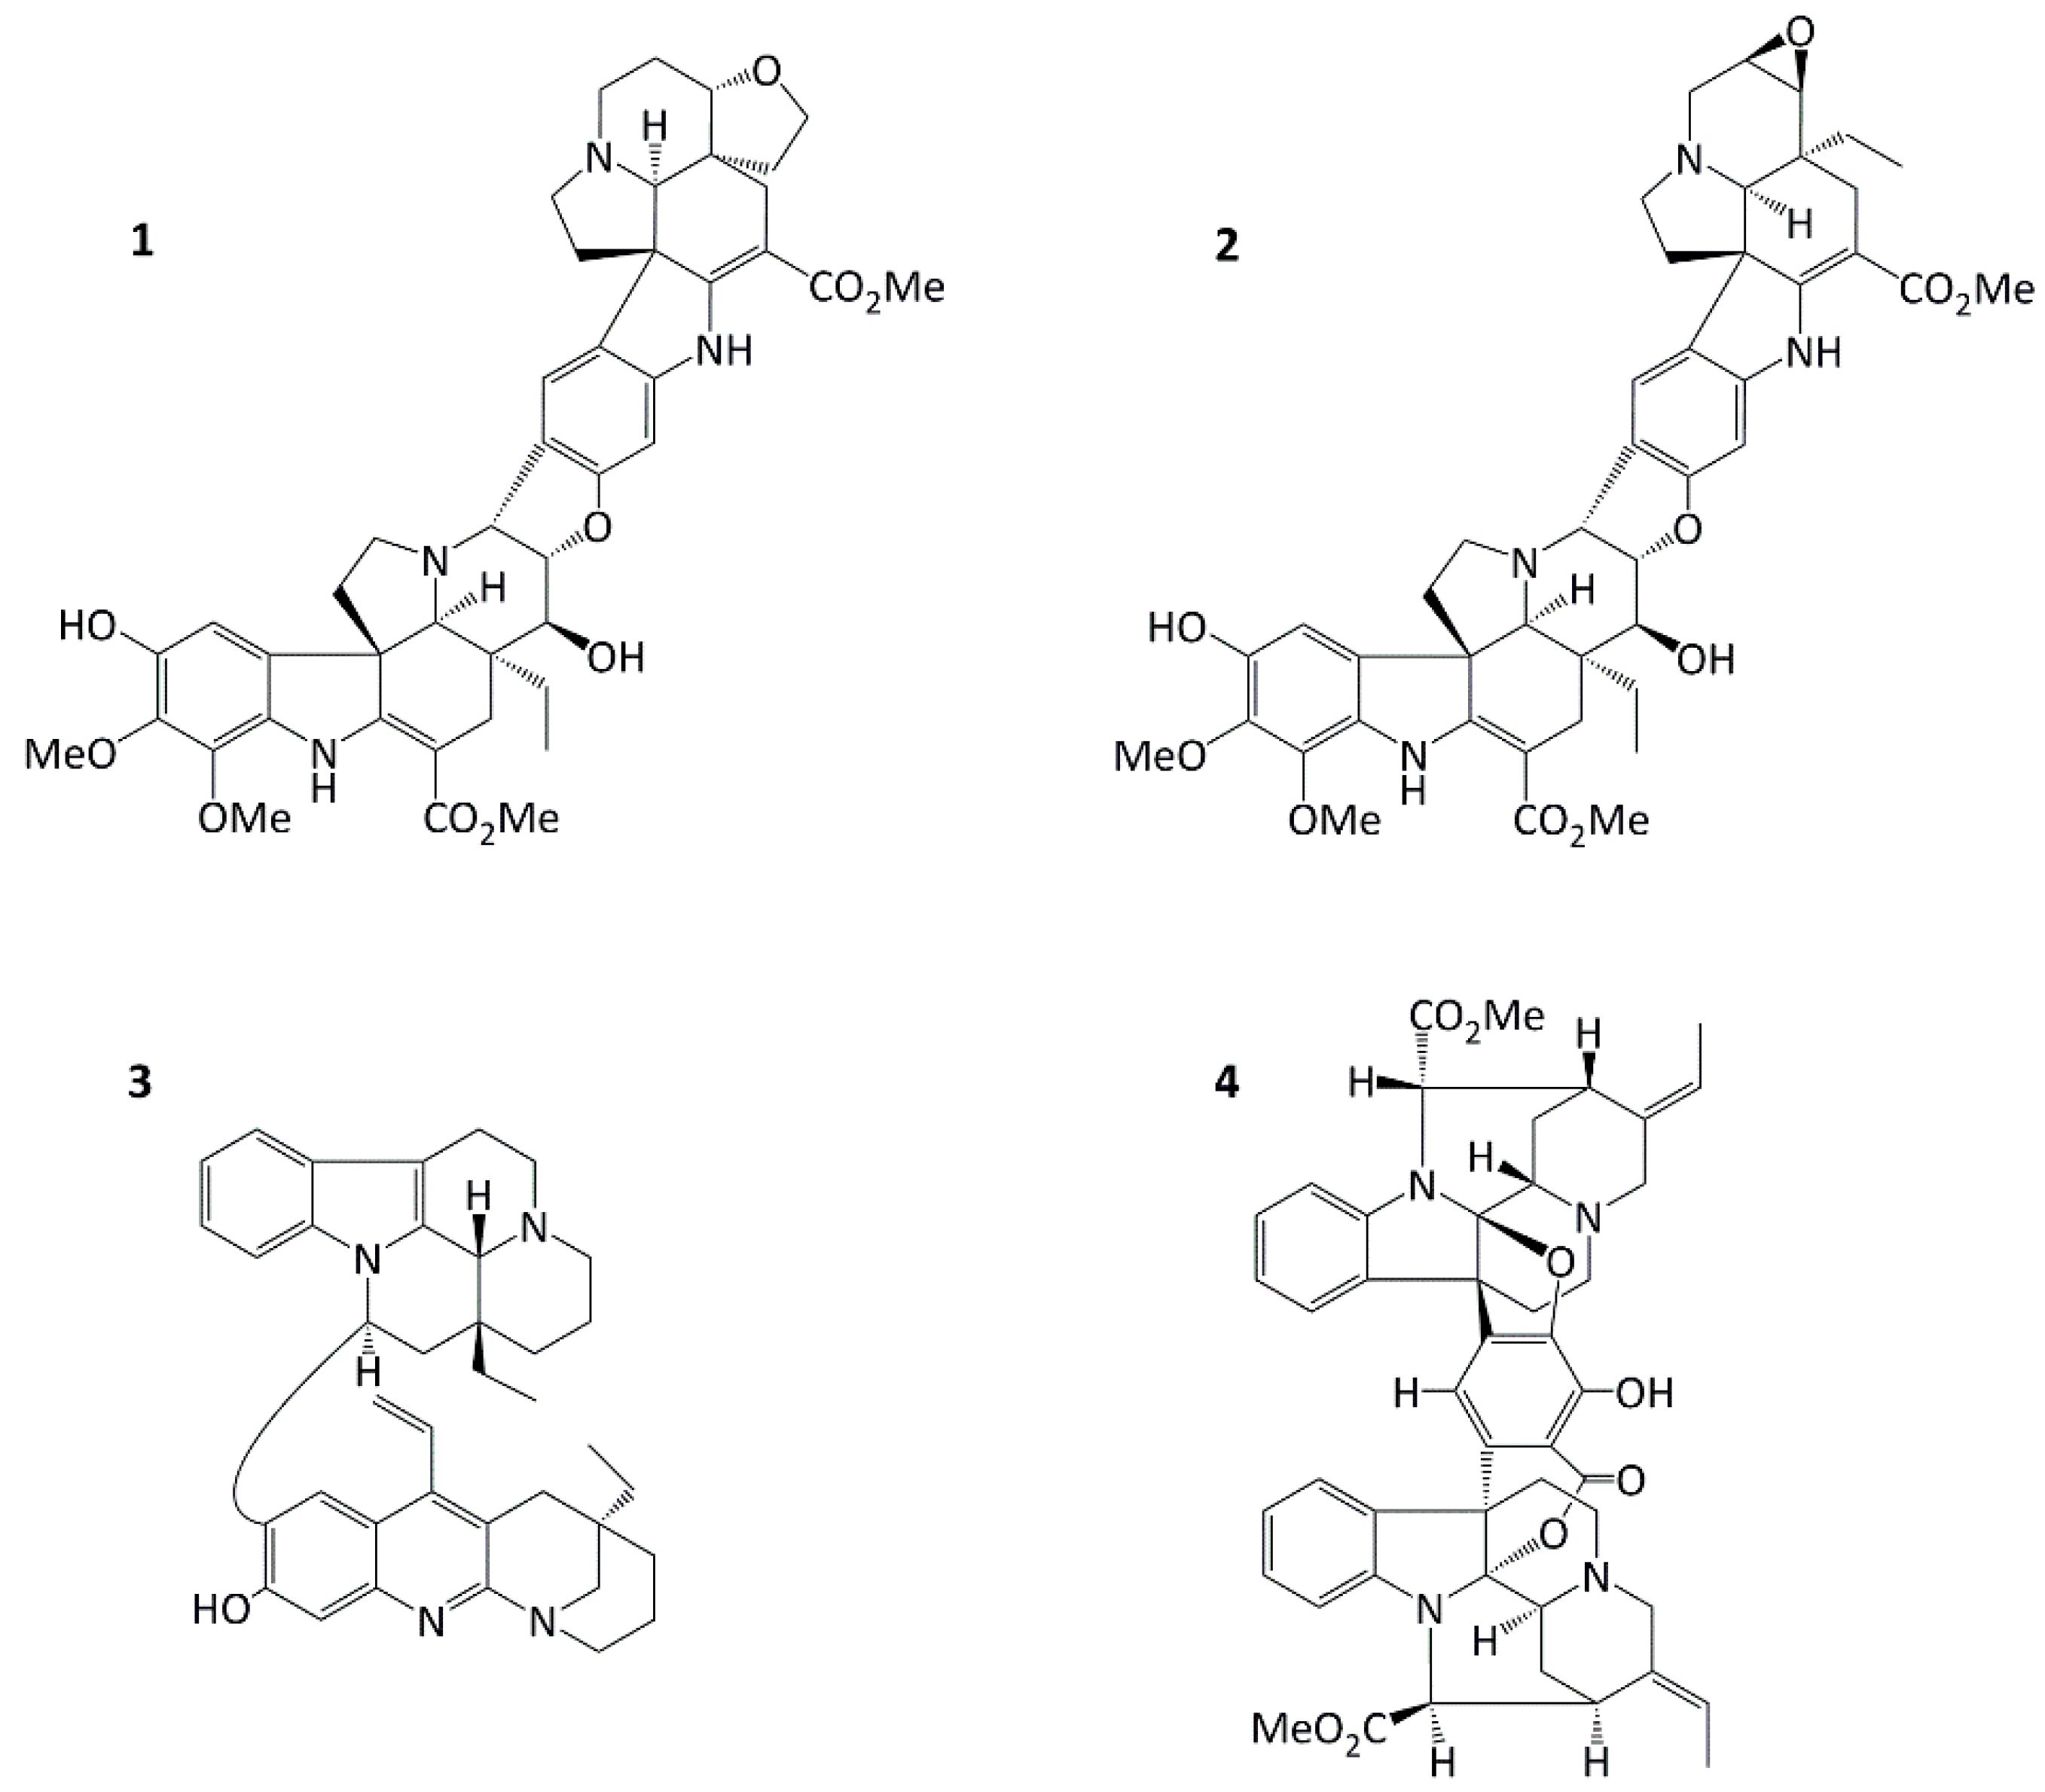
9]. In this study, we demonstrate conofolidine’s anticancer activity, together with that of three other bisindoles - conophylline, leucophyllidine and bipleiophylline,
Figure 1 [
10,
11,
12,
13] - against human-carcinoma cell lines derived from breast, colorectal, lung and pancreatic carcinomas and B-cell lymphomas. In 2016, Nge et al. reported the isolation and structure elucidation of conofolidine (as a new member of the conophylline-group;
Figure 1) and preliminary growth inhibitory effects [
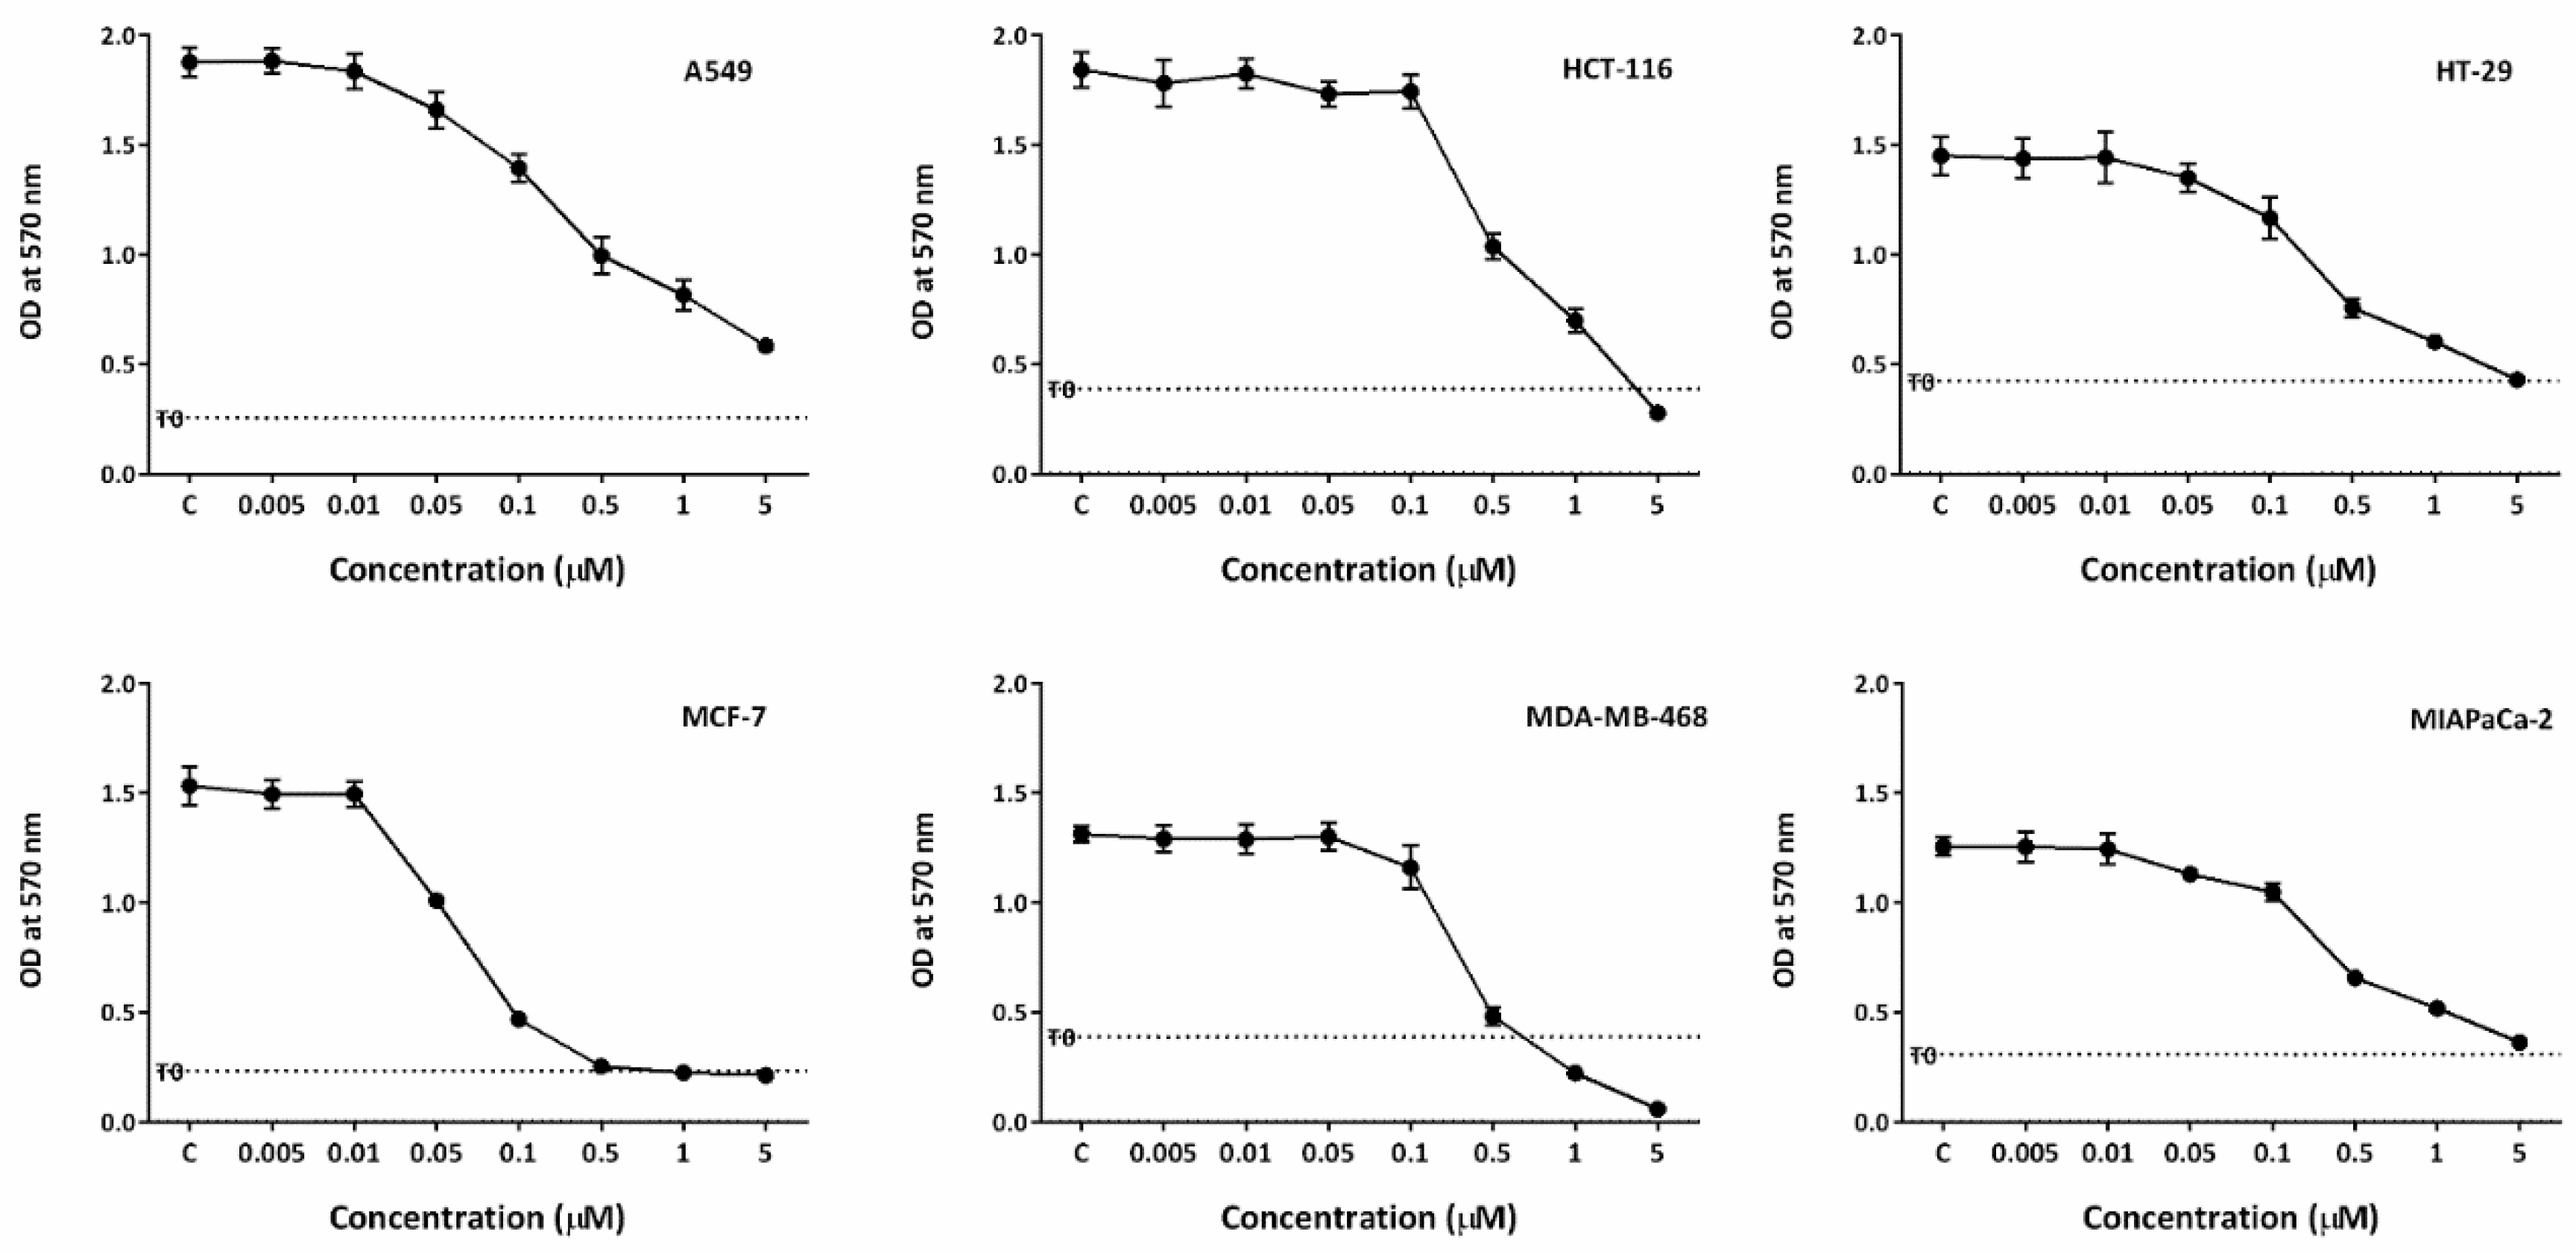
14]. Herein, further anticancer activities, cytotoxicity, cell cycle and death pathways triggered (apoptosis and senescence) have been investigated after treatment of carcinoma cells with conofolidine. Preliminary data showed a remarkable potency against carcinoma cells, e.g., GI
50=0.054 µM, MCF-7. Effects against foetal lung fibroblasts (MRC-5) and normal breast epithelial cells (MCF10A) were assessed for preliminary examination of potential selectivity towards carcinoma cells. Mode of action studies led to the identification of ROS production as one possible mechanism of conofolidine’s growth-inhibitory actions. Furthermore, increased DNA double strand breaks (DSBs) were detected, accompanied by perturbation of essential cell cycle regulatory proteins - CDK2, p21, cyclins A2 and D1 in a time-dependent fashion.
2. Materials and Methods
2.1. Isolation and characterization of conofolidine
All 4 bisindoles were kindly provided by Prof. Kam, University of Malaya. Conofolidine was isolated from the EtOH extract of the leaves of
Tabernaemontana corymbosa Roxb. ex Wall (Apocynaceae). Its two indoles correspond to taberhanine and 11-hydroxydeoxoapodine which are connected via a central dihydrofuran ring [
14]. The structure and absolute configuration of conofolidine (
Figure 1.1, C
44H
50N
4O
10, MW=794.89) were established by spectroscopic methods and X-ray diffraction analysis [
14].
2.2. Cell culture
Cancer cell lines were obtained from the American Type Culture Collection (ATCC), grown and maintained in RPMI-1640 medium supplemented with 10% foetal bovine serum (FBS). Cell lines included MCF-7, MDA-MB-231, MDA-MB-468, SK-BR3, T-47D, ZR-75-B, Caco-2, HCT-116, HT-29, A549, MIAPaCa-2, PANC-1, DoHH2, Vallois. Cells were subcultured twice weekly to sustain their logarithmic growth and were allowed to grow in a humidified atmosphere at 37 °C, 5% CO2 incubator. After ≤30 passages, and to reduce phenotypic or genotypic drift, new low passage cells were reintroduced from cell stocks that had been cryopreserved at -180 °C. Test compound top stocks were kept frozen at -80 °C as 10 mM/10 µL-aliquots in DMSO which were thawed promptly before use.
2.3. MTT assay
3-(4,5-Dimethylthiazol-2-yl)-2,5-diphenyltetrazolium bromide (MTT, Alfa-Aesar, Lancashire, UK) colourimetric assays were used for testing the antiproliferative ability of test agents on the cancer cells. Cells were seeded into 96-well plates (3 ×10³ cells/well) and allowed to attach overnight prior to test compound introduction (5 nM - 10 μM, n≥4). Serial dilutions were freshly prepared in culture medium before assay. Two measurements of viable cells (at the time of treatment introduction and after 72 h exposure) were conducted following MTT addition. Plates were then incubated for 3 h allowing metabolic reduction of yellow MTT into insoluble purple formazan crystals which were solubilised in 150 μL DMSO after supernatants’ aspiration. Absorbance readings were recorded at 570 nm in a plate reader (PerkinElmer Life and Analytical Sciences, Buckinghamshire, UK). Dose-response profiles were constructed from mean absorbance values, and test agent concentrations that inhibited growth by 50% (GI50) were calculated.
2.4. Clonogenic assay
Clonogenic assays were used to assess the ability of single cells to survive, proliferate and form colonies following brief exposure to conofolidine. Cells (~400/well) were seeded into 6-well plates in 2 mL medium. After 24 h incubation, conofolidine was introduced (0.1 and 0.5 µM) while medium alone was added to controls. Following 24 h treatment, medium containing conofolidine was gently aspirated, cells were washed (2× sterile PBS, 37 °C) before fresh conofolidine-free medium was introduced, and plates were re-incubated for 7–9 days. Cells were examined daily until cells in controls had formed colonies consisting of >50 cells. Wells were washed with PBS, fixed with methanol (100%; 15 min), stained with methylene blue (0.5%; 15 min), washed (dH2O), and air-dried, and stained colonies were then counted.
2.5. Cell cycle analysis
The method used is adapted from that described by Nicoletti et al. (1991) [
15]. Cells were seeded and allowed to attach overnight in 6-well plates (1.0 × 10
5 and 0.5 × 10
5 cells/well for 24 h and 72 h exposures, respectively). Following treatment, floating cells were collected, attached cells trypsinised and cells were pooled together in FACS tubes. Samples were washed (PBS; 4 °C), and pelleted by centrifugation (1,200 rpm; 5 min; 4 °C). Cells were resuspended in fluorochrome solution (50 μg/mL PI, 100 µg/mL ribonuclease-A, 0.1% triton-X-100, 0.1% sodium citrate). Cell cycle analyses were performed using an FC-500 Beckham-Coulter flow cytometer. Data were collected and analysed using EXPO32 software.
2.6. Annexin-V/PI apoptosis assay
Cells were seeded at densities of 0.5-0.75 × 10⁵ per well in a 6-well plate, incubated overnight and treated the following day. After 72 h 2×GI50 treatments, cells were harvested, washed (PBS; 4 °C) and transferred with the medium containing detached cells into FACS tubes. After centrifugation (1,200 rpm; 5 min; 4 °C) and aspiration of supernatants, cells were resuspended in 5 μL annexin-V-FITC plus 100 μL 1× annexin-V binding buffer (BD Pharmingen). Samples were briefly vortexed and incubated (protected from light for 15 min, 25 °C). PI (10 μL) plus 400 μL annexin-V binding buffer were added to each FACS tube followed by incubation for 10 min in the dark at 4 °C. Samples were analysed using Beckman Coulter FC-500 flow cytometer and EXPO32 software and percentages of early apoptotic (annexin-V positive (AV+), PI negative (PI-)) and late apoptotic cells (AV+, PI+) were recorded.
2.7. Caspase 3/7 assay
To measure executioner caspases` activity, the Caspase-Glo 3/7 (100 μL; Promega) assay was conducted according to the manufacturer’s protocol. Cells were seeded at a density of 5 × 10³ in 100 μL of medium/well in white-walled opaque 96-well plates and incubated overnight (37 °C, 5% CO2). Conofolidine or medium alone was added for an additional 24 h. Caspase-Glo 3/7 reagents were then added to each well. After 30 min, relative luminescence was measured in a plate reader (PerkinElmer Life and Analytical Sciences, Buckinghamshire, UK).
2.8. Senescence β-galactosidase cell staining assay
Senescence was investigated using β-Gal staining (Cell Signaling Technology; CST (London, UK)). Cells were seeded at a density of 2.5 × 10⁴ cell/well in 6-well plates, incubated overnight at 37 °C, 5% CO2 and treated with conofolidine the following day. After 72 h, cells were washed with PBS and fixed before adding 1 mL β-Gal solution (1 mg/mL X-gal, pH=6.0). Plates were incubated at 37 °C ≥16 h, before being inspected under a light inverted microscope for blue β-Gal staining; positive cells were counted in all wells.
2.9. Western Blotting
Following designated treatments, cells were collected and lysed using NP-40 lysis buffer containing protease and phosphatase inhibitors. Protein concentrations were measured using the Bradford assay [
16]. Samples were then loaded (50 μg protein each) and proteins were separated using sodium dodecyl sulphate polyacrylamide gel electrophoresis (SDS-PAGE). By immunoblotting, proteins were transferred onto nitrocellulose membrane, probed against primary antibody (dilution 1:1000), and thereafter against secondary antibody (dilution 1:4000). Protein bands were detected using enhanced chemiluminescence (Amersham ECL Prime (Buckinghamshire, UK) and LI-COR Biosciences Ltd. C-DiGit
® Blot Scanner, Cambridgeshire, UK). Densitometric analyses of western blots were performed using Image Studio. Primary antibodies were procured from CST (London, UK): whole and cleaved Poly (ADP-ribose) polymerase (PARP), CDK2, cyclin A2, cyclin D1, p21, NAD(P)H quinone dehydrogenase 1 (NQO1) and β-Actin. A secondary anti-mouse IgG/HRP antibody was purchased from Dako (Cambridgeshire, UK).
2.10. Confocal microscopy
Confocal microscopy was used to visualise the DNA-DSBs foci induced by conofolidine. Cells were seeded in eight-well µ-slides (Ibidi® Germany) and allowed to attach overnight in CO2 incubator at 37 °C, then they were incubated with either medium alone or conofolidine or positive control – etoposide. Following 72 h exposure, cells were fixed with 3.7% formaldehyde in PBS, permeabilised with PBT (0.1% Triton-X-100 in PBS) and incubated with p-Histone γ-H2AX antibody (Sigma-Aldrich, UK) for DNA-DSBs foci staining and draq5 (Abcam, UK) for DNA staining. Images were captured using Zeiss LSM 510 META confocal microscope (Cambridgeshire, UK) and Zeiss LSM 510 image browser (version 4.2). The above protocol was used also for visual validation of mitotic abnormalities induced by conofolidine except that β-tubulin antibody TUBB1 (ThermoFisher-Scientific, UK) and vincristine - positive control - were used.
2.11. Monitoring of γ-H2AX phosphorylation induction by flow cytometry
Cells were seeded at a density of 1 × 10⁶ in 100 mm2 culture Petri dishes, incubated overnight and treated the following day with either conofolidine 2×GI50 or etoposide 2.0 µM - positive control. After 72 h, cells were transferred into FACS tubes containing their respective medium. Cells were centrifuged (10 mins; 1500 RPM; 25 °C) and pelleted; supernatants were discarded and pellets were resuspended again. Thereafter, cells were fixed with 1% methanol-free formaldehyde in PBS, permeabilised with Triton-X-100 in PBS and incubated with p-Histone γ-H2AX antibody (Sigma-Aldrich, UK); dilution 1:3333 in 1% FBS in PBS; 1.5 h; 25 °C. For concurrent cell cycle analyses, cells were resuspended in PI (50 µg/ml) and RNase (100µg/ml) in PBS solution (10 min.; 25 °C). The % of γ-H2AX (+) cells and cell cycle distribution were analysed using CyFlow® Space flow cytometer (Sysmex Partec, Germany) and Kaluza analysis software (Beckman Coulter, UK).
2.12. Reactive oxygen species determination
To measure ROS production, the ROS-Glo H2O2 (Promega) assay was conducted according to the manufacturer’s protocol, which measures the most stable ROS-H2O2 level. Cells were plated at a density of 5× 10³/70 μL medium in white-walled opaque bottom 96-well plates and incubated overnight (37 °C, 5% CO2). Conofolidine or medium (10 μL) was added to treated or control wells, respectively, for an extra 24 h. After 18 h treatment, 20 μL H2O2 substrate was added to each well. Upon treatment period completion (24 h), 100 μL ROS-Glo solution was added to each well, and after 20 min, relative luminescence was measured in a plate reader (PerkinElmer Life and Analytical Sciences, Buckinghamshire, UK).
2.13. Statistical analysis
Experiments were repeated at least three times, internal repeats n≥4 (unless otherwise stated) and representative experiments are shown. Data are presented as mean ± SD (or SEM). Statistical differences between study groups were analysed using two-way ANOVA (unless otherwise stated). Dunnett’s multiple comparisons were used to test the significance, determined as p-value ≤ 0.05.
4. Discussion
Conofolidine, a novel bisindole alkaloid from
Tabernaemontana corymbosa proved its broad-spectrum potency against carcinoma cells derived from breast (MCF-7, MDA-MB-468, MDA-MB-231, SK-BR3, T-47D, ZR-75-B), colon (HCT-116, HT-29, Caco-2), lung (A549), pancreas (MIAPaCa-2, PANC-1) and B-cell lymphoma (DoHH2, Vallois) cell lines (
Table 1,
Table S1). The breast carcinoma cells were predominantly the most sensitive to conofolidine. Compared to MRC-5, all carcinoma cell lines exhibited higher sensitivity GI
50≤0.5 μM). Although MCF10A - the proliferative benign fibrocystic epithelial breast - cell line showed GI
50~0.23 μM, MCF-7, MDA-MB-231, T-47D, ZR-75-B, DoHH2 and Vallois cells yielded GI
50 values ≤0.13 μM. Indeed, the potency of conofolidine surpassed structurally-related congener conophylline (
Table 1) against A549, MDA-MB-468 and MIAPaCa-2 cell lines. This could be a consequence of the structural variation: the second indole moiety
viz. deoxoapodine in conofolidine instead of pachysiphine in conophylline (
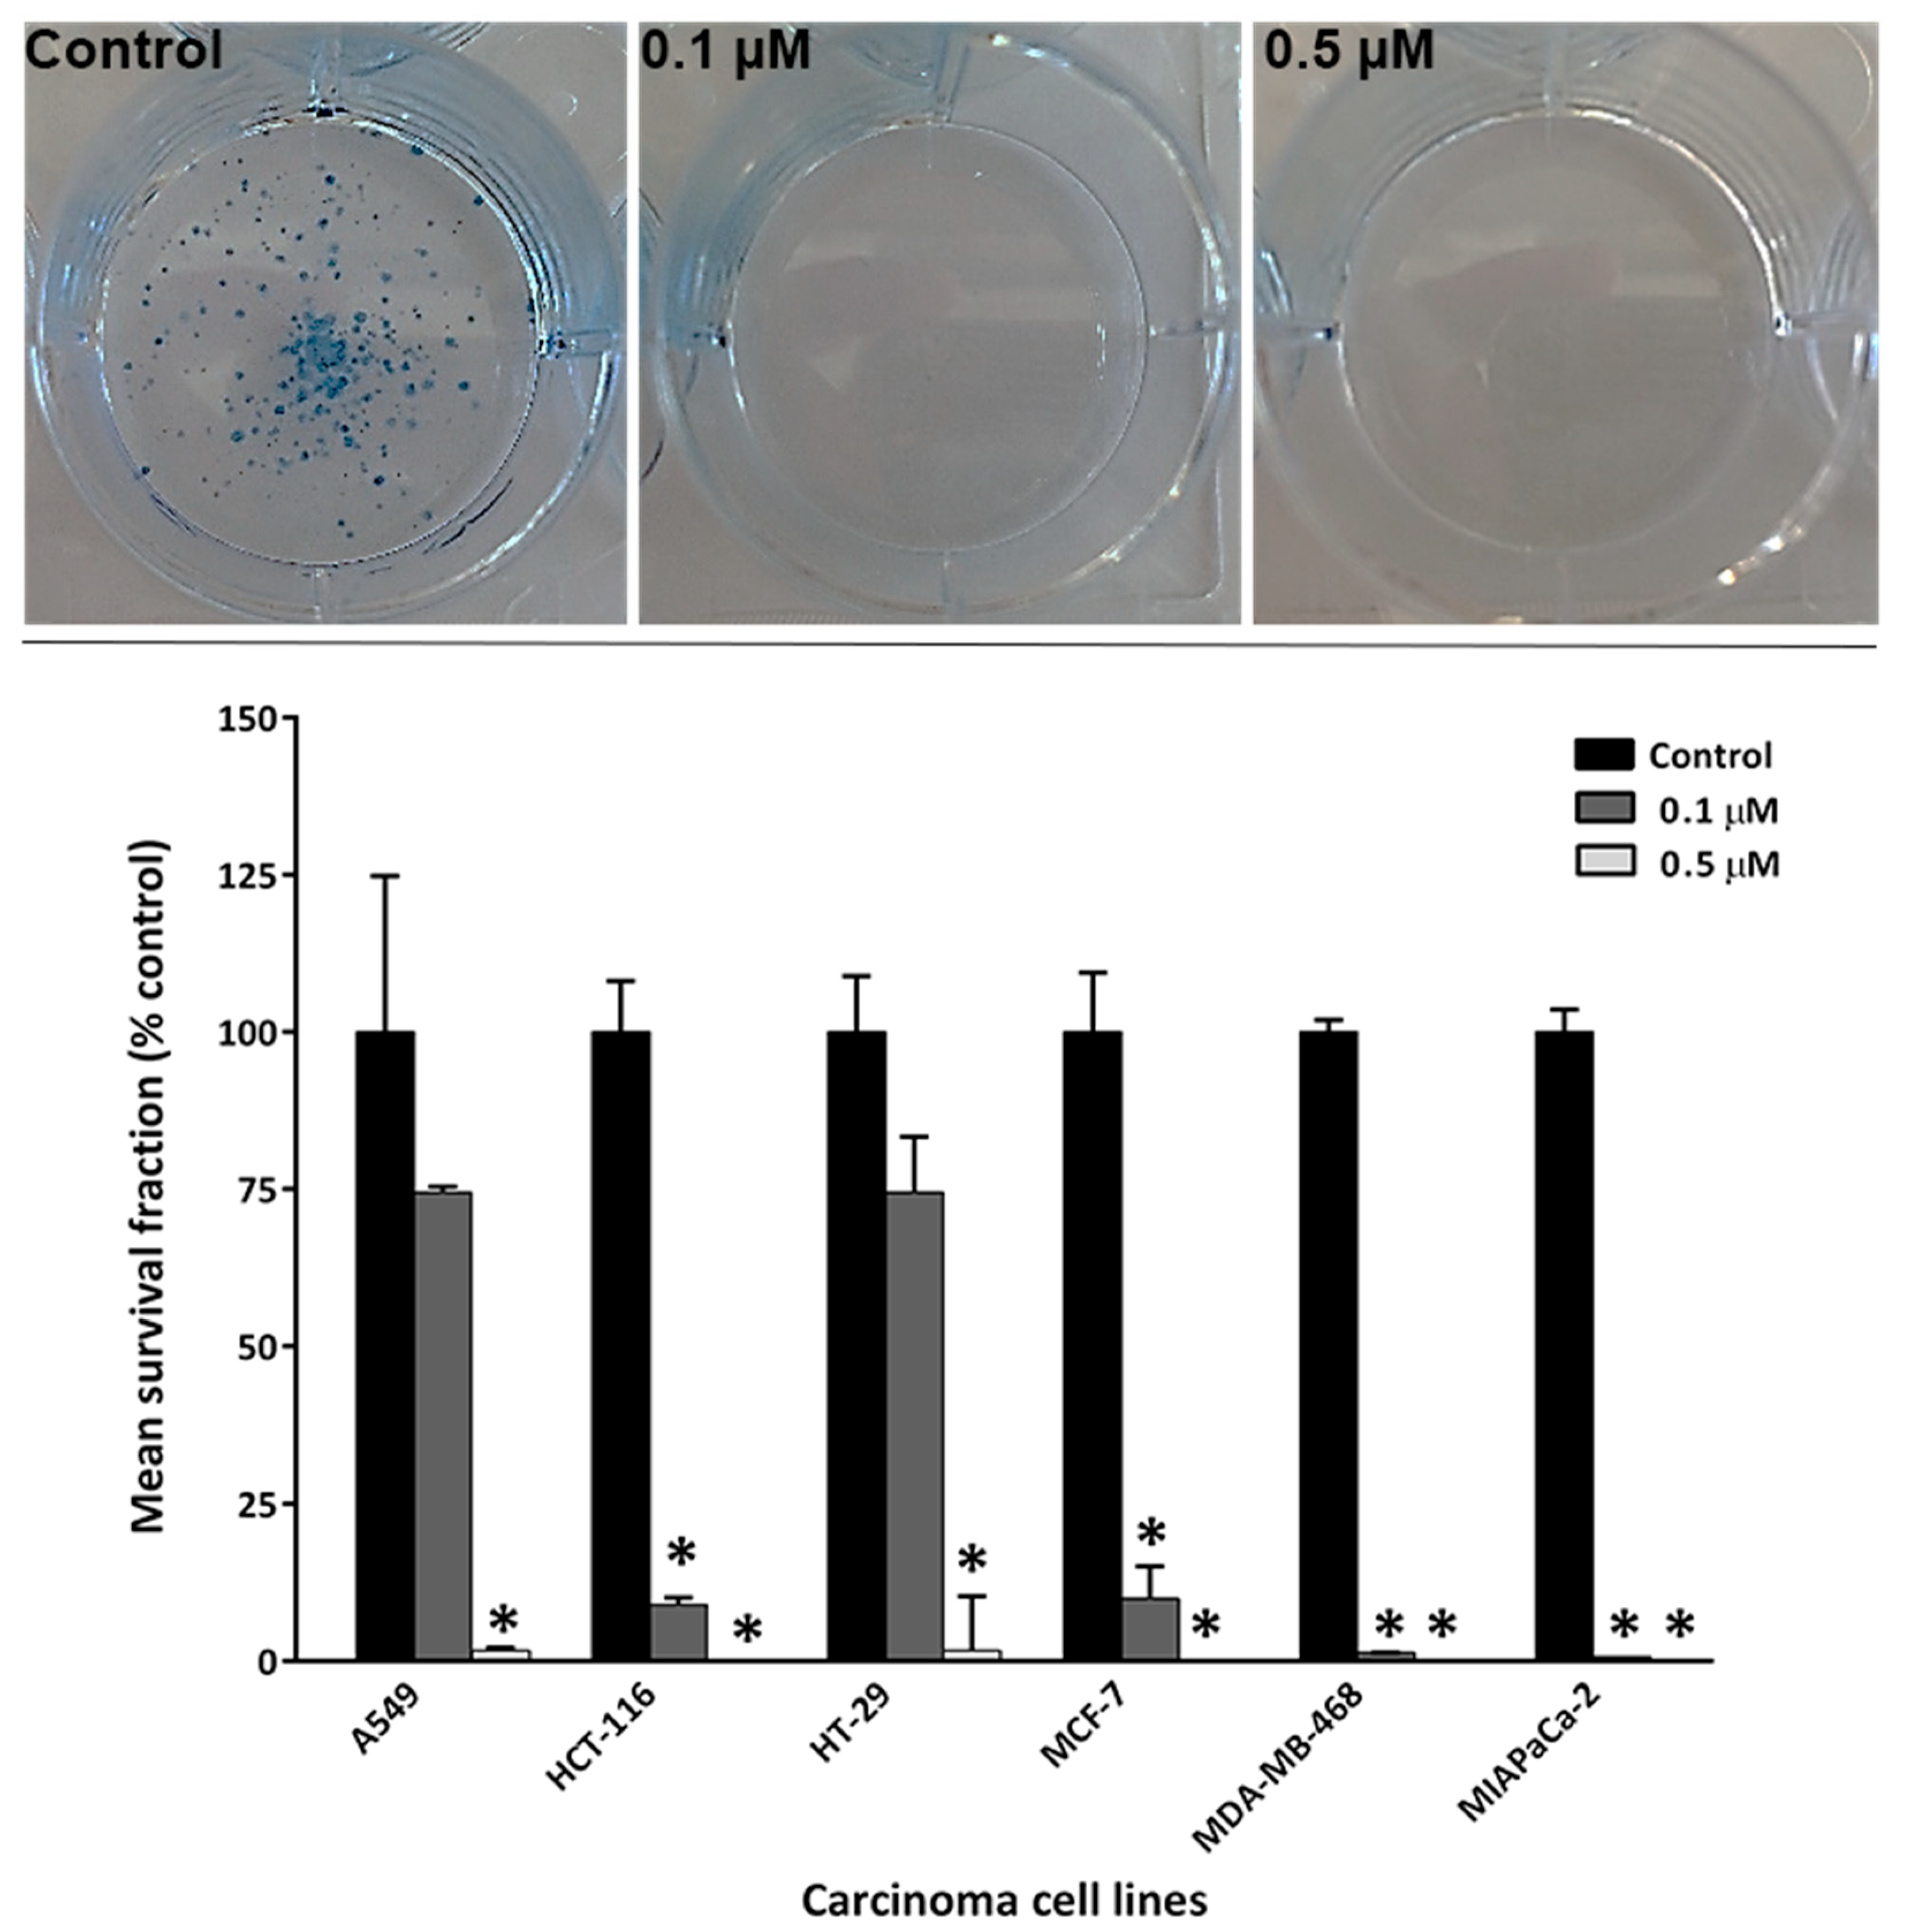
Figure 1). In addition to its antiproliferative actions, conofolidine efficiently suppressed the clonogenic potential of cancer cells (
Figure 3). For example, MDA-MB-468, MIAPaCa-2 colony formation was significantly inhibited ˃95% by 1 µM conofolidine. Individual cells were unable to survive 24 h conofolidine challenge and form progeny colonies. Dose-dependent inhibition of A549 and HT-29 colony-forming ability was seen. Together, MTT and clonogenic assays demonstrated conofolidine’s potential to compromise cancer cell proliferation and viability.
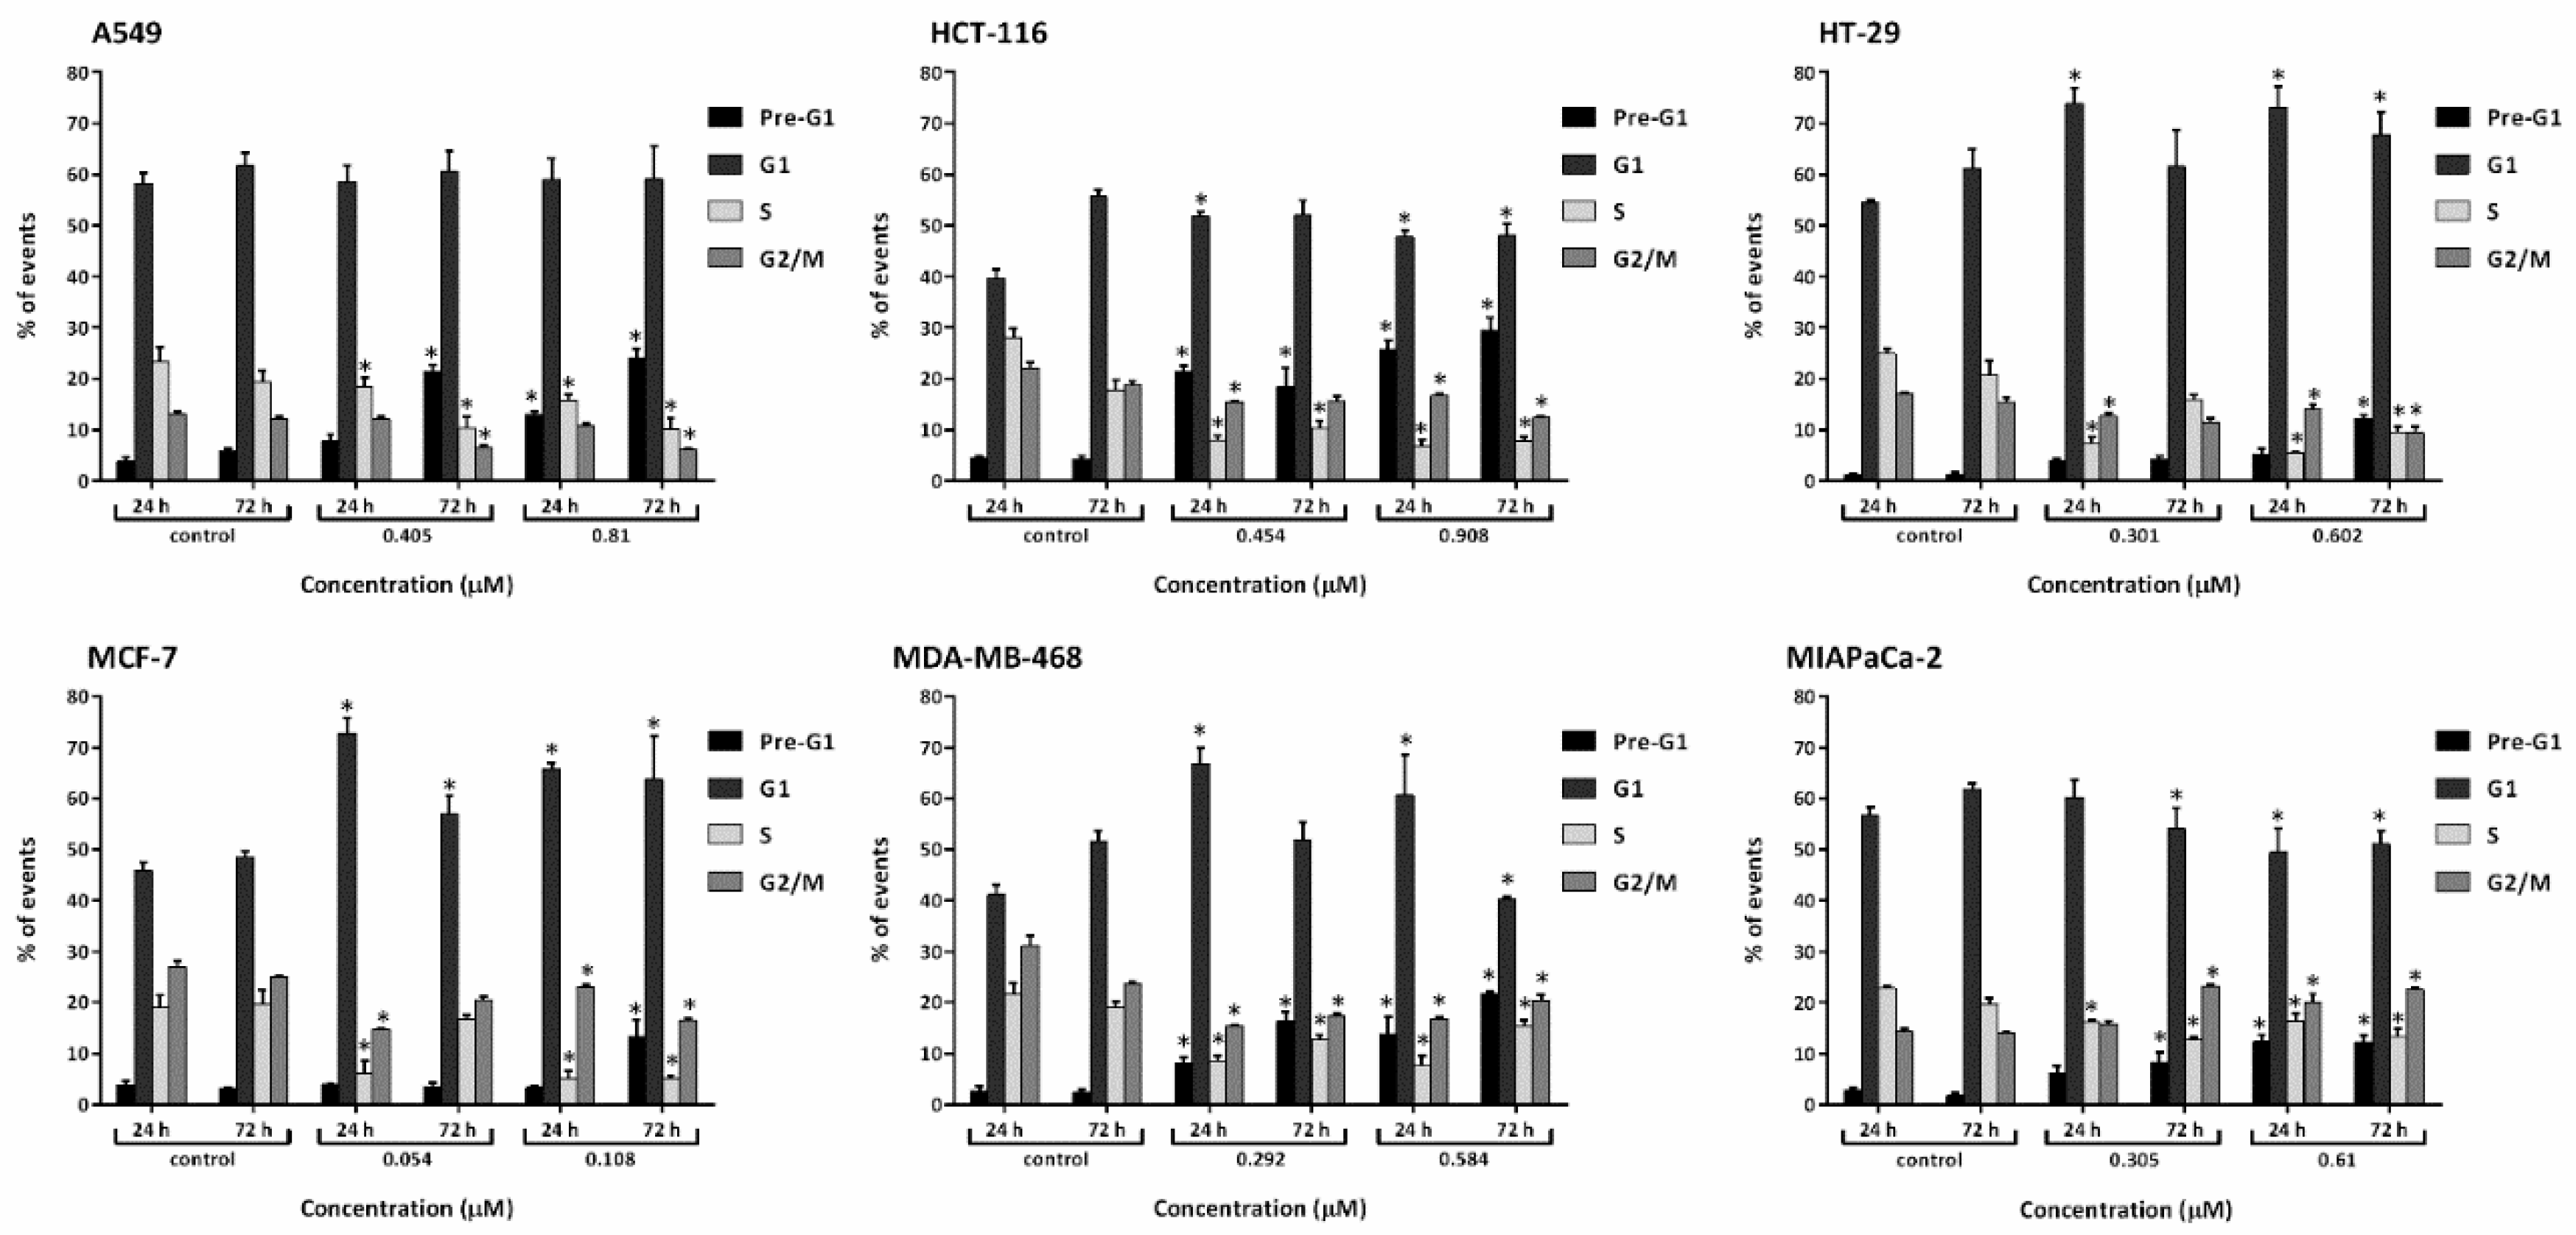
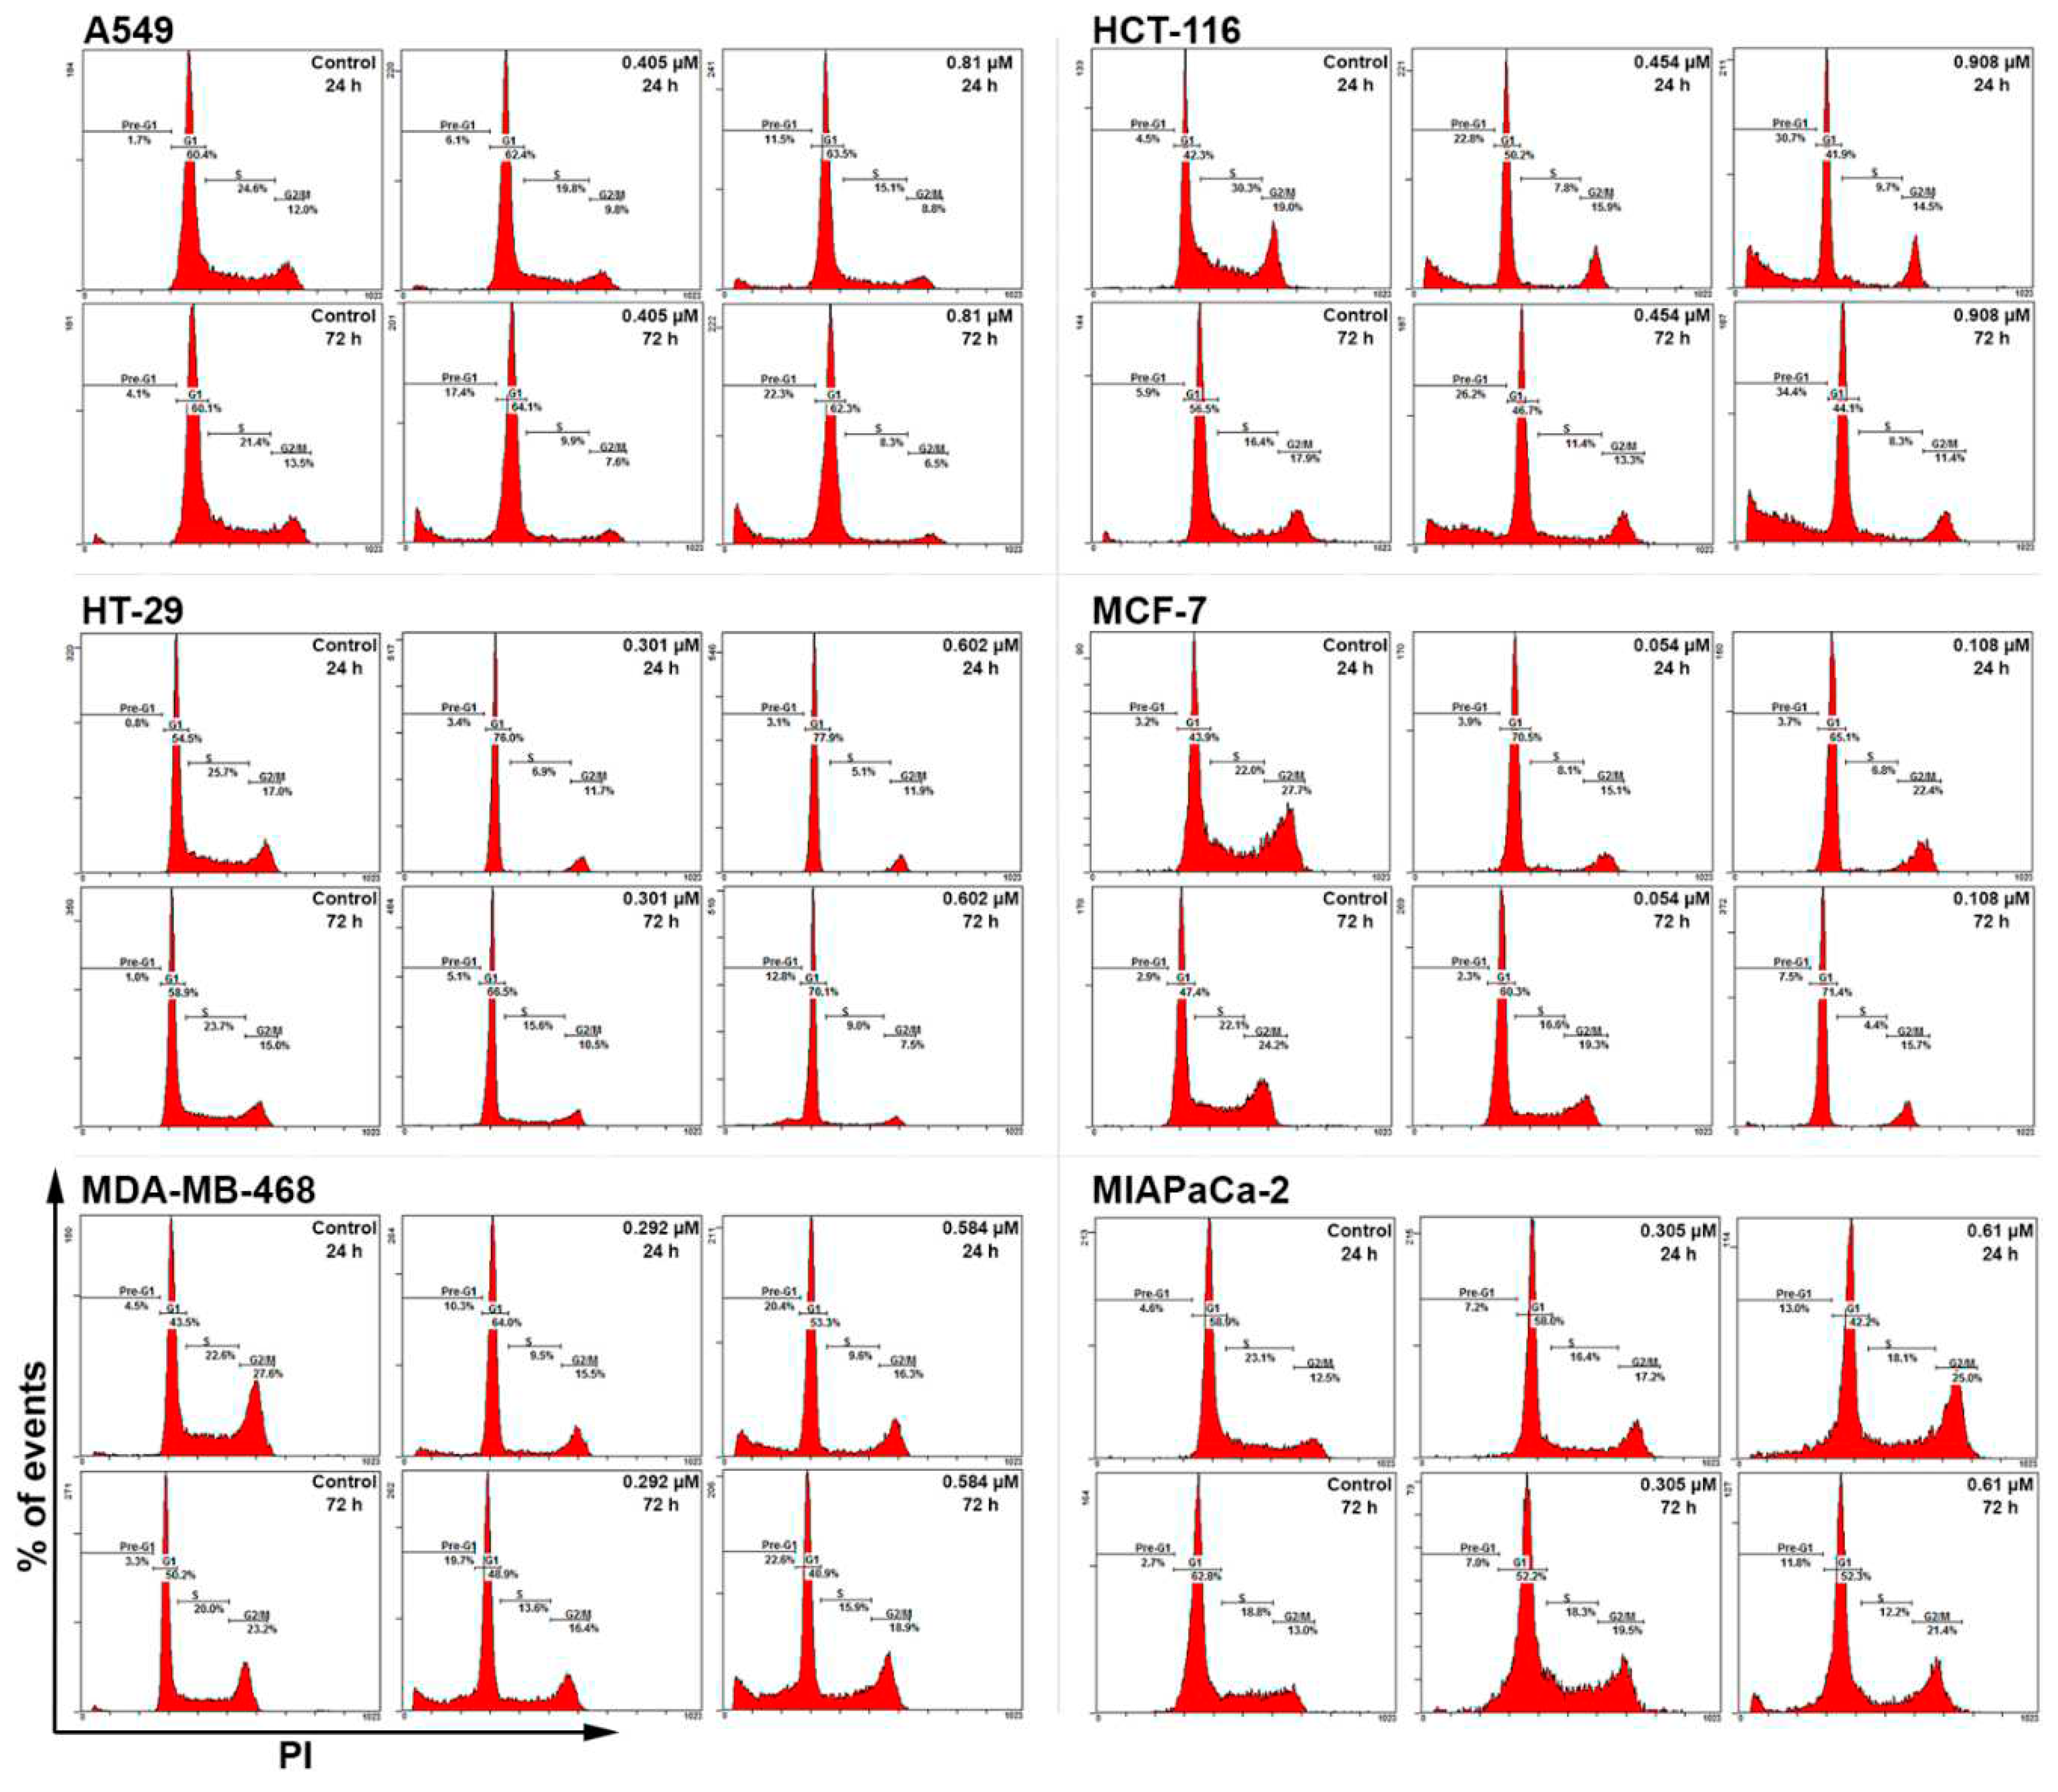
To explore conofolidine’s cellular mechanisms of action, cell cycle analysis (using flow cytometry) was considered (
Figure 4 and
Figure 5). Four distinctive perturbations (specifically at 2×GI
50) were observed: stark S-phase depletion, G1-phase arrest, G2/M arrest (seen only in MIAPaCa-2) and the emergence of sub-diploid population (<2N-DNA) appearing as pre-G1 events. Following 24 h, conofolidine induced radical S-phase depletion. For example, ≤6% HCT-116, HT-29, MCF-7, MDA-MB-468 cell population resided within S-phase using 1×GI
50 compared to 20-27% for untreated controls. Moreover, a concomitant increase of G1-populations started to emerge. After 72 h, conofolidine sustained statically significant G1/S-arrest, especially in HT-29 and MCF-7 cells. In contrast, A549 (less sensitive as indicated in previous assays) seemed to require a higher concentration of 2×GI
50 to produce profoundly equivalent depleted S-phase but without an obvious effect on G1 events. G1-arrest could be a consequence of inhibition of proteins’ transcription and expression which take place during G1 and are required for DNA replication, leading ultimately to decreased numbers of cells escaping G1-block into S-phase. Similarly, structurally-related conophylline was reported to induce G1-arrest in endometrial cancer cells [
24]. Thus, structurally-related conofolidine and conophylline may share similar anticancer mechanism(s) of action. However, conofolidine was able to decrease A549 S-phase population without affecting % of G1-cells suggesting that it may interfere directly with DNA replication machinery such as replicative helicase similar to anthracyclines [
25]. In support of this suggestion, S-phase depletion was attained with minimal effect on G1 in MIAPaCa-2 cells which interestingly accompanied a G2/M arrest. These observations indicate putative anti-microtubule activity and resemble the effects of microtubule disrupting agents such as vinca bisindole alkaloids [
26] and jerantinines A and B which share indole moiety structural similarities and are also isolated from
Tabernaemontana corymbosa [
8,
9]. Concentration- and time-dependent increased pre-G1 events were evident in most cell lines indicating cell death by apoptosis. For instance, ≥20% of HCT-116 cells accumulated at pre-G1 following 24 h exposure to 1×GI
50 which continued to increase to ≥30% after 72 h. The depleted S-phase (with changed HT-29 morphology) led to a hypothesis that conofolidine might induce differentiation. Indeed, conophylline is known to differentiate pancreatic-β endocrine cells [
27,
28]. However, conofolidine, in contrast to the positive control (sodium butyrate), failed to impact HT-29 differentiation (
Figure S8).
Considering the sub-diploid events seen in the cell cycle, an apoptotic mode of cell death was the first suggested death pathway to be investigated (
Figure 6,
Figure 7 and Figure S7). Annexin V-FITC/PI fluorescent staining and flow cytometric analyses of populations were undertaken, which distinguishes between early and late apoptosis. In early apoptosis, cell membrane asymmetry is lost exposing phosphatidylserine to the outer membrane surface. Thus annexin-V can bind and be measured by flow cytometry. PI can intercalate DNA and be quantified only upon the commencement of late apoptosis when membrane integrity deteriorates [
29]. Significantly increased apoptotic events were only observed in MDA-MB-468, MIAPaCa-2, and HCT-116 populations. For instance, ˃50% of MIAPaCa-2 and MDA-MB-468 were AV+; AV+ events evolve in early apoptosis and are accompanied by PI+ events in late apoptosis when DNA becomes fragmented [
30]. Indeed, pre-G1 populations are an indication of DNA cleavage into oligonucleosomal fragments [
31]. DNA fragmentation is induced by caspase-activated DNase [
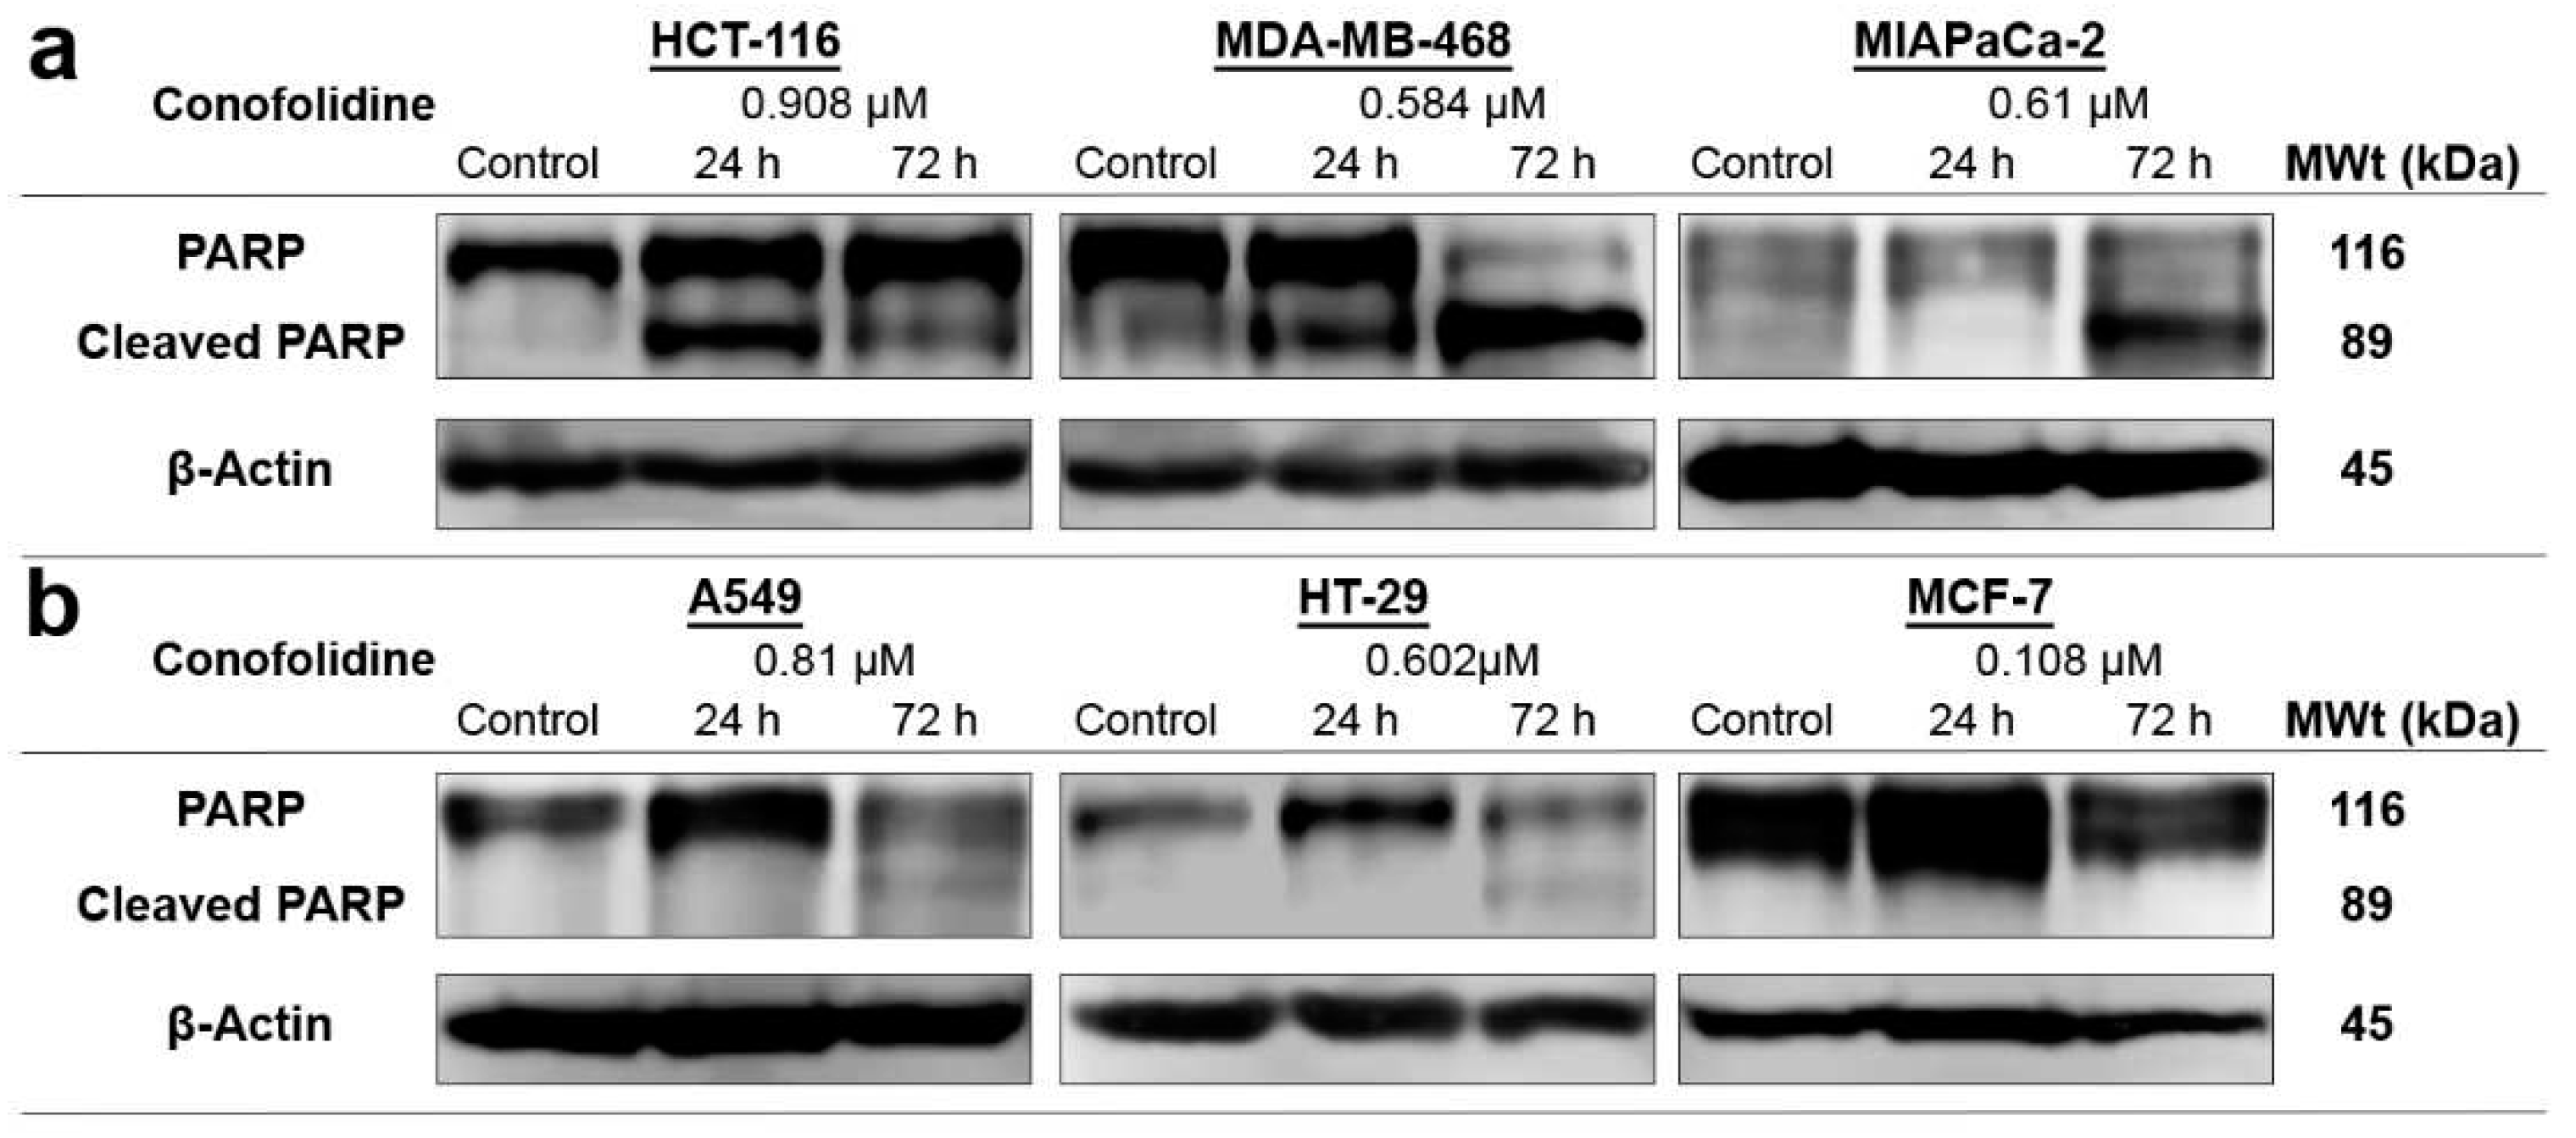
4], thus caspases activities and emergence of caspase-mediated cleaved PARP were validated. Indeed, MDA-MB-468, MIAPaCa-2 and HCT-116 showed increased active caspases 3 and 7, which generated the 89 kDa-PARP fragment corroborating apoptosis. The timing of apoptosis-onset was different between these cells according to annexin-V/PI results which were validated by the increased caspase activity and appearance of cleaved PARP at different time points. Intriguingly, A549 cells which showed significant pre-G1 events, did not display significant AV+ events. These results are consistent with other studies that describe: i) the known apoptosis-reluctant phenotype of A549 cells [
32]; and ii) the potential viability of pre-G1 A549 cells [
33]. Indeed, conofolidine did not arrest the G1 but decreased S- and G2/M phases thereby delaying mitosis. Furthermore, these cells might be able to divide thereby producing two or three cells (tripolar mitosis) possessing sub-diploid DNA content - observed as pre-G1 events. Thus, conofolidine might cause postmitotic arrest in the second and even third cell cycles. Unsurprisingly, the caspase 3 deficient MCF-7 cells did not show any significant AV+ events. This is likely because these cells were reported to have a base pair deletion of caspase 3 gene which ultimately abrogates mRNA translation [
34]. Hence, no apparent cleaved PARP was observed in MCF-7 treated with conofolidine.
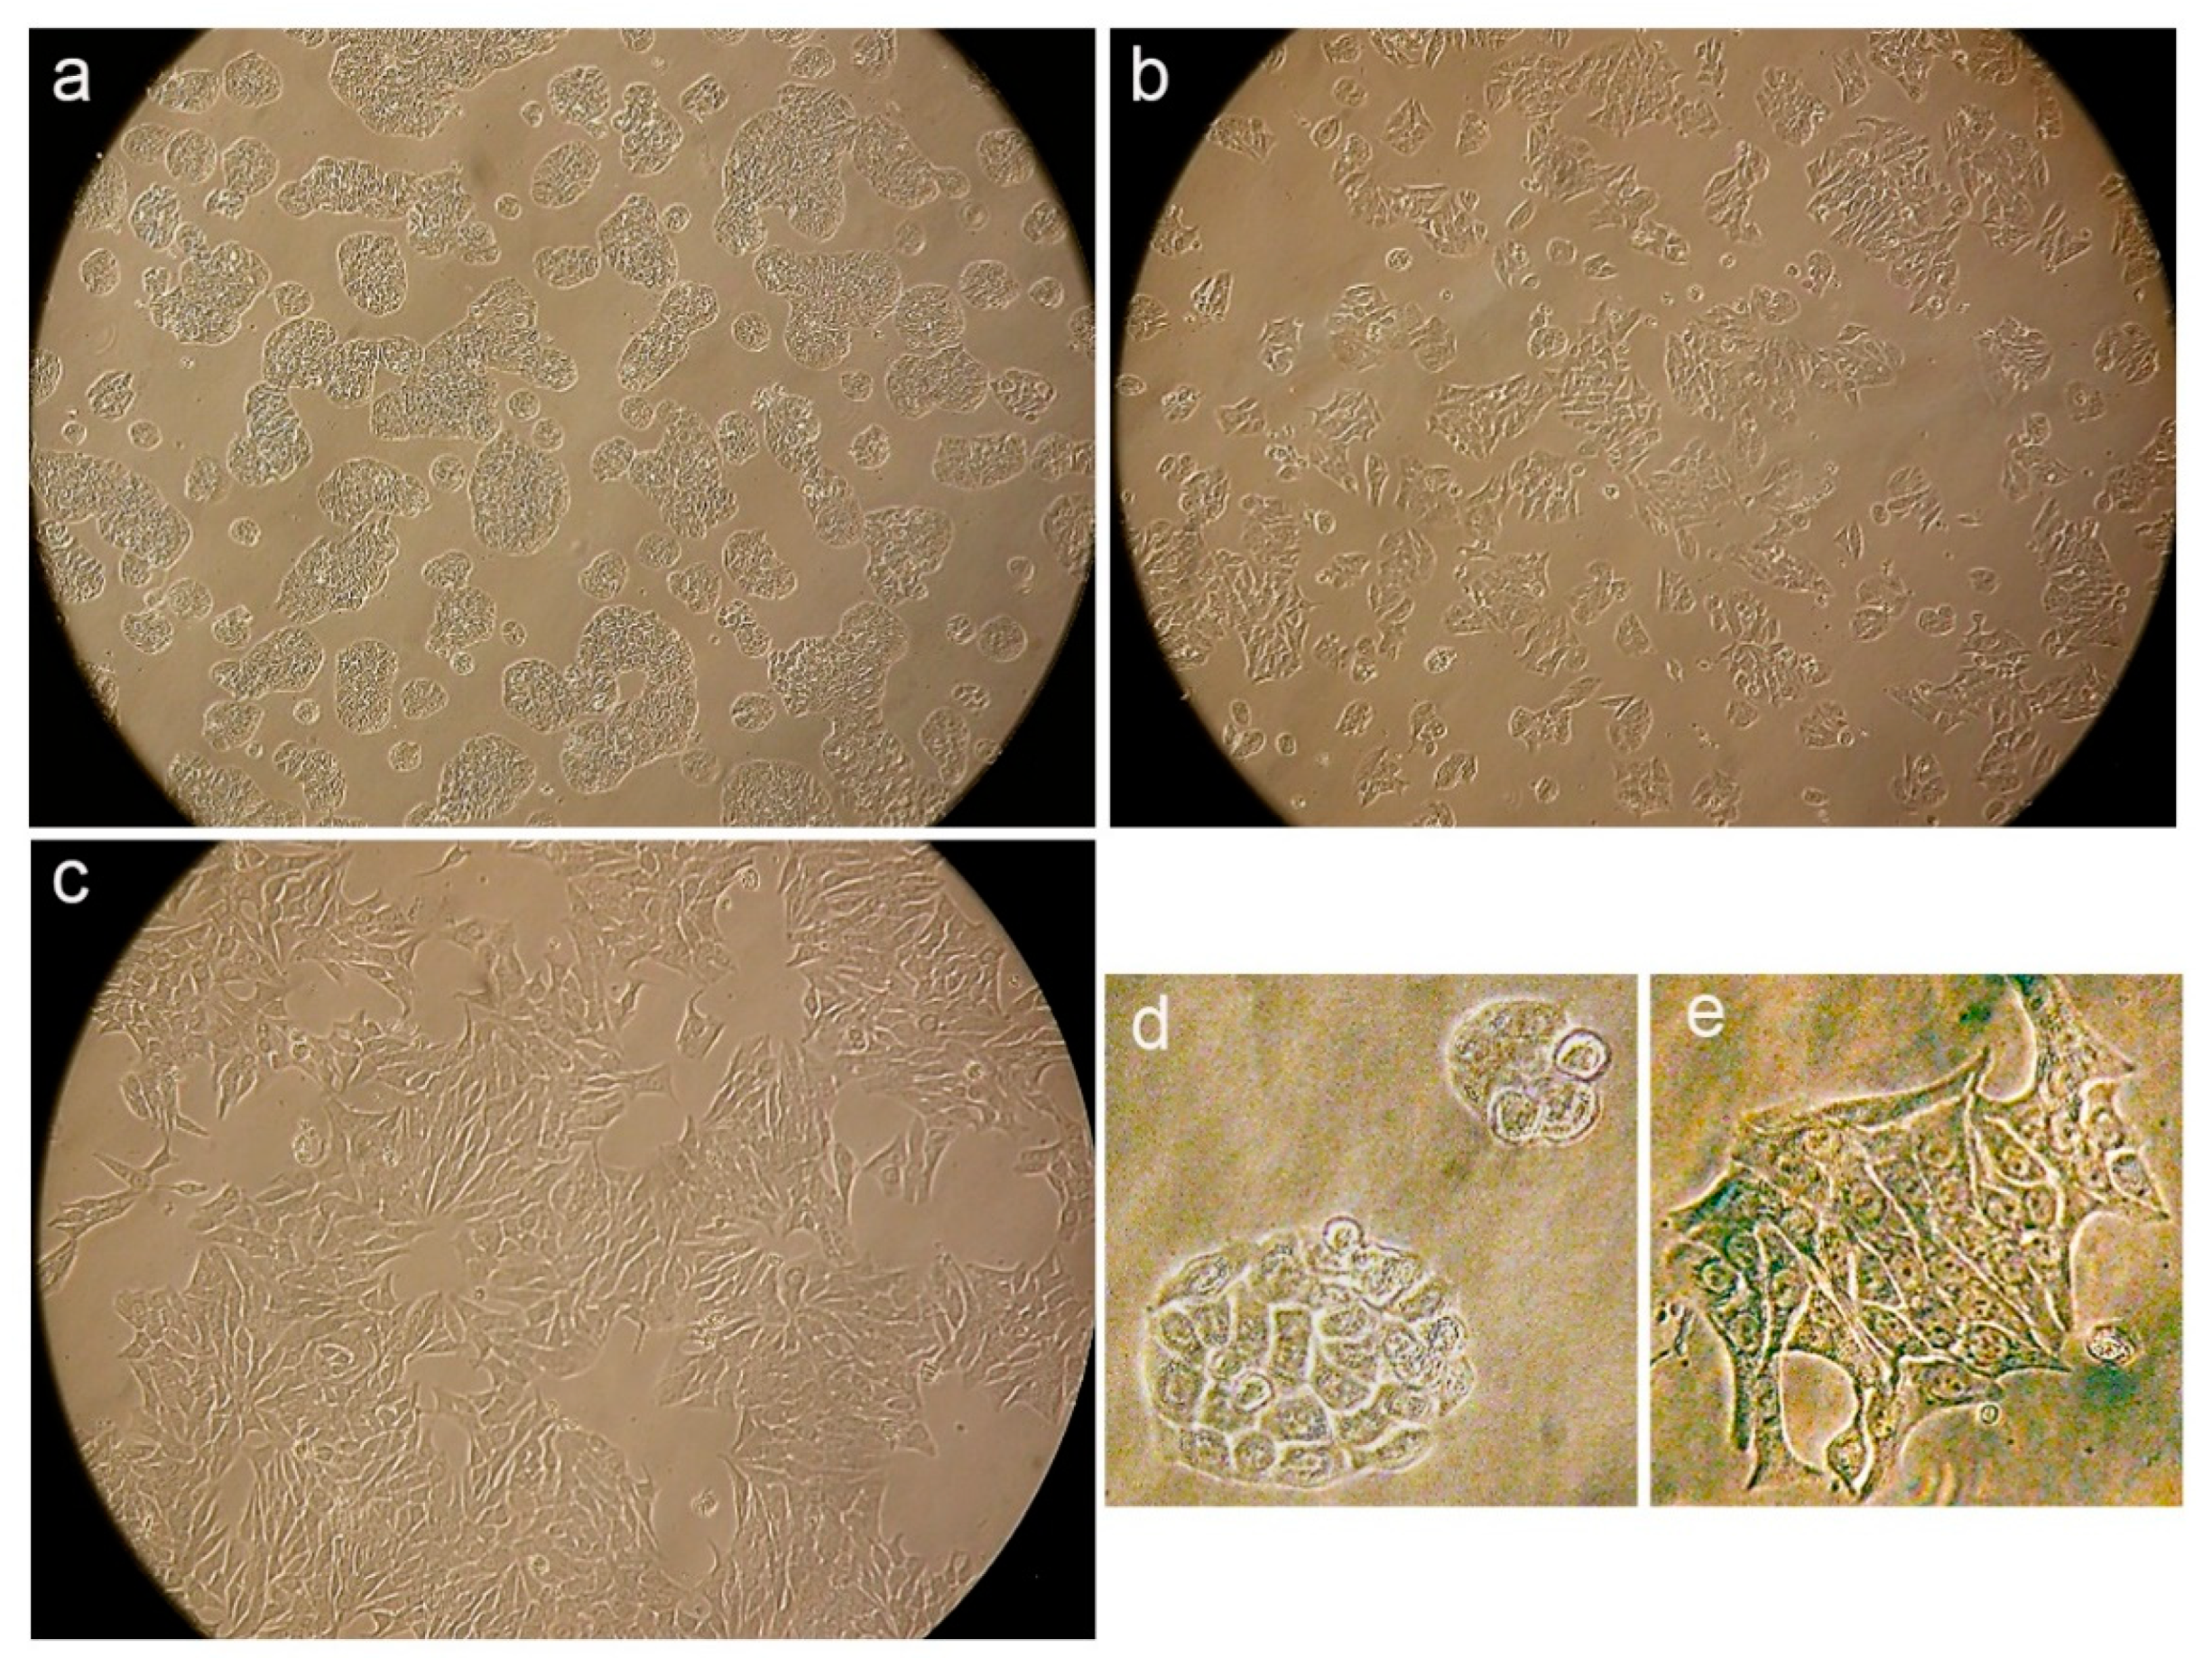
Inspired by conofolidine’s potency, G1/S arrest and altered HT-29 cell morphology (
Figure 8) without evident apoptosis or differentiation, we proposed senescence as an alternative pathway. Indeed, increased β-Gal positive HT-29, MCF-7 and A549 cells post-conofolidine exposure supported this proposal (
Figure 9). For example, ≥60% of HT-29 and MCF-7 cells were senescent compared to 15-20% of untreated cells; morphologically, these senescent cells appeared enlarged, flattened and prolonged. Senescent cells cease to divide - consistent with depleted S-phase, yet they remain metabolically active, staining positive for β-galactosidase, a lysosomal protein and putative senescence biomarker [
3]. Cellular senescence may be, in principle, considered a cancer-preventive mechanism, especially in somatic cells that have undergone many divisions and accumulated multiple genetic mutations. By conversion to an immunogenic senescent phenotype, the cell can be eliminated via the immune system [
35]. Senescence may also be considered a desired therapeutic outcome in cancer cells able to evade apoptosis, through for example p53 loss/mutation occurring in >50% human cancers [
36] and exemplified by HT-29 cells. Controversially, persistent senescence may contribute to tumourigenesis [
37] through acquisition of a senescence-associated secretory phenotype (SASP) that may promote tumour progression. However, corroborative evidence demonstrated herein reveals that the ultimate fate of conofolidine-induced senescence is death.
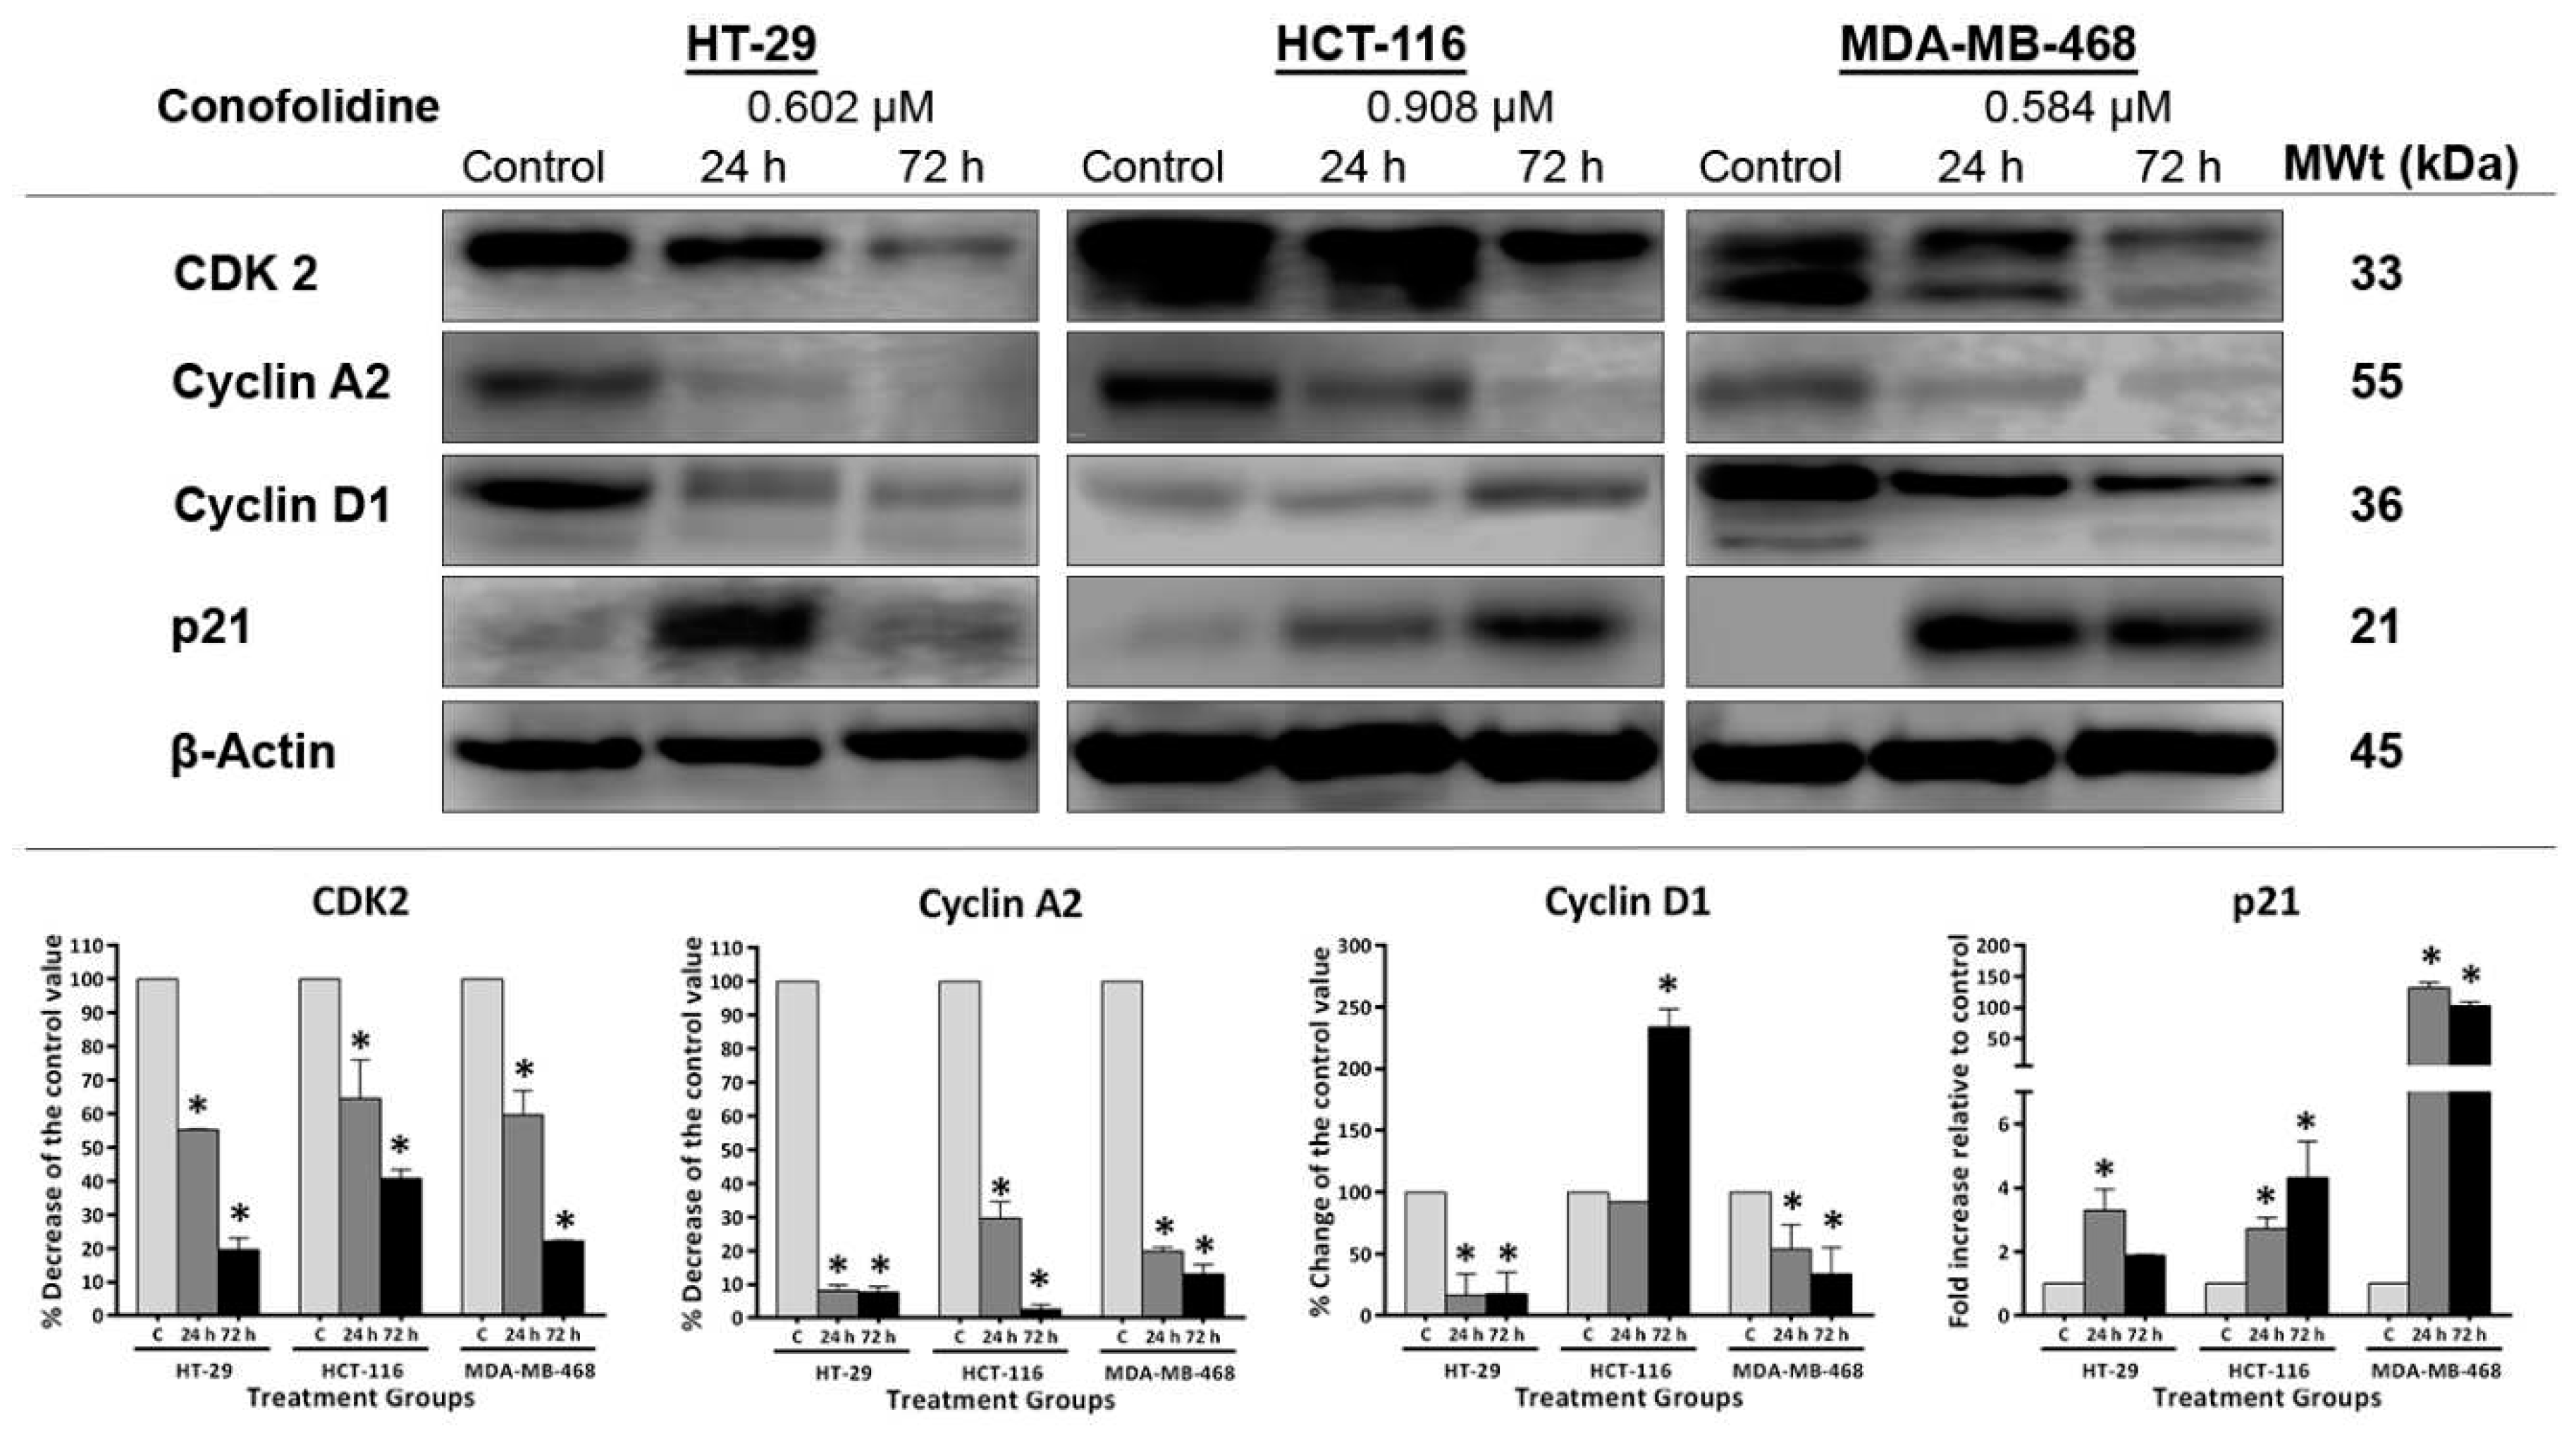
Interference with crucial cell cycle regulators - CDK2, cyclins A2, D1 and p21 - is expected with G1/S arrest inducers. Conofolidine affected the expression of these controllers in HT-29, HCT-116 and MDA-MB-468 cells (
Figure 10). Downregulation of CDK2 and both cyclin A2 and D1 was observed; as a consequence, these cells were not able to progress G1 through S-phase. It may be postulated that there was i) less cyclin D1 available for CDK4/6 activation to phosphorylate the retinoblastoma protein (pRb) thereby triggering G1 initiation [
38]; ii) decreased CDK2 expression required for both G1/S transition - upon binding to cyclin E2 - via phosphorylating both histone H1 and pRb [
39], and S-phase completion - upon binding to cyclin A2 - via phosphorylating the replication machinery components e.g., DNA polymerase [
40]. Diminished cyclin A2, which can activate CDK1 in addition to CDK2, leads to enhanced deterioration of S-phase progression through perturbation of DNA replication origin [
41], and decreased G2/M transition [
42] via disturbing nuclear envelope breakdown, nuclear accumulation of cyclin B1 [
43] and anchoring of the mitotic spindle [
44]. Thus, the observed G2 arrest accompanying S-phase depletion in MIAPaCa-2 cells may be explained. Our results demonstrating cyclin D1 downregulation in HT-29 and MDA-MB-468 are similar to previously described cyclin D1 suppression by conophylline in carcinoma cells [
24]. Conversely, cyclin D1 in HCT-116 was exceptionally increased possibly because cyclin D1 is available in two isoforms (a and b); cyclin D1b upregulation induces G1 arrest with apoptosis in carcinoma cells [
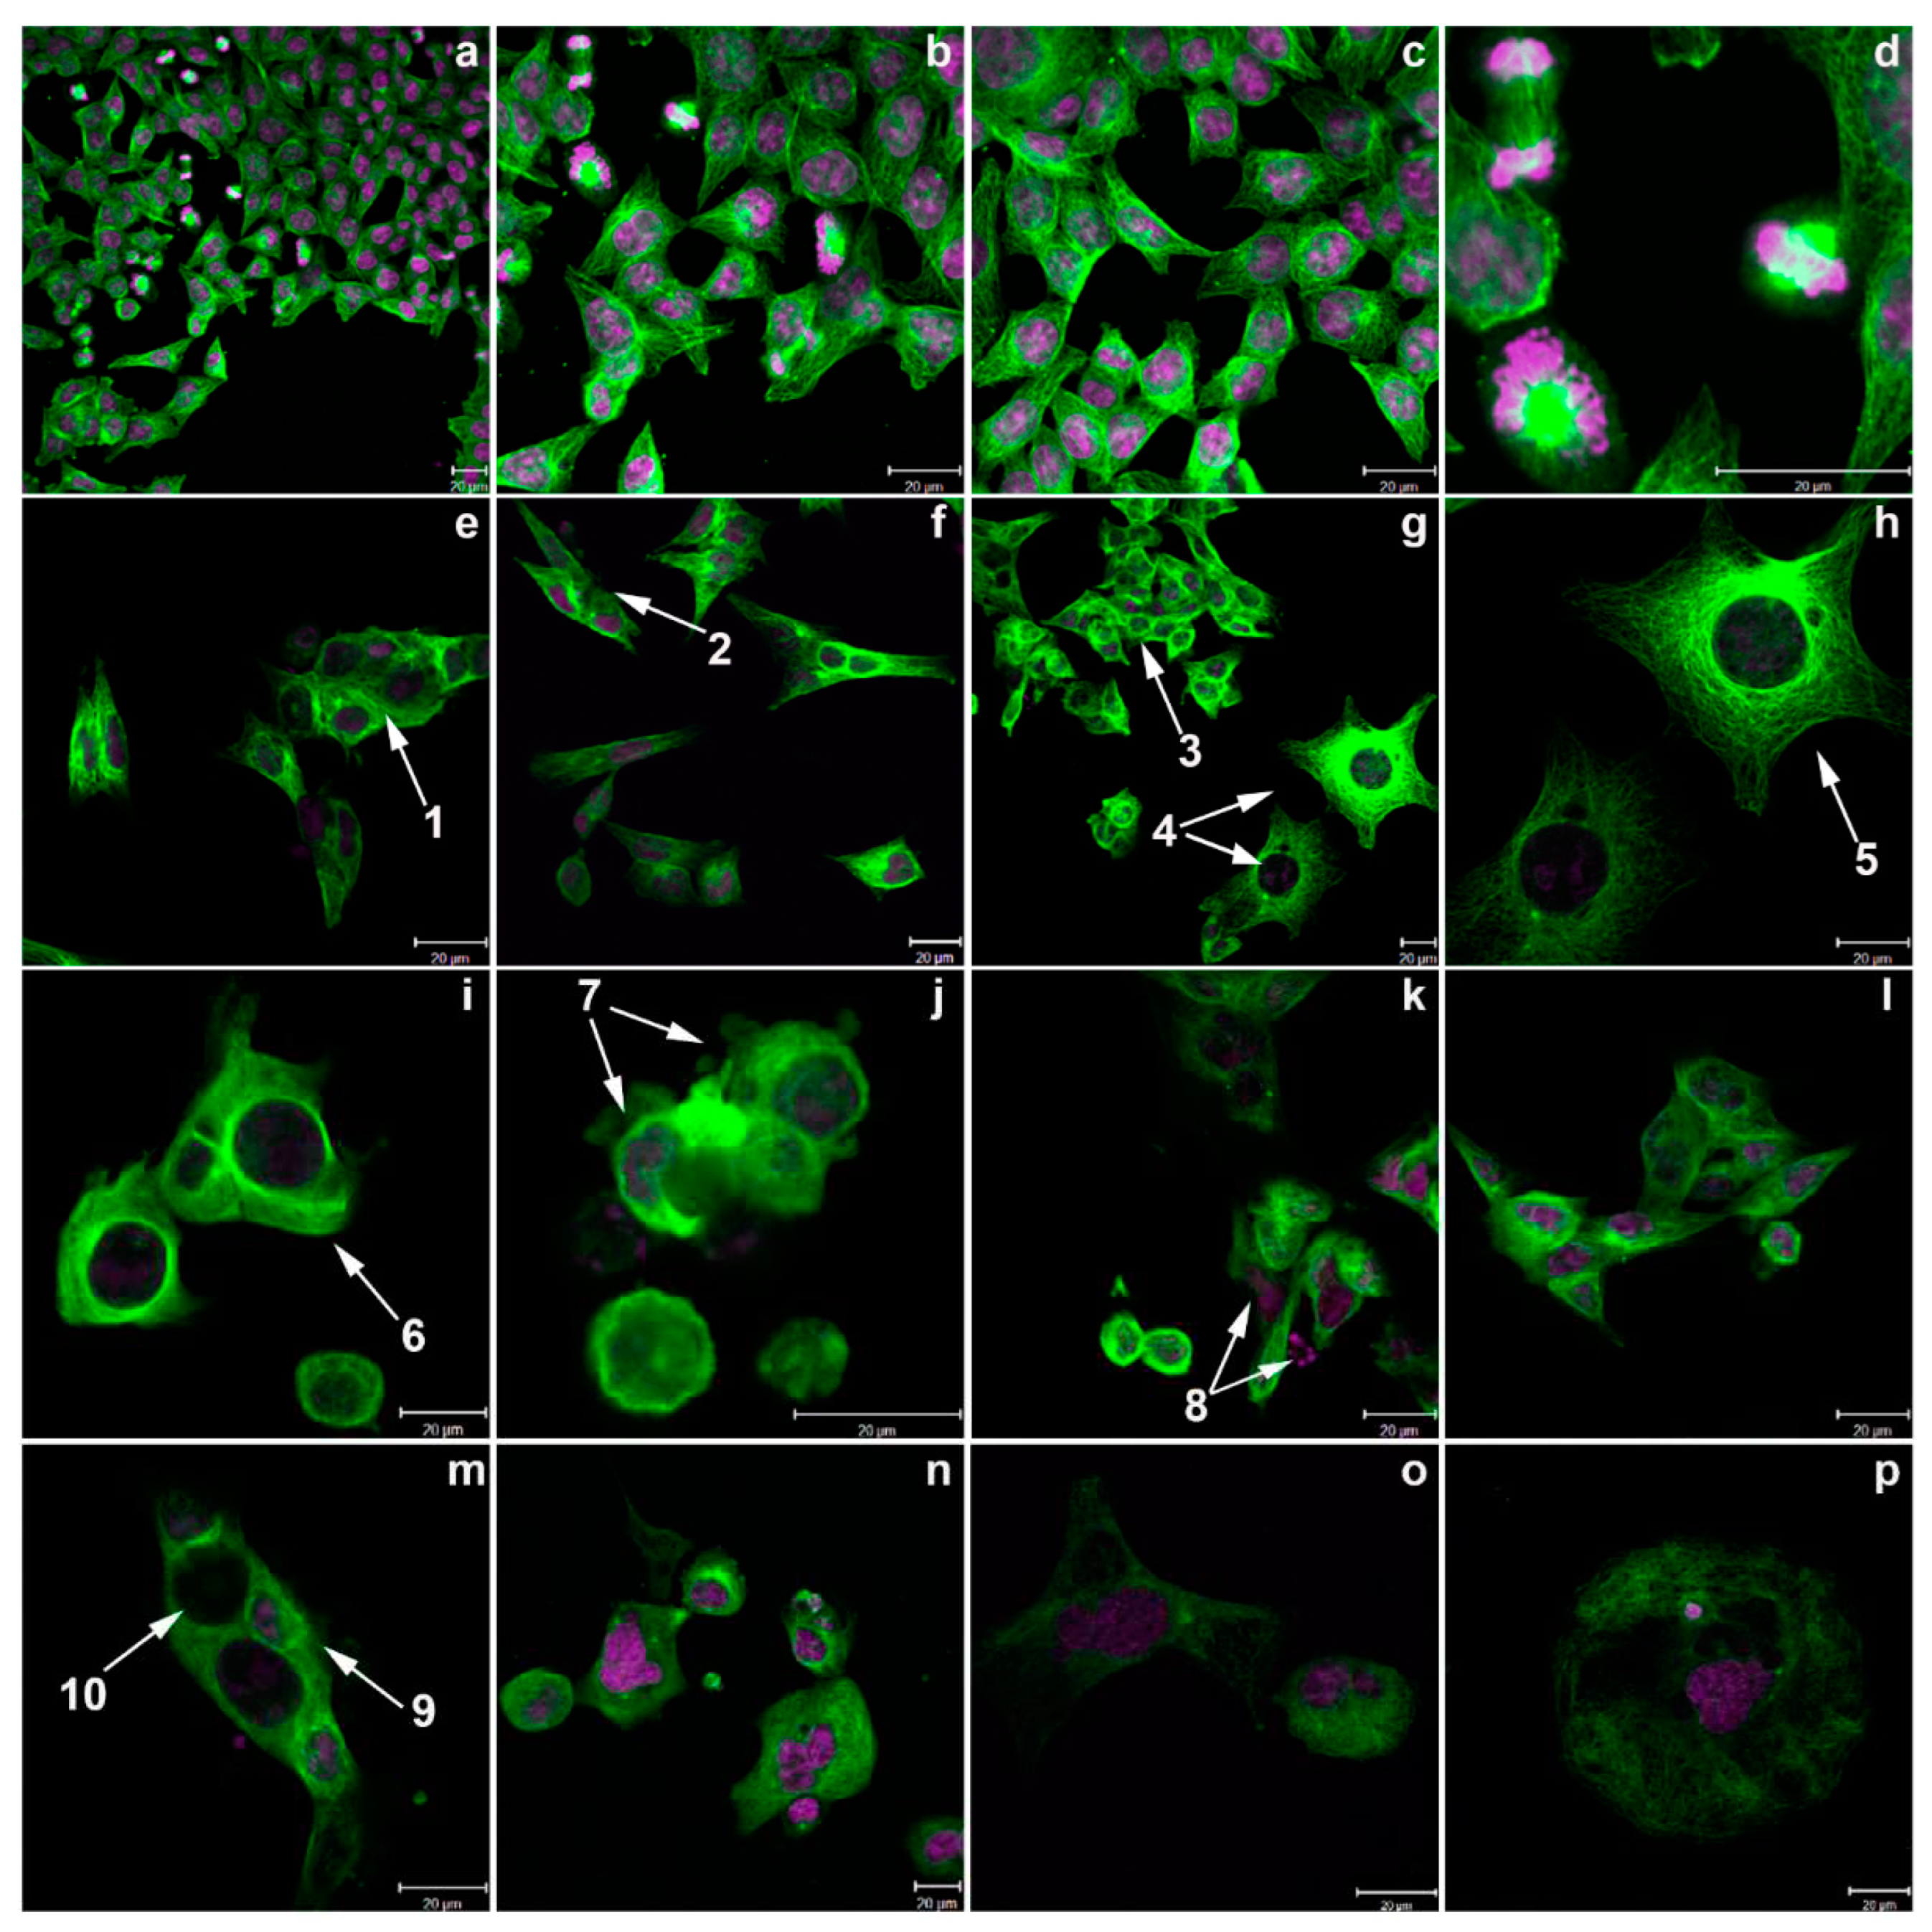
45]. Alternatively, HCT-116 cells might replicate their DNA without completing mitosis and/or cytokinesis, and re-enter G1 with tetraploid 4N DNA - driven by the increased cyclin D1- i.e. mitotic slippage. Indeed, confocal microscopy visually confirmed such aberrant division seen as frequent multi-nucleated cells (
Figure 11). Upregulated p21 inhibits the kinase activity of CDK2 and CDK2/cyclin complexes [
46,
47]. In addition, p21 can suppress the proliferating cell nuclear antigen (PCNA) required for DNA replication thereby blocking S-phase progression [
48]. Upregulation of p21 accompanied senescence-induction in HT-29 cells. Indeed, p21 mediates cellular senescence via p53-dependent and -independent pathways [
49]. However, one could speculate whether p21 overexpression could contribute to apoptosis especially evident in MDA-MB-468. p21 may disrupt transcription factors e.g. STAT3 [
50] which could inhibit the expression of antiapoptotic proteins as some authors reported [
51]. Interestingly, increased p21 expression following conofolidine treatment seems to be p53-independent; this is because: i) MDA-MB-468 cells, which displayed >100-fold p21 increase, harbour a gain of function (GOF)-R273H-mutation in their p53 gene; ii) HCT-116 cells which express WT-p53 exhibited only ~3-fold p21 increase. However, recent studies have shown that p21 can be induced by ROS-mediated DNA-damage even when p53 function is compromised [
52].
Confocal imaging of HCT-116 cells treated with conofolidine showed several aberrant mitotic phenotypes support our findings (
Figure 11). Multinucleation and mitotic slippage (consistent with cyclin D1 upregulation); decreased DNA content, microtubules’ disarrangement and changed polarity (consistent with cyclin A2 and CDK2 downregulation). Furthermore, DNA fragmentation and plasma membrane disintegration and/or blebbing confirmed apoptotic cells (as indicated in annexin V/FITC and cell cycle analyses). The multinucleated cells either succumbed directly to apoptosis, or continued another round of division. In support of the second fate, some cells exhibited aberrant, chaotic asymmetric multiplication with spindle disarrangement. Another form of mitotic abnormality appeared as multipolar giant cells with enlarged nuclei, which might be due to failure of nuclear envelope breakdown. The accumulation of DNA fragments might trigger genotoxic stress that leads to cell death. In comparison with the vincristine - a microtubule-targeting agent, both compounds disturbed microtubules’ and mitotic spindle machinery. However, vincristine decreased microtubules’ density more than conofolidine. DNA fragmentation is a likely consequence of lethal DNA-damage. Indeed, conofolidine caused DNA-DSBs as seen by intense γ-H2AX foci and increased percentage of γ-H2AX+ events with the majority of events emerging in G1- in addition to G2/M- phases of the cell cycle (
Figure 12 and Figure S9–S11). The histone protein H2AX is a robust reporter of unrepaired DNA-DSBs when phosphorylated to γ-H2AX at nascent DSB sites. Accumulation of γ-H2AX molecules in the chromatin around DSB sites creates foci at which DNA repair and chromatin remodeling proteins are recruited [
53]. Confocal images revealed an increased number of DNA-DSBs foci with foci saturation was frequently seen in HCT-116 cells. In MDA-MB-468 cells, the DNA-damage detected likely precedes exacerbated conofolidine-induced apoptosis. Interestingly, these cells lack a functional pRB resulting in an attenuated response to DNA-damage [
54]. Furthermore, conofolidine, by downregulating CDK2 and cyclin A2, halts the functions of both CDK2/cyclin A2 and also CDK2/cyclin A1 complexes. Considering the role of A-type cyclins in activating DNA-DSB repair mechanisms in collaboration with CDK2 and Ku DNA repair proteins [
55], conofolidine rendered carcinoma cells more prone to DNA-damage leading to aggravated cytotoxicity and apoptosis. Compared to etoposide, a topoisomerase II inhibitor, conofolidine induced significant DSBs at lower concentrations, especially in MDA-MB-468 and MIAPaCa-2 cells: ~0.6 μM conofolidine induced ~20% DSBs compared to ~35% for 2.0 μM etoposide. Thus, conofolidine demonstrated its potency as a DNA damaging agent comparable to etoposide.
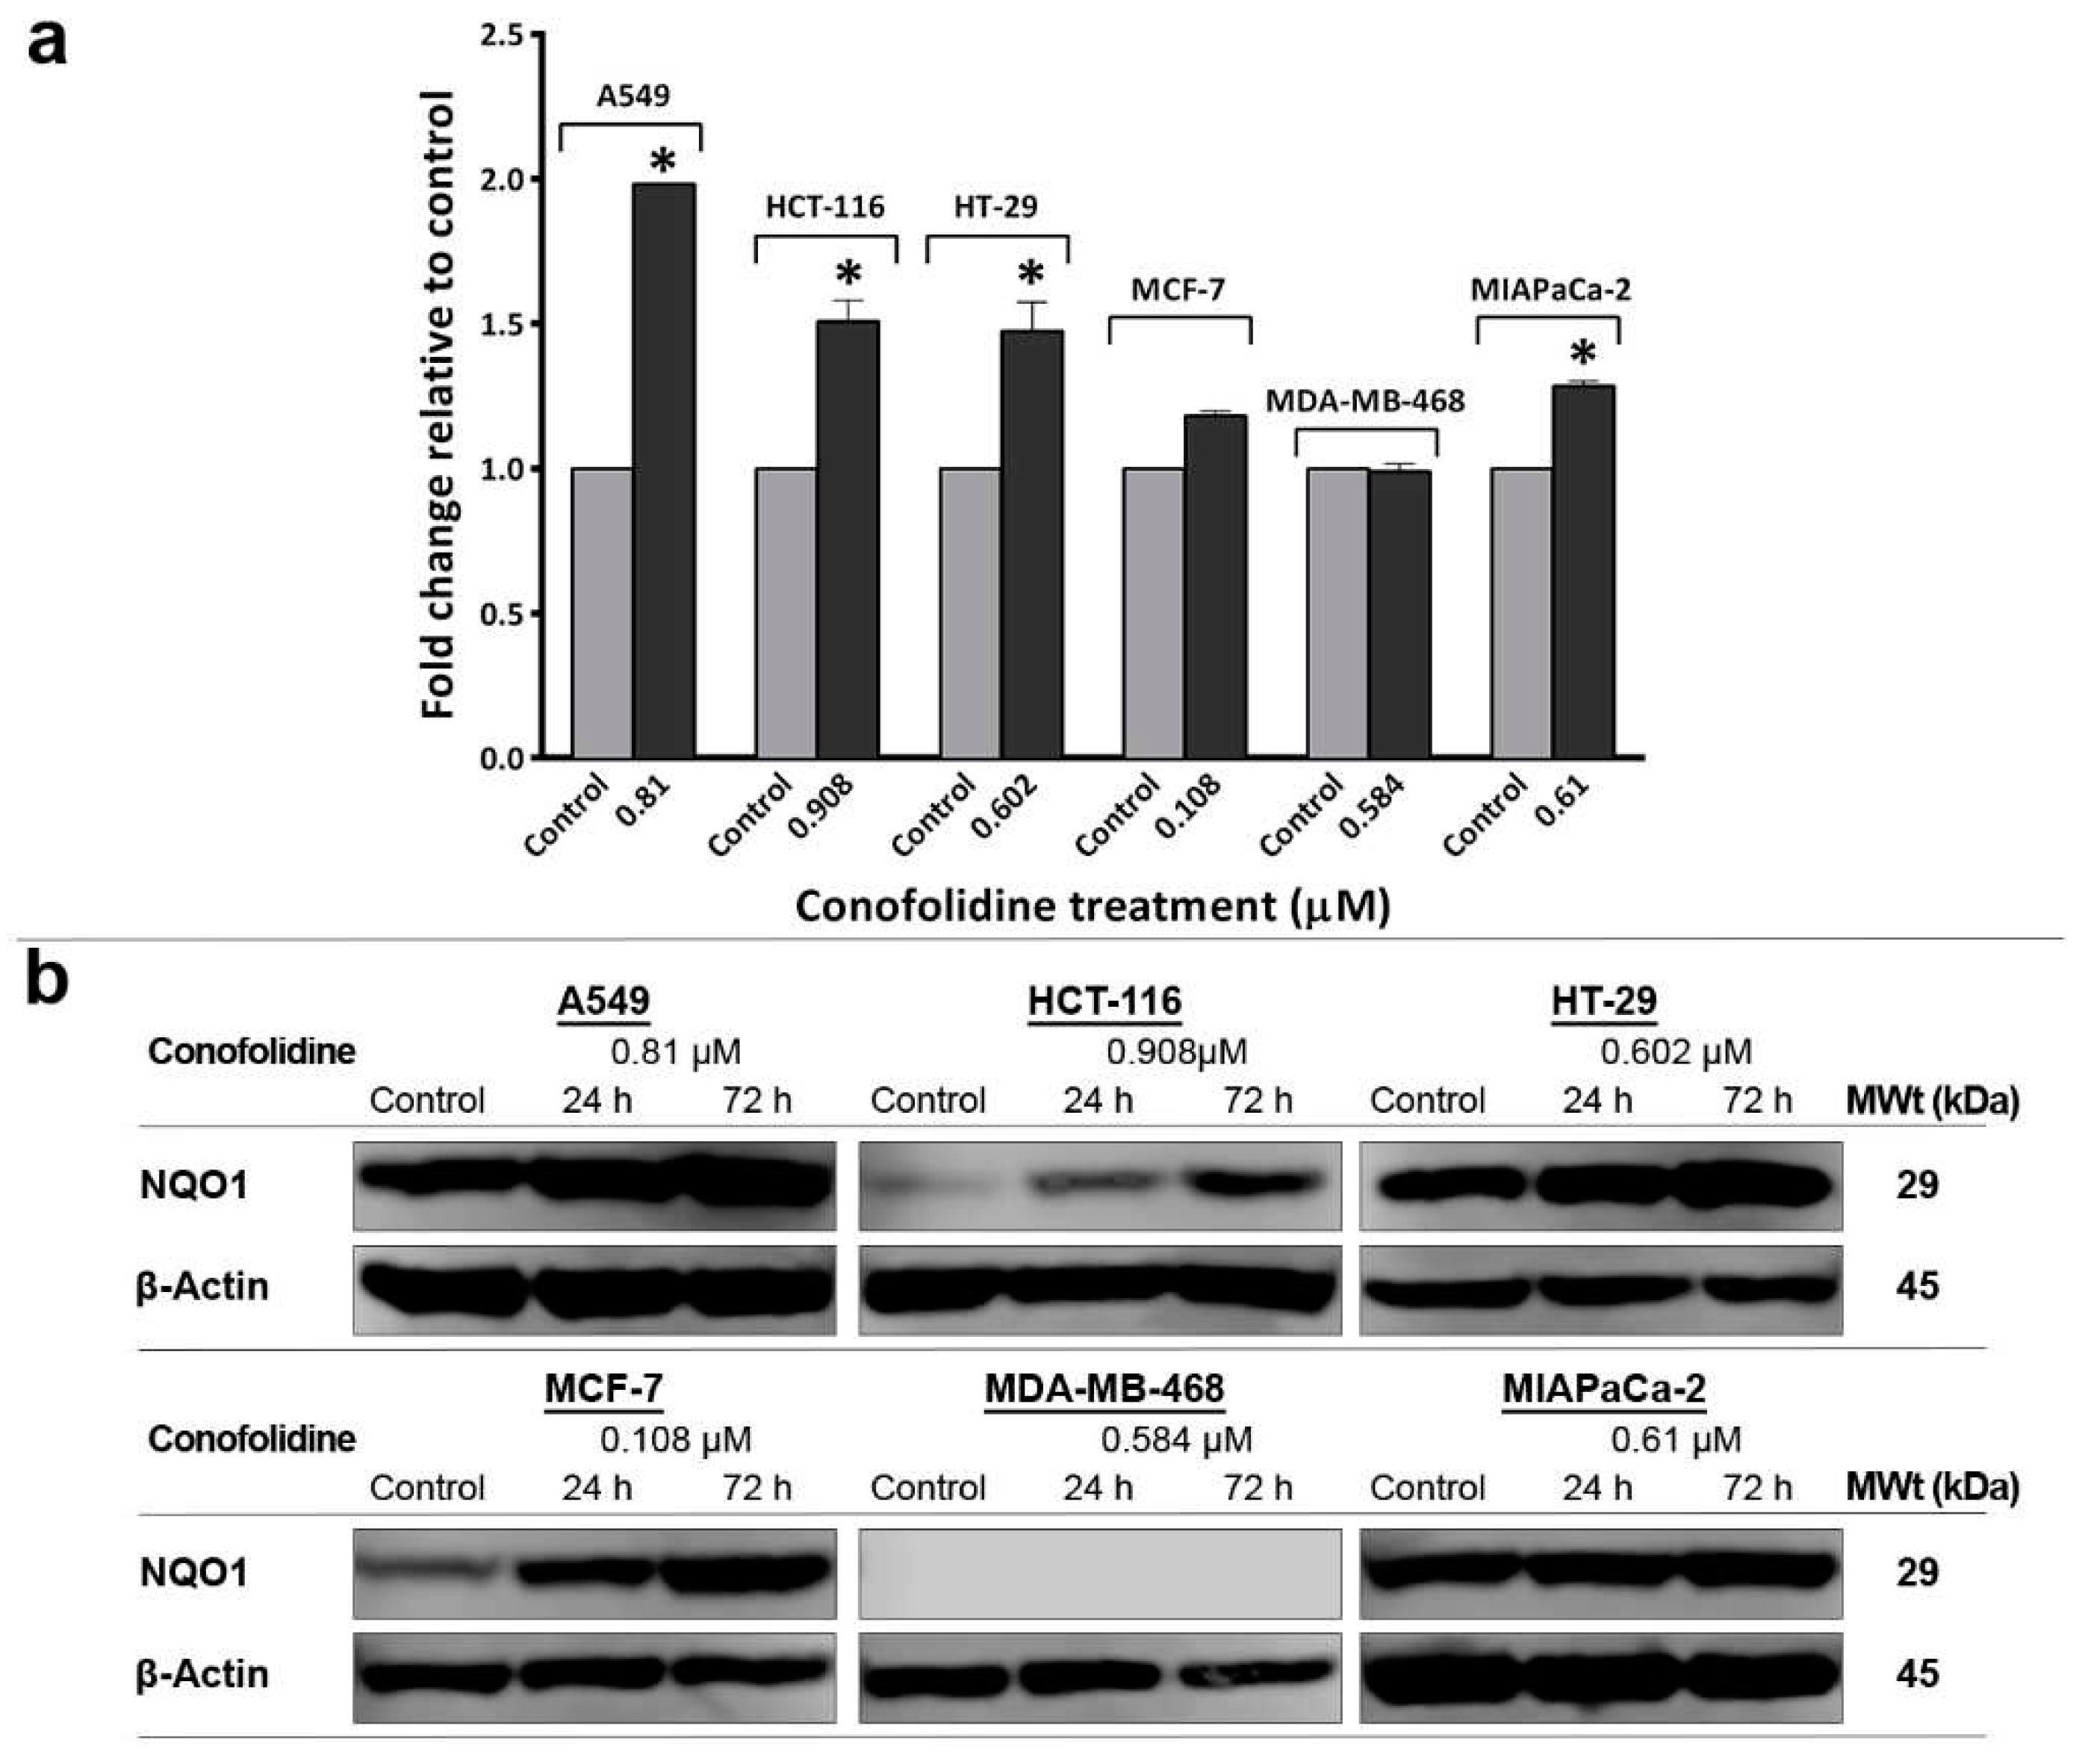
We showed that conofolidine was capable of inducing ROS (H
2O
2) in our cancer cell line panel - with the exception of MDA-MB-468 (
Figure 13). To cope with oxidative stress, cells increased NQO1 expression, an inducible quinone-detoxifying enzyme. In this regard, all ROS-positive cells exhibited NQO1 upregulation. It is noticeable that NQO1 expression is increased in these cells similarly although there is variation in their induced H
2O
2 level. One could speculate that conofolidine might induce other species of ROS e.g. hydroxyl radicals (OH
•) which may trigger NQO1 expression. Oxidative stress, by causing unrepairable DNA-damage, led to p21 upregulation and cell cycle arrest. Thus, ROS may act as mutagens and contribute to the induction and maintenance of cell senescence [
56]. Interestingly, some studies reported that NQO1 stabilises p53 or causes p53 accumulation independent of MDM2, provoking senescence and apoptosis [
57,
58]. ROS are known triggers of apoptosis for plant-derived anticancer agents e.g. vinca alkaloids [
59]. In the case of conofolidine, the oxidative stress elicited apoptosis in HCT-116 and MIAPaCa-2 cells through i) altering mitochondrial membrane permeability, cytochrome C release, caspase 3/7 activation and PARP-cleavage; ii) inducing DNA-damage which is aggravated by conofolidine’s blockade of its repair mechanism via CDK2/cyclin A complex inhibition. Absence of NQO1 in MDA-MB-468 cells is consistent with other studies which failed to detect NQO1 expression in these cells [
60,
61]. Such absence might enhance conofolidine’s anticancer action: conofolidine (like other conophylline family members) is converted to its quinone metabolite [
14]; accordingly, the absence of the quinone-detoxifying NQO1 delayed its metabolic inactivation which enhanced its anticancer actions.
Figure 1.
Structures of conofolidine(1), conophylline(2), leucophyllidine(3) and bipleiophylline(4).
Figure 1.
Structures of conofolidine(1), conophylline(2), leucophyllidine(3) and bipleiophylline(4).
Figure 2.
Growth inhibitory effects of conofolidine in A549, HCT-116, HT-29, MCF-7, MDA-MB-468 and MIAPaCa-2. Each representative graph shows one independent MTT trial. Cells were seeded in 96-well plates (3 × 10³ cells/well) and treated with TQ for 72 h. No. trials ≥3; n=4 per independent experiment.
Figure 3.
Representative photos of conofolidine’s inhibition of MIAPaCa-2 colonies at 0.1 and 0.5 µM. Mean ± SD bars show mean survival fraction as % of control. Asterisk indicates significant inhibition (p≤0.05). Cells were seeded, treated with conofolidine (24 h) then medias replaced with fresh ones. When colonies contained ≥50cells, colonies were fixed, stained and counted. Plating efficiencies ranged between ~25% and ~65%. No. trials ≥3; n=2 per independent experiment.
Figure 4.
Mean ± SD bars showing % distribution of cell cycle phases of A549, HCT-116, HT-29, MCF-7, MDA-MB-468, MIAPaCa-2 following 24, 72 h-1× and 2×GI50 conofolidine treatments. S-phase depletion and pre-G1 increase are the most significantly encountered changes. Cells were treated; then stained with PI and at least 20,000 events/sample were measured. Asterisks indicate significant (p≤0.05) changes compared to control. No. trials ≥3; n=2 per independent experiment.
Figure 5.
Representative cell cycle histograms showing conofolidine-induced perturbations in A549, HCT-116, HT-29 MCF-7, MDA-MB-468 and MIAPaCa-2 cell cycles after 24 and 72 h-treatments with their respective 1× and 2×GI50. The most prominent observations are depleted S-phase with occasional G1-arrest and increased pre-G1(<2N) events. The G1/S arrest is mainly observed in HT-29 and MCF-7 treatment groups. An exceptionally increased G2/M can also be seen in MIAPaCa-2 cells. Cells were treated; then stained with PI and at least 20,000 events/sample were measured. No. trials ≥3; n=2 per independent experiment.
Figure 6.
(a) and (b) Representative dot-plots and mean ± SD bars showing annexin V/PI results of carcinoma cells treated with conofolidine for 72 h with respective 2×GI50. Significantly increased apoptotic cells compared to control could only be seen in MDA-MB-468, MIAPaCa-2 and HCT-116 but not in HT-29. Like HT-29; A549 and MCF-7 did not show significant apoptotic events. Samples were stained with annexin V/PI and at least 10,000 events were detected. The percentage of apoptotic events was equal to sum of cells undergoing early-apoptosis (AV+/PI-) plus late-apoptosis (AV+/PI+). Asterisk indicate statistically significant (p≤0.05) increments compared to control. No. trials ≥3; n=2 per independent experiment. (c) Mean ± SD bars showing changes in caspases 3/7 activities following 24 h conofolidine (2×GI50) exposure in carcinoma cell lines. Conofolidine significantly increased caspases 3/7 activities (shown as fold change relative to control) in HCT-116, MDA-MB-468, and MIAPaCa-2. However, no significant changes were seen in A549, HT-29 and decreased activities were observed in MCF-7 cells. Assays were repeated 3 times (n=2). Asterisks indicate a statistically significant (p≤0.05) change compared to the control.
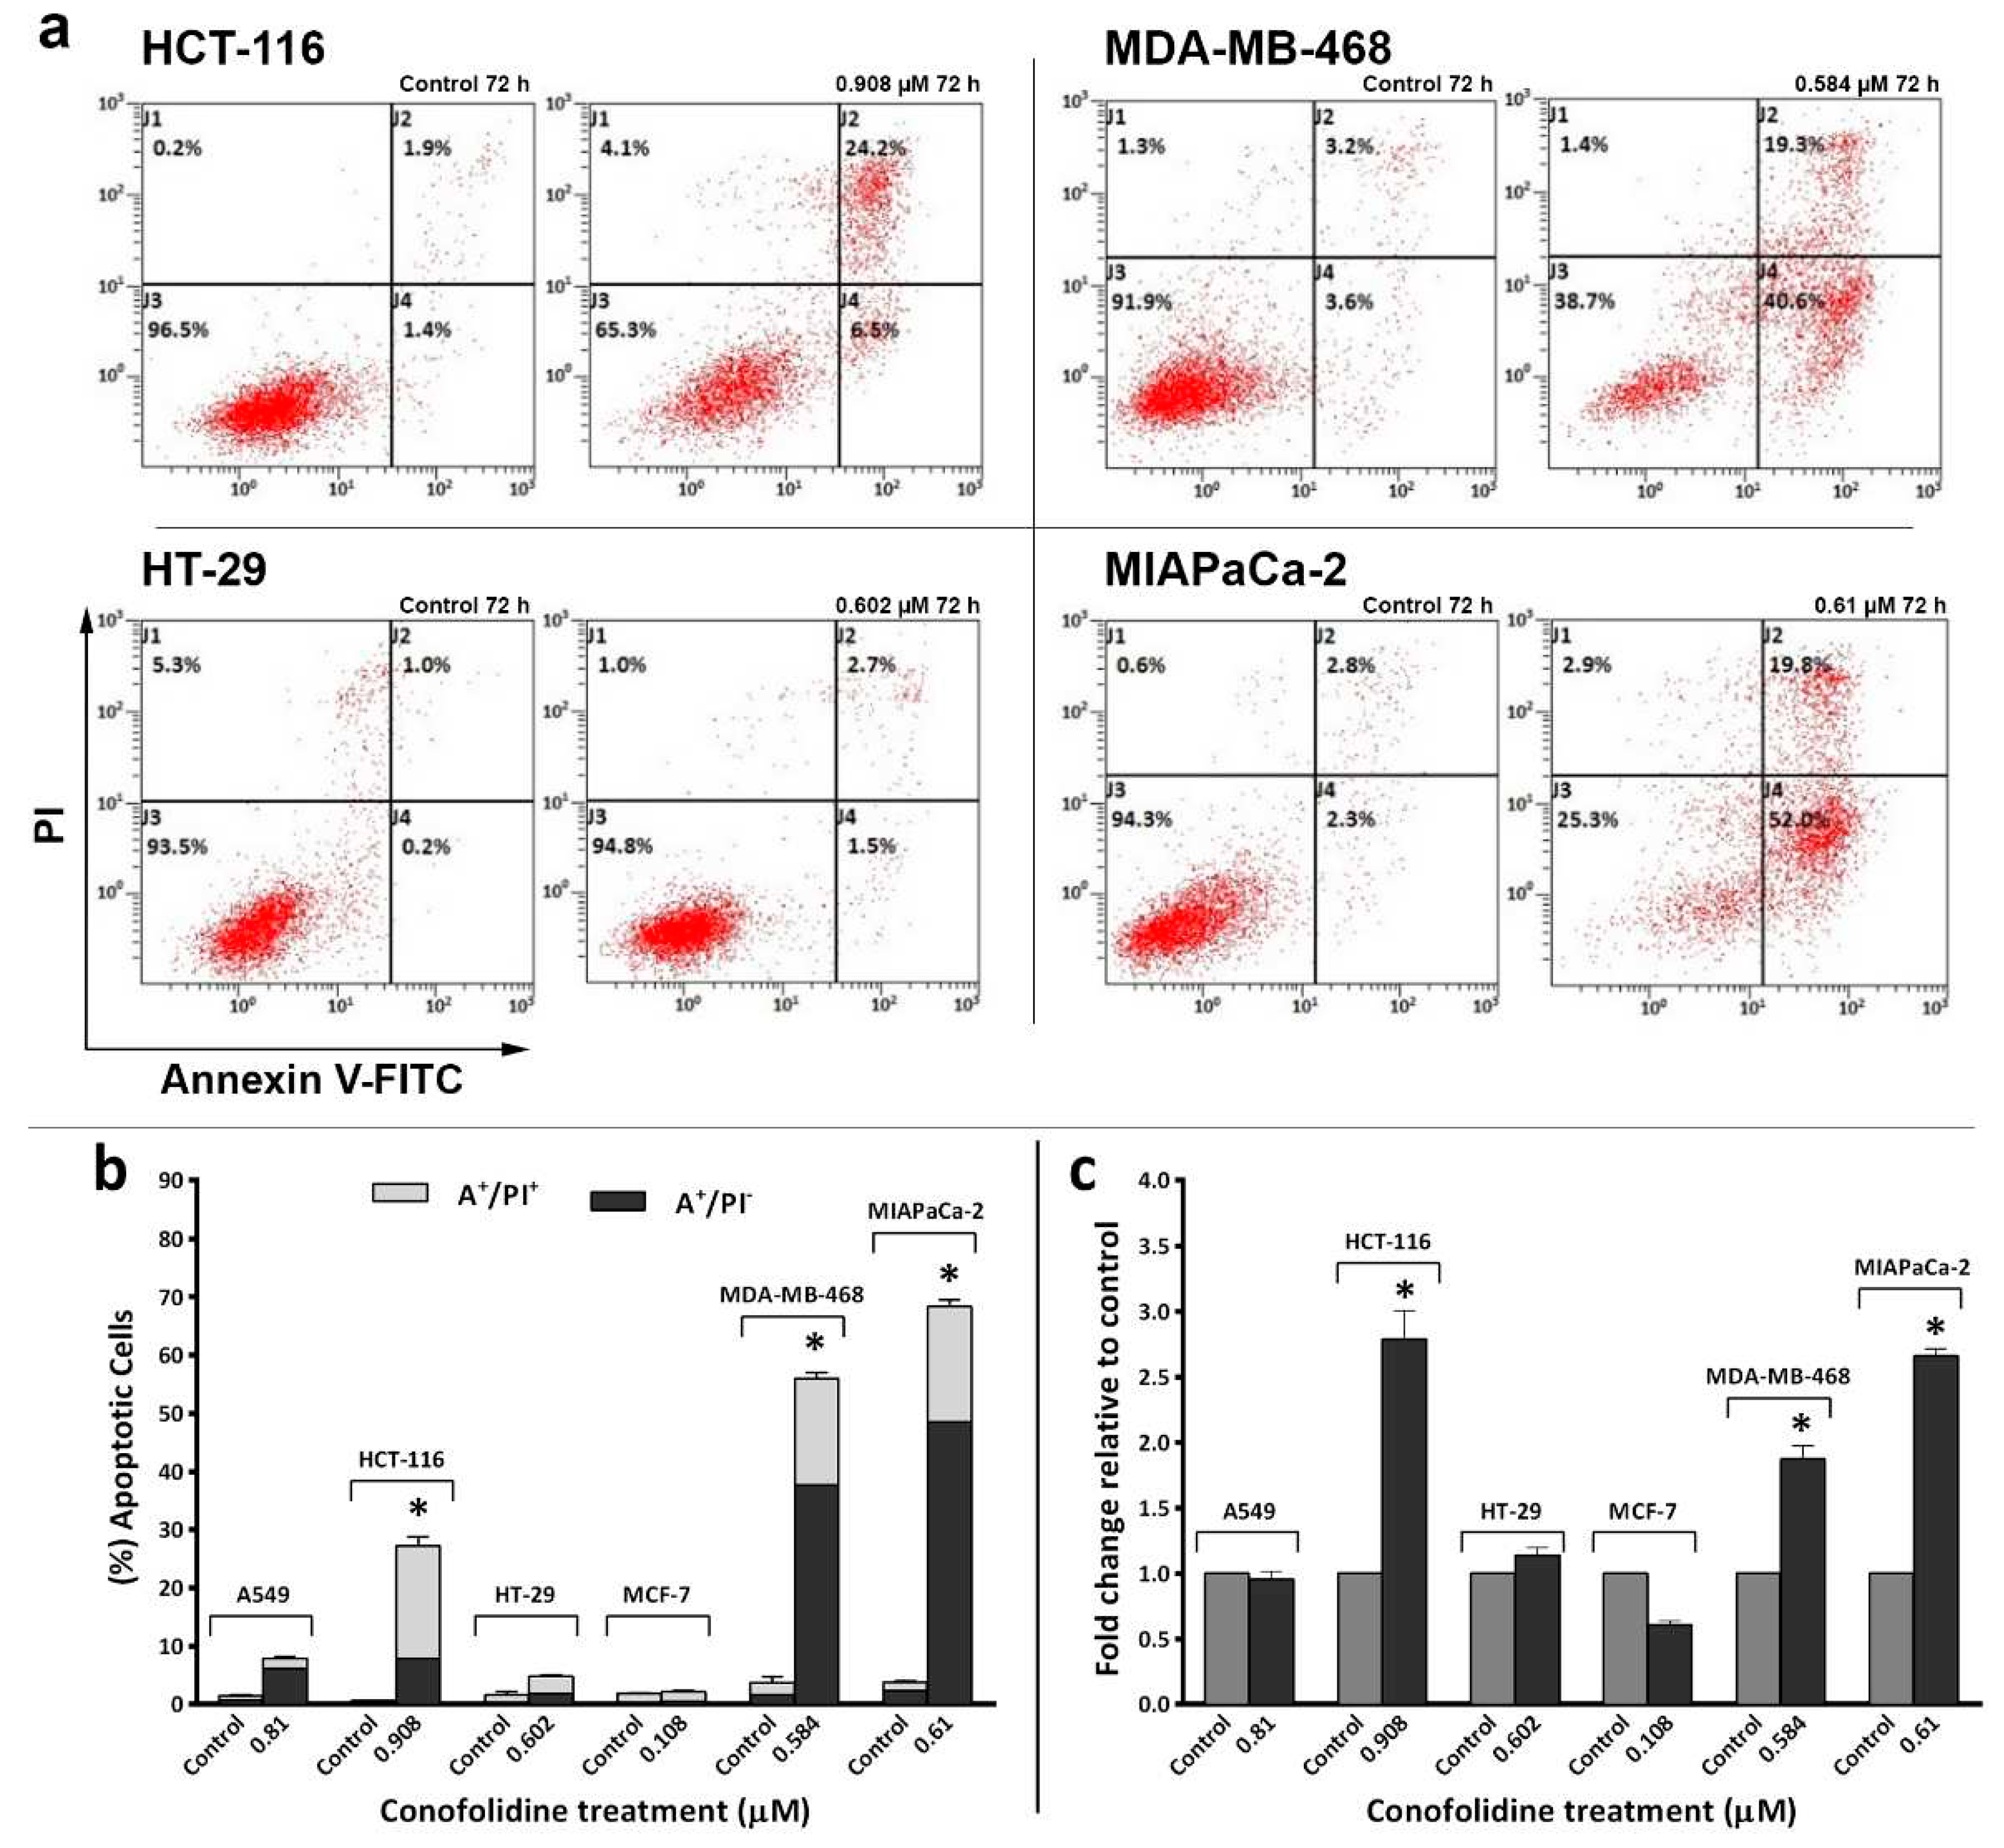
Figure 7.
Representative western blot bands showing expression of whole and cleaved PARP in protein lysates of carcinoma cell lines treated with conofolidine (2×GI50, 24 h and 72 h). Western blots were performed using antibodies to detect whole and cleaved PARP and housekeeping gene β-Actin. (a) Cleaved PARP can be seen in HCT-116 after 24 h and in MDA-MB-468 and MIAPaCa-2 cells after 72 h exposures. (b) Faint bands of cleaved PARP can be seen in A549 and HT-29 cells after 72 h while no cleaved PARP can be seen in MCF-7. Assays were repeated 3 times.
Figure 8.
Representative images of HT-29 cells obtained by light inverted microscope showing morphological and size alterations induced by conofolidine (2×GI50). (a) ~65% Confluent untreated control cells, (b) 24 h Conofolidine treated cells and (c) 72 h-conofolidine treated cells at 10× objective magnification. Examples of cells` morphology following 72 h incubation with vehicle control (d) and 2×GI50 conofolidine (e); 40× objective magnification.
Figure 9.
Representative images from light inverted microscope and mean ± SD bars showing increased % of senescence-associated β-Gal positive cells induced by conofolidine (2×GI50, 72 h) compared to untreated controls HT-29, MCF-7, and A549. Images of both HT-29 and MCF-7 cells were captured at 20x while A549 images were taken at 40x objective magnifications. Mean bars ± SD showing significant (p≤0.05) increase in the percentage of senescence-associated β-Gal positive cells relative to untreated controls in HT-29, MCF-7 and A549 cells treated with conofolidine (2×GI50, 72 h). Cells were either incubated for 72 h with medium alone or with conofolidine (2×GI50); then stained with β-Gal after which images were captured from at least 4 different areas in each well of treatment groups. From captured images, senescence β-Gal positive cells were counted in both treated and untreated controls and at least 1000 cells were counted per each treatment group. Assays were repeated 3 times (n=2). Asterisks indicate a statistically significant (p≤0.05) change compared to the control.
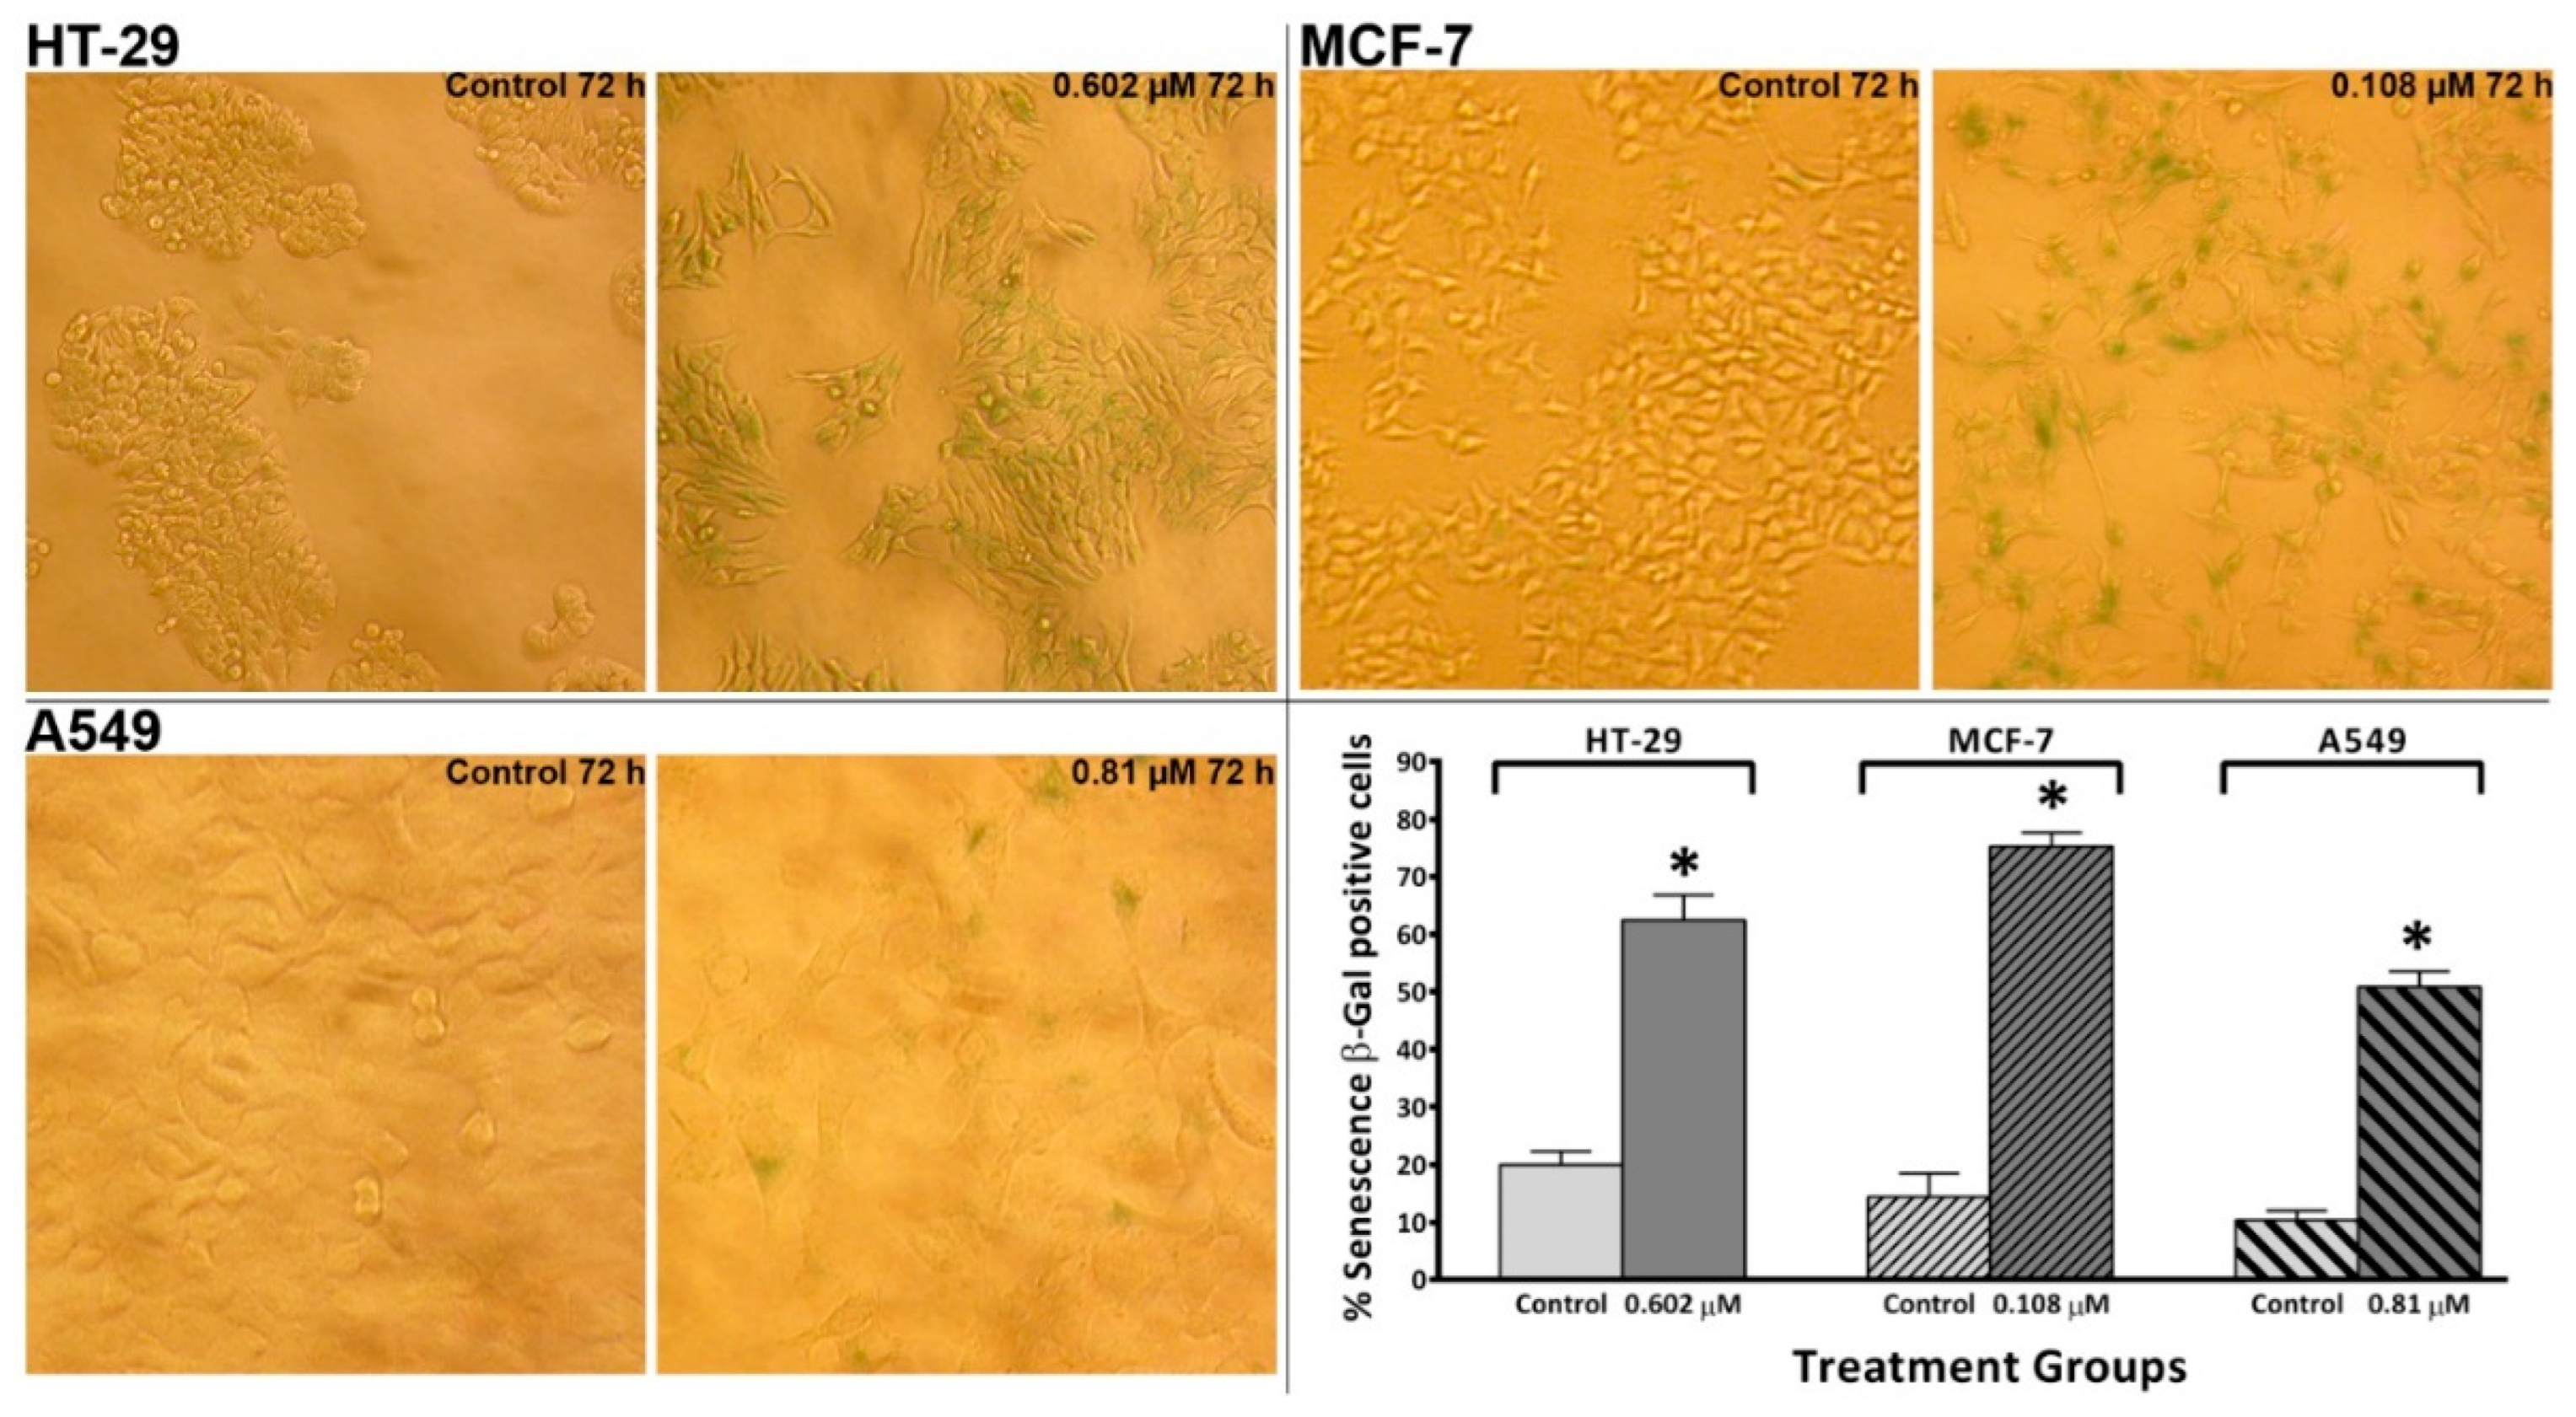
Figure 10.
Representative western blot showing expression of and mean ± SD error bars from densitometric analysis of CDK2, cyclin A2, cyclin D1 and p21 in protein lysates of HT-29, HCT-116 and MDA-MB-468 cells treated with conofolidine (24 h and 72 h, 2×GI50). Western blots were done using antibodies against CDK2, cyclin A2, cyclin D1, p21 and housekeeping gene β-Actin. Mean ± SD error bars presented as % decrease of the control value of CDK2, cyclin- A2 and D1; and fold increase of p21 relative to control. Conofolidine significantly decreased CDK2 and cyclin A2 and increased p21 expressions. Cyclin D1 is also decreased in HT-29 and MDA-MB-468 while its expression is increased in HCT-116 cells. No changed β-Actin expression was seen. Assays were repeated 2 times. Asterisks indicate a statistically significant (p≤0.05) change compared to the control.
Figure 11.
Confocal images showing HCT-116 cells treated with conofolidine compared to untreated control and vincristine-treated cells. (a-d) Controls with medium only; (e-k) conofolidine 1×GI50-treated cells; (l, m) conofolidine 2×GI50-treated cells; (n-p) vincristine (10 ηM) treated cells. Conofolidine induced variable morphological phenotypes including multi-nucleation with chaotic multiplication (arrows 1-3), multipolar large cells (arrows 4,5), loss of polarity with asymmetric division (arrow 6), membrane blebbing and/or DNA-fragmentation (arrows 7-9) and multinucleated asymmetric cells with varying DNA content (arrow 10). Vincristine-treated HCT-116 cells showed reduced microtubules density, microtubules irregularity with multipolar spindle.
Figure 12.
(a) Representative histograms and dot-plots from independent trial showing HCT-116 cell cycle perturbation and γ-H2AX induction after 72 h, 2×GI50 conofolidine treatment. The majority of DSBs were seen in G1 phase of cell cycle compared to controls and etoposide (positive control)-treated cells. (b) Mean ± SD bars showing changes in percentage of HCT-116 cell cycle phases and increased DNA-DSBs following 72 h, 2×GI50 conofolidine exposure compared to untreated control. Asterisks indicate a statistically significant (p≤0.05) change compared to the control. No. trials ≥3; n=2 per independent experiment. At least 15000 events were obtained/sample. (c) Confocal images from one trial of HCT-116 treated with conofolidine showing γ-H2AX foci (green fluorescence) compared to control. Etoposide-treated cells also showed γ-H2AX foci formation. Arrows show examples of nuclei containing γ-H2AX foci saturation. Less DNA content was seen in each of conofolidine-treated cells compared to control. Assays were repeated 2 times and at least three images were obtained from each treatment.
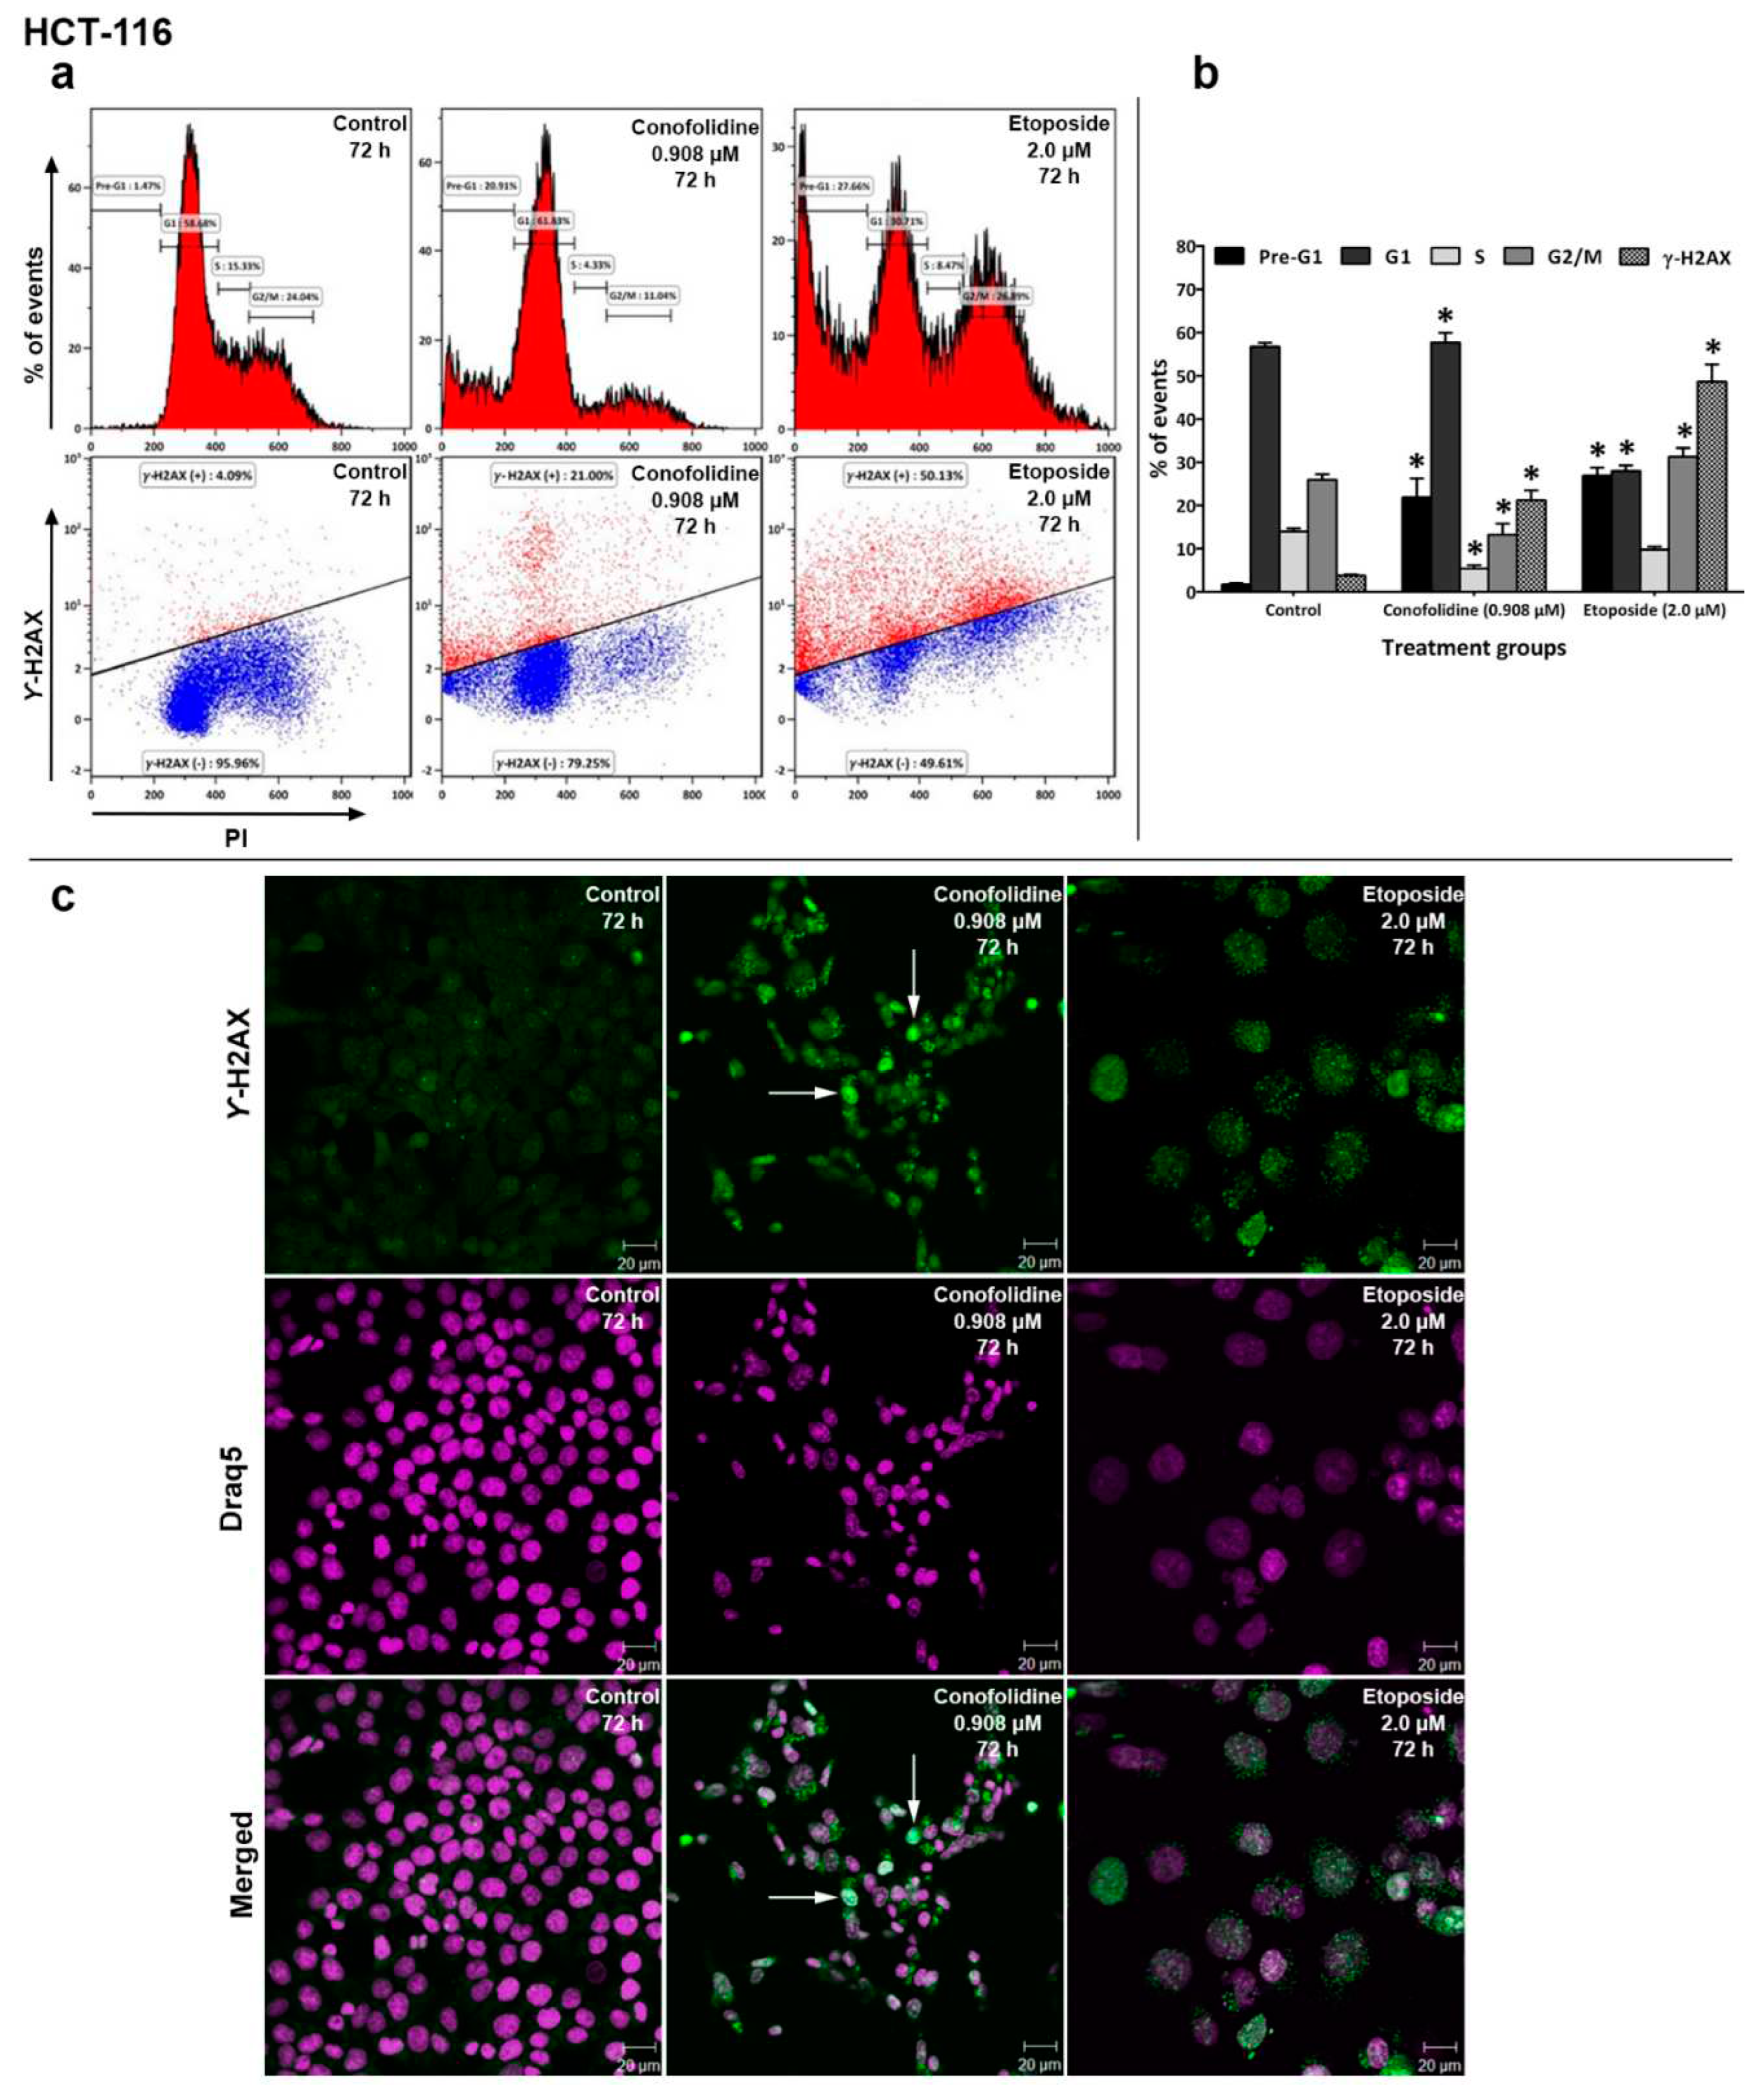
Figure 13.
(a) Mean ± SD error bars showing fold change relative to control of ROS level in carcinoma cells following conofolidine treatment (2×GI50, 24 h). Significantly increased ROS is seen in A549, HCT 116, HT-29, MIAPaCa-2; MCF-7 showed slight increment while no significant change is observed in MDA-MB-468. Assays were repeated 3 times (n=2). Asterisks indicate a statistically significant (p≤0.05) change compared to the control. (b) Representative western blot showing expression of NQO1 in protein lysates of A549, HCT 116, HT-29, MCF-7, MDA-MB-468 and MIAPaCa-2 cells treated with conofolidine (24 h and 72 h, 2×GI50). Western blotting was performed using antibodies against NQO1 and housekeeping gene β-Actin. All cell lines (except MDA-MB-468) showed increased NQO1 expression following conofolidine treatment. No changed β-Actin expression was seen. Assays were repeated 2 times.
Table 1.
Bisindoles` anti-proliferative effects on human carcinoma cell lines.
Table 1.
Bisindoles` anti-proliferative effects on human carcinoma cell lines.
| Human cell line |
|
72 h exposure MTT GI50 (µM) |
| Origin |
Designation |
Conofolidine |
Conophylline |
Leucophyllidine |
Bipleiophylline |
| Breast carcinoma |
MCF-7 |
0.054±0.08 |
0.066±0.03 |
2.79±0.98 |
3.49±0.47 |
| |
MDA-MB-468 |
0.292±0.03 |
0.557±0.08 |
1.99±0.03 |
5.81±1.11 |
| Colon carcinoma |
HCT-116 |
0.454±0.07 |
0.737±0.27 |
2.43±0.08 |
3.86±1.04 |
| HT-29 |
0.301±0.03 |
0.350±0.52 |
2.48±0.17 |
7.72±4.08 |
| Pancreatic carcinoma |
MIAPaCa-2 |
0.305±0.03 |
0.663±0.03 |
3.29±0.98 |
12.37±3.12 |
| Lung carcinoma |
A549 |
0.405±0.07 |
1.743±0.34 |
4.45±0.27 |
13.63±1.94 |
