Preprint
Article

Effects of Different Temperature and Density on Quality and Microbial Population of Alfalfa Silage

Altmetrics

Downloads

95

Views

41

Comments

0

Submitted:

08 January 2024

Posted:

09 January 2024

You are already at the latest version

Alerts
Abstract
In this study, alfalfa silage with different packing densities (500 kg/m3, 600 kg/m3 and 700 kg/m3) were set up under outdoor high temperature and indoor normal temperature. The chemical composition, fermentation quality and microbial community of alfalfa silage were analyzed. The results showed that DM and WAC content decreased with the increase of density. When the density is 600kg/m3, CP content reaches the maximum and ADF content is the lowest. Temperature has a certain effect on alfalfa silage. The content of Lactobacillus plantarum fermented at high temperature is lower than that fermented at normal temperature. At the same time, the content of Lactobacillus plantarum decreased with the increase of packing density. However, the content of Lactobacillus plantarum was the lowest when the packing density was 600 kg/m3 at high temperature. In summary, this study explained the effects of different temperature and density on alfalfa fermentation quality and microbial community, and clarified that the density should be reasonably controlled within 600 kg/m3 during alfalfa silage, providing theoretical support for production practice.
Keywords: 
Subject: Biology and Life Sciences  -   Agricultural Science and Agronomy

1. Introduction

Silage, a method used to preserve green forage crops in anaerobic conditionsp[1], offers several advantages, such as minimal nutrient loss and good palatability[2]. It is commonly employed to address feed shortages during the spring and winter seasons by extending the storage time of feed. However, silage fermentation is highly influenced by temperature[3], and different temperatures can lead to changes in microbial species and community dynamics during the fermentation process. Unfavorable factors, such as the growth and reproduction of detrimental bacteria, may occur under higher temperatures and humid conditions[4].The optimal temperature range for the dominant lactic acid bacteria involved in the silage fermentation process is generally considered to be between 20-30°C. Deviations from this range, whether higher or lower, can affect their growth and reproduction, subsequently influencing the fermentation quality of silage feed [5]. However, it is important to note that the optimal temperature for silage may vary depending on the type of material being used. For instance, Fuhou Li et al. found that the optimal temperature for silaging corn stover was 25°C[6], while S.C. Kim et al. suggested an optimal temperature range of 20-25°C for whole-plant corn silage[7].
Factors that contribute to silage deterioration include oxygen content (exposure time), microbial population composition, substrate type, and fermentation temperature [8]. During the large-scale harvesting of alfalfa in the summer, temperatures can surpass 30°C, posing challenges in maintaining precise temperature control during alfalfa silage production. Furthermore, the storage method employed, particularly the use of silos, has an impact on fermentation quality. A lower stacking density during the fermentation process can elevate the residual oxygen content in the feed, which hinders the complete anaerobic stage of early fermentation and facilitates the growth of harmful microorganisms [9]. Additionally, a reduced stacking density can lead to a decrease in the recovery rate of dry matter (DM) and nutrient loss [10].

2. Results and Discussion

2.1. Chemical and microbial composition of fresh alfalfa samples

Table 1 presents the chemical composition and microbial population of the alfalfa raw samples prior to ensiling. The DM content was determined to be 42.75%, while the WSC content was measured at 1.59%. Furthermore, the CP, NDF, and ADF contents were found to be 20.52%, 38.29%, and 31.30%, respectively. Regarding the microbial population, the counts of lactic acid bacteria, aerobic bacteria, coliform bacteria, yeast, and mold on the raw samples were recorded as 5.41, 6.33, 2.77, 5.96, and 3.16 log10 colony-forming units (cfu) per gram of fresh material (FM), respectively.

2.2. Chemical composition and fermentation quality analysis of alfalfa silage

The chemical characteristics of alfalfa silage feed, fermented at different temperatures and densities for 60 days, are summarized in Table 2. Temperature showed no significant impact on the DM content of the silage feed (p > 0.05). However, density exerted a substantial influence on DM content (p < 0.0001), resulting in a decline in DM content with increasing density. The interaction between temperature and density had no discernible effect on CP content (p > 0.05). Notably, CP content exhibited an initial rise followed by a decrease, reaching its zenith at a density of 600 kg/m3. Whether fermented at high or ambient temperatures, the a ADF content was minimal at a density of 600 kg/m3.The interaction between temperature and density had no significant impact on NDF content (p > 0.05). In the case of silage feed fermented at ambient temperature, NDF content rose with escalating density. post high-temperature fermentation, WSC content surpassed that of ambient temperature fermentation, and WAC content diminished with increasing density. The pH of silage feed fermented at high temperature was lower than that of ambient temperature (p < 0.0001), reaching its nadir at a density of 600 kg/m3. In high-temperature conditions, LA content decreased with density augmentation, whereas the inverse was observed during ambient temperature fermentation. AA content in silage feed fermented at high temperature exceeded that of ambient temperature (p > 0.05). Regardless of ambient or high temperature fermentation, the highest lactic acid bacteria content and the lowest aerobic bacteria content were noted at a density of 600 kg/m3.
The presence of lactic acid bacteria (LAB) on the raw material plays a crucial role in silage fermentation [11]. previous studies have indicated that the minimum LAB count on the raw material should exceed 5.0 log10cfu per gram of fresh matter . In this study, the LAB count on the alfalfa material was 5.41 log10cfu per gram FM, meeting this requirement. Soluble carbohydrates are important energy sources for plant development and metabolism [12]. As expected, the content of WSC decreased after ensiling, primarily due to the conversion of soluble carbohydrates into lactic acid by microorganisms as fermentation substrates under anaerobic conditions [13]. Under ambient temperature conditions, DM content has been found to be negatively correlated with density,which is consistent with the study by Ruppel et al. [14]. However, previous studies have shown that silage with higher density exhibited higher DM recovery rates compared to silage with lower density [15], which contradicts the findings of this study. The discrepancy may be attributed to differences in forage species, ensiling methods, and densities used in the respective studies. Temperature and density did not influence the Cp content in this study, which aligns with previous research [16]. This may be because Cp content is not directly affected by fermentation but instead increases linearly with the increase of gas and effluent losses during ensiling [17]. The NDF content was significantly higher in the high-density treatment group (700 kg/m3) compared to the low-density treatment groups (500 kg/m3 and 600 kg/m3), which is inconsistent with the findings of Sun et al. [18]. The variation in the raw material variety used could explain this discrepancy.
In practical silage production, fermentation temperature fluctuates daily, which affects the fermentation process. previous studies have found correlations between the daily fluctuation of fermentation temperature in silage experiments and external conditions [19]. Both temperature treatment groups in this study experienced fluctuating temperatures, which adversely affected silage fermentation quality. The experimental results confirmed this notion, as the acetic acid and butyric acid content were relatively higher in the treatment group fermented at high temperature. The pH value is a fundamental indicator for evaluating the fermentation quality of silage, and a sufficient number of lactic acid bacteria are required to lower the pH value and obtain high-quality silage [20]. previous studies have shown that higher packing density results in higher heat capacity and fermentation temperature, effectively reducing silage pH [21,22]. However, in this study, while the pH value decreased due to temperature, its relationship with density was not significant.

2.3. Analysis of microbial community diversity and population change in alfalfa silage

Table 3 illustrates the results of second-generation sequencing of the full-length 16S rRNA gene conducted on both the alfalfa fresh material and silage feed. The sequencing coverage for all samples exceeded 99%, indicating that the sequencing depth adequately captured the representation of the bacterial community, enabling effective analysis of bacterial community diversity. Comparing the results to the alfalfa raw samples, the ace, chao1, shannon, and sobs values of the feed after ensiling exhibited a decrease. Specifically, the ace values ranged between 102.24 and 184.05, the chao1 values ranged from 94.36 to 102.20, the shannon values ranged from 0.63 to 0.89, and the sobs values ranged from 64.00 to 103.00.
Microbial diversity analysis was performed using principal Coordinate Analysis (PCoA) to examine variations between individuals or populations. Each data point represents a sample, and points of the same color correspond to the same group. The proximity between two points indicates the similarity in their community composition. Figure 1A demonstrates that no significant separation was observed among the bacterial communities of the alfalfa raw samples. However, clear separation occurred after ensiling. In comparison to fermentation under normal temperature conditions, microbial community separation was less pronounced in the feed subjected to high-temperature fermentation. In Figure 1B, bacterial community separation was observed in all treatment groups after ensiling, except for treatment group C500. Notably, when the stacking density reached 600 kg/m3, a distinct separation was observed between bacterial communities under both high-temperature and normal temperature conditions.
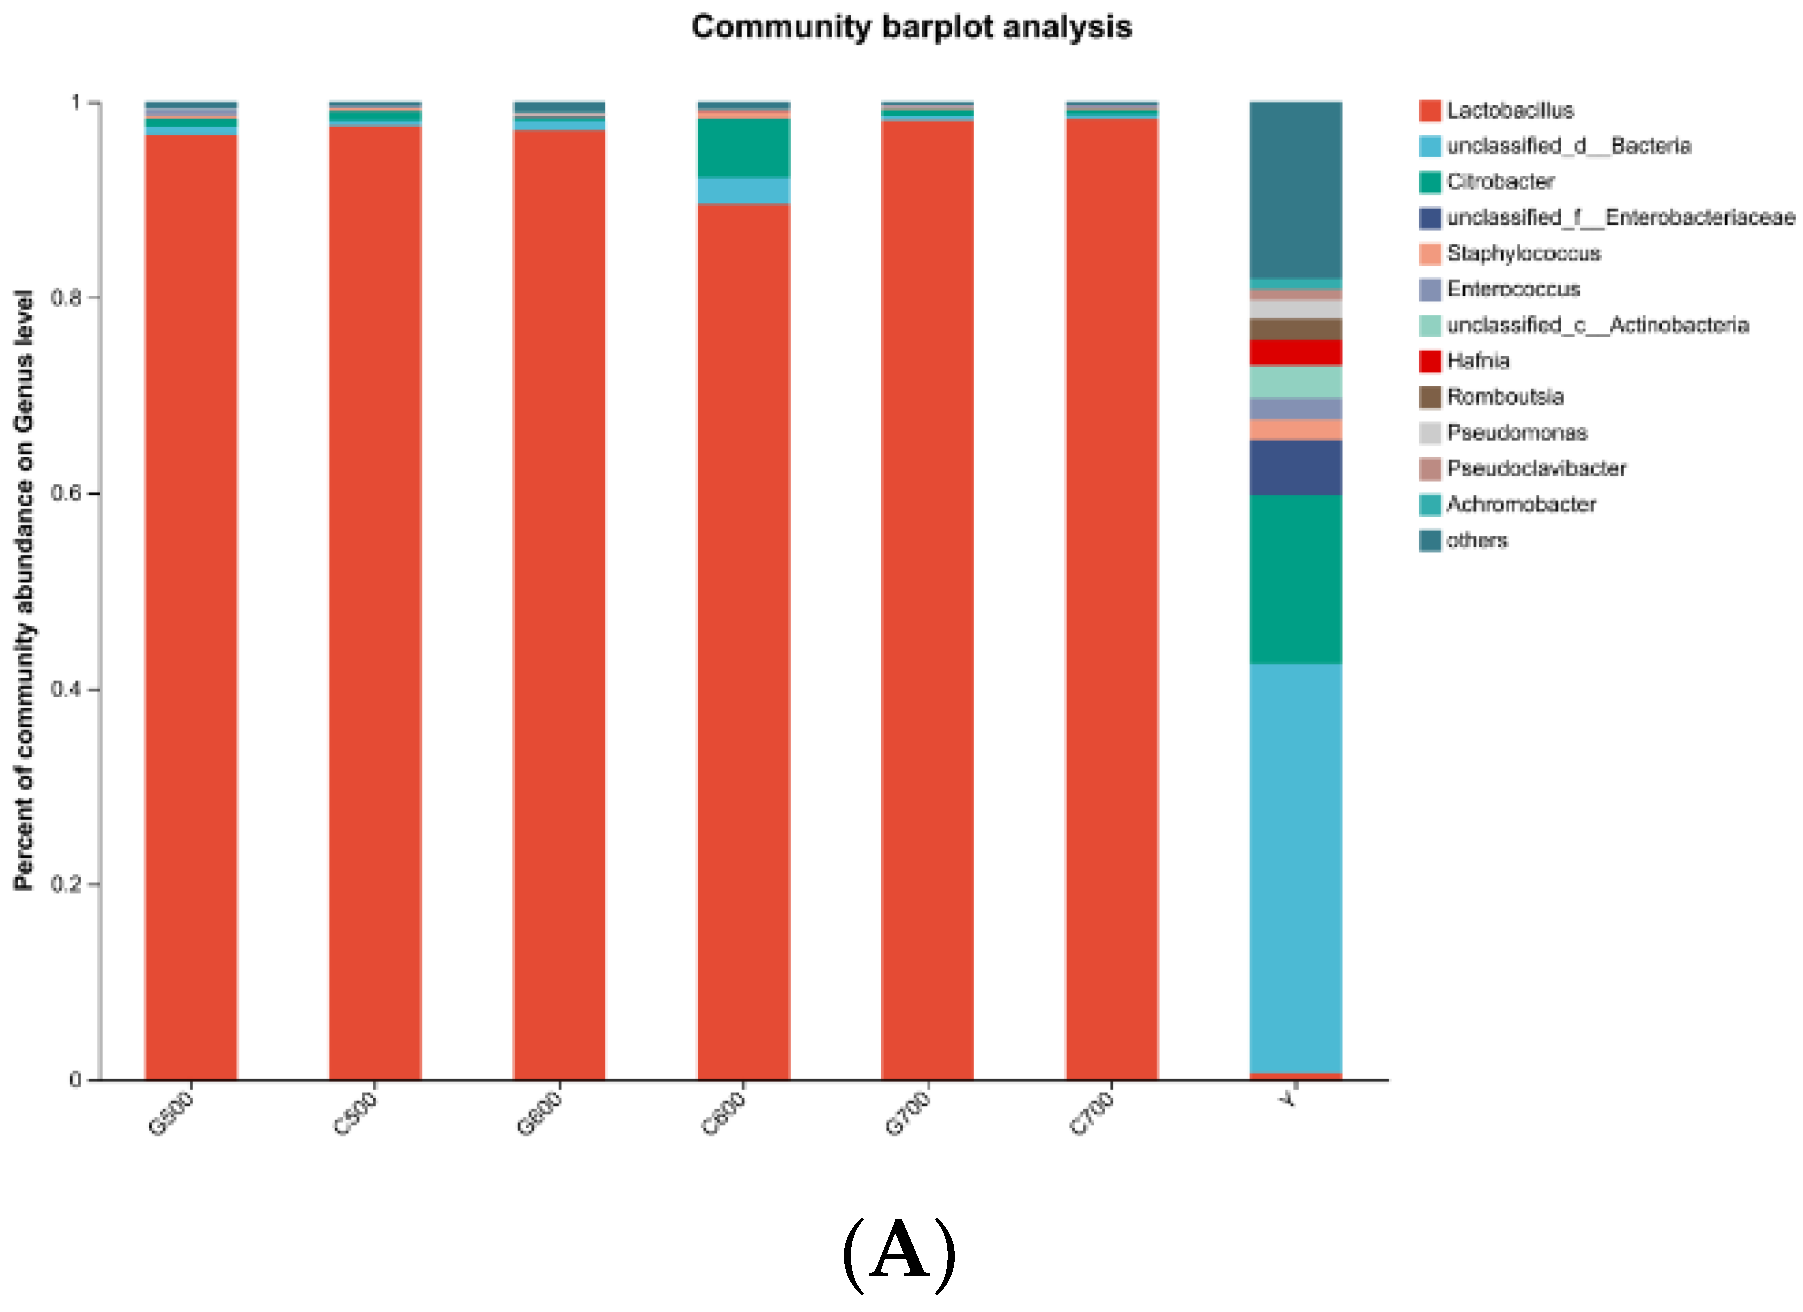
The dynamics of bacterial community composition at the genus level in alfalfa raw samples and silage feed, subjected to different temperature and additive treatments, as revealed by microbial second-generation sequencing, are depicted in Figure 2A.In the alfalfa raw samples, the major genera identified were unclassified_d_Bacteria (41.88%) and others (18.10%), with the predominant genus being Citrobacter (17.27%), accompanied by a small proportion of Lactobacillus (0.67%). Following ensiling, the dominant genus across all treatment groups was Lactobacillus (G500: 96.61%; C500: 97.52%; G600: 97.07%; C600: 89.56%; G700: 98.10%; C700: 98.27%). Figure 2B presents the dynamics of bacterial community composition at the species level between the alfalfa raw samples and silage feed(Figure 2B).
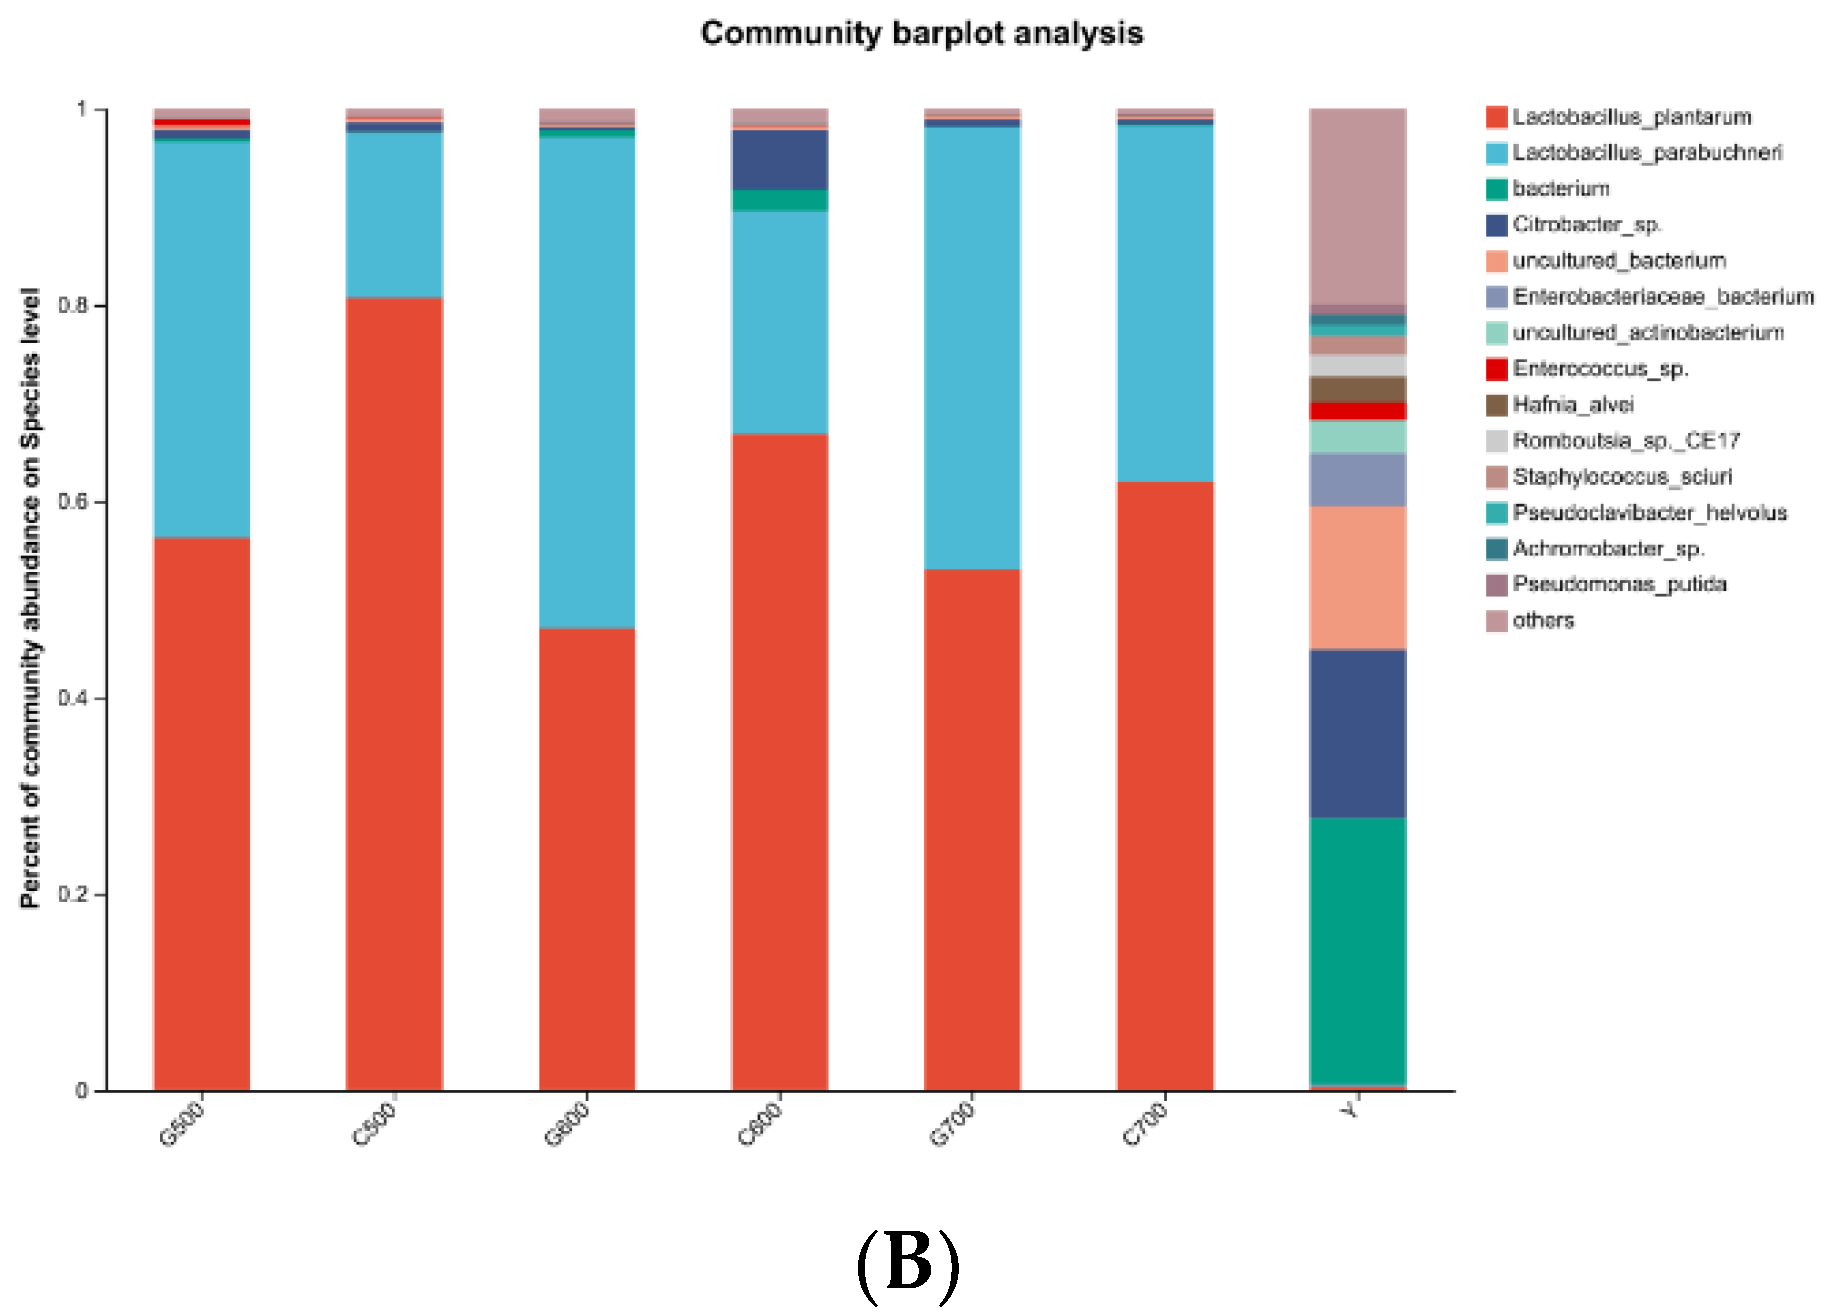
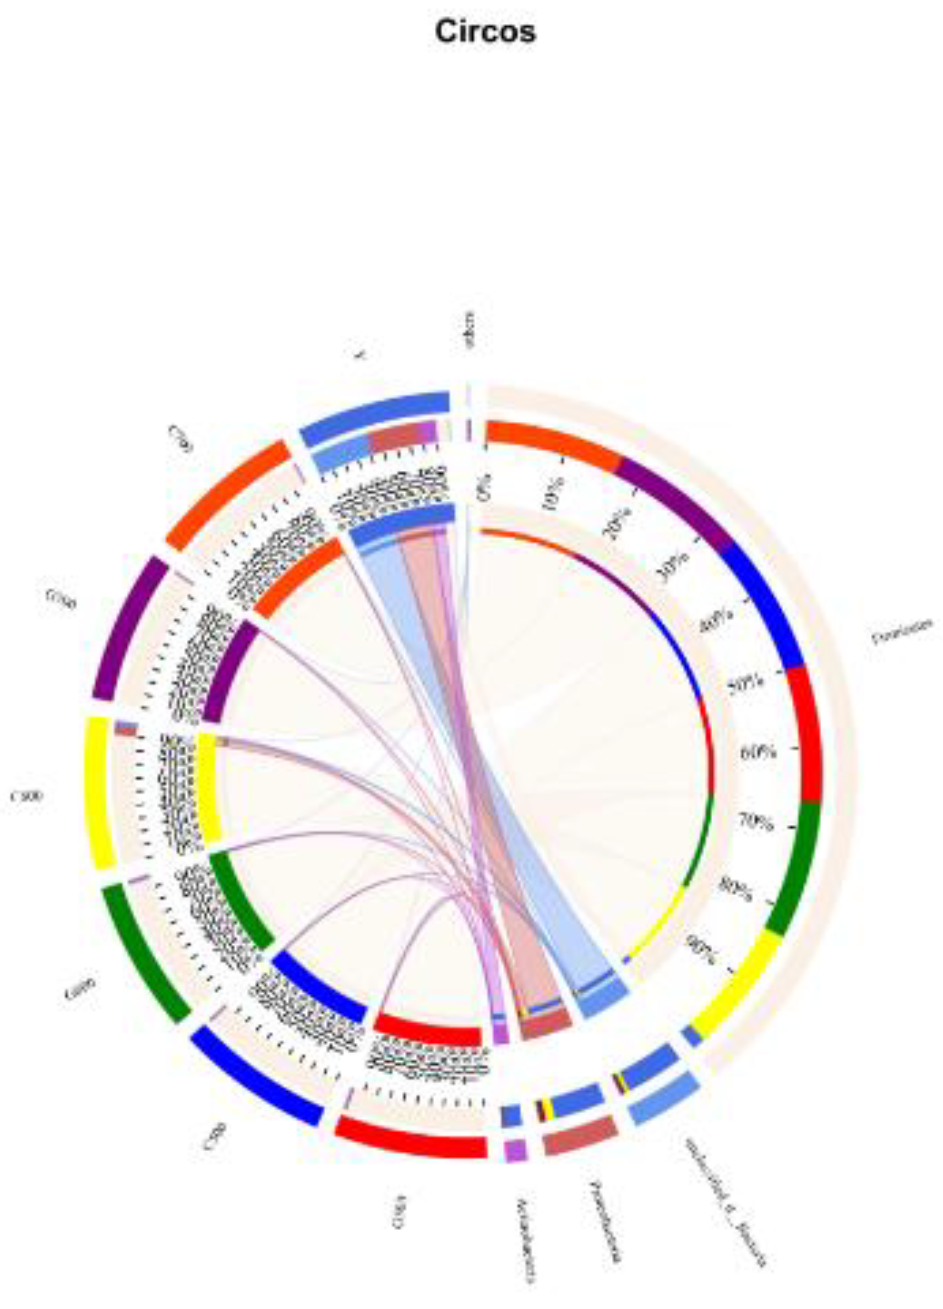
In the alfalfa raw samples, the main species identified were bacterium (27.02%) and others (19.98%). Additionally, Citrobacter_sp. accounted for 17.21%, while Lactobacillus_plantarum represented 0.40% of the species composition. After ensiling fermentation, the major species in all treatment groups were Lactobacillus_plantarum and Lactobacillus parabuchneri. Notably, in the silage feed fermented under high temperature conditions, the content of Lactobacillus_plantarum was lower compared to that fermented under normal temperature conditions. Moreover, an increasing stacking density demonstrated a decreasing trend in the content of Lactobacillus_plantarum. However, the lowest content of Lactobacillus_plantarum was observed when the stacking density reached 600 kg/m3 under high-temperature conditions. The dynamic bacterial community evolution in fresh alfalfa material and silage at the door level is shown in Figure 3. Among the original alfalfa, the dominant phylum unclassified_d_Bacteria (42%) and proteobacteria (37%) are the dominant obacteria. However, Firmicutes were predominant in all treatment groups after silage (G500,98%; C500,98%; G600,97%; C600,91%; G700, 99%; C700,99%).
In this investigation, the alpha-diversity of fresh alfalfa material was found to be significantly higher, signifying elevated bacterial richness and diversity compared to silage. This observation is attributed to the prevailing fermentation activity of lactic acid bacteria in acidic and anaerobic conditions. Concurrently, aerobic microorganisms associated with alfalfa struggled to thrive in anaerobic environments, resulting in a reduction in their abundance [23]. The predominant phyla identified in alfalfa fresh material were unclassified_d_Bacteria and proteobacteria, with proteobacteria emerging as the largest phylum among bacteria. However, post-fermentation, a noteworthy transition in the population structure of alfalfa occurred, shifting from the dominant phylum proteobacteria to Firmicutes. Research suggests that this transformation is linked to LAB fermentation, particularly the homofermentative type [24]. Homofermentative LAB are recognized as favorable during ensiling, producing two moles of lactic acid from each mole of fermented glucose, in contrast to heterofermentative LAB, which generate one mole of lactic acid, one mole of carbon dioxide, and one mole of ethanol or acetic acid [25]. Within the Firmicutes phylum, the most substantial increase was observed in the Lactobacillus genus. Despite lactic acid bacteria producing lactic acid under anaerobic conditions, they demonstrated the ability to convert lactic acid into acetic acid under aerobic conditions [26].
In the context of this study, when the stacking density reached 600 kg/m3, regardless of whether fermentation occurred at room temperature or high temperature, the lactic acid content was observed to be low, while the acetic acid content was high. Despite the decrease in lactic acid content, the generated acetic acid played a crucial role in lowering the pH in the fermentation environment, thereby inhibiting the proliferation of harmful microorganisms. Typically, ensiled forage treated with microbial inoculants exhibits higher abundance of lactic acid bacteria [27]. In this study, the lactic acid bacteria content in alfalfa fresh material was merely 0.4%, whereas the bacterial content of the Enterobacter genus was relatively high. Studies indicate that Enterobacter is a bacterium with higher content in non-inoculated microbial additive silage [28]. The primary bacteria identified in each treatment group were Lactobacillus plantarum and Lactobacillus parabuchneri, a consequence of the inclusion of lactic acid bacteria additives. However, the content of Lactobacillus plantarum in silage increased with stacking density, possibly due to increased pressure between alfalfa leaves and stems during stacking, leading to the leakage of damaged leaf sap and microbial loss from the raw material. Furthermore, when alfalfa underwent ensiling fermentation at different temperatures, the content of Lactobacillus plantarum in the high-temperature treatment group was lower than that in the room temperature treatment group.

2.4. Relationship between chemical composition, fermentation quality, and bacterial community

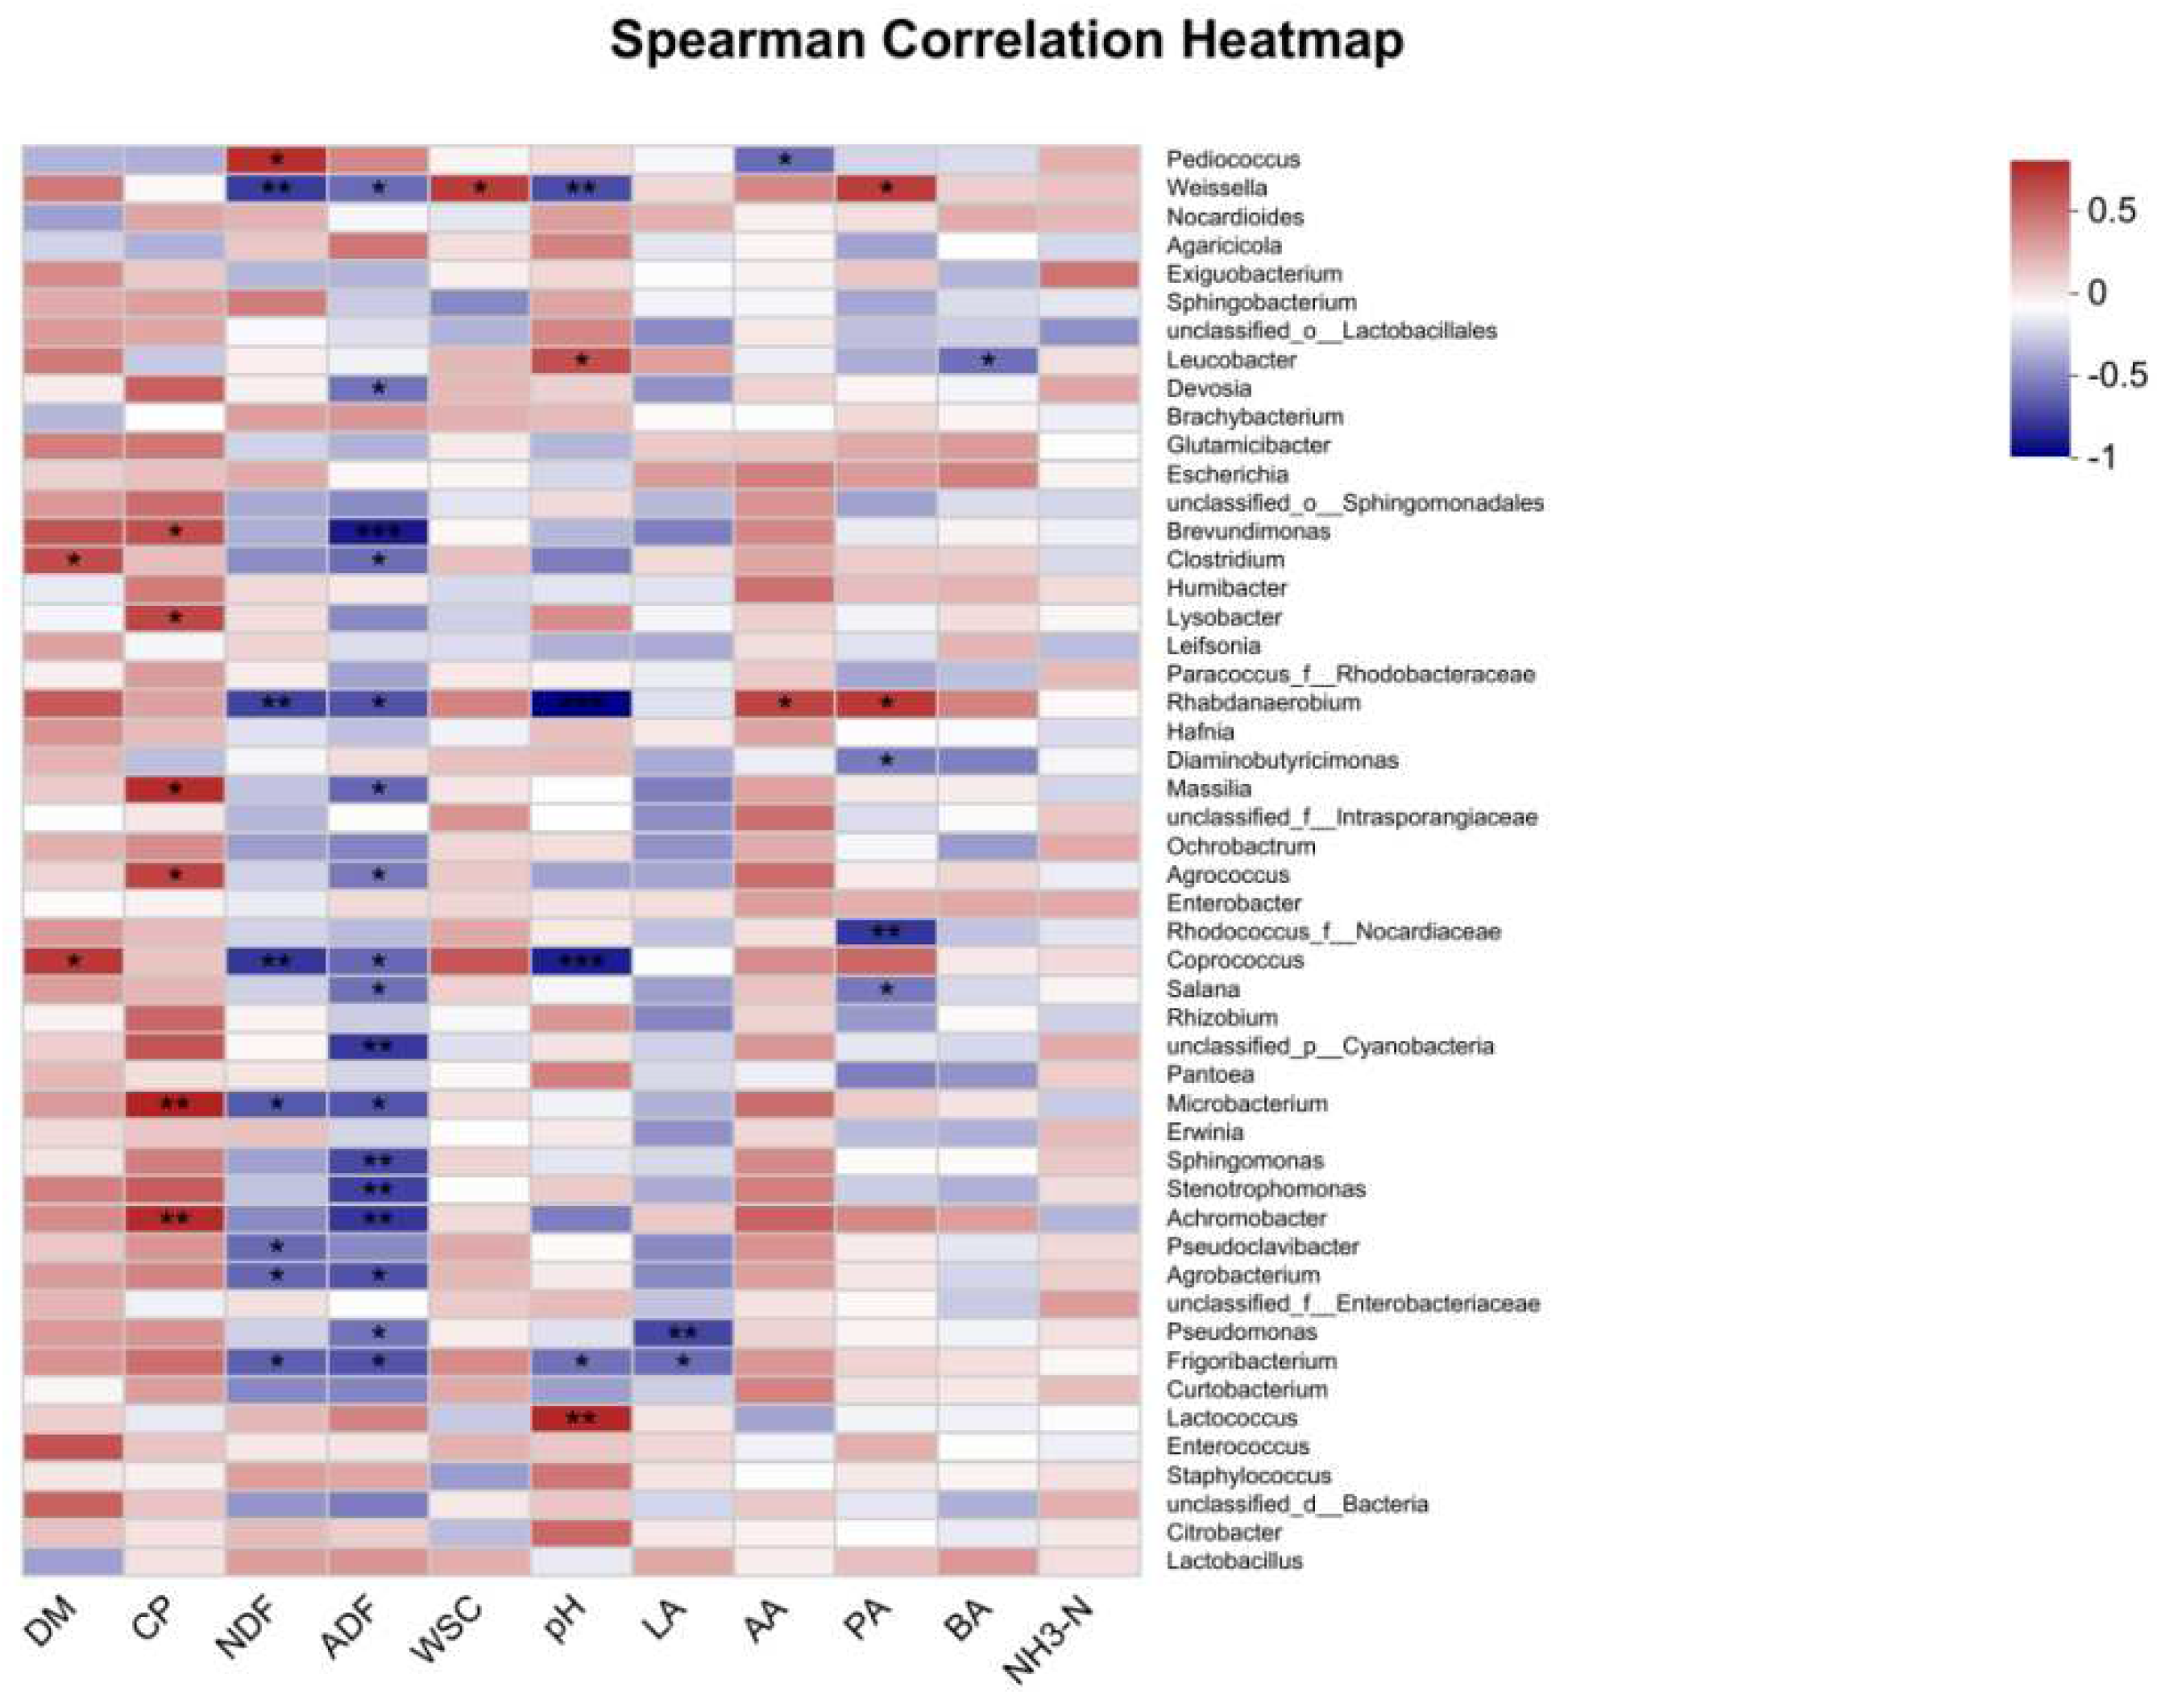
Correlation analysis was conducted to depict the relationship between the chemical composition, fermentation parameters, and major fermentation products at the genus level(Figure 4). The results are presented as follows:DM exhibited a positive correlation with Clostridium and Coprococcus. CP displayed positive correlations with pseudoclavibacter, Microbacterium, Agrococcus, Massilia, Lysobacter, and Brevundimonas. Similarly, NDF and ADF were found to have negative correlations with Frigoribacterium, Agrobacterium, Microbacterium, Coprococcus, and Weissella, while showing positive correlations with pediococcus. WSC demonstrated a positive correlation specifically with Weissella. pH values exhibited a positive correlation with Lactococcus and Leucobacter, while displaying negative correlations with Coprococcus, Rhabdanaerobium, Weissella, and Curtobacterium. LA showed negative correlations with pseudomonas and Frigoribacterium. AA displayed a positive correlation with Rhabdanaerobium, while having a negative correlation with pediococcus. PA demonstrated positive correlations with Rhabdanaerobium and Weissella, while exhibiting negative correlations with Rhodococcus_f_Nocardiaceae and Salana.
The factors influencing microbial communities in ensiled forage are diverse, encompassing moisture, WSC, and various chemical components. Microorganisms, generating a range of metabolic byproducts, profoundly impact the quality of ensiled forage. For instance, lactic acid bacteria assume a pivotal role in lactic acid generation, while Enterobacter can ferment lactic acid, yielding acetic acid [29]. Ensiling, a well-established fermentation process. Research findings underscore that the manipulation of bacterial communities in ensiled forage can effectively alter its nutritional, aromatic, and flavor-related chemical composition [30].
Moreover, the relative abundance of bacteria exhibits crucial correlations with the ultimate fermentation products. In this study, a correlation analysis based on post-ensiling fermentation product content and microbial population composition unveiled a positive correlation between pH and Lactococcus. This suggests that Lactococcus encounters challenges in flourishing in low-pH environments, with Lactococcus lactis displaying low acidity tolerance and restricted growth when the pH falls below 4.8[31]. Conversely, a negative correlation was discerned between pH and Weissella. As Weissella ferments glucose, producing acid, an elevation in Weissella abundance results in ample acid production, consequently inducing a pH decrease [11]. LA demonstrated a negative correlation with pseudomonas and Frigoribacterium, both categorized as aerobic microorganisms [32,33]. Residual oxygen in the fermentation environment hampers lactic acid production by lactic acid bacteria while fostering the growth of pseudomonas and Frigoribacterium.

3. Materials and Methods

3.1. Materials and chemicals

The experiment was conducted from June to August 2022 at a research base located in Hohhot, Inner Mongolia Autonomous Region. This region is situated within the Eurasian continent and is characterized by a temperate continental monsoon climate with precipitation ranging from 335.2 to 534.6mm. The experimental area covered 666m² of saline-alkali soil, and harvesting was carried out on June 28.
After the harvest, a portion of the fresh samples was placed in sterilized storage tubes and transported to a laboratory for storage at -80°C. The remaining grass samples were spread on clean plastic sheets and naturally dried to a moisture content of approximately 60%. The dried samples were then cut into 2-3 cm lengths using a shredder.
The processed alfalfa samples were divided into three equal portions and subjected to secondary fermentation by evenly spraying them with a composite inoculant containing Lactobacillus_plantarum and Lactobacillus brucei. The targeted bacterial population in the sprayed inoculant was set at 1×10⁶ cfu/g. The first part had a stacking density of 500 kg/m³ (500g of grass samples filled into a 1L polyethylene barrel), the second part had a stacking density of 600 kg/m³ (600g of grass samples filled into a 1L polyethylene barrel), and the third part had a stacking density of 700 kg/m³ (700g of grass samples filled into a 1L polyethylene barrel). Each density treatment group was further divided into two temperature gradients (3 density treatment groups * 2 temperatures * 3 replicates).
After filling, the top of each barrel was sealed with a sealing cover equipped with a sealing rubber and plunger ring, and the barrel opening was wrapped with plastic film to prevent the entry of oxygen. The ambient temperature treatment group was placed indoors for fermentation, while the high-temperature treatment group was exposed to outdoor fermentation. During the experiment, which took place in summer, the outdoor temperature could reach 35°C.
After 60 days of ensiling, the barrels were opened to evaluate the quality of alfalfa silage under high-temperature conditions with stacking densities of 500 kg/m³, 600 kg/m³, and 700 kg/m³ (referred to as G500, G600, and G700, respectively), as well as under ambient temperature conditions with stacking densities of 500 kg/m³, 600 kg/m³, and 700 kg/m³ (referred to as C500, C600, and C700, respectively). Additionally, 20g of each sample was placed in storage tubes and stored at -80°C. These samples were sent to Majorbio Bio-pharm Technology (Majorbio Bio-pharm Technology Co., Ltd., Shanghai, China) for sequencing analysis.

3.2. Sample collection and measurements

Each sample of fresh alfalfa and silage underwent three parallel determinations, which included analyses of chemical composition, fermentation characteristics, and microbial analysis. The dry matter (DM) content was determined by drying the samples in an oven at 65°C for 48 hours by Zhang,et al. [34]. After drying, the samples were pulverized, and the crude protein (CP) content was determined using a Kjeldahl nitrogen analyzer (Gerhart Vapodest 50 s, Germany) in accordance with the guidelines provided by the Association of Official Analytical Chemists (AOAC, 1990). The water-soluble carbohydrate (WSC) content was assessed using the anthrone colorimetric method as outlined by Thomas [35]. The neutral detergent fiber (NDF) and acid detergent fiber (ADF) contents were determined using an Ankom A2000i fiber analyzer (A2000i, Ankom Technology, Macedon, NY, United States).
To evaluate the fermentation characteristics of the silage, 10g of the sample was mixed with sterilized distilled water and incubated at 4°C after thorough shaking. The resulting solution was then filtered through four layers of cheesecloth. The pH value of the silage extract was measured using a calibrated glass electrode pH meter (STARTED 100/B, OHAUS, Shanghai, China).
The concentrations of lactic acid (LA), acetic acid (AA), propionic acid (PA), and butyric acid (BA) were quantitatively determined using liquid chromatography, following the method described by You, Du, Ge, Wan, and Jia [36].Additionally, the ammonia nitrogen (NH3-N) concentration was measured using the phenol-hypochlorite method as outlined by Broderick and Kang [37].For the analysis of microbial populations, 10g of the silage sample was thoroughly mixed with 90ml of sterilized distilled water, and the resulting mixture was then filtered. To perform microbial counting, a 10-fold serial dilution was carried out using 1ml of the solution.The counting of lactic acid bacteria (LAB) was conducted by placing the plates on De Man Rogosa Sharpe agar in an anaerobic chamber (C-31, Mitsubishi Gas Chemical Co., Tokyo, Japan) and incubating them at 37°C for 48 hours. Enumeration of coliform bacteria was achieved by incubating the plates (violet red bile agar) at 37°C for 48 hours. As for yeast and mold counting, the corresponding plates (potato dextrose agar) were placed in a regular incubator (Gp-01, Huangshi Hengfeng Medical Equipment Co., Ltd., Huangshi, China) under aerobic conditions and incubated at 30°C for 48 hours, following the method described by Fu et al.[38] .The colony-forming units (cfu) were expressed as the logarithm of the fresh material (FM).

3.3. Sequencing and analysis of microbial population

Commercial sample DNA extraction kits, E.Z.N.A. R (Omega Bio-tek, Norcross, GA, USA), were utilized for the extraction of total DNA from both the raw alfalfa samples and silage feed samples. Subsequently, the concentration and purity of the extracted DNA were assessed using a NanoDrop 2000 UV-Vis spectrophotometer (Thermo Fisher Scientific, Wilmington, United States).For PCR amplification, the V3-V4 region of the 16S rDNA was targeted, employing the followingprimers:338F: 5’-ACTCCTACGGGGGAGGCAGCAG-3’ and 806R: 5’-GGACTACHVGGGTWTCTAAT-3’. The PCR amplification process was carried out by Majorbio Bio-pharm Technology Co., Ltd. (Shanghai, China).To ensure data quality, the raw fastq files underwent quality filtering using Trimmomatic, followed by merging using FLASH. Operational taxonomic units (OTUs) were clustered using UpARSE, and chimeric sequences were identified and subsequently removed using UCHIME.Finally, the RDp classifier algorithm was employed to analyze the 16S rRNA gene sequences against the Silva (SSU123) 16S rRNA database, utilizing a confidence threshold of 70% for classifying each sequence.

3.4. Statistical analysis

The chemical composition, fermentation quality, and microbial characteristics of the silage feed were analyzed using the two-factor analysis program in SAS version 9.2. To determine significant differences, Duncan’s test was employed, with a significance level of p < 0.05. The reported data values represent the average values and standard errors of the means obtained from different treatments. For the analysis of microbial community data, the Majorbio I-Sanger Cloud platform, an online platform, was utilized.

4. Conclusion

In this investigation, the ensilage fermentation of alfalfa was scrutinized. When the stacking density surpassed 600 kg/m3, a decrease in the levels of DM and CP was noted, coupled with an elevation in ADF and NDF content. As the density increased, there was a discernible downward trend in the abundance of Lactobacillus plantarum. Concurrently, temperature exerted a notable impact on the ensiled alfalfa feed, resulting in a conspicuous reduction in the content of Lactobacillus plantarum during the fermentation process under high-temperature conditions. In conclusion, practical production considerations suggest maintaining the density of alfalfa ensilage below 600 kg/m3 for optimal results during ensiling.

Author Contributions

Conceptualization, J.L., and G.G; Methodology, J.L. and Z.W.; Experimentation, J.L., and J.H.; Analysis, X.Y., and M.Z..; Writing-original draft preparation, J.L.; Writing—review and editing, G.G.; Fund acquisition, G.G. All authors have read and agreed to the published version of the manuscript.

Funding

This work was financially supported by the Inner Mongolia Autonomous Region Science and Technology Plan (No. 2021GG0109).

Institutional Review Board Statement

Not applicable.

Informed Consent Statement

Not applicable.

Data Availability Statement

Data are available from the authors.

Conflicts of Interest

The authors declare no conflict of interest.

References

  1. Xu, D.; Ding, W.; Ke, W.; Li, F.; Zhang, P.; Guo, X. Modulation of Metabolome and Bacterial Community in Whole Crop Corn Silage by Inoculating Homofermentative Lactobacillus plantarum and Heterofermentative Lactobacillus buchneri. Front. Microbiol. 2019, 9, 3299. [Google Scholar] [CrossRef] [PubMed]
  2. Liu, M.; Wang, Y.; Wang, Z.; Bao, J.; Zhao, M.; Ge, G.; Jia, Y.; Du, S. Effects of Isolated LAB on Chemical Composition, Fermentation Quality and Bacterial Community of Stipa grandis Silage. Microorganisms 2022, 10, 2463. [Google Scholar] [CrossRef] [PubMed]
  3. Wang, S.; Dong, Z.; Li, J.; Chen, L.; Shao, T. Effects of storage temperature and combined microbial inoculants on fermentation end products and microbial populations of Italian ryegrass (Lolium multiflorumLam.) silage. J. Appl. Microbiol. 2018, 125, 1682–1691. [Google Scholar] [CrossRef] [PubMed]
  4. Adesogan, A. T. (2006). Factors affecting corn silage quality in hot and humid climates. Florida Ruminant Nutrition Symposium.
  5. Zhou, Y.; Drouin, P.; Lafrenière, C. Effect of temperature (5-25°C) on epiphytic lactic acid bacteria populations and fermentation of whole-plant corn silage. J. Appl. Microbiol. 2016, 121, 657–671. [Google Scholar] [CrossRef] [PubMed]
  6. Li, F.; Ding, Z.; Ke, W.; Xu, D.; Zhang, P.; Bai, J.; Mudassar, S.; Muhammad, I.; Guo, X. Ferulic acid esterase-producing lactic acid bacteria and cellulase pretreatments of corn stalk silage at two different temperatures: Ensiling characteristics, carbohydrates composition and enzymatic saccharification. Bioresour. Technol. 2019, 282, 211–221. [Google Scholar] [CrossRef] [PubMed]
  7. Kim, S.; Adesogan, A. Influence of Ensiling Temperature, Simulated Rainfall, and Delayed Sealing on Fermentation Characteristics and Aerobic Stability of Corn Silage. J. Dairy Sci. 2006, 89, 3122–3132. [Google Scholar] [CrossRef] [PubMed]
  8. Jonsson, A. (1989). Role of Yeasts and Clostridia in Silage Deterioration: Identification and Ecology.
  9. Driehuis, F.; Oude Elferink, S.J.W.H. The impact of the quality of silage on animal health and food safety: A review. Vet. Q. 2000, 22, 212–216. [Google Scholar] [CrossRef] [PubMed]
  10. Anésio, A.; Santos, M.; da Silva, L.; Silveira, R.; Braz, T.; Pereira, R. Effects of ensiling density on chemical and microbiological characteristics of sorghum silage. J. Anim. Feed. Sci. 2017, 26, 65–69. [Google Scholar] [CrossRef]
  11. Cai,Y.M.,Benno,Y.,Ogawa,M.,Ohmomo,S.,Kumal,S.,Nakase,T.(1998).Influence of Lactobacillus spp. from an Inoculant and of Weissella and Leuconostoc spp. from Forage Crops on Silage Fermentation.Applied and Environmental Microbiology.Aug. 1998, p. 2982–2987.
  12. Wang, S.; Dong, Z.; Li, J.; Chen, L.; Shao, T. Effects of storage temperature and combined microbial inoculants on fermentation end products and microbial populations of Italian ryegrass (Lolium multiflorumLam.) silage. J. Appl. Microbiol. 2018, 125, 1682–1691. [Google Scholar] [CrossRef] [PubMed]
  13. You, S.; Du, S.; Ge, G.; Wan, T.; Jia, Y. Selection of lactic acid bacteria from native grass silage and its effects as inoculant on silage fermentation. Agron. J. 2021, 113, 3169–3177. [Google Scholar] [CrossRef]
  14. Ruppel,R. A.,pitt,R.E.,Chase,L.E.,Galton,D.M. Bunker Silo Management and Its Relationship to Forage preservation on Dairy Farms. J Dairy Sci 1995, 78, 141–153. [Google Scholar] [CrossRef]
  15. Sucu, E.; Kalkan, H.; Canbolat, O.; Filya, I. Effects of ensiling density on nutritive value of maize and sorghum silages. Rev. Bras. de Zootec. 2016, 45, 596–603. [Google Scholar] [CrossRef]
  16. Han,K. J.,Collins,M.,Vanzant,E.S.,Dougherty,C.T. Bale Density and Moisture Effects on Alfalfa Round Bale Silage. CROp SCIENCE 2004, 44, 914–919.
  17. Li, P.; Gou, W.; Zhang, Y.; Yang, F.; You, M.; Bai, S.; Shen, Y. Fluctuant storage temperature increased the heterogeneous distributions of pH and fermentation products in large round bale silage. Grassl. Sci. 2019, 65, 155–161. [Google Scholar] [CrossRef]
  18. Sun, L.; Na, N.; Li, X.; Li, Z.; Wang, C.; Wu, X.; Xiao, Y.; Yin, G.; Liu, S.; Liu, Z.; et al. Impact of Packing Density on the Bacterial Community, Fermentation, and In Vitro Digestibility of Whole-Crop Barley Silage. Agriculture 2021, 11, 672. [Google Scholar] [CrossRef]
  19. Green, O.; Bartzanas, T.; Løkke, M.M.; Bochtis, D.D.; Sørensen, C.G.; Jørgensen, O.J.; Tortajada, V.G. Spatial and temporal variation of temperature and oxygen concentration inside silage stacks. Biosyst. Eng. 2012, 111, 155–165. [Google Scholar] [CrossRef]
  20. Ke-Li, L. , Ju-Lin, G., & Shu-Guo, L. U. (2004). Studies on Characteristics of Silage production of Different Types Maize. Journal of Maize Sciences.
  21. Williams,A. G.,Lowe,J.F.,Rees,D.V. The effect of oxygen concentration on changes in the microhial population, temperature and dry-matter content in grass silage. Grass Forage Sci. 1994, 49, 183–191. [Google Scholar] [CrossRef]
  22. Muller,C. E. Fermentation patterns of small-bale silage and haylage produced as a feed for horses. Grass Forage Sci. 2005, 60, 109–118. [Google Scholar] [CrossRef]
  23. Yuan, X.; Dong, Z.; Li, J.; Shao, T. Microbial community dynamics and their contributions to organic acid production during the early stage of the ensiling of Napier grass (Pennisetum purpureum). Grass Forage Sci. 2019, 75, 37–44. [Google Scholar] [CrossRef]
  24. McGarvey, J.; Franco, R.; Palumbo, J.; Hnasko, R.; Stanker, L.; Mitloehner, F. Bacterial population dynamics during the ensiling of Medicago sativa (alfalfa) and subsequent exposure to air. J. Appl. Microbiol. 2013, 114, 1661–1670. [Google Scholar] [CrossRef]
  25. Muck,R.E.(2010).Silage microbiology and its control through additives.Revista Brasileira de Zootecnia.p.183-191, 2010 (supl. especial).
  26. Elferink, S.J.W.H.O.; Krooneman, J.; Gottschal, J.C.; Spoelstra, S.F.; Faber, F.; Driehuis, F. Anaerobic Conversion of Lactic Acid to Acetic Acid and 1,2-Propanediol by Lactobacillus buchneri. Appl. Environ. Microbiol. 2001, 67, 125–132. [Google Scholar] [CrossRef] [PubMed]
  27. Pang, H.; Qin, G.; Tan, Z.; Li, Z.; Wang, Y.; Cai, Y. Natural populations of lactic acid bacteria associated with silage fermentation as determined by phenotype, 16S ribosomal RNA and recA gene analysis. Syst. Appl. Microbiol. 2011, 34, 235–241. [Google Scholar] [CrossRef] [PubMed]
  28. Du, Z.; Sun, L.; Chen, C.; Lin, J.; Yang, F.; Cai, Y. Exploring microbial community structure and metabolic gene clusters during silage fermentation of paper mulberry, a high-protein woody plant. Anim. Feed. Sci. Technol. 2021, 275, 114766. [Google Scholar] [CrossRef]
  29. Guan, H.; Yan, Y.; Li, X.; Li, X.; Shuai, Y.; Feng, G.; Ran, Q.; Cai, Y.; Li, Y.; Zhang, X. Microbial communities and natural fermentation of corn silages prepared with farm bunker-silo in Southwest China. Bioresour. Technol. 2018, 265, 282–290. [Google Scholar] [CrossRef] [PubMed]
  30. He, Q.; Zhou, W.; Chen, X.; Zhang, Q. Chemical and bacterial composition of Broussonetia papyrifera leaves ensiled at two ensiling densities with or without Lactobacillus plantarum. J. Clean. Prod. 2021, 329, 129792. [Google Scholar] [CrossRef]
  31. Ávila, C.; Carvalho, B. Silage fermentation—updates focusing on the performance of micro-organisms. J. Appl. Microbiol. 2019, 128, 966–984. [Google Scholar] [CrossRef]
  32. Kampfer,K. ,Rainey,F.A.,Andersson,M.A.,Lassila,E.L.N.,Ulrych,U.,Busse,H.J.,Weiss,N.,Mikkola,R. Frigoribacterium faeni gen. nov., sp. nov., a novel psychrophilic genus of the family Microbacteriaceae. Int. J. Syst. Evol. Microbiol. 2000, 50, 355–363. [Google Scholar] [CrossRef]
  33. Ogunade, I.M.; Jiang, Y.; Cervantes, A.A.P.; Kim, D.H.; de Oliveira, A.S.; Vyas, D.; Weinberg, Z.G.; Jeong, K.C.; Adesogan, A.T. Bacterial Diversity and Composition of Alfalfa Silage as Analyzed by Illumina MiSeq Sequencing: Effects of Escherichia Coli O157:H7 and Silage Additives. J. Dairy Sci. 2018, 101, 2048–2059. [Google Scholar] [CrossRef] [PubMed]
  34. Zhang, Q.; Wu, B.; Nishino, N.; Wang, X.; Yu, Z. Fermentation and microbial population dynamics during the ensiling of native grass and subsequent exposure to air. Anim. Sci. J. 2016, 87, 389–397. [Google Scholar] [CrossRef]
  35. Thomas, T.A. An automated procedure for the determination of soluble carbohydrates in herbage. J. Sci. Food Agric. 1977, 28, 639–642. [Google Scholar] [CrossRef]
  36. You, S.; Du, S.; Ge, G.; Wan, T.; Jia, Y. Selection of lactic acid bacteria from native grass silage and its effects as inoculant on silage fermentation. Agron. J. 2021, 113, 3169–3177. [Google Scholar] [CrossRef]
  37. Broderick, G.A.; Kang, J.H. Automated Simultaneous Determination of Ammonia and Total Amino Acids in Ruminal Fluid and In Vitro Media. J. Dairy Sci. 1980, 63, 64–75. [Google Scholar] [CrossRef] [PubMed]
  38. Fu, Z.; Sun, L.; Hou, M.; Hao, J.; Lu, Q.; Liu, T.; Ren, X.; Jia, Y.; Wang, Z.; Ge, G. Effects of different harvest frequencies on microbial community and metabolomic properties of annual ryegrass silage. Front. Microbiol. 2022, 13, 971449. [Google Scholar] [CrossRef] [PubMed]
Figure 1. principal Coordinate Analysis (PCoA) plot illustrating the variations in bacterial community structure among different temperature and density treatments. Y: fresh material; C500:room temperature treatment group with a density of 500 kg/m3; C600: room temperature treatment group with a density of 600 kg/m3; C700: room temperature treatment group with a density of 700 kg/m3; G500: high temperature treatment group with a density of 500 kg/m3; G600:high temperature treatment group with a density of 600 kg/m3; G700: high temperature treatment group with a density of 700 kg/m3.
Preprints 95782 g001
Figure 2. The bacterial community composition at the genus (A) and species (B) levels in fresh alfalfa samples and alfalfa silage feed was determined using microbial amplicon sequencing. Y: fresh material; C500: room temperature treatment group with a density of 500 kg/m3; C600: room temperature treatment group with a density of 600 kg/ m3; C700: room temperature treatment group with a density of 700 kg/m3; G500: high temperature treatment group with a density of 500 kg/m3; G600:high temperature treatment group with a density of 600 kg/m3; G700: high temperature treatment group with a density of 700 kg/m3. (A–B).
Preprints 95782 g002aPreprints 95782 g002b
Figure 3. The Circos plot displayed the variations in relative abundance of microbial communities at the phylum level, where the size of each bar represented the relative abundance of that phylum in the samples.
Preprints 95782 g003
Figure 4. It showcases a correlation heatmap that effectively illustrates the intricate relationships among chemical components, fermentation quality, and bacterial communities. The heatmap adopts a color scheme in which red signifies positive correlations, while blue represents negative correlations. The significance levels are denoted as follows: *p ≤ 0.05; **p ≤ 0.01; ***p ≤ 0.001.
Preprints 95782 g004
Table 1. Nutrient content and microbial population of alfalfa fresh materials.
Items Stipa grandis
Dry matter (g/kg FW) 42.57±0.98
Crude protein (g/kg DM) 20.52±1.23
Neutral detergent fiber (g/kg DM) 38.29±1.54
Acid detergent fiber (g/kg DM) 31.30±0.71
Water-soluble carbohydrates (g/kg DM) 1.59±0.05
LAB (log10 cfu/g FM) 5.41±1.87
Aerobic bacteria (log10 cfu/g FM) 6.33±0.43
Coliform bacteria (log10 cfu/g FM) 2.77±2.66
Yeasts (log10 cfu/g FM) 5.96±0.19
Mold (log10 cfu/g FM) 3.16±0.28
Table 2. Effects of different temperatures and density on the chemical composition, fermentation quality, and microbial composition of alfalfa silage after a 60-day period.
Temperature 500 600 700 SEM Temperature Density The interaction effect of temperature and density
DM (%) G 39.33±0.73Aa 40.00±1.2Aa 35.09±1.46Ba 0.500 p=0.9083 s<0.0001 p*S=0.4116
C 39.28±0.40Aa 39.16±0.93Aa 35.82±0.48Ba p<0.0001
Cp (% DM) G 19.4±4.68Aa 21.75±1.42Aa 20.56±1.65Aa 0.473 p=0.6597 s=0.4891 p*S=0.8245
C 20.86±0.69Aa 21.73±0.22Aa 20.6±1.13Aa p=0.4891
ADF (% DM) G 32.87±2.68Ba 31.82±0.86Bb 38.39±0.91Aa 0.611 p=0.0217 s=0.0217 p*s=0.0073
C 36.88±0.80Aa 35.26±0.83Ba 36.36±0.56ABb p=0.0027
NDF (% DM) G 37.29±1.79Ba 36.75±0.61Ba 40.04±0.20Ab 0.45 p=0.0211 s=0.0484 p*s=0.4067
C 39.15±0.41Aa 39.87±2.79Aa 40.76±0.29Aa p=0.0484
EE(% DM) G 1.27±0.27Ab 1.53±0.29Aa 1.72±0.04Ab 0.079 p=0.0183 s=0.2025 p*s=0.2331
C 1.92±0.25Aa 1.67±0.48Aa 1.97±0.02Aa p=0.2025
WSC (% DM) G 1.37±0.03Aa 1.21±0.20Aa 1.14±0.22Aa 0.035 p=0.1825 S=0.0065 p*s=0.8064
C 1.29±0.07Aa 1.19±0.09Aa 1.05±0.04Ba p=0.0065
pH G 4.59±0.02Ab 4.56±0.04Ab 4.69±0.07Aa 0.036 p<0.0001 s=0.1924 p*s=0.4116
C 4.87±0.01Aa 4.84±0.06Aa 4.89±0.05Aa
Lactic acid (g/kg) G 0.27±0.07Aa 0.00±0.00Ba 0.07±0.07Ba 0.032 p=0.2413 s=0.1569 p*s=0.0656
C 0.13±0.03Aa 0.13±0.09Aa 0.27±0.07Aa
Acetic acid (g/kg) G 0.60±0.31Aa 0.33±0.03Aa 0.37±0.13Aa 0.061 p=0.0758 s=0.7140 p*s=0.5474
C 0.17±0.09Aa 0.23±0.03Aa 0.17±0.03Aa
propionic acid (g/kg) G 0.40±0.06Aa 0.40±0.23Aa 0.43±0.15Aa 0.05 p=0.0837 S=0.9857 p*S=0.9050
C 0.27±0.12Aa 0.23±0.03Aa 0.20±0.10Aa
Butyric acid (g/kg) G 0.00±0.00Aa 0.10±0.10Aa 0.20±0.12Aa 0.028 p=0.0563 s=0.2589 p*s=0.2589
C 0.00±0.00Aa 0.00±0.00Aa 0.00±0.00Aa
NH3-N G 4.40±0.15Aa 4.73±0.94Aa 4.07±0.18Aa 0.148 p=0.7395 s=0.9713 p*s=0.3757
C 4.23±0.07Ba 4.07±0.03Ca 4.57±0.03Aa
LAB (log10 cfu/g FM) G 4.37±2.19Aa 4.89±0.04Ab 4.68±1.03Aa 0.422 p=0.0938 s=0.8155 p*s=0.9201
C 6.22±0.61Aa 6.92±0.37Aa 5.85±0.46Aa
Aerobic bacteria (log10 cfu/g FM) G 5.28±1.21Aa 3.80±0.63Aa 4.35±0.73Aa 0.309 p=0.0527 s=0.3687 p*s=0.4100
C 5.46±0.31Aa 5.21±0.55Aa 6.37±0.23Aa
Yeasts (log10 cfu/g FM) G 4.34±0.03Ab 4.81±0.15Ab 5.20±0.67Aa 0.238 p<0.0001 s=0.3266 p*s=0.5158
C 6.38±0.08Aa 6.55±0.25Aa 6.49±0.08Aa
Coliform bacteria (log10 cfu/g FM) G ND ND ND
C ND ND ND
Mold (log10 cfu/g FM) G ND ND ND
C ND ND ND
Table 3. Alpha-diversity of bacterial communities in alfalfa fresh materials and silage.
Sample\Estimators ace chao1 shannon sobs coverage
Y 800.55 764.76 3.39 728.67 0.998
C500 125.13 103.65 0.63 64.00 0.999
C600 108.39 106.94 0.89 85.67 0.999
C700 102.24 94.36 0.76 69.00 0.999
G500 184.05 147.27 0.88 99.33 0.999
G600 148.02 136.74 0.82 103.00 0.999
G700 110.37 102.20 0.81 74.00 0.999
Disclaimer/Publisher’s Note: The statements, opinions and data contained in all publications are solely those of the individual author(s) and contributor(s) and not of MDPI and/or the editor(s). MDPI and/or the editor(s) disclaim responsibility for any injury to people or property resulting from any ideas, methods, instructions or products referred to in the content.
Copyright: This open access article is published under a Creative Commons CC BY 4.0 license, which permit the free download, distribution, and reuse, provided that the author and preprint are cited in any reuse.
Prerpints.org logo

Preprints.org is a free preprint server supported by MDPI in Basel, Switzerland.

Subscribe

© 2024 MDPI (Basel, Switzerland) unless otherwise stated