Submitted:
05 January 2024
Posted:
08 January 2024
You are already at the latest version
Abstract
Keywords:
1. Introduction
2. Materials and Methods
2.1. Study Area and Crop Management
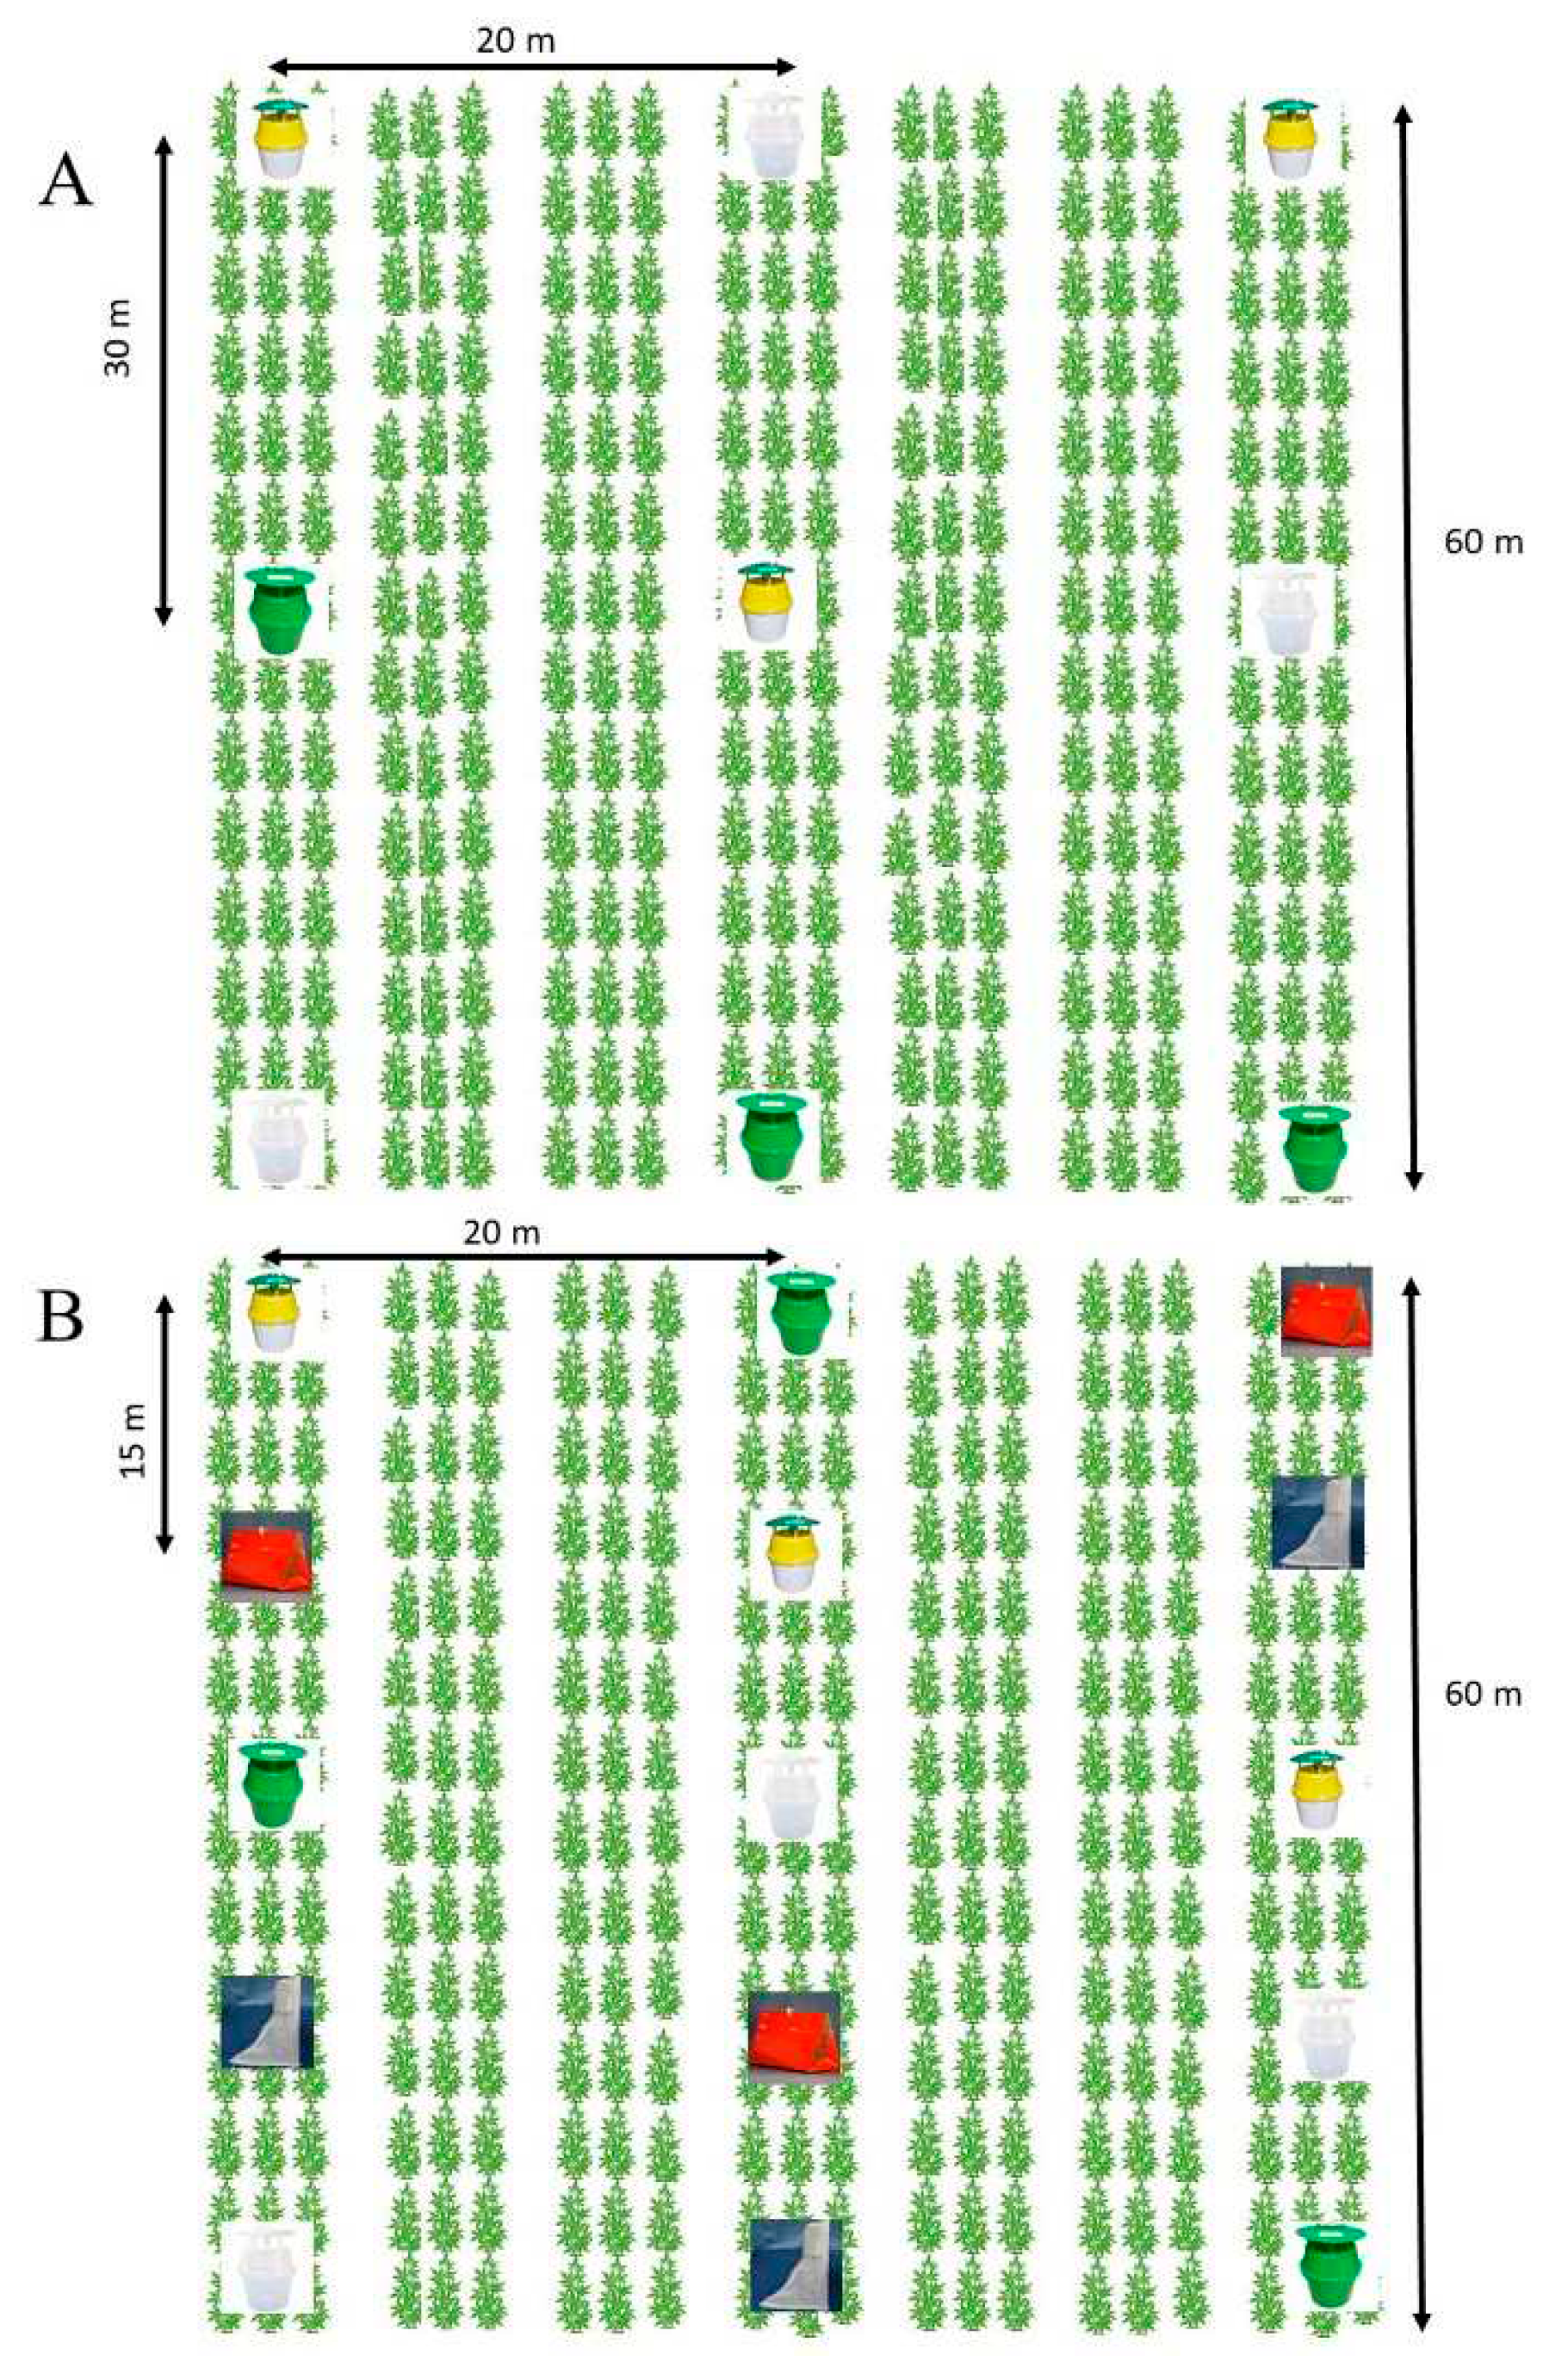
2.2. Description of experimental plots

2.2. Sampling of Moths Using Pheromone-baited Trap
2.3. Statistical Analysis
3. Results
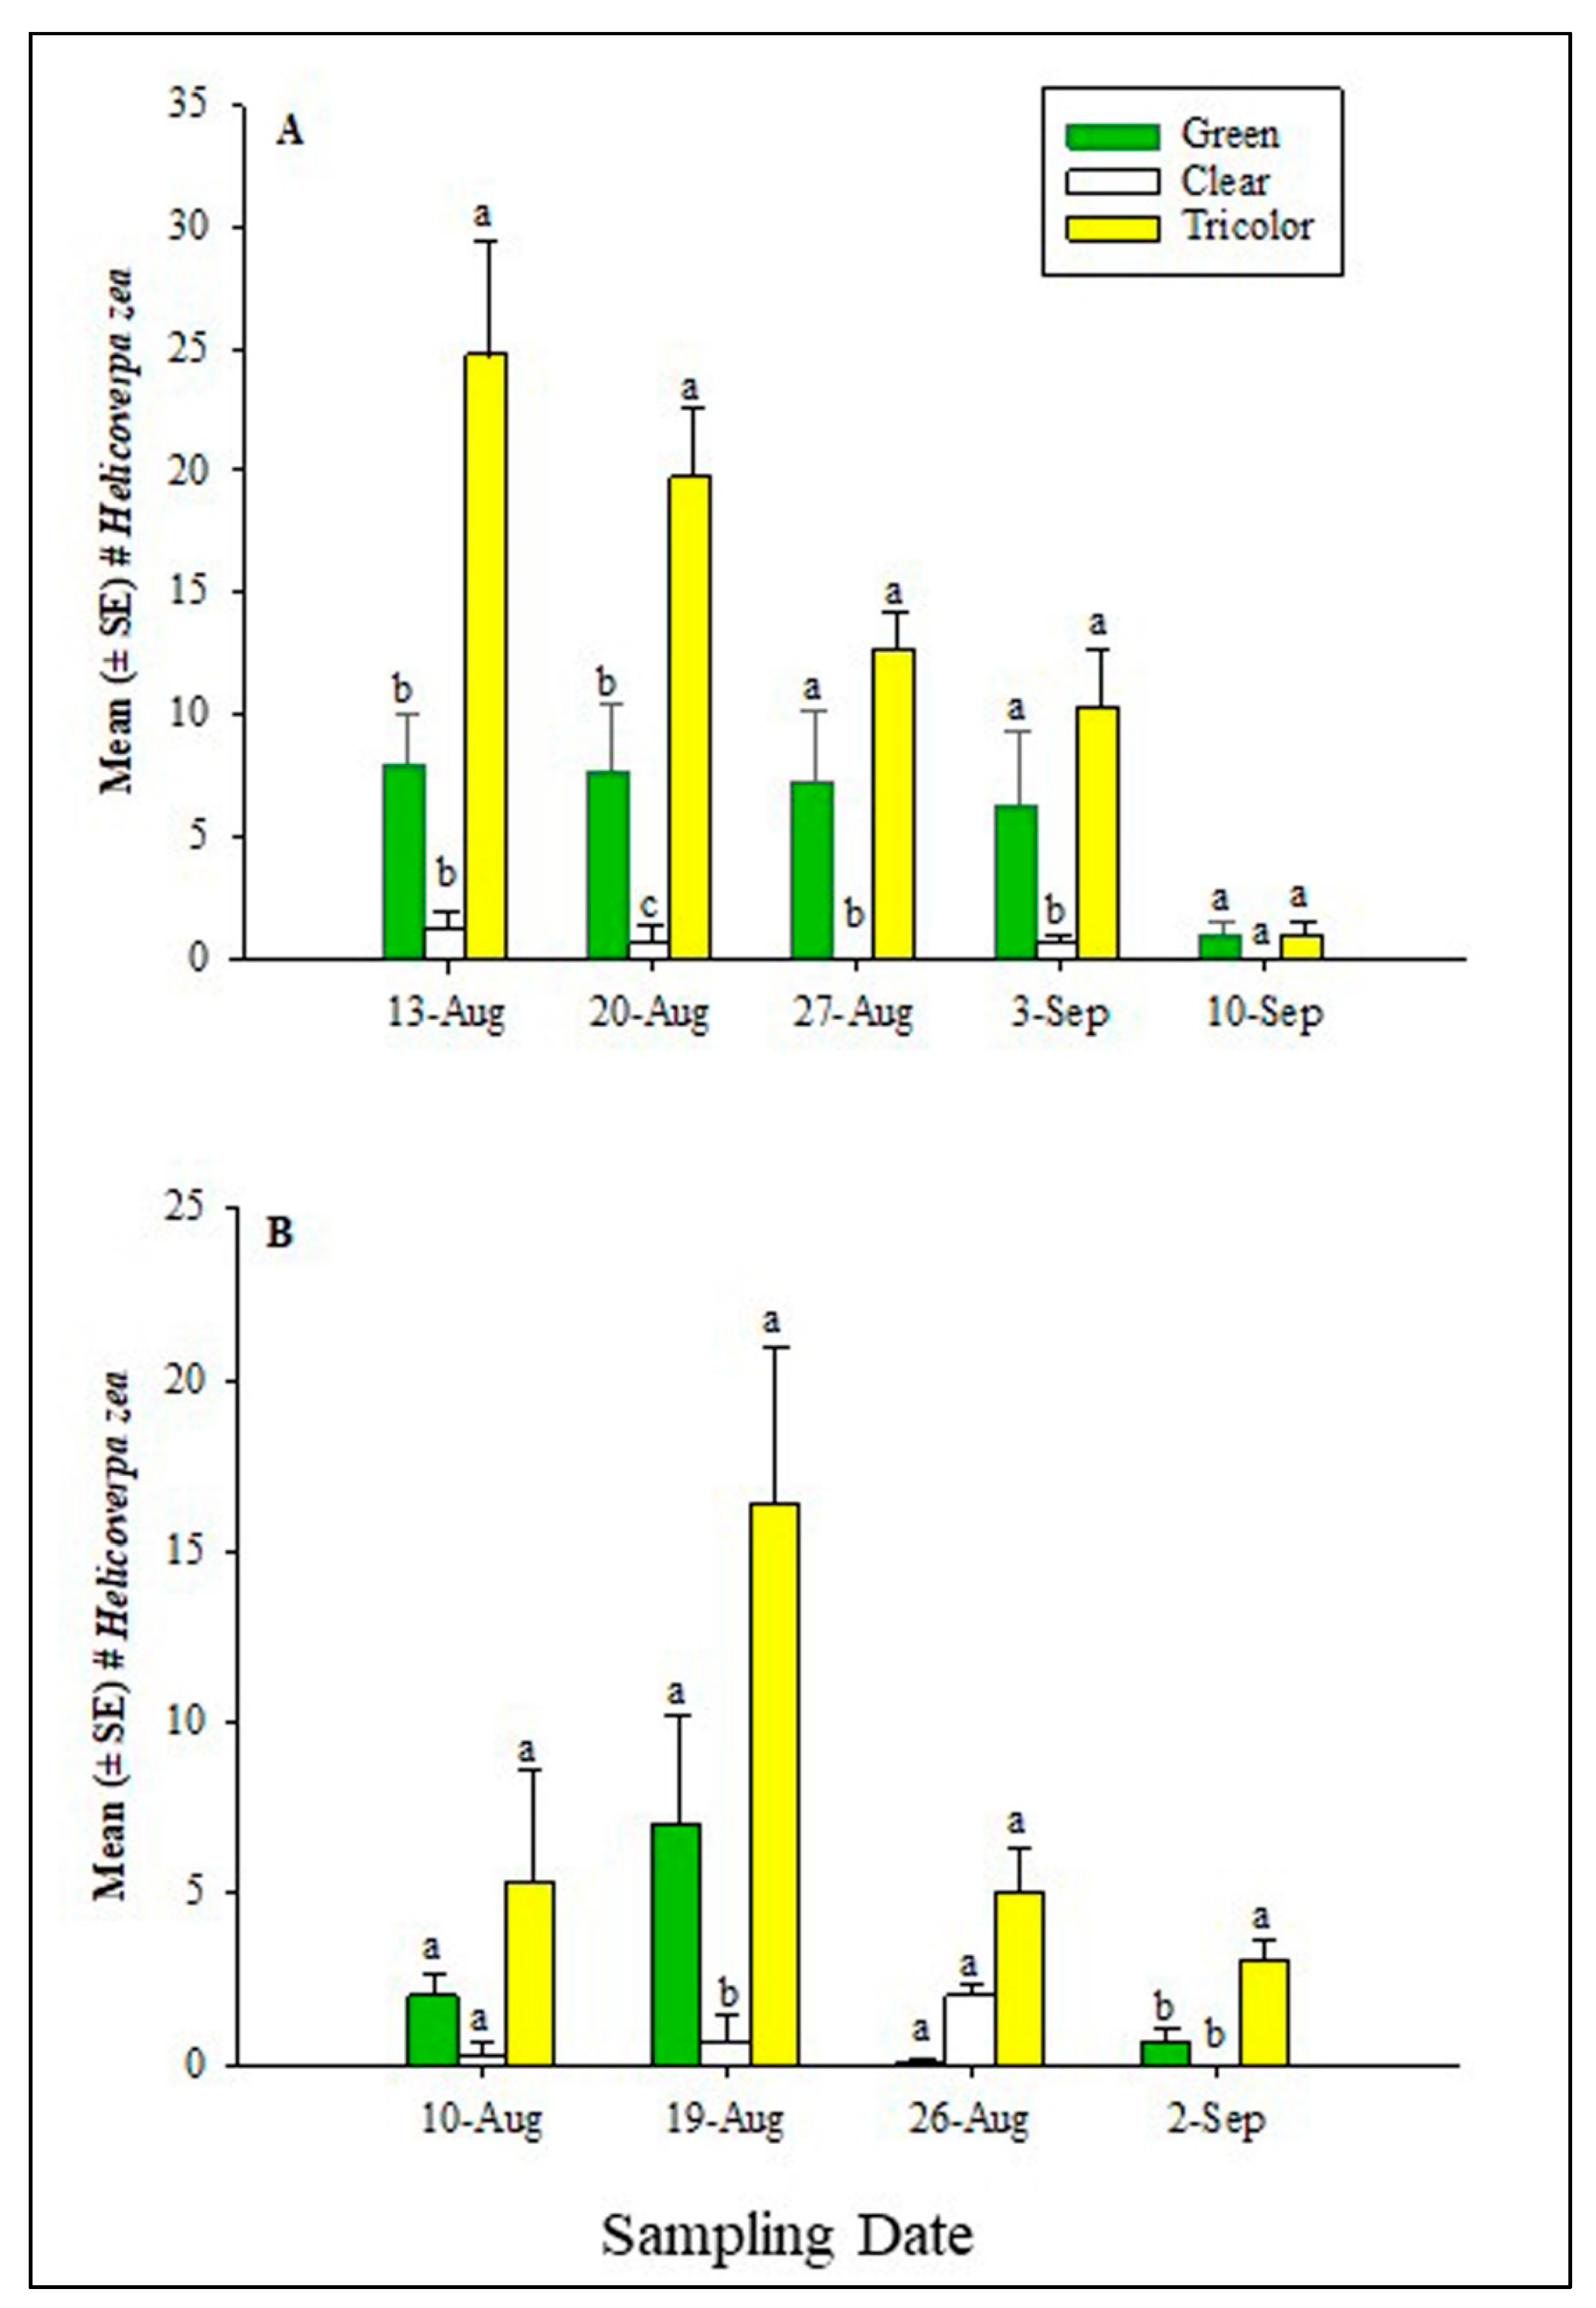
3.1. Trap Performance in 2021

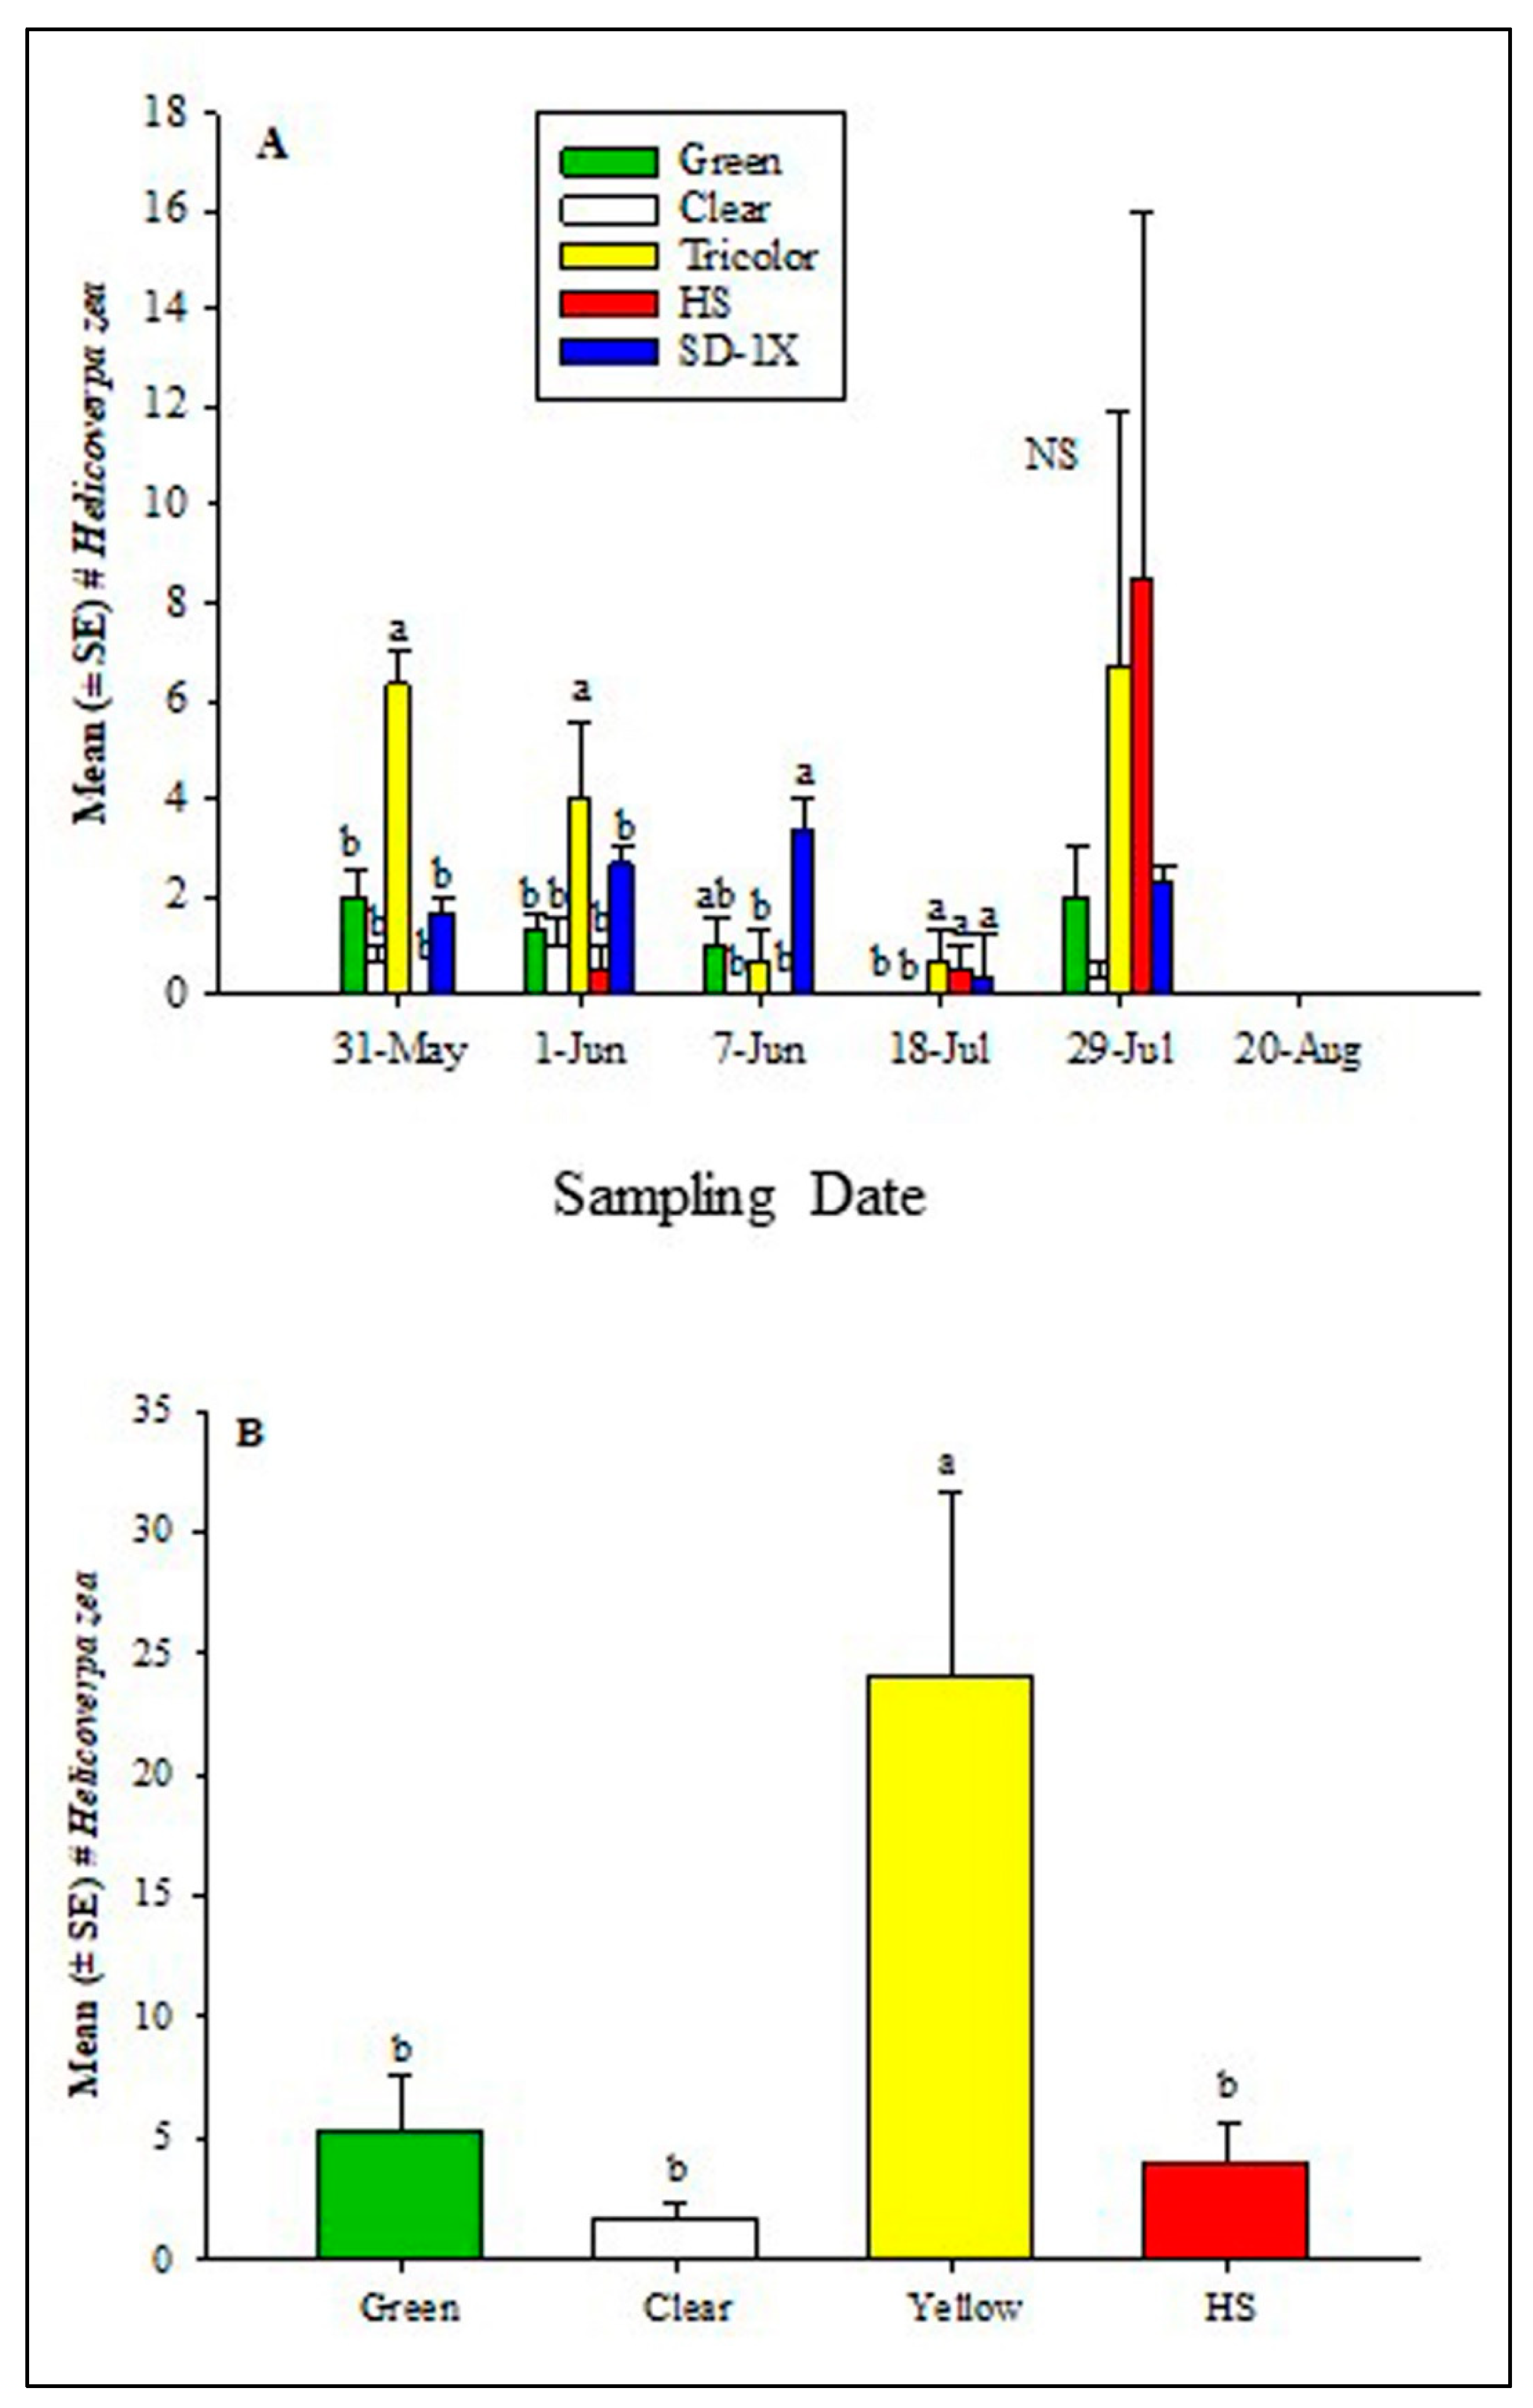
3.3. Trap Performance in 2022

3.4. Captures of Common Pollinators in 2021
3.5. Captures of Common Pollinators in 2022
4. Discussion
5. Conclusions
Data Availability Statement
Acknowledgments
Conflicts of Interest
References
- Adesina, I.; Bhowmik, A.; Sharma, H.; Shahbazi, A. A review on the current state of knowledge of growing conditions, agronomic soil health practices and utilities of hemp in the United States. 2020, Agric. 10. [CrossRef]
- Mark, T.; Shepherd, J.; Olson, D.; Snell, W.; Proper, S.; Thornsbury, S. 2020. Economic Viability of Industrial Hemp in the United States: A review of state pilot programs. United States Dep. Agric. Econ. Res. Serv. 2020, 1–77. [CrossRef]
- Tancig, M.; Kelly-Begazo, C.; Kaur, N.; Sharma, L.; Brym, Z. Industrial hemp in the United States: Definition and History. Edis. 2021, 2021: 2–4. [CrossRef]
- Horner, J.; Ohmes, A.; Massey, R.; Luce, G.; Bissonnette, K.; Milhollin, R.; Lim, T.; Roach, A.; Morrison, C.; Schneider. R. Missouri Industrial Hemp Production. 2019, 1–45.
- Johnson, N. American Weed: A History of cannabis cultivation in the United States. EchoGéo. 2019, 0–22. [CrossRef]
- NASS. National Hemp Report (April 2023) 29 USDA, National Agricultural Statistics Service. 2023, National Hemp Report 04/19/2023 (cornell.edu).
- Agricultural Marketing Resource Center. A national information resource for value- added agriculture. 2023, (https://www.agmrc.org/commodities-products/fiber/industrial-hemp).
- McPartland, J.; Clarke, R.; Watson, D. Hemp diseases and pests management and biological control. 2000, CABI Publisher.
- Cranshaw, W.; Schreiner, M.; Britt, K.; Kuhar, T. P.; McPartland, J.; Grant, J.; Bogran, C. Developing Insect Pest Management Systems for Hemp in the United States: A Work in Progress. J. Integr. Pest Manag. 2019, 10. [CrossRef]
- Mostafa, A. R. ; Messenger. P. S. lnsects and mites associated with plants of the 45 genera Argemone, Cannabis, Glaucium, Erythroxylum, Eschscholtzia, Humulus, and Papaver. Unpubl. manuscript, Univ. California, Berkeley, 1972.
- Schreiner, M. A survey of the arthropod fauna associated with hemp (Cannabis sativa L.) Grown in Eastern Colorado (Doctoral dissertation, Colorado State University), 2019. [CrossRef]
- Ajayi, O. S.; Samuel-Foo, M. Hemp pest spectrum and potential relationship between Helicoverpa zea station and hemp production in the United States in the face of climate change. Insects. 2021, 12: 1–11. [CrossRef]
- Britt, K. E.; Kuhar, T. P.; Cranshaw, W.; McCullough, C. T.; Taylor, S. V.; Arends, B. R.; Burrack, H.; Pulkoski, M.; Owens, D.; Tolosa, T. A.; Zebelo, S.; Kesheimer, K. A.; Ajayi, O. S.; Samuel-Foo, M.; Davis, J. A.; Arey, N.; Doughty, H.; Jones, J.; Bolt, M.; Fritz, B. J.; Grant, J. F.; Cosner, J.; Schreiner, M. Pest management needs and limitations for corn earworm (Lepidoptera: Noctuidae), an emergent key pest of hemp in the United States. J. Integr. Pest Manag. 2021, 12: 1–11. [CrossRef]
- Arey, N. C.; Lord, N. P. ; Davis. J. A. Evaluation of Hemp (Cannabis sativa) (Rosales: Cannabaceae) as an alternative host plant for polyphagous Noctuid Pests. J. Econ. Entomol. 2022, 115: 1947–1955. [CrossRef]
- Le Feon, V. , Schermann-Legionnet, A., Delettre, Y., Aviron, S., Billeter, R., Bugter, R., Hendrickx, F., Burel, F. Intensification of agriculture, landscape composition and wild bee communities: a large scale study in four European countries. Agric. Ecosyst. Environ. 2010, 137: 143–150. [CrossRef]
- Senapathi, D. , Biesmeijer, J.C., Breeze, T.D., Kleijn, D., Potts, S.G., Carvalheiro, L.G. Pollinator conservation — the difference between managing for pollination services and preserving pollinator diversity. Curr. Opin. Insect Sci. 2015, 12: 93–101. [CrossRef]
- Weber, D. C.; Ferro, D. N. Nontarget noctuids complicate integrated pest management monitoring of sweet corn with pheromone traps in Massachusetts. J. Econ. Entomol. 1991, 84: 1364–1369. [CrossRef]
- Coop, L. B.; Drapek, R. J.; Croft, B. A.; Fisher, G. C. Relationship of corn earworm (Lepidoptera: Noctuidae) pheromone catch and silking to infestation levels in Oregon sweet corn. J. Econ. Entomol.1992, 85: 240–245. [CrossRef]
- Guerrero, S.; Brambila, J.; Meagher, R. L. Efficacies of four pheromone-baited traps in capturing male Helicoverpa (Lepidoptera: Noctuidae) Moths in northern Florida. Florida Entomol. 2014, 97: 1671–1678. [CrossRef]
- Lichtenberg, E. M. , Mendenhall, C. D., Brosi, B. Foraging traits modulate stingless bee community disassembly under forest loss. J. Anim. Ecol. 2017, 86(6): 1404-1416. [CrossRef]
- Grab, H., E. J. Blitzer, B. Danforth, G. Loeb, and K. Poveda. Temporally dependent pollinator competition and facilitation with mass flowering crops affects yield in co-blooming crops. Sci. Rep. 2017, 7: 45296. [CrossRef]
- Dalio, J. S. Cannabis sativa – an important subsistence pollen source for Apis. J. Pharm. Biol. Sci. 2012, 1: 1–3.
- Byers, J. A.; Naranjo, S. E. Detection and monitoring of pink bollworm moths and invasive insects using pheromone traps and encounter rate models. J. Appl. Ecol. 2014, 51: 1041– 1049. [CrossRef]
- Ferracini, C.; Pogolotti, C.; Lentini, G.; Saitta, V.; Busato, E.; Rama, F.; Alma, A. Performance of pheromone-baited traps to monitor the seasonal abundance of tortrix moths in chestnut groves. Insects. 2020, 11: 1–15. [CrossRef]
- Falcon, L.; Van Den Bosch, R.; Etzel, L.; Ferris, C.; Stromberg, L. Light traps as detection devices for moths of cabbage looper and bollworm. Calif. Agric. 1967, 21: 12–14. [CrossRef]
- Hayes, J. L. Dynamics of nocturnal activity of moths in the Heliothis complex (Lepidoptera: Noctuidae) in cotton. J. Econ. Entomol.1991, 84: 855–865. [CrossRef]
- Gregg, P. C.; Fitt, G. P.; Coombs, M.; Henderson, G. S. Migrating moths (Lepidoptera) collected in tower-mounted light traps in northern New South Wales, Australia: species composition and seasonal abundance. Bull. Entomol. Res. 1993, 83: 563–578. [CrossRef]
- Harrison, T.; Berenbaum, M. R. Moth diversity in three biofuel crops and native prairie in Illinois. Insect Sci. 2013, 20: 407–419. [CrossRef]
- Studebaker, G. E.; Spurgeon, D. W.; Mueller, A. J. Calibration of ground cloth and sweep net sampling methods for larvae of corn ear worm and soybean looper (Lepidoptera: Noctuidae) in soybean. J. Econ. Entomol.1991, 84: 1625–1629. [CrossRef]
- Swenson, S. J.; Prischmann-Voldseth, D. A.; Musser, F. R. Corn Earworms (Lepidoptera: Noctuidae) as pests of soybean. J. Integr. Pest Manag. 2013, 4: 1–8. [CrossRef]
- Pearson, A. C.; Sevacherian, V.; Ballmer, G. R.; Vail, P. V.; Henneberry, T. J. Population dynamics of Heliothis virescens and H. zea (Lepidoptera: Noctuidae) in the Imperial Valley of California. Environ. Entomol. 1989, 18: 970–979. [CrossRef]
- Parajulee, M. N.; Rummel, D. R.; Arnold, M. D.; Carroll, S. C. Long-term seasonal abundance patterns of Helicoverpa zea and Heliothis virescens (Lepidoptera: Noctuidae) in the Texas High Plains. J. Econ. Entomol. 2004, 97: 668–677. [CrossRef]
- Piñero, J. C.; Jácome, I.; Vargas, R.; Prokopy, R. J. 2006. Response of female melon fly, Bactrocera cucurbitae, to host-associated visual and olfactory stimuli. Entomol. Exp. et Appl. 2008, 121 (3), 261-269. [CrossRef]
- Pinero, J. C.; Souder, S. K.; Vargas, R. I. Vision-mediated exploitation of a novel host plant by a tephritid fruit fly. PLoS One, 2017, 12 (4), e0174636. [CrossRef]
- Mitchell, E. R.; Agee, H. R.; Heath, R. R. Influence of pheromone trap color and design on capture of male velvetbean caterpillar and fall armyworm moths (Lepidoptera: Noctuidae). J. Chem. Ecol. 1989, 15: 1775–1784. [CrossRef]
- Agee, H. R. Spectral sensitivity of the compound eyes of field-collected adult bollworm and tobacco budworms. Ann. Entomol. Soc. Am. 1973, 66: 613–615. [CrossRef]
- McLaughlin, J. R.; Brogdon, J. E.; Agee, H. R.; Mitchell, E. R. Effect of trap color on captures of male cabbage looper and soybean looper in double-cone pheromone traps. J. Georg. Entomol. Soc. 1975, 10: 174–179. [CrossRef]
- Méndez, A.; Martín, L.; Arines, J.; Carballeira, R.; Sanmartín, P. Attraction of insects to ornamental lighting used on cultural heritage buildings: A case study in an urban area. Insects. 2022, 13(12): 1153. [CrossRef]
- Knodel, J. J.; Agnello, A. M. Field comparison of nonsticky and sticky pheromone traps for monitoring fruit pests in western New York. J. Econ. Entomol. 1990, 83: 197–204. [CrossRef]
- Cha, D. H.; Hesler, S. P.; Park, S.; Adams, T. B.; Zack, R. S.; Rogg, H.; Loeb, G. M.; Landolt, P. J. Simpler is better: fewer non-target insects trapped with a four-component chemical lure vs. a chemically more complex food-type bait for Drosophila suzukii. Entomol. Exp. Appl. 2015,154: 251–260. [CrossRef]
- Landolt, P.; Zhang, Q.-H. Discovery and development of chemical attractants used to trap pestiferous social wasps (Hymenoptera: Vespidae). J. Chem. Ecol. 2016, 42: 655–665. [CrossRef]
- Grocock, N. L.; Batallas, R. E.; McNamara, E. A.; Sturm, A. B.; Manson, J. S.; Evenden, M. L. Bumble bees (Hymenoptera: Apidae) respond to moth (Lepidoptera: Noctuidae) pheromone components, leading to bee bycatch in monitoring traps targeting moth Pests. Front. Ecol. Evol. 2020, 8: 576692. [CrossRef]
- Adams, R. G.; Murray, K. D.; Los, L. M. Effectiveness and Selectivity of Sex Pheromone Lures and Traps for Monitoring Fall Armyworm (Lepidoptera: Noctuidae) Adults in Connecticut Sweet Corn. J. Econ. Entomol. 1989, 82: 285–290. [CrossRef]
- Meagher, R. L.; Mitchell, E. R. Nontarget hymenoptera collected in pheromone- and synthetic floral volatile-baited traps. Environ. Entomol. 1999, 28: 367–371. [CrossRef]
- Knight, A. L.; Miliczky, E. Influence of trap colour on the capture of codling moth (Lepidoptera: Tortricidae), honeybees, and non-target flies. J. Entomol. Soc. Brit. Columbia. 2003, 100: 65–70.
- Aurelian, V. M.; Evenden, M. L.; Judd, G. J. R. Diversity and abundance of arthropod by-catch in semiochemical-baited traps targeting apple clearwing moth (Lepidoptera: Sesiidae) in organic and conventional apple orchards in British Columbia, Canada. Can. Entomol. 2015, 147: 227–243. [CrossRef]
- Spears, L. R.; Looney, C.; Ikerd, H.; Koch, J. B.; Griswold, T.; Strange, J. P.; Ramirez, R. A. Pheromone Lure and Trap Color A. Environ. Entomol. 2016, 45: 1009–1016. [CrossRef]
- Goulson, D. Conserving wild bees for crop pollination. Food, Agric. Environ. 2003, 1: 142–144.
- Potts, S. G.; Biesmeijer, J. C.; Kremen, C.; Neumann, P.; Schweiger, O.; Kunin, W. E. Global pollinator declines: Trends, impacts and drivers. Trends Ecol. Evol. 2010, 25: 345– 353. [CrossRef]
- Zattara, E. E.; Aizen, M. A. Worldwide occurrence records suggest a global decline in bee species richness. One Earth. 2021, 4:114–123. [CrossRef]
- Graves, T. A.; Janousek, W. M.; Gaulke, S. M.; Nicholas, A. C.; Keinath, D. A.; Bell, C. M. , Cannings, S.; Hatfield, R. G.; Heron, J. M.; Koch, J. B.; Loffland, H. L.; Richardson, L. L.; Rohde, A. T.; Rykken, J.; Strange, J. P.; Tronstad, L. M.; Sheffield, C. S. 2020. Western bumble bee: declines in the continental United States and range-wide information gaps. Ecosphere. 2020, 11. [CrossRef]
- Biesmeijer, J. C.; Roberts, S. P.; Reemer, M.; Ohlemuller, R.; Edwards, M.; Peeters, T.; Schaffers, A. P.; Potts, S. G.; Kleukers, R. J.; Thomas, C. D.; Settele, J.; Kunin, W. E. Parallel declines in pollinators and insect-pollinated plants in Britain and the Netherlands. Science 2006, (80-.). 313: 351–354. [CrossRef]
- Cameron, S. A.; Lozier, J. D.; Strange, J. P.; Koch, J. B.; Cordes, N.; Solter, L. F.; Griswold, T. L. Patterns of widespread decline in North American bumble bees. Proc. Natl. Acad. Sci. U. S. A. 2011, 108: 662–667. [CrossRef]
- Powney, G. D.; Carvell, C.; Edwards, M.; Morris, R. K. A.; Roy, H. E.; Woodcock, B. A.; Isaac, N. J. B. Widespread losses of pollinating insects in Britain. Nat. Commun. 2019, 10: 1–6. [CrossRef]
- Gross, H. R.; Carpenter, J. E. Role of the fall armyworm (Lepidoptera: Noctuidae) pheromone and other factors in the capture of bumblebees (Hymenoptera: Aphidae) by universal moth traps. Environ. Entomol. 1991, 20: 377–381. [CrossRef]
- Flicker, N. R. , Poveda, K., Grab, H. The Bee Community of Cannabis sativa and Corresponding Effects of Landscape Composition. Environ. Entomol. 2019, 49(1): 197–202. [CrossRef]
| Location | Trap Type | Carpenter Bee Mean ± SE |
Bumble Bee Mean ± SE |
Honey Bee Mean ± SE |
| Carver Farm | Green | 1.40 ± 0.53 ab | 1.27 ± 0.51 a | 1.07 ± 0.73 a |
| Clear | 0.47 ± 0.24 b | 0.33 ± 0.19 a | 0.60 ± 0.47 a | |
| Tricolor | 4.27 ± 1.39 a | 2.27 ± 0.88 a | 1.93 ± 1.47 a | |
| χ2 | 9.12 | 5.38 | 0.33 | |
| df | 2, 44 | 2, 44 | 2, 44 | |
| p | 0.0104 | 0.0679 | 0.8473 | |
| Sikeston | Green | 0.58 ± 0.26 b | 1.33 ± 0.61 b | 1.33 ± 0.45 a |
| Clear | 1.08 ± 0.34 b | 2.92 ± 0.94 b | 1.25 ± 0.49 a | |
| Tricolor | 4.08 ± 1.08 a | 14.92 ± 4.67 a | 1.83 ± 0.58 a | |
| χ2 | 9.15 | 9.75 | 0.69 | |
| df | 2, 33 | 2, 33 | 2, 33 | |
| p | 0.0103 | 0.0076 | 0.7091 |
| Trap Type | H. zea | |
|---|---|---|
| Carver Farm | Sikeston Farm | |
| Green | 11.00 ± 2.08 b | 10.67 ± 2.33 b |
| Clear | 8.3 ± 2.70 b | 2.67 ± 0.89 b |
| Tricolor | 134.6 ± 56.2 a | 31.67 ± 1.8 a |
| HS | 14.0 ± 2.73 b | NA |
| SD-1X | 16.33 ± 4.9 b | 22.00 ± 6.5 ab |
| χ2 | 8.8 | 8.00 |
| df | 4 | 3 |
| P | 0.064 | 0.0459 |
Disclaimer/Publisher’s Note: The statements, opinions and data contained in all publications are solely those of the individual author(s) and contributor(s) and not of MDPI and/or the editor(s). MDPI and/or the editor(s) disclaim responsibility for any injury to people or property resulting from any ideas, methods, instructions or products referred to in the content. |
© 2024 by the authors. Licensee MDPI, Basel, Switzerland. This article is an open access article distributed under the terms and conditions of the Creative Commons Attribution (CC BY) license (http://creativecommons.org/licenses/by/4.0/).


