1. Introduction
1.1. Motivation
The most common activities of daily living (ADL) are walking and climbing stairs [
1]. The ability to comfortably perform ADLs is crucial for the quality of life of patients or elderly persons. This is especially important as disorders of the human gait pattern increase significantly with age. According to a study conducted by Mahlknecht et al. [
2] the prevalence of gait and balance disorders for the age group between 60 and 69 years old is around 10% and more than 60% for over 80 year olds. In view of an ageing society, interest in effective and affordable treatment methods for gait disorders is increasing. There are multiple approaches to reduce the impairment of gait disorders. One of them are orthoses and exoskeletons, which can be used to support or even regain the functions of the lower extremities [
3,
4,
5,
6,
7,
8,
9,
10,
11]. To develop and validate such devices and to adapt them to the user, a long-term gait observation is necessary. Parameters like the torque and the angle on the knee joint, the angular velocity in the hip joint and the speed of the subject’s movement can be derived based on biomechanical measurements [
5]. By evaluation of these parameters over the course of a day while performing ADL we can generate load collectives for the lower limb. The collected data can help to improve the design, verification and the control of exoskeletons.
1.2. State of the Art
This chapter provides an overview of the current state of the art in research and technology for capturing lower-limb biomechanics with Motion Analysis Systems (MAS). There are several methods for this purpose, which differ primarily in the choice of sensors.
1.2.1. Optical Motion Analysis Systems
A frequently selected method of recording motion kinetics is the use of optical systems [
12]. One example of such system has been described by Riener et al. [
13]. A camera-based infrared movement analyzer records the positions of retro-reflective markers, which are attached to anatomical landmarks of the foot, ankle, knee and hip on both legs. If a marker can be resolved by two cameras from different angles, the position of the marker in relation to the cameras can be retrieved. The kinematics are then determined via the marker position and the ground reaction forces (GRF) measured by force plates installed in the instrumented steps of the setup. Even though this setup is transferable to a flat environment, the measurements always take place under laboratory conditions.
This methodology with motion-detecting cameras has been proven for decades in bio kinematics but is inappropriate for a wearable biomechanic analysis system. Optical systems can record human motion very accurately, but restrict the recording spatially into a stationary environment outfitted with an array of cameras [
14]. Nevertheless, the precise data and the large amount of test results in literature can be used for the verification of a new measurement system [
13,
15].
1.2.2. Inertial Measurement Unit based Motion Analysis Systems
IMU (Inertial Measurement Unit) based wearable systems have been recently subject to extensive research [
12,
14,
16,
17,
18,
19,
20,
21,
22,
23,
24,
25,
26,
27,
28,
29,
30,
31,
32]. Systems based on inertial sensors, while not yet delivering the same accuracy as optical systems, can be operated everywhere and not only in a stationary environment equipped with cameras. Commercial solutions for inertial motion capturing have existed since the early 2000s. In 2008, Cloete et al. [
33] benchmarked the commercially available MOVEN motion capture system by XSENS, comparing it to a clinically used optical system. They concluded that the system can measure the inclinations of body parts and joint angles with reasonable accuracy, while being exceptionally fast to setup and flexible in its use [
33]. However, the commercial solutions tested still are relatively expensive, with the latest version of XSENS motion capture suit costing more than 4000 USD. In 2020, Robert-Lachaine et al. [
34] compared the Perception Neuron System with a state-of-the-art optical measurement system. They found a RMSE (Root Mean Squared Error) of less than 5° for most joint angles [
34]. The comparison of Robert-Lachaines et al. [
34] results with the results of Cloete et al. [
33] indicates large improvements in accuracy over the years. The maximum difference between the RMSEs for knee joint of the two studies is 11°. However, even though the system is considered a low-cost solution, its pricetag of under 2.000 USD (in 2020) still renders their solution unaffordable for the intended purposes [
34].
Hamdi et al. [
35] proposed an inertial motion capture system based on seven IMUs and four Force Sensitive Resistors, placed under the heel and toe of the subject. They observed the inclination of the body parts on which the IMUs were placed, and calculated joint angles from these inclinations. In the validation phase, the measurements taken with their system were compared to literature data, resulting in a comparable accuracy to the commercial solution, with the knee flexion error measured between 0.3° and 13° RMSE [
35]. Both commercially available solutions aim to capture human motion with a high accuracy and sampling rate, but for a comparably short amount of time.
Known MAS aim at measuring absolute limb orientations in all three dimensions. However, accelerometers and gyroscopes only measure accelerations and angular velocities. To observe the absolute orientation of the sensor, sensor fusion with a magnetometer can be applied [
17,
21,
26,
36]. Prayudi et al. [
36] developed a low-cost motion capturing system for the upper body. They used a network of independent sensors, each observing its orientation by fusioning accelerometer, gyroscope and magnetometer data. To calculate joint angles, the orientations of the sensors were transformed into a coordinate system centered around the joint in question. The joint angle could then be calculated using simple arithmetics [
36].
Another advantage of sensor fusion with magnetometer data is that it can be used to compensate drifting gyroscope values [
26]. However, when using magnetometers, compensation for distortions introduced by electromagnetic interferecences must be applied [
21,
36]. This can become difficult for long-lasting interferences in indoor environments. Zihajehzadeh et al. [
37] proposed an IMU-based motion capturing system for the lower body. Instead of using magnetometers for drift compensation, multiple ultrawideband localization systems were implemented for measuring the distance between the left and right foot from the waist of the subject. They fused these distances with the gyroscope and accelerometer data using an Extended Kalman Filter (EKF) based algorithm.
1.2.3. Other methods for Motion-Analysis-Systems
It is also possible to measure the movement of a human body via the detection of electrical biosignals. Commonly used methods are electrocardiography (ECG) [
38], electromyography (EMG) [
12,
38] or electrical impedance tomography (EIT) [
38]. They are used to measure the electrical excitation of the heart muscle’s contraction (ECG) and action potentials of single or multiple muscles (EMG) [
38,
39]. The methods can be both invasive with needles and non-invasive with surface electrodes. EIT does not measure muscle contraction via electrical potential but via the changing impedance of a muscle [
40,
41].
Bansal et al. [
42] used OLEDs (Organic Light Emitting Diode) and OPDs (Organic Photo Diode) assembled on a flexible sensor board for measuring muscle activity. The proposed method is non-invasive. A diode with a wavelength of 610-700 nm is placed on the skin surface and shines on the muscles underneath. Due to the liquid crystalline properties of Myosin proteins in the sarcomeres and the muscle fibers becoming short and wide during muscle contraction the incident light is scattered anisotropically. This anisotropy can be detected by surface-mounted light detectors to determine muscle contraction. The proposed system can differentiate between isotonic and isometric contractions [
42].
Willwacher et al. [
12] and Pfüller [
43] note that a lot of experience is required to place surface electrodes correctly. The accuracy of the measurements of all tree methods is affected by biological variability (e.g. skin conduction conditions, subcutaneous adipose tissue) and different other interferences. Furthermore scattering of the signal amplitude can occur during dynamic movement analyses (due to constant changes in position and distance between the active muscle and electrode), which will lead to errors in the measurement of action potential [
43].
1.3. Objectives of SensAA
While systems for recording biomechanical measurements have been available for decades, these are either optical systems constraint to a laboratory environment, or full-body motion capturing suits, which would be too expensive for recording only the lower limb motion of a subject. None of the known systems is designed to run long-term measurements while performing ADL.
These long-term measurements are required to obtain a complete data set of loads during real live conditions over several days. Field measurements offer a significantly larger and more realistic variety of load scenarios compared to simulating selected walking activities in a laboratory. In addition, simulating tasks can lead to systematic errors. These errors can be avoided by measuring under real conditions.
The data of long-term measurements can be used later for calculating load collectives of the human leg and identifying different walking activities (e.g., level walking, stair ascending and descending) performed by the user. It is intended to use this information for the control of an active orthoses for the human knee.
For this purpose, a data acquisition system (SensAA) focused on measuring biomechanical parameters of the lower human limbs in everyday life is proposed. SensAA will be used by elderly people, therefore the use of the measurement system shall be as intuitive as possible. The wearer does not need technical knowledge to operate the system and can don and doff it on their own. No maintenance like recharging and sensor adjustment is required during runtime. The system is implemented by using off-the-shelf hardware and open-source software. This reduces cost and improves system accessibility.
SensAA is used in activities of daily living both indoors and outdoors. It is also used all day without taking it off. Therefore, a small and compact design is suggested, which is unobstructive to its wearer and does not cause discomfort.
To take full advantage of this wearable design a cloud-based software for data acquisition and analysis is proposed. While the measurements are running, the data is automatically uploaded into a database on a cloud server. The server allows central data storage and online data collection for multiple users simultaneously.
2. Materials and Methods
2.1. System Architecture
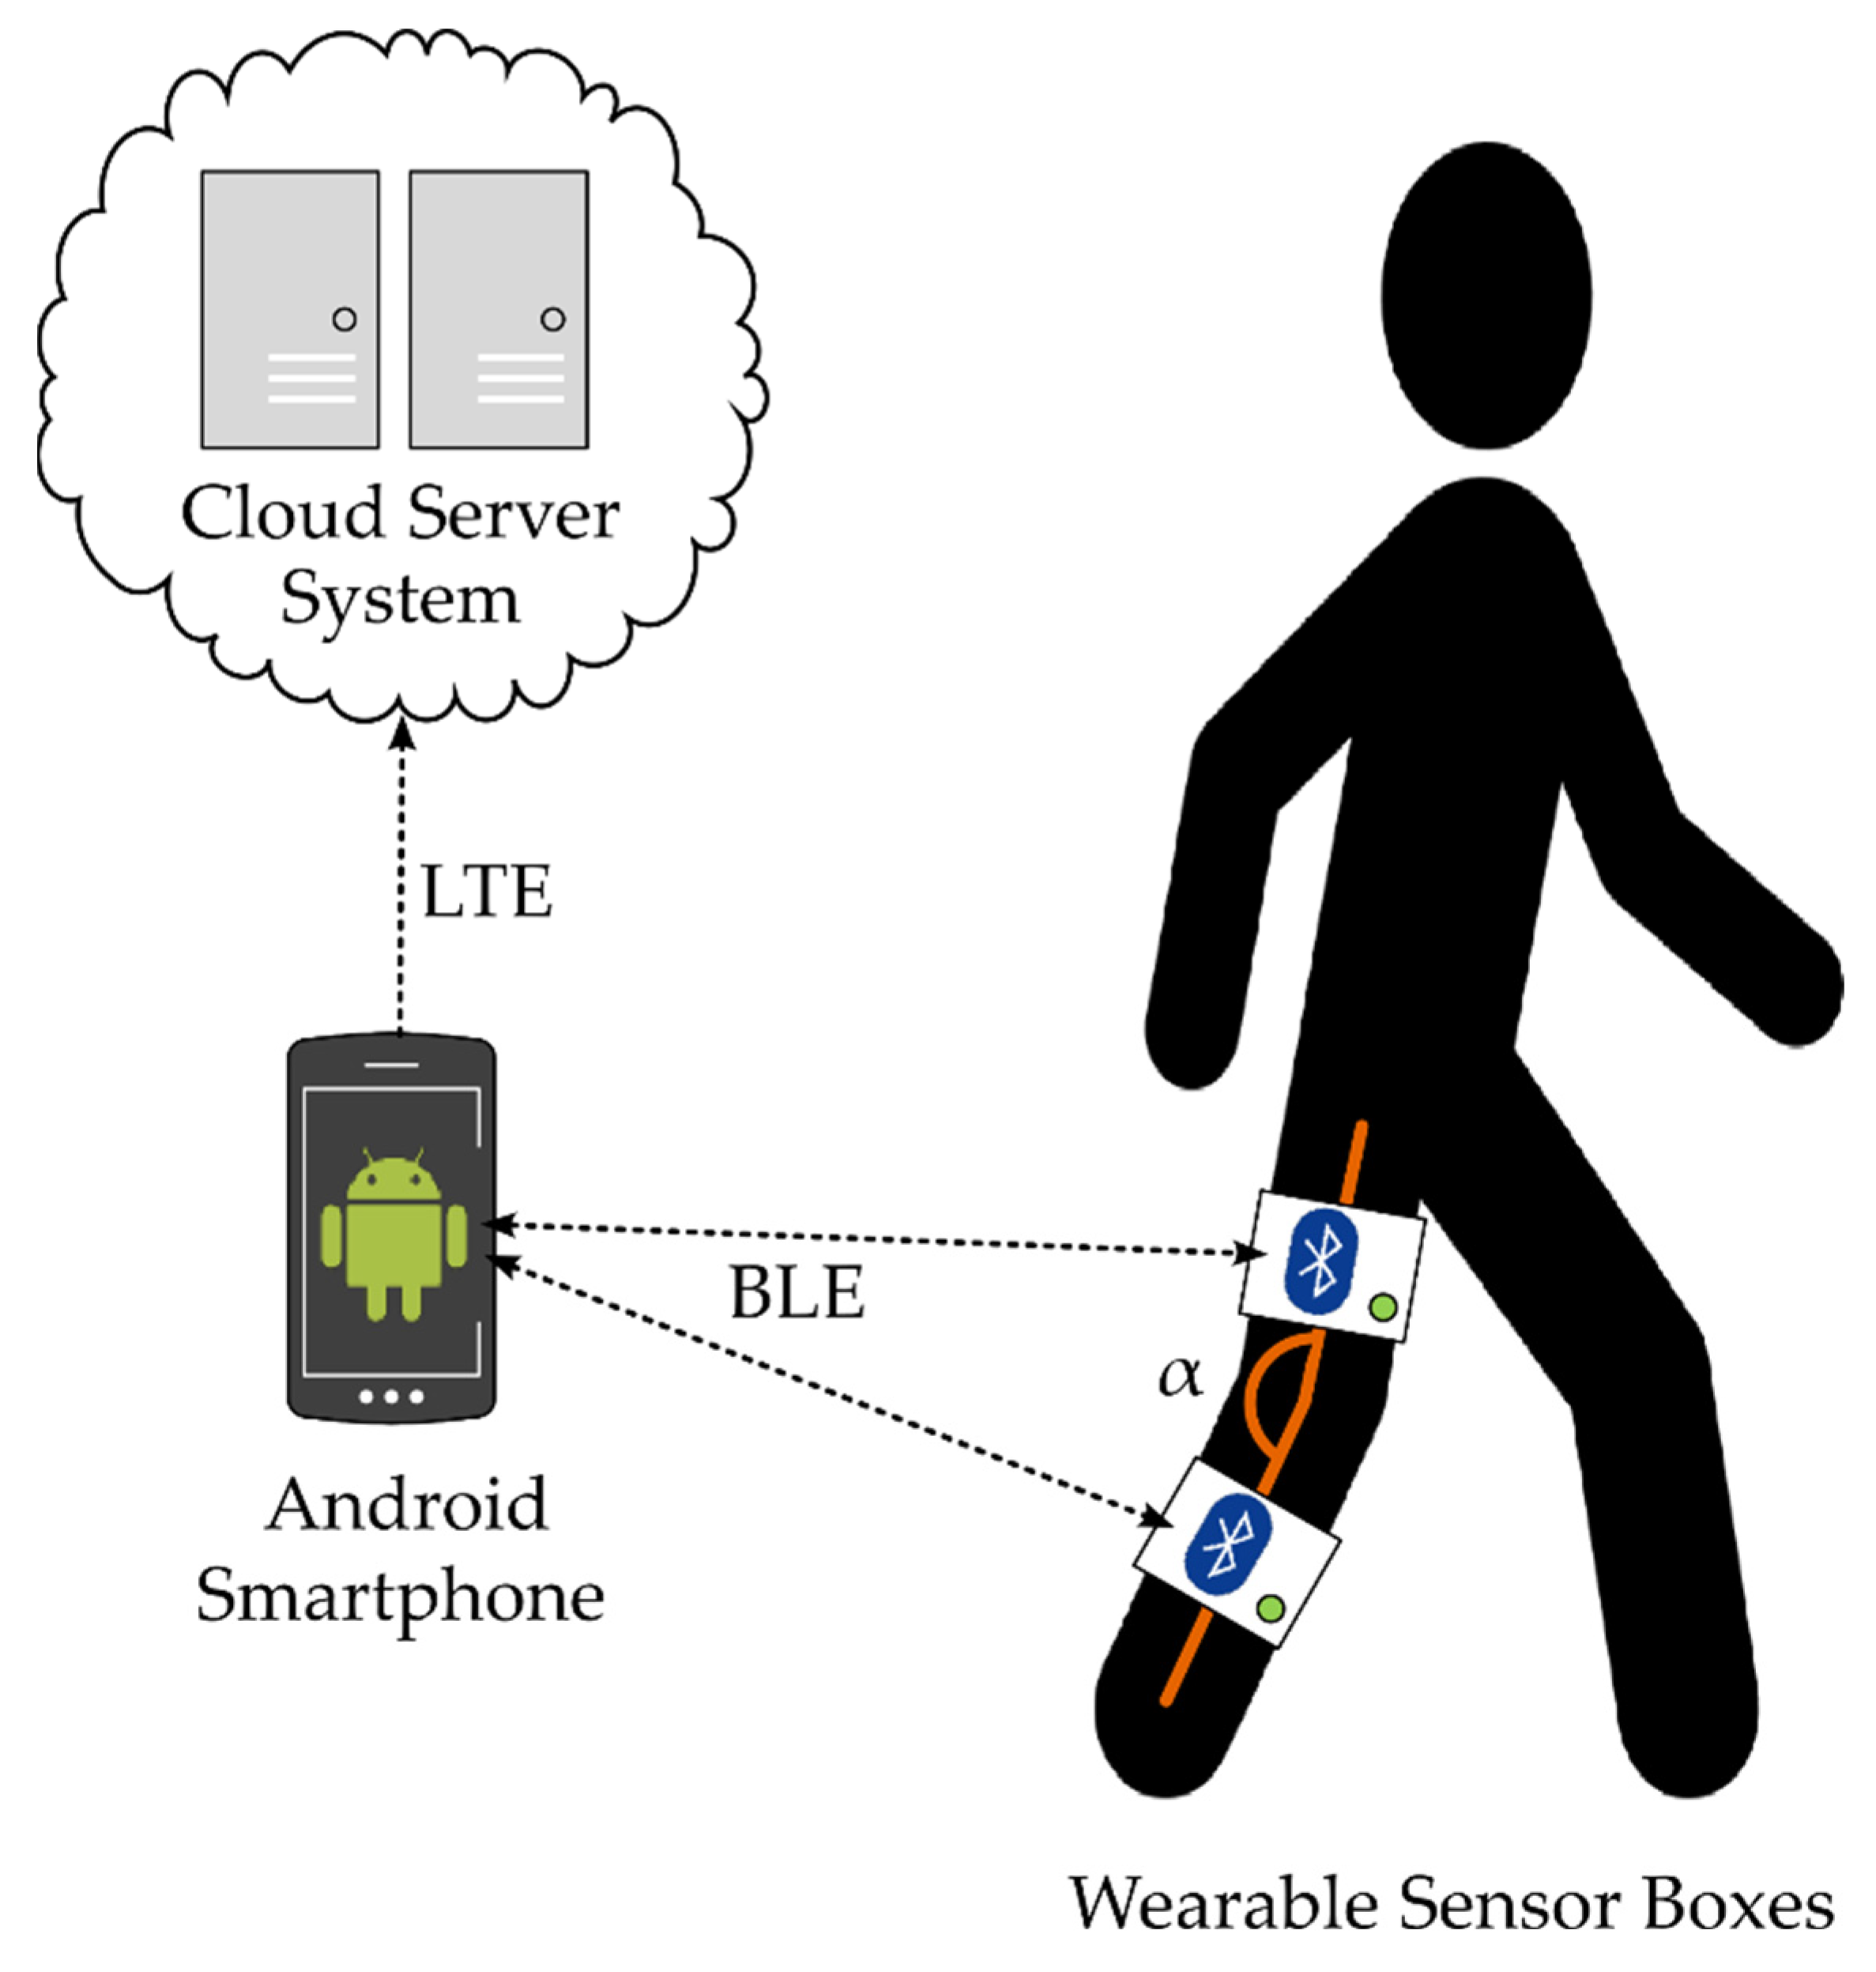
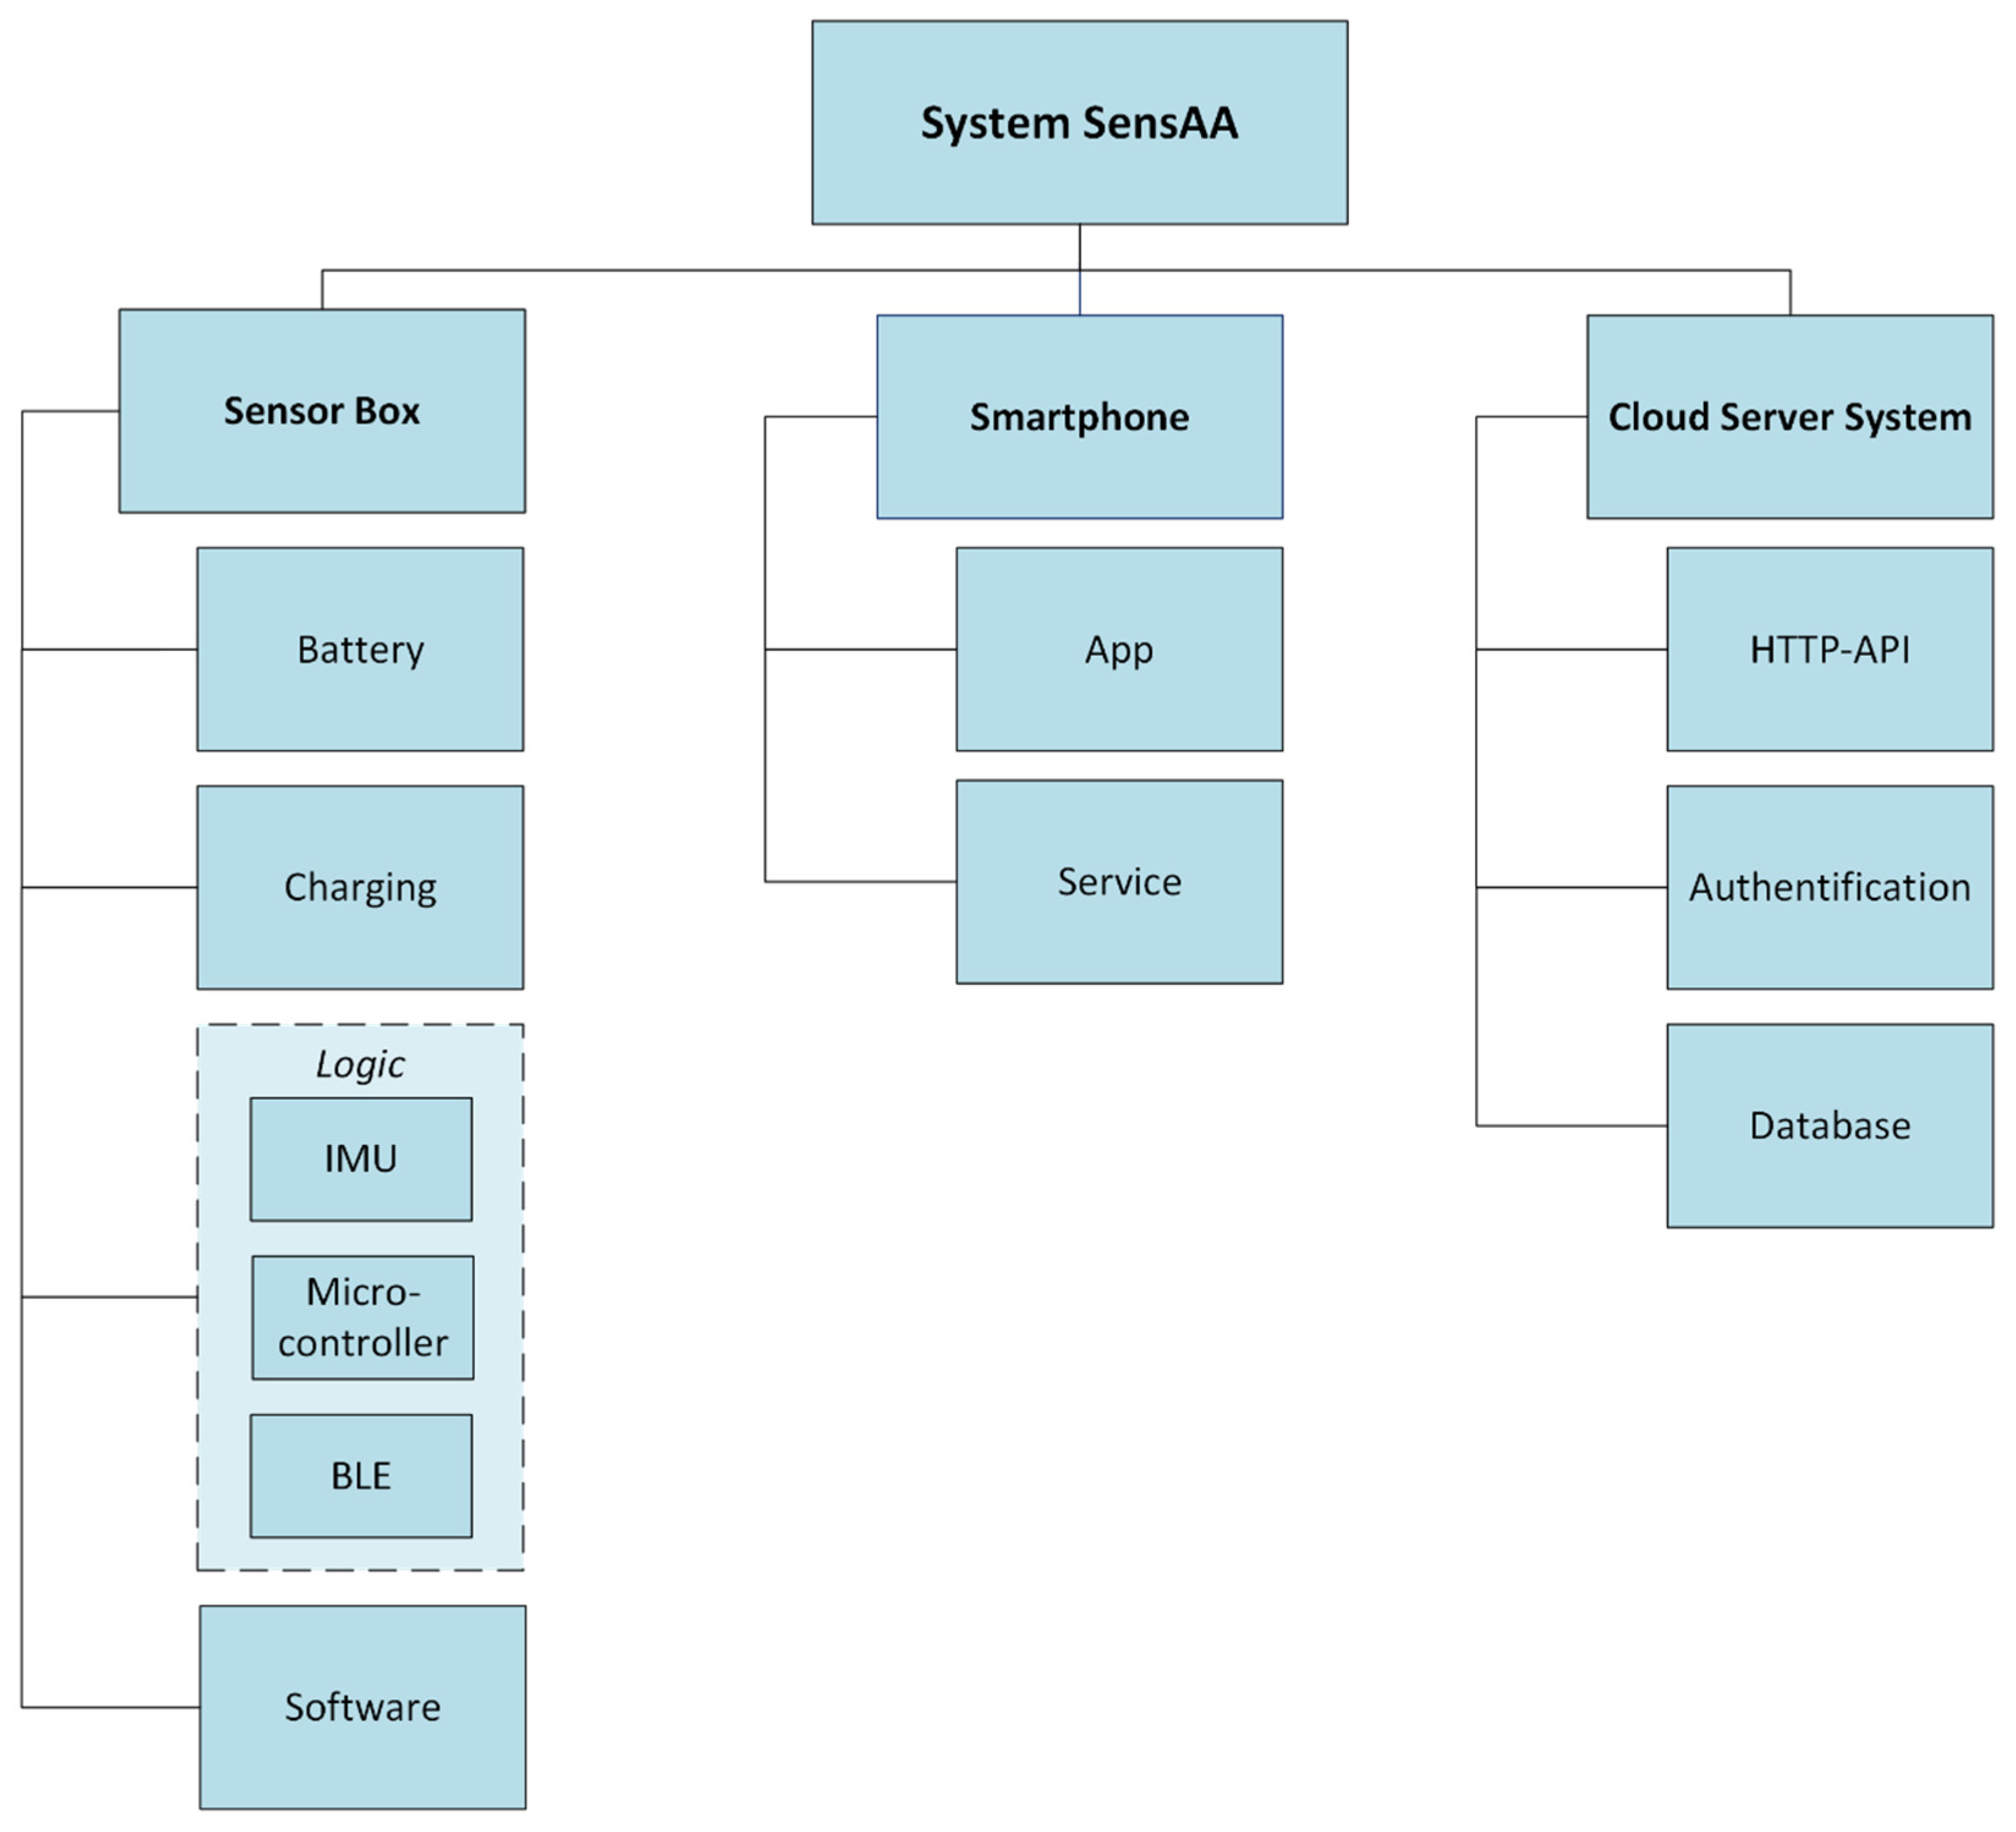
This Section gives an overview of the architecture of SensAA. The three main components are:
Wearable Sensor Boxes
Android Smartphone
Cloud Server System
The components and their interfaces are illustrated in
Figure 1:
In this paper as an example the use of the proposed measuring system for measuring the flexion and extension angle of the human knee joint is described. The measurement system uses IMU sensors to determine joint angles. The chosen sensor principle requires at least two IMU sensors for measuring the angle at one axis of a joint.
Each sensor is integrated in a housing, a wearable Sensor Box, together with a battery and a Bluetooth
® Low Energy (BLE) module (see
Section 2.2). One IMU sensor is attached to each thigh and shank of a leg. The sensors are placed parallel to the sagittal plane of the user’s body. They record acceleration and angular velocity of thigh and shank respectively. Each sensor also observes its inclination in relation to the gravity vector which will be used to calculate the joint angle of the knee joint.
The collected data is transmitted wirelessly via BLE from the sensors to a smartphone (see
Section 2.3). The smartphone runs a service, which receives the data via BLE notifications and relays them to a Cloud Server System over the cellular network. The Cloud Server provides a read and write interface to a database for up- and downloading datapoints (see
Section 2.4). It is linked to a central database with the possibility of creating regular backups. Since the server is reachable from a public address, appropriate measures must be taken to ensure the authenticity and authority of the users.
2.2. Sensor Box
2.2.1. Electronic Structure
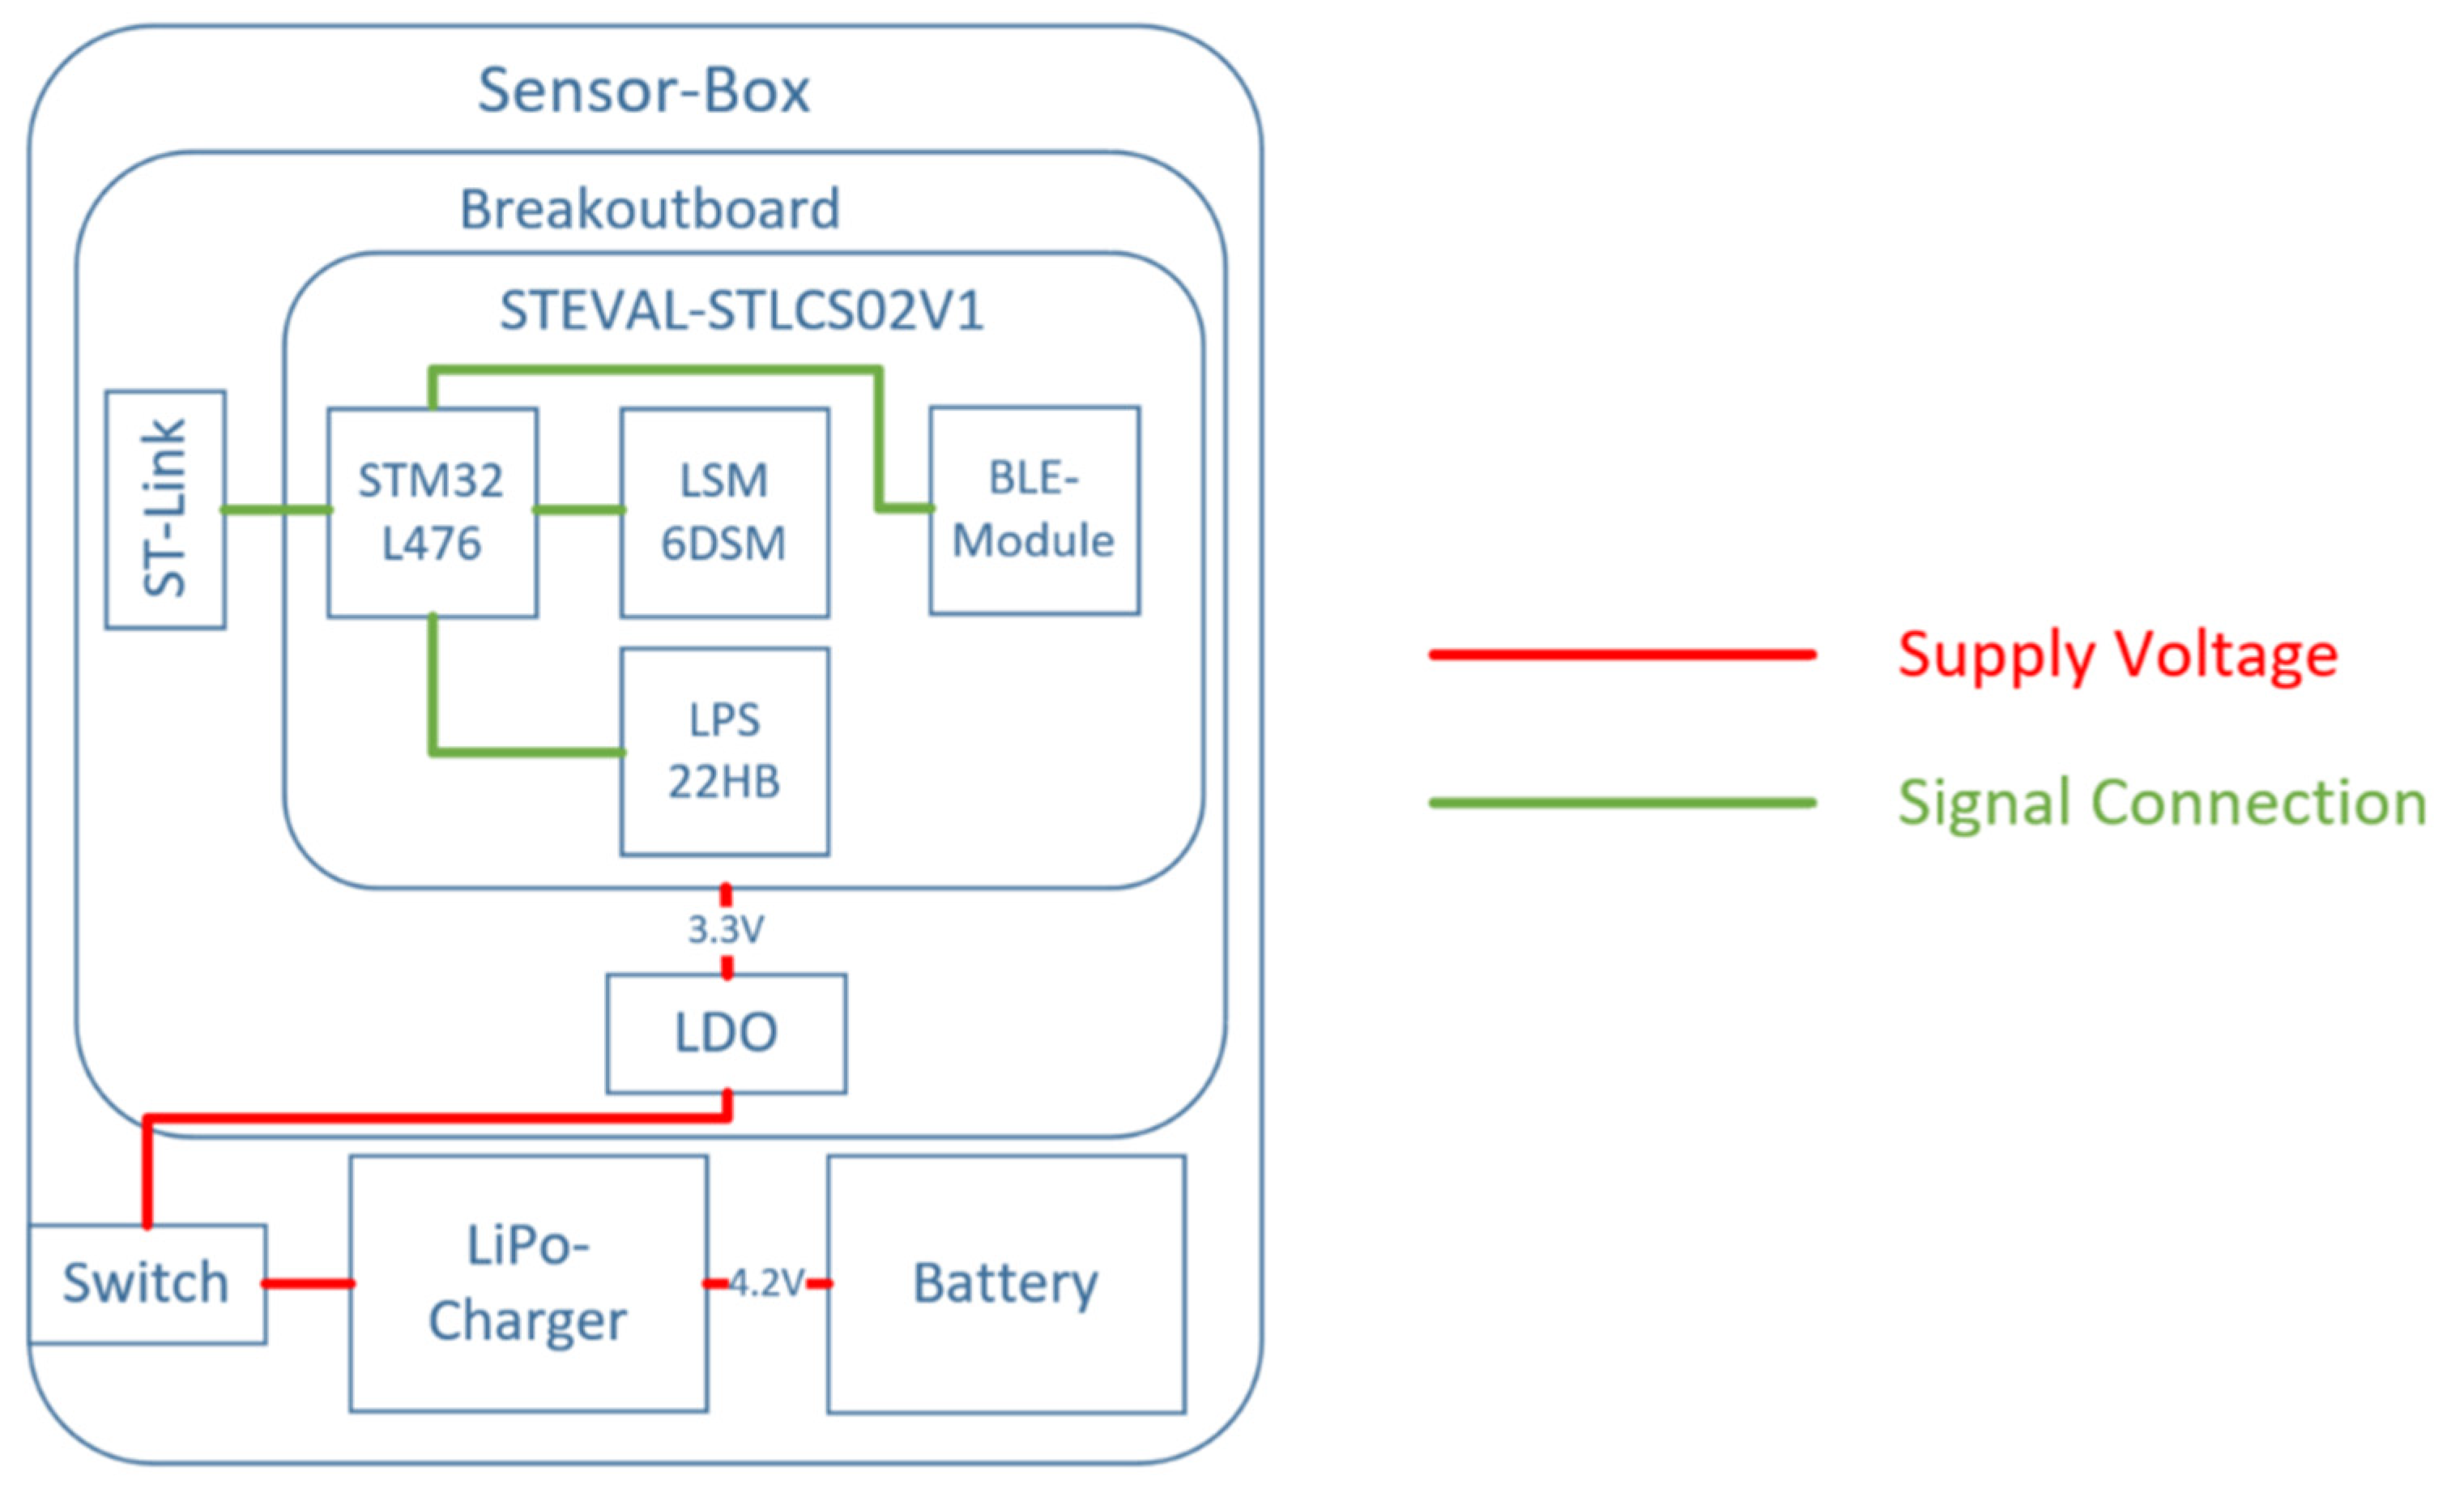
The Sensor Boxes with integrated inertial sensor and microcontroller are designed to have a small form factor while maintaining a long battery live.
Figure 3 shows the block diagram of the electronic structure and interfaces of SensAA.
The long duration of recordings requires the use of energy-efficient hardware, together with an appropriately dimensioned power source. While sensors based on MEMS (Micro-Electro-Mechanical Systems) technology themselves have a negligible power input, processors and wireless transmitters must be carefully selected to achieve the required level of energy.
Since Bluetooth
® Low Energy is the preferred protocol for transmitting data wirelessly to a smartphone (see
Section 2.3), the compact STEVAL-STLCS02V1 (ST-Evaluation) sensor board from STMicrolectronics is chosen. The BLE communication is provided by the modules integrated on the STEVAL-Board. This board is inexpensive and offers a suitable interface for programming with the integrated STM32-L476 microcontroller [
44]. In addition, its small size (13.5x13.5 mm) makes the board ideal for the intended application. The board has a built on IMU sensor, LSM6DSM, which integrates an accelerometer and a gyroscope. The linear acceleration can be measured up to ±16 g (gravity of earth) and the angular velocity up to ±2000 dps (degrees per second) [
45]. The built-on magnetometer is not used, due to possible interference from external induced magnetic fields.
A 500 mAh LiPo (lithium polymer)-battery provides the power supply, which can be switched on and off via a slide switch. Nominal battery voltage is 4.2 V. In order to recharge the battery and provide long operating times a LiPo-battery-charger from Adafruit
® is used [
46]. This charger can be connected through a micro-USB (Universal Serial Bus).
For the connection to the supply voltage and programming possibilities of the STEVAL-Board a Breakoutboard is required. Therefore, a custom PCB (Printed Circuit Board) has been designed. An LDO (low drop-out voltage-regulator) is used, to provide a constant supply voltage of 3.3 V to the Breakoutboard.
The transmitted data from the sensor to the smartphone is processed with a smartphone application and forwarded to a Cloud Server System. This is used to file and store the measuring values in a database (see
Section 2.3 and
Section 2.4).
2.2.2. Mechanical Structure
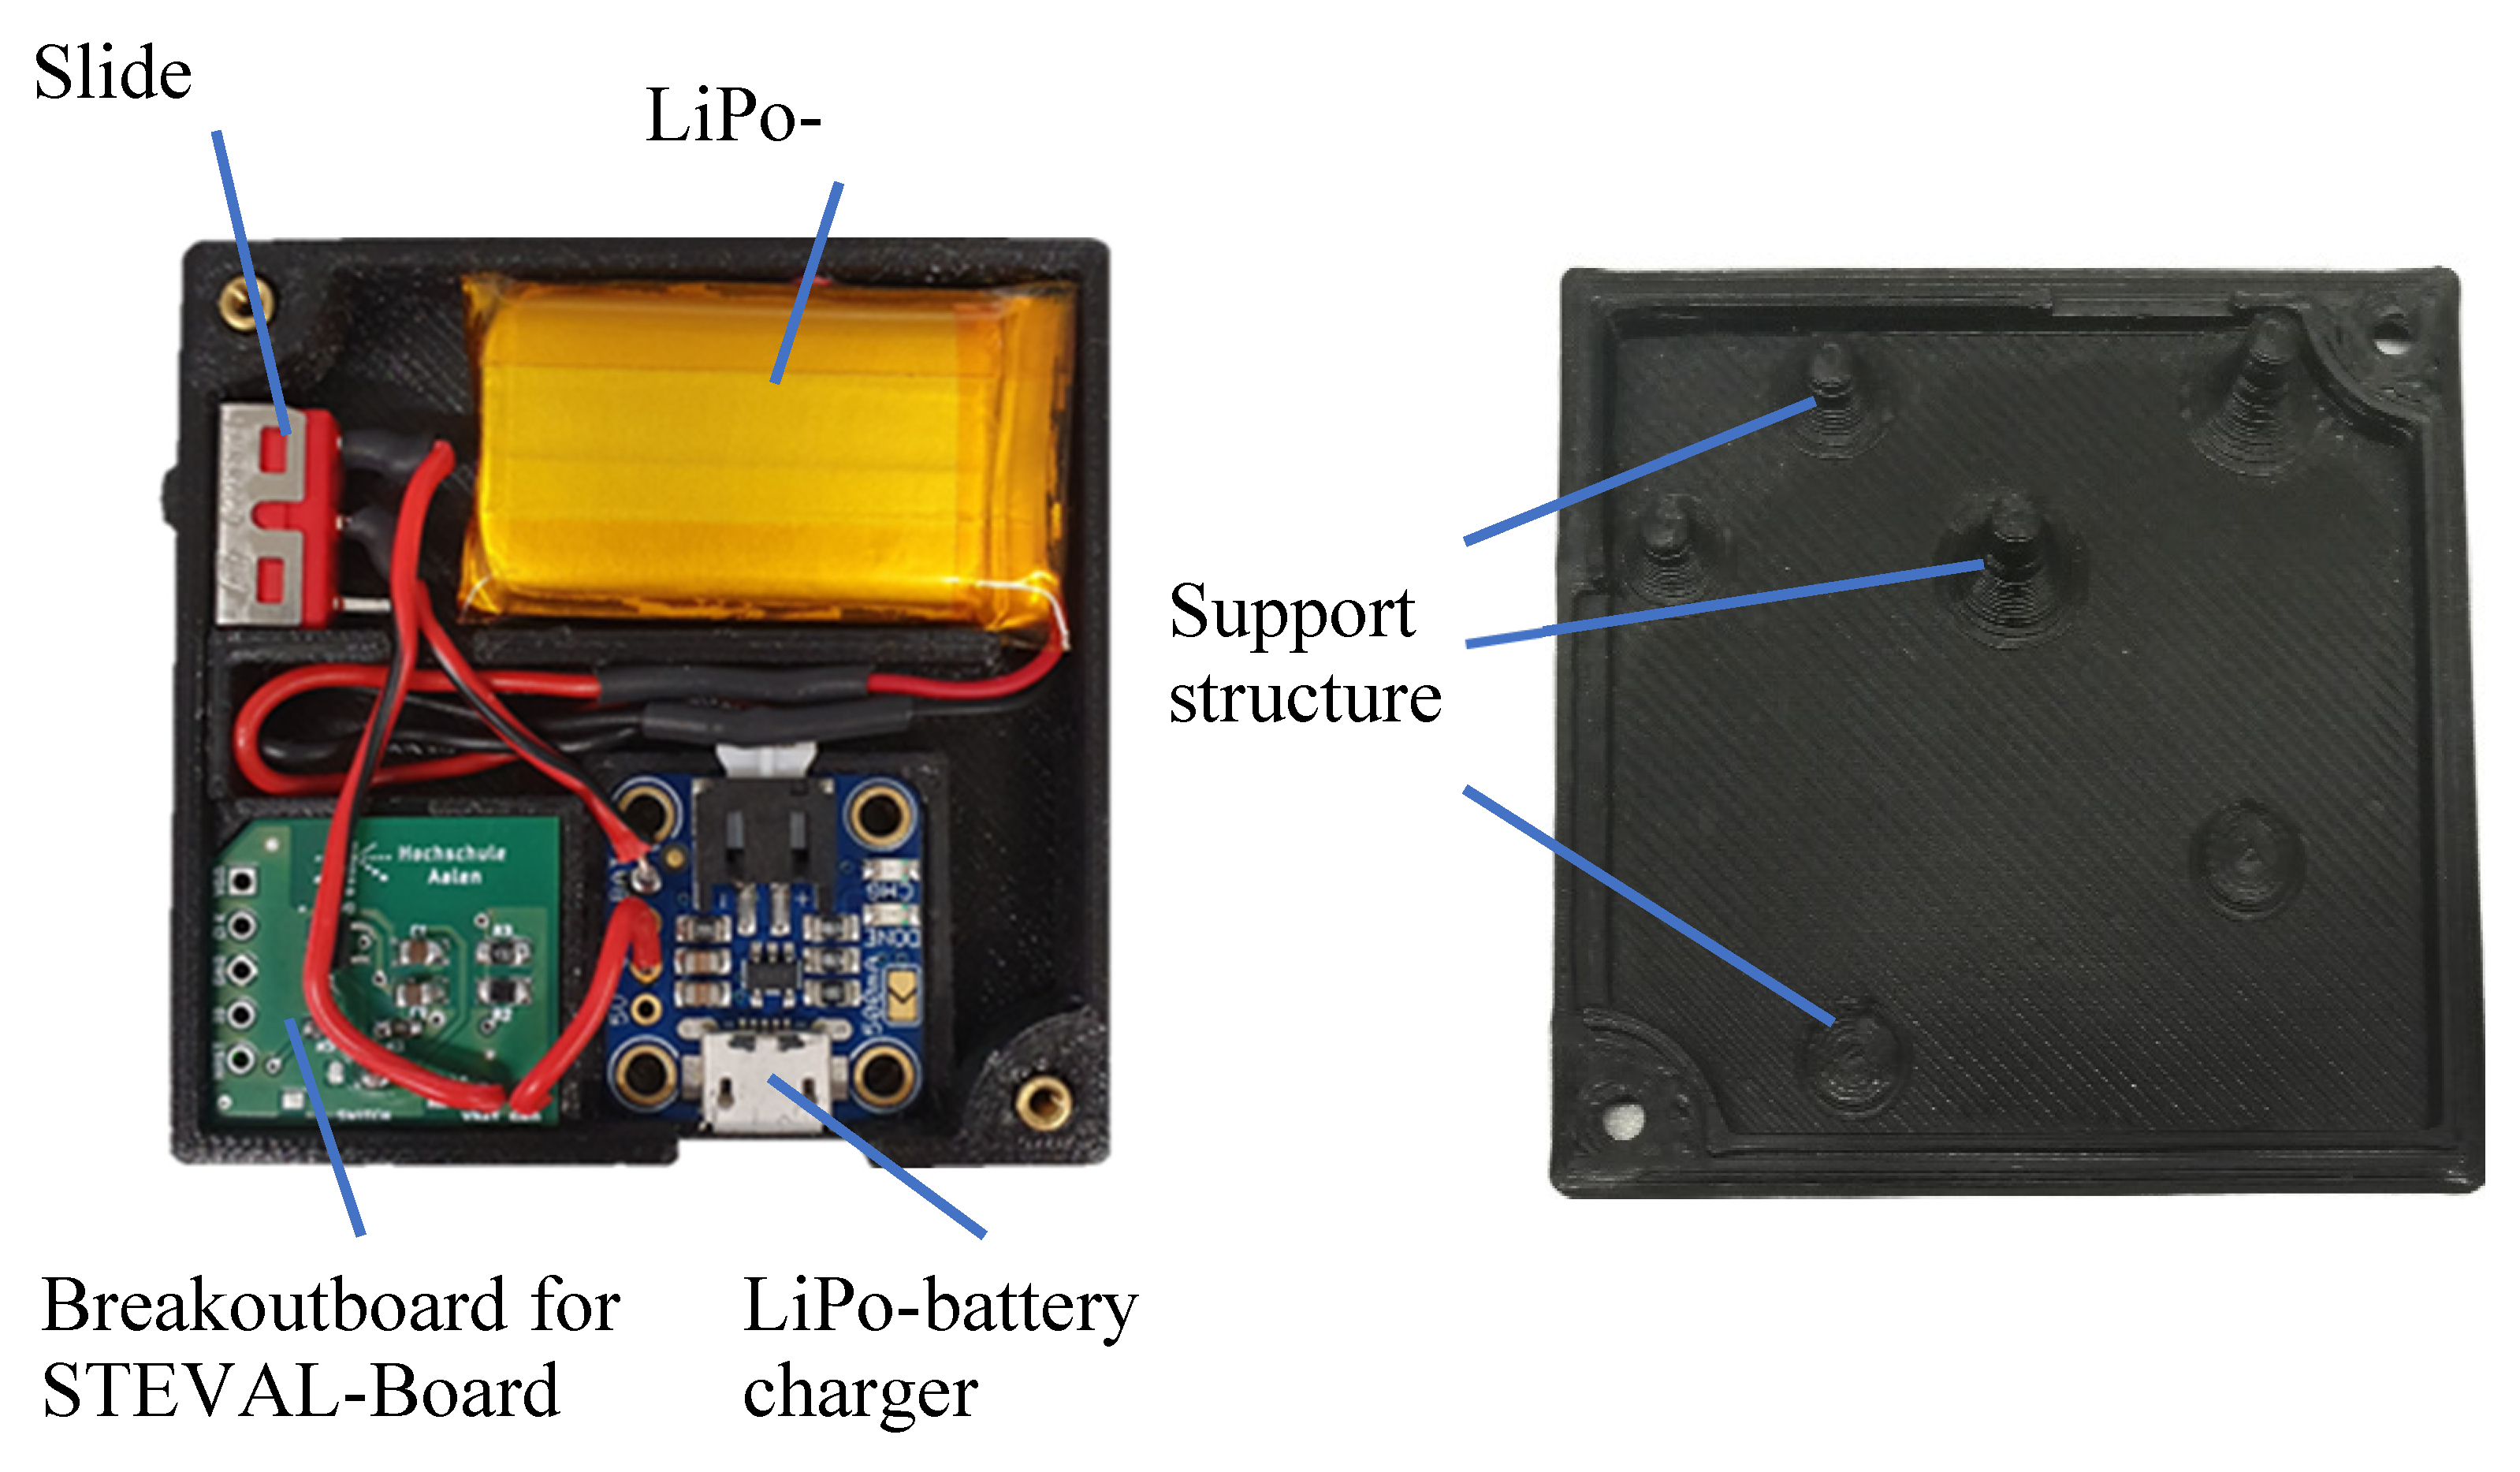
The electronic components are mounted in a 3D-printed housing, the Sensor Box. The bottom half of the housing provides cutouts and guides for components and cables. One corner of the custom PCB is cut at an angle, which prevents the PCB from being inserted incorrectly in the housing. The PCB has an overall size of 17.5x20 mm. The housing also provides openings for the slide switch and the USB connector of the LiPo-charger.
The top half provides support structures to ensure that the components do not move during measurements. While the Sensor Box is closed, these support structures are in contact with the components and hold them down securely.
The Sensor Box has the final dimensions of 53.2 mm in length, 52.5 mm in width and 11.6 mm in height. Figure 4 shows the 3D-printed housing with the fitted components.
2.2.3. Sensor Firmware
The firmware of the sensors is implemented in the C language with the following main functions:
Reading values from the built-in accelerometer and gyroscope
Observing the inclination of the sensors by fusion of the accelerometer and gyroscope data
Transmission of measurements to the smartphone application using GATT (Generic Attribute Profile) characteristic notifications.
The sensors interface with the smartphone application is using the BLE GATT protocol. All interactions between the smartphone app and the sensors are mapped to GATT services and characteristics. Therefore, the following GATT-Services are provided:
The “Metric” service provides the sensor data. For each type of sensor data (acceleration, angular velocity, inclination) a GATT-characteristic is defined, which can be subscribed by the smartphone app. Furthermore, a GATT-descriptor is added to each characteristic, describing the scale and unit of the provided metrics. Using the descriptor, the full-scale of the device can be reconfigured, without reprogramming the scaling in the smartphone application.
The “Version” service provides the firmware version running on the sensor. It features two characteristics, one for reading the major and minor version number, and one for the exact build revision.
The “Control” service is used to imperatively trigger different processes in the sensor firmware. Each characteristic of the service maps to an action in the sensor firmware. For now, it is only used to trigger the self-calibration function.
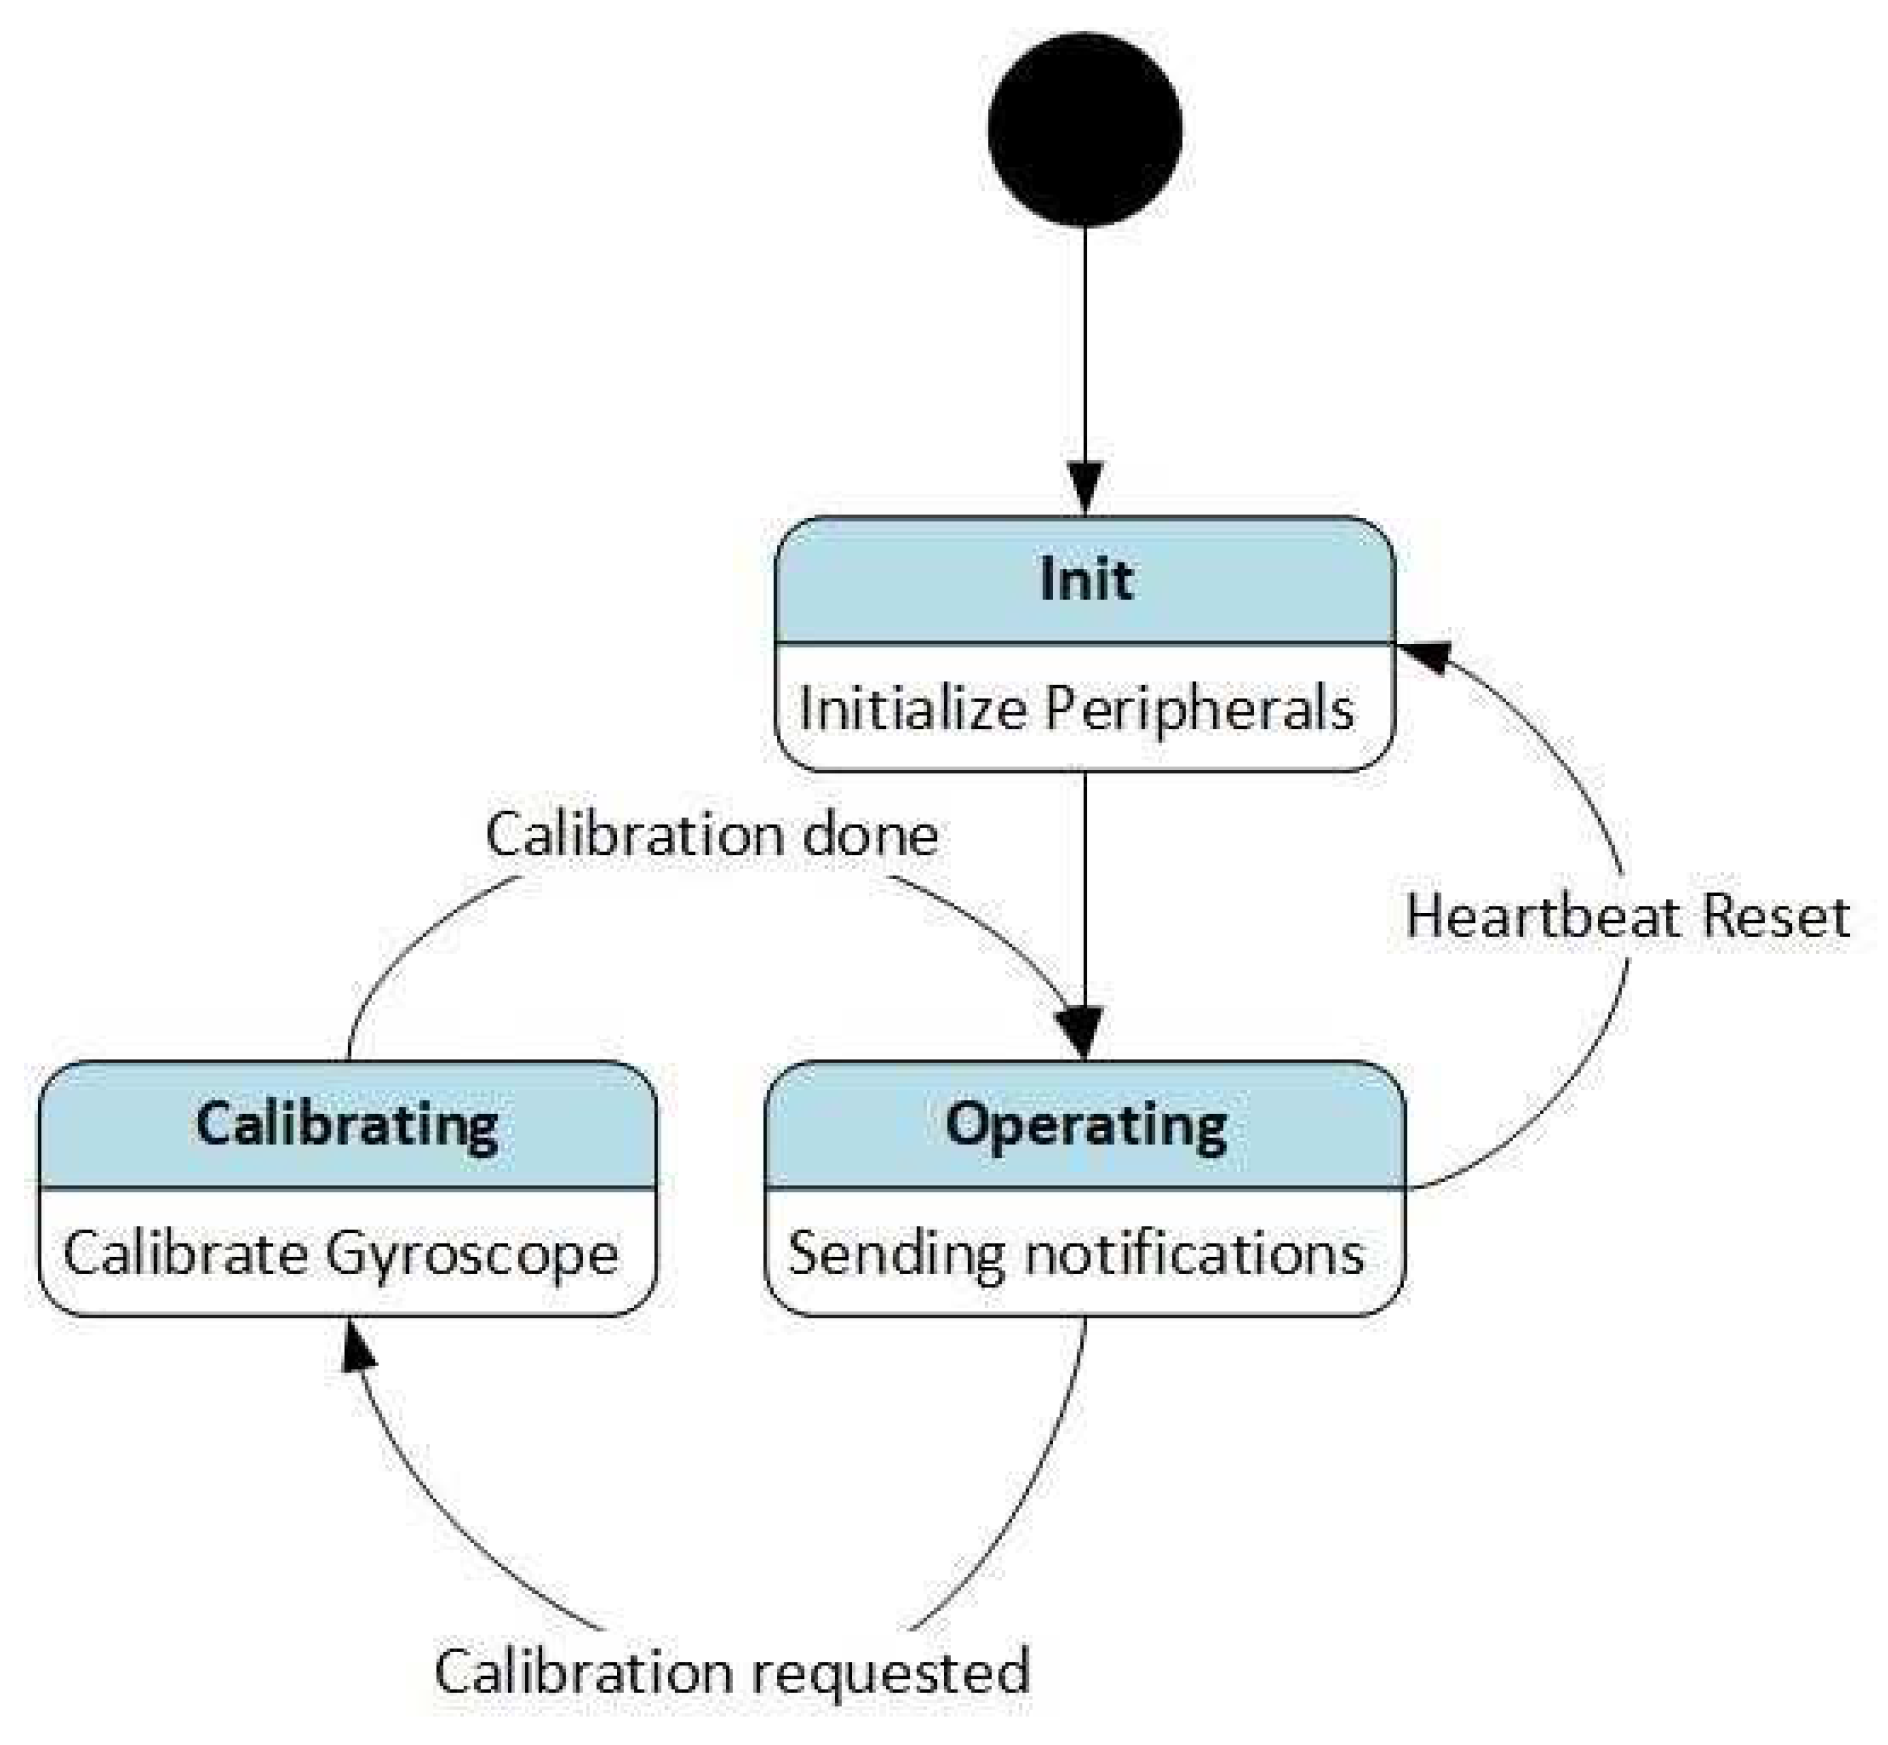
Figure 5 illustrates the main state machine of the sensor firmware. On reset, the system goes into the Init state. In the Init state, the microcontroller and its peripherals are configured. After initialization, the system goes into the Operating state. In the Operating state, the sensors are read, and notifications are updated. The user can trigger self-calibration of the sensors via the “Control” GATT-service. During self-calibration, the offset in the gyroscope values is calculated while the sensor is in a stationary state. This offset is then stored in flash and applied to all subsequent sensor readings. When calibration is finished, the system goes back into the Operating state, resuming characteristic updates. During operation, the sensors are calculating their orientation using an Extended Kalman Filter (EKF) based observer algorithm. The observer estimates the direction of the gravity vector, from which the inclination of the sensor is derived. The inclination is published via the ‘Inclination’ GATT characteristic in radians as a 32bit floating point number.
The average frequency of walking is between 1.5 Hz and 2.5 Hz [
47] and can go up to 4.5 Hz while climbing stairs [
48]. According to the Nyquist-Shannon Sampling Theorem the sampling rate of the system must be at least 9 Hz to record the gait pattern of a subject correctly. Depending on the number of sensors connected, the sensors reach a sampling rate from at least 20 Hz (with four sensors) up to 50 Hz (with two sensors).
2.3. Smartphone
Communication between the smartphone application and the sensors is implemented using a BLE-GATT service. The service features two characteristics: One for the accelerometer, and one for the gyroscope. To receive updates from them the smartphone application subscribes to these characteristics and is then asynchronously notified about incoming sensor value updates. The smartphone application consists of two parts, an App and a Service. The App provides a user interface for interacting with the sensors. The App allows to connect, disconnect, and calibrate the sensors. Since the data recordings are long-running processes, they are implemented in a Service. A Service is a background-process, which may be executed even when the device display is off. The Service is used to silently collect sensor data via BLE without needing any interaction with the user.
The data packets received from the sensors only contain relative timestamps. The smartphone clock is used to give the relative timestamps an absolute reference. When the first packet from a new sensor arrives, the relative timestamp in the packet is subtracted from the absolute timestamp of the smartphone at the time of receiving. For each future packet received from the same sensor, this time reference is added onto the relative timestamp.
2.4. Cloud Server System
The Cloud Server System has the responsibility of persistent data storage, while keeping the data accessible, integer and consistent. The consistency and integrity requirement can be met by using a database management system and a well-defined data model. A MySQL database management system is used for this purpose. To enable cross-platform access to a database system, an interface application based on web technologies is a convenient choice. Therefore, the system communicates using the Hypertext Transfer Protocol (HTTP), which is the standard protocol for web applications. To achieve high accessibility, an architecture which allows for fast deployment and updatability is developed. The clients interacting with the Cloud Server System are connected via public, mobile networks. The Cloud Server System is listening on a public IP Address. When exposing the application to the internet, data security becomes an immediate concern. To prevent unauthorized access to the system all communications are encrypted and an authentication and authorization system is used.
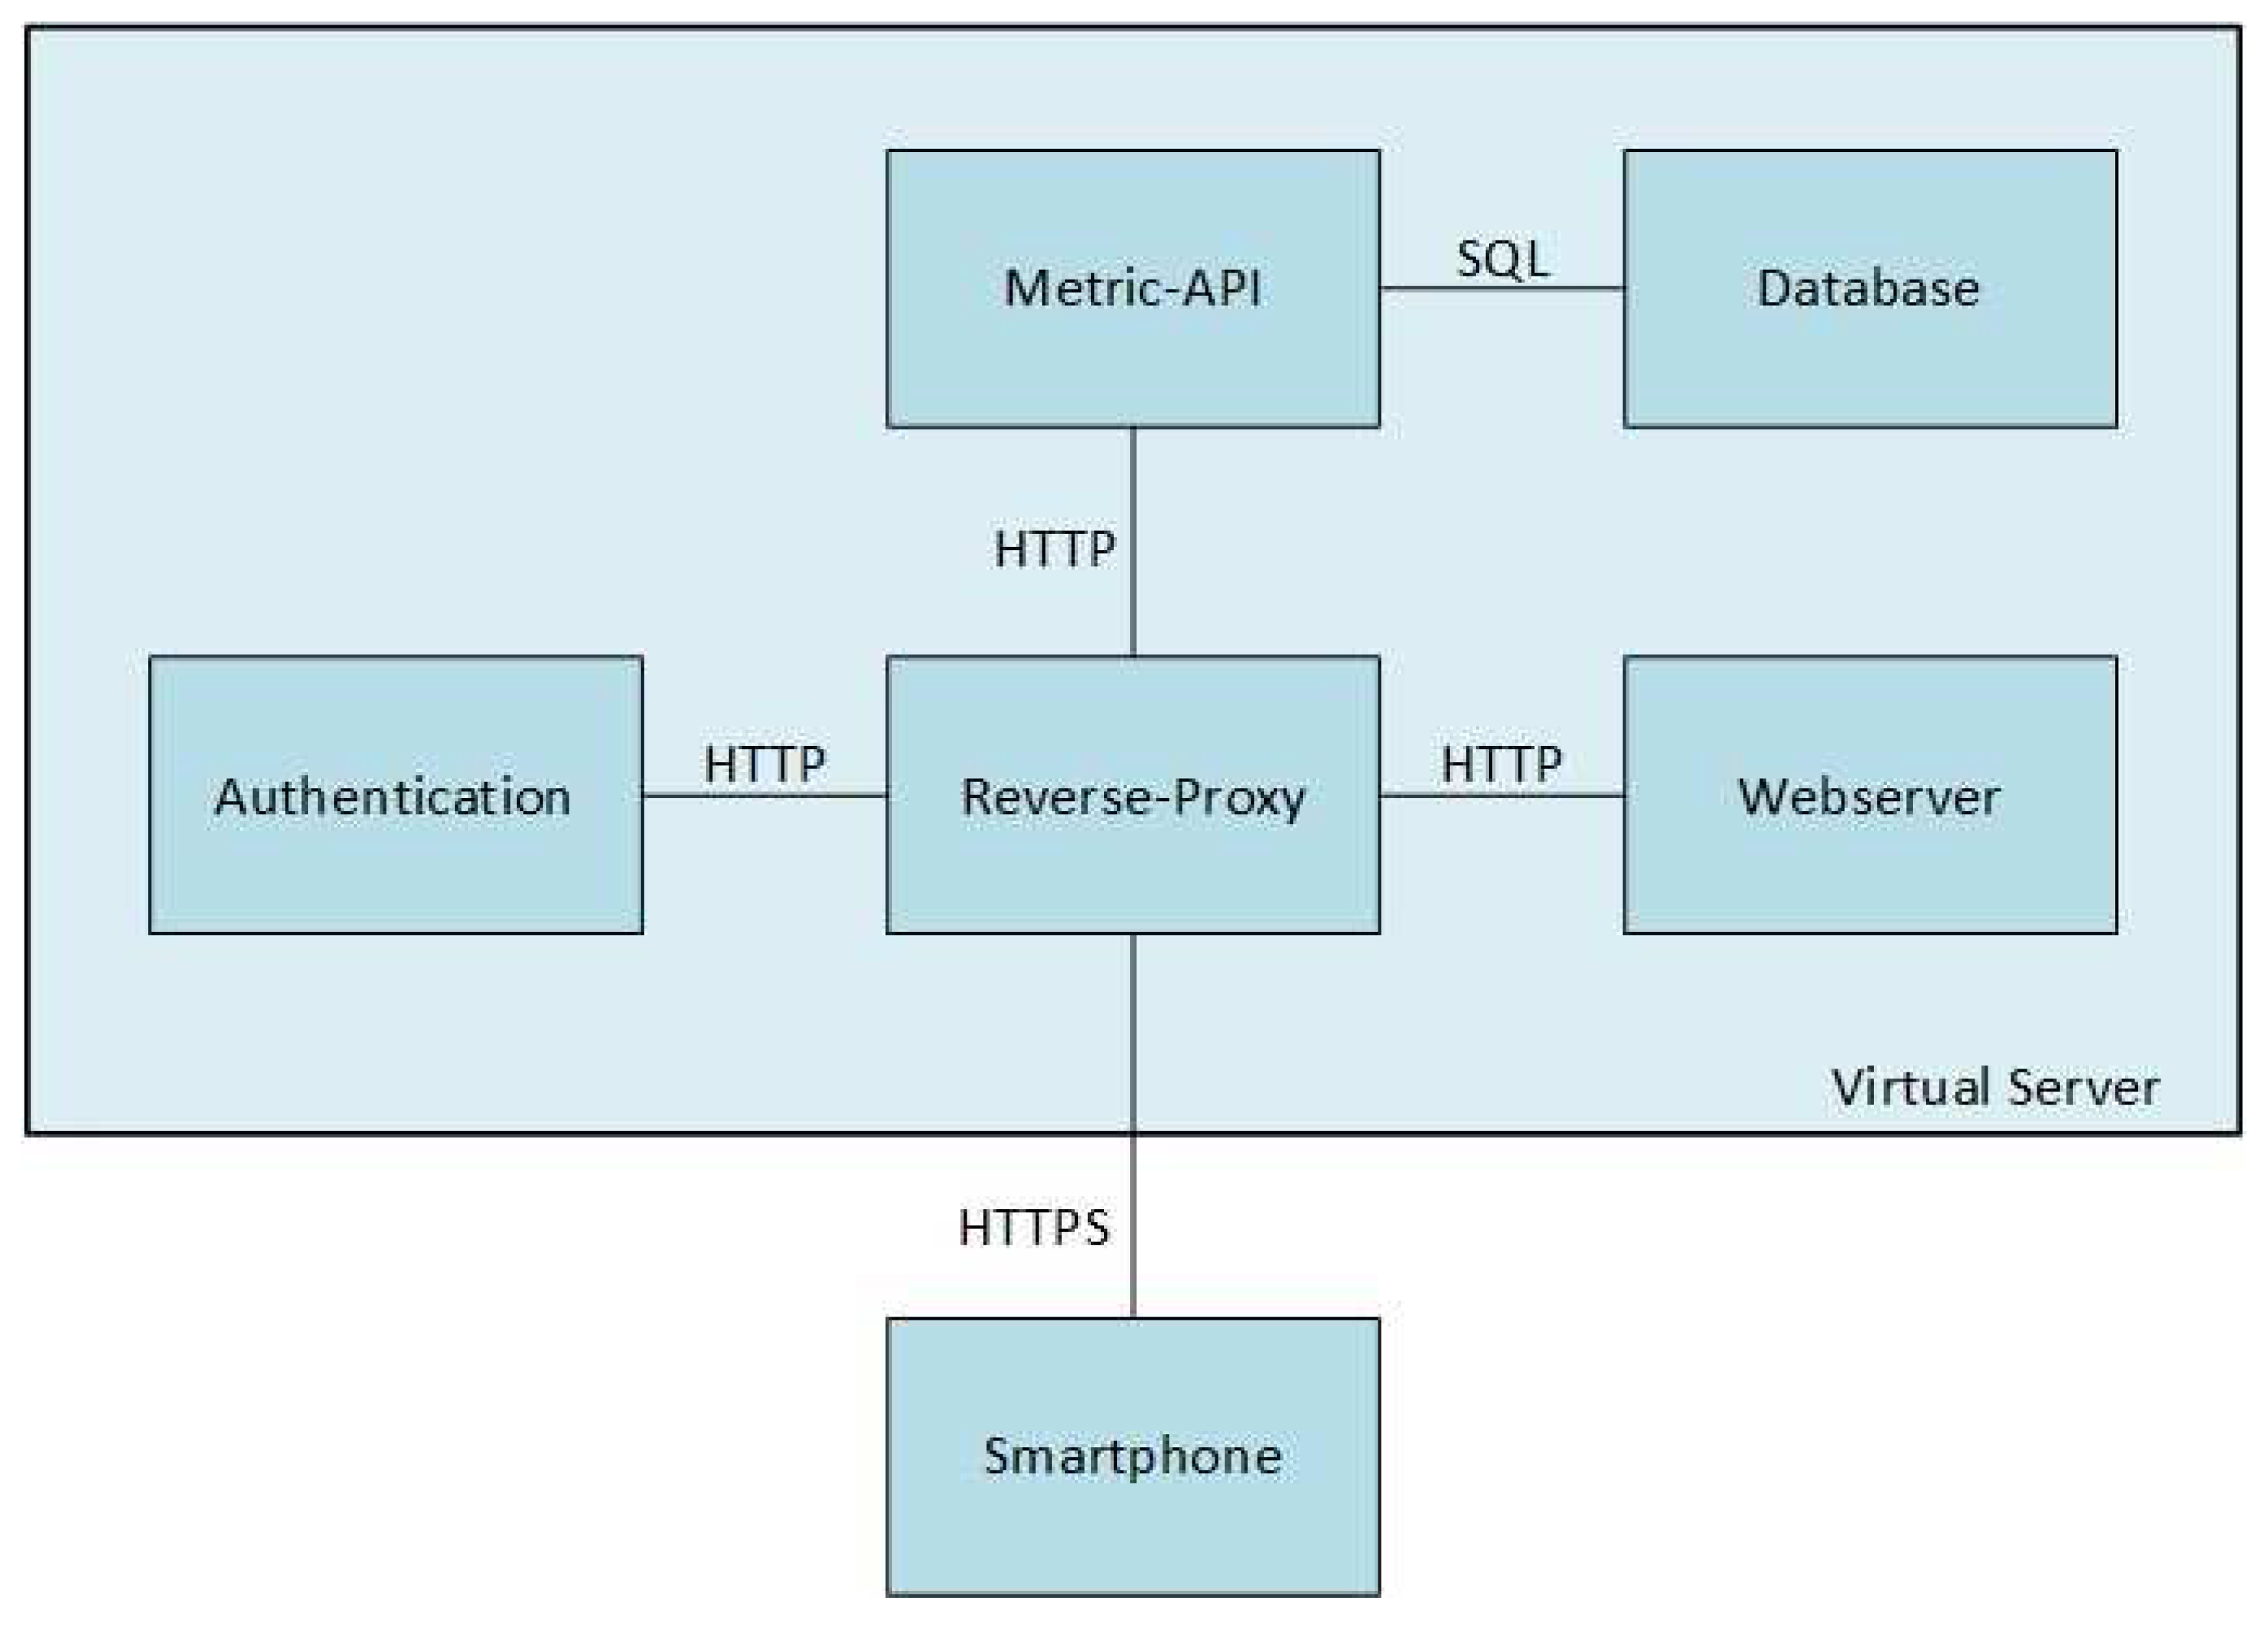
Figure 6 shows the proposed Cloud Server System architecture. For simple interaction, the system acts as a single HTTP Server towards the client. Internally, the system is implemented as a docker container network. Each container runs specific services, each responsible for enabling distinct functions of the system. All containers can be maintained and updated individually. This allows incremental updates, without needing to shut down the entire system. All services are connected to the clients via HTTP based Application Programming Interfaces (APIs). However, from a client’s perspective, it is easier to communicate with a single server offering all these services. The API-Gateway is a reverse proxy addressing this issue. Depending on the path of the request, the request is relayed to the service handling it. To ensure data security, the API-Gateway uses Transport Layer Security (TLS). The API-Gateway decrypts the incoming HTTP messages and relays the unencrypted message to its destination service. This way, while the services are not handling security themselves, the API-Gateway ensures that no unencrypted data can leave the system.
The API-Server container hosts the Metrics-API, responsible for accessing the database. The Metrics-API provides one endpoint for each type of measurement, each reachable on a distinct HTTP path. A corresponding database table exists to each endpoint. The scheme of this table describes the measurements datatype. When inserting a datapoint, the body of the clients’ request contains a JSON (Java Script Object Notation) document, which contains an array of JSON objects, each representing a single measurement. When retrieving datapoints, the body of the HTTP response contains the datapoints in the same format. To support selective retrieval of the datapoints, the endpoints provide filter options for each column of the datatype in question. The supported filter operators depend on the column datatype. A text value can only be compared for equality. For numerical types, the column can be filtered using a comparison value, with either an equality, greater than, or less than operator applied. To filter a range of values, both a greater than and a less than operator can be applied to the same column. The filters are passed to the API with the HTTP requests query string.
2.5. Material Costs
The approximate costs of materials for one Sensor Box of SensAA are listed in
Table 1. The total costs are below 70 €. These costs relate to the prototype implementation of the system. The costs for series production of the Sensor Boxes can be assumed to be much lower.
2.6. Verification
To verify the proposed measurement system, several tests are carried out, which ensure that the set requirements are met and that correct measurement results are achieved. The verification includes a Battery Life Test, a Pendulum Test, and a Treadmill Test.
2.6.1. Battery Life Test
The goal of the Battery Life Test is to verify whether the battery-based power supply of the Sensor Boxes is sufficient for long-term recording. The Sensor Boxes need to be able to record and transmit data over a complete day, at least 16 hours (cp.
Section 1.3). For this purpose, two sensor modules are switched on and connected to a smartphone via the Bluetooth
® Low Energy interface. This starts the data acquisition and the test. The smartphone is logged into the Cloud Server System and continuously delivers measurement data. The sensors remained stationary during the test. The sensor board has a supply voltage of 3.3 V. When the voltage drops below this threshold, the sensor turns off and the recording stops. This timepoint can be determined precisely since the data is recorded with absolute timestamps. The consumed battery power of the smartphone (in %) and the sensors (in V) are recorded regularly in a one-hour interval.
2.6.2. Pendulum Test
The goal of this test is to verify the EKF based observer algorithm and to determine the accuracy of SensAA (see
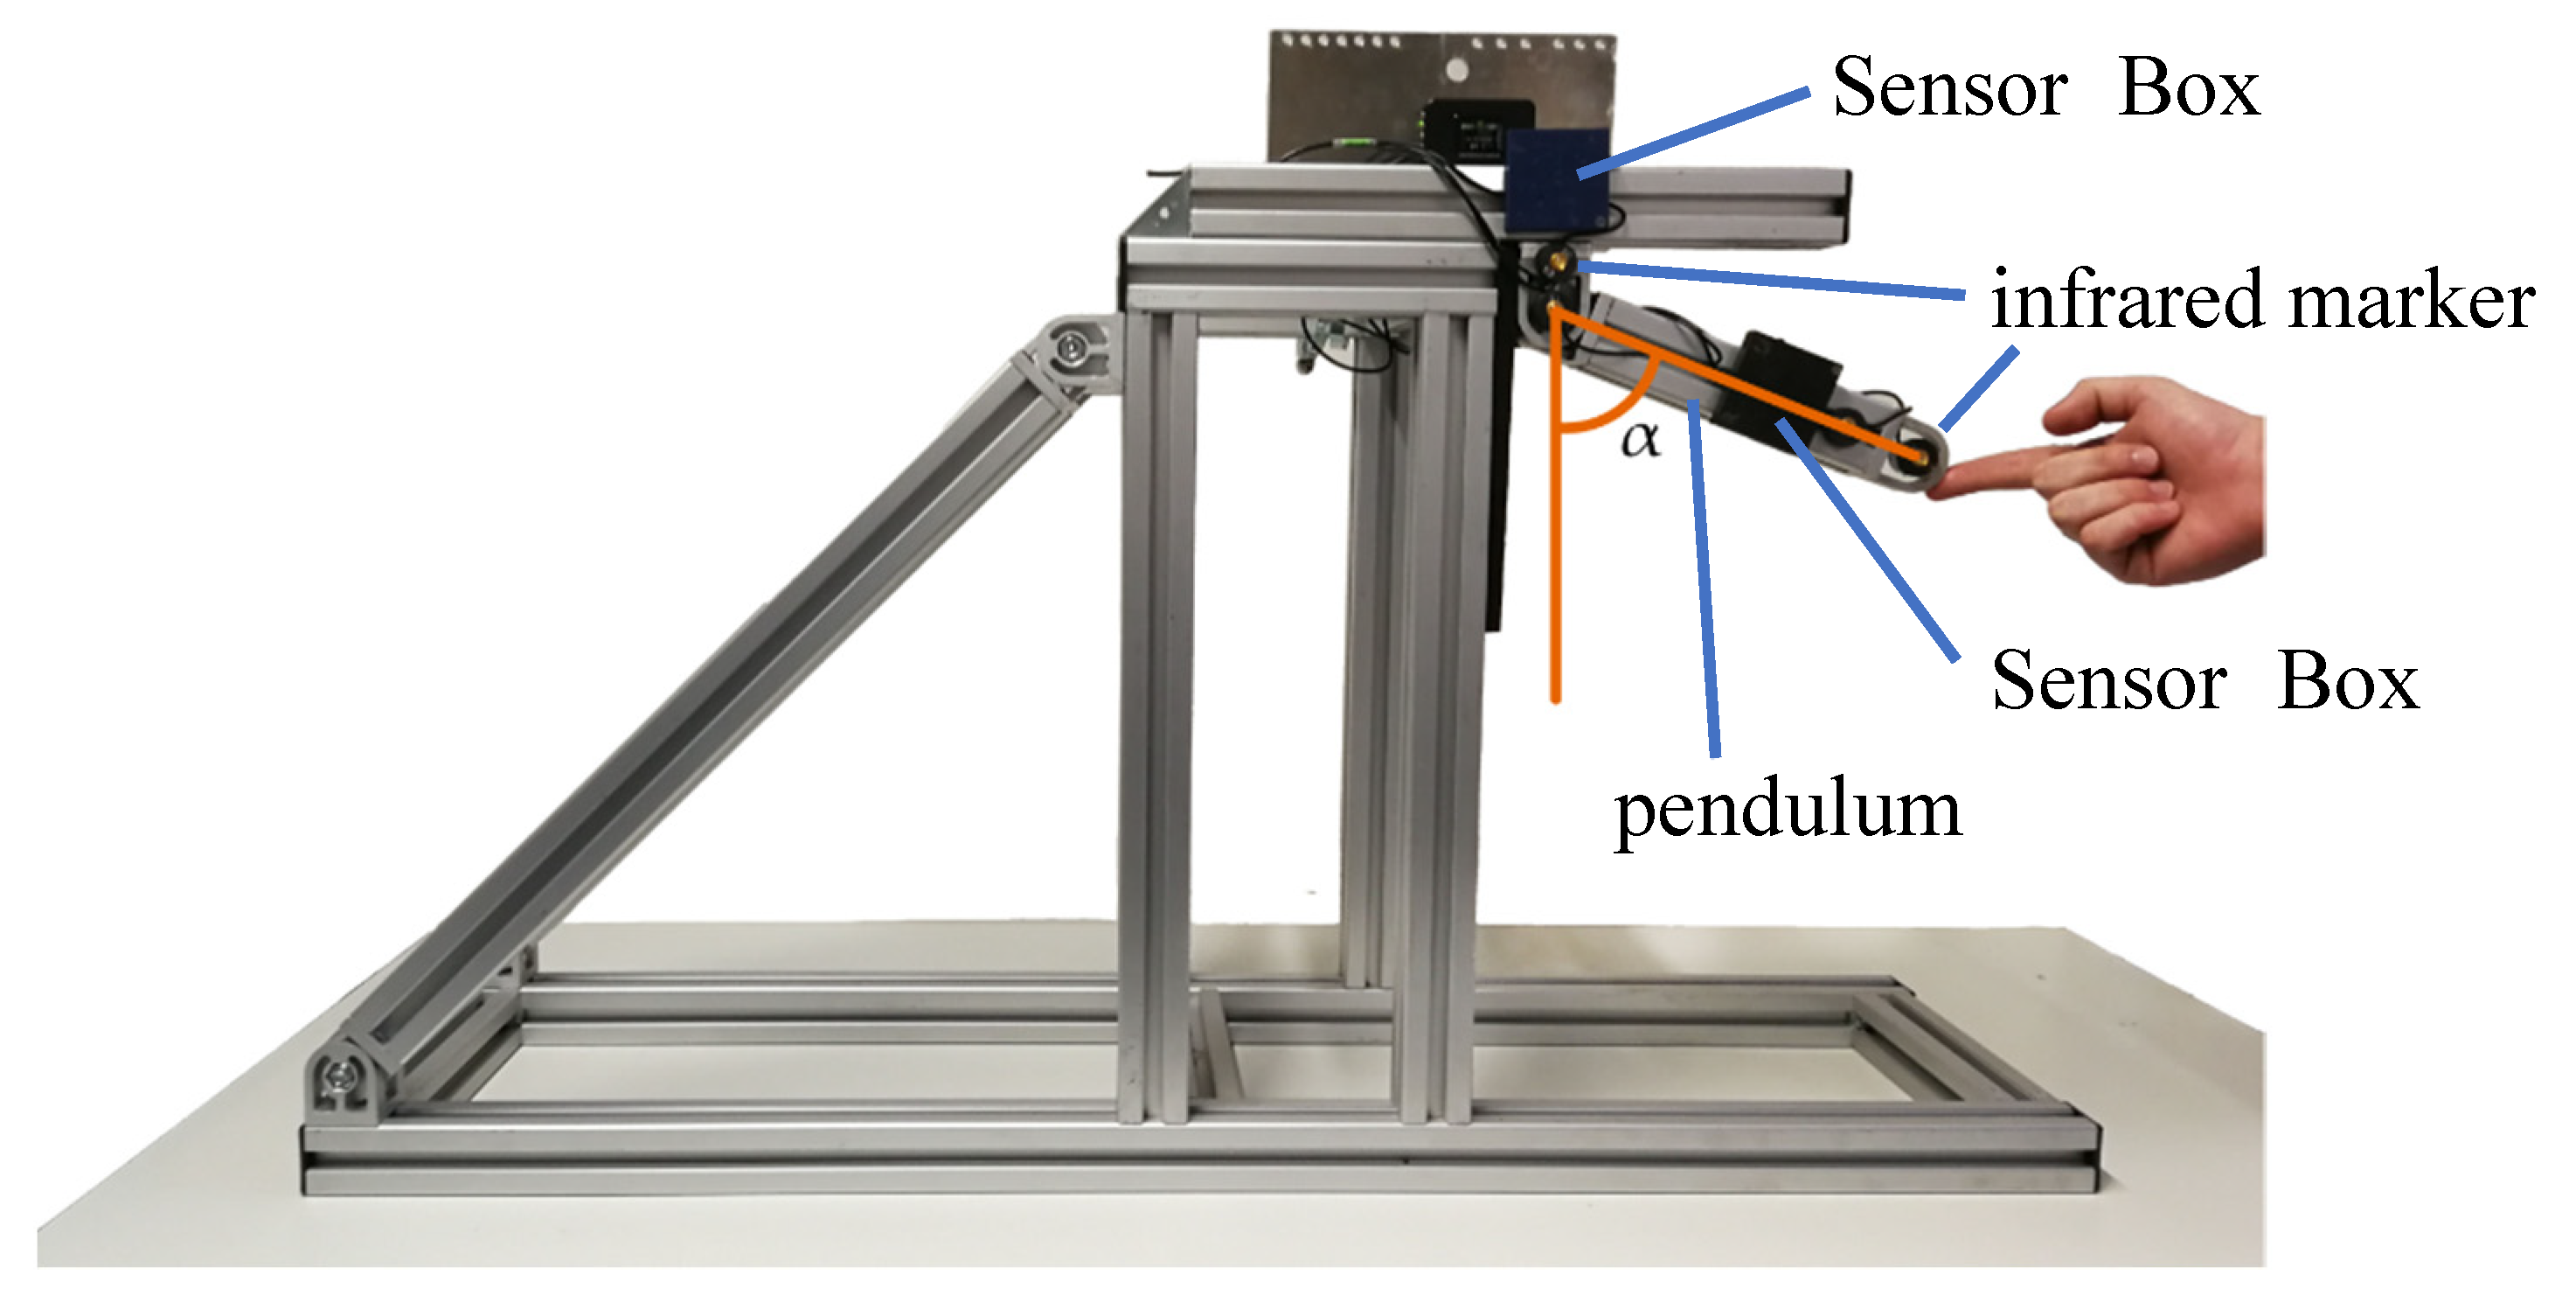
Section 2.2.3). Two wearable Sensor Boxes are attached to a test setup (see
Figure 7). One Sensor Box is fixed along the vertical axis, while the other is mounted on a free-swinging pendulum. The angle
in the figure denotes the angle measured by the system. For this experiment an optical MAS (LaiTronic GmbH, Innsbruck, Tirol, Austria, former Steinbichler) is used as reference for comparing the measurement data (cp.
Section 1.2.1). The infrared markers are attached to the vertical axis and the far end of the pendulum and therefore the MAS measures the same angel as the wearable sensors. The sampling rate of the MAS needs to be configured for the test setup. The maximum sampling rate of the system is limited by the distance to the markers. Here, the MAS is set up about three meters away from the test setup. In this configuration, a sampling rate of 220 Hz resulted in clean measurements of
.
2.6.3. Treadmill Test
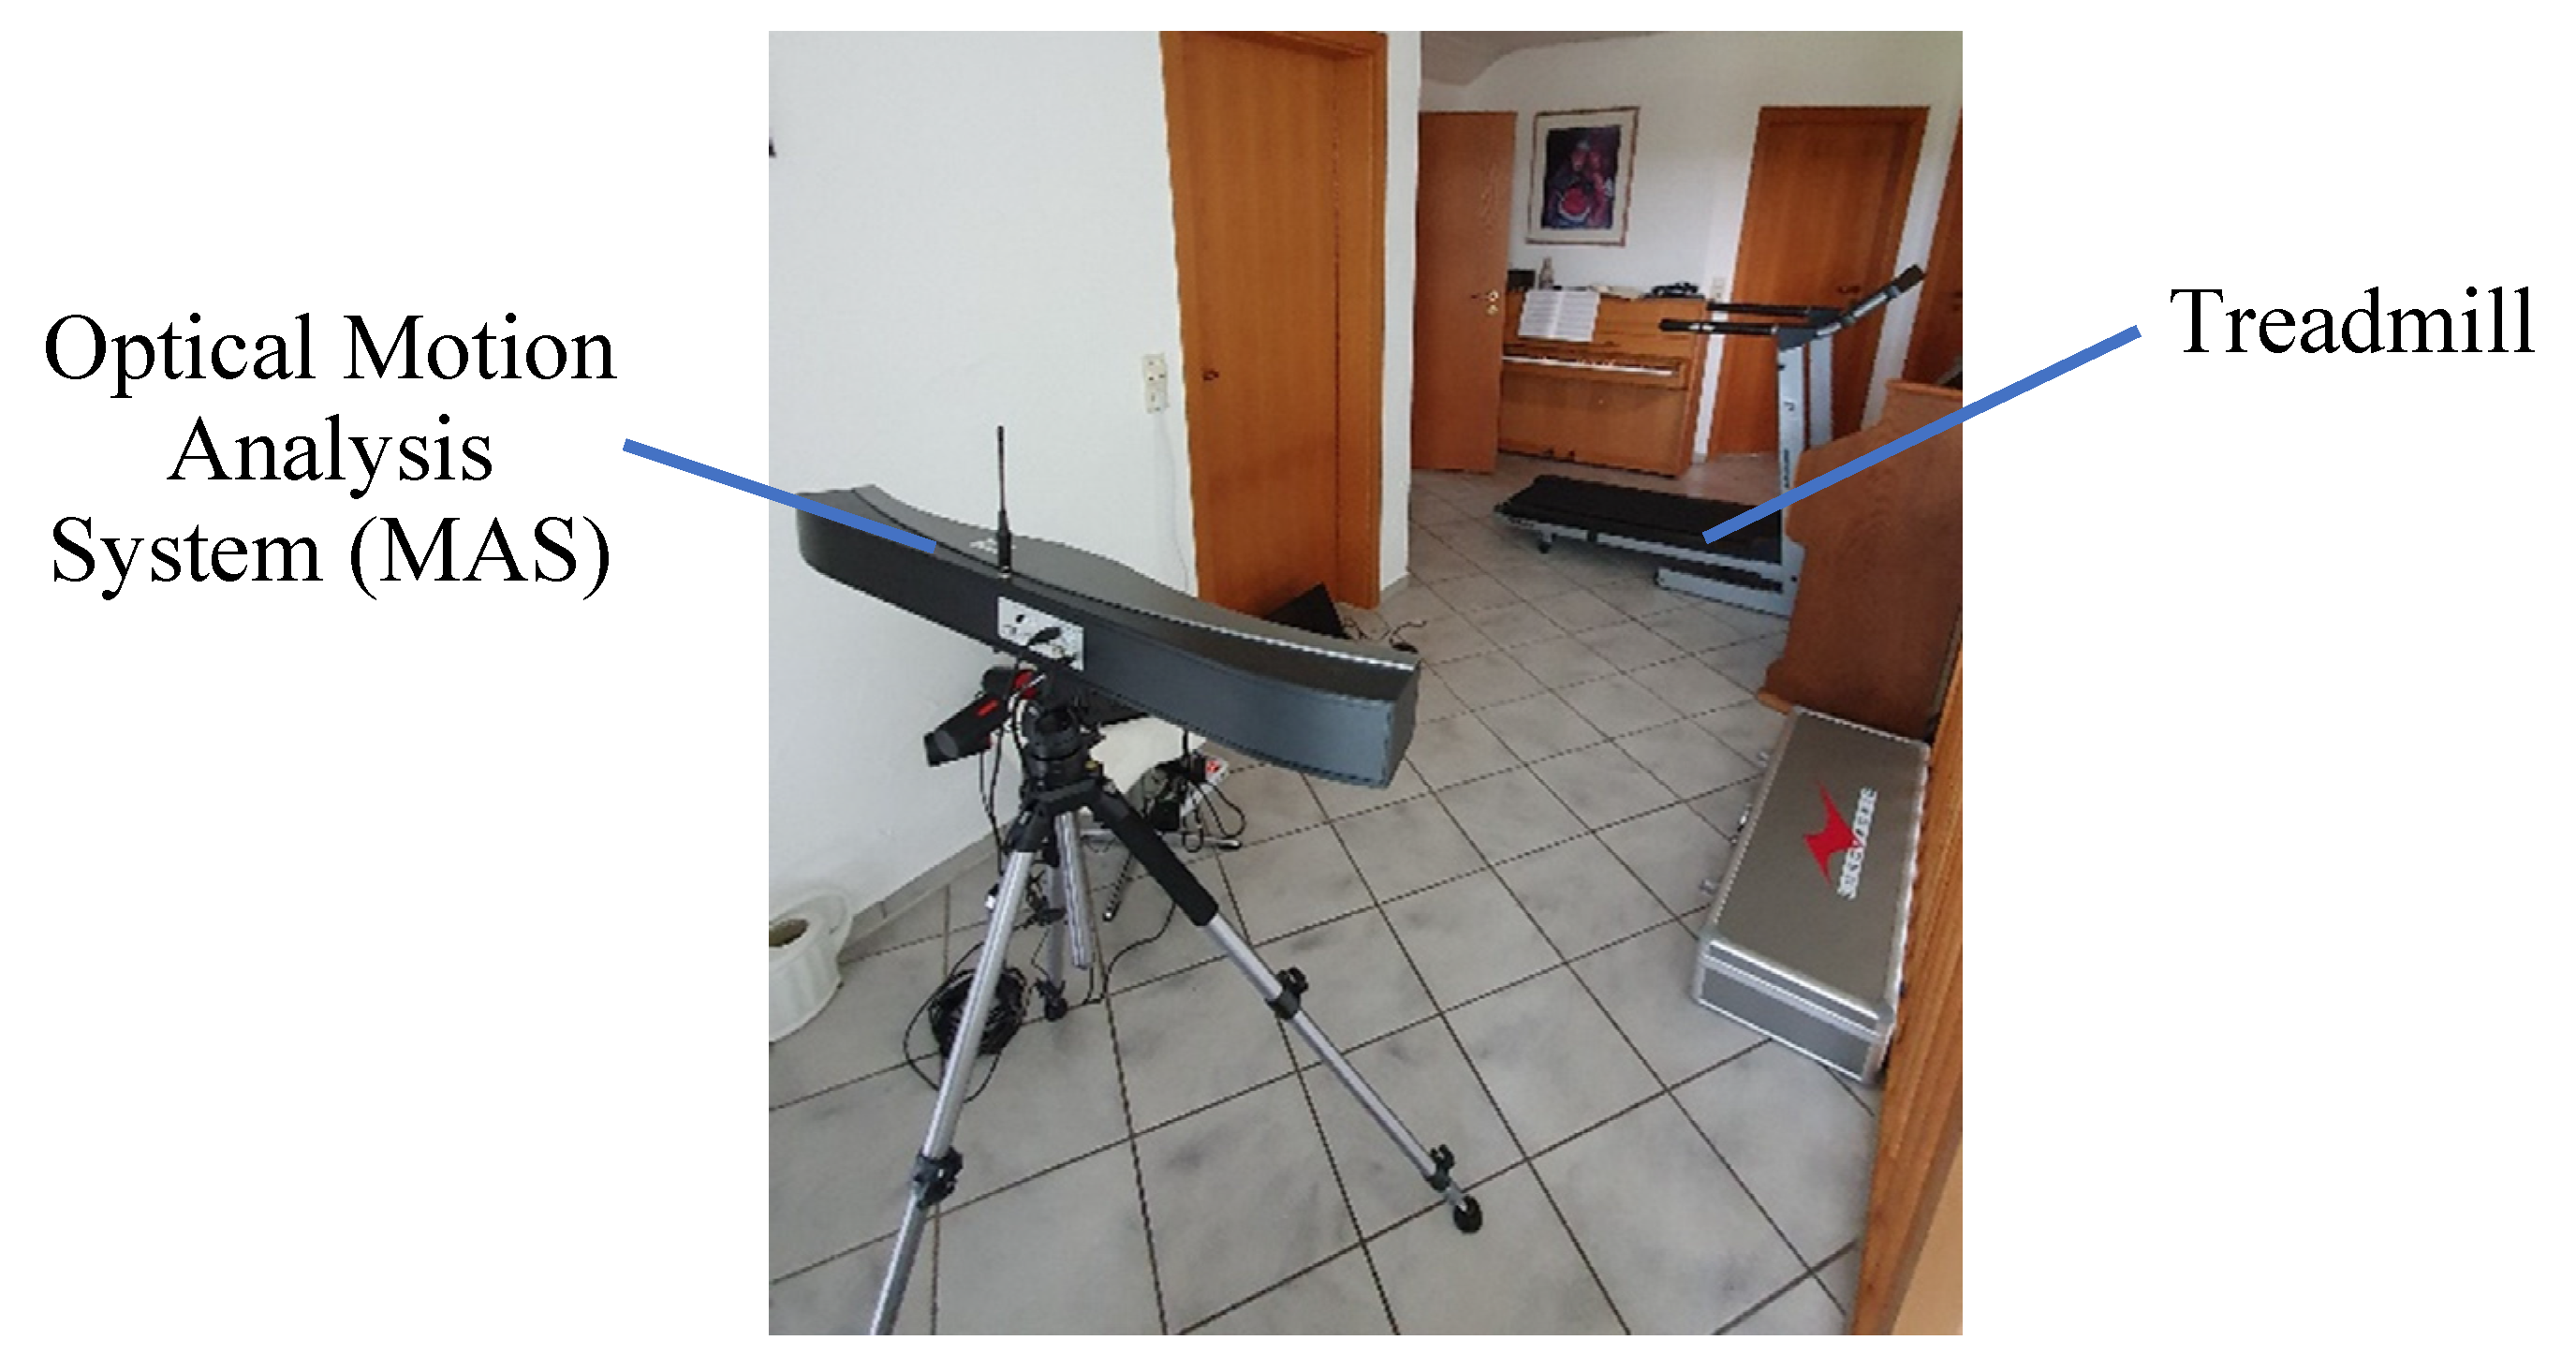
The measurements on a treadmill are intended to test the behavior of the sensors under real conditions, when walking at different velocities. The goal is to compare the angle progression measured by SensAA with that of the MAS. The setup of the treadmill test is shown in
Figure 8.
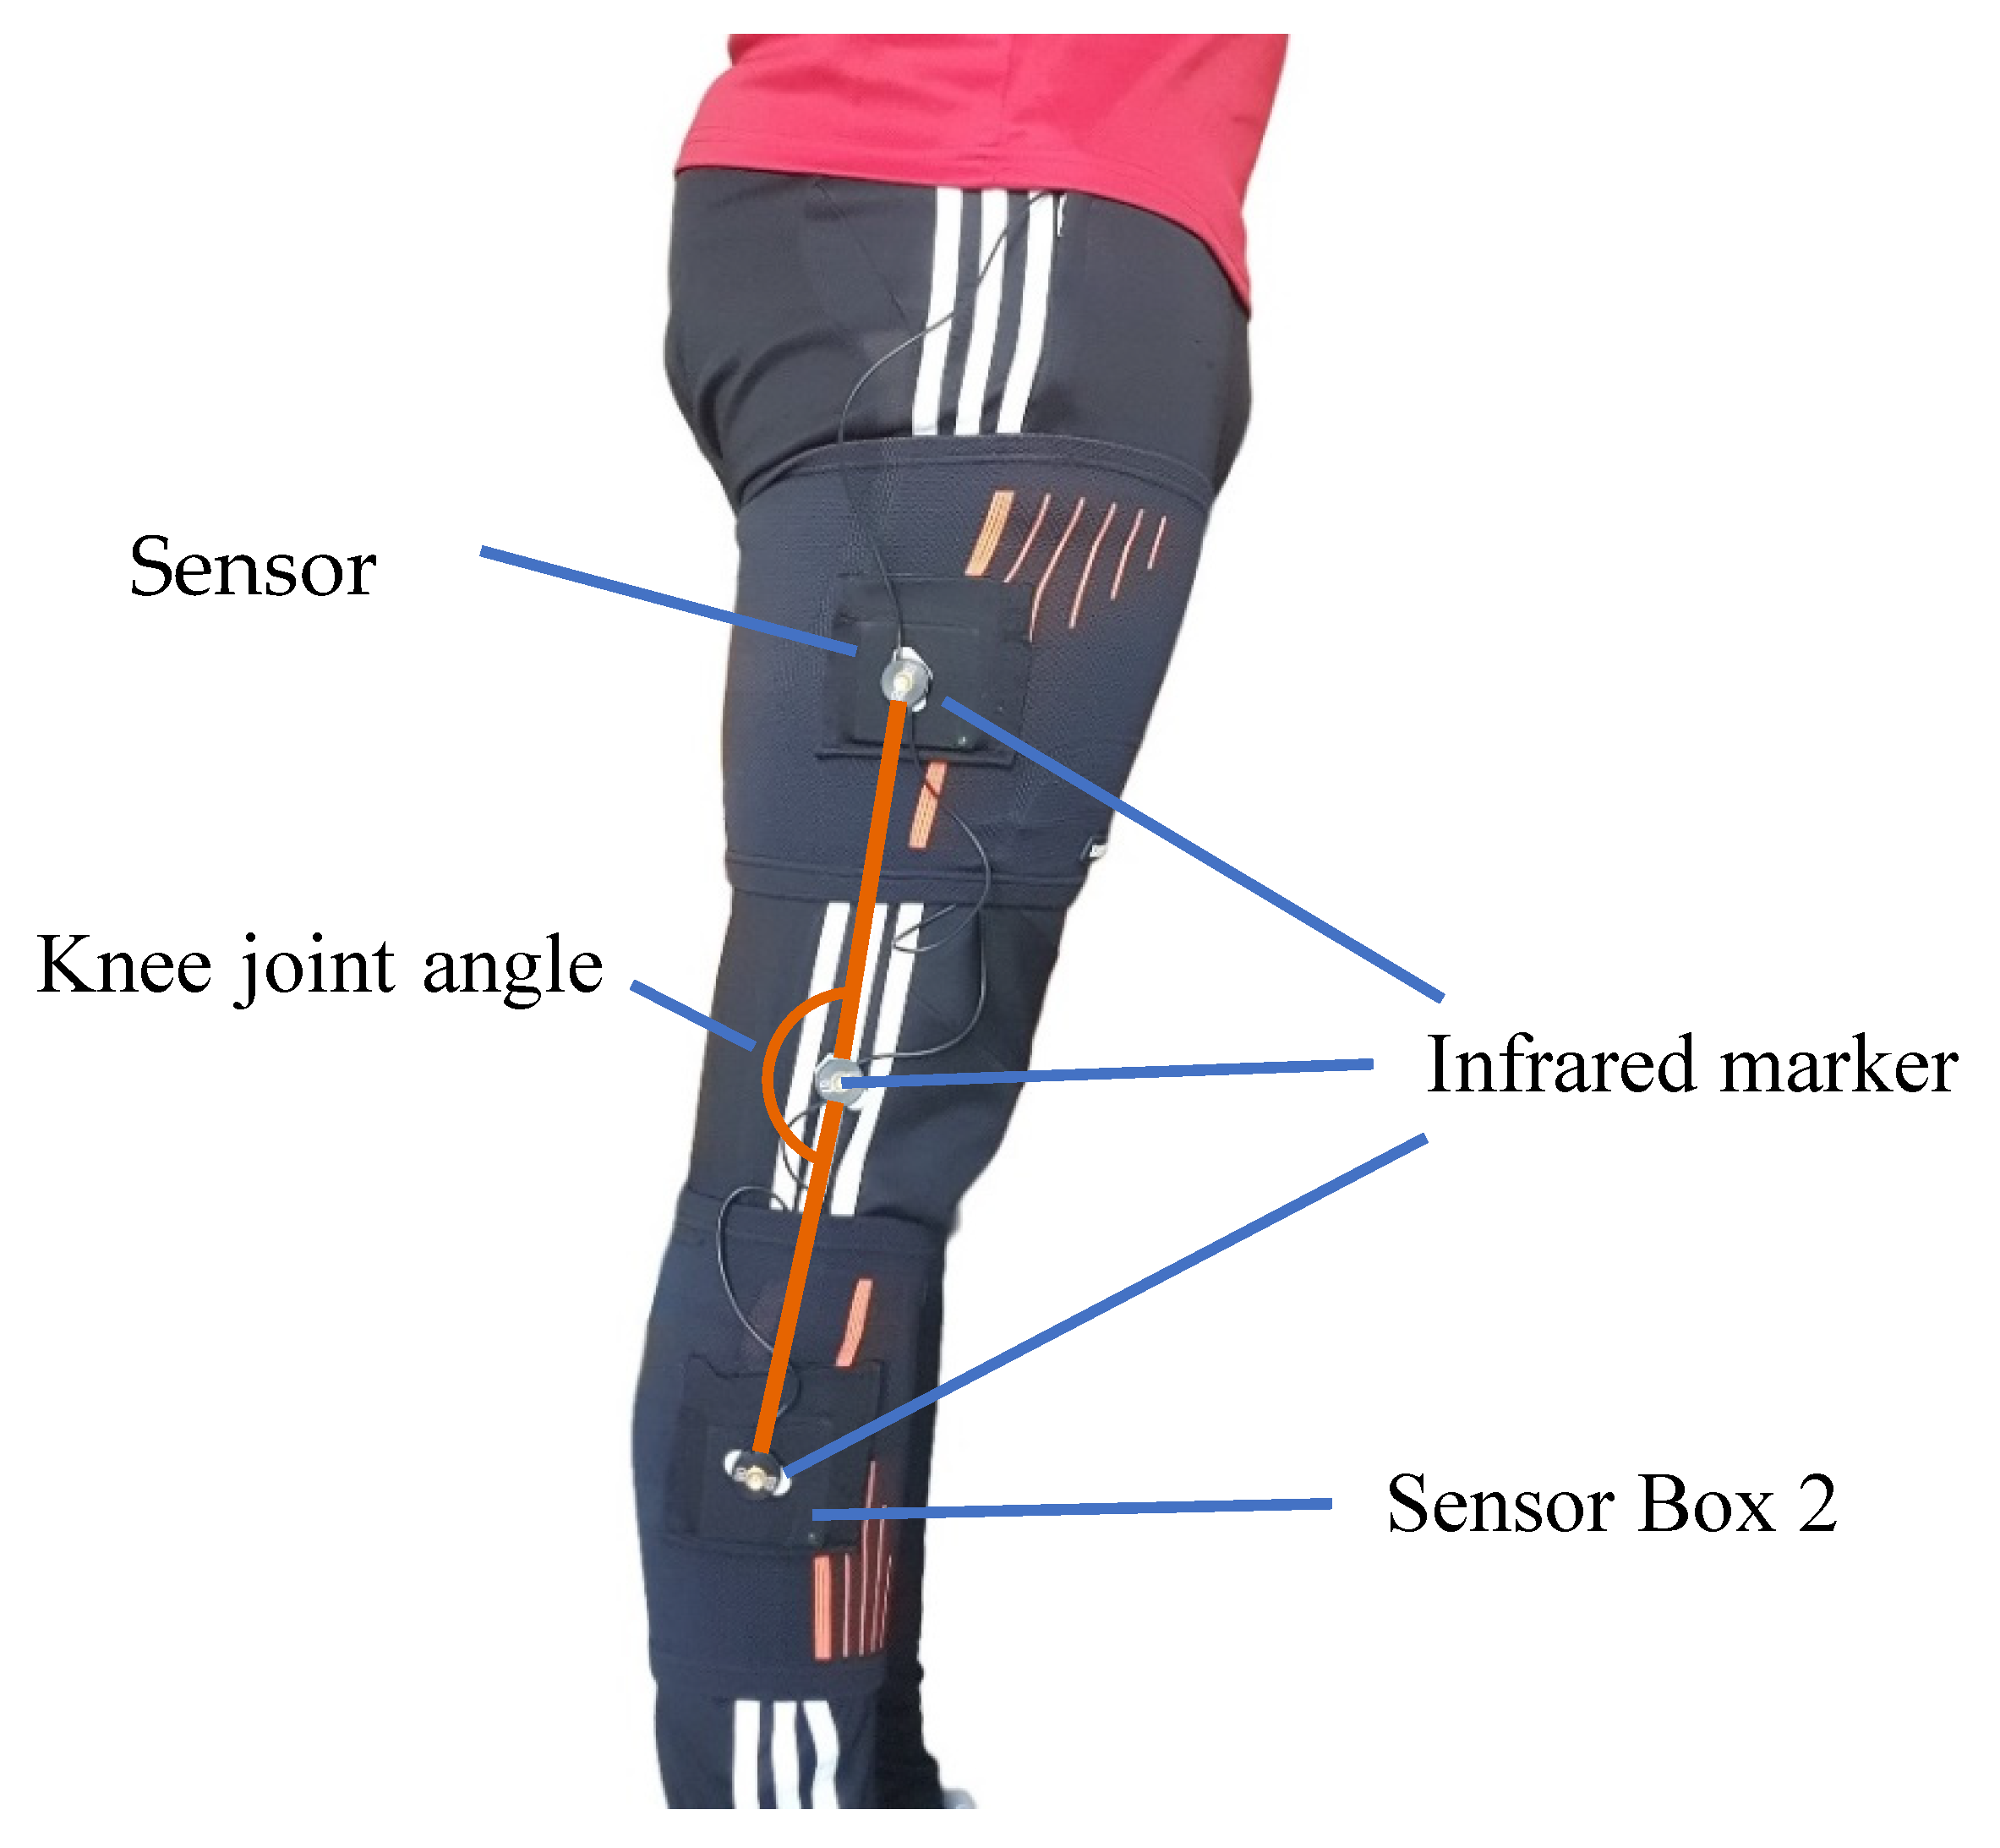
The wearable Sensor Boxes are attached to a healthy subject’s thigh and shank of the right leg with bandages. As shown in
Figure 9, the infrared markers of the MAS are mounted centered on the Sensor Boxes. One additional marker is located at the rotation point of the knee joint to form a triangle with the markers on the thigh and shank when the knee is flexed. From this triangle, the knee angle is calculated.
To conduct the test, both SensAA and the MAS are started, and the treadmill is initially set to 3 km/h walking speed. A dataset of at least one minute length is recorded, before the speed is gradually increased and the process repeated. The experiment was performed three times at walking speeds of 3 km/h, 9 km/h, 6 km/h and 12 km/h. When the speed is increased to 12 km/h the subject must change their gait from walking to jogging. This test serves as a load test of the system to evaluate how the quality of the knee angle progression performs at high speed.
3. Results
3.1. Battery Life Test
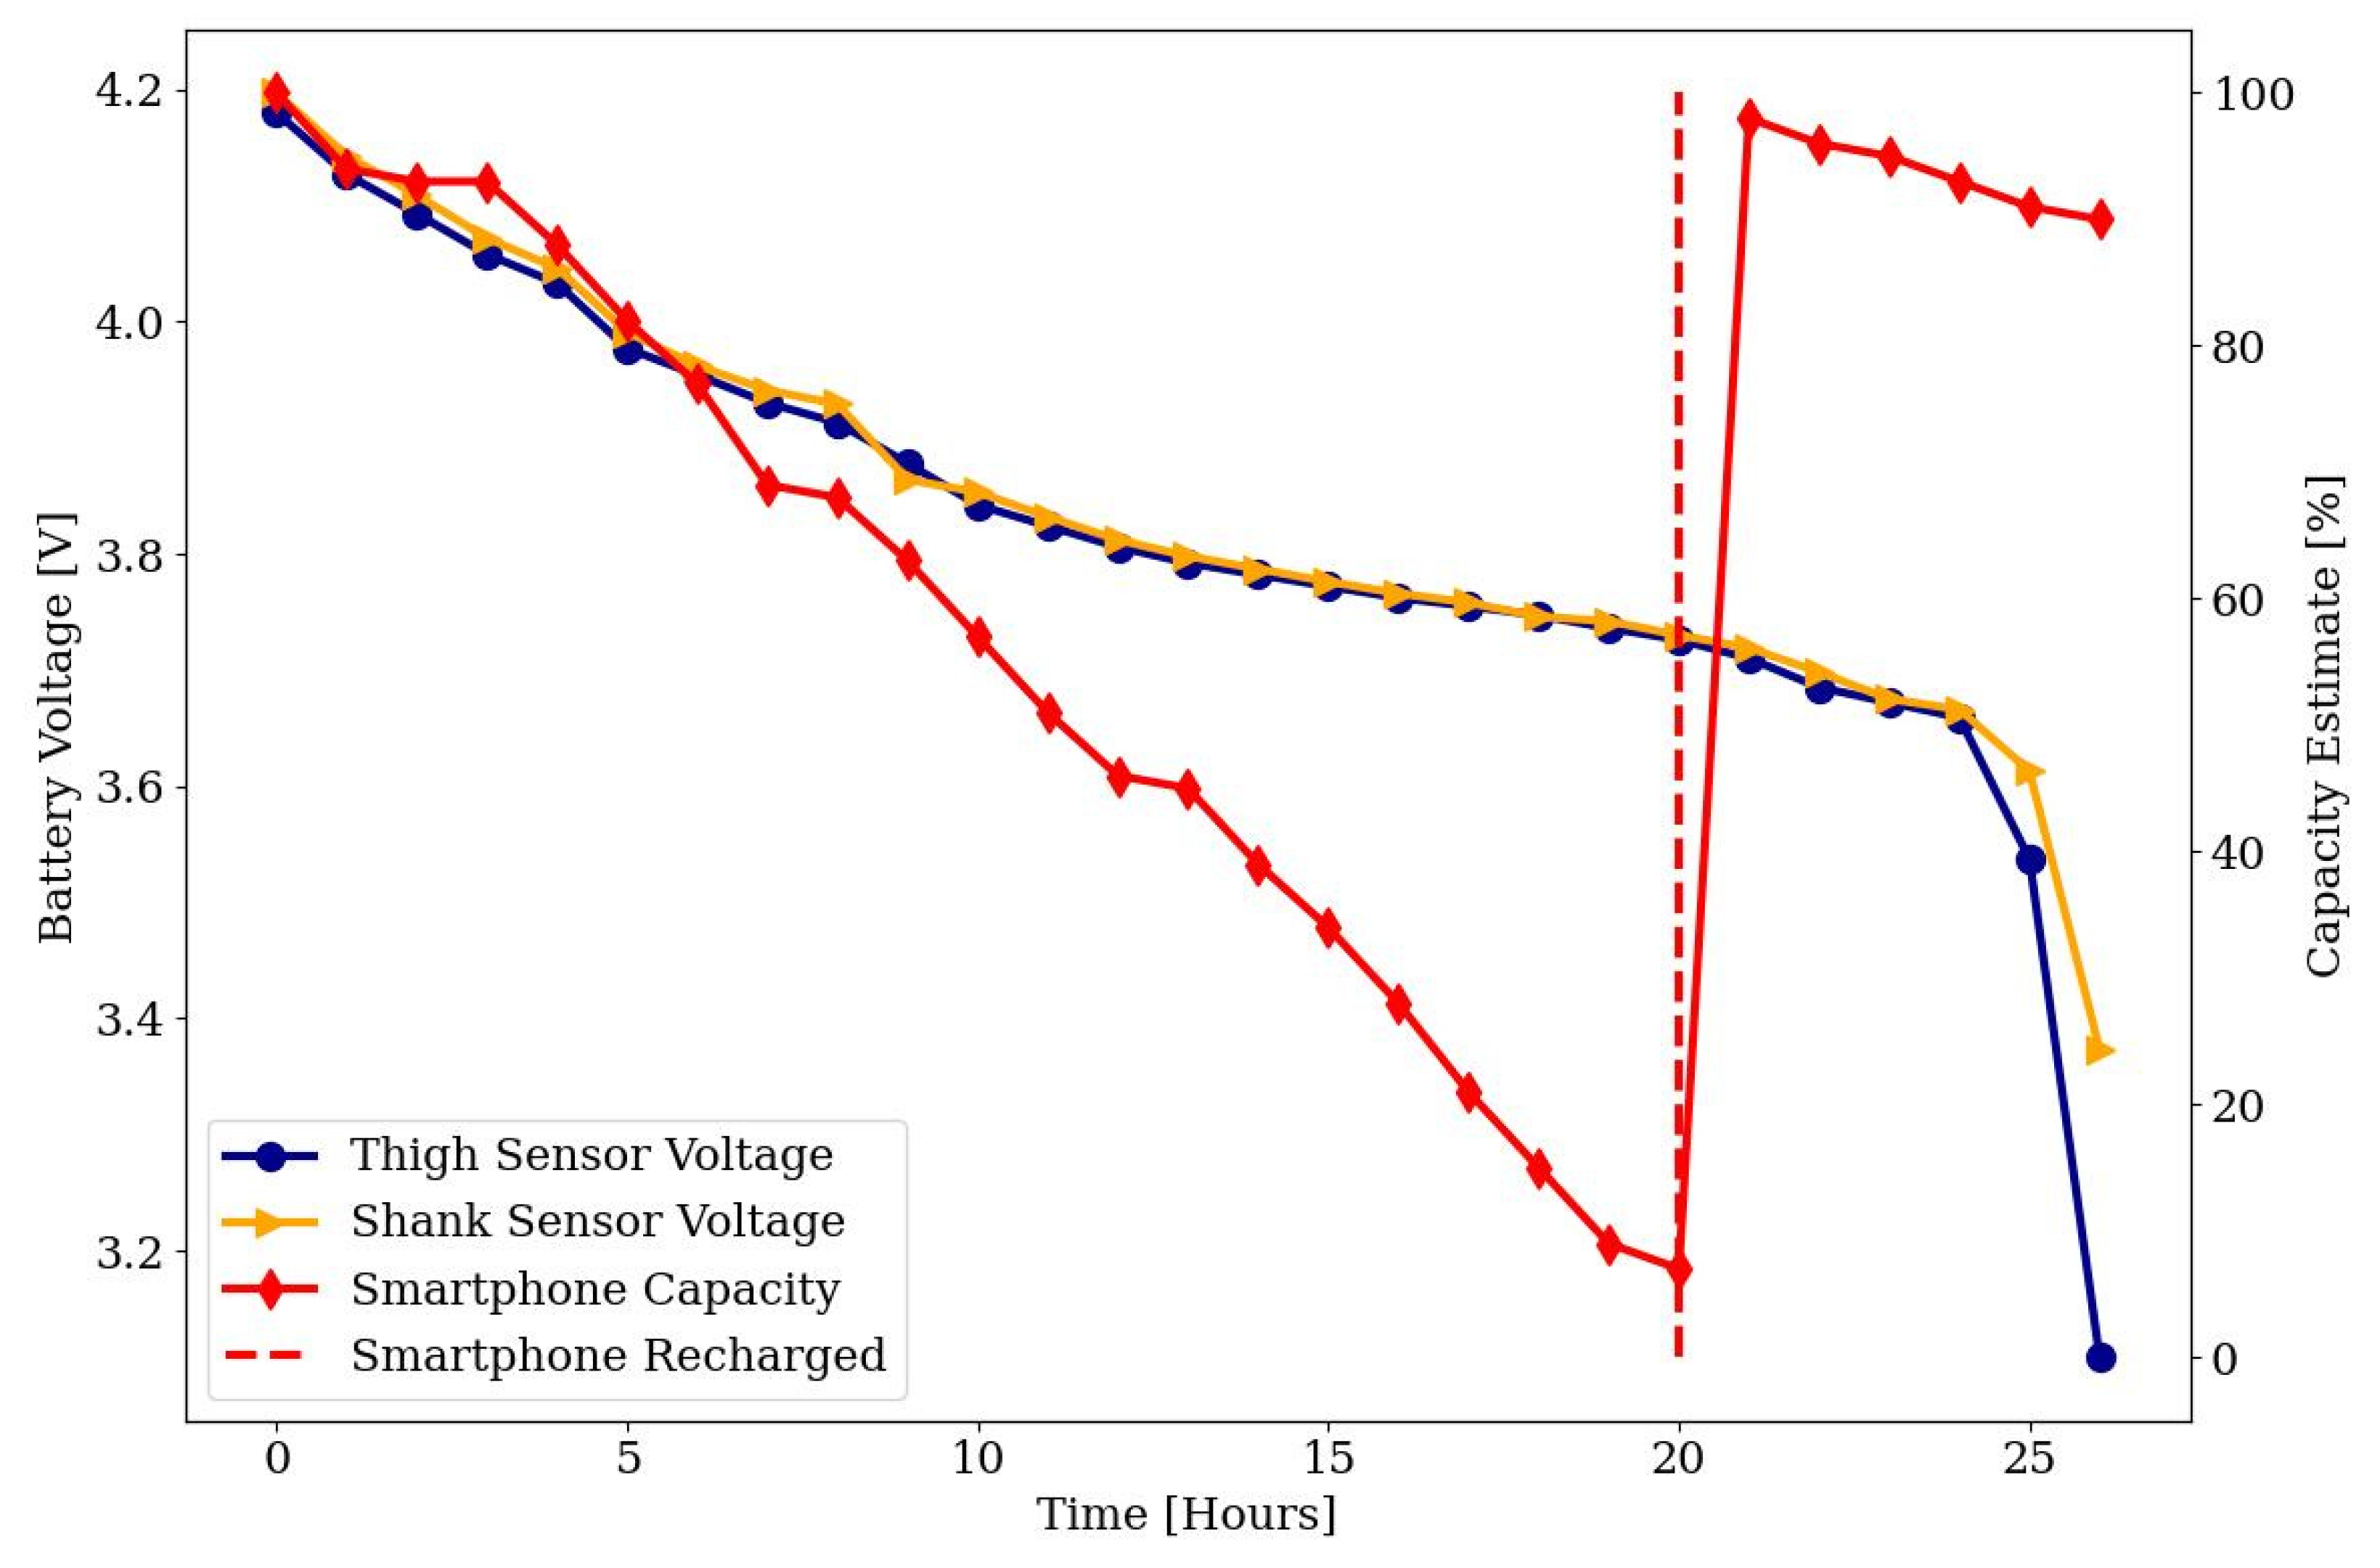
The discharge curves of the Sensor Boxes batteries and the capacity estimation of the smartphone during the Battery Life Test is shown in
Figure 10 (see
Section 2.6.1). After approx. 26 hours of runtime the batteries dropped below the 3.3 V threshold, at which the sensor module can no longer be supplied and the data recording stops. The discharge curves of the batteries show a typical Li-Ion behavior. The smartphone's battery level is at 7 % after 20 hours. It was then recharged, but the data recording continued.
3.2. Pendulum Test
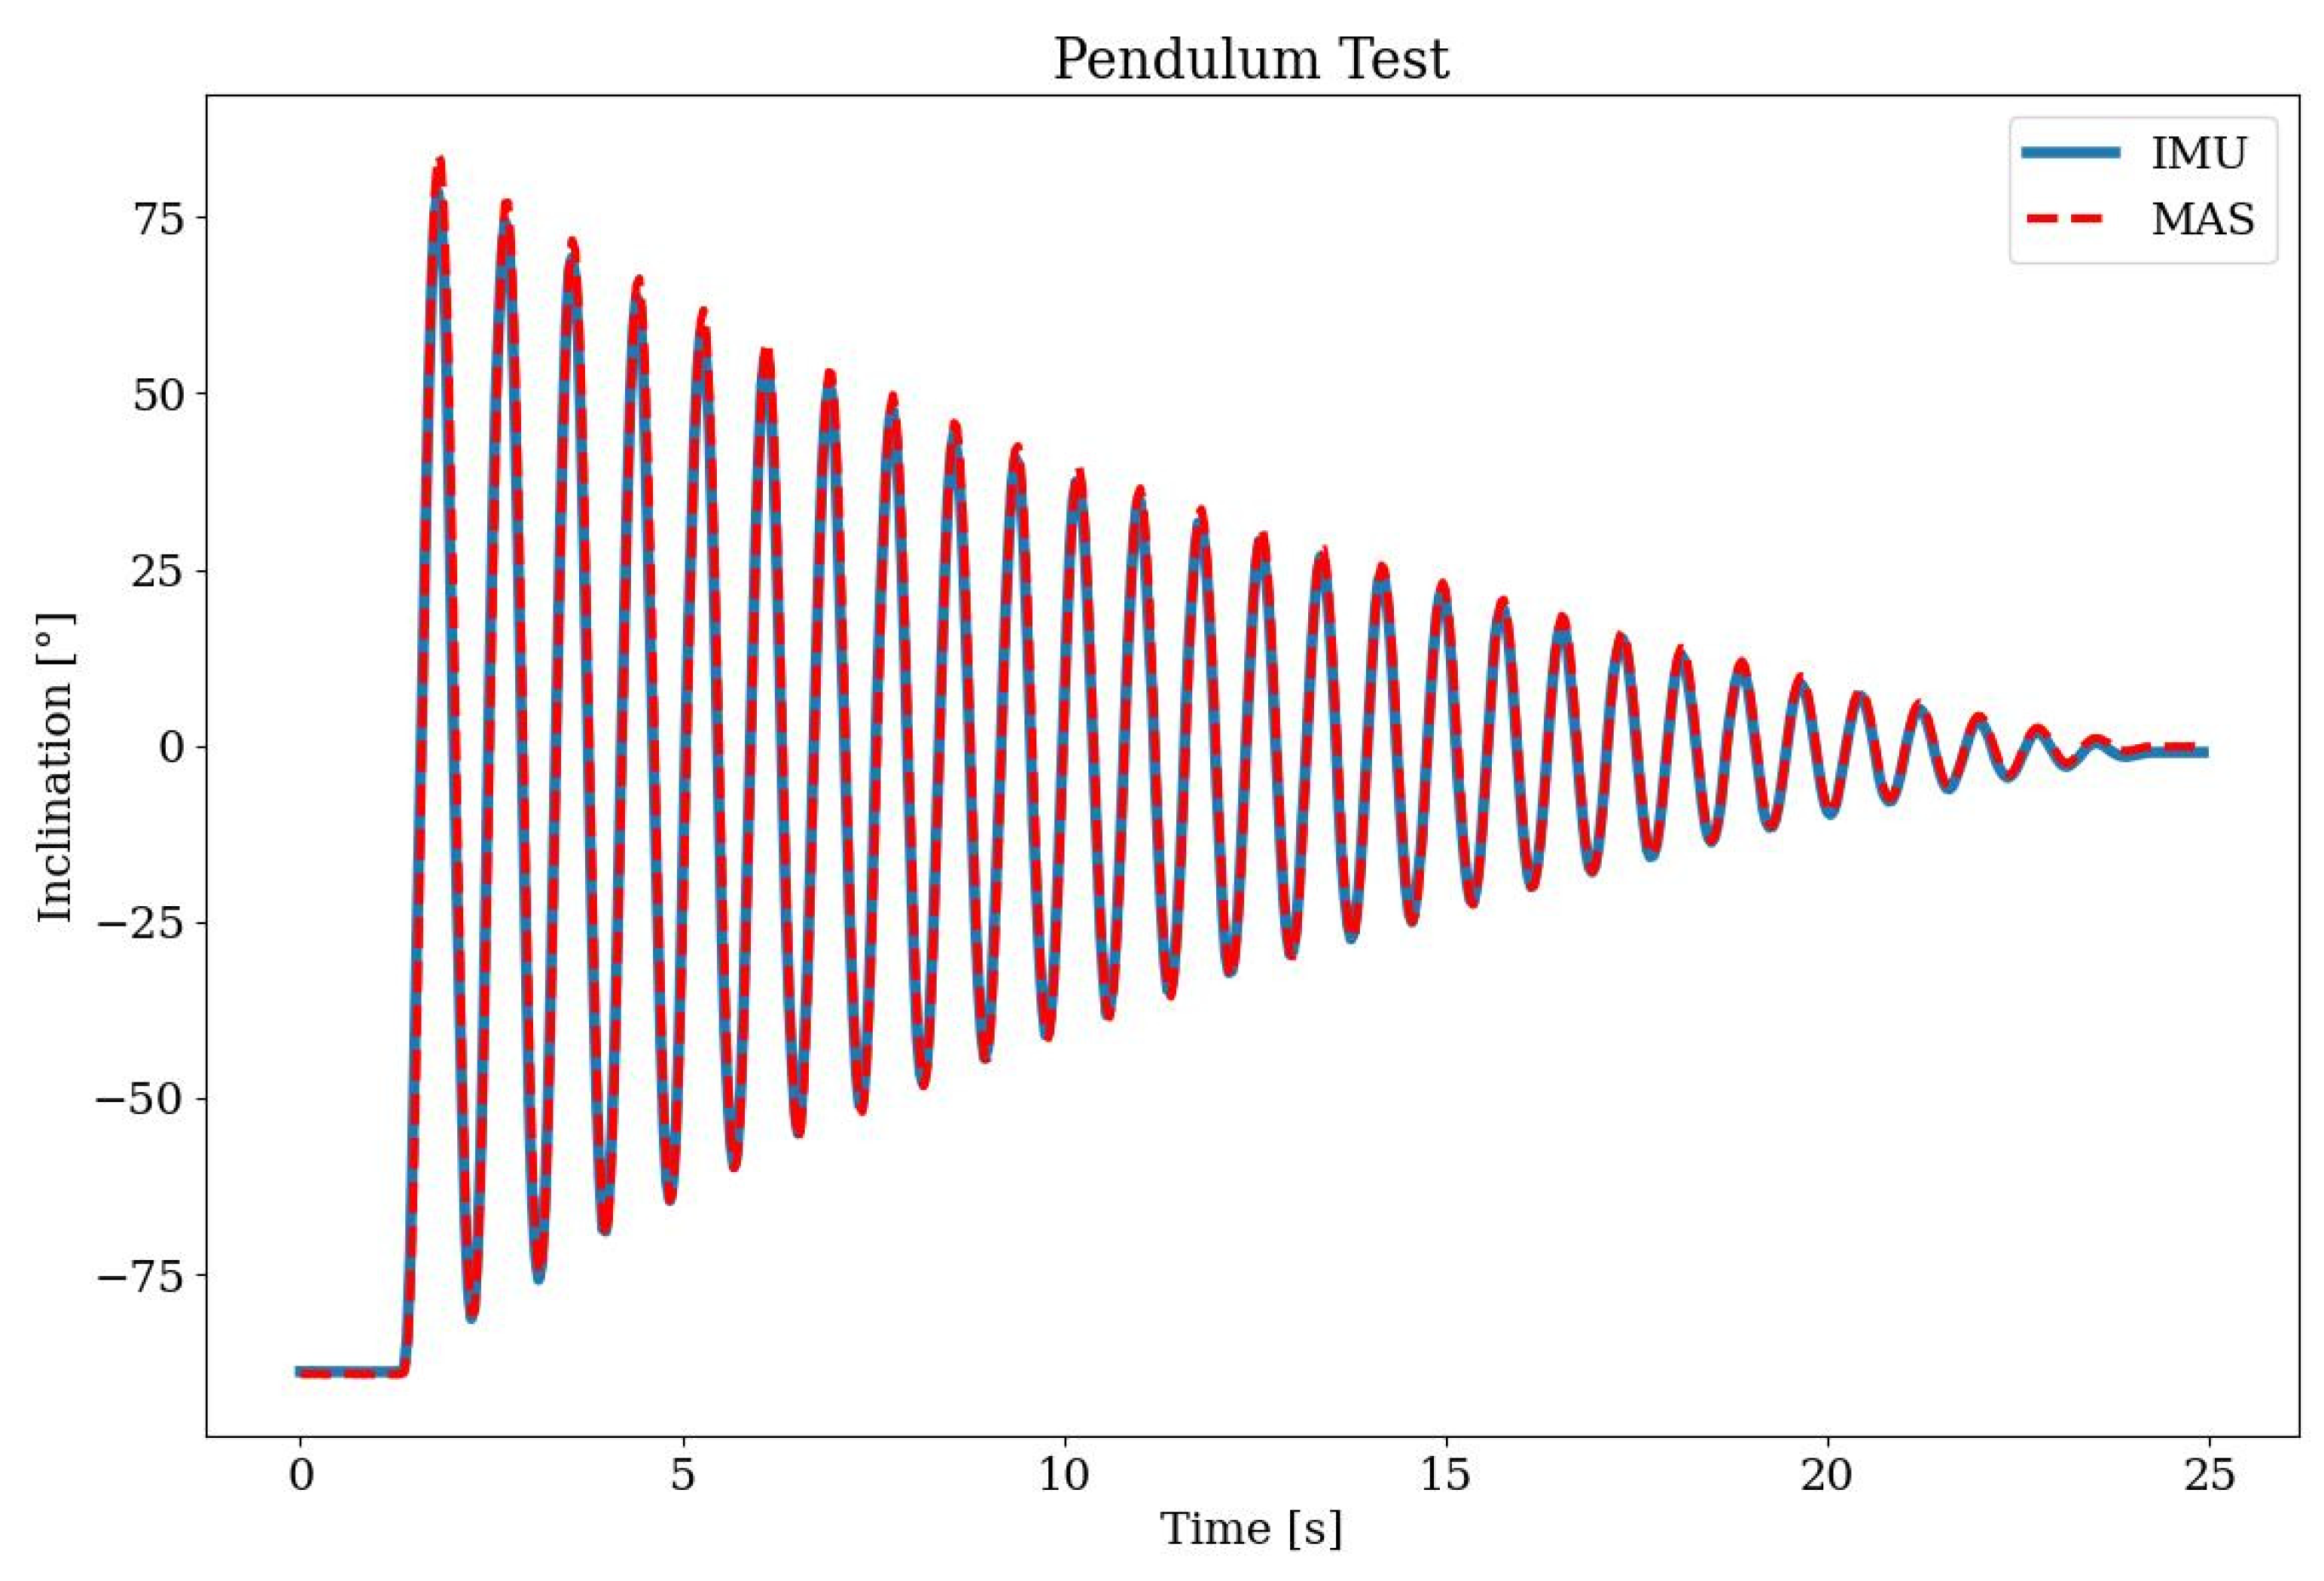
The result of the Pendulum Test (see
Section 2.6.2) is shown in
Figure 11. The graph shows the comparison of the measured angle obtained from the MAS and the proposed measurement system. To evaluate the quality of the measurements, the difference of the angle curves and their mean value can be calculated. For this purpose, the mean standard deviation is used, which reflects the average distance of all measured points from the mean value.
Table 2 summarizes the results.
3.3. Treadmill Test
To verify the wearable sensor data, the resulting knee angle signal is compared to the results of the MAS system. First, the offset in the time axis of both signals is determined and applied to the data. Then, both datasets are interpolated onto the same sampling timepoints. Since the MAS system has a significantly higher sampling rate compared to SensAA, the timepoints of the wearable sensor data were used for interpolation.
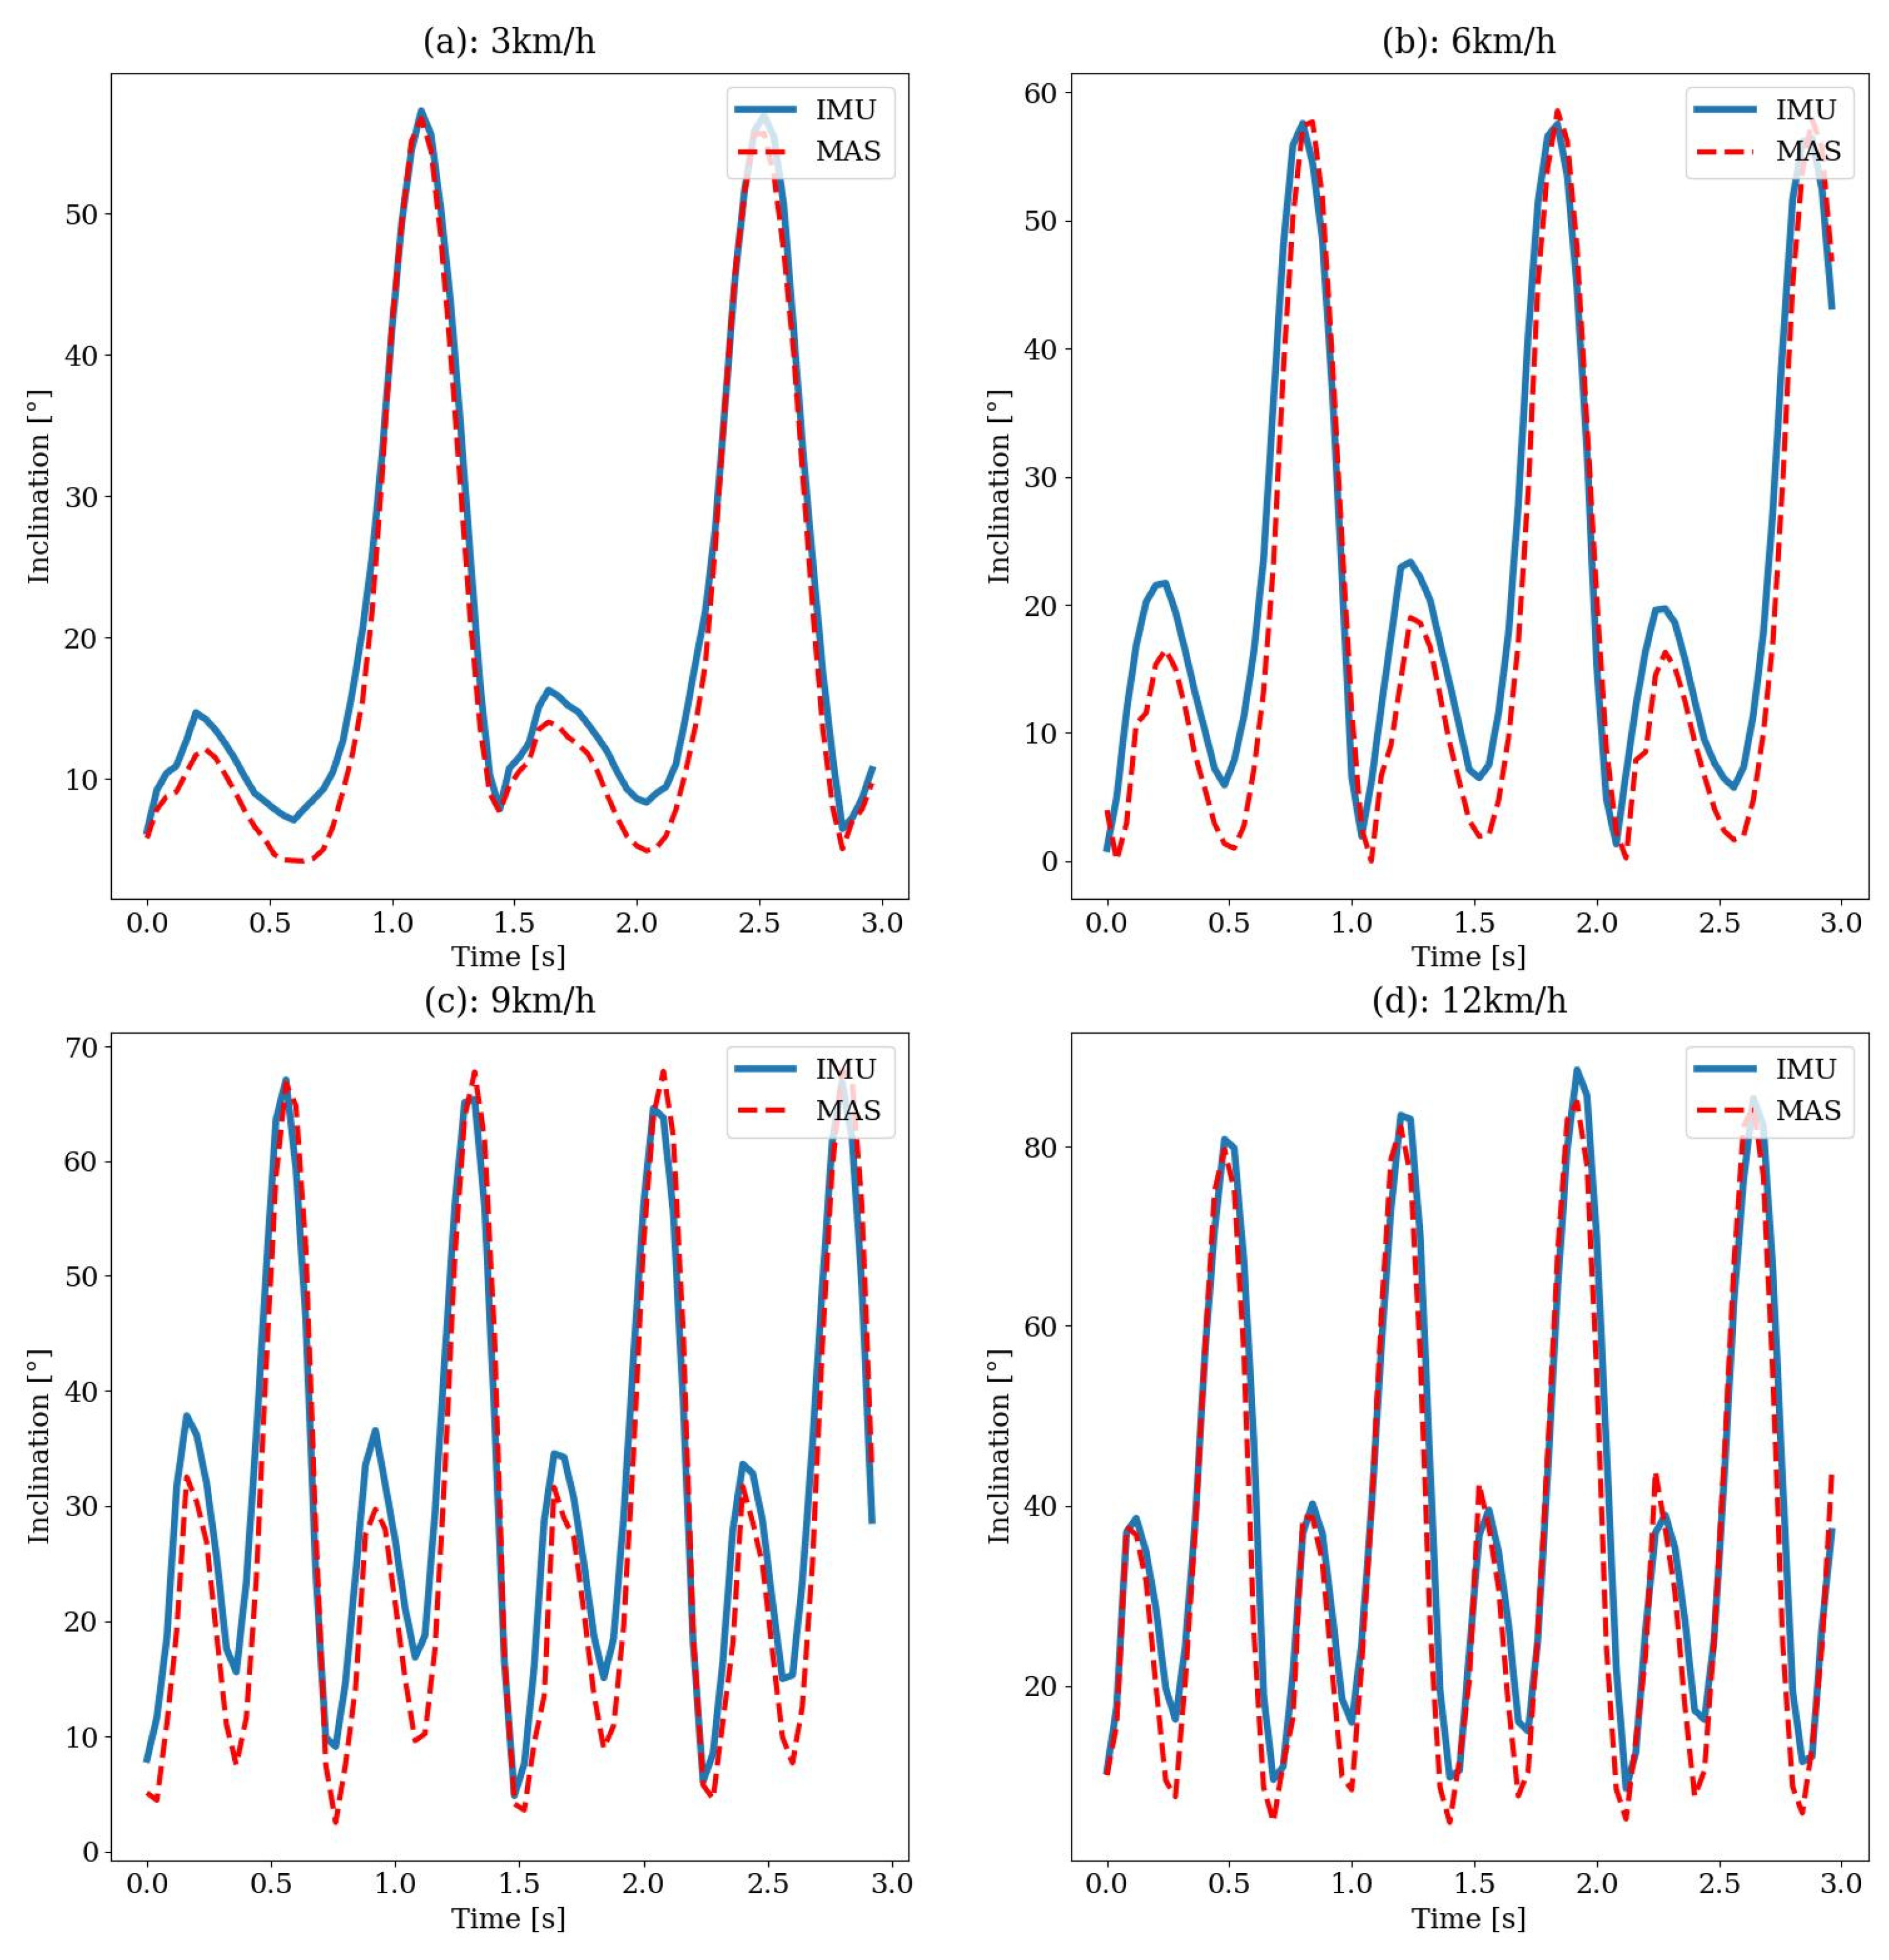
Figure 12 shows both signals compared to each other. The main metric used to quantify the comparison is the Euclidean distance between the two signals, also referred to as the Root Mean Square Error (RMSE). Additionally, the average, minimum and maximum distance and the standard deviation between both signals were calculated.
Table 3 shows the comparison results. The lowest RMSE value was measured for the speed of 3 km/h at 2.9°. For the speeds of 6 and 9 km/h the RMSE is at 6.1° and 5.2°. The highest RMSE of 8.0°was reached at 12 km/h. The average deviation is below 5° at all four walking speeds and the standard deviation is between 1.6° and 6.7°.
Figure 13 shows the phases of the gait cycle at 12 km/h speed. At such speeds there are phases in which both feet no longer touch the ground and as a result the test person bounces off. In the fifth sequence, it can be recognized that the knee angle experiences a significantly greater maximum in the swing phase than in walking. Here, the maximum knee angle is between 80° and 90°, which can be seen from the knee angle curve in
Figure 12. For comparison, in walking the maximum of the knee angle ranges between 60° and 70°.
4. Discussion
In this paper, we propose SensAA, a low-cost, highly mobile biomechanical measurement system capable of measuring the knee joint angle based on Inertial Measurement Units. The system uses a centralized, cloud hosted data storage and an off-the-shelf android smartphone to design a solution which is both inexpensive (see
Section 2.5) and easy to setup. With BLE as wireless transmission protocol, a battery life of more than 24h was achieved. This result is well suited for long-term recordings. It must be mentioned that no other activities were performed on the smartphone during the test. It should be ensured that no extensive screen time or other activities are undertaken at the smartphone during a long-term recording.
The proposed system was at first verified with a Pendulum Test. We achieved good results for the accuracy of angle measurements (RMSE: 3.5°, standard deviation: 3.4°). This proves that the implemented observer algorithm can calculate the angle between two Sensor Boxes in the sagittal plane accurately.
The system was further tested with a Treadmill Test at different walking speeds. Elastic bandages were used to attach the Sensor Boxes to the thigh and shank. During all Treadmill Test runs, these attachments did not cause any discomfort to the wearer. They are easy to put on and off and are adjustable to the thickness of the wearer’s leg.
On the treadmill, the system achieved a RMSE of 2.9° to 8° for walking speeds between 3 and 12 km/h compared to an optical measurement system. The results for walking at 3 km/h deviate less than most previous studies. These report RMSE values between 3.2° and 5.9° [
16,
17,
18,
19,
24,
25,
28,
32]. These studies describe the performed walking activity during their measurement routine only as walking and do not give an exact speed. Therefore, no comparison of the measuring accuracy of the systems at the same speed can be made.
During our literature research we only found Robert-Lachaine et al. taking measurements at different specified speeds [
27]. They investigated speeds from 0.6 to 1.2 m/s. At the speed of 0.8 m/s, which is about 3 km/h, the RMSE was 3.2°. This is higher than the error achieved with SensAA at the same walking speed.
Lower errors were achieved by Joukov et al. [
23] and Teufl et al. [
31] with RMSE values of 2.5° and 2.38° to 2.65°. Joukov et al. [
23] proposed a system based on a Rhythmic Extended Kalman Filter, which considers the periodicity of movements when walking. This significantly improves the state estimation of a regular EKF algorithm. Teufl et al. [
31] achieved a high accuracy by following an iterated extended Kalman filter approach. The inertial data was processed twice. First to obtain a converged estimate of the acceleration bias which was then used as initial guess for the second time [
31]. The downside of these two algorithms might be the increased computing effort and runtime.
The RMSE values of SensAA rise with higher walking speed. Other studies have experienced the same problem with increasing speed and increasing gait movement complexity [
18,
24]. It should be noted that the error for the speed of 6 km/h (RMSE 6.1°) is greater than for 9 km/h (RMSE 5.2°), which is contrary to the expected trend. One explanation could be a slightly loose attachment of one Sensor Box during the 6 km/h run, which causes false sensor inclination calculations.
The higher increase in the error compared to other studies might be caused by the way the Sensor Boxes are mounted. The sensors were not attached directly to the skin but to the participant’s trousers. Fast walking leads to movement of the fabric which could result again in inclination of the sensor and false calculations.
In order to achieve high accuracy for the measurement of joint angles using IMU sensors, Niswander et al. [
49] points out that the positioning of the sensors must be optimized. They compared different sensor positions and reached the lowest RMSE for the knee angle with sensors positioned at the middle lateral shank and lower anterior thigh [
49]. Besides this sensor position they also recommend the positioning which has been chosen for SensAA.
Another crucial aspect of MAS is the calibration procedure of the sensors [
18,
20,
50]. Di Raimondo et al. [
18] describe three possible types of IMU calibration: manual, static and functional calibration. They propose a functional calibration method that integrates hip abduction-adduction motion, sit-to-stand and walking movements. With this method, the RMSE could be reduced from 7.8°, with manual calibration, to 3.9°. SensAA is calibrated with a static method.
When considering the measurement accuracy, it must be considered that SensAA cannot be compared to a reliable ground truth. The optical reference system is also subject to errors. Teufl et al. [
31] showed that MAS based on optical markers can suffer from soft tissue artifacts (STA) when the markers are placed on anatomical landmarks (cp. [
21,
24,
28]). Teufl et al. [
31] achieved higher accuracy by using rigid marker clusters fixed on the thigh and shank with straps (RMSE reduction of up to 1.3°). For the Treadmill Test we attached two markers to the rigid Sensor Boxes, but one marker on the rotation axis of the knee. This marker might be affected by STA additionally to the fabric movement.
The measuring accuracy of SensAA could possibly be improved by optimizing the sensor attachment, sensor positions and the calibration method. Nevertheless, SensAA shows viable performance for gait analysis purposes. Errors between 2° and 5° are considered clinically acceptable [
18]. This threshold could be achieved when walking at 3 km/h. Speeds from 6 km/h to 12 km/h are rarely measured in everyday life situations, especially for elderly people [
51,
52].
At this point SensAA has only been tested in a laboratory environment, which is not its intended purpose. However, the tests conducted showed that the proposed toolchain works as desired. Whether the system delivers the same results during a long-term measurement has yet to be verified.
5. Conclusion and Outlook
In this contribution we propose a low-cost and easy to use wearable measurement system for long-term gait observation (see
Section 2). It can be shown that SensAA has a high measurement accuracy in measuring the angle of the knee joint, which is greater or similar to that of previous studies (see
Section 4).
SensAA provides a powerful platform for collecting and processing biomechanical data. Nevertheless, additional optimizations have to be made to reach a consistent accuracy for walking speeds above 3 km/h. After the laboratory verification a long-term study with test subjects is planned to validate the system in the intended environment.
For future work SensAA can be used for calculating load collectives of the human leg and identifying different walking activities (cp. [
53,
54,
55]). These could be used for designing and controlling an active exoskeleton, which assists the user with ADLs like walking, climbing stairs and sitting down and standing up.
The system is not limited to the knee joint and the lower limbs but can be used on the whole body. Additional Sensor Boxes could be used to examine other human joints simultaneously. Thanks to the cloud-based data storage solution, a large group of participants could easily be examined. This could help to create an extensive database for human kinematics.
Author Contributions
Conceptualization and methodology, L.R., D.S., J.S. and M.G.; software, D.S. and J.S.; validation, L.R., D.S., J.S. and J.P.D.; formal analysis, L.R., D.S., J.S. and J.P.D.; resources, L.R, D.S, J.P.D., J.S., and M.G.; data curation, L.R., D.S. and J.P.D.; writing—original draft preparation, D.S., L.R. and J.P.D.; writing—review and editing, J.P.D. and M.G.; visualization, D.S, L.R. and J.P.D.; supervision, M.G.; project administration, J.P.D.; funding acquisition, J.P.D. and M.G. All authors have read and agreed to the published version of the manuscript.
Funding
We acknowledge support for the publication costs by the Open Access Publication Fund of Aalen University.
Institutional Review Board Statement
The study was conducted in accordance with the Declaration of Helsinki. For the technical development, no ethical review and approval were obligatory.
Informed Consent Statement
Informed consent was obtained from all subjects involved in the study. Function tests and quantitative validations of several developments were performed by the authors.
Data Availability Statement
The data presented in this study are available on request from the corresponding author.
Conflicts of Interest
The authors declare no conflict of interest. The funders had no role in the design of the study; in the collection, analyses, or interpretation of data; nor in the writing of the manuscript, or in the decision to publish the results.
Abbreviations
The following abbreviations are used in this manuscript:
| ADL |
Activities of Daily Living |
| API |
Application Programming Interface |
| BLE |
Bluetooth® Low Energy |
| ECG |
Electrocardiography |
| EIT |
Electrical Impedance Tomography |
| EKF |
Extended Kalman Filter |
| EMG |
Electromyography |
| GATT |
Generic Attribute Profile |
| GRF |
Ground Reaction Force |
| HTTP |
Hypertext Transfer Protocol |
| HTTPS |
Hypertext Transfer Protocol Secure |
| IMU |
Inertial Measurement Unit |
| IP |
Internet Protocol |
| JSON |
Java Script Object Notation |
| LDO |
Low Drop-Out Voltage-Regulator |
| LiPo |
Lithium Polymer |
| LTE |
Long Term Evolution |
| MAS |
Motion Analysis System |
| MEMS |
Micro-Electro-Mechanical Systems |
| OLED |
Organic Light Emitting Diode |
| OPD |
Organic Photo Diode |
| PCB |
Printed Circuit Board |
| RMS |
Root Mean Squared |
| RMSE |
Root Mean Squared Error |
| STA |
Soft Tissue Artifacts |
| SQL |
Structured Query Language |
| TLS |
Transport Layer Security |
| USB |
Universal Serial Bus |
References
- Pirker, W.; Katzenschlager, R. Gait disorders in adults and the elderly : A clinical guide. Wiener Klinische Wochenschrift 2017, 129, 81–95. [Google Scholar] [CrossRef]
- Mahlknecht, P.; Kiechl, S.; Bloem, B.R.; Willeit, J.; Scherfler, C.; Gasperi, A.; Rungger, G.; Poewe, W.; Seppi, K. Prevalence and burden of gait disorders in elderly men and women aged 60-97 years: a population-based study. PLoS ONE 2013, 8, e69627. [Google Scholar] [CrossRef]
- Meda-Gutiérrez, J.R.; Zúñiga-Avilés, L.A.; Vilchis-González, A.H.; Ávila-Vilchis, J.C. Knee Exoskeletons Design Approaches to Boost Strength Capability: A Review. Applied Sciences 2021, 11, 9990. [Google Scholar] [CrossRef]
- Nesler, C.; Thomas, G.; Divekar, N.; Rouse, E.J.; Gregg, R.D. Enhancing Voluntary Motion with Modular, Backdrivable, Powered Hip and Knee Orthoses. IEEE Robot. Autom. Lett. 2022, 7, 6155–6162. [Google Scholar] [CrossRef] [PubMed]
- Toxiri, S.; Calanca, A.; Poliero, T.; Caldwell, D.G.; Ortiz, J. Actuation Requirements for Assistive Exoskeletons: Exploiting Knowledge of Task Dynamics. In Wearable Robotics: Challenges and Trends, Proceedings of the 4th International Symposium on Wearable Robotics, WeRob2018, October 16-20, 2018, Pisa, Italy. International Symposium on Wearable Robotics; Carrozza, M.C., Micera, S., Pons, J.L., Carrozza, M.C., Eds.; Springer International Publishing: Cham, 2019; pp. 381–385. ISBN 978-3-030-01887-0. [Google Scholar]
-
Wearable Robotics: Challenges and Trends: Proceedings of the 4th International Symposium on Wearable Robotics, WeRob2018, October 16-20, 2018, Pisa, Italy; Carrozza, M.C.; Micera, S.; Pons, J.L.; Carrozza, M.C., Eds., 1st ed. 2019. International Symposium on Wearable Robotics; Springer International Publishing: Cham, 2019. Cham.
- Arazpour, M.; Bani, M.A.; Hutchins, S.W. Reciprocal gait orthoses and powered gait orthoses for walking by spinal cord injury patients. Prosthet. Orthot. Int. 2013, 37, 14–21. [Google Scholar] [CrossRef] [PubMed]
- Contreras-Vidal, J.L.; A Bhagat, N.; Brantley, J.; Cruz-Garza, J.G.; He, Y.; Manley, Q.; Nakagome, S.; Nathan, K.; Tan, S.H.; Zhu, F.; et al. Powered exoskeletons for bipedal locomotion after spinal cord injury. J. Neural Eng. 2016, 13, 31001. [Google Scholar] [CrossRef] [PubMed]
- Alqahtani, M.S.; Al-Tamimi, A.; Almeida, H.; Cooper, G.; Bartolo, P. A review on the use of additive manufacturing to produce lower limb orthoses. Prog Addit Manuf 2020, 5, 85–94. [Google Scholar] [CrossRef]
- Tarbit, J.; Hartley, N.; Previte, J. Exoskeletons at your service: a multi-disciplinary structured literature review. JSM 2023, 37, 313–339. [Google Scholar] [CrossRef]
- Yan, T.; Cempini, M.; Oddo, C.M.; Vitiello, N. Review of assistive strategies in powered lower-limb orthoses and exoskeletons. Robotics and Autonomous Systems 2015, 64, 120–136. [Google Scholar] [CrossRef]
- Willwacher, S.; Robbin, J.; Eßer, T.; Mai, P. Bewegungsanalysesysteme in der Forschung und für niedergelassene Orthopädinnen und Orthopäden. Orthopadie (Heidelb) 2023, 52, 610–617. [Google Scholar] [CrossRef]
- Riener, R.; Rabuffetti, M.; Frigo, C. Stair ascent and descent at different inclinations. Gait & Posture 2002, 15, 32–44. [Google Scholar] [CrossRef]
- Laudanski, A.; Brouwer, B.; Li, Q. Measurement of lower limb joint kinematics using inertial sensors during stair ascent and descent in healthy older adults and stroke survivors. Journal of Healthcare Engineering 2013, 4, 555–576. [Google Scholar] [CrossRef] [PubMed]
- Brinckmann, P. Orthopädische Biomechanik: Mit 23 Tabellen ; mit einem Verzeichnis der Fachausdrücke der Orthopädischen Biomechanik Englisch-Deutsch, 2., erw. Aufl.; Monsenstein und Vannerdat: Münster, 2012, ISBN 978-3-8405-0059-6.
- Carcreff, L.; Payen, G.; Grouvel, G.; Massé, F.; Armand, S. Three-Dimensional Lower-Limb Kinematics from Accelerometers and Gyroscopes with Simple and Minimal Functional Calibration Tasks: Validation on Asymptomatic Participants. Sensors (Basel) 2022, 22. [Google Scholar] [CrossRef] [PubMed]
- Cerfoglio, S.; Capodaglio, P.; Rossi, P.; Conforti, I.; D'Angeli, V.; Milani, E.; Galli, M.; Cimolin, V. Evaluation of Upper Body and Lower Limbs Kinematics through an IMU-Based Medical System: A Comparative Study with the Optoelectronic System. Sensors 2023, 23, 6156. [Google Scholar] [CrossRef] [PubMed]
- Di Raimondo, G.; Vanwanseele, B.; van der Have, A.; Emmerzaal, J.; Willems, M.; Killen, B.A.; Jonkers, I. Inertial Sensor-to-Segment Calibration for Accurate 3D Joint Angle Calculation for Use in OpenSim. Sensors (Basel) 2022, 22. [Google Scholar] [CrossRef] [PubMed]
- Dorschky, E.; Nitschke, M.; Seifer, A.-K.; van den Bogert, A.J.; Eskofier, B.M. Estimation of gait kinematics and kinetics from inertial sensor data using optimal control of musculoskeletal models. Journal of Biomechanics 2019, 95, 109278. [Google Scholar] [CrossRef] [PubMed]
- Favre, J.; Aissaoui, R.; Jolles, B.M.; Guise, J.A. de; Aminian, K. Functional calibration procedure for 3D knee joint angle description using inertial sensors. Journal of Biomechanics 2009, 42, 2330–2335. [Google Scholar] [CrossRef]
- Finco, M.G.; Patterson, R.M.; Moudy, S.C. A pilot case series for concurrent validation of inertial measurement units to motion capture in individuals who use unilateral lower-limb prostheses. J. Rehabil. Assist. Technol. Eng. 2023, 10, 20556683231182322. [Google Scholar] [CrossRef]
- Gard, S.A.P. Use of Quantitative Gait Analysis for the Evaluation of Prosthetic Walking Performance. JPO Journal of Prosthetics and Orthotics 2006, 93–104. [Google Scholar] [CrossRef]
- Joukov, V.; Bonnet, V.; Karg, M.; Venture, G.; Kulic, D. Rhythmic Extended Kalman Filter for Gait Rehabilitation Motion Estimation and Segmentation. IEEE Trans. Neural Syst. Rehabil. Eng. 2018, 26, 407–418. [Google Scholar] [CrossRef]
- Lebleu, J.; Gosseye, T.; Detrembleur, C.; Mahaudens, P.; Cartiaux, O.; Penta, M. Lower Limb Kinematics Using Inertial Sensors during Locomotion: Accuracy and Reproducibility of Joint Angle Calculations with Different Sensor-to-Segment Calibrations. Sensors (Basel) 2020, 20. [Google Scholar] [CrossRef] [PubMed]
- Lora-Millan, J.S.; Hidalgo, A.F.; Rocon, E. An IMUs-Based Extended Kalman Filter to Estimate Gait Lower Limb Sagittal Kinematics for the Control of Wearable Robotic Devices. IEEE Access 2021, 9, 144540–144554. [Google Scholar] [CrossRef]
- Poitras, I.; Dupuis, F.; Bielmann, M.; Campeau-Lecours, A.; Mercier, C.; Bouyer, L.J.; Roy, J.-S. Validity and Reliability of Wearable Sensors for Joint Angle Estimation: A Systematic Review. Sensors 2019, 19, 1555. [Google Scholar] [CrossRef] [PubMed]
- Robert-Lachaine, X.; Parent, G.; Fuentes, A.; Hagemeister, N.; Aissaoui, R. Inertial motion capture validation of 3D knee kinematics at various gait speed on the treadmill with a double-pose calibration. Gait & Posture 2020, 77, 132–137. [Google Scholar] [CrossRef]
- Seel, T.; Raisch, J.; Schauer, T. IMU-based joint angle measurement for gait analysis. Sensors 2014, 14, 6891–6909. [Google Scholar] [CrossRef]
- Shull, P.B.; Jirattigalachote, W.; Hunt, M.A.; Cutkosky, M.R.; Delp, S.L. Quantified self and human movement: a review on the clinical impact of wearable sensing and feedback for gait analysis and intervention. Gait & Posture 2014, 40, 11–19. [Google Scholar] [CrossRef]
- Storm, F.A.; Cesareo, A.; Reni, G.; Biffi, E. Wearable Inertial Sensors to Assess Gait during the 6-Minute Walk Test: A Systematic Review. Sensors 2020, 20, 2660. [Google Scholar] [CrossRef]
- Teufl, W.; Miezal, M.; Taetz, B.; Fröhlich, M.; Bleser, G. Validity, Test-Retest Reliability and Long-Term Stability of Magnetometer Free Inertial Sensor Based 3D Joint Kinematics. Sensors 2018, 18, 1980. [Google Scholar] [CrossRef]
- Weygers, I.; Kok, M.; Konings, M.; Hallez, H.; Vroey, H. de; Claeys, K. Inertial Sensor-Based Lower Limb Joint Kinematics: A Methodological Systematic Review. Sensors 2020, 20, 673. [Google Scholar] [CrossRef]
- Cloete, T.; Scheffer, C. Benchmarking of a full-body inertial motion capture system for clinical gait analysis. In 2008 30th Annual International Conference of the IEEE Engineering in Medicine and Biology Society, 2008; pp 4579–4582.
- X. Robert-Lachaine; H. Mecheri; A. Muller; C. Larue; A. Plamondon. Validation of a low-cost inertial motion capture system for whole-body motion analysis. Journal of Biomechanics 2020, 99, 109520. [CrossRef]
- Hamdi Mohammed M.; Awad Mohammed I.; Abdelhameed Magdy M.; Tolbah Farid A. Lower limb motion tracking using IMU sensor network. In 2014 Cairo International Biomedical Engineering Conference (CIBEC), 2014; pp 28–33.
- Prayudi Iman; Kim Doik. Design and implementation of IMU-based human arm motion capture system. In 2012 IEEE International Conference on Mechatronics and Automation, 2012; pp 670–675.
- Zihajehzadeh, S.; Park, E.J. A Novel Biomechanical Model-Aided IMU/UWB Fusion for Magnetometer-Free Lower Body Motion Capture. IEEE Trans. Syst. Man Cybern, Syst. 2017, 47, 927–938. [Google Scholar] [CrossRef]
- Husar, P. Elektrische Biosignale in der Medizintechnik, 2. Aufl. 2020; Springer Berlin Heidelberg: Berlin, Heidelberg, 2020, ISBN 9783662596418.
- Bovi, G.; Rabuffetti, M.; Mazzoleni, P.; Ferrarin, M. A multiple-task gait analysis approach: Kinematic, kinetic and EMG reference data for healthy young and adult subjects. Gait & Posture 2011, 33, 6–13. [Google Scholar] [CrossRef]
- Kusche, R. Mehrkanal-Bioimpedanz-Instrumentierung: Zeitaufgelöste Messung Physiologischer Ereignisse; Springer Fachmedien Wiesbaden GmbH: Wiesbaden, 2021; ISBN 9783658314705. [Google Scholar]
- Silva, O.L.; Sousa, T.H.; Hoffman, I.O.; Camargo, E.D. de; Moura, F.S. de; Martins, A.R.; Biasi, C.; Fantoni, D.T.; Lima, R.G. A proposal to monitor muscle contraction through the change of electrical impedance inside a muscle. In 5th IEEE RAS/EMBS International Conference on Biomedical Robotics and Biomechatronics. 2014 5th IEEE RAS & EMBS International Conference on Biomedical Robotics and Biomechatronics (BioRob), Sao Paulo, Brazil, 12–15 Aug. 2014; IEEE, 2014; pp 763–767, ISBN 978-1-4799-3128-6.
- Bansal, A.K.; Hou, S.; Kulyk, O.; Bowman, E.M.; Samuel, I.D.W. Wearable Organic Optoelectronic Sensors for Medicine. Advanced Materials 2015, 27, 7638–7644. [Google Scholar] [CrossRef] [PubMed]
- Pfüller, T. Oberflächenmyographische Detailanalyse des Ökonomieverhaltens der Hüft- und Beinmuskulatur unter dynamischen Bedingungen; Friedrich-Schiller-Universität Jena, 2021.
- ST Microelectronics. STEVAL-STLCS02V1 - Data brief. Available online: https://www.st.com/resource/en/data_brief/steval-stlcs02v1.pdf (accessed on 1 December 2022).
- ST Microelectronics. LSM6DSM - iNEMO inertial module: always-on 3D accelerometer and 3D gyroscope. Available online: https://www.st.com/resource/en/datasheet/lsm6dsm.pdf (accessed on 1 December 2022).
- Adafruit Industries. Adafruit Micro-Lipo Charger for LiPo/LiIon Batt w/MicroUSB Jack. Available online: https://www.adafruit.com/product/1904 (accessed on 27 December 2023).
- A. Pachi; T. Ji. Frequency and velocity of people walking, 2005.
- Karampour, H.; Piran, F.; Faircloth, A.; Talebian, N.; Miller, D. Vibration of Timber and Hybrid Floors: A Review of Methods of Measurement, Analysis, and Design. Buildings 2023, 13, 1756. [Google Scholar] [CrossRef]
- Niswander, W.; Wang, W.; Kontson, K. Optimization of IMU Sensor Placement for the Measurement of Lower Limb Joint Kinematics. Sensors 2020, 20, 5993. [Google Scholar] [CrossRef] [PubMed]
- Pacher, L.; Chatellier, C.; Vauzelle, R.; Fradet, L. Comparison of lower limb calibration methods for movement analysis with inertial measurement unit (IMU). Computer Methods in Biomechanics and Biomedical Engineering 2020, 23, S215–S217. [Google Scholar] [CrossRef]
- Prakash, C.; Kumar, R.; Mittal, N. Recent developments in human gait research: parameters, approaches, applications, machine learning techniques, datasets and challenges. Artif Intell Rev 2018, 49, 1–40. [Google Scholar] [CrossRef]
- Inès A Kramers-De Quervain; Edgar Stüssi; Alex Stacoff. Ganganalyse beim Gehen und Laufen. Schweizerische Zeitschrift für Sportmedizin und Sporttraumatologie 2008, 56, 35–42.
- Djuric, M. Automatic recognition of gait phases from accelerations of leg segments. In 2008 9th Symposium on Neural Network Applications in Electrical Engineering. 2008 9th Symposium on Neural Network Applications in Electrical Engineering, Belgrade, Serbia, 25–27 Sep. 2008; IEEE, 2008; pp 121–124, ISBN 978-1-4244-2903-5.
- Jasiewicz, J.M.; Allum, J.H.J.; Middleton, J.W.; Barriskill, A.; Condie, P.; Purcell, B.; Li, R.C.T. Gait event detection using linear accelerometers or angular velocity transducers in able-bodied and spinal-cord injured individuals. Gait & Posture 2006, 24, 502–509. [Google Scholar] [CrossRef]
- Gao, F.; Liu, G.; Liang, F.; Liao, W.-H. IMU-Based Locomotion Mode Identification for Transtibial Prostheses, Orthoses, and Exoskeletons. IEEE Trans. Neural Syst. Rehabil. Eng. 2020, 28, 1334–1343. [Google Scholar] [CrossRef]
Figure 1.
System Overview of SensAA.
Figure 1.
System Overview of SensAA.
Figure 2.
System Architecture of SensAA.
Figure 2.
System Architecture of SensAA.
Figure 3.
Electronic structure of SensAA. All electrical components are integrated in a housing, the Sensor Box.
Figure 3.
Electronic structure of SensAA. All electrical components are integrated in a housing, the Sensor Box.
Figure 4.
3D-printed Sensor Box; left: bottom half with, which provides cutouts and cable guides for custom Breakoutboard for STEVAL-Board, LiPo-battery-charger, slide switch and battery, right: top half with integrated support structure to fixate all electrical components in the bottom half.
Figure 4.
3D-printed Sensor Box; left: bottom half with, which provides cutouts and cable guides for custom Breakoutboard for STEVAL-Board, LiPo-battery-charger, slide switch and battery, right: top half with integrated support structure to fixate all electrical components in the bottom half.
Figure 5.
Sensor State Machine of the sensor firmware of SensAA.
Figure 5.
Sensor State Machine of the sensor firmware of SensAA.
Figure 6.
Architecture of the Cloud Server System of SensAA.
Figure 6.
Architecture of the Cloud Server System of SensAA.
Figure 7.
Pendulum Test setup with marked measuring angle and two Sensor Boxes. Sensor Box 1 is fixed on a stationary vertical axis and Sensor Box 2 is mounted on a free-swinging pendulum. Both axis and pendulum are marked with infrared markers to measure with an optical MAS simultaneously.
Figure 7.
Pendulum Test setup with marked measuring angle and two Sensor Boxes. Sensor Box 1 is fixed on a stationary vertical axis and Sensor Box 2 is mounted on a free-swinging pendulum. Both axis and pendulum are marked with infrared markers to measure with an optical MAS simultaneously.
Figure 8.
Treadmill Test setup with optical MAS positioned three meters away from the treadmill.
Figure 8.
Treadmill Test setup with optical MAS positioned three meters away from the treadmill.
Figure 9.
Sensor Boxes attached with bandages to a subject’s thigh and calf of the right leg. Additionally, three infrared markers for an optical MAS are attached to the leg. They form a triangle that encloses the knee joint angle .
Figure 9.
Sensor Boxes attached with bandages to a subject’s thigh and calf of the right leg. Additionally, three infrared markers for an optical MAS are attached to the leg. They form a triangle that encloses the knee joint angle .
Figure 10.
Discharge curves of the batteries of the sensor modules at shank and thigh and the smartphone.
Figure 10.
Discharge curves of the batteries of the sensor modules at shank and thigh and the smartphone.
Figure 11.
Results of the Pendulum Test; knee joint angle of the IMU sensors of SensAA in comparison to reference MAS.
Figure 11.
Results of the Pendulum Test; knee joint angle of the IMU sensors of SensAA in comparison to reference MAS.
Figure 12.
Comparison of knee angle measured by IMU sensors of SensAA and reference MAS on treadmill at a) 3 km/h, b) 6 km/h, c) 9 km/h and d) 12 km/h walking speed.
Figure 12.
Comparison of knee angle measured by IMU sensors of SensAA and reference MAS on treadmill at a) 3 km/h, b) 6 km/h, c) 9 km/h and d) 12 km/h walking speed.
Figure 13.
Gait cycle on the treadmill at 12 km/h.
Figure 13.
Gait cycle on the treadmill at 12 km/h.
Table 1.
Costs of Material of one Sensor Box of SensAA.
Table 1.
Costs of Material of one Sensor Box of SensAA.
| Component |
Approximate Cost |
| Housing |
8 € |
| LiPo-Battery and Charger |
11 € |
| STEVAL-Board |
34 € |
| Passive Electronic Components |
4 € |
| Bandage |
12 € |
| Total Cost |
69 € |
Table 2.
Pendulum Test results, knee joint angle difference between SensAA and reference MAS.
Table 2.
Pendulum Test results, knee joint angle difference between SensAA and reference MAS.
| RMSE |
Standard
deviation |
Average
Difference |
| 3.5° |
3.4° |
2.3° |
Table 3.
Verification Results of the Treadmill Tests, starting at 3 km/h up to 12 km/h.
Table 3.
Verification Results of the Treadmill Tests, starting at 3 km/h up to 12 km/h.
| Walking Speed |
RMSE |
Standard
deviation |
Difference |
| Average |
Minimum |
Maximum |
| 3 km/h |
2.9° |
1.6° |
2.4° |
-3.0° |
7.0° |
| 6 km/h |
6.1° |
5.1° |
3.4° |
-11.1° |
18.2° |
| 9 km/h |
5.2° |
5.1° |
1,0° |
-10.1° |
16.3° |
| 12 km/h |
8.0° |
6.7° |
4.3° |
-11.9° |
24.2° |
|
Disclaimer/Publisher’s Note: The statements, opinions and data contained in all publications are solely those of the individual author(s) and contributor(s) and not of MDPI and/or the editor(s). MDPI and/or the editor(s) disclaim responsibility for any injury to people or property resulting from any ideas, methods, instructions or products referred to in the content. |
© 2024 by the authors. Licensee MDPI, Basel, Switzerland. This article is an open access article distributed under the terms and conditions of the Creative Commons Attribution (CC BY) license (http://creativecommons.org/licenses/by/4.0/).
