Submitted:
09 January 2024
Posted:
09 January 2024
You are already at the latest version
Abstract
Keywords:
1. Introduction
- (1)
- A novel protection method is proposed that relies on the similarity of voltage waveforms between measuring and reference points. It addresses the issue of unreliable operation of AC protection in AC/DC hybrid systems.
- (2)
- The Euclidean distance and dynamic time warping (DTW) distance are investigated to assess waveform similarity, thus avoiding the impact of data asynchrony or protection misoperation caused by a single distance metric.
- (3)
- The least squares method (LSM) is employed to fit the voltage waveform, effectively mitigating interference from high-order harmonics.
2. Comprehensive Voltage Waveform Similarity Calculation
2.1. Waveform Processing
2.2. Euclidean Distance Calculation
2.3. DTW Distance
2.4. Local Dynamic Mapping
2.5. Comprehensive Voltage Waveform Similarity Description
3. System Fault Characteristics and Protection Process
3.1. Hybrid DC Multi-Infeed AC/DC Interconnected System Topology Structure
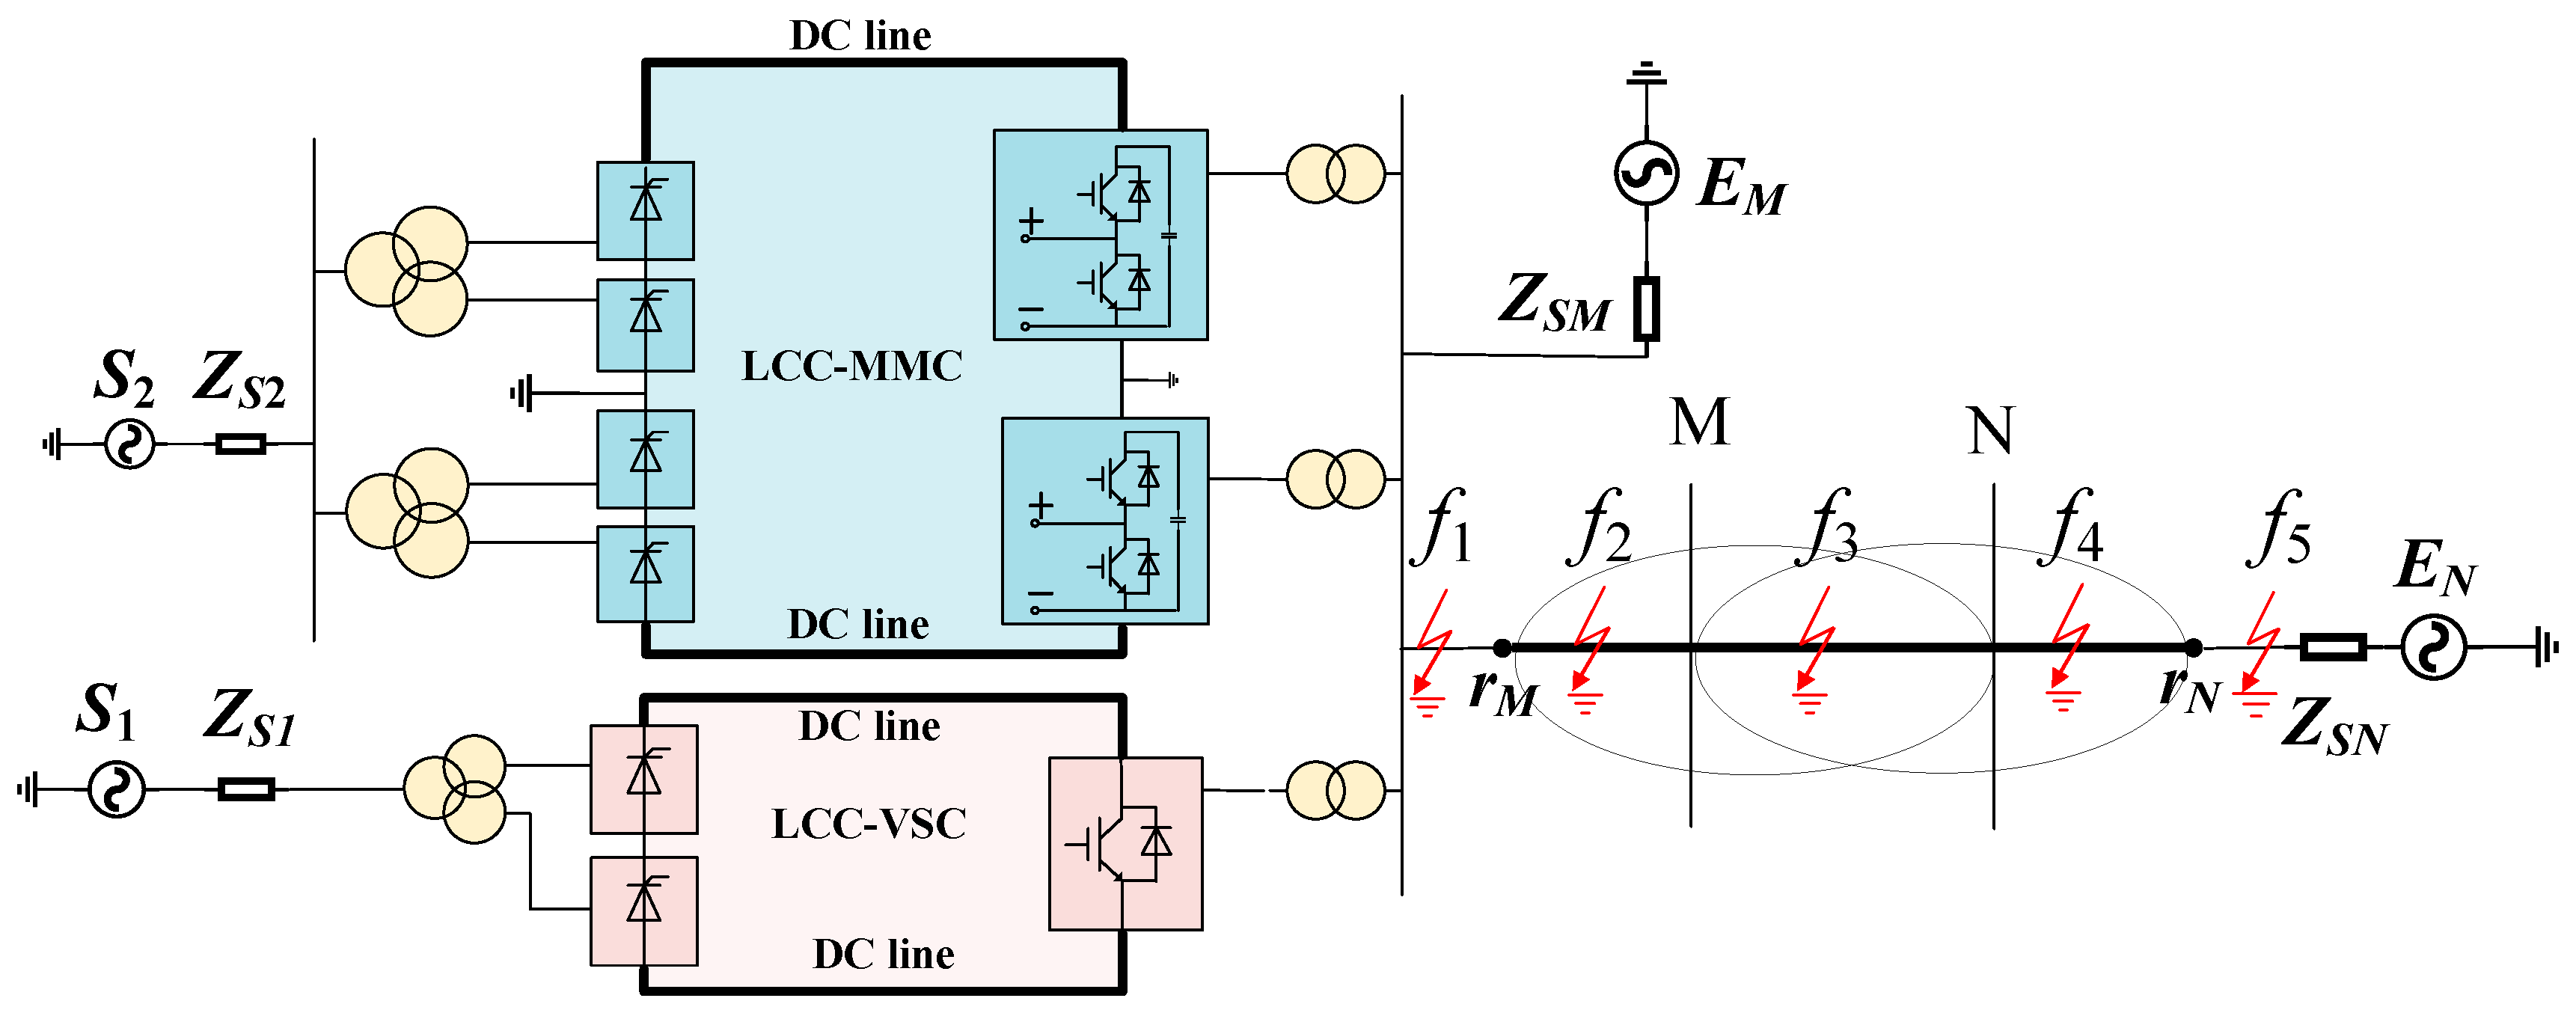
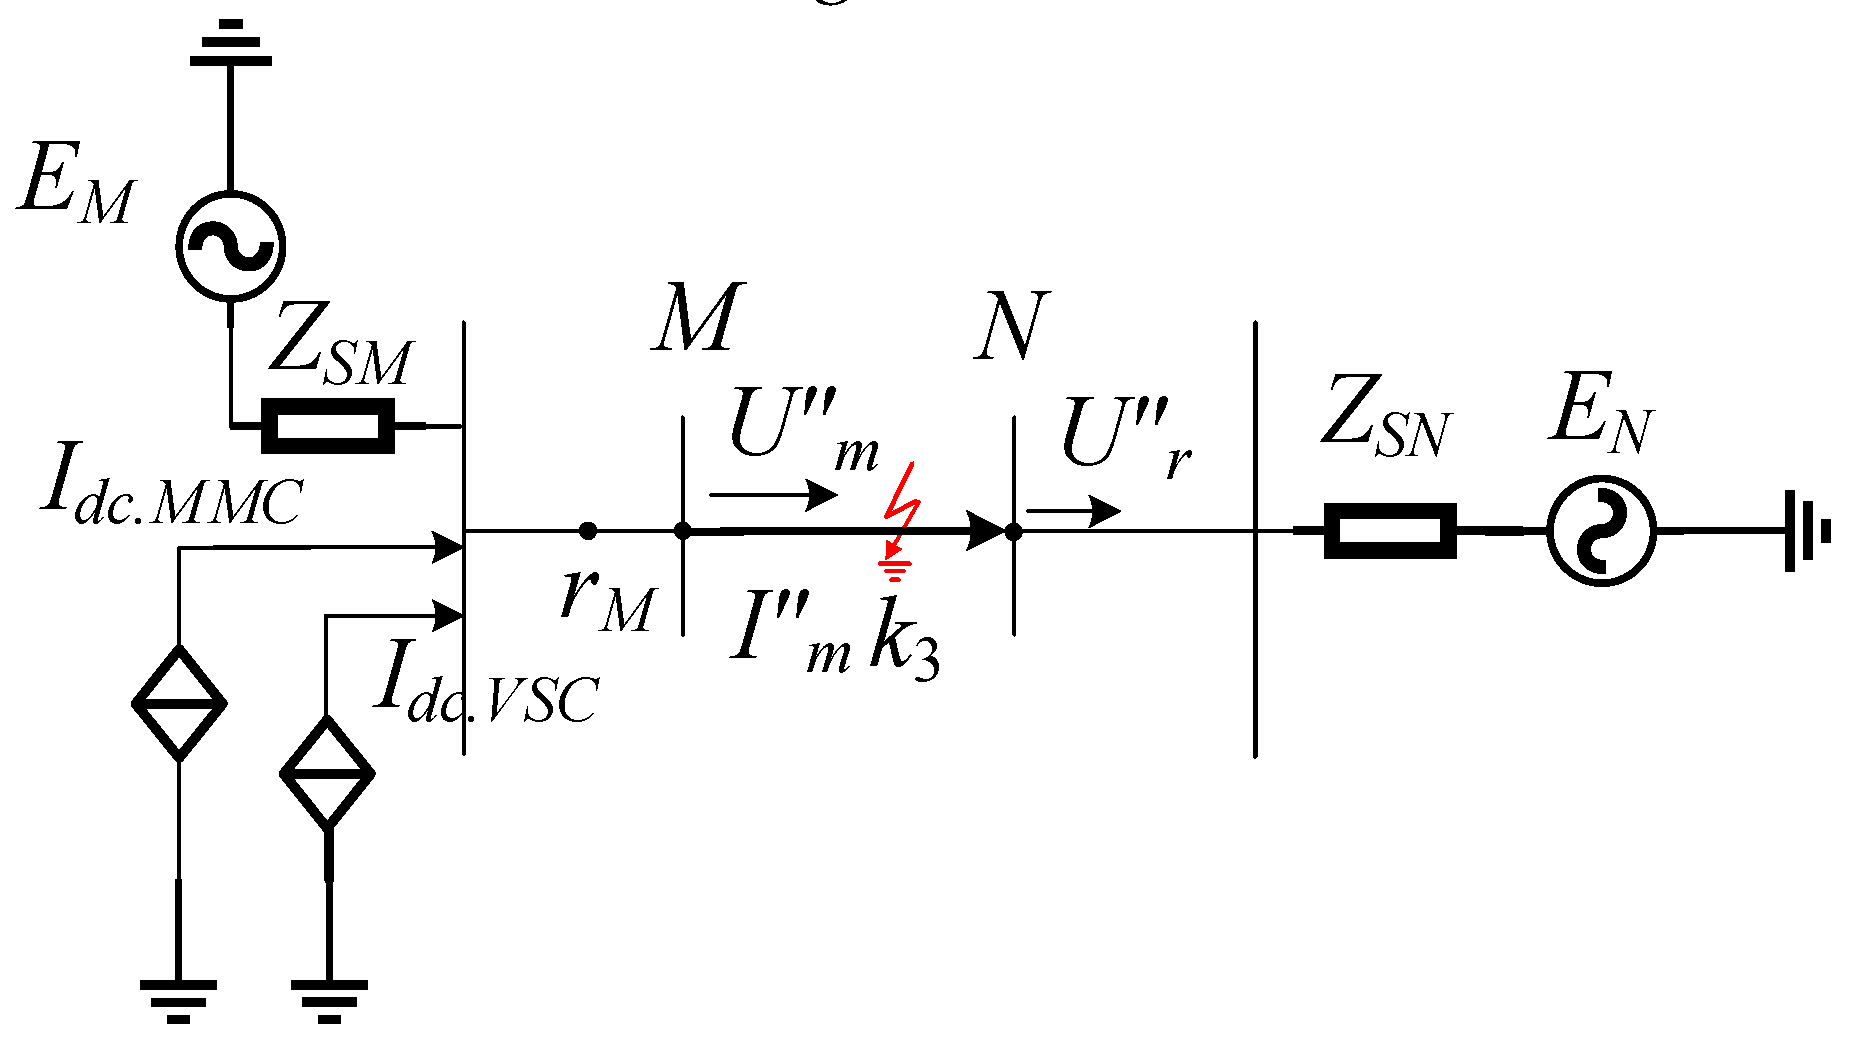
3.2. Reference Voltage Calculation and System Fault Characteristics
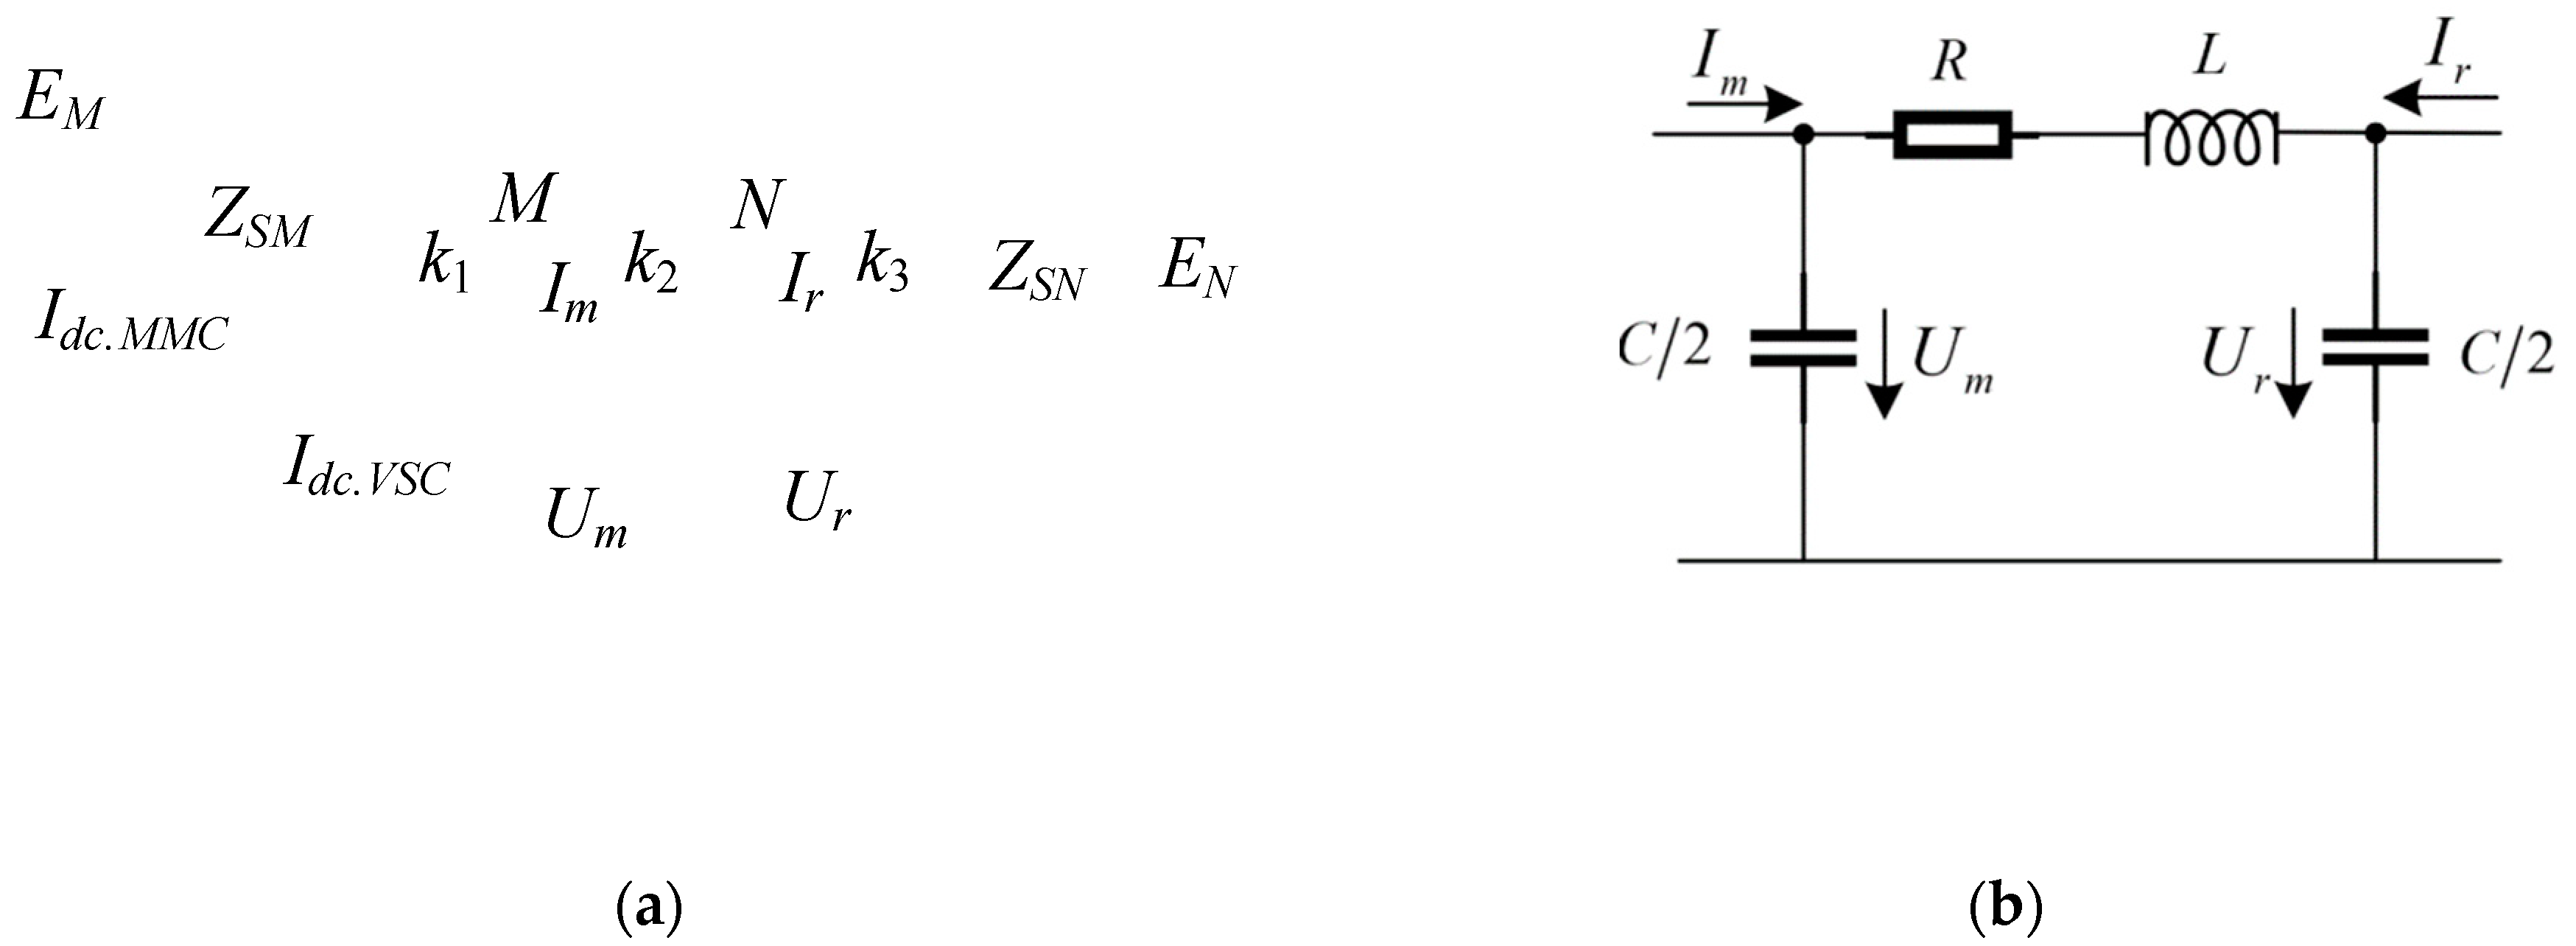
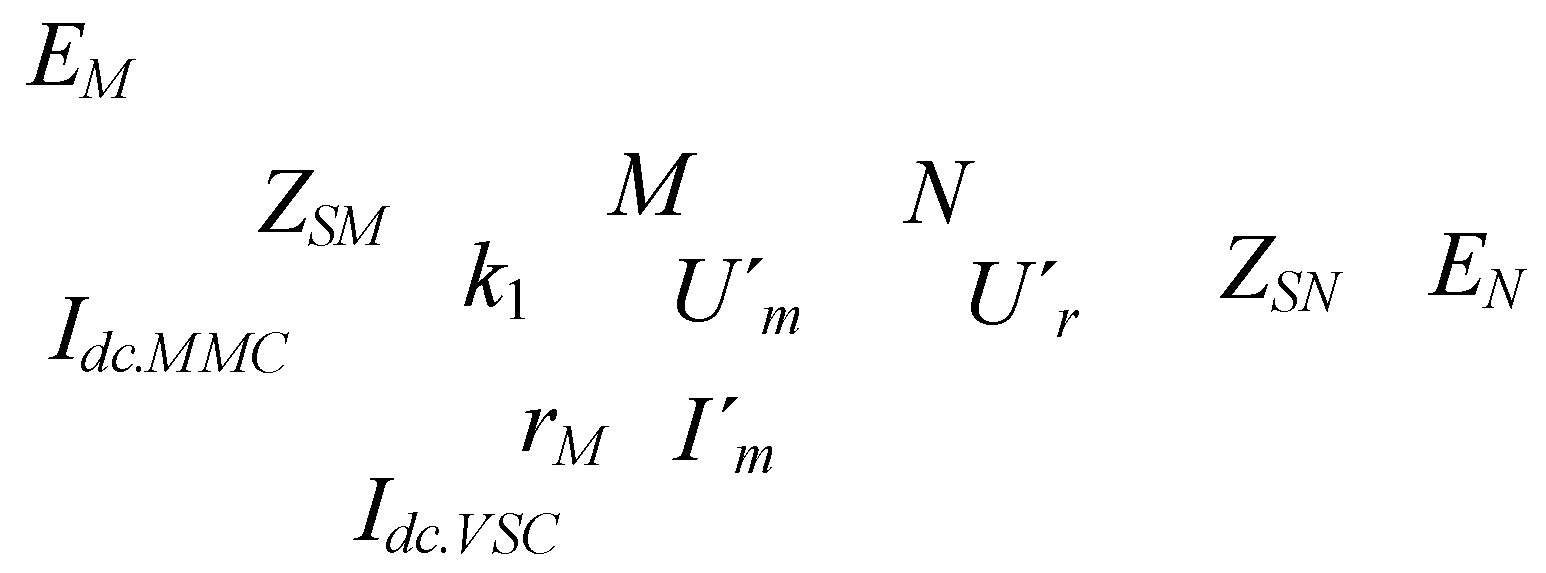
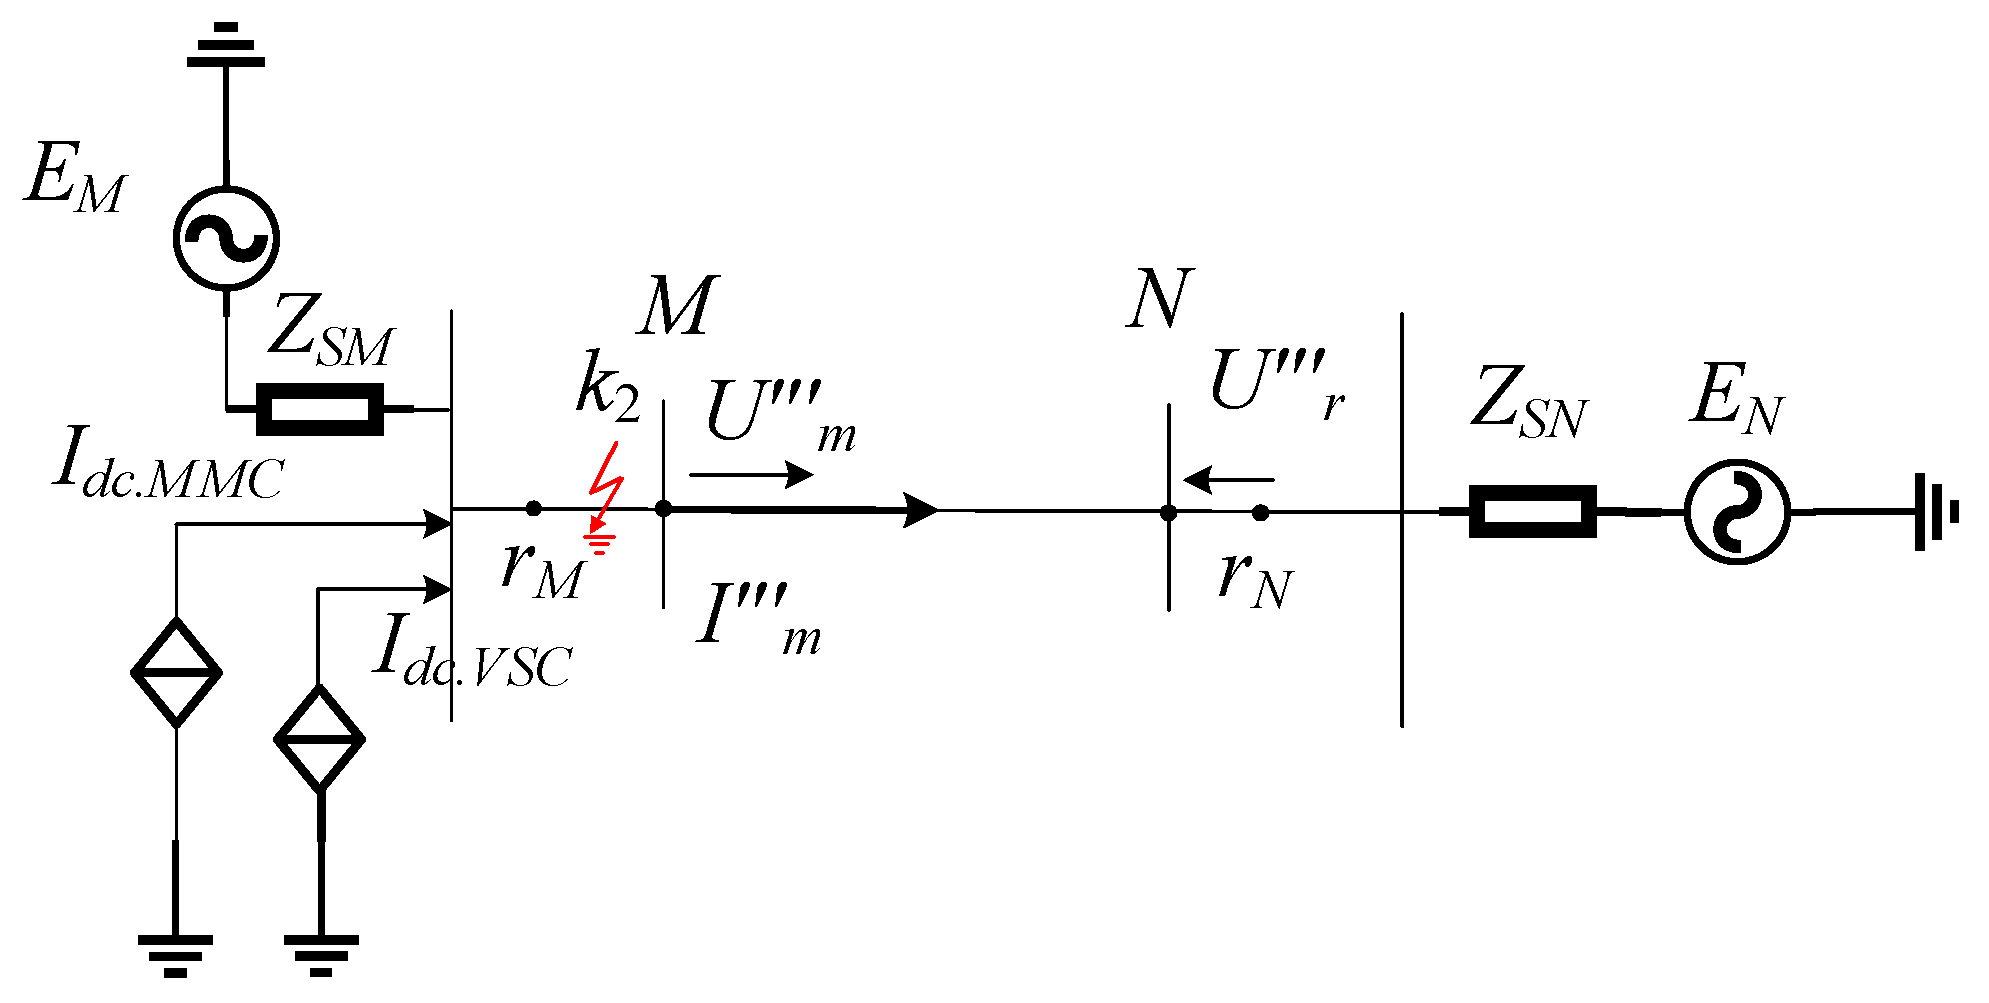
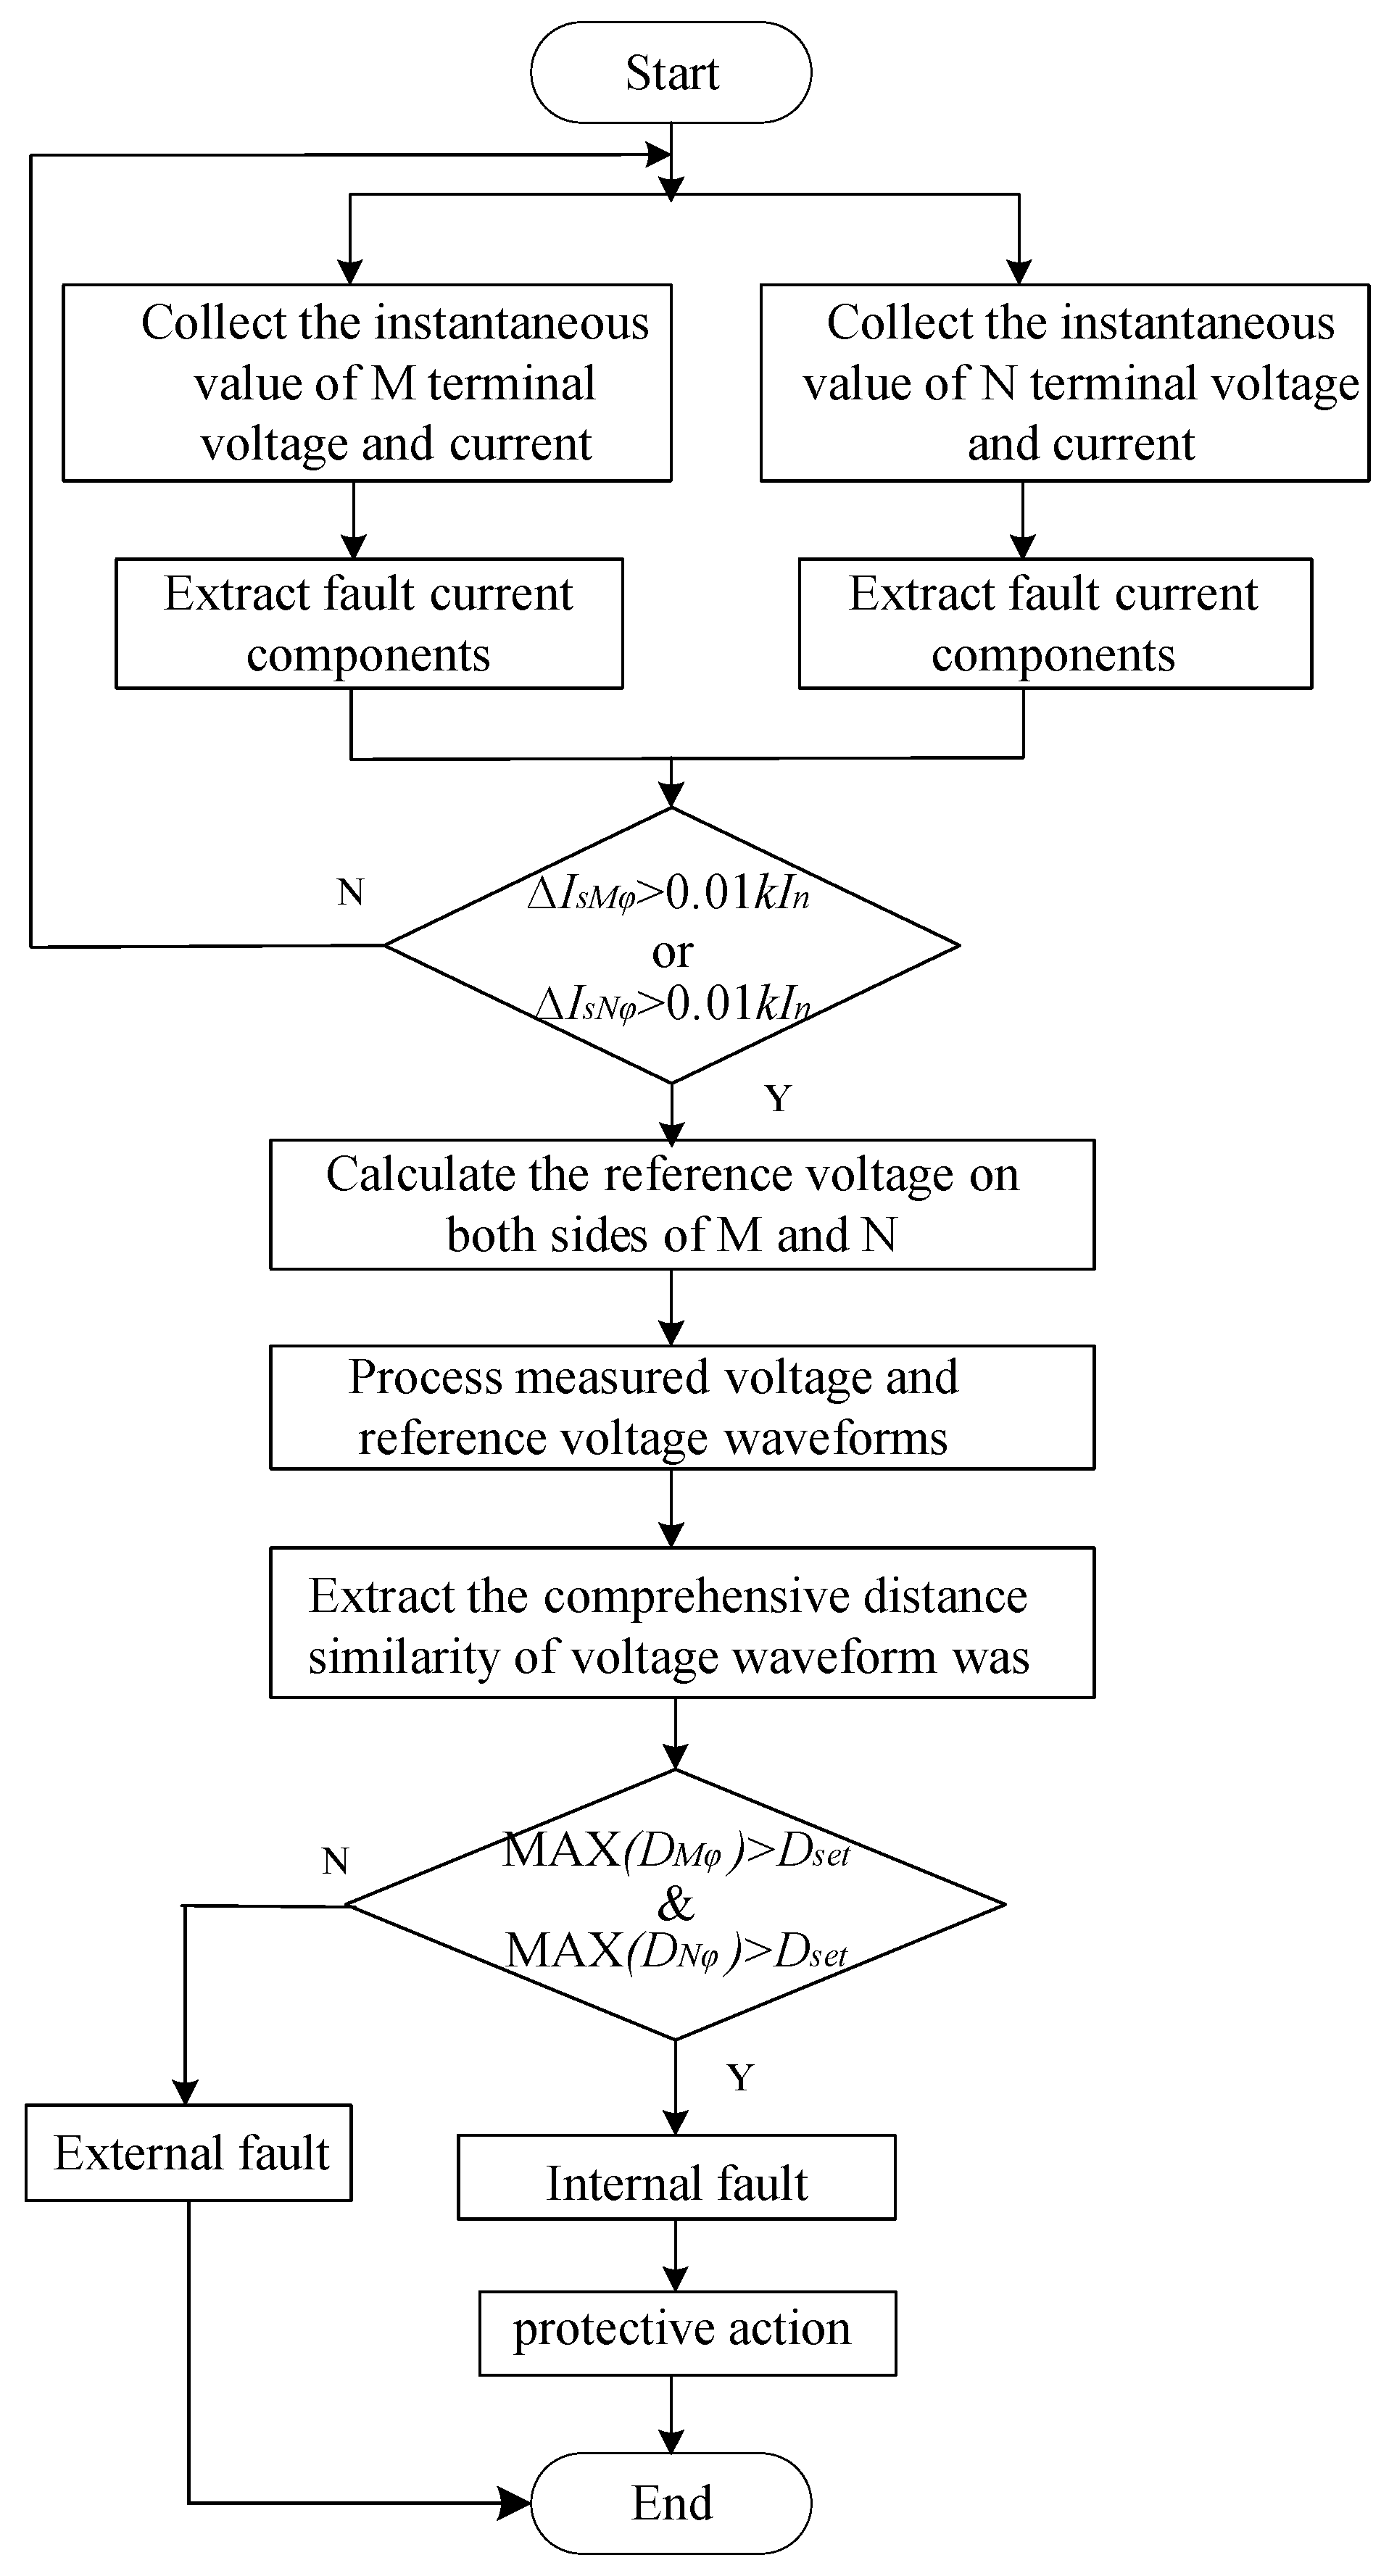
3.3. Protection Action Criteria
4. Experimental Verification
4.1. Introduction to the Experimental Platform
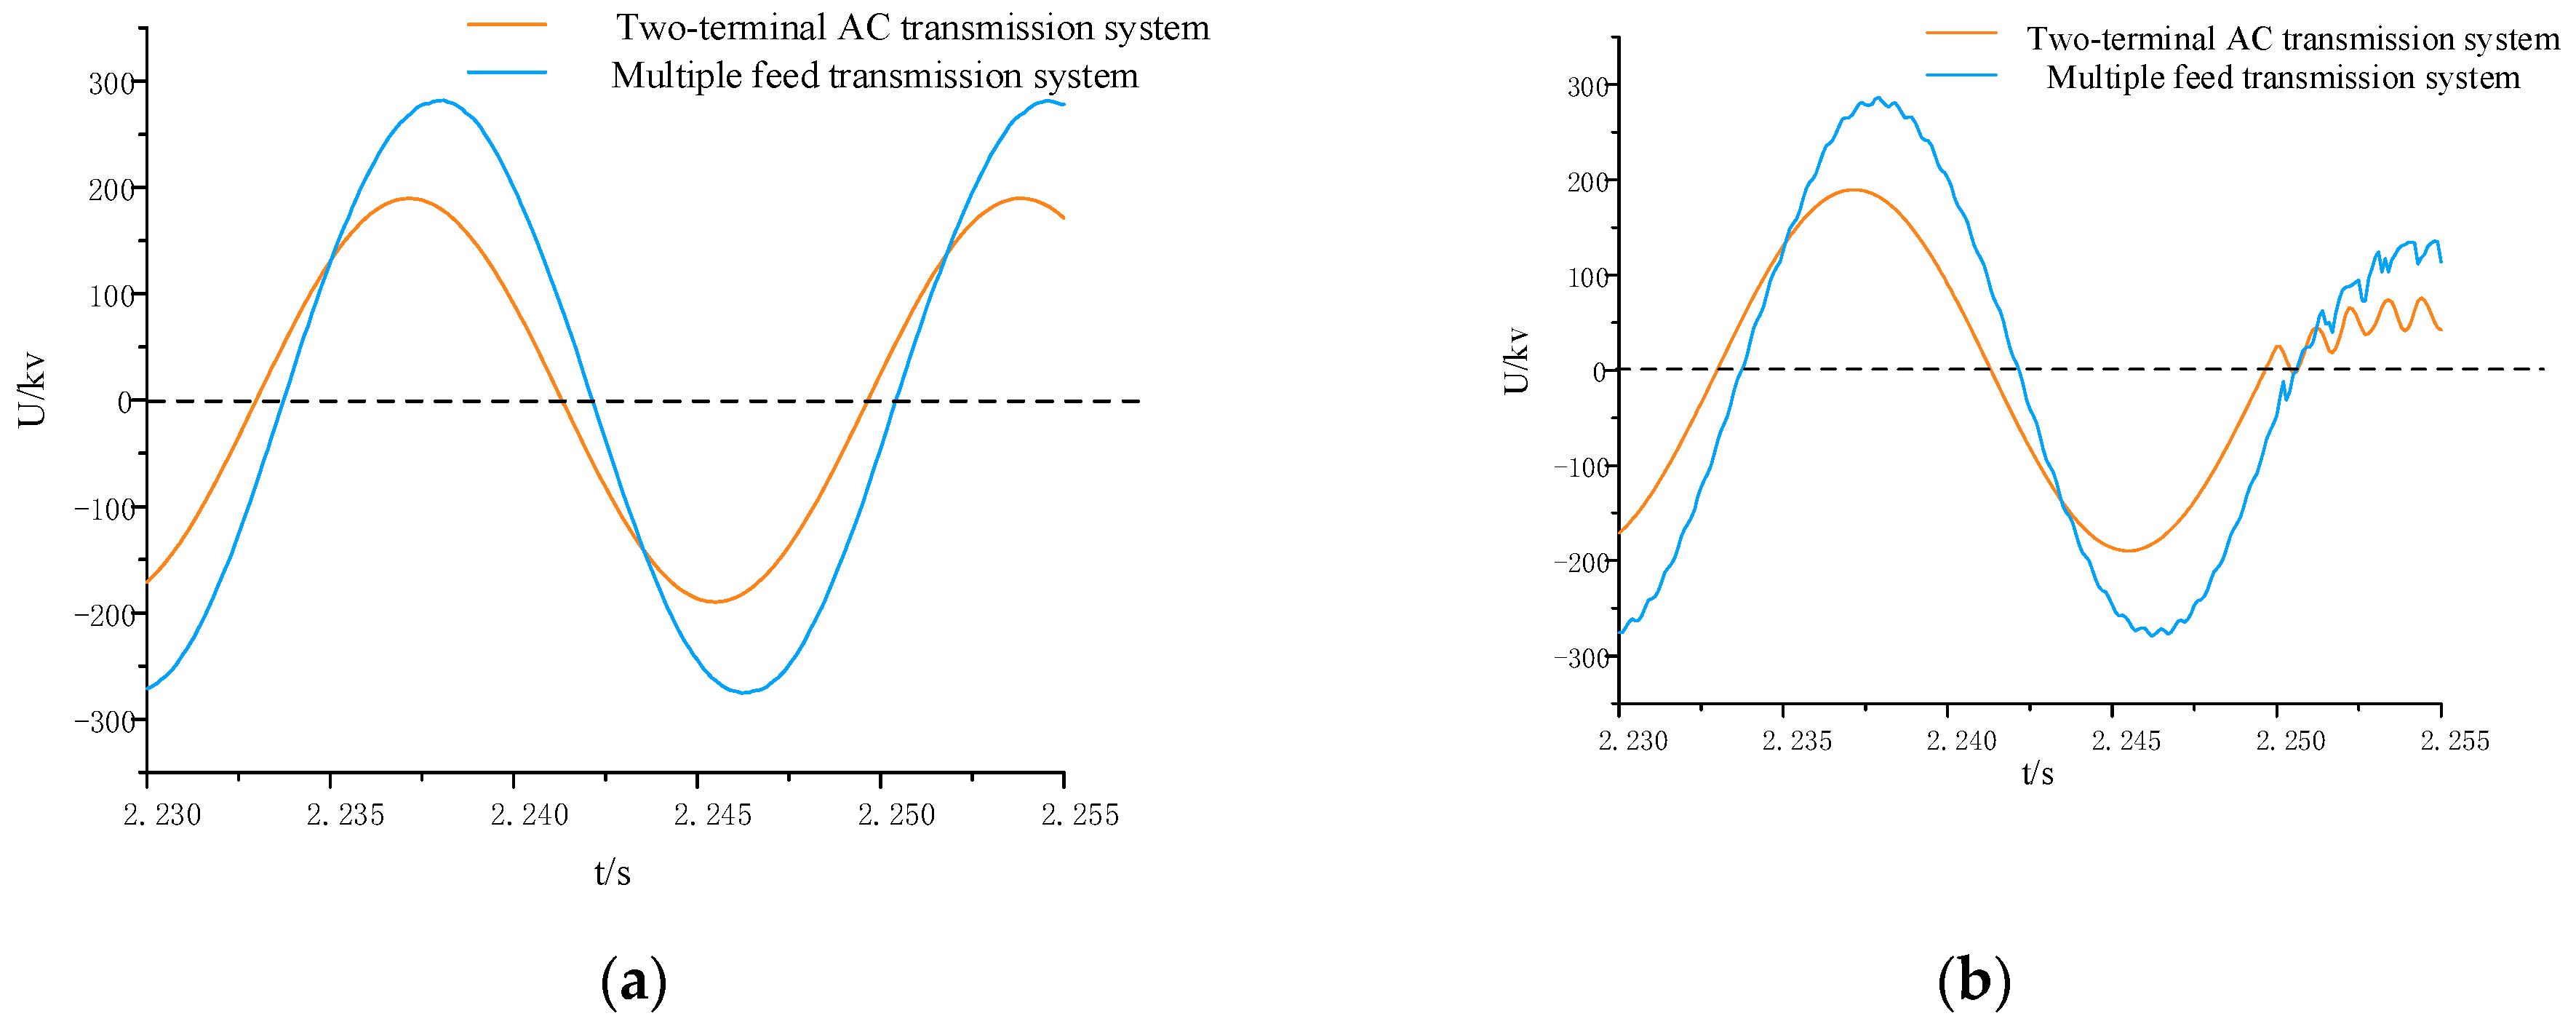
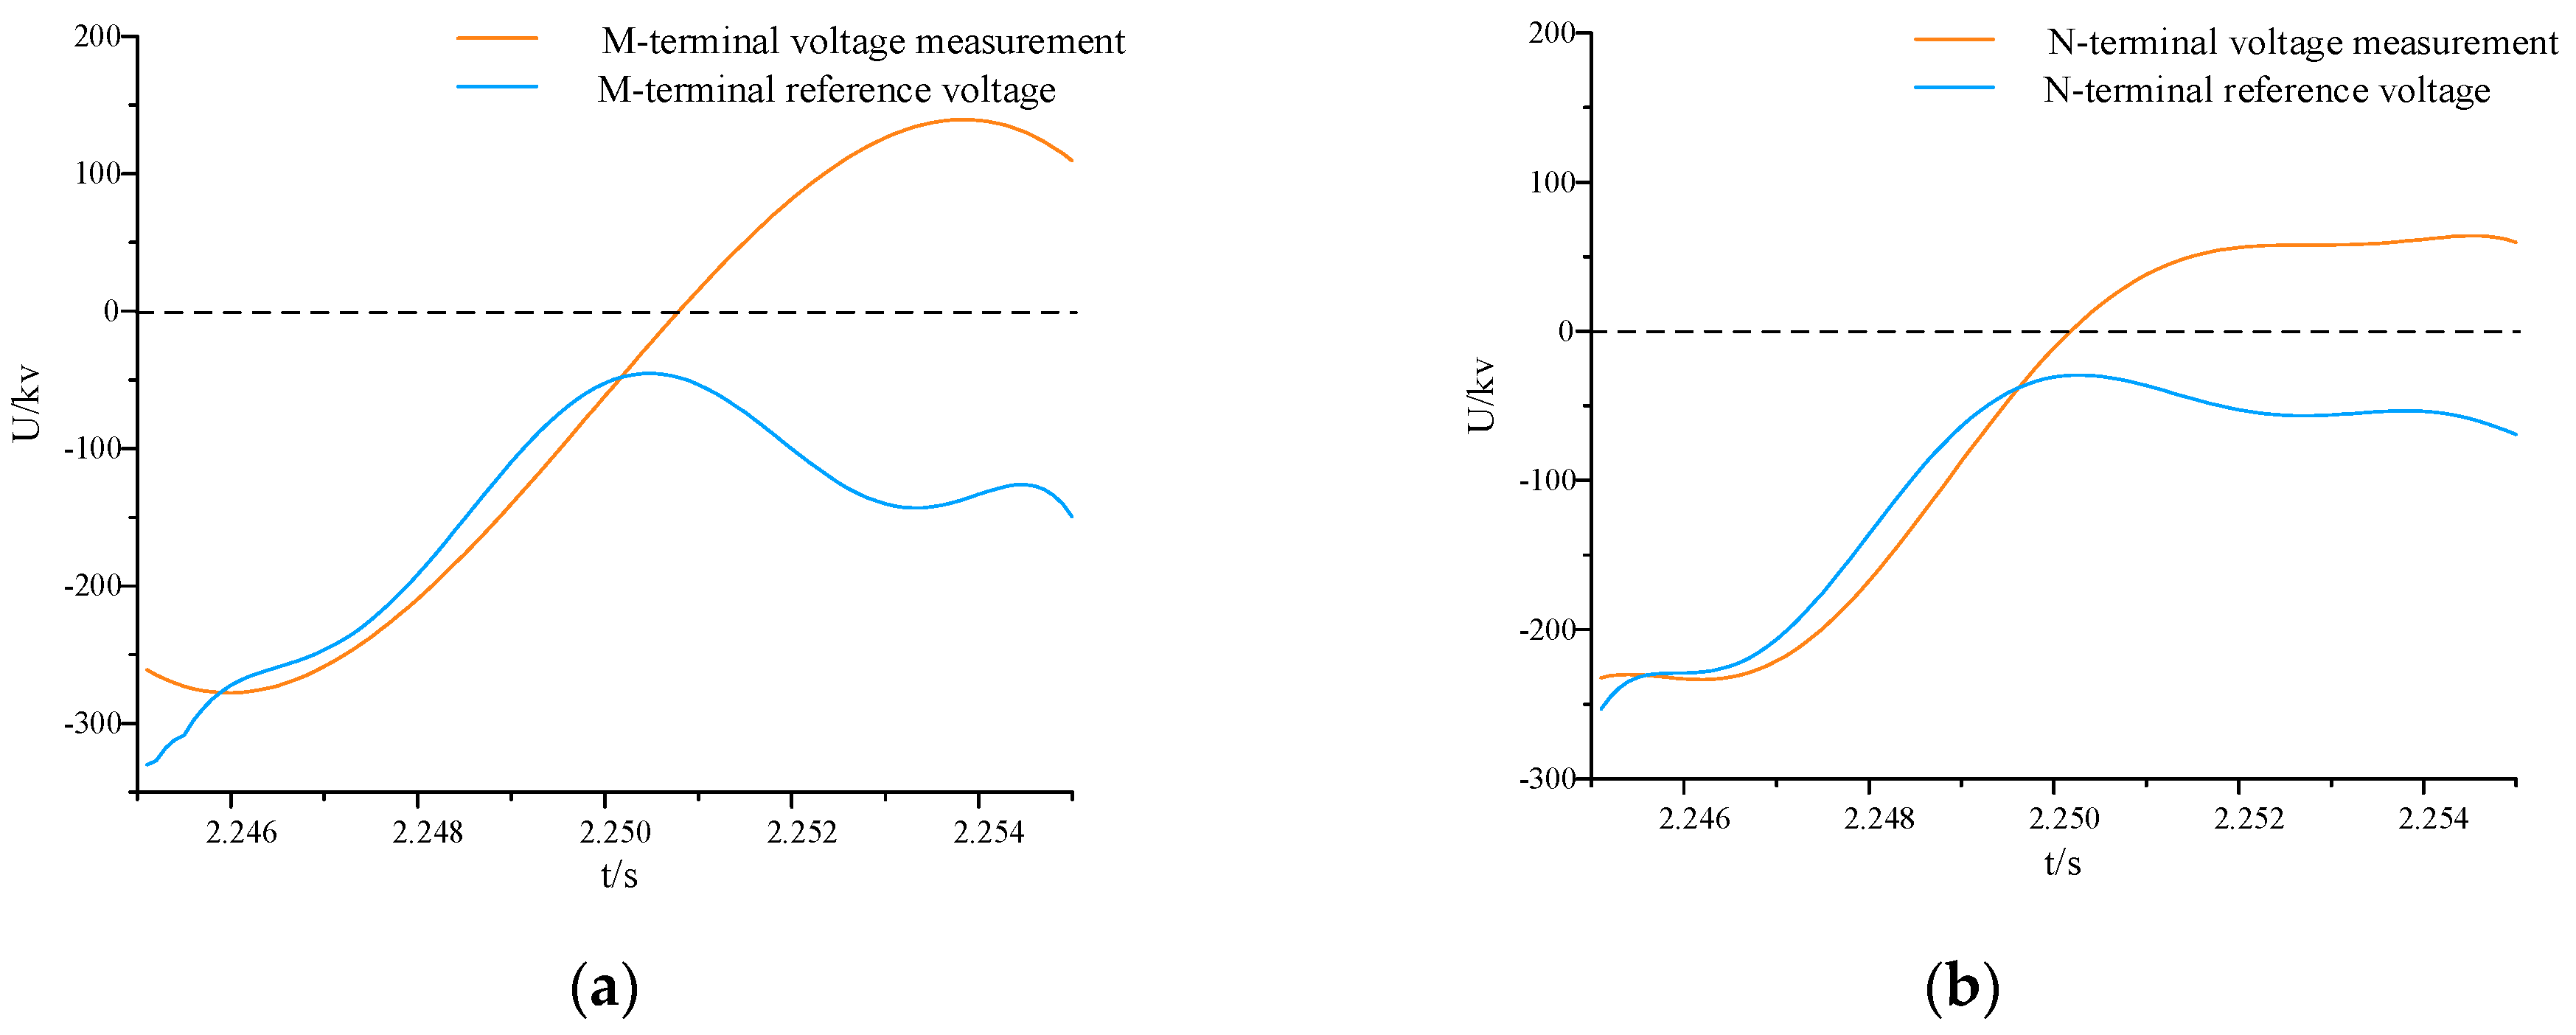
4.2. In-Zone Fault Simulation Result
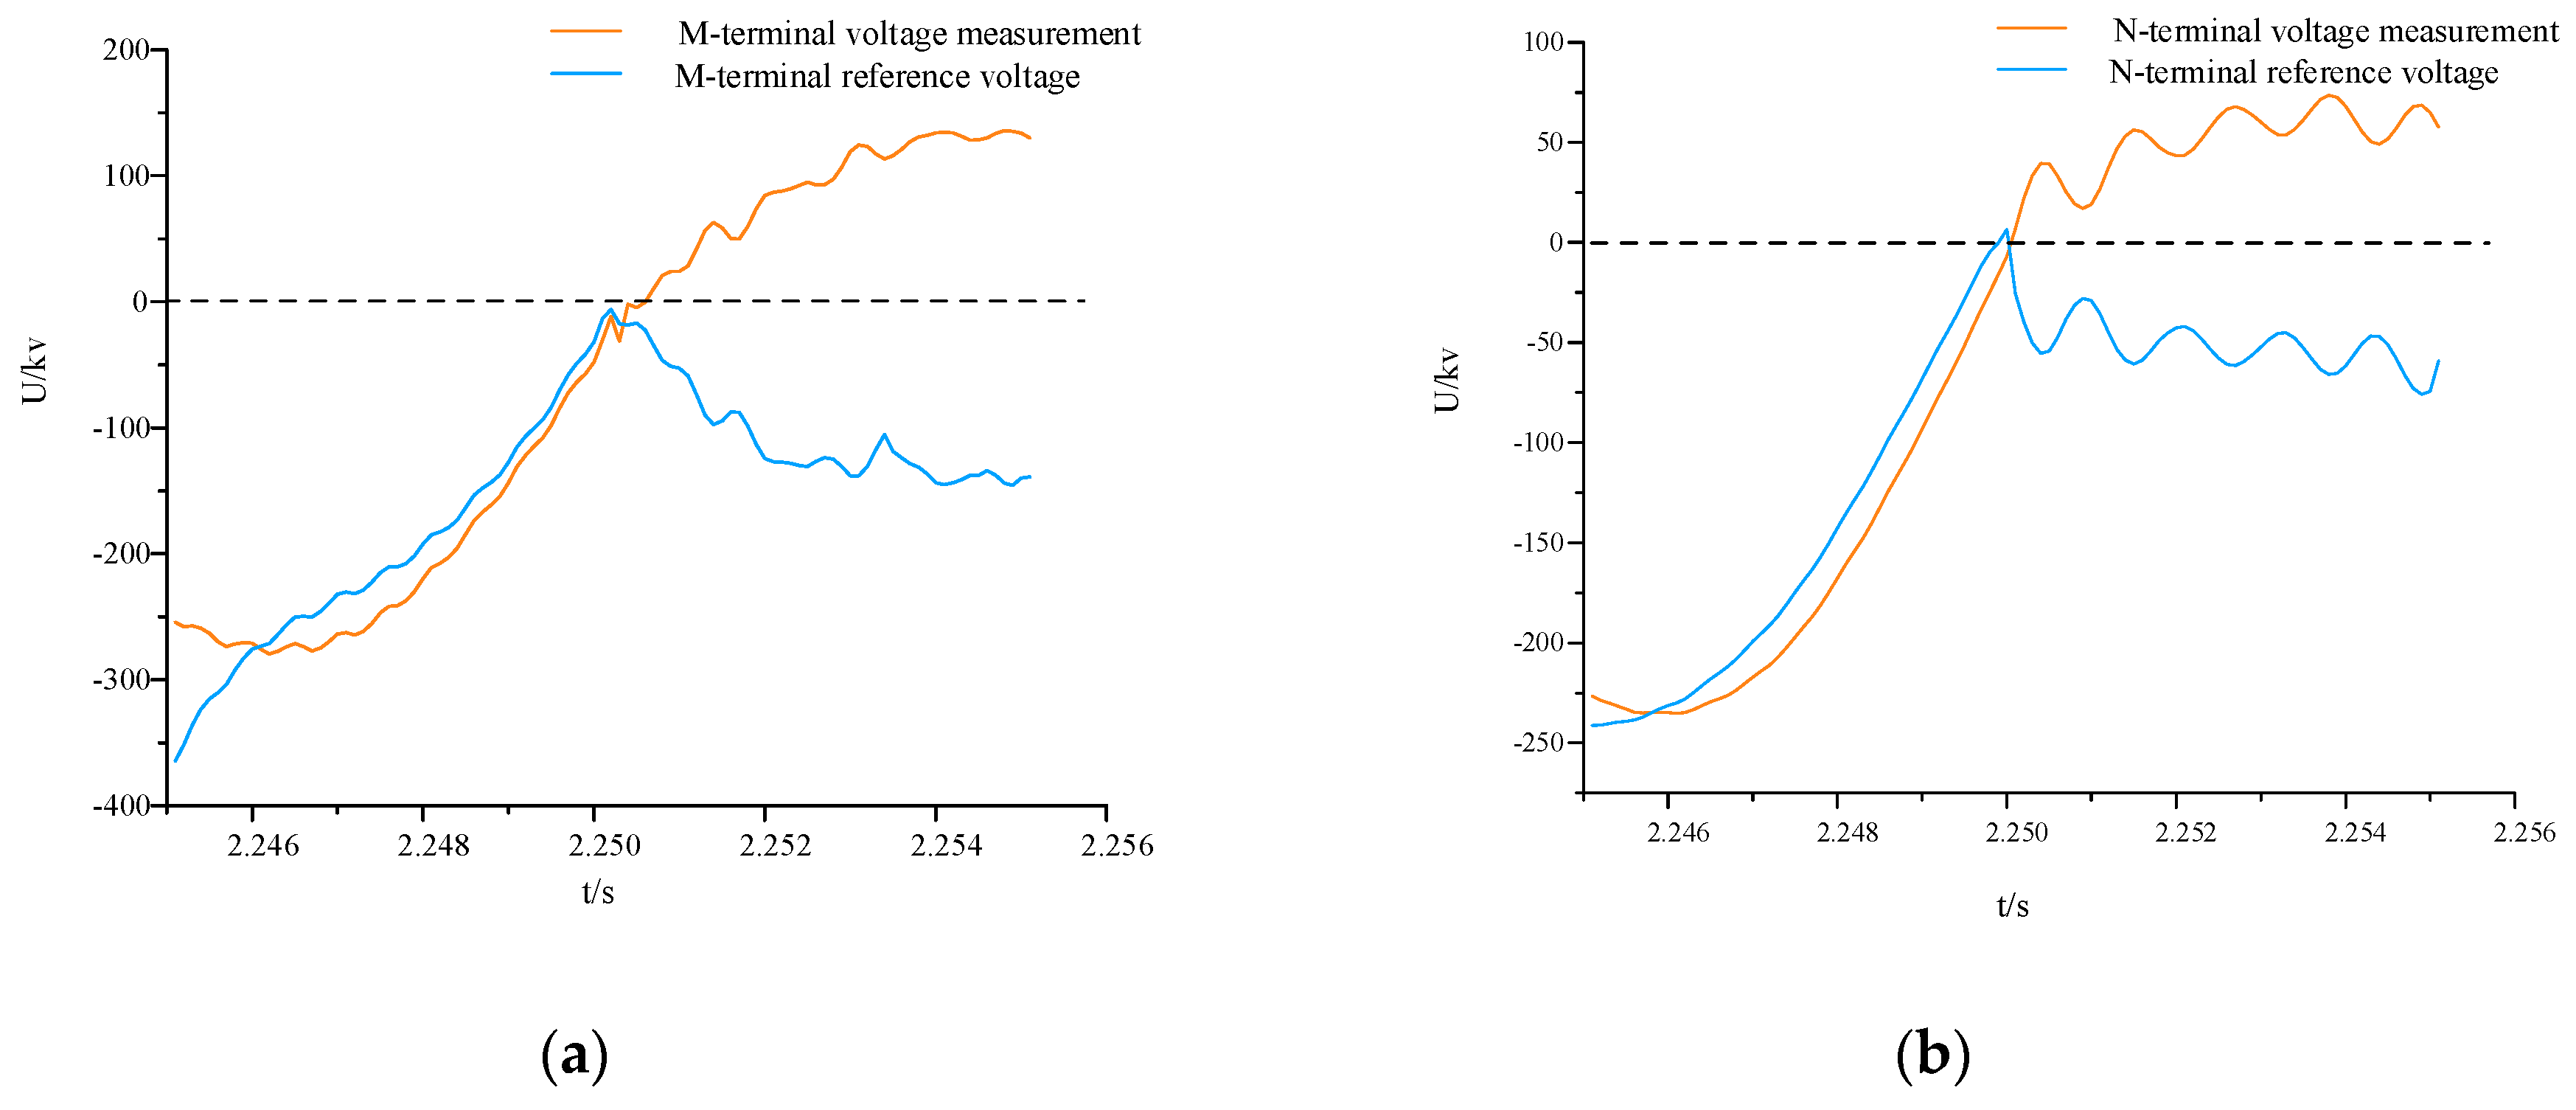
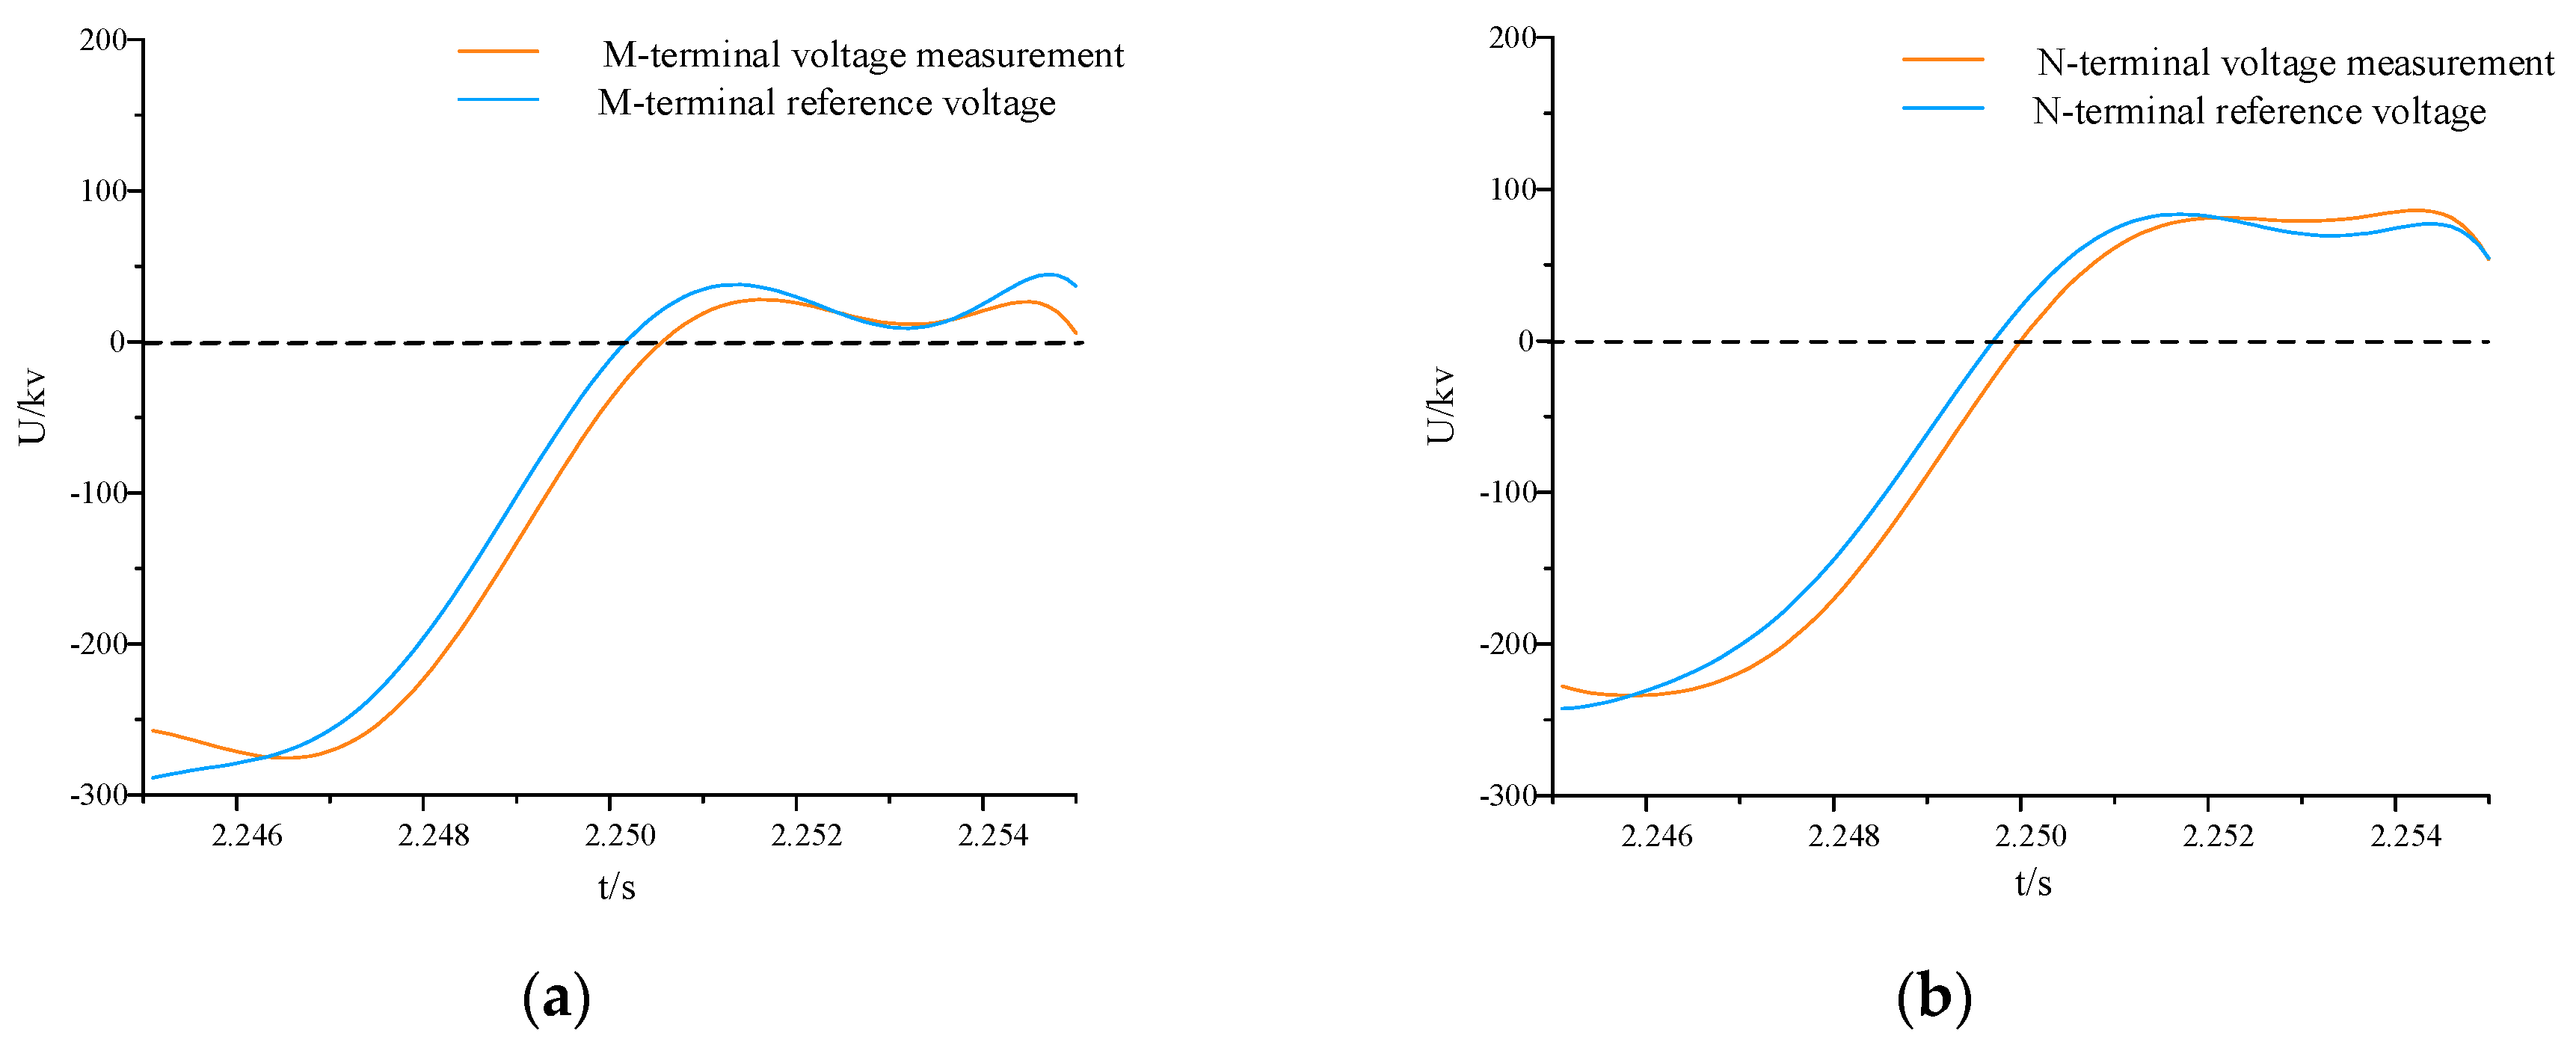
4.3. Out-of-Zone Fault Simulation Result
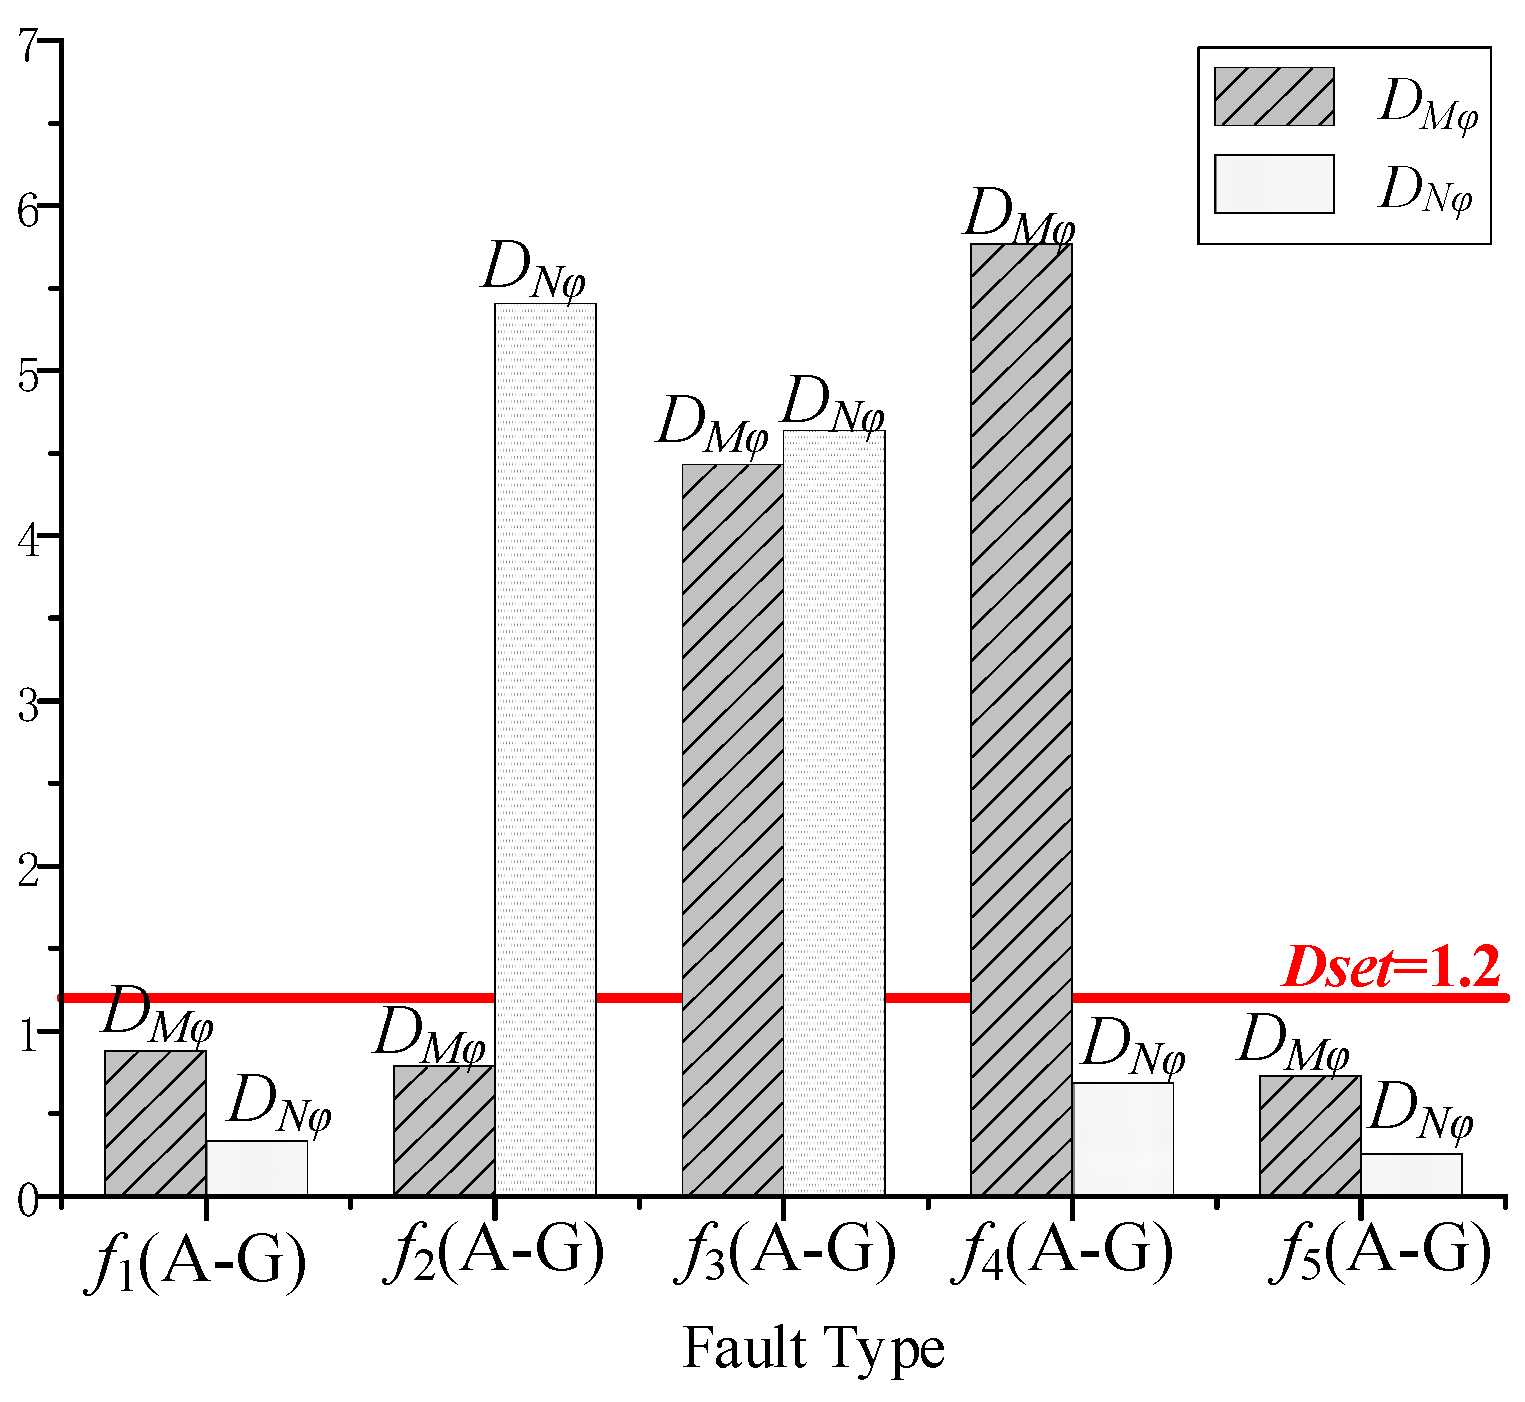
4.4. Protection Action Status
4.5. Anti-Interference Analysis
4.6. Comparison and Discussion
5. Conclusions
Author Contributions
Funding
Data Availability Statement
References
- A, Alassi; S, Bañales; O, Ellabban; G, Adam and C, MacIver. HVDC transmission: technology review, market trends and future outlook. Renewable and Sustainable Energy Reviews 2019, 112, 530–554. [CrossRef]
- Haleem, NM; Rajapakse, AD; Gole, AM; Fernando, IT. Investigation of fault ride-through capability of hybrid VSC-LCC multi-terminal HVDC transmission systems. IEEE Transactions on Power Delivery 2019, 34, 241–250. [CrossRef]
- Xiao, H; Zhang, Y; Xue, Yand Yao, W. Correcting the Calculation Method of Commutation Failure Immunity Index for LCC-HVDC Inverters. IEEE Transactions on Power Delivery 2022, 37, 5469-5472. [CrossRef]
- Zheng, H; Yuan, X; Cai, J; Sun, P and Zhou, L. Large-Signal Stability Analysis of DC Side of VSC-HVDC System Based on Estimation of Domain of Attraction. IEEE Transactions on Power Systems 2022, 37, 3630-3641. [CrossRef]
- Guo, C; Liu, W; Zhao, J; et al. Impact of control system on small-signal stability of hybrid multi-infeed HVDC system. IET Generation, Transmission & Distribution 2018, 12, 4233–4239.
- S. V, Unde; P. Gawande and S. Dambhare. New Algorithm for Protection of Double Circuit Transmission Lines Using Modal Currents. IEEE Transactions on Power Delivery 2019, 34, 1967-1977. [CrossRef]
- Hao, X; Li, Y; He, X et al. A rapid assessment method of commutation failure immunity level for hybrid multi-infeed HVDC transmission systems. Proceedings of the CSEE 2017, 37, 4986-4998+5218. [CrossRef]
- Zhou, H; Yao, W; Ai, X; Li, D; Wen, J; Li, C. Comprehensive review of commutation failure in HVDC transmission systems. Electric Power Systems Research 2022, 205, 107768. [CrossRef]
- Jing, L; Wang, B; Dong, X. Review of consecutive commutation failure research for HVDC transmission system. Electric Power Automation Equipment 2019, 39, 116-123. [CrossRef]
- Hao, X; Li, Y; He, X; Yi, X and Duan, X. A Rapid Assessment Method of Commutation Failure Immunity Level for Hybrid Multi-infeed HVDC Transmission Systems. Proceedings of the Chinese Society of Electrical Engineering 2017, 37. 4986-4998. [CrossRef]
- Zheng, Z; Song, D; Du, K; Xiao, X; Ren, J; and Xie, Q. A Continuous Fault Ride-through Scheme for DFIGs Under Commutation Failures in LCC-HVDC Transmission Systems. Journal of Modern Power Systems and Clean Energy 2023, 11, 1126-135. [CrossRef]
- Li, X; Cai, Z; Huang, M et al. Transient Power Converse in an AC/DC Interconnected Power Grid. Automation of Electric Power Systems 2012, 36, 61-66+85.
- J. Ma, W. Ma, Y. Qiu, and J. S. Thorp. An adaptive distance protection scheme based on the voltage drop equation,” IEEE Transactions on Power Delivery 2015, 30, 1931–1940. [CrossRef]
- Huang, K; Jiao, B; Yu, Y; Liu, H; Hao, Q and Liu, Y. Performance Improvement for Pilot Protection of Double Circuit Lines on the Same Tower Based on Power Converse Accurate Identification, 2023 IEEE International Conference on Advanced Power System Automation and Protection (APAP) China, 2023, 260-264. [CrossRef]
- Huang, N; Fan, C; Jiang, S. Research of Protection for AC Transmission Lines Based on Characteristic of Grid-side Inverter. Journal of Engineering 2019, 16, 3240-3245. [CrossRef]
- Huang, J; Gao, H; Zhao, L and Feng, Y. Instantaneous Active Power Integral Differential Protection for Hybrid AC/DC Transmission Systems Based on Fault Variation Component, IEEE Transactions on Power Delivery 2020, 35, 2791-2799. [CrossRef]
- J. Ma, Y. Wu, and A. G. Phadke, A novel AC line distance protection scheme for AC/DC hybrid system based on fault likeness factor. IET Generation, Transmission & Distribution 2020, 15, 912–926. [CrossRef]
- Zheng, J; Wen, M; Chen, Y; Shao, X. A novel differential protection scheme for HVDC transmission lines. International Journal of Electrical Power & Energy Systems 2018, 94, 171-178. [CrossRef]
- Psaras, Vasileios; Dimitrios, Tzelepis; Dimitrios, Vozikis; Grain Philip Adam; and Graeme, Burt. Non-Unit Protection for HVDC Grids: An Analytical Approach for Wavelet Transform-Based Schemes. IEEE Transactions on Power Delivery 2021, 36.5, 2634-645. [CrossRef]
- Tian, C; Li, K. A method of ambiguity resolution based on matrix ordering. Journal of Navigation and Positioning 2021, 9, 65-70.
- Song, J; Cui, Y; Li, X; et al. Load Curve Clustering Method Based on Euclidean Dynamic Time Warping Distance and Entropy Weight. Automation of Electric Power System 2020, 44, 87-94.
- Cai, S; Lu, Z; Chen, B; Guo, Lin; Qing, Z; and Yao, L. Dynamic Gesture Recognition of A-Mode Ultrasonic Based on the DTW Algorithm. IEEE Sensors Journal 2022, 18, 17924-17931. [CrossRef]
- Ma, J; Kang, J; Zhou, Y and Cheng, P. A Novel Pilot Protection Scheme for AC Line Connected to LCC-HVDC Inverter Based on Composite-Mode Model. IEEE Transactions on Power Delivery 2022, 37, 1627-1639. [CrossRef]
- Zhang, H; Cong, W; Kong, H; Chen, M and Wei, Z. Longitudinal Protection Method based on Voltage Waveform Comparison for AC / DC Hybrid System. 2020 IEEE/IAS Industrial and Commercial Power System Asia (I&CPS Asia), 2020, 937-942. [CrossRef]
- Gao, W; He, W; Wai, R; Zeng, X; Guo, M. High-impedance arc fault modeling for distribution networks based on dynamic geometry dimension. Electric Power Systems Research 2024, 229, 110109. [CrossRef]
| Terminal voltage EM/EN(/kV) | 230 |
| Short-circuit ratio | 5 |
| MN line length (/km) | 100 |
| Two-terminal out-of-zone line length (/km) | 30 |
| Total length at receiving end (/km) | 160 |
| Positive-sequence parameters of line R1(Ω/km) | 0.01782 |
| Positive-sequence parameters of line ωL1 (Ω/km) | 0.3139 |
| Positive-sequence parameters of line ωC1 (S/km) | 3.626×10⁻⁶ |
| Zero-sequence parameters of line R0(Ω/km) | 0.2952 |
| Zero-sequence parameters of line ωL0 (Ω/km) | 1.039 |
| Zero-sequence parameters of line ωC0 (S/km) | 2.414×10⁻⁶ |
| Fault Type | Transition resistance (Ω) | DMA | DMB | DMC | DNA | DNB | DNC |
|---|---|---|---|---|---|---|---|
| Single-phase ground fault | 0.01 | 4.4298 | 0.3175 | 0.8093 | 4.6376 | 0.2579 | 0.2792 |
| 50 | 3.1682 | 0.3248 | 0.7994 | 3.2402 | 0.2459 | 0.2690 | |
| 100 | 2.7807 | 0.3268 | 0.7998 | 2.6619 | 0.2279 | 0.2612 | |
| Double-phase ground fault | 0.01 | 0.1387 | 3.3960 | 2.5062 | 0.4000 | 7.5495 | 4.4422 |
| 50 | 0.4916 | 6.4778 | 3.7474 | 0.1258 | 7.6393 | 4.1362 | |
| 100 | 0.5539 | 6.5028 | 4.8863 | 0.1434 | 7.7454 | 4.1295 | |
| Three-phase ground fault | 0.01 | 5.2445 | 8.6719 | 3.0781 | 6.3565 | 5.2792 | 6.3929 |
| 50 | 4.2174 | 8.2139 | 3.0262 | 4.4252 | 4.1751 | 6.8504 | |
| 100 | 3.6431 | 3.5486 | 2.8565 | 3.5486 | 7.6422 | 6.8159 | |
| Phase-to-phase short circuit fault | 0.4916 | 7.4778 | 4.8882 | 0.1258 | 6.6393 | 4.1362 | |
| Fault location | Fault type | DMA | DMB | DMC | DNA | DNB | DNC |
| f1 | (A-G) | 0.4191 | 0.3818 | 0.8793 | 0.2577 | 0.2016 | 0.3326 |
| (BC-G) | 0.3387 | 0.7960 | 0.4305 | 0.3298 | 0.6940 | 0.4132 | |
| (ABC-G) | 0.5454 | 0.5267 | 0.3940 | 0.6781 | 0.8451 | 0.6219 | |
| f2 | (A-G) | 0.4237 | 0.3780 | 0.8514 | 8.2461 | 0.2011 | 0.3291 |
| (BC-G) | 0.3398 | 0.7862 | 0.4297 | 0.3127 | 4.6844 | 5.4057 | |
| (ABC-G) | 0.5401 | 0.5227 | 0.3899 | 4.6774 | 5.8057 | 4.6211 | |
| f4 | (A-G) | 3.4668 | 0.3669 | 0.7471 | 0.1971 | 0.2014 | 0.3279 |
| (BC-G) | 0.3598 | 5.7681 | 4.4179 | 0.3177 | 0.6873 | 0.4098 | |
| (ABC-G) | 4.5129 | 4.5115 | 4.4187 | 0.6228 | 0.8047 | 0.6047 | |
| f5 | (A-G) | 0.4795 | 0.3215 | 0.7258 | 0.0904 | 0.1995 | 0.2525 |
| (BC-G) | 0.3671 | 0.7543 | 0.3938 | 0.1097 | 0.6574 | 0.3561 | |
| (ABC-G) | 0.4911 | 0.4981 | 0.3477 | 0.6129 | 0.7987 | 0.5917 |
| Fault location | Fault type | DMA | DMB | DMC | DNA | DNB | DNC |
| 10% | (A-G) | 6.7142 | 0.2533 | 0.0574 | 5.7713 | 0.2314 | 0.2732 |
| (BC-G) | 0.4351 | 4.4981 | 4.3163 | 0.1473 | 6.8017 | 4.1781 | |
| (ABC-G) | 7.0384 | 6.9961 | 6.6941 | 7.4620 | 8.0194 | 6.9814 | |
| 50% | (A-G) | 4.5695 | 0.2654 | 0.7600 | 5.1755 | 0.2522 | 0.2696 |
| (BC-G) | 0.4101 | 3.4312 | 3.6343 | 0.1347 | 7.2423 | 3.8155 | |
| (ABC-G) | 4.8054 | 4.5203 | 3.3509 | 5.4671 | 6.2985 | 6.5022 | |
| 90% | (A-G) | 1.9995 | 0.2467 | 0.7250 | 7.2727 | 0.1836 | 0.2470 |
| (BC-G) | 0.2174 | 3.3058 | 3.1673 | 0.0571 | 3.1982 | 2.0070 | |
| (ABC-G) | 4.3491 | 4.1847 | 2.7319 | 5.4894 | 6.7844 | 6.0876 |
| Model | [24] | Longitudinal differential protection | Ours |
|---|---|---|---|
| Data window | 6.25ms | 1ms | 1ms |
| Protection operation time | 8ms | 4.6ms | 3ms |
| Error occurrence conditions | 100Ω | 200Ω | 1000Ω |
Disclaimer/Publisher’s Note: The statements, opinions and data contained in all publications are solely those of the individual author(s) and contributor(s) and not of MDPI and/or the editor(s). MDPI and/or the editor(s) disclaim responsibility for any injury to people or property resulting from any ideas, methods, instructions or products referred to in the content. |
© 2024 by the authors. Licensee MDPI, Basel, Switzerland. This article is an open access article distributed under the terms and conditions of the Creative Commons Attribution (CC BY) license (http://creativecommons.org/licenses/by/4.0/).


