Preprint
Article

Does Digital Agricultural Technology Extension Service Enhance Sustainable Food Production? Evidence from Maize Farmers in China

Altmetrics

Downloads

128

Views

31

Comments

0

A peer-reviewed article of this preprint also exists.

This version is not peer-reviewed

Submitted:

09 January 2024

Posted:

09 January 2024

You are already at the latest version

Alerts
Abstract
Digital agricultural technology extension service and sustainable food production have attracted attention from academia. However, the association between digital agricultural technology extension service and sustainable food production has not yet been fully investigated. This research investigates the average and heterogeneous impacts of digital agricultural technology extension service use on eco-efficiency among 1302 maize producing farmers from Northeast China major maize producing area in 2022 to fill this knowledge gap. The slack-based measure model with undesirable outputs is applied to calculate the eco-efficiency of maize production. To obtain an unbiased estimation of the average effect, the self-selection problem generated by observable and unobservable factors is solved by the endogenous switching regression model. Quantile regression is utilized to analyze the heterogeneous effect. Notably, the mediated effects model is utilized to examine the potential mechanism between them. Our findings indicate that digital agricultural technology extension service use can increase maize production's eco-efficiency. Digital agricultural technology extension service users would reduce eco-efficiency by 0.148 (21.11%) if they had not used the digital agricultural technology extension service. Digital agricultural technology extension service nonusers would improve eco-efficiency by 0.214 (35.20%) if they had used it. The robustness check reconfirms the results. Moreover, digital agricultural technology extension service use is more helpful to maize farmers who have lower eco-efficiency than those who have higher eco-efficiency. Digital agricultural technology extension service use can improve eco-efficiency of maize production through the application of organic fertilizers, green pesticides and biodegradable agricultural films.
Keywords: 
Subject: Business, Economics and Management  -   Economics

1. Introduction

Maize is an important staple food in China and the world [1,2], and China is now the leading maize producer in the world, accounting for 22.54% of the world's total production and 21.06% of its cultivation area in 2022 [3]. Because of its adaptability to pests and diseases, climate change and differences in soil quality, high output, and multipurpose, which can be consumed as a vegetable, fodder and staple food, maize is a vital food for food security and rural socioeconomic development in China [4,5,6]. Due to the overuse of agricultural production factors such as chemical fertilizers, chemical pesticides and plastic films, environmental pollution is currently one of the most prominent challenges to sustainable maize production and economic development in rural areas [7,8,9,10,11]. The key to achieve sustainable food production is to improve the eco-efficiency (EE) in maize production with higher desirable output and lower undesirable output [12]. EE was first introduced in 1990 [13] and has been widely used in different sectors and areas to measure sustainability [14,15,16]. In agriculture, EE refers to the ratio of the economic value created by agricultural production to the environmental impact [12,17,18,19]. In order to achieve an agricultural green transition and build resource-saving and environmentally friendly agricultural production systems, increasing agricultural efficiency within the restrictions of agricultural pollution discharge is an essential decision. To accomplish the sustainable agricultural production practices, it is imperative to enhance EE.
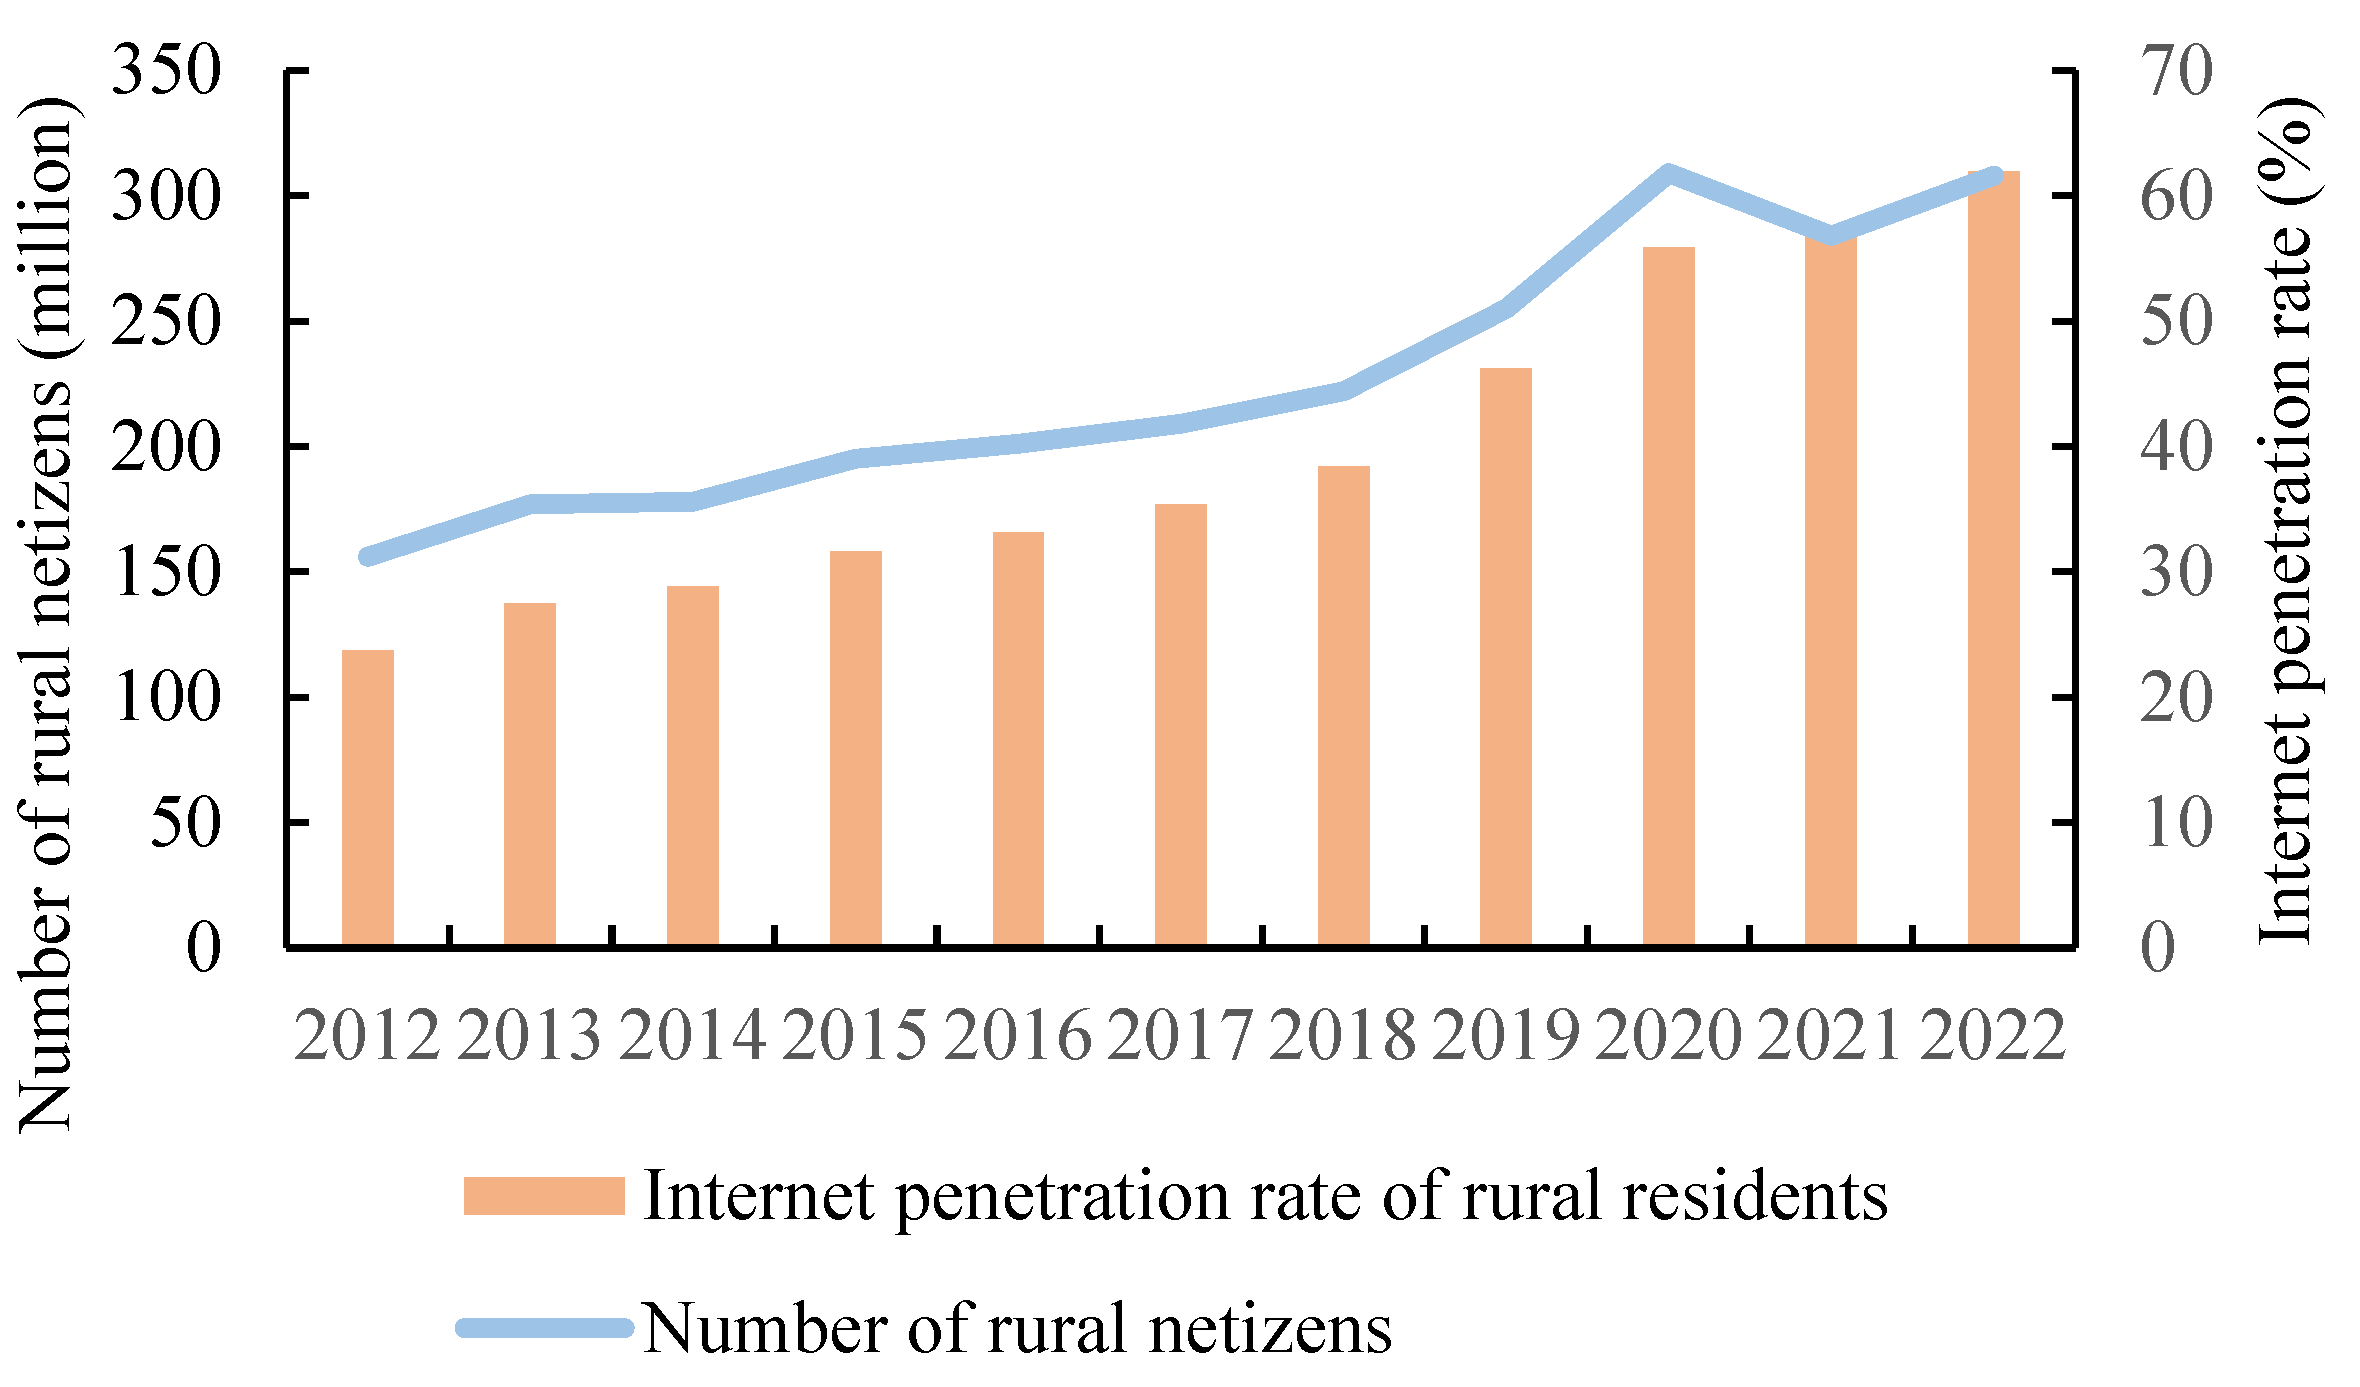
Digital agricultural technology extension service (DATES) is a new type of agricultural technology extension service, combining the Internet (PC, smart phone, tablet, etc.) with traditional agricultural technology extension services (neighborhood exchange, online guidance, technical training classes, scientific and technological demonstrations and mass media such as newspapers, radio, television, etc.), and it has the the characteristics of high efficiency, low cost and high availability [20,21,22]. DATES can address challenges in traditional agricultural technology extension service such as poor timeliness, narrow content limitations, time-consuming and labor-intensive offline guidance, and difficulty in carrying out large-scale technical training lectures during the COVID-19 epidemic. This contributes to promoting the sustainable transformation of food production [23]. The Internet has been an efficient way to obtain sustainable production knowledge, especially in rural China [24]. With the implementation of the “Internet Plus” strategy by Chinese government, China's rural netizens have grown from 156 million in 2012 to 308 million in 2022, and the Internet penetration rate in rural areas has increased from less than 23.70% in 2012 to 61.90% in 2022, according to data provided by the China Internet Network Information Center [25]. The significant increase in rural Internet penetration rate and the number of rural netizens shows that a large number of rural netizens have become potential target groups for DATES, providing solid support for the application of DATES to farmers. On the other hand, these large numbers of rural netizens are direct beneficiaries of the adoption of sustainable food production practices [20].Thus, DATES, as one of information and communication technologies (ICTs), has been a key driver for agricultural economics growth, food sustainable production and the integration of agricultural digitalization and food production.
Many scholars have studied EE from different perspectives. Some of them evaluated the EE of many agricultural products, i.e., wheat, cotton, soybeans and rice [26,27,28,29], the average EE of different agricultural products is quite different, ranging from 0.51 to 0.89, representing different room for improvement in sustainable production of different crops, but only a few studies have explored the EE of maize production. Some studies measured EE from macro, meso and micro perspectives [30,31,32,33,34,35,36]. Although many methods have been developed to evaluate EE, the two most commonly used methods in previous studies are data envelopment analysis (DEA) and stochastic frontier analysis (SFA) [4]. SFA, as a parametric methodology, can handle the impact of uncontrollable factors on inefficiency [37,38], but it is generally only suitable for single-output and multi-input production [39]. DEA is a non parametric frontier methodology to evaluate EE with multiple inputs and outputs [40]. The method avoids issues related to model-settings errors and the impact of nontechnical factors on the EE [41]. In addition, the traditional DEA has a disadvantage in that it can easily overlook undesirable outputs during the calculation process, so it cannot obtain the actual efficiency accurately. Subsequently, the slack-based measure (SBM) model was introduced in 2001, which can overcome the shortcomings of DEA [42]. Hence, this study adopts the SBM model with undesirable output.
Existing studies have increasingly concentrated on how DATES use affects agricultural production practices, especially sustainable agricultural practices (SAPs) selection. First of all, DATES have become an important channel for farmers to obtain technologies and information related to sustainable food production, meeting their practical needs for solving technical problems and obtaining technical guidance online, and avoiding the shortcomings of inefficiency of technical information transmission and restricted time and space that exist in traditional agricultural technology extension [43,44]. Secondly, as an efficient information tool, DATES can fill the information gap, reduce information search costs, and accelerate the circulation of agricultural information [45,46,47].. Thirdly, farmers use DATES to conduct two-way communication with the outside world, improve their decision-making capabilities and risk perception before technology selection, reduce information negotiation costs [48,49], and change farmers' technology adoption preferences in order to maximize the economic benefits of agriculture, which in turn has a potential impact on the sustainable food production [50]. However, few studies have focused on the relationship between DATES and EE of food production.
The main contribution of this study is to explore the direct effect, heterogeneous effect and potential mechanism of DATES on EE while effectively solving the endogeneity problem caused by observable and unobservable variables. This paper offers a possible way to achieve sustainable food production from the perspective of DATES and building a theoretical bridge between DATES and sustainable food production. The findings of this paper will present detailed and timely empirical evidence for the expansion of DATES and a valuable reference for the sustainable development of food production.
The purpose of this paper is to explore the impact of DATES use on EE of maize production and potential mechanism between them. Different from existing studies, DATES use is referred to when maize farmers use the DATES to browse and obtain sustainable technologies and inputs information about maize production rather than only have smart phone apps or follow the WeChat public accounts. The endogenous switching regression (ESR) model is utilized to address the self-selectivity bias from observable and unobservable variables. SBM model is employed to evaluate the EE of maize production, which refers to the level of sustainable production. Quantile regression (QR) model is used to investigate the heterogeneous impact of DATES on EE. Mediation model is employed to explore the potential mechanism between them.
The rest of this paper is organized as follows. Section 2 draws the theoretical analysis and research hypothesis. Section 3 describes the data and methodology used in this paper. Section 4 presents the estimation results and discussion. Section 5 states the conclusions and policy implications.
Figure 1. Rural netizens in China from 2012 to 2022.
Preprints 95874 g001

2. Theoretical analysis and research hypotheses

2.1. Direct effects of the DATES

According to the new economic growth theory, it is known that technological progress is an important engine for driving sustainable economic growth, and DATES, as an important driving force for promoting agricultural economic growth, deeply influences the dissemination and diffusion of information related to the concept, technologies and inputs of sustainable food production, which contribute to the improvement of the EE of agricultural production. On the one hand, the DATES has accelerated the promotion and application of maize sustainable production concepts and technologies. DATES can significantly reduce the cost of searching for information on sustainable maize production, alleviate the asymmetry of agricultural information, deepen their knowledge of sustainable food production, and lead farmers to gradually integrate their knowledge into all process of maize production, thereby improving the EE of maize production. On the other hand, the development of the DATES has facilitated the dissemination and diffusion of knowledge on inputs for sustainable production. The DATES has greatly reduced the threshold of maize farmers' access to information on sustainable production inputs, accelerated the speed of information dissemination, broken the traditional information dissemination network based on blood or geography, and improved maize farmers' knowledge of sustainable inputs such as organic fertilizers, green pesticides and biodegradable films, and thus realizing the improvement of the EE of maize production. Thus, this paper proposes hypothesis 1:
H1. DATES use can improve the EE of maize production.

2.2. Heterogeneous effects of the DATES
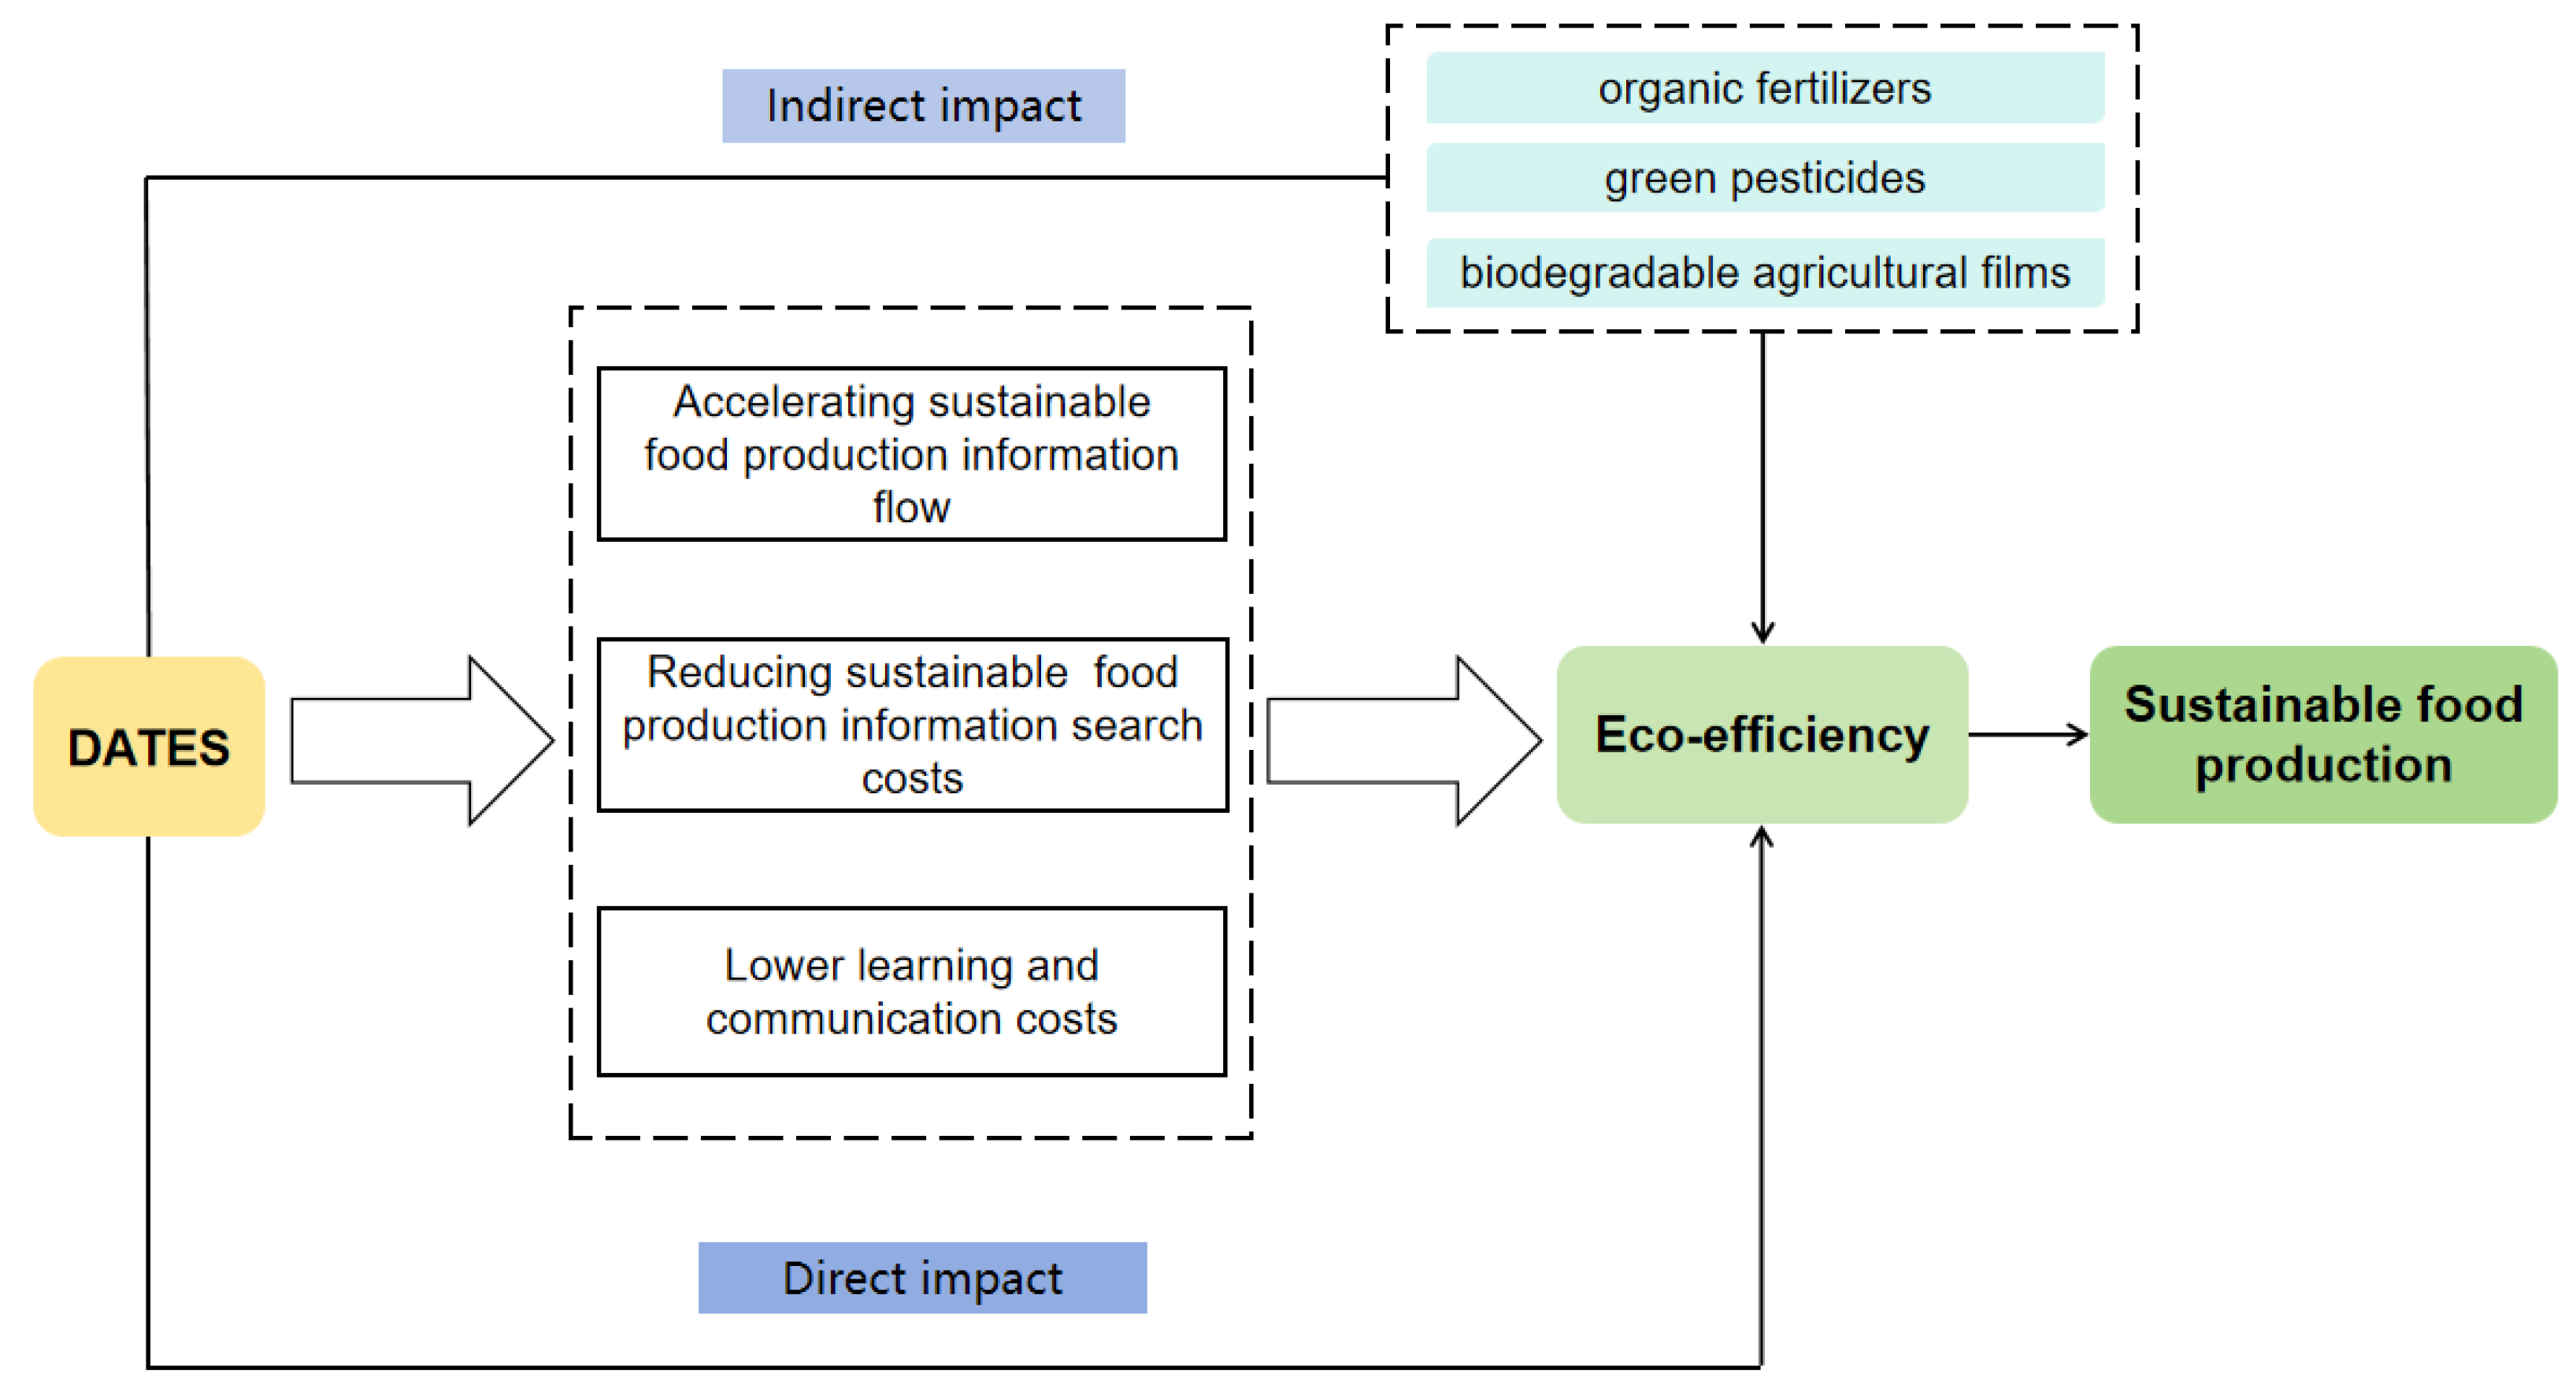
The impact of DATES use on the EE of maize farmers is heterogeneous. On the one hand, DATES use improves the utilization efficiency of input factors such as capital and land, and better allocation efficiency can be achieved in maize production. However, according to the theory of marginal effect, with the continuous improvement of the utilization efficiency of each input factor, the degree of the impact of DATES use on input factors will gradually decrease, which in turn affects the improvement of the EE of maize production.On the other hand, the DATES will accelerate the accumulation of human capital of maize farmers, but its acceleration effect also has a marginal decreasing trend. The DATES has promoted the accumulation of human capital of maize farmers by spreading sustainable production concepts, technologies and inputs. The most direct reflection of the accumulation of human capital is the change in the EE of the maize production. With the accumulation of human capital, the impact of DATES use on the EE of the maize production has gradually decreased. Based on the analysis, this study proposes hypothesis 2:
H2. DATES use affects low-EE maize farmers to a greater extent than high-EE maize farmers.
Figure 2. Theoretical framework.
Preprints 95874 g002

2.3. Mediation effects of the DATES

The use of sustainable inputs can improve EE of maize production. As an efficient information acquisition channel, the DATES can help disseminate and diffuse information about sustainable inputs, thereby promoting the improvement of EE in maize production. On the one hand, the DATES can significantly reduce the cost for maize farmers to obtain knowledge related to sustainable inputs. Under the assumption of rational choice theory, if the benefits of sustainable input information are greater than their search costs, maize farmers will actively search for and learn relevant information. This will help stimulate maize farmers' initiative in obtaining information, accelerate the accumulation of knowledge about sustainable inputs, and thus affect EE of maize production. On the other hand, the DATES can increase the speed of information flow on sustainable inputs. Farmers using the DATES can quickly obtain knowledge about sustainable inputs and the impact on the agricultural environment, deepen their awareness of the environmental benefits brought by sustainable inputs, and increase their willingness to use sustainable inputs, which in turn affects the EE of maize production. In view of this, this study proposes hypothesis 3.
H3. DATES use affects the EE of maize production through using organic fertilizers, green pesticides and biodegradable agricultural films.

3. Materials and Methods

3.1. Data Collection

The farm household data from maize farmers were collected by China Agriculture Research System- maize industrial economics research group in 2022. As the three important producing regions in Northeast China main maize producing area, Heilongjiang, Jilin and Liaoning provinces were selected as the study regions. Maize output in these three provinces exceeded 92.55 million tons, accounting for 33.39 percent of China's maize total output in 2022. According to the maize production capacityt and level of regional economic developmen, nine counties (cities) were randomly selected from the Northeast China main maize producing area, including Changtu County in Tieling city, Daowai and Acheng Districts in Harbin city, Longjiang and Gannan Counties in Qiqihar city, Jiutai and Yushu Counties in Changchun city, and Gongzhuling and Lishu Counties in Siping city. Firstly, 3-4 townships were randomly selected from each sample district and county based on random sampling method. Secondly, 3-4 administrative villages were randomly selected from each township. Finally, 10-16 maize farmers were randomly selected from each administrative village. Therefore, the final sample included 1302 maize farmers. The survey was based on a participatory approach, with one-on-one interviews with maize farmers. Thus, the sample is well representative.
All of the sampled maize farmers were given a questionnaire. The survey was limited to only decision-makers (or family members responsible for maize production). This questionnaire employed a multi-criteria decision-making approach. Before the survey was done, all of the respondents went through the same training to make sure they understand the purpose of survey.

3.2. Methodology

3.2.1. The slack-based measure (SBM) model

Assuming returns to scale are constant (CRS), the SBM model is as follows:
m i n ρ * = 1 1 m i = 1 m s i x i 0 t 1 + 1 s 1 + s 2 r = 1 s 1 s r g y r 0 g + r = 1 s 2 s r b y r 0 b s . t . x 0 = X λ + s y 0 g = Y g λ s g y 0 b = Y b λ + s b s 0 ,   s g 0 ,   s b 0 ,   λ 0 X = x 1 ,   x 2 ,   ,   x n R m × n Y g = y 1 g ,   y 2 g ,   ,   y n g R s 1 × n υ Y b = y 1 g ,   y 2 g ,   ,   y n g R s 2 × n
s represents the slack variable of input and output, and s , s g , and s b are slack variables denoting input excess, link excess, and output shortfall, respectively. s , s g , and s b are the variables when estimating the overall EE of DMU. s , s g , and s b are strictly decreasing. x i 0 represents the observed input of DMU i , y r 0 represents the observed output of DMU r , and m represents the number of decision-making units. X , Y g and Y b are the matrices of the input, good output, and bad output, respectively, while X , Y g and Y b are all strictly larger than zero. λ represents the constant vector. ρ * represents agricultural EE, ρ * 0 , 1 , ρ * = 1 means production units completely efficient, and s = s g = s b = 0 ; ρ * < 1 means a production unit’s efficiency loss [5].

3.2.2. Endogenous switching regression (ESR) model

In general, it is not random for maize farmers to make decisions about using DATES, so there is an issue with self-selection. We employed the ESR model to address this issue, because ESR allows us to figure out self-selection problem caused by both unobservable and observable factors [51-54], and ESR models may perform better than propensity score matching (PSM) that only focus on observable factors [55].
Theoretically, there are two steps in the ESR model. Firstly, a selection equation is created to characterize whether maize farmers search, browse and acquire sustainable technologies and information through the DATES. It is notable that a maize farmer chooses to use the DATES when the predicted value from doing so exceeds the value from not doing so. S i is a dummy variable utilized to represent the binary option. Given that it is impossible to observe the predicted value, but it is possible to observe whether a maize farmer uses the DATES, let S i * represent the latent variable defining the probability of being the DATES user.
Firstly, the decision to use the DATES can be described in the following ways:
S i * = γ i Z i j + ν i
where S i * represents the latent variable of the dummy variable S i , if S i * > 0 S i = 1 ;if S i * 0 S i = 0 .   Z i j embodies a vector of independent variables used in the selection equation. Note that the explanatory variables in Z i j can be repeated with X i j , but for better identification, Z i j should contain at least one variable that is not included in X i j , that is, an instrumental variable, which should have a direct impact on whether maize farmers use the DATES but not on their EE, and thus, we selected the communication signal intensity of the village as the instrumental variable. ν i represents a random error term assumed to be ν i ~ N 0 , σ ν 2 , and γ i denotes a vector of parameters to be estimated.
Secondly, two different outcome equations are established for the DATES users and nonusers in the following:
E E 1 i = j = 1 n β 1 X 1 i j + μ 1 i ,   if   S i = 1
E E 2 i = j = 1 n β 2 X 2 i j + μ 2 i ,   if   S i = 0
where the DATES users and nonusers are represented by subscripts 1 and 2; X i j represents a vector of independent variables for the outcome equations; β i is a vector of coefficients to be estimated; and μ 1 i and μ 2 i are random error terms assumed to be μ 1 i ~ N 0 ,   σ 1 2 and μ 2 i ~ N 0 ,   σ 2 2 , respectively.
The error terms in Equations (1), (2), and (3) presume a zero-mean trivariate normal distribution, and the covariance matrix is listed as below:
c o v ν i ,   μ 1 i , μ 2 i = δ η 2 δ η 1 δ η 2 δ 1 η δ 1 2 δ 12 δ 2 η δ 21 δ 2 2
where δ η 2 , δ 1 2 and δ 2 2 are the variances of ν i , μ 1 i and μ 2 i , respectively. The covariance between ν i and μ 1 i are δ 1 η and δ η 1 ; the covariance between ν i and μ 2 i are δ 2 η and δ η 2 ; δ 12 and δ 21 are the covariance between μ 1 i and μ 2 i , but they are not defined since E E 1 i and E E 2 i cannot be observed simultaneously.
Given the self-selectivity bias, the random error terms μ 1 i and μ 2 i are listed as below:
E μ 1 i S i = 1 = δ 1 η λ 1 i = δ 1 η I M R 1 i
E μ 2 i S i = 0 = δ 2 η λ 2 i = δ 2 η I M R 2 i
where λ 1 i and λ 2 i are the inverse Mills ratios, which can correct for the selection bias [54,56].
The ESR model can help us to estimate the expected EE for the DATES users and nonusers in the counterfactual and actual contexts:
E Y 1 i S i = 1 = β 1 j X 1 i j + δ 1 η I M R 1 i
E Y 2 i S i = 0 = β 2 j X 2 i j + δ 2 η I M R 2 i
E Y 1 i S i = 0 = β 2 j X 2 i j + δ 2 η I M R 2 i
E Y 2 i S i = 1 = β 1 j X 1 i j + δ 1 η I M R 1 i
We can also estimate the average treatment effect on the treated group (ATT), which is the difference between Eqs. (7) and (9), and the average treatment effect on the untreated group (ATU), which is the difference between Eqs. (8) and (10).
A T T = E Y 1 i S i = 1 E Y 2 i S i = 0
A T U = E Y 1 i S i = 0 E Y 2 i S i = 0
Due to the self-selectivity bias is accounted for through this computation, ATT and ATU indicate unbiased estimation.

3.2.3. Quantile regression (QR) model

After measuring the average impact of using the DATES to access sustainable technologies and information on the EE of maize production, the heterogeneous impact on the EE of maize production is further explored. The quantile regression model has two main characteristics, one is that the model is not strongly constrained by the assumptions of the error term, which can effectively avoid the influence of extreme values in the data, and the estimation results tend to be more robust; and the other is constructed by using the weighted average of the absolute values of the residuals to minimize the objective function, which can estimate the regression coefficients of the explanatory variables under different quantile points (Koenker et al., 1978). The specific model is as follows:
Q q = a q + b q X i + c q W i + ε i
where Q q denotes the EE of maize production of maize farmers, vector X i represents the explanatory variables, vector W i represents the control variables, a q , b q and c q denotes the parameters to be estimated, and ε i denotes the error term.

3.2.4. Mediation effects model

Combining the stepwise regression method and bootstrap method, the mediating role of green inputs in the impact of using the DATES on the EE of maize production was tested. The mediating effect model is as follows:
Y i = a 0 + a 1 X i + a 2 N i + ε 1
M i = b 0 + b 1 X i + b 2 N i + ε 2
Y i = c 0 + c 1 X i + c 2 M i + c 3 N i + ε 3
where Y i denotes the EE of maize production, vector X i represents the explanatory variables, vector M i represents the mediating variables, vector N i represents the control variables, a , b and c denotes the parameters to be estimated, and ε is the error term.

4. Results and Discussion

4.1. Descriptive Statistics

The variables are composed of two parts: (1) inputs, desirable output, undesirable outputs and related emission coefficients in SBM model and (2) dependent variables, control variables, instrumental variables and treatment variables for the ESR model.
In terms of the SBM model, the desirable output is maize gross revenue per ha, and the inputs consist of land, seed, fertilizer, labor, and others (including pesticides, agricultural film and machinery). The undesirable output is composed of carbon emissions and nitrogen and phosphorus losses.
EE, as the dependent variable for the ESR model, is evaluated based on the SBM model, ranges from 0 to 1.
The treatment variable for the ESR model is DATES use. DATES use is regarded as maize farmers acquire sustainable production technologies and information through WeChat public accounts or smart phone apps. According to the question in the questionnaire, "Do you use WeChat public accounts of DATES to access sustainable production technologies and information?" If the answer is "yes", it equals 1, otherwise it equals 0.
The instrumental variable (IV) in this paper is denoted as the communication signal strength of the sample villages. Considering that the communication signal is the basis for daily communication, each maize farmer may not access WeChat accounts or apps of DATES, but is more likely to access the communication signal, and DATES use and communication signal strength are strongly related. Thus, we believe that the strength of the communication signal influences each maize farmer's decision to use DATES, but has no effect on EE. On a 5-point Likert scale (very poor, poor, average, good, and outstanding, equal to 1, 2, 3, 4, and 5, respectively), a question was devised to measure each maize farmer's satisfaction level of communication signal strength.
The control variables for the ESR model consist of two parts. The first part states maize farmers' characteristics, such as gender, age, health status, years of education, whether they are village leaders, whether they participate in off-farm work, and whether they participate in digital technology training. The second part is the production characteristics, involving farm size, income from other crops production, the number of laborers in maize production, degree of specialization and distance from households to the nearest central market.
In this study, total carbon emissions of maize production process should include carbon emissions caused by carbon sources such as fertilizers, pesticides, diesel fuel (including sowing and harvesting), agricultural films, deep plow and irrigation. The calculation formula can be specified as follows:
C = C i = n i * γ i
where C denotes the quantity of carbon emissions, C i represents the emissions from different carbon sources, n i denotes the usage amount of inputs and diesel fuel and the deep plowed area, and γ i is the emission coefficient of different carbon sources in agriculture; Table 1. presents the agricultural carbon emission coefficient and reference sources.
Table 1. Agricultural carbon emission source, coefficient and reference sources.
Source Carbon emission coefficient References
Fertilizer 0.896 kg/ kg Oak Ridge National Laboratory
Pesticide 4.934 kg /kg Oak Ridge National Laboratory
Diesel fuel 0.593 kg/ kg Intergovernmental Panel on Climate Change (IPCC)
Agricultural film 5.180 kg/ kg Institute of Resource, Ecosystem and Environment of Agriculture, Nanjing Agricultural University
Deep plow 312.600 kg/ km2 College of Biological Sciences, China Agricultural University
Irrigation 25 kg/ ha Dubey [57]
In this study, the total nitrogen and total phosphorus produced in the maize production process should be calculated using Formula (18):
E = m i ρ i + δ i
where E is the total nitrogen and total phosphorus losses in the maize production process; m i is the nitrogen and phosphorus used in maize production process, which mainly come from the chemical fertilizer input in the production process, expressed in pure amount of chemical fertilizer; and ρ i and δ i are the nitrogen and phosphorus loss coefficients, as presented in Table 2. [58].
Table 2. Chemical fertilizer loss rate in study areas.
Region Loss rate (%)
Nitrogen fertilizer Phosphate fertilizer
Liaoning and Jilin 20 4
Heilongjiang 10 7
Table 3 presents the descriptive statistics of desirable output, inputs and undesirable outputs for the SBM model. From the perspective of maize production, we select the cost of land, seed, fertilizer, labor and others (including pesticides, agricultural film and machinery) as inputs and maize gross revenue as the desirable output. As shown in Table 3., compared to the DATES nonuser group, desirable output and most inputs in the DATES user group are higher than DATES nonuser group, except for seed.
Table 3. Descriptive statistics of inputs, desirable output and undesirable outputs.
Variable Total DATES users DATES nonusers Difference
Desirable output (yuan/ha) 26025.579 27526.312 22874.039 4652.272***
Land (yuan/ha) 1494.617 1550.556 1377.147 173.409*
Seed (yuan/ha) 753.073 669.033 84.040 753.073
Fertilizer (yuan/ha) 2460.384 2508.372 2358.552 149.821**
Labor (yuan/ha) 7658.409 7519.770 7952.627 -432.857**
Others (yuan/ha) 1197.574 1232.485 1124.271 108.214**
Total carbon emission (kg/ha) 1387.381 1467.790 1216.716 276.073**
Total nitrogen loss (kg/ha) 170.3187 176.4504 157.302 19.1484
Total phosphorus loss (kg/ha) 34.3683 34.8462 33.3639 1.4823
Note: yuan is Chinese currency (1U=SD = 6.726 yuan in 2022).
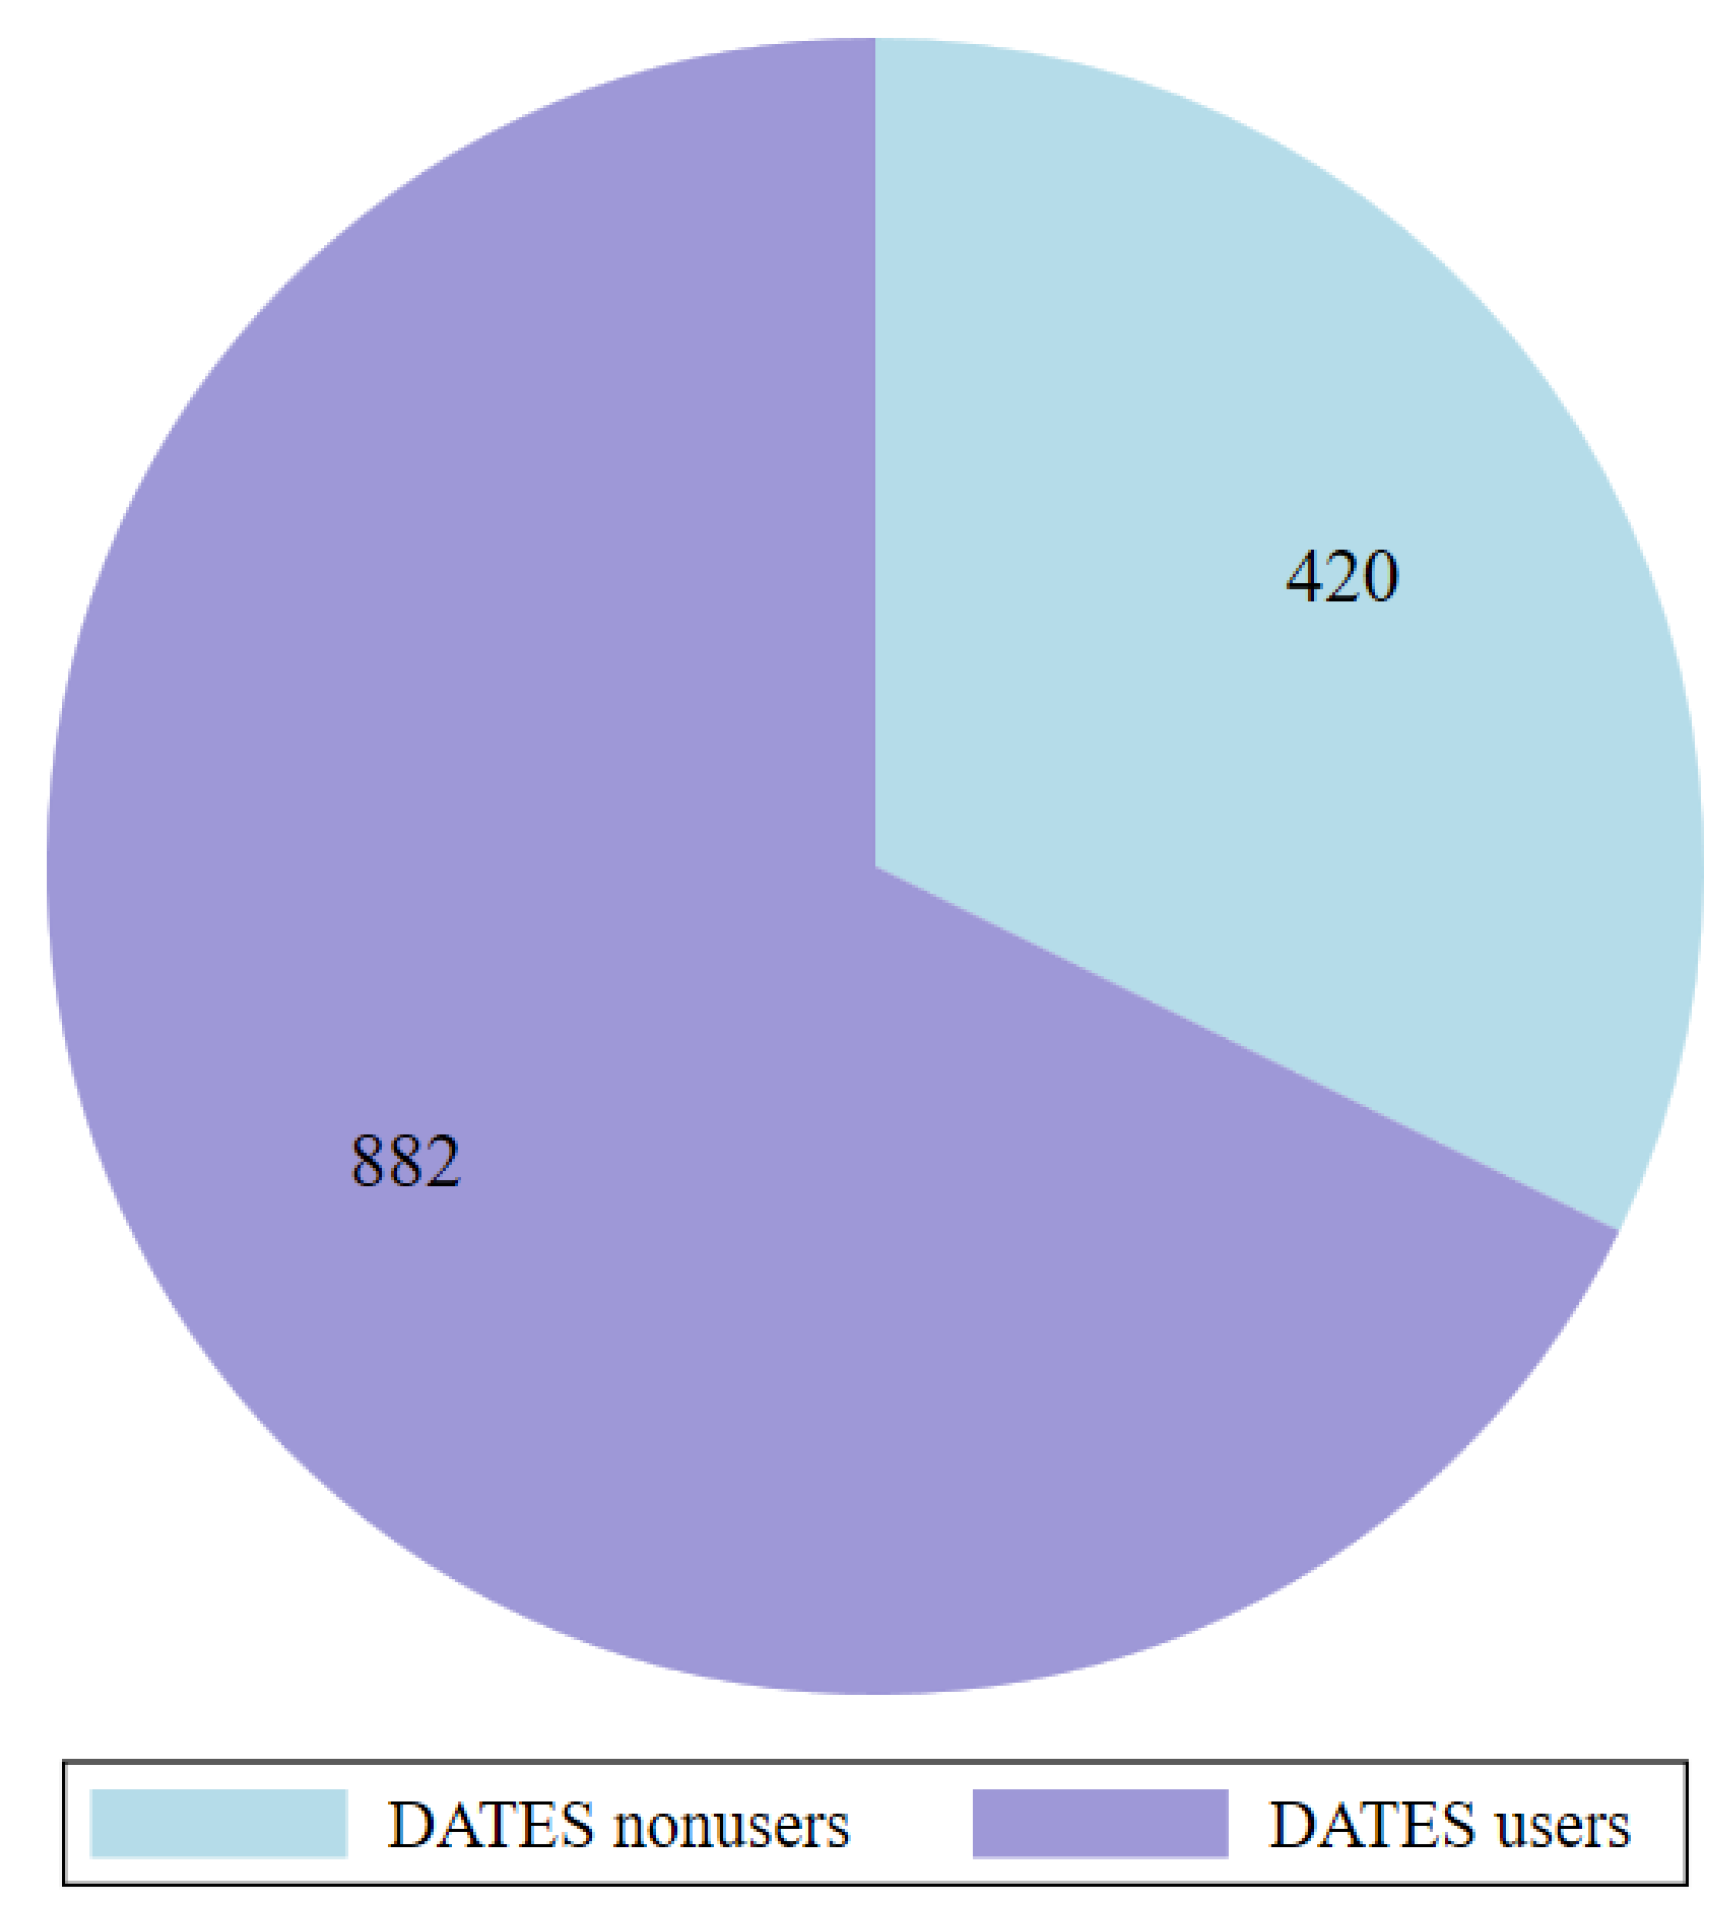
Table 4 displays descriptive statistics for the ESR model variables. There are 882 DATES users and 420 nonusers among the 1302 samples, indicating that 67.13% of maize farmers use the DATES to obtain sustainable technologies and information about maize production (as shown in Figure 3.). The comparison between DATES users and nonusers reveals obvious differences in several variables. For instance, the education years in DATES users group are significantly higher than those in nonusers group. Compared to DATES nonusers, DATES users are younger, more healthy, well educated, more willing to be village leaders, have a larger farm size, earn more from other crops and have more digital technology training. Notably, these significant differences between two groups suggest the possibility of a self-selection issue in DATES use.
Figure 3. DATES use of samples.
Preprints 95874 g003

4.2. Eco-efficiency scores

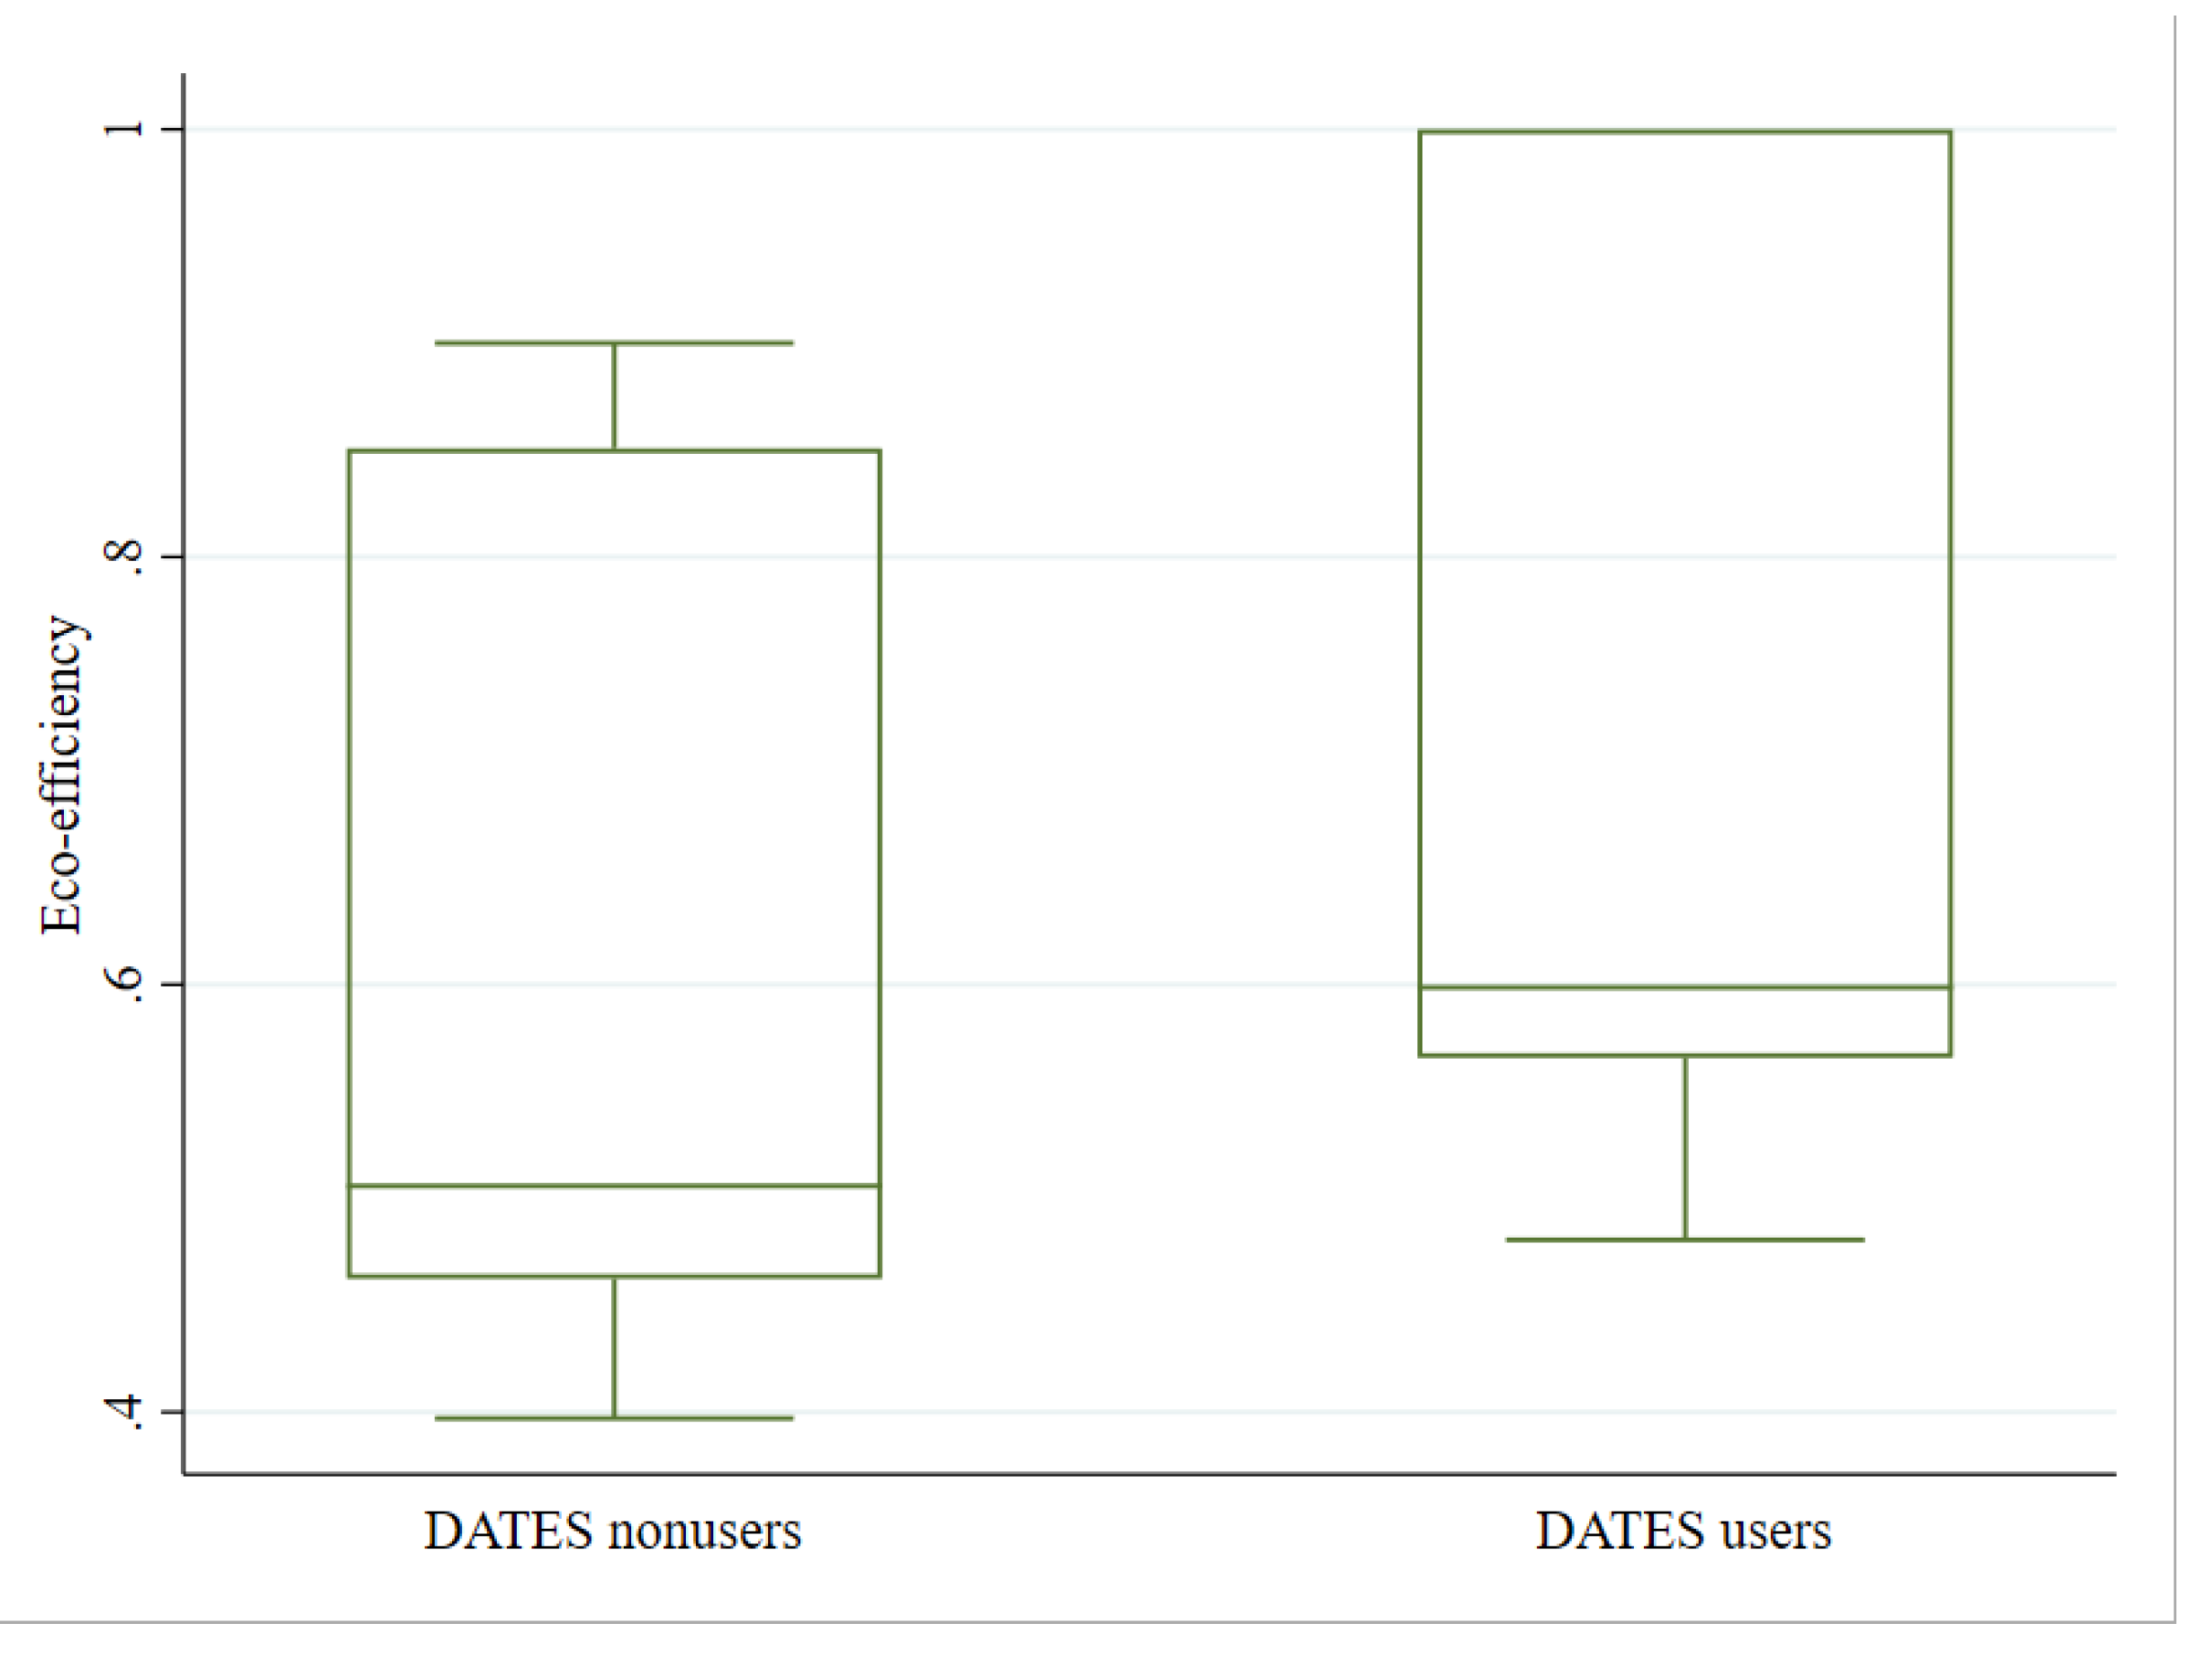
Table 5 presents the EE scores of maize production. The average EE for 1302 maize farmers is 0.671, ranging from 0.397 to 1. There is a significant difference in EE between DATES users and nonusers. The average EE of 881 people who use DATES is 0.702, while that of 421 nonusers is 0.608. This shows that the average EE of maize production in DATES users group is about 15.46% higher than that in DATES nonusers group.
Figure 4. The difference in EE of maize production between DATES users and nonusers.
Preprints 95874 g004

4.3. Results of the ESR model

As shown in Table 6., 16.66 is a significant value at the 1% level for the LR test of independent equations, which implies that the selection and outcome equations are unrelated. Meanwhile, ln σ 1 and ln σ 0 are both significant, implying that there is a self-selection problem [56,59]. Therefore, it is appropriate to adopt the ESR model.

4.3.1. Determinants of DATES use

The estimated coefficient of the IV (communication signal strength) is significant at 1% level, and it met our expectation. This indicates that the stronger the communication signal, the more likely that maize farmers are to obtain sustainable technology and information through DATES. The Cragg-Donald Wald F statistic was 70.97, indicating that the null hypothesis of weak instrumental variables was rejected. Therefore, IV is valid (Table 6.).
Table 6 also demonstrates that a number of variables have the significant impact on whether a maize farmer uses DATES or not. The estimated coefficient of the age of the maize farmer is significantly negative, implying that it’s less likely for older maize farmers to use DATES. This result is in line with existing research [52,56,60]. The coefficient of gender of maize farmers is statistically significantly positive, implying that male maize farmers are more likely to obtain sustainable technology and information through DATES use. The better a maize farmer's health status, the more energy and capacity he or she has to learn how to use the DATES, and then to obtain sustainable production information [61]. The more years of education the maize farmers have, the stronger the ability to acquire information and learn and the more they are inclined to use the DATES to access sustainable production technology and information, which is consistent with the finding of existing study [50]. Maize farmers with off-farm employment may be more likely to use DATES because they may have broader horizons and be more likely to investigate new sustainable technologies and information. There is a significant and positive correlation between DATES use and farm size. Compared with farmers with small farm size, farmers with larger farm size pay more attention to the long-term economic benefits of agricultural production, so they have a greater incentive to enhance sustainability of agricultural production by using DATES to obtain timely and useful technologies and information. Thus, larger-scale maize farmers are much more probably to use DATES, which is inconsistent with the conclusion of existing study [62]. Furthermore, income from other crops has a negative impact on use of DATES, indicating that the higher the income from other crops, the more dependent maize farmers are on the current production methods and the lower their willingness to choose to use DATES to change their production models.

4.3.2. Determinants of EE

Table 6. provides the coefficients for outcome equations. In general, the coefficients of the independent variables for DATES users and DATES nonusers have quite different statistical significance, which shows that these observable factors account for various impacts of EE on maize production between the two groups. At the 1% and 5% level, the coefficient of age for DATES users and nonusers are both significant and negative. It illustrates that EE of maize production decreases by 0.002 and 0.003 for every ten-year increase in age, assuming all other variables remain constant. The significant and positive gender coefficient for DATES users indicates that the EE of male maize farmers is 0.079, which is significantly higher than that of female maize farmers. For DATES users, the village leader coefficient is statistically significant and positive, indicating that the EE of village leaders who use DATES is 0.068 higher than that of normal maize farmers who use DATES (Table 7). This result is primarily attributable to the responsibility of village leaders for transferring technologies and information from the local government and relevant departments to farmers, enhancing village leaders’ DATES use experience, leading to an increased likelihood of obtaining sustainable information about superior technology and high-quality inputs.
There is a negative correlation between farm size and the EE for DATES users and nonusers. Keeping other variables constant, the findings indicate the maize farmers with a larger farm size would decrease EE among maize farmers by 0.025 and 0.029. Basically, maize production in China is usually labor-intensive and land-intensive. Therefore, the large scale of farm has become a challenge for maize farmers to make precise management, which may impede the improvement of EE [63,64].
Income from other crops and EE among DATES users is positively correlated. Maize farmers with higher income from other crops, are more able to invest sustainable technologies and inputs into maize production to improve EE. Number of labors in maize production has a significantly negative impact on EE for DATES users, it illustrates the greater the number of laborers engaged in maize production, the greater the barriers to adopting sustainable technologies and inputs, making it difficult to increase EE, but there is no such evidence among DATES nonusers. Moreover, for DATES nonusers, the significant and negative coefficients of specialization degree implies that the larger the proportion of maize production area maize farmers manage, the lower EE they have because maize farmers cannot understand sustainable technology and information in a timely manner without the help of the DATES, which limits EE improvement. The coefficient of market distance is negative and significant at the 1 % level, indicating the long distance between maize farmers and the market will impede the diffusion of sustainable technologies and information, and hinder the improvement of EE. Notably, digital technology training has a significantly negative impact on EE for both two groups, implying that current technical training is mainly aimed at e-commerce, socialization, etc., and does not meet the sustainable development needs of agricultural production, crowding out farmers' time to use the DATES to learn sustainable production technologies and information, which negatively affects EE.

4.3.3. Average treatment effects

Table 7. reports the predicted EE in the actual and counterfactual contexts, as well as the treatment effects of DATES use by DATES users and nonusers. The ATT and ATU are unbiased result after addressing self-selection problem.
The value of ATT and ATU show that DATES use can improve EE of maize production for both groups (Table 7.). Specifically, EE of maize production would reduce by 0.148 (21.11%) for DATES users if they had not used DATES to obtain sustainable technology and information about production. EE would increase by 0.214 (35.20%) for DATES nonusers if they had used DATES. According to the average difference in EE between DATES users and nonusers (approximately 0.093), ATT indicates that ignoring self-selection bias would significantly underestimate the effect of DATES use on EE (Figure 5.).

4.4. Robustness check

The robustness test is conducted in treatment effects model (TEM) and ordinary linear squares (OLS) regression to ensure the accuracy of the analytical findings. The results of the OLS show an underestimation of the impact of the DATES use due to the neglect of self-selection issues, but the DATES use has a positive and significant effect on the EE of maize production, which leads to. TEM was first proposed by Maddala [65]. TEM results support the reliability of the existing result shown in Table 6.. Notably, the estimated coefficients for DATES use in the outcome equation are significant and positive, indicating that DATES use does increase EE. For the sake of simplicity, no more information about the TEM and OLS is provided in this study. Therefore, hypothesis H1 is verified.

4.5. Heterogeneous analysis

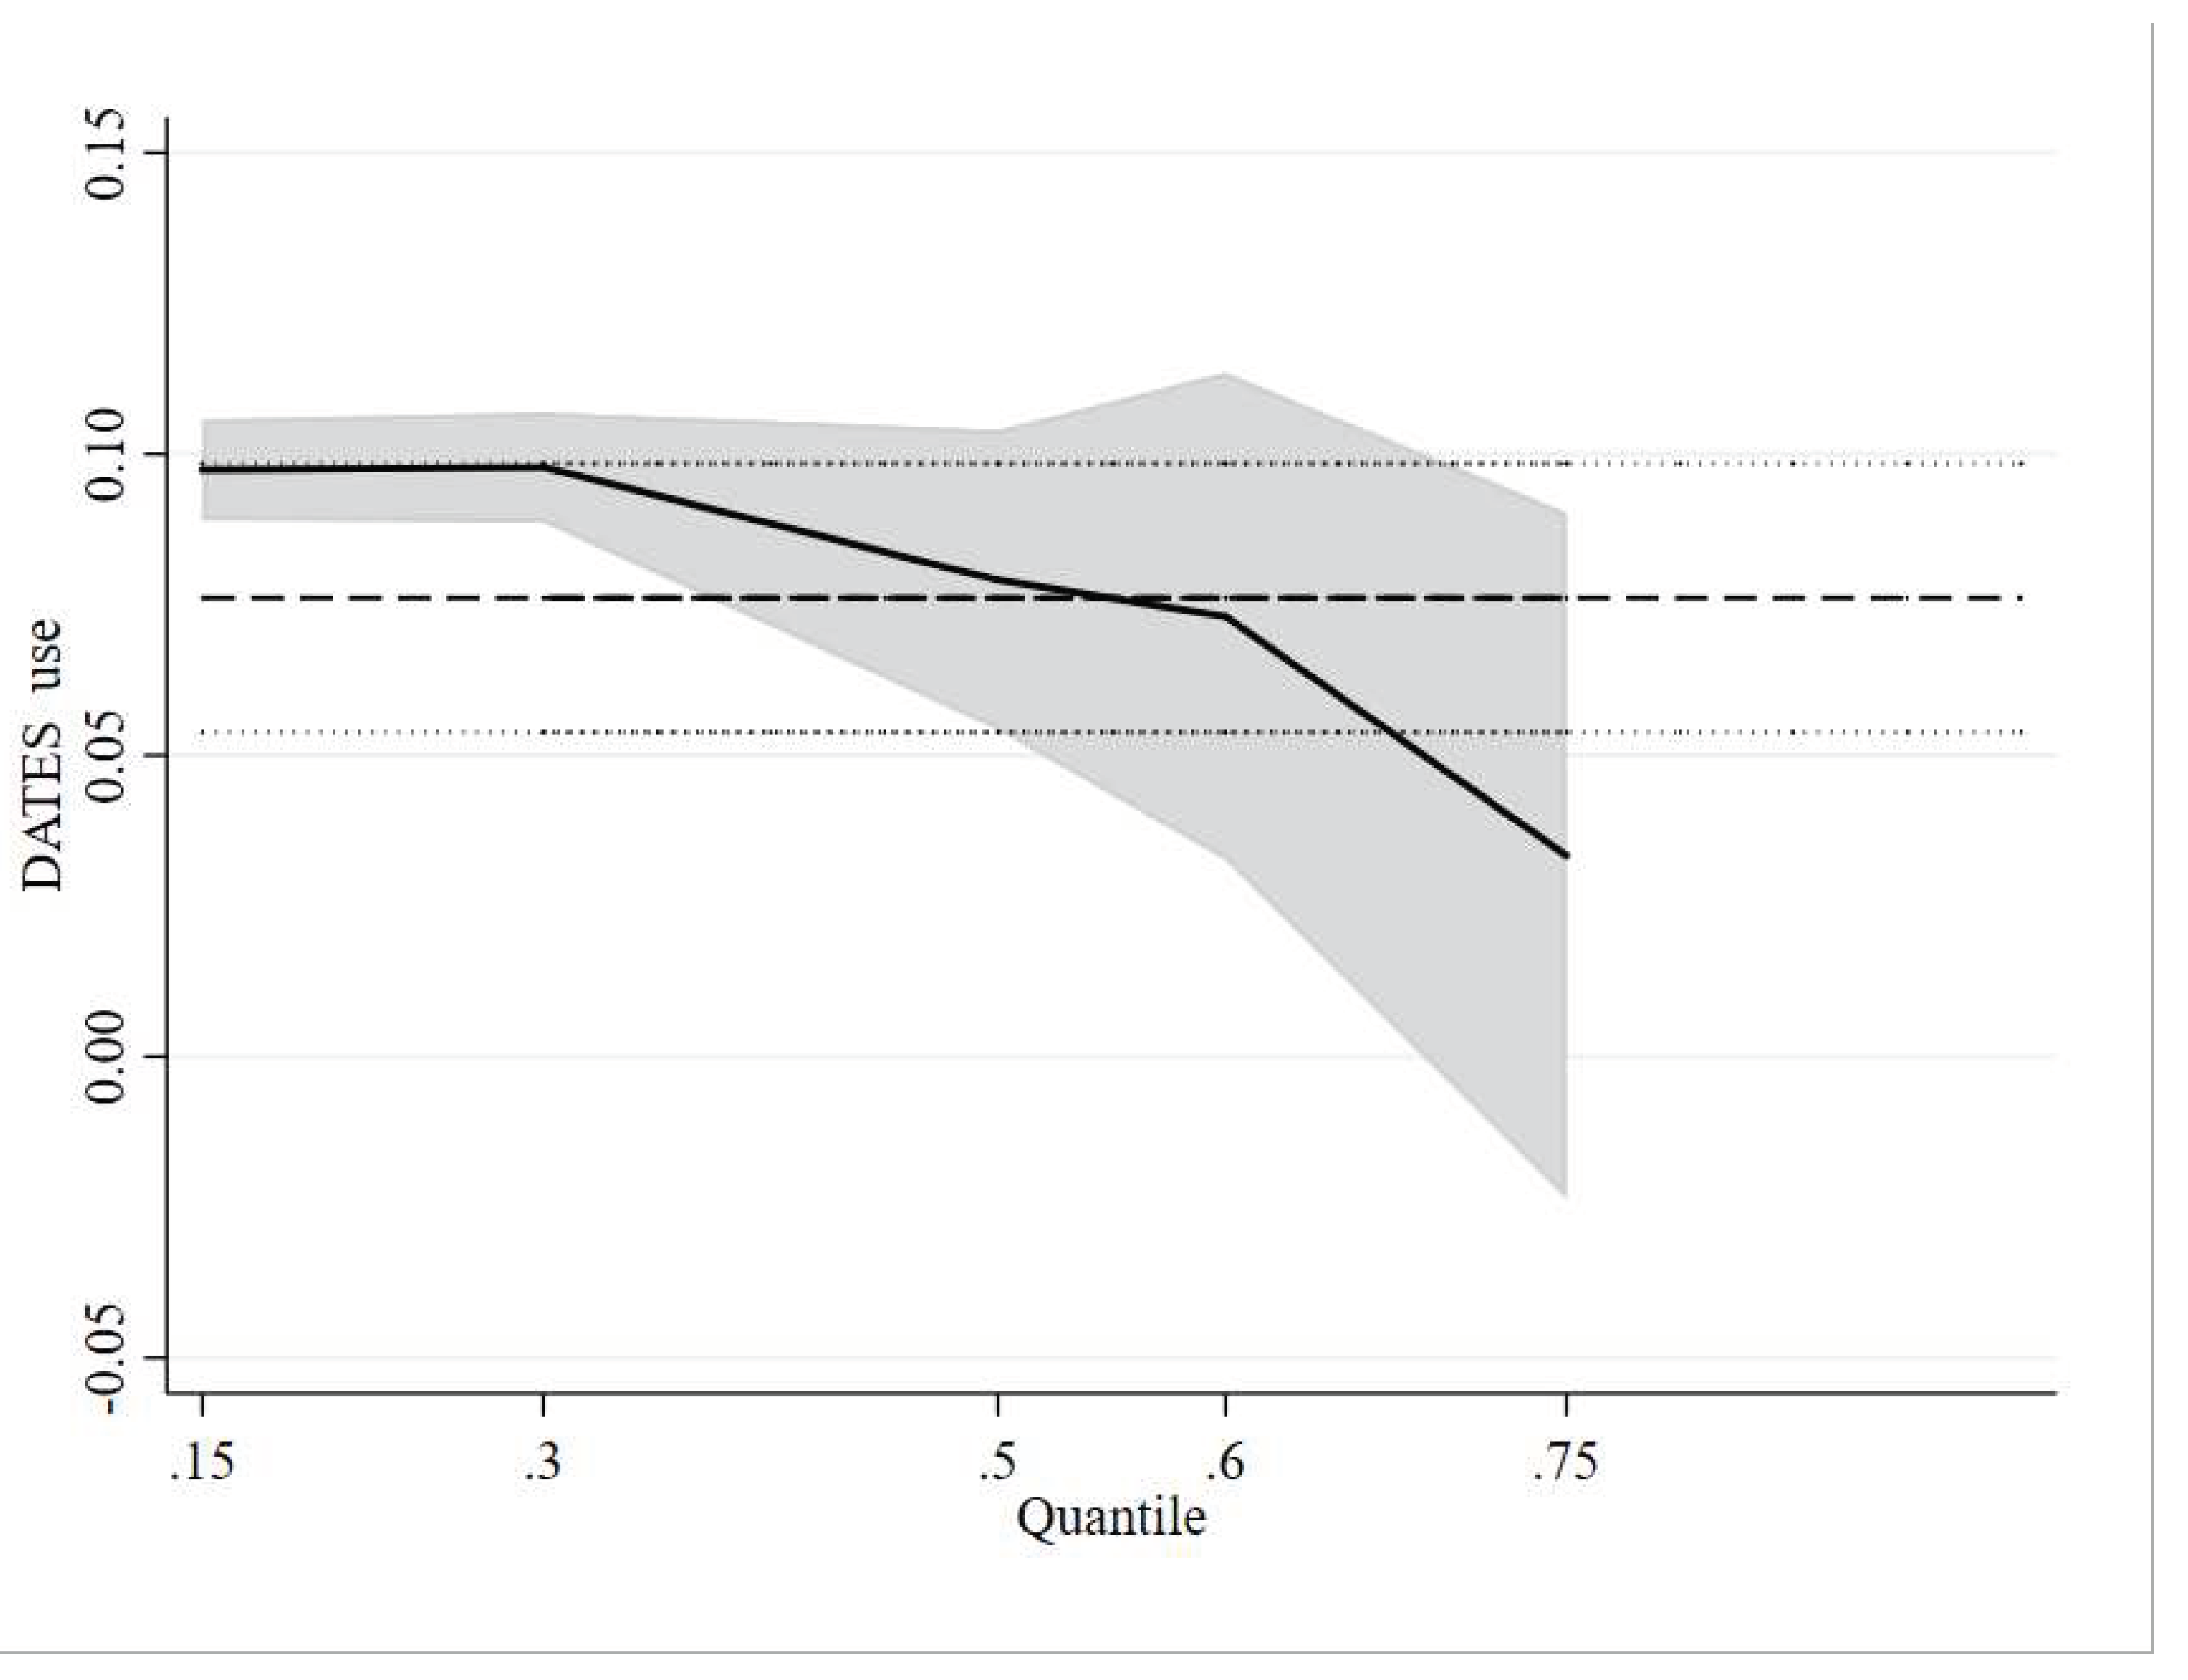
The QR model's findings illustrate the impact of DATES use on EE varies significantly across different quantiles. If we only examine the homogenous or mean-based effects of DATES use on EE of maize production, we cannot observe the results of this heterogeneity. Table 9. shows a positive and statistically significant correlation between DATES use and EE of maize production for the 15th, 30th, 50th, and 60th quantiles. Notably, DATES use had the greatest effect on EE at lower quantiles, denoting that DATES use is more beneficial to maize farmers with lower EE than to those with higher EE. It is more clearly presented in Figure 6. Therefore, hypothesis H2 is verified.

4.6. Mechanism analysis

The results of the mediation effects model are shown in Table 10.
According to the second column of Table 10, the estimated coefficient of DATES use is significant at 1% level, which means that DATES use significantly increases the EE of maize production. In the third column, the estimated coefficient of DATES use is significantly positive, implying that DATES use significantly increases the likelihood of maize farmers adopting organic fertilizer. From the results of column 6, it can be seen that after adding the mediator variables, DATES use and application of organic fertilizer are both significantly positively correlated with EE, which means that application of organic fertilizer plays a part of the mediator effect in the effect of DATES use on sustainable maize production, which accounts for 17.10% of the total effect, in other words, 17.10% of the improving effect of the DATES use on EE of maize production is achieved through the application of organic fertilizer. In order to further test the robustness of the results of the mediation effect model, the bootstrap method was used to test the mediation effect of organic fertilizer application between DATES use and EE of maize production. In order to further test the robustness of the results of the mediation effect model, the bootstrap method was used to test the mediation effect of organic fertilizer application between DATES use and EE of maize production. The results showed that the direct effect was 0.077 and the indirect effect was 0.016, which were both significant at the 1% statistical level; the confidence interval of the indirect effect was not including 0, which indicated that the application of organic fertilizer played a mediating role in the influence of DATES use on the EE of maize production.
As can be seen from the results in column 4, the estimated coefficient of DATES use is significantly positive, implying that DATES use significantly increases the likelihood of using green pesticides by maize farmers. From the results in column 6, it can be seen that after adding the mediator variables, DATES use and the use of green pesticides are both significantly positively correlated with the EE of maize farmers' production, indicating that the use of green pesticides plays a part of the mediator effect in the impact of DATES use on the EE of production, which accounted for 13.63% of the total effect, in other words, 13.63% of the effect of the use of the DATES in enhancing the EE of maize farmers' production is realized through the use of green pesticides. is realized through the use of green pesticides. In order to further test the robustness of the results of the mediation effect model, the bootstrap method was utilized to test the mediation effect of the use of green pesticides in the relationship between DATES use and the EE of maize production. The results showed that the direct effect was 0.081 and the indirect effect was 0.013, both of which were significant at the 1% statistical level; the confidence interval of the indirect effect was not including 0, indicating that the use of green pesticides plays a mediating role in the impact of DATES use on the EE of maize production, and the hypothesis H4 was verified.
Similarly, from the results in column 5, the estimated coefficient of DATES use is significantly positive, implying that DATES use significantly increases the likelihood that maize farmers will use biodegradable agricultural films. From the results in column 6, it can be seen that after adding the mediator variables, both DATES use and the use of biodegradable films are significantly positively correlated with the EE of maize farmers' production, indicating that the use of biodegradable films plays a part of the mediating effect in the impact of DATES use on the EE of production, which accounts for 11.16% of the total effect, i.e., 11.16% of the effect of the DATES use on improving the EE of maize farmers' production is through the use of biodegradable films. 11.10% of the total effect, that is, 11.10% of the effect of DATES use to improve the EE of maize farmers' production is realized through the use of biodegradable agricultural film. In order to further test the robustness of the results of the mediated effect model, Bootstrap method was utilized to test the mediated effect of using biodegradable agricultural film between DATES use and EE of maize production. The results showed that the direct effect was 0.083 and the indirect effect was 0.010, which were significant at the statistical levels of 1%, respectively; the confidence interval of the indirect effect was not including 0, which indicated that the use of biodegradable agricultural film played a mediating role in the influence of DATES use on the EE of maize production. Therefore, hypothesis H3 is verified.

5. Conclusions and Policy implications

This paper reveals the average and heterogeneous impacts of DATES use on the EE of maize production and its potential mechanism using 1302 survey data in Northeast China main maize producing area. The main conclusions are as follows: first, the average EE of maize production is 0.67, and the loss of EE reaches 0.33, indicating that there is still huge room for sustainable maize production. Second, DATES nonusers would improve EE of maize production by 35.20% if they had used it, indicating that DATES use can improve sustainable maize production. The decision to use the DATES is significantly affected by age, gender, health status, education, off-farm work, whether to be a village leader, farm size, income from other crops and communication signal strength, while the EE of maize production is significantly affected by age, gender, whether to be a village leader, farm size, income form other crops, number of labors, degree of specialization, market distance and digital technology training. Third, DATES use is more helpful to maize farmers with lower EE than to those with higher EE, implying that the effect of DATES use gradually slows down as EE increased. Fourth, the application of organic fertilizer, green pesticides and biodegradable agricultural film are significantly positively correlated with the DATES use, indicating that the DATES use can promote the use of green inputs. At the same time, the DATES use can contribute to sustainable maize production through the application of organic fertilizers, green pesticides and biodegradable agricultural film.
Above all, the relevant policy implications can be proposed. First, the government should join hands with universities, colleges and research institutes to popularize the concept of sustainable food production through a combination of online and offline methods, and encourage farmers to adopt sustainable production technologies and sustainable inputs. Secondly, the governments should continue to expand investment in information and communication technology infrastructure in rural areas to empower sustainable food production. And relevant departments should utilize all kinds of public accounts, agricultural extension apps and website to accelerate the flow of information on sustainable food production and accelerate the accumulation of human capital. Thirdly, the government should implement a categorized promotion strategy based on the actual situation of different production entities. Paying more attention to farmers with low EE, and providing targeted digital technology training to achieve sustainable food production. Finally, Using the publicity of DATES to encourage farmers to use sustainable inputs, as well as to provide technical guidance and training lessons to accelerate the transition to sustainable food production.

Author Contributions

Conceptualization, R.L., W.L., G.L. and Q.L.; methodology, R.L. and G.L.; software, R.L. and G.L.; validation, R.L. and W.L.; formal analysis, R.L., W.L., and G.L., investigation, R.L. and Q.L.; data curation, R.L. and W.L.; writing—original draft preparation, R.L. and W.L.; writing—review and editing, R.L., W.L., G.L. and Q.L.; visualization, R.L. and G.L.; supervision, Q.L. and G.L.; project administration, R.L. and Q.L.; funding acquisition, R.L. and Q.L..

Funding

This research was funded by China Agriculture Research System- Industrial Economics (CARS-9) and the China Scholarship Council (202103250054).

Institutional Review Board Statement

Not applicable

Informed Consent Statement

Not applicable

Data Availability Statement

The data presented in this study are available on request from the corresponding author.

Acknowledgments

Special thanks are given to the farmers who were eager to cooperate in the survey

Conflicts of Interest

The authors declare no conflict of interest.

References

  1. Yang, J.; Jiang, R.; Zhang, H.; He, W.; Yang, J.; He, P. Modelling maize yield, soil nitrogen balance and organic carbon changes under long-term fertilization in Northeast China. J. Environ. Manag. 2023, 325, 116454. [Google Scholar] [CrossRef] [PubMed]
  2. Zhang, W.; Qiao, Y.; Lakshmanan, P.; Yuan, L.; Liu, J.; Zhong, C.; Chen, X. Combing public-private partnership and large-scale farming increased net ecosystem carbon budget and reduced carbon footprint of maize production. Resour. Conserv. Recycl. 2022, 184, 106411. [Google Scholar] [CrossRef]
  3. FAO. FAO statistical databases. Available online: https://www.fao.org/faostat/en/#data/QCL (accessed on 2023).
  4. Liu, Y.S.; Zou, L.L.; Wang, Y.S. Spatial-temporal characteristics and influencing factors of agricultural eco-efficiency in China in recent 40 years. Land. Use Policy 2020, 97, 10. [Google Scholar] [CrossRef]
  5. Pang, J.X.; Chen, X.P.; Zhang, Z.L.; Li, H.J. Measuring Eco-Efficiency of Agriculture in China. Sustainity 2016, 8, 15. [Google Scholar] [CrossRef]
  6. Wu, F.; Zhan, J.Y.; Guneralp, I. Present and future of urban water balance in the rapidly urbanizing Heihe River Basin, Northwest China. Ecol. Model. 2015, 318, 254–264. [Google Scholar] [CrossRef]
  7. Shen, Z.; Qiu, J.; Hong, Q.; Chen, L. Simulation of spatial and temporal distributions of non-point source pollution load in the Three Gorges Reservoir Region. Sci. Total Environ. 2014, 493, 138–146. [Google Scholar] [CrossRef] [PubMed]
  8. Hu, L.L.; Guo, L.; Zhao, L.F.; Shi, X.Y.; Ren, W.Z.; Zhang, J.; Tang, J.J.; Chen, X. Productivity and the complementary use of nitrogen in the coupled rice-crab system. Agric. Syst. 2020, 178, 102742. [Google Scholar] [CrossRef]
  9. Lazaridou, D.; Michailidis, A.; Trigkas, M. Socio-economic factors influencing farmers' willingness to undertake environmental responsibility. Environ. Sci. Pollut. Res. Int. 2019, 26, 14732–14741. [Google Scholar] [CrossRef]
  10. Li, F.; Yang, P.; Zhang, K.; Yin, Y.; Zhang, Y.; Yin, C. The influence of smartphone use on conservation agricultural practice: Evidence from the extension of rice-green manure rotation system in China. Sci. Total Environ. 2022, 813, 152555. [Google Scholar] [CrossRef]
  11. Zou, L.; Liu, Y.; Wang, Y.; Hu, X. Assessment and analysis of agricultural non-point source pollution loads in China: 1978-2017. J. Environ. Manag. 2020, 263, 110400. [Google Scholar] [CrossRef]
  12. Zhong, F.L.; Jiang, D.W.; Zhao, Q.Q.; Guo, A.J.; Ullah, A.; Yang, X.; Cheng, Q.P.; Zhang, Y.N.; Ding, X.J. Eco-efficiency of oasis seed maize production in an arid region, Northwest China. J. Clean. Prod. 2020, 268, 10. [Google Scholar] [CrossRef]
  13. Schaltegger, S.; Sturm, A. Ökologische Rationalität: Ansatzpunkte zur Ausgestaltung von ökologieorientierten Managementinstrumenten. Die Unternehm. 1990, 44, 273–290. [Google Scholar]
  14. Caiado, R.G.G.; de Freitas Dias, R.; Mattos, L.V.; Quelhas, O.L.G.; Leal Filho, W. Towards sustainable development through the perspective of eco-efficiency - A systematic literature review. J. Clean. Prod. 2017, 165, 890–904. [Google Scholar] [CrossRef]
  15. Deng, X.Z.; Gibson, J. Improving eco-efficiency for the sustainable agricultural production: A case study in Shandong, China. Technol. Forecast. Soc. Chang. 2019, 144, 394–400. [Google Scholar] [CrossRef]
  16. Mickwitz, P.; Melanen, M.; Rosenstrom, U.; Seppala, J. Regional eco-efficiency indicators - a participatory approach. J. Clean. Prod. 2006, 14, 1603–1611. [Google Scholar] [CrossRef]
  17. Rebolledo-Leiva, R.; Angulo-Meza, L.; Iriarte, A.; Gonzalez-Araya, M.C.; Vasquez-Ibarra, L. Comparing two CF+DEA methods for assessing eco-efficiency from theoretical and practical points of view. Sci. Total Environ. 2019, 659, 1266–1282. [Google Scholar] [CrossRef] [PubMed]
  18. Bianchi, M.; del Valle, I.; Tapia, C. Measuring eco-efficiency in European regions: Evidence from a territorial perspective. J. Clean. Prod. 2020, 276, 123246. [Google Scholar] [CrossRef]
  19. Zeng, L.L.; Li, X.Y.; Ruiz-Menjivar, J. The effect of crop diversity on agricultural eco-efficiency in China: A blessing or a curse? J. Clean. Prod. 2020, 276, 13. [Google Scholar] [CrossRef]
  20. Gao, Y.; Zhao, D.; Yu, L.; Yang, H. Influence of a new agricultural technology extension mode on farmers' technology adoption behavior in China. J. Rural. Stud. 2020, 76, 173–183. [Google Scholar] [CrossRef]
  21. Mahmood, N.; Arshad, M.; Mehmood, Y.; Faisal Shahzad, M.; Kächele, H. Farmers’ perceptions and role of institutional arrangements in climate change adaptation: Insights from rainfed Pakistan. Clim. Risk Manag. 2021, 32, 100288. [Google Scholar] [CrossRef]
  22. Oyinbo, O.; Chamberlin, J.; Abdoulaye, T.; Maertens, M. Digital extension, price risk, and farm performance: experimental evidence from Nigeria. Am. J. Agric. Econ. 2022, 104, 831–852. [Google Scholar] [CrossRef]
  23. Buehren, N.; Goldstein, M.; Molina, E.; Vaillant, J. The impact of strengthening agricultural extension services on women farmers: Evidence from Ethiopia. Agric. Econ-Blackwell 2019, 50, 407–419. [Google Scholar] [CrossRef]
  24. Hudson, H.E.; Leclair, M.; Pelletier, B.; Sullivan, B. Using radio and interactive ICTs to improve food security among smallholder farmers in Sub-Saharan Africa. Telecommun. Policy 2017, 41, 670–684. [Google Scholar] [CrossRef]
  25. 25. CNNIC. The 51th China Statistical Report. on Internet Development, 2023.
  26. Mohammadi, A.; Rafiee, S.; Jafari, A.; Dalgaard, T.; Knudsen, M.T.; Keyhani, A.; Mousavi-Avval, S.H.; Hermansen, J.E. Potential greenhouse gas emission reductions in soybean farming: a combined use of Life Cycle Assessment and Data Envelopment Analysis. J. Clean. Prod. 2013, 54, 89–100. [Google Scholar] [CrossRef]
  27. Masuda, K. Measuring eco-efficiency of wheat production in Japan: a combined application of life cycle assessment and data envelopment analysis. J. Clean. Prod. 2016, 126, 373–381. [Google Scholar] [CrossRef]
  28. Ullah, A.; Perret, S.R.; Gheewala, S.H.; Soni, P. Eco-efficiency of cotton-cropping systems in Pakistan: an integrated approach of life cycle assessment and data envelopment analysis. J. Clean. Prod. 2016, 134, 623–632. [Google Scholar] [CrossRef]
  29. Huang, M.L.; Zeng, L.L.; Liu, C.J.; Li, X.Y.; Wang, H.L. Research on the Eco-Efficiency of Rice Production and Its Improvement Path: A Case Study from China. Int. J. Environ. Res. Pub He 2022, 19, 20. [Google Scholar] [CrossRef] [PubMed]
  30. Rashidi, K.; Saen, R.F. Measuring eco-efficiency based on green indicators and potentials in energy saving and undesirable output abatement. Energy Econ. 2015, 50, 18–26. [Google Scholar] [CrossRef]
  31. Yang, L.; Zhang, X. Assessing regional eco-efficiency from the perspective of resource, environmental and economic performance in China: A bootstrapping approach in global data envelopment analysis. J. Clean. Prod. 2018, 173, 100–111. [Google Scholar] [CrossRef]
  32. Xin, Y.; Tao, F. Optimizing genotype-environment-management interactions to enhance productivity and eco-efficiency for wheat-maize rotation in the North China Plain. Sci. Total Environ. 2019, 654, 480–492. [Google Scholar] [CrossRef]
  33. Oliveira, R.; Camanho, A.S.; Zanella, A. Expanded eco-efficiency assessment of large mining firms. J. Clean. Prod. 2017, 142, 2364–2373. [Google Scholar] [CrossRef]
  34. Yang, L.; Yang, Y. Evaluation of eco-efficiency in China from 1978 to 2016: Based on a modified ecological footprint model. Sci Total Environ. 2019, 662, 581–590. [Google Scholar] [CrossRef] [PubMed]
  35. Zeng, J.J.; Han, J.Y.; Qu, J.S.; Maraseni, T.N.; Xu, L.; Li, H.J.; Liu, L.N. Ecoefficiency of China's agricultural sector: What are the spatiotemporal characteristics and how are they determined? J. Clean. Prod. 2021, 325, 11. [Google Scholar] [CrossRef]
  36. He, G.J.; Ma, Z.G.; Wang, X.N.; Xiao, Z.; Dong, J.R. Does the improvement of regional eco-efficiency improve the residents' health conditions: Empirical analysis from China's provincial data. Ecol. Indic. 2021, 124, 107387. [Google Scholar] [CrossRef]
  37. Aigner, D.; Lovell, C.A.K.; Schmidt, P. Formulation and estimation of stochastic frontier production function models. J. Econom. 1977, 6, 21–37. [Google Scholar] [CrossRef]
  38. Meeusen, W.; van Den Broeck, J. Efficiency Estimation from Cobb-Douglas Production Functions with Composed Error. Int. Econ. Rev. 1977, 18, 435–444. [Google Scholar] [CrossRef]
  39. Jin, G.; Li, Z.; Deng, X.; Yang, J.; Chen, D.; Li, W. An analysis of spatiotemporal patterns in Chinese agricultural productivity between 2004 and 2014. Ecol Indic 2019, 105, 591–600. [Google Scholar] [CrossRef]
  40. Charnes, A.; Cooper, W.W.; Rhodes, E. Measuring the efficiency of decision making units. Eur. J. Oper. Res. 1978, 2, 429–444. [Google Scholar] [CrossRef]
  41. Angulo-Meza, L.; González-Araya, M.; Iriarte, A.; Rebolledo-Leiva, R.; Soares de Mello, J.C. A multiobjective DEA model to assess the eco-efficiency of agricultural practices within the CF + DEA method. Comput. Electron. Agric. 2019, 161, 151–161. [Google Scholar] [CrossRef]
  42. Tone, K. A slacks-based measure of efficiency in data envelopment analysis. Eur. J. Oper. Res. 2001, 130, 498–509. [Google Scholar] [CrossRef]
  43. Adamides, G.; Stylianou, A. Evaluation of the Radio as an Agricultural Information Source in Rural Areas. J. Agric. Food Inf. 2018, 19, 362–376. [Google Scholar] [CrossRef]
  44. Li, B.; Zhuo, N.; Ji, C.; Zhu, Q. Influence of Smartphone-Based Digital Extension Service on Farmers’ Sustainable Agricultural Technology Adoption in China. Int. J. Environ. Res. Public Health 2022, 19, 9639. [Google Scholar] [CrossRef] [PubMed]
  45. Norton, G.W.; Alwang, J. Changes in Agricultural Extension and Implications for Farmer Adoption of New Practices. Appl. Econ. Perspect. P. 2020, 42, 8–20. [Google Scholar] [CrossRef]
  46. Ma, Q.; Zheng, S.; Deng, P. Impact of Internet Use on Farmers’ Organic Fertilizer Application Behavior under the Climate Change Context: The Role of Social Network. Land 2022, 11, 1601. [Google Scholar] [CrossRef]
  47. Fabregas, R.; Kremer, M.; Schilbach, F. Realizing the potential of digital development: The case of agricultural advice. Science 2019, 366, eaay3038. [Google Scholar] [CrossRef] [PubMed]
  48. Steinke, J.; Achieng, J.O.; Hammond, J.; Kebede, S.S.; Mengistu, D.K.; Mgimiloko, M.G.; Mohammed, J.N.; Musyoka, J.; Sieber, S.; van de Gevel, J.; et al. Household-specific targeting of agricultural advice via mobile phones: Feasibility of a minimum data approach for smallholder context. Comput. Electron. Agric. 2019, 162, 991–1000. [Google Scholar] [CrossRef]
  49. Fernando, A.N. Seeking the treated: The impact of mobile extension on farmer information exchange in India. J. Dev. Econ. 2021, 153, 102713. [Google Scholar] [CrossRef]
  50. Zheng, Y.; Fan, Q.; Jia, W. How Much Did Internet Use Promote Grain Production?—Evidence from a Survey of 1242 Farmers in 13 Provinces in China. Foods 2022, 11, 1389. [Google Scholar] [CrossRef]
  51. Hou, J.; Huo, X.; Yin, R. Does computer usage change farmers’ production and consumption? Evidence from China. China Agric. Econ. Rev. 2018, 11, 387–410. [Google Scholar] [CrossRef]
  52. Khanal, A.R.; Mishra, A.K. Financial performance of small farm business households: the role of internet. China Agric. Econ. Rev. 2016, 8, 553–571. [Google Scholar] [CrossRef]
  53. Di Falco, S.; Veronesi, M.; Yesuf, M. Does Adaptation to Climate Change Provide Food Security? A Micro-Perspective from Ethiopia. Am. J. Agric. Econ. 2011, 93, 829–846. [Google Scholar] [CrossRef]
  54. Huang, J.K.; Wang, Y.J.; Wang, J.X. Farmers' Adaptation to Extreme Weather Events through Farm Management and Its Impacts on the Mean and Risk of Rice Yield in China. Am. J. Agric. Econ. 2015, 97, 602–617. [Google Scholar] [CrossRef]
  55. Läpple, D.; Hennessy, T.; Newman, C. Quantifying the Economic Return to Participatory Extension Programmes in Ireland: an Endogenous Switching Regression Analysis. J. Agric. Econ. 2013, 64, 467–482. [Google Scholar] [CrossRef]
  56. Zhu, X.; Hu, R.; Zhang, C.; Shi, G. Does Internet use improve technical efficiency? Evidence from apple production in China. Technol. Forecast. Soc. Chang. 2021, 166. [Google Scholar] [CrossRef]
  57. Dubey, A.; Lal, R. Carbon footprint and sustainability of agricultural production systems in Punjab, India, and Ohio, USA. J. Crop Improv. 2009, 23, 332–350. [Google Scholar] [CrossRef]
  58. Lai, S.Y.; Du, P.F.; Chen, J.N. Evaluation of non-point source pollution based on unit analysis. J. T Singhua Univ. 2004, 44, 1184–1187. [Google Scholar] [CrossRef]
  59. Song, C.; Liu, R.; Oxley, L.; Ma, H. The adoption and impact of engineering-type measures to address climate change: evidence from the major grain-producing areas in China. Aust. J. Agric. Resour. Econ. 2018, 62, 608–635. [Google Scholar] [CrossRef]
  60. Ma, W.; Nie, P.; Zhang, P.; Renwick, A. Impact of Internet use on economic well-being of rural households: Evidence from China. Rev. Dev. Econ. 2020, 24, 503–523. [Google Scholar] [CrossRef]
  61. Huang, Y.; Luo, X.; Liu, D.; Du, S.; Yan, A.; Tang, L. Pest control ability, technical guidance, and pesticide overuse: evidence from rice farmers in rural China. Environ. Sci. Pollut. R. 2021, 28, 39587–39597. [Google Scholar] [CrossRef]
  62. Zheng, H.; Ma, W.; Wang, F.; Li, G. Does internet use improve technical efficiency of banana production in China? Evidence from a selectivity-corrected analysis. Food Policy 2021, 102. [Google Scholar] [CrossRef]
  63. Khataza, R.R.B.; Hailu, A.; Doole, G.J.; Kragt, M.E.; Alene, A.D. There is growing evidence that elderly farmers may be less likely to employ new technology because of path-dependence effect. Agric. Econ-Blackwell 2019, 50, 237–246. [Google Scholar] [CrossRef]
  64. Desiere, S.; Jolliffe, D. Land productivity and plot size: Is measurement error driving the inverse relationship? J. Dev. Econ. 2018, 130, 84–98. [Google Scholar] [CrossRef]
  65. Maddala, G.S. Limited-dependent and qualitative variables in econometrics; Cambridge university press: 1983.
Disclaimer/Publisher’s Note: The statements, opinions and data contained in all publications are solely those of the individual author(s) and contributor(s) and not of MDPI and/or the editor(s). MDPI and/or the editor(s) disclaim responsibility for any injury to people or property resulting from any ideas, methods, instructions or products referred to in the content.
Figure 5. Probability density of EE for two regimes.
Preprints 95874 g005
Figure 6. Variation of coefficients with different quantiles.
Preprints 95874 g006
Table 4. Descriptive statistics of variables for the ESR model.
Variables Definition Total DATES Users DATES nonusers Difference
EE ranges from 0 to 1 0.671 0.702 0.608 0.094***
DATES use 1 = yes, 0 = no 0.677 1.000 0.000 1.000***
Communication signal strength very bad, bad, average, good and excellent equal to 1-5, respectively 2.535 2.799 1.979 0.820***
Age age of respondents 48.479 46.786 52.036 -5.250***
Gender 1 = male, 0 = female 0.749 0.820 0.600 0.220***
Health status 1=very poor, 2=poor, 3=fair, 4=better, 5=very good 3.858 4.051 3.665 0.386***
Education years of education 11.044 11.772 9.514 2.258***
Off-farm work 1 = yes, 0 = no 0.523 0.541 0.486 0.055
Village leader 1 = yes, 0 = no 0.157 0.197 0.071 0.126***
Farm size maize planted area (hectare) 0.730 0.860 0.519 0.340***
Income from other crops other crops gross revenue in 2022 (ten thousand yuan 1/ha) 5.300 5.345 5.025 0.320**
Labor number of laborers per household 2.320 2.452 2.213 0.239
Degree of specialization maize production area/all arable area, % 0.515 0.515 0.513 0.002
Digital technology training 1 = yes, 0 = no 0.468 0.476 0.451 0.025*
Market distance Distance from the household to the nearest central market (km) 9.949 10.035 9.830 0.205
Note: yuan is Chinese currency (1USD = 6.99 Yuan in 2022). ***, **, and * denote significance at the 1%, 5%, and 10% levels, respectively.
Table 5. Descriptive summary of EE scores.
Group Mean Standard
Deviation
Min Max
DATES users 0.702 0.187 0.481 1
DATES nonusers 0.608 0.189 0.397 0.9
All 0.671 0.192 0.397 1
Table 6. Estimation results of the ESR model.
Variable ESR
Selection equation Outcome equations (EE)
DATES users DATES nonusers
Age -0.003*** -0.002*** -0.003**
(0.004) (0.001) (0.001)
Gender 0.613*** 0.079*** 0.011
(0.094) (0.017) (0.022)
Health status 0.156*** -0.076 -0.079
(-0.058) (0.076) (0.184)
Education 0.041*** -0.001 0.002
(0.015) (0.002) (0.004)
Off-farm work 0.248*** -0.011 0.030
(0.081) (0.012) (0.019)
Village leader 0.319** 0.068*** -0.053
(0.130) (0.017) (0.035)
Farm size 0.167** -0.025*** -0.029***
(0.042) (-0.005) (0.010)
Income from other crops -0.695** 0.252*** 0.194**
(0.298) (0.043) (0.077)
Labor -0.049 -0.016*** -0.012
(0.042) (0.006) (0.010)
Specialization degree -0.127 -0.015 -0.108***
(0.134) (0.020) (0.031)
Market distance -0.078 -0.023*** 0.007
(0.054) (0.008) (0.011)
Digital technology training 0.070 -0.031** -0.058***
(0.083) (0.013) (0.018)
Communication signal strength 0.355***
(0.039)
Constant -0.652* 0.995*** 0.767***
(0.372) (0.057) (0.092)
ln σ 1 -1.712***
(0.031)
ln σ 0 -1.748***
(0.050)
ρ 1 -0.505***
(0.107)
ρ 0 -0.253
(0.250)
Durbin-Wu-Hausman 30.009***
Cragg-Donald Wald F Statistic 70.965
Stock-Yogo critical values under 10% bias 16.380
LR test of independentequations 16.660***
Note: Figures in parentheses are standard error, ***, **, * indicate significant at the 1%, 5%, and 10% levels, respectively.
Table 7. Average treatment effects of DATES use on EE.
Group Use No use ATT ATU
DATES users 0.701 0.553 0.148***
DATES nonusers 0.822 0.608 0.214***
Table 8. Robustness check based on the ESR, TEM and OLS.
Items ESR TEM OLS
Coefficient of DATES use 0.188*** 0.076***
(0.026) (0.011)
ATT 0.148***
(0.004)
ATU 0.214***
(0.005)
Control variables Yes Yes Yes
Note: ***, **, * indicate significant at the 1%, 5%, and 10% levels, respectively.
Table 9. Heterogeneous impact of DATES use on EE.
Items EE
15th 30th 50th 60th 75th
DATES users 0.097*** 0.098*** 0.079*** 0.073*** 0.033
(0.005) (0.005) (0.011) (0.019) (0.028)
Control variables Yes Yes Yes Yes Yes
Pseudo R2 0.193 0.141 0.083 0.115 0.156
Note: Figures in parentheses are standard errors. ***, **, and * denote significance at the 1%, 5%, and 10% levels, respectively.
Table 10. Estimation of mediation effect model.
Variable EE Adoption of organic fertilizer Adoption of green pesticide Adoption of biodegradable agricultural films EE
DATES use 0.094***
(0.011)
0.171***
(0.029)
0.188***
(0.029)
0.180***
(0.029)
Adoption of organic fertilizer 0.094***
(0.010)
Adoption of green pesticide 0.068***
(0.010)
Adoption of biodegradable agricultural films 0.058***
(0.011)
Control variables Yes Yes Yes Yes Yes
Number of observations 1302 1302 1302 1302 1302
Disclaimer/Publisher’s Note: The statements, opinions and data contained in all publications are solely those of the individual author(s) and contributor(s) and not of MDPI and/or the editor(s). MDPI and/or the editor(s) disclaim responsibility for any injury to people or property resulting from any ideas, methods, instructions or products referred to in the content.
Copyright: This open access article is published under a Creative Commons CC BY 4.0 license, which permit the free download, distribution, and reuse, provided that the author and preprint are cited in any reuse.
Prerpints.org logo

Preprints.org is a free preprint server supported by MDPI in Basel, Switzerland.

Subscribe

© 2024 MDPI (Basel, Switzerland) unless otherwise stated