Submitted:
09 January 2024
Posted:
09 January 2024
You are already at the latest version
Abstract
Keywords:
1. Introduction
2. Materials and Methods
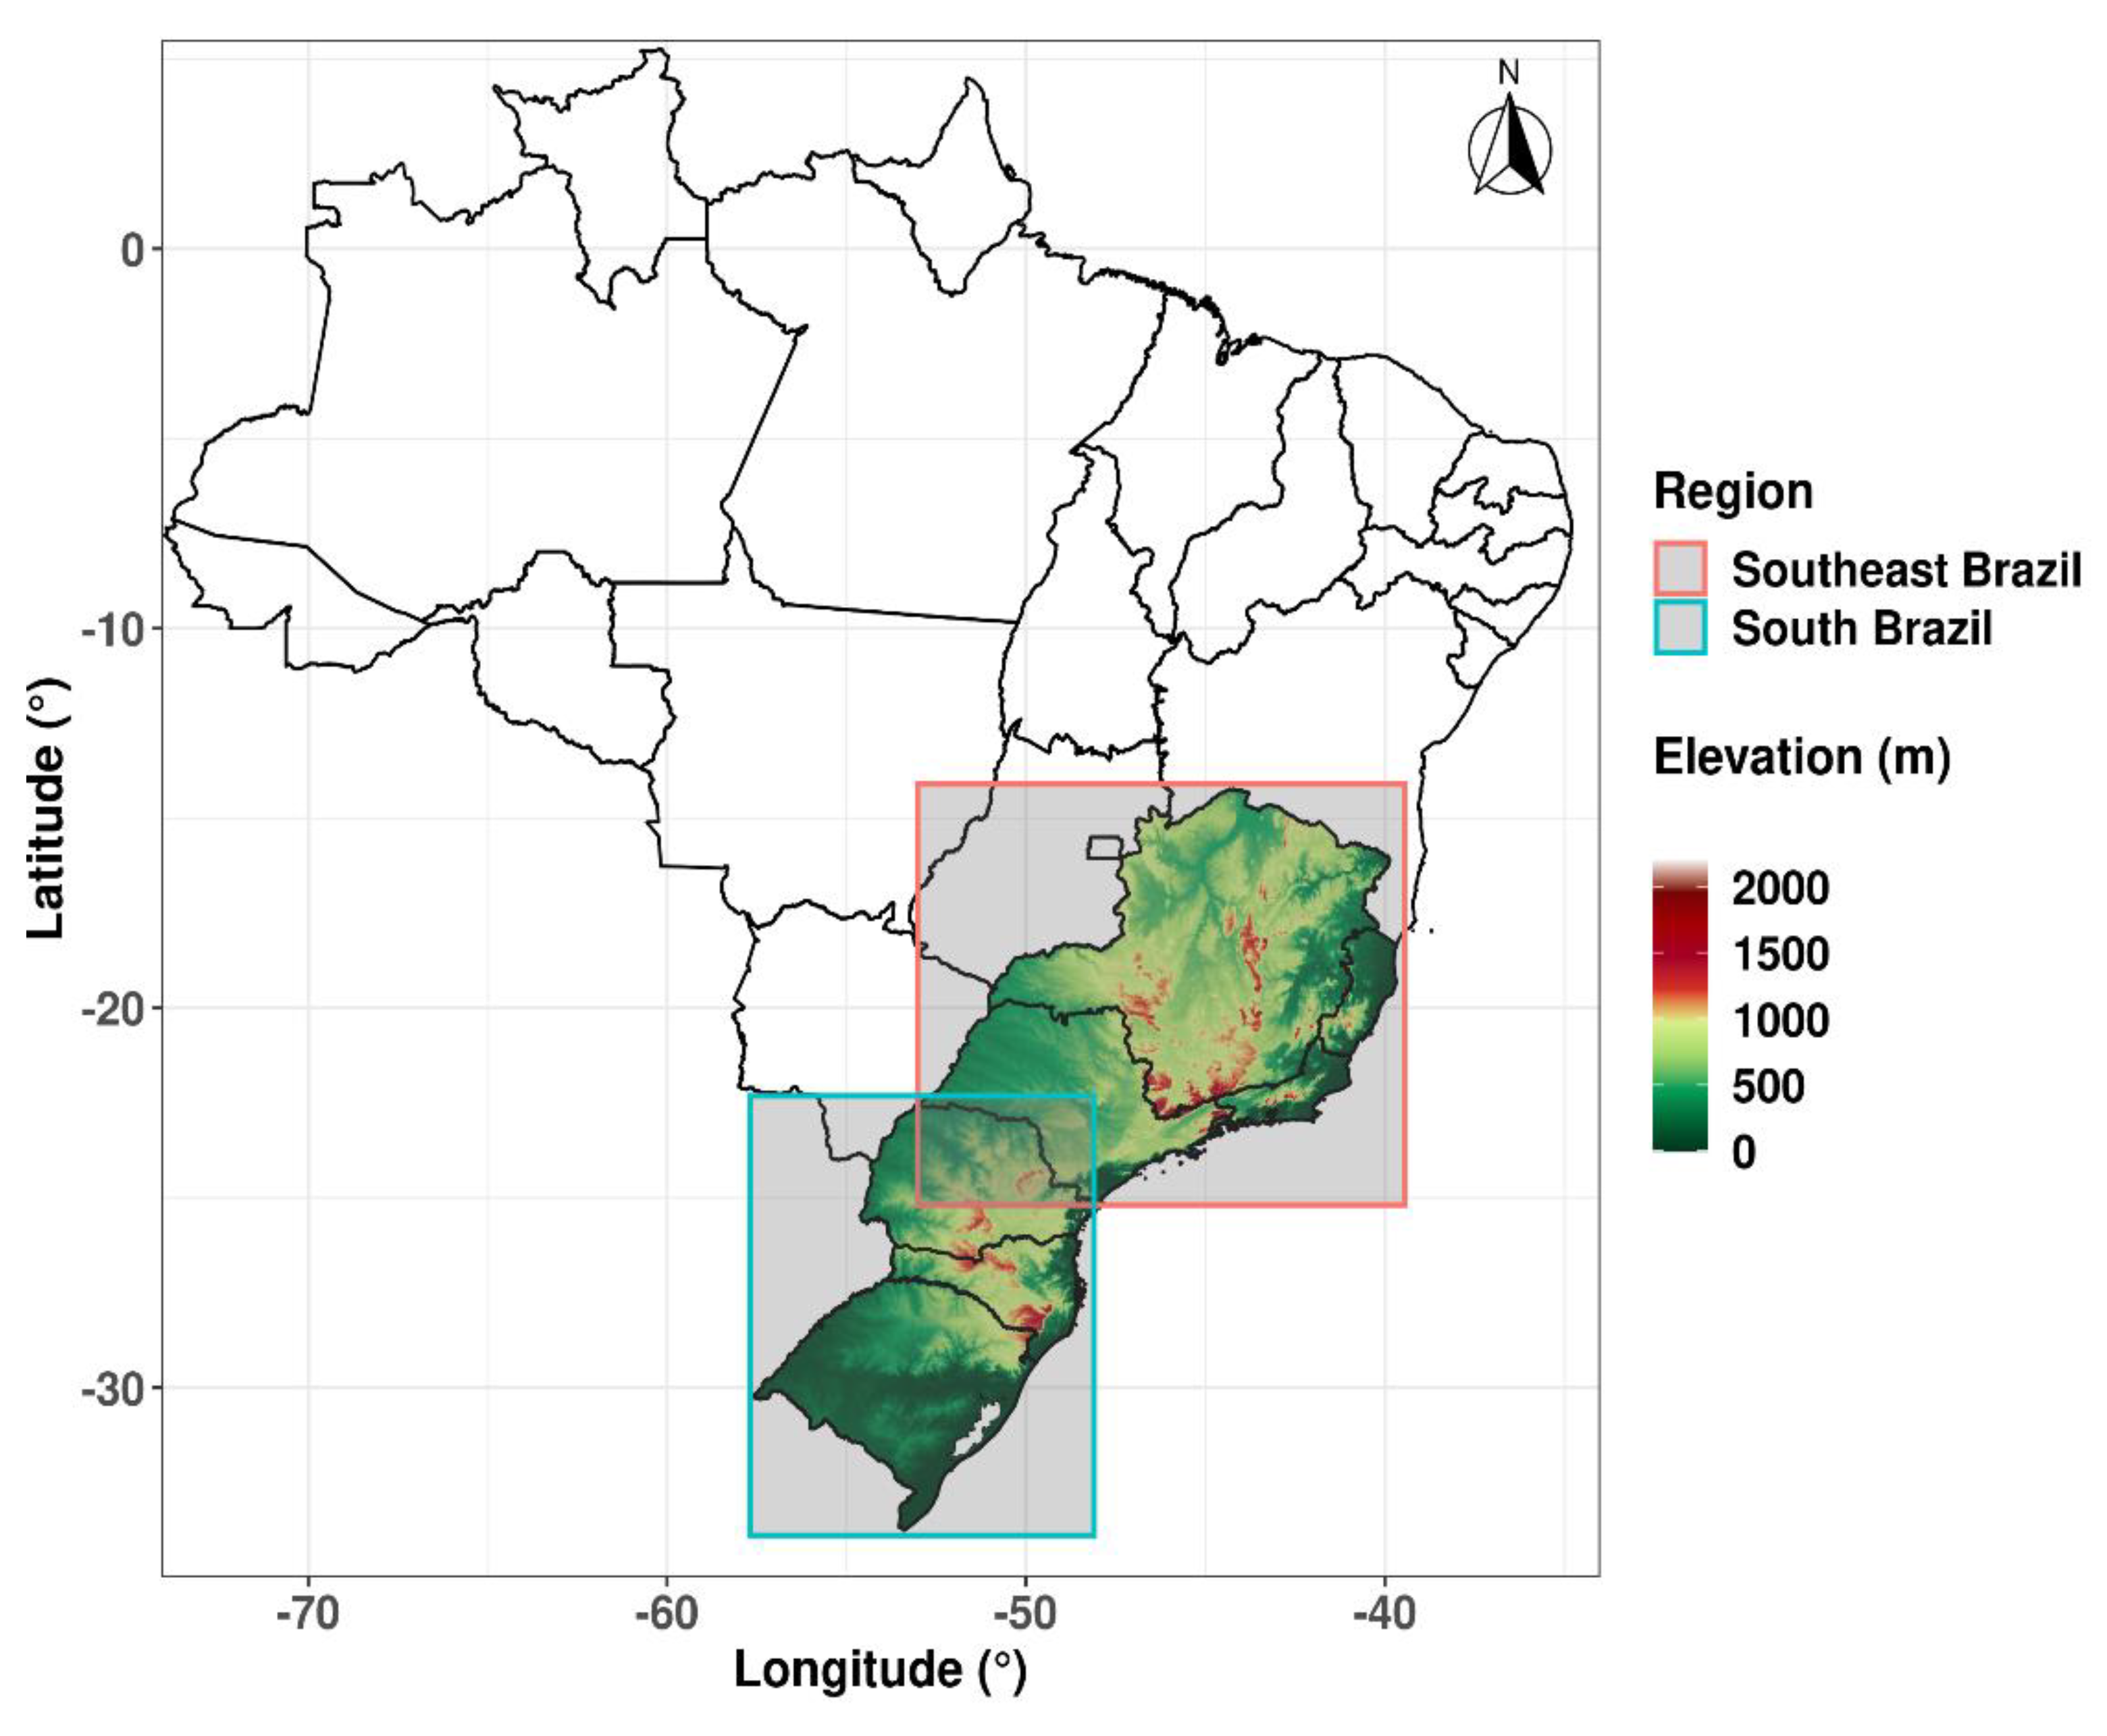
2.1. Datasets and study area
2.2. Drought characterization
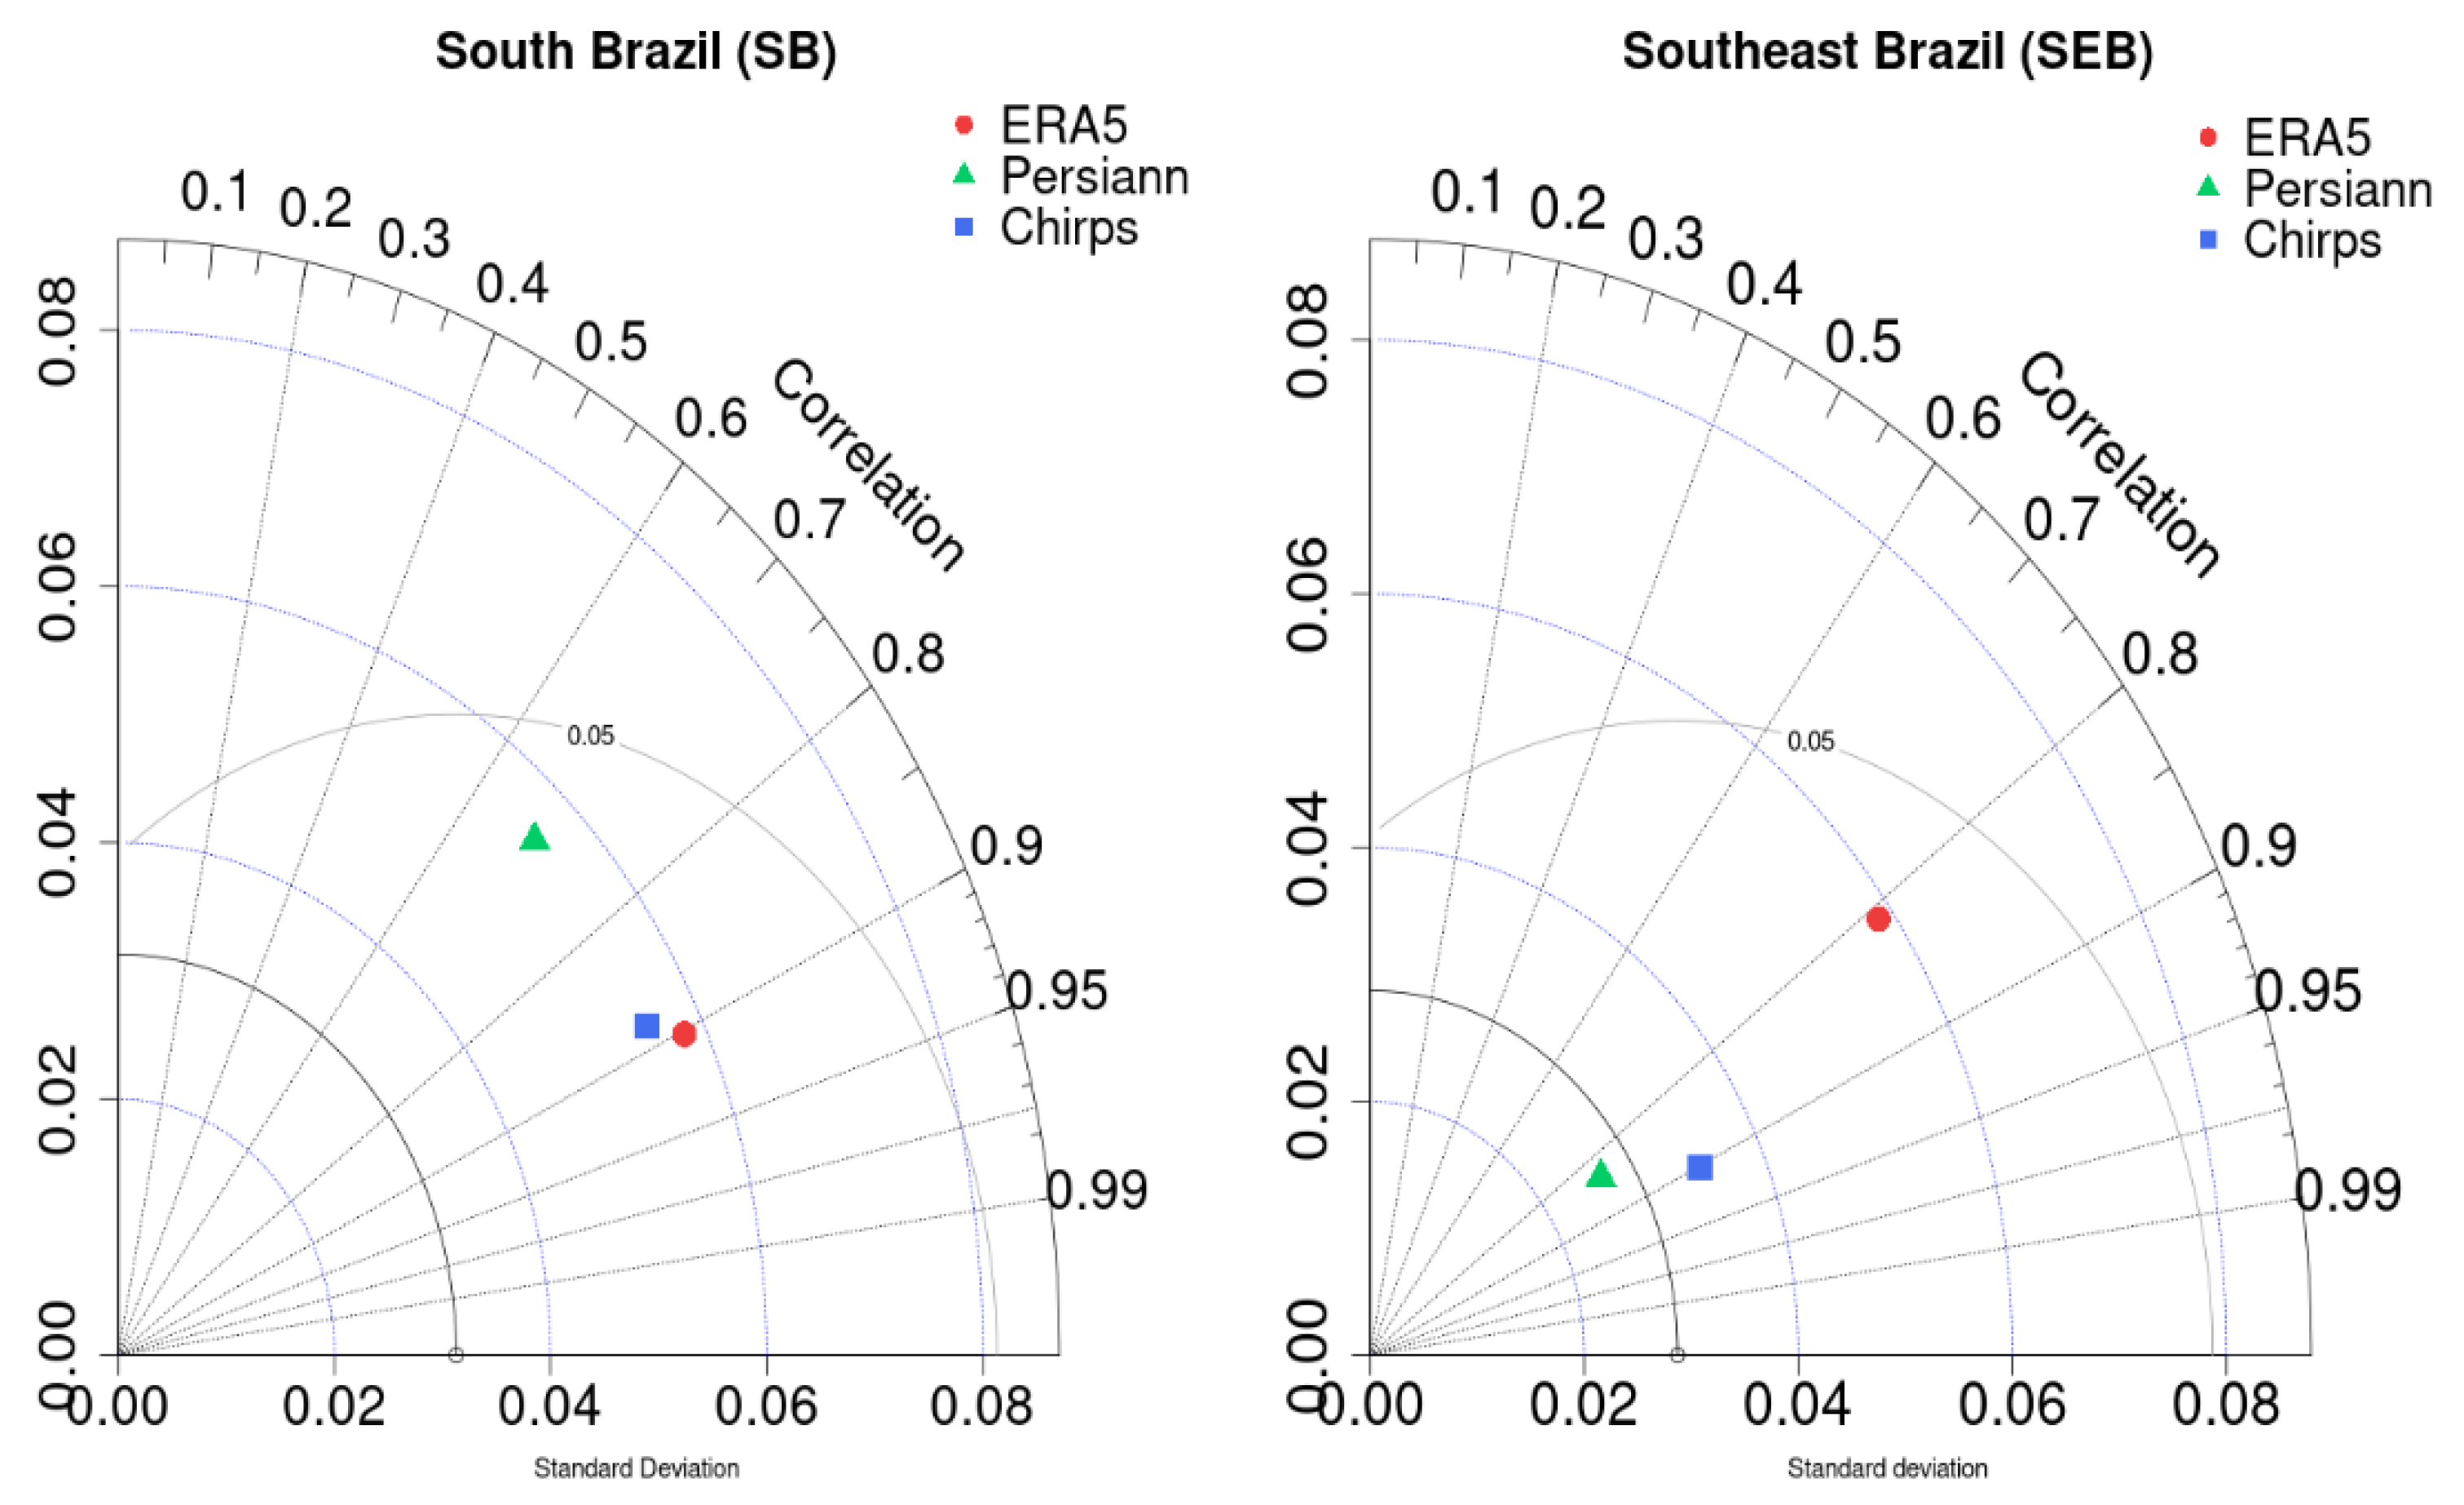
2.3. Validation of precipitation datasets
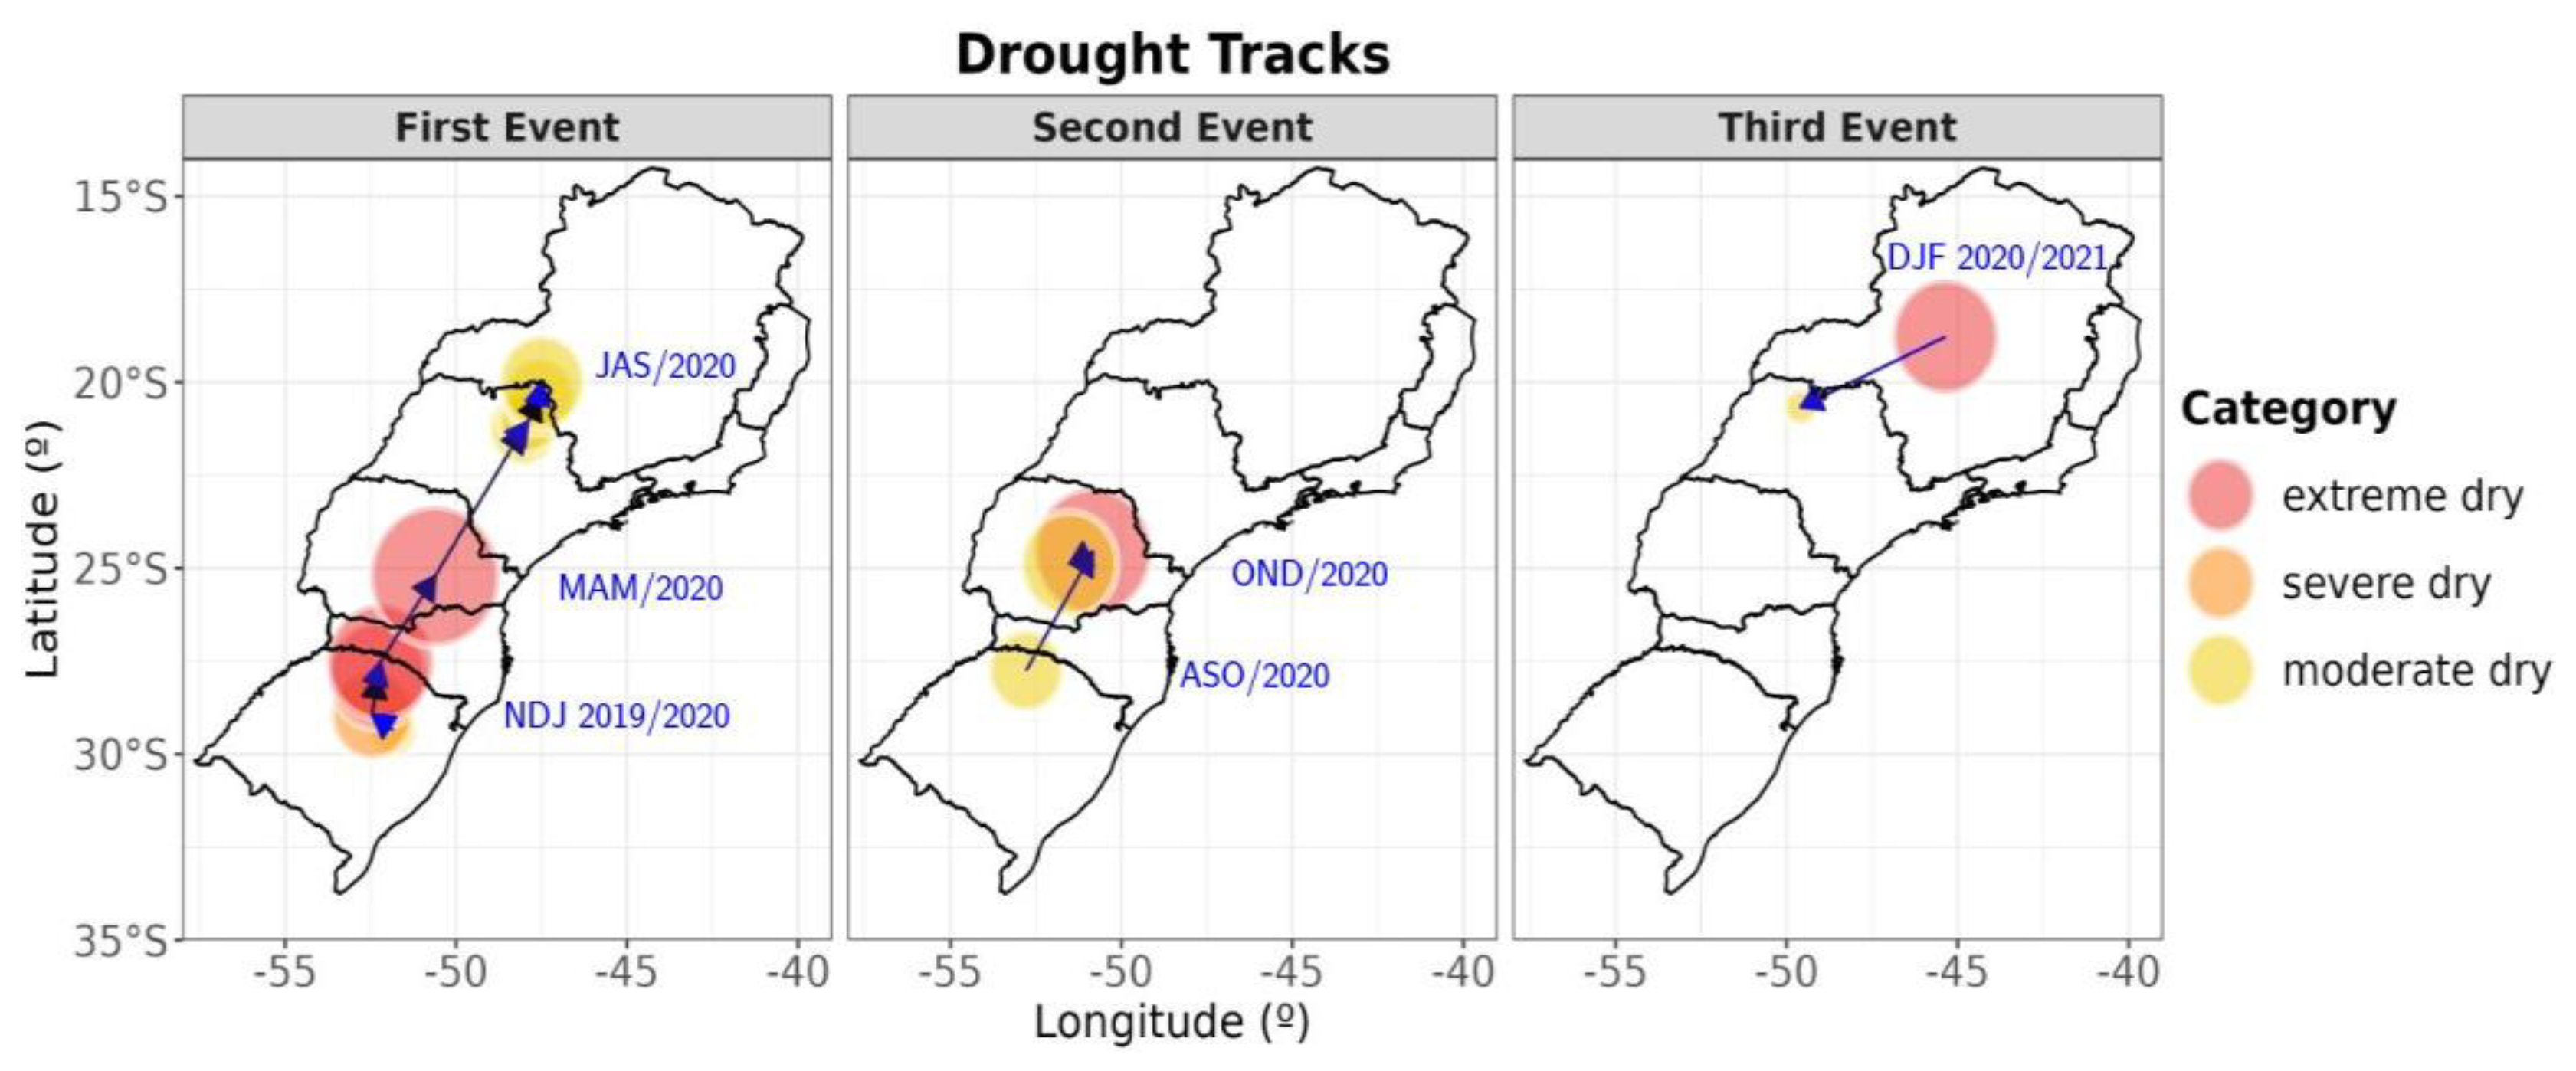
2.4. Spatial Tracking of Drought
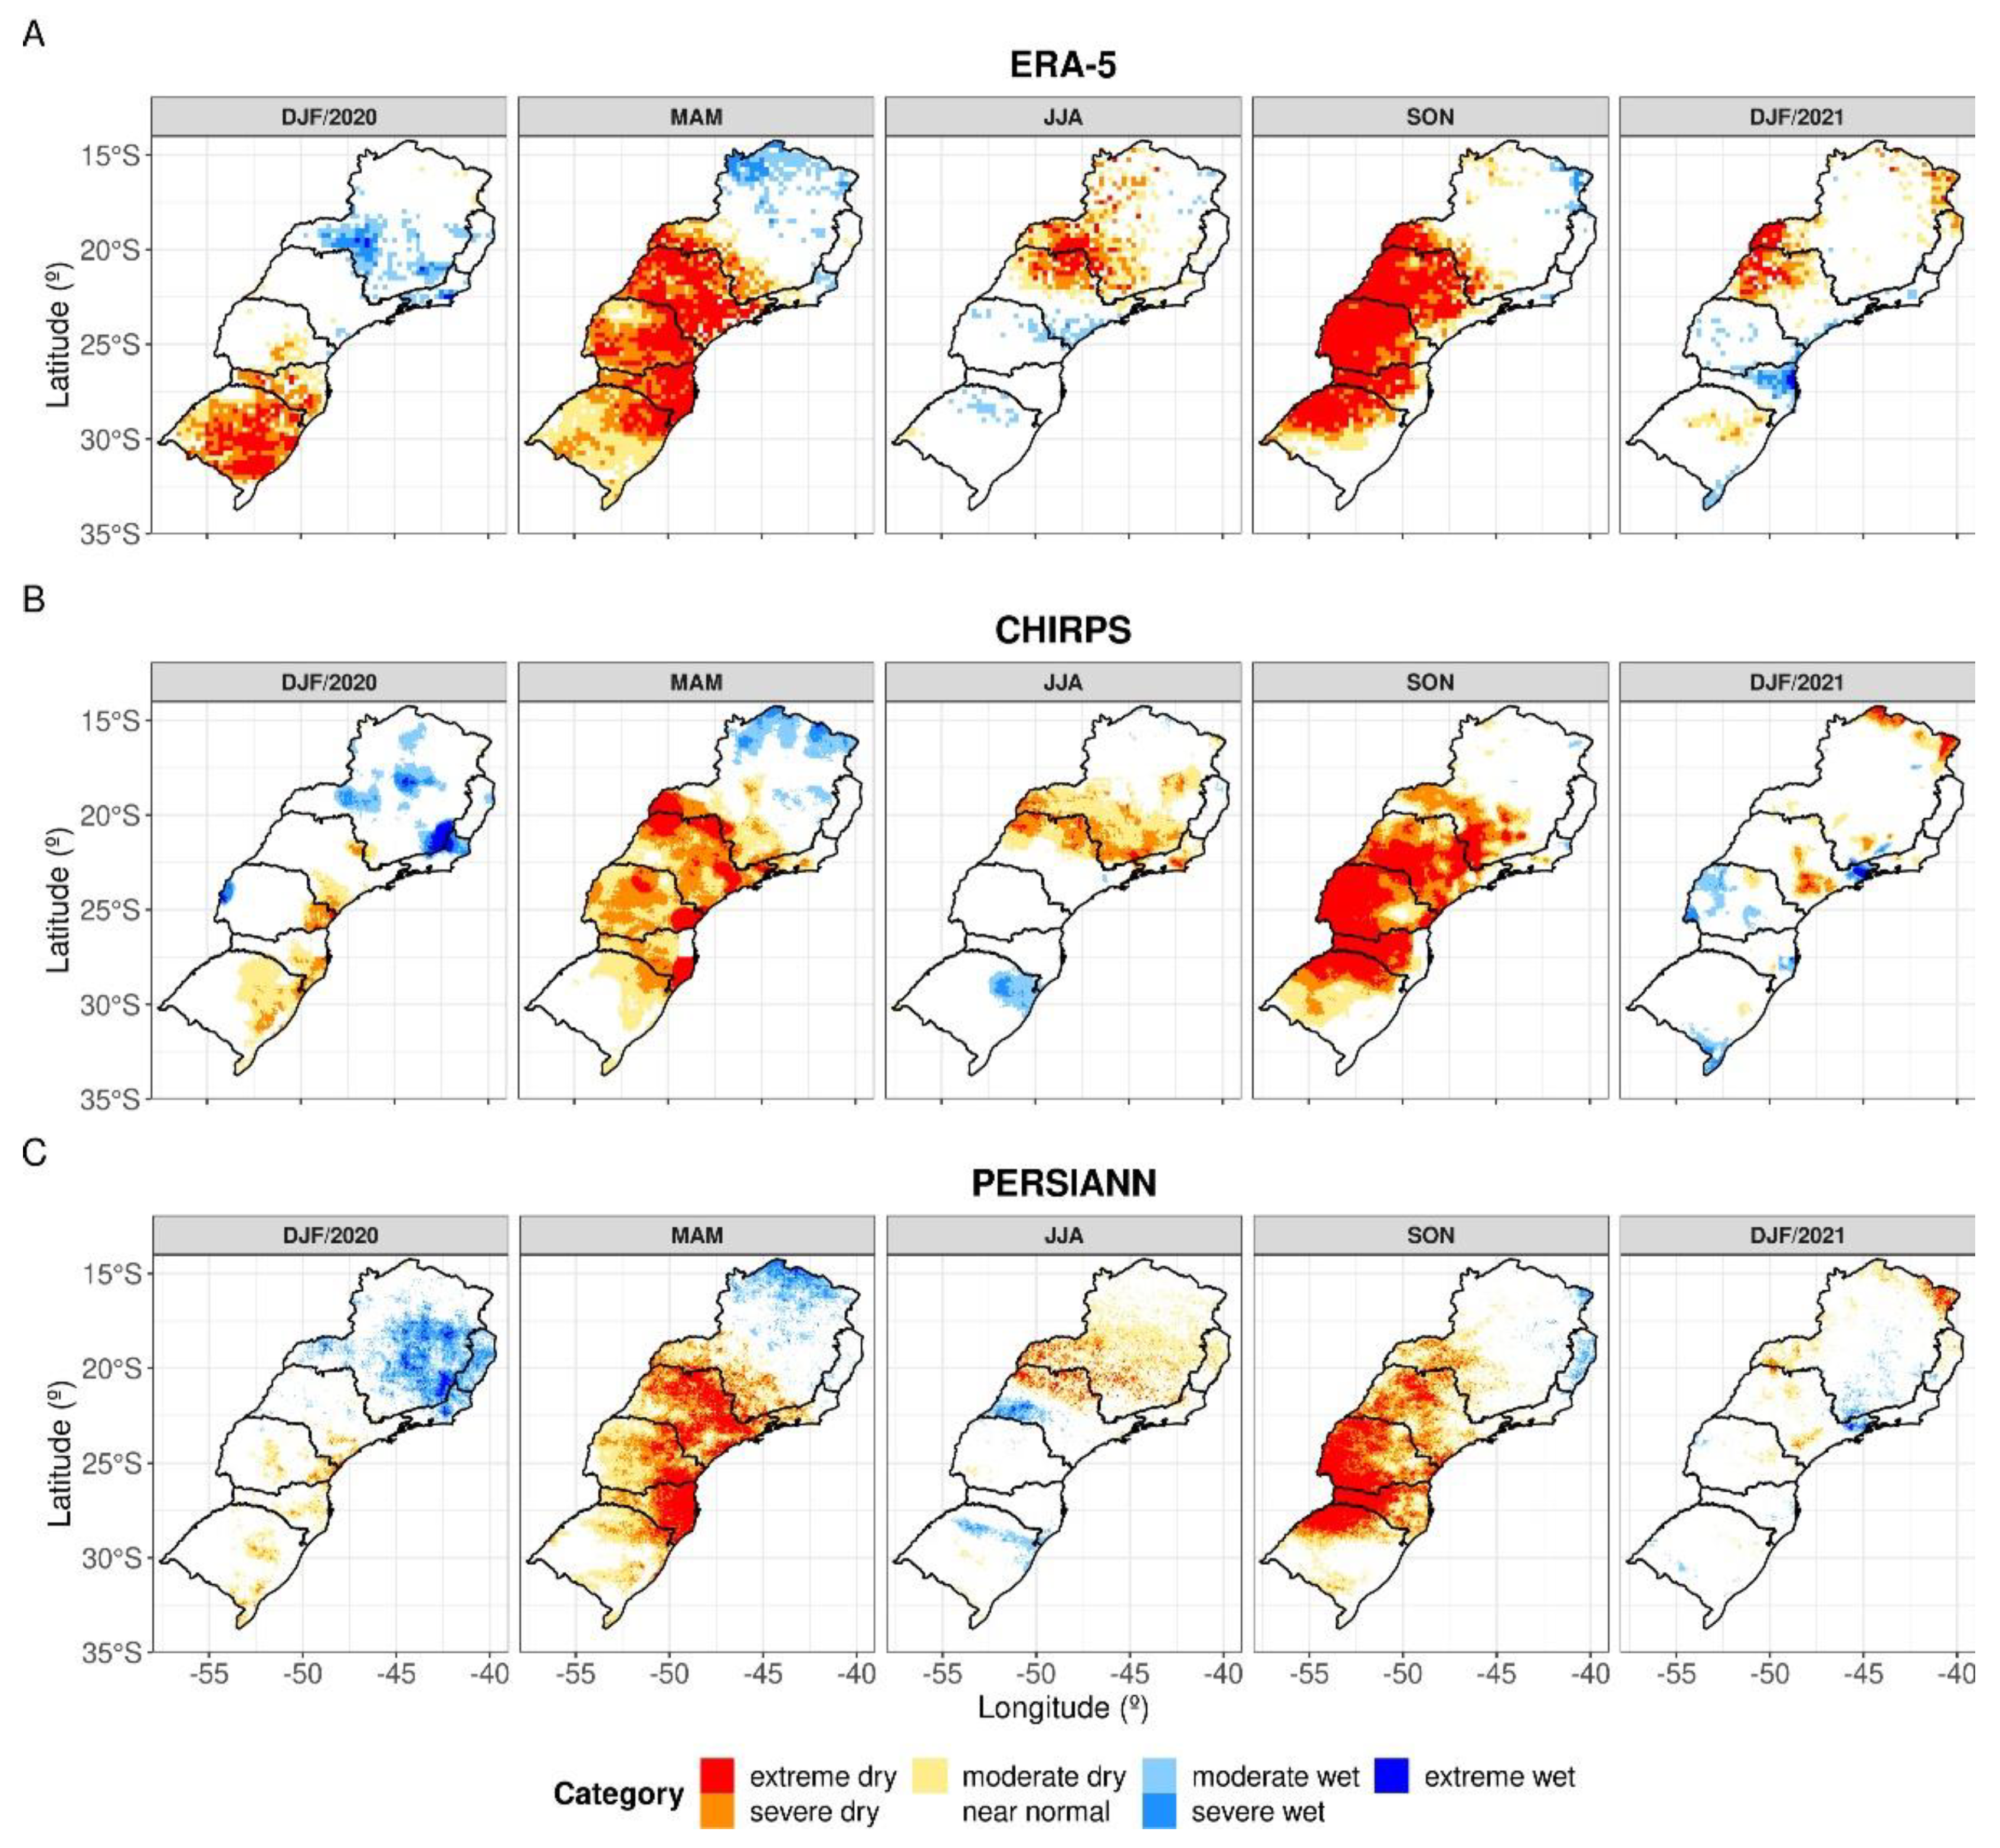
3. Results
4. Summary
Author Contributions
Funding
Acknowledgments
Conflicts of Interest
References
- DERAL – Departamento de Economia Rural. Boletim Informativo – Estiagem Histórica no Paraná. 2020. https://www.agricultura.pr.gov.br/sites/default/arquivos_restritos /files/documento/2020-05/estiagem_18_maio_2020.pdf. (Accessed May, 2023).
- Getirana, A., Libonati, R, Cataldi, M. Brazil is in water crisis—it needs a drought plan. Nature 2021, 600, 218–220. [CrossRef] [PubMed]
- Naumann, G., Podesta, G., Marengo, J., Luterbacher, J., Bavera, D., Arias-Muñoz, C., Marinho Ferreira Barbosa, P., Cammalleri, C., Chamorro, L., Cuartas, L.A., De Jager, A., Escobar, C., Hidalgo, C., Leal De Moraes, O.L., Mccormick, N., Maetens, W., Magni, D., Masante, D., Mazzeschi, M., Seluchi, M., De Los Milagros Skansi, M., Spinoni, J., Toreti, A. The 2019-2021 extreme drought episode in La Plata Basin, EUR 30833 EN, Publications Office of the European Union, Luxembourg, 2021. ISBN 978-92-76-47671-92021. [CrossRef]
- Gomes, M.S., de Albuquerque Cavalcanti, I.F., Müller, G.V. 2019/2020 drought impacts on South America and atmospheric and oceanic influences. Weather and Climate Extremes, 2021, 34, 100404. [CrossRef]
- Spinoni, J., Barbosa, P., De Jager, A., McCormick, N., Naumann, G., Vogt, J.V., Magni, D., Masante, D., Mazzeschi, M. A new global database of meteorological drought events from 1951 to 2016. Journal of Hydrology: Regional Studies 2019, 22, 100593. [CrossRef] [PubMed]
- Diaz, V., Perez, G.A.C., Van Lanen, H.A., Solomatine, D., Varouchakis, E.A. An approach to characterize spatio-temporal drought dynamics. Advances in Water Resources, 2020, 137, 103512. [CrossRef]
- Herrera-Estrada, J. E., Satoh, Y., Sheffield, J. Spatiotemporal dynamics of global drought. Geophysical Research Letters 2017, 44, 2254–2263. [CrossRef]
- Hosseini, A., Ghavidel, Y., Farajzadeh, M. Characterization of drought dynamics in Iran by using S-TRACK method. Theoretical and Applied Climatology 2021, 145, 661–671. [CrossRef]
- Verhoeven, E., Wardle, G.M., Roth, G.W., Greenville, A.C. Characterizing the spatiotemporal dynamics of drought and wet events in Australia. Science of The Total Environment 2022, 846, 157480. [CrossRef] [PubMed]
- Sadeghi, M., Nguyen, P., Naeini, M.R.., Hsu, K., Braithwaite, D., Sorooshian, S. PERSIANN-CCS-CDR, a 3-hourly 0.04° global precipitation climate data record for heavy precipitation studies. Sci Data 2021, 8, 157. [CrossRef]
- Funk, C., Peterson, P., Landsfeld, M., Pedreros, D., Verdin, J., Shukla, S., ... & Michaelsen, J. The climate hazards infrared precipitation with stations—a new environmental record for monitoring extremes. Sci Data 2015, 2, 150066. [CrossRef]
- Hersbach, H., Bell, B., Berrisford, P., Hirahara, S., Horányi, A., Muñoz-Sabater, J., ... & Thépaut, J.N. The ERA5 global reanalysis. Quarterly Journal of the Royal Meteorological Society, 2020, 146, 1999–2049. [CrossRef]
- Tirivarombo, S., Osupile, D., Eliasson, P. Drought monitoring and analysis: Standardized Precipitation Evapotranspiration Index (SPEI) and Standardized Precipitation Index (SPI). Physics and Chemistry of the Earth, 2018. [CrossRef]
- Kamruzzaman, M., Cho, J., Jang, M.W., Hwang, S. Comparative evaluation of standardized precipitation index (SPI) and effective drought index (EDI) for meteorological drought detection over Bangladesh. Journal of the Korean Society of Agricultural Engineers 2019, 61, 145–159. [CrossRef]
- McKee, T.B., Doesken, N.J., Kleist, J. The relationship of drought frequency and duration to time scales. In: Proceedings of the 8th Conference on Applied Climatology. AMS, Boston, MA, 1993, p. 179–184.
- Rocha, L.H.D.S., Silva, D.F.D., Kayano, M.T., Bonfim, O.E.T. Homogeneidade, Eventos Extremos e suas Causas Climáticas: Bacia Hidrográfica do Rio São Francisco. Revista Brasileira de Meteorologia 2022, 37, 199–212. [CrossRef]
- Dos Santos, B.C., Sanches, R.G., Moreira, R.M., Bourscheidt, V., Souza, P.H. Análise espaço-temporal da precipitação na região central do estado de São Paulo utilizando dados CHIRPS. Revista Brasileira de Geografia Física, 2022, 15, 2582–2600. [CrossRef]
- Taylor, K.E. Summarizing multiple aspects of model performance in a single diagram. Journal of Geophysical Research, 2001, 106, 7183–7192. [Google Scholar] [CrossRef]
- Yang, X., Zhou, B., Xu, Y., Han, Z. CMIP6 evaluation and projection of temperature and precipitation over China. Advances in Atmospheric Sciences, 2021, 38, 817–830. [CrossRef]
- Diaz, V., Corzo Perez, G.A., Van Lanen, H.A.J., Solomatine, D. Intelligent drought tracking for its use in machine learning: implementation and first results. In: La Log- gia, G., Freni, G., Puleo, V., De Marchis, M. (Eds.), HIC 2018. 13th International Conference on Hydroinformatics, 3 Palermo: EasyChair, 2018. [CrossRef]
- Diaz, V., Perez, G.A.C., Van Lanen, H.A., Solomatine, D., Varouchakis, E.A. Characterisation of the dynamics of past droughts. Science of the Total Environment, 2020; 718, 134588. [CrossRef]
- Corzo Perez, G.A., Van Huijgevoort, M.H.J., Voß, F., Van Lanen, H.A.J. On the spatio-temporal analysis of hydrological droughts from global hydrological models. Hydrology and Earth System Sciences, 2011, 15, 2963–2978. [CrossRef]
- Anjum, M.N. , Irfan, M. , Waseem, M., Leta, M.K., Niazi, U.M.,... & Nadeem, M.U. Assessment of PERSIANN-CCS, PERSIANN-CDR, SM2RAIN-ASCAT, and CHIRPS-2.0 rainfall products over a semi-arid subtropical climatic region. Water, 2022, 14, 147. [Google Scholar] [CrossRef]
- Prakash, S. Performance assessment of CHIRPS, MSWEP, SM2RAIN-CCI, and TMPA precipitation products across India. Journal of hydrology, 2019; 571, 50–59. [CrossRef]
- Singh, T., Saha, U., Prasad, V.S., Gupta, M.D. Assessment of newly-developed high resolution reanalyses (IMDAA, NGFS and ERA5) against rainfall observations for Indian region. Atmospheric Research 2021, 259, 105679. [CrossRef]
- Jafarpour, M., Adib, A., Lotfirad, M. Improving the accuracy of satellite and reanalysis precipitation data by their ensemble usage. Applied Water Science, 2022, 12, 232. [CrossRef]
- Coelho, C. , Uvo, C., Ambrizzi, T. Exploring the impacts of the tropical Pacific SST on the precipitation patterns over South America during ENSO periods. Theor Appl Climatol, 2002, 71, 185–197. [CrossRef]
- Minuzzi, R.B., Sediyama, G.C., Ribeiro, A., Costa, J. El Niño: ocorrência e duração dos veranicos do Estado de Minas Gerais. Revista brasileira de engenharia agrícola e ambiental 2005, 9, 364–371. [CrossRef]
- Cemadem - Centro Nacional de Monitoramento e Alertas de Desastres Naturais. Boletim Monitoramento de secas e impactos no Brasil Abril/2020. Ministério da Ciência, Tecnologia e Inovações. 2020. http://www2.cemaden.gov.br/wp-content/uploads/2020/05/ Boletim_BRASIL_abr2020.pdf (Accessed May, 2023).
- Marengo, J.A., Cunha, A.P., Cuartas, L.A., Deusdará Leal, K.R., Broedel, E., Seluchi, M. E., ... & Bender, F. Extreme drought in the Brazilian Pantanal in 2019–2020: characterization, causes, and impacts. Frontiers in Water 2021, 3, 639204. [CrossRef]
- Geirinhas, J.L. , Russo A., Libonati R., Miralles, D., Ramos, A., Gimeno, L., & Trigo, R. Combined large-scale tropical and subtropical forcing on severe soil desiccation in South America. Research Square, 2023. [CrossRef]
- Tedeschi, R.G. , Cavalcanti, I.F.A., Grimm, A.M. Influences of two types of ENSO on South American precipitation. International Journal of Climatology, 2013. [CrossRef]
- Grimm, A.M. , Almeida, A.S., Beneti, C.A.A., Leite, E.A. O efeito combinado de oscilações climáticas na produção de extremos: a seca de 2020 no Sul do Brasil. RBRH, 2020, 25. [CrossRef]
- Santos, E.B., de Freitas, E.D., Rafee, S.A.A., Fujita, T., Rudke, A.P., Martins, L.D., Souza, R.A.F., Martins, J. A. Spatio-temporal variability of wet and drought events in the Paraná River basin—Brazil and its association with the El Niño—Southern oscillation phenomenon. International Journal of Climatology 2021, 41, 4879–4897. [CrossRef]
| SPI | Category |
|---|---|
| Extreme wet | > 2 |
| Severe wet | > 1,5 to ≤ 2 |
| Moderate wet | > 1 to ≤ 1,5 |
| Near normal | > -1 to ≤ 1 |
| Moderate dry | > -1,5 to ≤ -1 |
| Severe dry | > -2 to ≤ 1,5 |
| Extreme dry | ≤ -2 |
Disclaimer/Publisher’s Note: The statements, opinions and data contained in all publications are solely those of the individual author(s) and contributor(s) and not of MDPI and/or the editor(s). MDPI and/or the editor(s) disclaim responsibility for any injury to people or property resulting from any ideas, methods, instructions or products referred to in the content. |
© 2024 by the authors. Licensee MDPI, Basel, Switzerland. This article is an open access article distributed under the terms and conditions of the Creative Commons Attribution (CC BY) license (http://creativecommons.org/licenses/by/4.0/).


