Preprint
Article

Assessment of the Pollution Present in School Playgrounds in the City of Murcia (SE Spain)

Altmetrics

Downloads

108

Views

49

Comments

0

Submitted:

09 January 2024

Posted:

10 January 2024

You are already at the latest version

Alerts
Abstract
Urban dust samples were taken from the playgrounds of 27 schools located in the urban area of the city of Murcia (S.E. Spain). Their color and degree of magnetism were determined, as well as their heavy metal content (Cd, Cu, Cr, Ni, Pb and Zn) to evaluate contamination by environmental and health indexes. The highest concentration of contaminants is found in dusts of dark color and medium and high magnetism. The concentrations of heavy metals in the dust were, in this order, Zn (453.74 mg kg-1)> Cu (77.44 mg kg-1)> Cr (67.93 mg kg-1)> Pb (55.72 mg kg-1)> Ni (18.56 mg kg-1)> Cd (0.42 mg kg-1). The analysis of the magnetic and non-magnetic fraction indicates that there is a concentration of all heavy metals in the magnetic fraction. According to the geoenvironmental indices used, the ecological risk presented by school playgrounds is moderate. As for the health indices, ingestion was the main route of exposure and entry of dust particles into the body, being the main health risk for adults and children for all metals. The Hazard Index (HI) values for all elements for both adults and children were less than 1, indicating that there is no risk of developing adverse health effects. As for the Cancer Risk (CR), the values of this index indicate that there is no risk. The objective of this study was to evaluate pollution in the playgrounds of schools in the city of Murcia.
Keywords: 
Subject: Public Health and Healthcare  -   Public, Environmental and Occupational Health

1. Introduction

Urban dust is a heterogeneous mixture of different elements and pollutant particles, originating from natural and/or anthropogenic activities, such as erosion, industrial processes, heating, construction debris and, above all, road traffic [1]. These particles, after dissipation into the atmosphere, are deposited on surfaces. Among the pollutants that make up urban dust, perhaps the most dangerous to health are heavy metals due to their toxicity, causing various risks to the organism, such as dermal and respiratory disorders and, above all, carcinogenic effects. Arsenic and cadmium cause carcinogenic effects in the body, affecting the skin, prostate, and bladder, among others [2]. The proximity of humans to sources of pollution in urban areas increases the risk of developing various diseases, increasing mortality and morbidity rates [3]. In recent years, oncologists are confronted with a growing phenomenon that they cannot fully explain: more and more people are developing lung cancer without ever having smoked [4].
Contact with heavy metals contained in urban dust can occur in three different ways, by direct oral ingestion of substrate particles, by inhalation of suspended particles through the mouth and nose, and by dermal absorption from exposed body parts [5]. In addition, the smaller the particles become, the more dangerous they are to the body, as they can reach the pulmonary alveoli. The most polluting is 𝑃𝑀10 (particles with a diameter ≤ 10 μm) and 𝑃𝑀2.5 (particles with a diameter ≤ 2.5 μm). On the one hand, 𝑃𝑀10, coarse particles, derive mainly from combustion processes, whereas 𝑃𝑀2,5 derive mostly from mechanical processes. These particles are released into the environment and accumulate on different surfaces and become part of urban dust. In each city, the concentration and size of these particles can vary, depending on the climate, location, or sources of origin of these particles. According to the study by Linares and Diaz [6], it was found that particles with a diameter of less than 2.5µm were closely related to hospital admissions of children under 10 years of age, as the concentrations of these particles exceeded the limit value set by the World Health Organisation (WHO). Children are more vulnerable to these particles because their lungs are not yet fully developed, so if they suffer from respiratory diseases, these may be worsened by exposure to the particular material. The WHO continually disseminates global air quality guidelines, with the aim that each state should seek to reduce pollutant emissions and reduce the adverse effects of these emissions on human health. In addition, toxic chemicals in the environment can cause neurodevelopmental disabilities, and the developing brain can be particularly sensitive to environmental pollutants [7]. As urban dust results from a mixture of different pollutants, it is not sufficient to pay attention only to air quality guidelines, but also to soil quality criteria and standards, as soil quality is also affected by this dust. These standards are designed to regulate soil quality, in accordance with RD 9/2005 of 14 January 2005, which establishes the list of potentially soil-polluting activities and the criteria and standards for the declaration of contaminated soils [8] in order to protect public health. Urban soil is a major component of urban ecosystems, contributing directly or indirectly to health and well-being by supporting housing, schools, transport infrastructure and leisure activities, filtering substances and moderating the urban climate [9].
Due to their physiological and behavioural characteristics, children are more exposed to some environmental pollutants than adults. Since children are the most vulnerable group to health problems derived from urban pollution, it is important to carry out a study in school playgrounds, places where children spend a large part of the school day, especially the youngest ones. It is in playgrounds where they can come into direct contact with urban dust by any of the routes described above (ingestion, inhalation, or dermal contact), especially in cities where the climate allows children to play outdoors all year round.
The colour of urban dust is a characteristic that some authors have used to make a quick diagnosis of its hazardousness or contamination [10,11], relating darker colours to dusts more contaminated by heavy metals, which could be a quick and economical "proxy" method of diagnosis, although there are studies where these results have not been so evident [12].
Magnetism is another property that has been used by some authors to relate to the degree of contamination of soils [13,14]. The application of magnetic methods can be useful to study areas affected by contaminants, as it is relatively faster than chemical analysis methods. The method is based on the knowledge of the concentration of magnetic particles and magnetisation-bearing minerals, determining the concentration of anthropogenic ferrimagnetic minerals in soil or urban dust samples. Metals with magnetic properties are Fe, Co, and Ni. Ferrimagnetic minerals are carriers of heavy metal ions, so if urban dust contains ferrimagnetic minerals, it is likely to contain heavy metals as well [15,16].
All this does not exempt the need to carry out a chemical analysis where the concentration of each heavy metal is known in order to evaluate the level of contamination of the samples and then apply geoenvironmental indices that allow us to evaluate the level of contamination and health indices [11,12,17], in order to know the risk suffered by the population and to be able to adopt the appropriate measures.
The hypotheses that we intend to demonstrate in this work is to show whether there is a relationship between the dark colour of urban dust and the higher degree of magnetism with the contamination of dust collected in schools and, furthermore, are schools with a higher concentration of magnetic materials those with a higher concentration of heavy metals? Are school playgrounds safe for children from an environmental and health point of view?
The objectives that were set to respond to our hypotheses were as follows:
-
-To determine the colour and degree of magnetism of urban dust sampled in school playgrounds in the city of Murcia. To relate the colour to the degree of magnetism.
-
-To evaluate the concentration of heavy metals in the dust and to characterise the magnetic fraction of urban dust.
-
-To relate colour and degree of magnetism to the toxic pollutant load in urban dust.
-
-To apply different geo-environmental and health indixes to diagnose the degree of environmental hazard in schools and its possible direct impact on children's health.

2. Materials and Methods

2.1. Experimental design

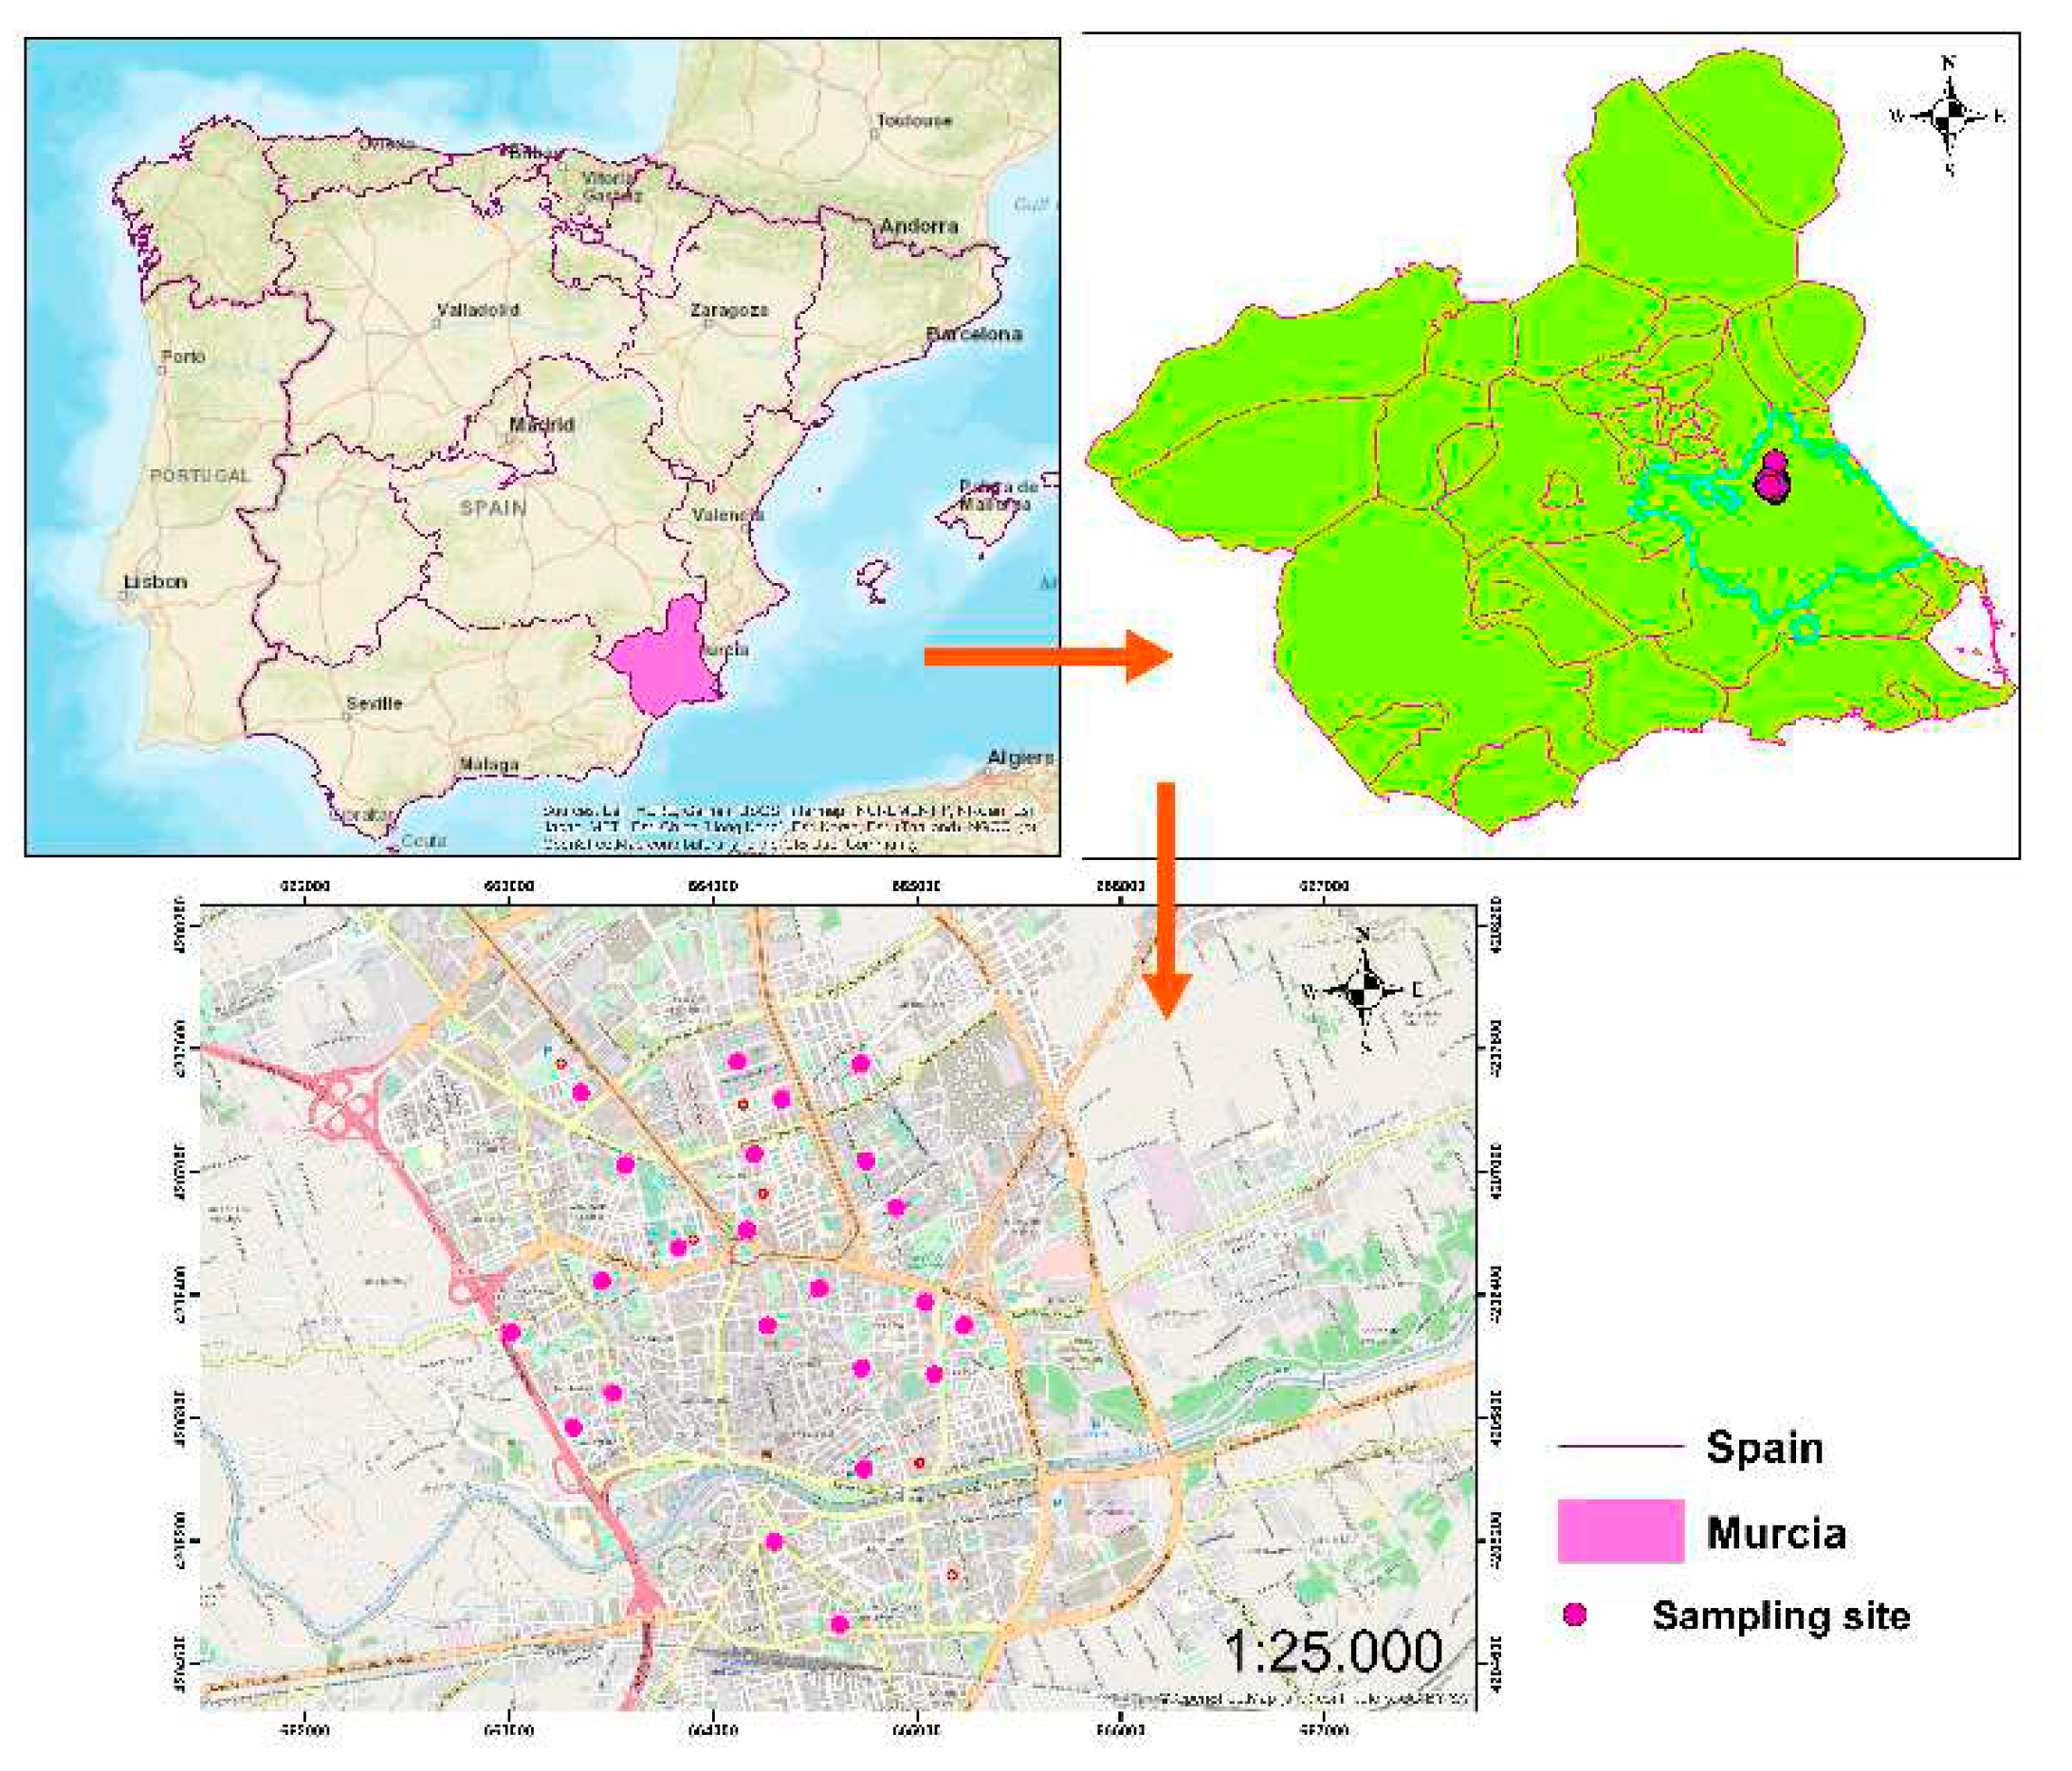
Sampling was carried out in 27 schools in the centre of the city of Murcia (Figure 1). Sampling took place between November-February 2023, coinciding with a period of low rainfall. The city of Murcia has a semiarid Mediterranean climate with a mean annual temperature of 18◦C and a mean annual precipitation of approximately 300 mm. Rainfall is scarce but occasionally violent, mainly concentrated in spring and autumn.
The dust was preferably collected on the sports fields of the schools and in the children's play area of each school. The surface area selected for sampling was approximately 1m2, using a brush for sweeping and airtight plastic containers for storing the sample. The samples were sieved with a 1 mm sieve to remove any plant debris or other artefacts they might contain. Sampling was carried out in triplicate in each of the schools and the samples were stored in a dry place at 4ºC until analysis.

2.2. Sample analysis

The colour of the samples was determined with Munsell keys [18]. To determine the magnetism of the urban dust, a 3 cm diameter neodymium magnet, capable of attracting magnetic particles, was used. Depending on the weight of particles attracted by the magnet, three categories of magnetism were determined: high (>30%), medium (15-30%) and low (<15%).
The samples, prior to acid digestion, were ground with an agate mortar and passed through a 50 µm sieve. The acid digestion was carried out with aqua regia (HNO3/HCl, 1:3) in a microwave oven at 220 °C for 1 h. The analysis of the samples was performed by inductively coupled plasma mass spectrometry (ICP-MS) Thermo ICAP 6500DUO to determine the total concentration of Cd, Cu, Cr, Ni, Pb and Zn. All chemicals used were of the highest purity available and the water used was water obtained using a Milli-Q system (Milli-pore, Bedford, MA, USA). Standard solutions (1000 µg ml-1) for all the elements measured were purchased from Panreac (Barcelona, Spain) and diluted as necessary to obtain working standards. All elements were determined simultaneously with a multi-elemental pattern.
A certified standard reference material was analyzed for its element content (SRMSan Joaquin Soil), and duplicate samples were analyzed simultaneously to provide quality control. The standard deviation (2-3%) was calculated and can be considered satisfactory for environmental analysis. Recoveries of 94-102% for Zn, 96-101% for Pb, 92-98% for Cu, 95-99% for Cr, 98-102% for Ni and 95-101% for Cd were obtained.
The magnetic and non-magnetic fractions separated with the magnet were analyzed with the same ICP-MS methodology described above and the same heavy metals were determined.We observed the morphology by scanning electron microscopy (SEM) with an energy dispersive system (EDS).

2.3. Environmental Pollution Index and the Potential Risk

2.3.1. Contamination Factor (CF)

The Contamination Factor (Equation (1)) describes the pollution level of street dustwith a given heavy metal, and it was calculated as the ratio between the concentration of each heavy metal measured (Cn) and its background value (Cbn) [2,3].
C F = C n C b n
Based on the results obtained for CF, the level of heavy metal contamination was established according to CF < 1 low; 1 ≤ CF ≤ 3, moderate; 3 ≤ CF < 6, considerable; and CF ≥ 6, very high.

2.3.2. Degree of contamination (Cdeg)

The contamination factor reveals contamination of a single element [4]. The sum of the contamination factors of all elements yields the degree of contamination (Cdeg) of the investigated environment. The degree of contamination is divided into four groups[5]: Cdeg<8: Low deg of contamination; 8≤Cdeg<16: Moderate degree of contamination; 16≤Cdeg<32: Considerable deg of contamination; 32≥Cdeg: Very high degree of contamination.

2.3.3. Pollution Load Index (PLI)

The Pollution Load Index (Equation (2)) is a tool used to assess the global level of sediment contamination, considering the concentrations of several heavy metals. PLI was calculated based on the Contamination Factor of each metal[6].
P L I = C F M e 1 × C F M e 2 × . C F M e n 1 n
where PLI is the Pollution Load Index, CFMe1,2, . . . n represents the Contamination Factor of each metal, and n is the number of metals. The values of PLI < 1 indicate the absence of heavy metal contamination, whereas PLI > 1 shows the presence of heavy metal pollution.

2.3.4. Enrichment Factor (EF)

Enrichment Factor was initially proposed to describe metal pollution levels in the atmosphere [7,8]. Later, this method was applied in many areas, especially for evaluating metals in soil and dust. EFs for metals in dust were calculated as follows.
(Equation (3)) [8,9]:
E F = C x C r e f s a m p l e C x C r e f b a c k g r o u n d
where Cx represents the concentration of metal element x, and Cref is the concentration of the reference element—in our case, Ca, which is the major element in both dust and asphalt and no human activity influences. The background values used were those obtained after the analysis of the asphalt.
EF categories were defined as [9] deficient to minimal enrichment when EF < 2, moderate enrichment when EF = 2–5, substantial enrichment when EF = 5–20, very high enrichment when EF = 20–40, and extremely high enrichment when EF > 40.

2.3.5. Geoacumulation Index (Igeo)

To obtain another contamination index to produce a more robust contamination degree analysis, the geo-accumulation Index (Igeo) was also calculated (Equation (4)). Igeo considers small variations in the background value using a 1.5 factor (factor K). The geo-accumulation index was proposed by [7] to assess the pollution levels of each heavy metal in surface sediments to account for their background value:
I g e o = l o g 2 C n K × C b n
where Cn is the concentration of metal n and Cbn is the background concentration of the metal (n). The factor K is the background matrix correction factor due to lithospheric effects, which is usually defined as 1.5 [7].
Igeo can be interpreted as follows: Igeo < 0 (uncontaminated), 0–1 (uncontaminated to moderately contaminated), 1–2 (moderately contaminated), 2–3 (moderately to highly contaminated), 3–4 (highly contaminated), 4–5 (highly to very highly contaminated), >5 (very highly contaminated).

2.3.6. Potential Ecological Risk Index (RI)

The Potential Ecological Risk Index (RI) was developed by Häkanson [22] to evaluate the potential risk of heavy metal contamination in sediments. According to Häkanson [5] the toxic response factors for heavy metals analyzed, such us: Pb, Cu, Cr, Zn, and Ni are 5, 5, 2, 1, and 5. The final value of RI was obtained by calculating the following formulas:
RI = ∑ErMe
ErMe= TrMe x CFMe
where RI is the sum of potential risk of individual heavy metal, ErMe is the potential ecological risk of each metal Me, TrMe refers to the toxic-response factor for each metal Me; CF Me is the contamination factor for each heavy metal.
The levels of ecological risk according to the RI index values obtained are RI < 150, low ecological risk; 150 ≤ RI <300, moderate ecological risk; 300 ≤ RI <600, considerable ecological risk, and RI ≥ 600, the very high ecological risk for the sediment.

2.4. Human Health Index (HI) and Cancer Risk (CR)

Human health risk assessment is a computational model to assess the likelihood of effects of hazardous chemicals on humans [10]. The human health risk assessment model was established by the United States Environmental Protection Agency and the Netherlands National Institute of Public Health [11,12,13]. In this model, citizens, including adults and children, can be exposed to heavy metals through the following three routes: ingestion (Ding), inhalation (Dinh), and dermal contact (Dder) [14,15]. In the first step for calculating the non-carcinogenic risk, the dose received through Ding, Dinh, and Dder was calculated using Equations (6)–(8) [11,12]. To assess the health risk from carcinogenic toxic metals, the lifetime median daily dose (LADDinh) for the inhalation exposure route of Cr, Cd, Ni, and Pb was applied using Equation (9) [11,12]:
D i n g = C × i n g R × E F × E D B w × A T × 10 6
D i n h = C × i n h R × E F × E D P E F × B W × A T
D d e r = C × S L × S A × A B S × E F × E D B W × A T × 10 6
L A D D i n h = C × E F A T × P E F × i n h R c h i l d × E D c h i l d B w c h i l d + i n h R a d u l t × E D a d u l t B w a d u l t
Where the IngR intake rate is assumed to be 100 mg day-1 for adults, while it is 200 mg day-1 for children [11]; InhR as inhalation rate as inhalation rate is estimated to be 7.6 m3 day-1 for children and 20 m3 day-1 for adults [13], C is the content of toxic metals, mg kg-1; EF is the exposure factor, used in the present study of 350 days per year-1, ED is the exposure period, assumed in the present study of 6 years for children and 24 years for adults [11]; SL is the skin level, which in this study has been taken as 0.2 mg m-2day-1 for children and 0.07 mg cm-2 day-1 for adults[11]; SA is the exposed skin area, estimated at 2800 cm2 for children and 5700 cm2 for adults [11]; ABS is the skin absorption factor, considered as 0.001 for all the heavy metals studied; PEF is the particulate emission factor = 1.36 × 10⁹ m3 kg-1 [11]; AT is the average time contact , defined ED × 365 days for non-cancers and 70 × 365 = 25550 days for carcinogens [16] and BW is the mean body weight, defined as 15 kg for children and 70 for adults [28].
HI is the hazard index used to calculate the non-cancer risks of the metals studied for children and adults. The HI is the sum of the hazard quotients (HQ), which represents the magnitude of harmful impacts of the total exposure pathways (HI=HQing+HQinh+HQder) [17]. HQs for each exposure route were calculated by dividing the mean daily dose from each exposure route (Ding, Dinh, and Dder) by a corresponding reference dose (RfDing, RfDinh, and RfDder).
The RfD values (mg kg-1 day-1) illustrate the maximum permissible risk in the daily exposure of citizens throughout their lives [29]. The reference doses for the heavy metals studied are presented in Table 1. When the HI < 1, it shows that there are no adverse health effects; when the HI is greater than 1, it indicates that probable non-cancer health impacts may occur [24].
Cancer risk (CR) was defined as the probability of developing cancer due to exposure to carcinogenic contaminants during their lifetime. Carcinogenic risks associated with three routes of exposure were calculated using Equation 9:
C a n c e r   R i s k   C R = L A D D i n h × S F
For carcinogens, the dose is multiplied by the corresponding slope factor (SF) to produce an estimate of cancer risk. The SF of each carcinogenic element is shown in Table 1. Risk management decisions were most frequently made when the CR ranges were 10-6 to 10-4.

2.5. Stadistical Analysis

General statistical analyses were performed, as well as frequency tables between the categorical variables of colour and magnetism, using the statistical program Jamovi [33].

3. Results

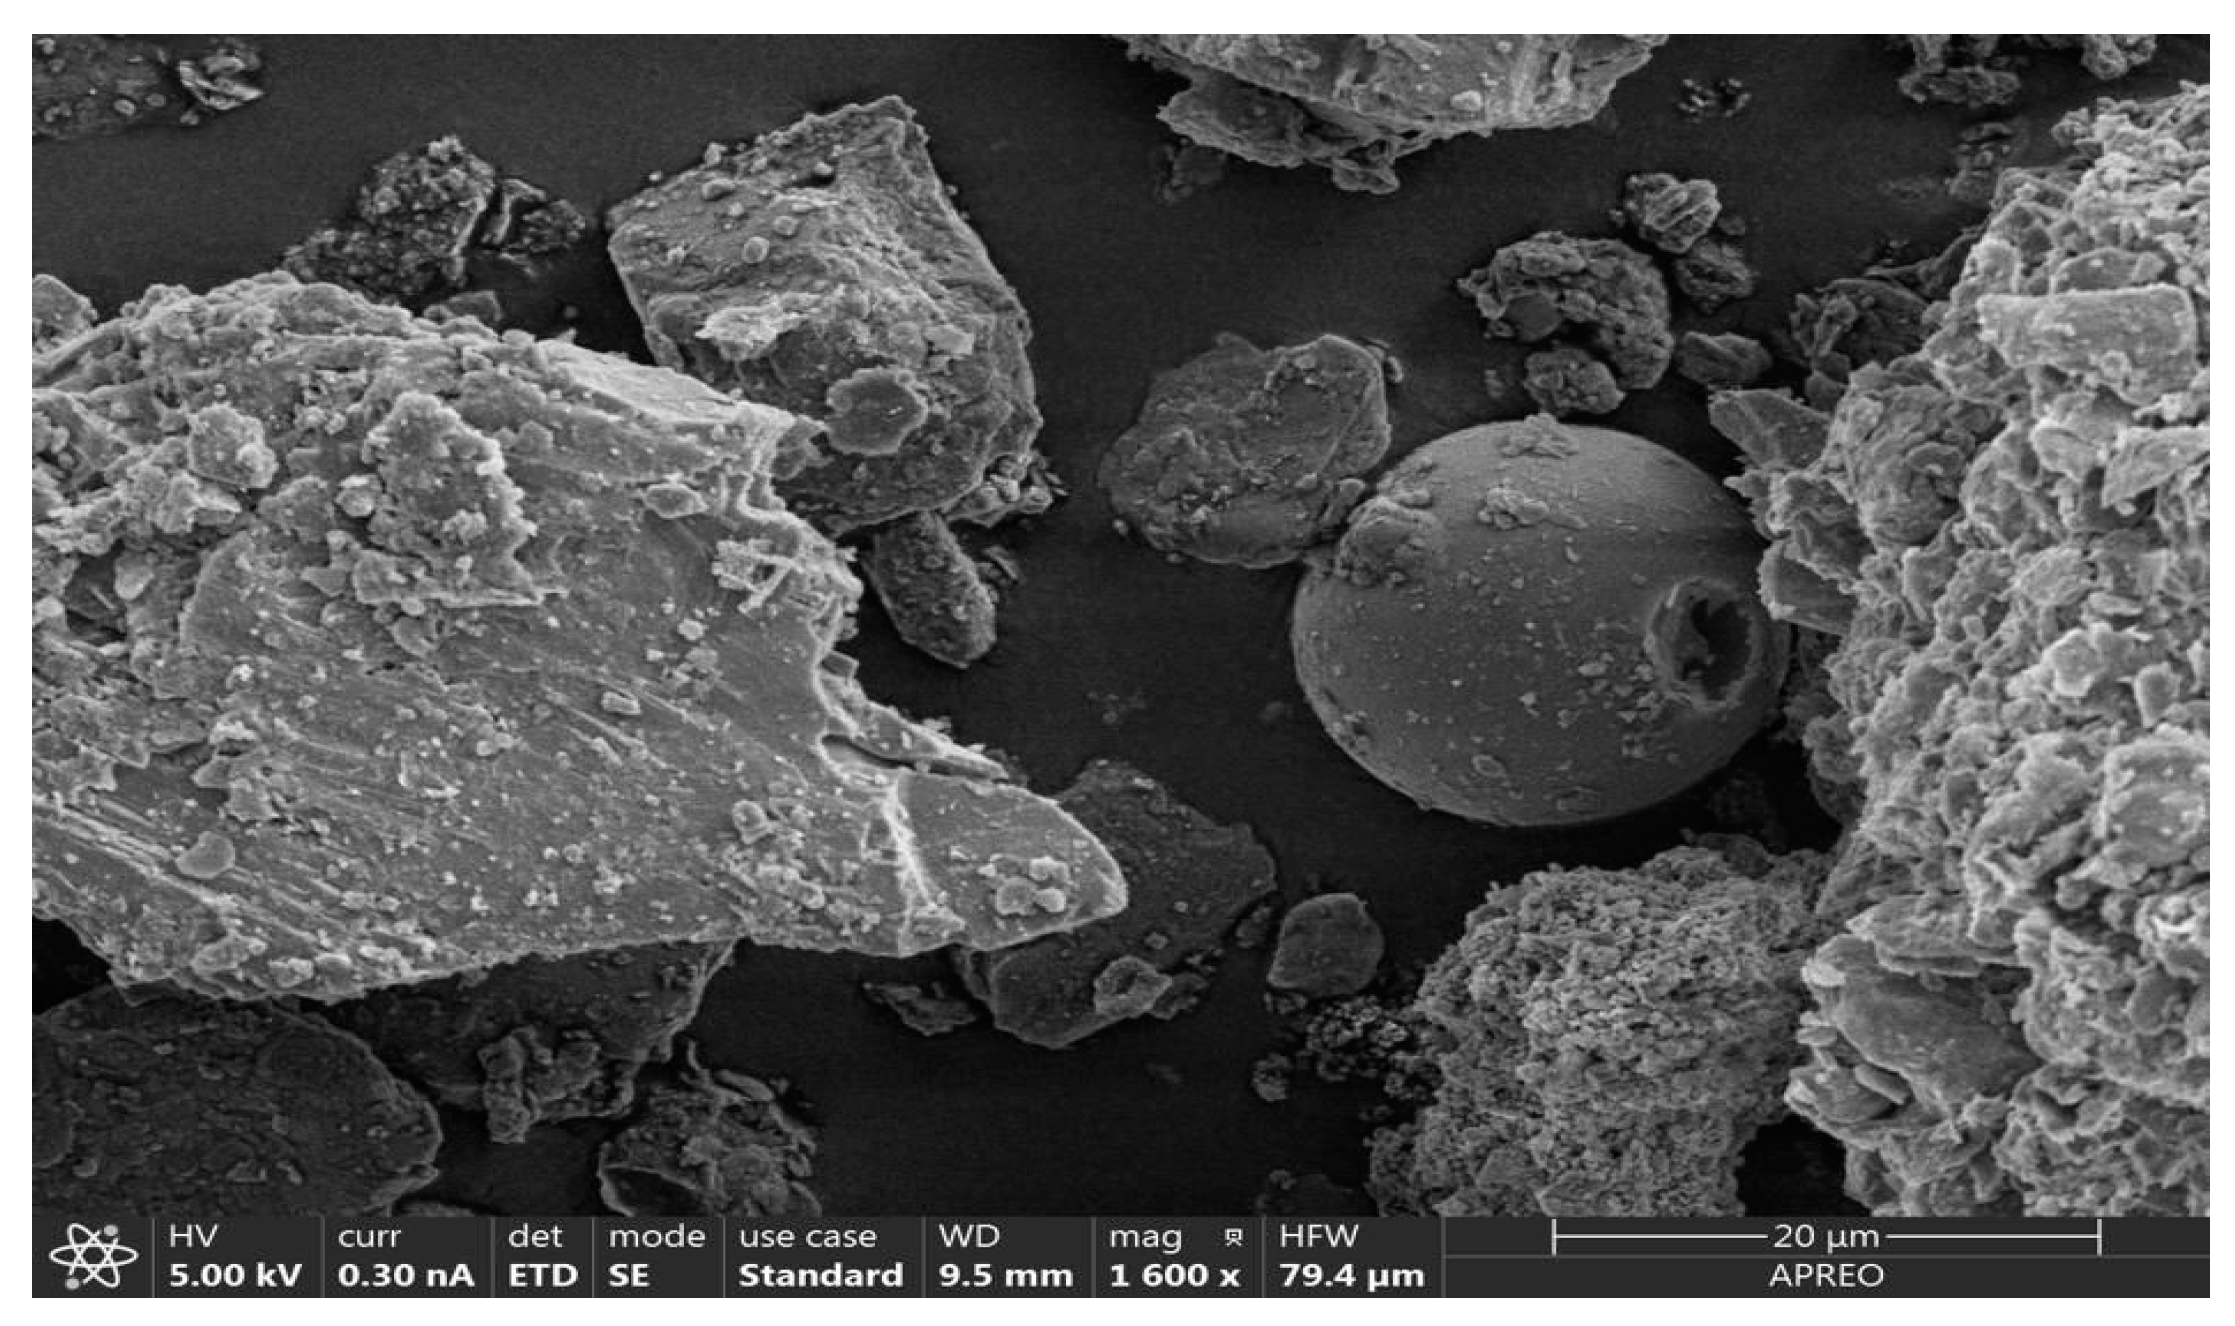
The matrix of the school dust was similar in all the samples, and was formed by a heterogeneous mixture, mainly carbonate, predominantly calcite (47-50%), dolomite (28-30%), quartz about 20% and gypsum and phyllosilicates in less than 5%. It is important to note in some cases the presence of traces of magnetite and other iron oxides as can be seen in the electron microscope image (Figure 2), appearing as spheres with a smooth surface. The smooth spherical particles are generated by combustion processes. They arise from the melting of impurities in the fuel material and take this shape due to surface tension [34].
The concentration of the six heavy metals analysed varies greatly depending on the element in question and the sample analysed as can be seen in Table 2 where their mean, maximum, minimum and standard deviation (SD) values are shown.
According to these values the order of abundance of heavy metals in the urbane dust is Zn> Cu> Cr> Pb> Ni> Cd.
As for the determination of the colour of the powder sampled, all the samples had the same HUE 2.5 Y, so the samples were grouped according to their VALUE in two categories, light, with a value between 5 and 6, and dark, those with a value between 2 and 4. According to the results obtained (Table 3), slightly more than half of the samples had a dark colour.
Table 3, shows the results obtained by comparing the colour of the samples with their degree of magnetism:
Regarding the relationship between the colour and the degree of magnetism of the samples and the toxic pollutant load (TPL), the results obtained are presented in Table 4:
The determination of magnetism resulted in most of the samples having a medium (15 and 30%) or low (<15%) content of magnetic particles, only five samples contained more than 30% of magnetic particles.
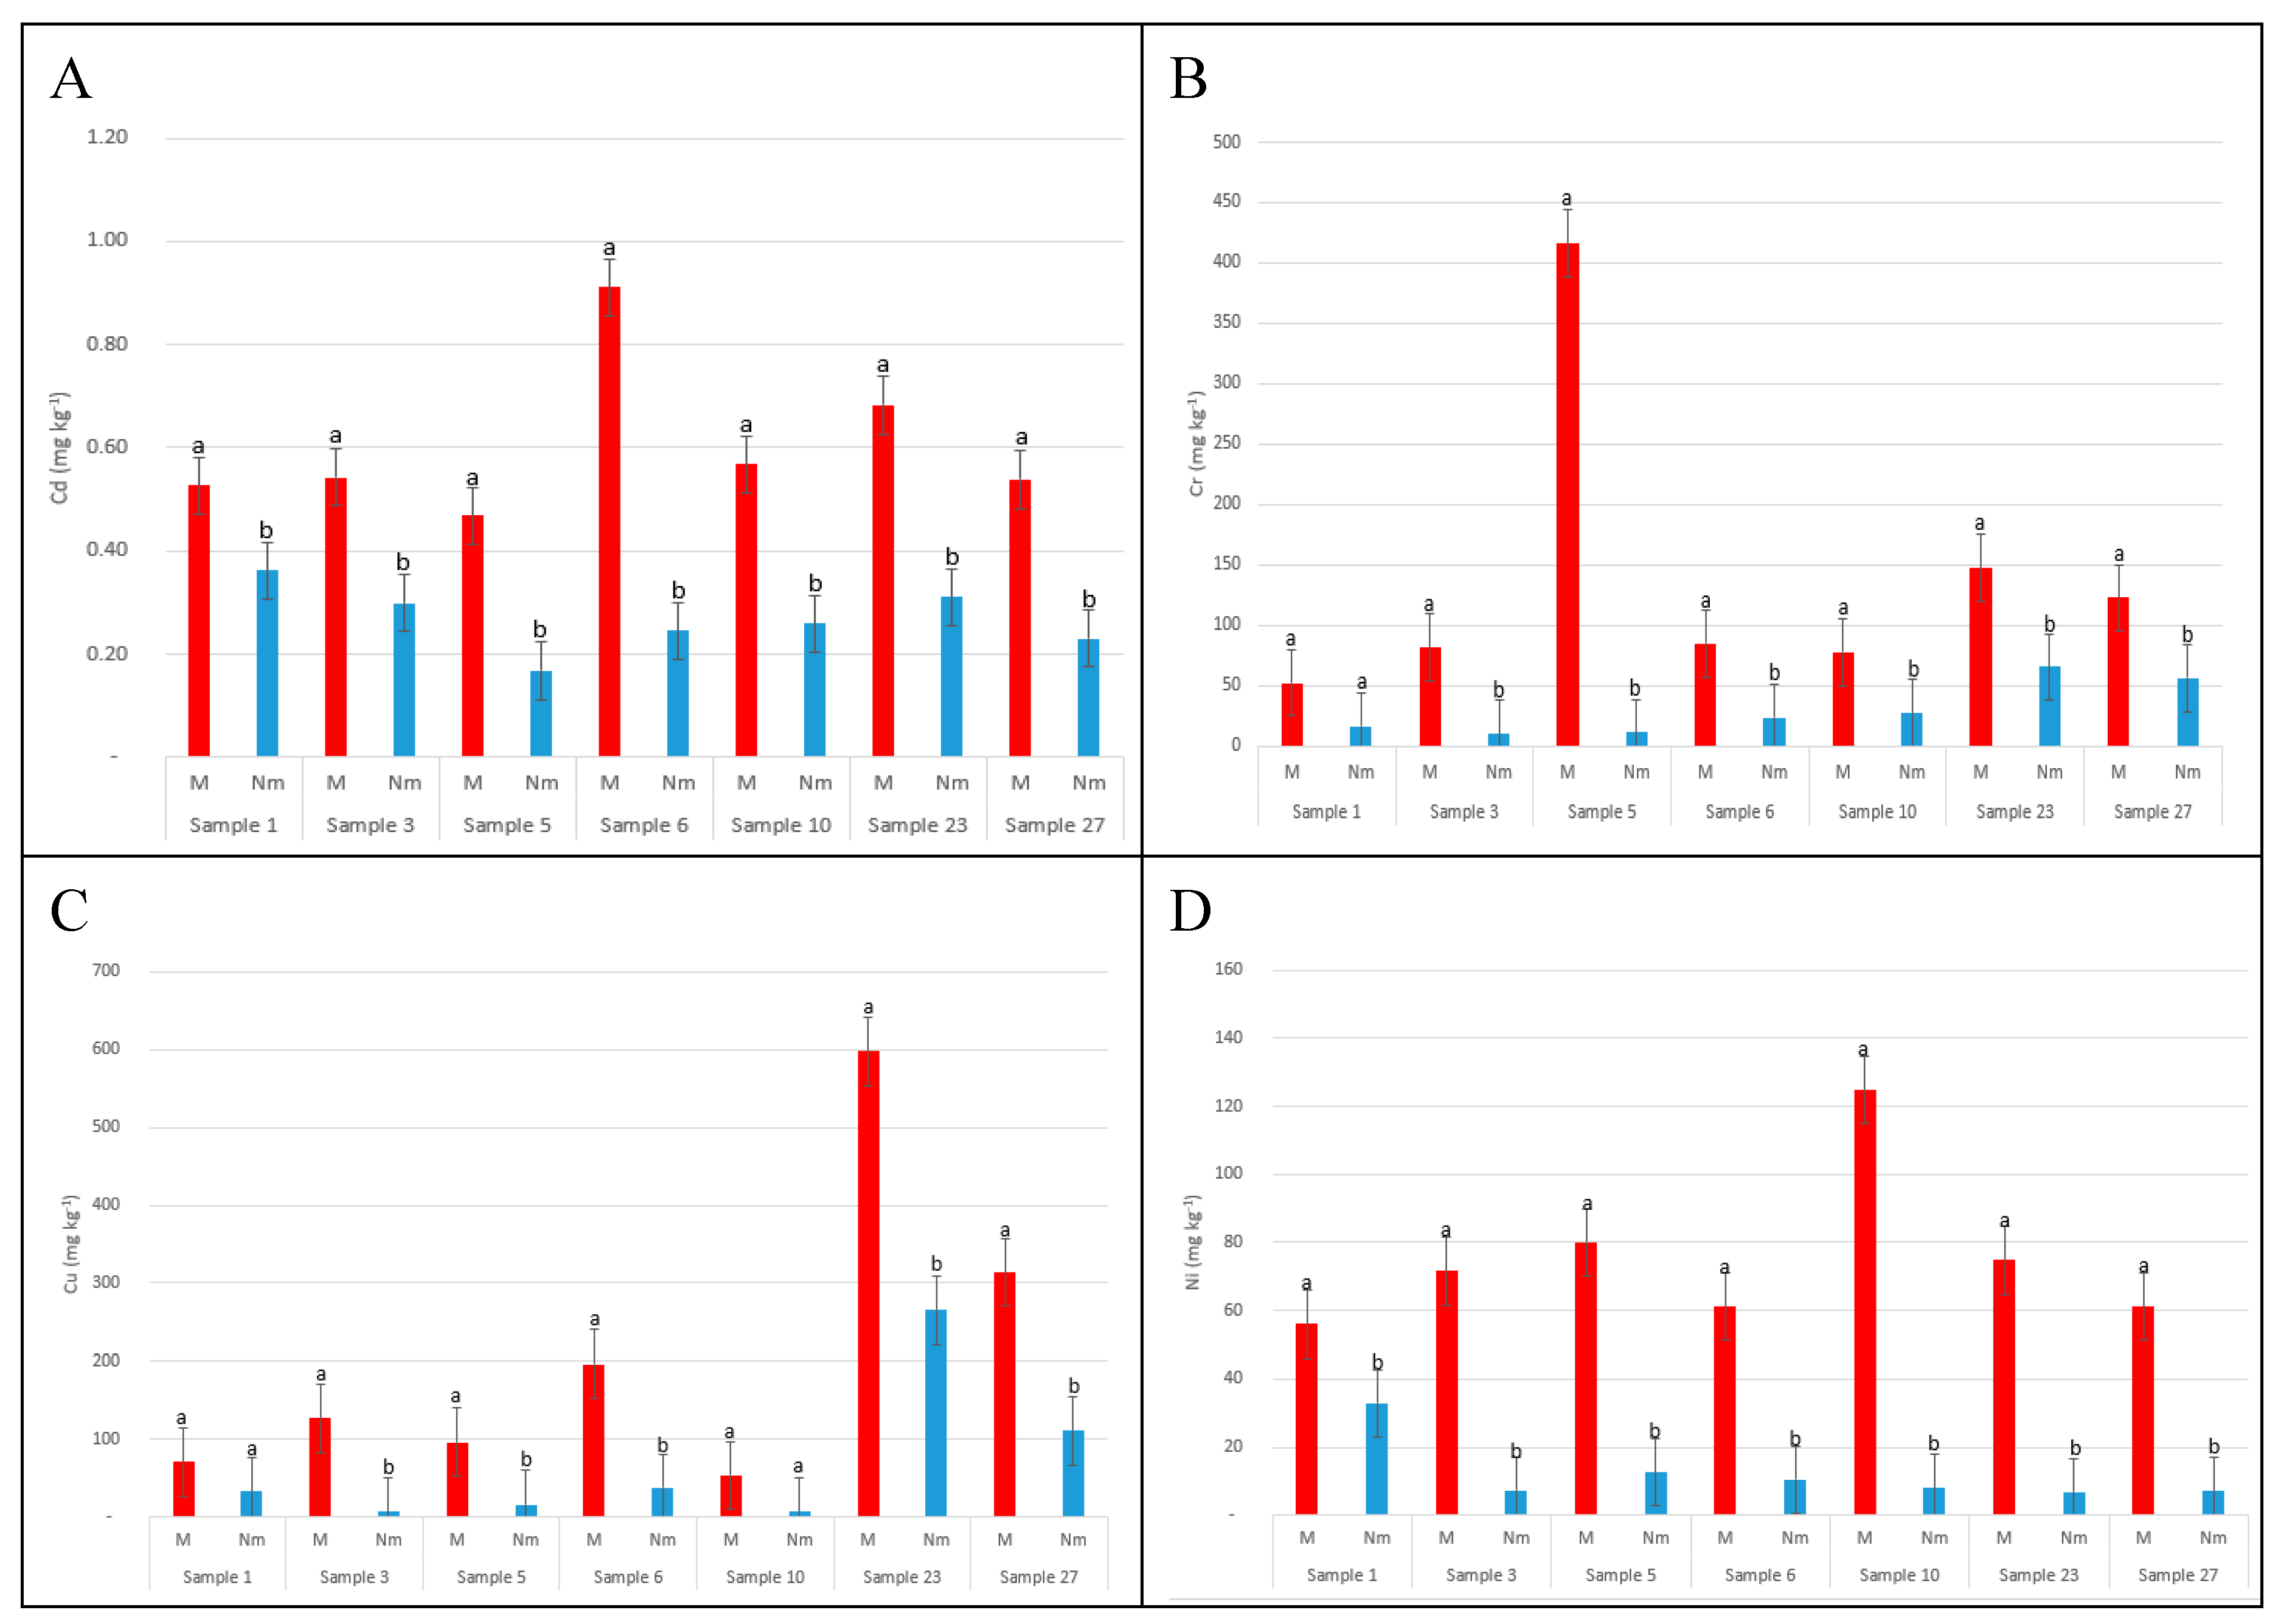
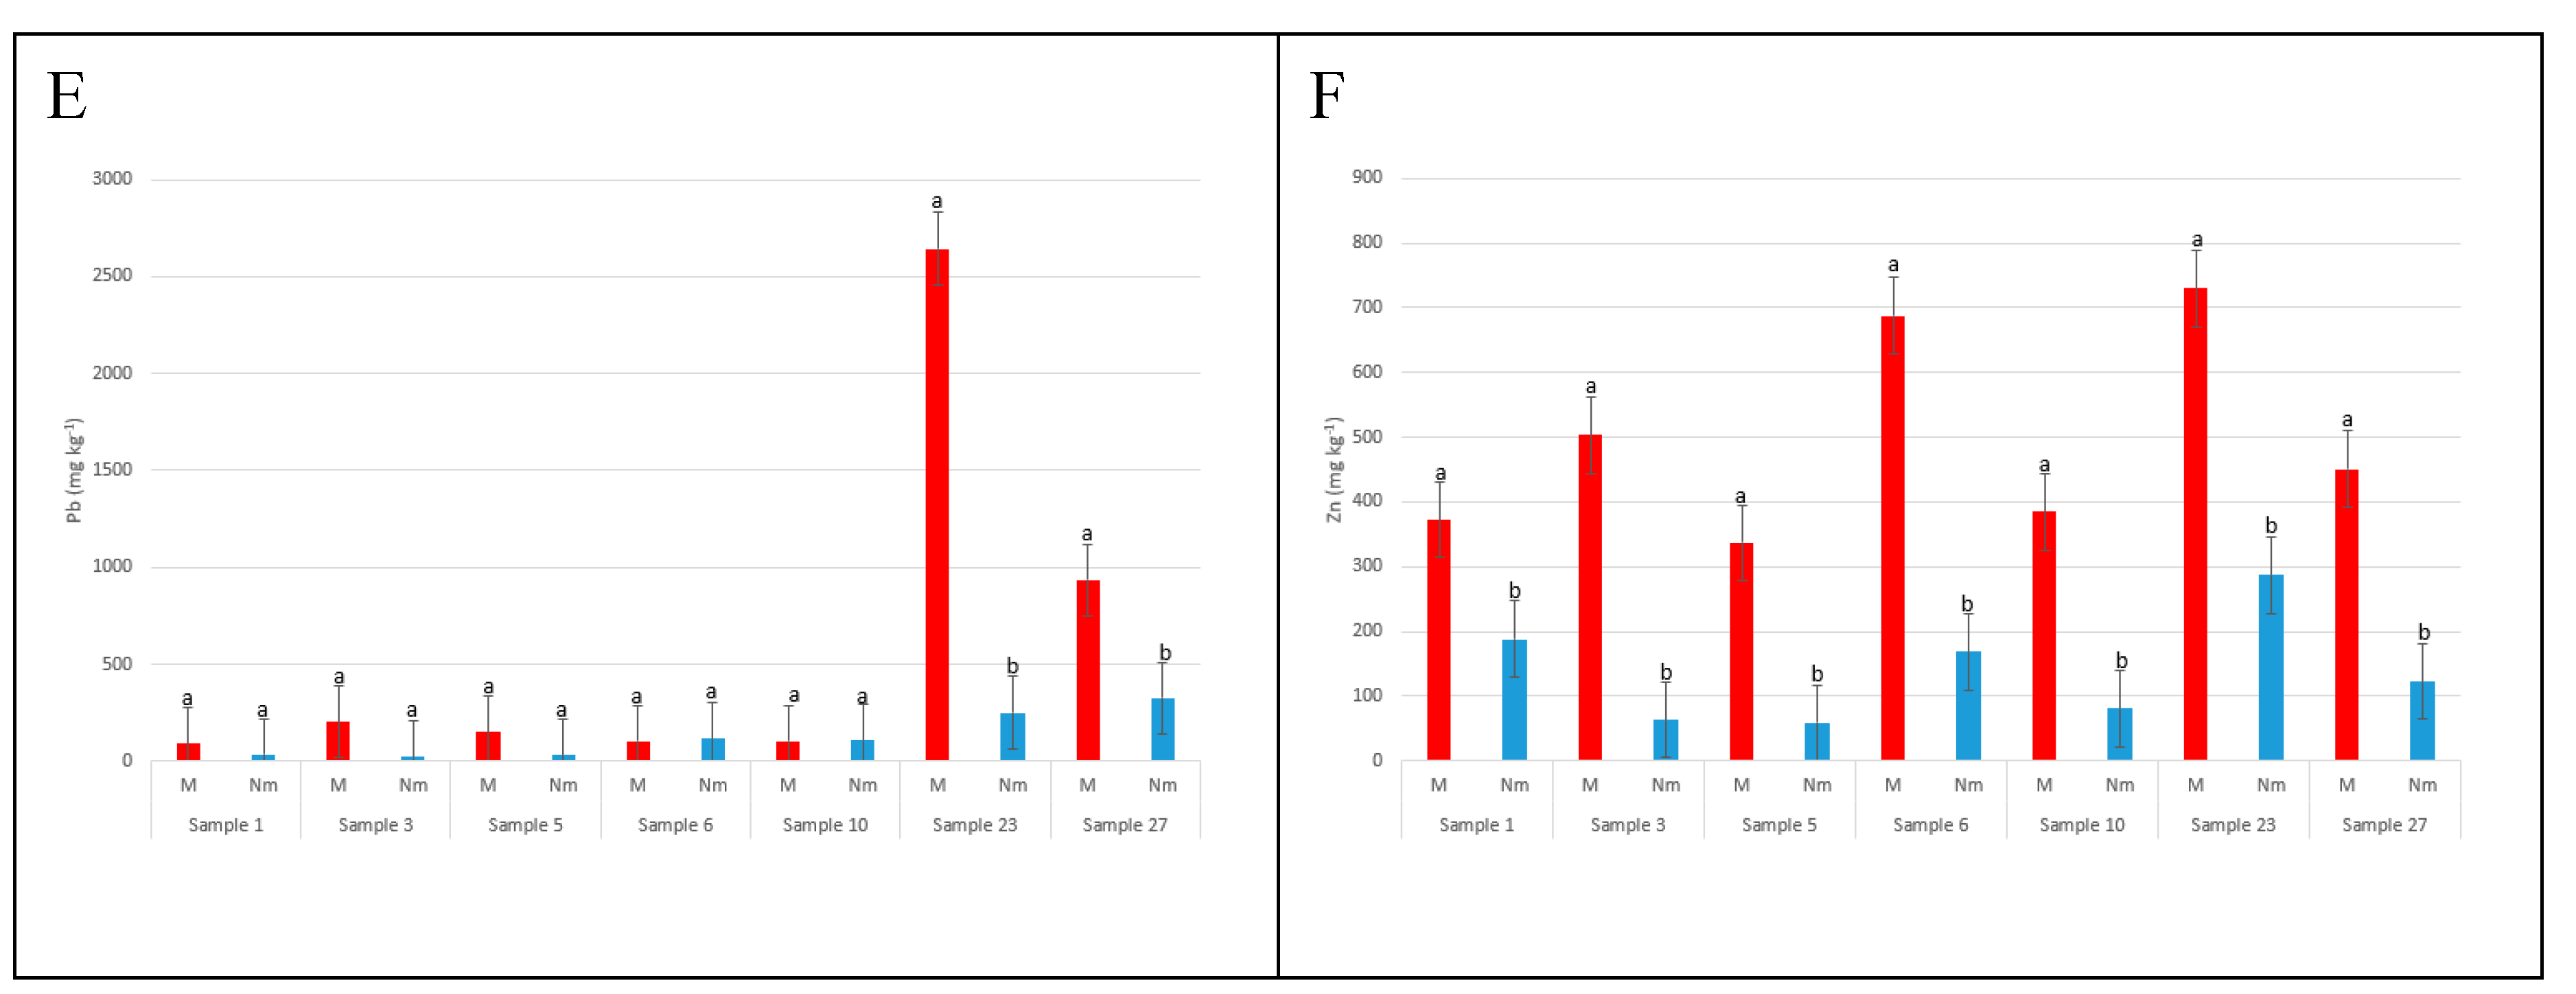
Figure 3 shows an evident concentration of heavy metals in the magnetic fraction (M) of the dust with respect to the non-magnetic (Nm), with significant differences in all of them, except for Pb, where the lack of homogeneity of the variance does not allow this statement to be established. On the other hand, and from the quantitative point of view, the differences in concentration between fractions are not equal for all metals, so that while in Cd an average concentration of 0.6 and 0.3 mg kg-1 has been observed in the magnetic and non-magnetic fractions, respectively, in Ni it is 76 and 12 mg kg-1, respectively, i.e., more than 6 times higher in M than in Nm. In view of these results, everything suggests that there is a positive correlation between magnetism and the heavy metals present in it, but the affinity between them for this property is very different. Thus, in sample 5 a concentration of Cr in the magnetic fraction almost forty times higher than the non-magnetic one is observed, while for the rest of the elements this difference is about six times higher. Something similar occurs with Pb in samples 23 and 27, where concentrations of 2645 and 936 mg kg-1 are reached in the magnetic fraction.

3.1. Environmental pollution indices

These indices are used to assess the environmental risk caused by exposure to heavy metals in dust in schools where children carry out their daily activities. They are a very useful tool to know the current situation in order to be able to act in case of risk. The values obtained are presented in Table 5:
As for the global indices of environmental pollution, one of these indices calculated was the degree of pollution (Cdeg), its value for this study is 38.8. Another general index calculated was the index of potential ecological risk (IR), its value was 165.42. As for the pollutant load index (PLI), its value was 3.79.

3.2. Human Health indices (HI) and cancer risk (CR)

The values obtained after the application of the different health indices for both adults and children are presented in Table 6.
Regarding cancer risk (CR) Cr, Cu, Ni and Pb were assessed using lifetime inhalation exposure. The results obtained are presented in Table 7.

4. Discussion

The composition of urban dust found in schools in Murcia is like that found by other authors in children's playgrounds [35,36]; perhaps what differs most is the concentration of these heavy metals. In our study the most abundant metals in the dust were Zn, Cu, Cr, and Pb, in that order, with Ni and Cd being in lower proportion. All values of these heavy metals are lower than those found by Marín-Sanleandro et al. [12] in the urban dusts sampled in the streets of Murcia, which could be due to a greater cleanliness inside the schools and the presence of vegetation or construction barriers that delimit the schools, which would prevent the passage of these pollutants from the traffic roads.
The major element is Zn as in dusts analysed in other schools or cities as indicated by a study in Malaysia [37] as well as the systematic review of schools by Moghtaderi et al [38]. Although these studies have been carried out by taking samples from inside the classroom, we can assume that what is found inside the classroom reflects what is found outside [39].
Cu is an essential trace element for humans, acting as a necessary cofactor for many enzymes and proteins. However, its excess can be toxic due to its high oxidative capacity. Its presence in school playgrounds can be due to many different causes, as it can be present in plastic and rubber materials, paints and varnishes, printing inks, synthetic fibres, metallic coatings, etc., all of which are common in schools [40].
The fact that the amount of Cr exceeds that of Pb in school playgrounds may be due to paint residues from sports fields and other elements present in school playgrounds. The presence of Cr has been associated with the use of paint or steel welding [41].
All the sampled schools, being located in the urban center of the city, are near roads and some are close to highways, so we cannot rule out that the origin of the heavy metals found in the dust of school playgrounds may be related to road traffic. Similar results have been reported in other studies [36,42,43,44].
Relating the colour of the samples to the content of magnetic particles (Table 3), all samples with a high content of magnetic particles were dark in colour. Samples with light colours generally had a low degree of magnetism, although we have also detected dark-coloured samples with a medium or even low degree of magnetism. However, this does not mean that magnetism and pollution are not related, since the results obtained when comparing colour and magnetism with the toxic pollutant load (Table 4), understanding TPL as the sum of the concentration of pollutant elements in urban dust such as Cd, Cr, Cu, Ni, Pb, and Zn, show that there is a statistically significant relationship between these parameters. The highest concentration of pollutants is found in dark coloured dusts with medium and high magnetism, which confirms our hypothesis.
These magnetic particles must have an anthropic origin and come from the combustion of fossil fuels used in industries and motor vehicles. The magnetism present in these particles could be due to the retention of metallic elements such as Fe or Ni [45] or even be composed of metals in the form of oxides [46]. The study of the composition of this fraction by ICP-MS revealed the concentration of heavy metals associated with this fraction, with very high values as in the case of Pb, which could be interpreted that most of the contamination present in the dust would be concentrated in this magnetic fraction. This could be useful in the case of having to take urgent decontamination measures.
Considering the affinity of heavy metals for the magnetic fraction of urban dust, it would be advisable to study techniques that make use of this property to decontaminate urban dust, especially in street cleaning machinery, where by installing appropriate devices, heavy metals could be concentrated in the magnetic fraction, which usually represents at most 20% of the total, and then managed as hazardous waste.
The results obtained in the environmental pollution indices show that the Contamination Factor (CF), which describes the level of dust pollution for a given element, Cd and Ni indicate that the level of pollution is moderate for these two elements, for Cr and Cu it is considerable and very high in the case of Pb and Zn, where the values are higher than 6.
As for EF, which indicates the contamination of urban dust for an element in relation to its background, in this case asphalt, and a common and abundant reference element in the study area, which in our case we have chosen Ca+2. Only Cd presents a minimal enrichment, Cu and Ni a moderate enrichment, and Cr, Zn and Pb a substantial enrichment, with the highest values for Zn and Pb (18.11 and 19.09 respectively). Comparing these values obtained with the values of urban dusts sampled in the streets of the urban area of Murcia [12] for Pb, this value in the streets was 45, while in schools its value is less than half. However, in the case of Zn, the value in the case of Murcia roads was 20, so the values are very similar to those obtained in this work.
The Igeo index, which shows the level of contamination in the yards, can be interpreted according to its values as no or very low contamination in Cd (0.67), Cu (0.92) and Ni (0.13). Moderate contamination is present in Cr (1.40), and Pb (2.25) and only Zn (2.53) presents values that could be interpreted as moderate to high contamination in this element.
There are some global indices of environmental pollution that express the contamination by heavy metals in general, without discriminating in any element. One of these indices was the degree of contamination (Cdeg). Its value for this study was 38.8, which implies, according to the scale presented by this index, a very high degree of environmental contamination in schools. Other authors who have used this environmental index have also found very high values in their research [21], and it seems to be an environmental index that is very sensitive to heavy metal pollution.
In relation to the potential ecological risk index (IR), which is the sum of the potential risks of each of the heavy elements considering their toxicity, the value obtained of 165.42 corresponds to a moderate ecological risk.
According to the pollutant load index (PLI), which is another global index that considers the FC of all heavy metals, with a value of 3.79, being greater than 1, this indicates the presence of contamination by heavy metals. As can be seen, depending on the sensitivity of the global index used, the risk or degree of environmental contamination is more or less high, but in all cases environmental contamination by heavy metals is present in this school environment.
To assess the health risk caused by exposure to heavy metals in dust in schools where children, teachers and other school staff carry out their daily teaching activities, health indices have been applied. They are a very useful tool to know the current situation to be able to act in case of risk. According to the results presented in Table 5, for non-carcinogenic effects, ingestion is the main route of exposure and entry of dust particles into the body, being the main health risk for adults and children for all metals. Second is dermal contact, and inhalation was the route with the lowest values. The HQinh value is between 100 and 10,000 times lower than HQing and HQderm, coinciding these results with those found in other works [17,30,31,40,48,49] where health risk was assessed in other locations.
As ingestion and dermal contact are the main routes of entry of heavy metals into schools, the cleanliness of playgrounds and places where children play and come into direct contact with objects on the ground should be maximised.
The HI values for dust in children range from 0.0054 for Cd to 0.29 for Cr and 0.00076 for Cd to 0.036 for Cr in adults. The HI values decrease in the following order: Cr > Cu > Zn > Pb > Ni > Cd in children while in adults the order sequence is Cr > Pb > Cu > Zn > Ni > Cd. All HI values, for all elements, for both adults and children are less than 1 indicating that there is no risk of developing adverse health effects.
Regarding cancer risk (CR) Cr, Cu, Ni and Pb were assessed using lifetime inhalation exposure. CR in urban dust can be seen in Table 6. The cancer risk values decrease in this order: Cr > Ni > Cd > Pb.
The competent authorities should take decisions and measures in case the cancer risk index is between 10-6 and 10-4[17]. Our studied values are well below this range, so the current situation is not considered a risk and should not cause alarm, although it should be borne in mind that Cr has been found to be the most toxic element with the highest risk to health, so preventive measures should be taken. The Cr found in school playgrounds may come from the paints and enamels used on the different surfaces and elements of the playground, as anti-corrosive products and galvanised products are used in the manufacture [49,50], although other sources such as road traffic cannot be ruled out, as the wear and tear of vehicle brakes, wheels and engines can be sources of Cr, Cu, Zn and Pb pollutants, as well as gases and particles produced during combustion [11,47], and all the schools in this study were located in the urban area of the city.
To prevent the entry of these particulate pollutants, the presence of vegetation barriers may be highly recommended in schools as it would reduce their entry and thus the exposure of children to air pollution [44,51]. In addition, the presence of vegetation in schools is associated with several benefits ranging from improved academic performance to the promotion of children's mental and physical health. Many studies have demonstrated the negative influence of environmental pollution in schools on children's cognitive development [52,53,54], and therefore the cleanliness of playgrounds should be maximised, and the entry of polluting particles should be prevented as far as possible.

5. Conclusions

Zn is the most abundant heavy metal in the dust sampled in the schools, followed by Cu and Cr.
In view of the values of the environmental indices obtained, Pb and Zn are the heavy metals that present the greatest environmental pollution problems. Likewise, the general environmental pollution indices show that the existing ecological risk is moderate, however, the index that measures the degree of pollution by heavy metals (Cdeg) is very high.
Regarding health indices, ingestion is the most important route of exposure to heavy metals in both children and adults. The health index values for children are higher than for adults confirming that heavy metals in school dust represent a potential health risk for children. Cr was found to be the most toxic element with the highest risk to children's health. This element is related to the presence of painted objects and steel welds.
In terms of assessed cancer risk, there is no risk for children or adults in schools.
The highest concentration of contaminating elements is found in the dusts with dark colour and medium and high magnetism. Analysis of the magnetic and non-magnetic fraction indicates that there is a concentration of all heavy metals in the magnetic fraction.
Schools should be safe places for children, the competent authorities should be aware that in schools in Murcia, although there is no risk of cancer for children or adults, there is an ecological risk due to the presence of heavy metals in school playgrounds, so it is recommended to pay attention to all building materials used in these places, continue with the frequent cleaning and washing of playgrounds to prevent the accumulation of dust in them and increase the number of green barriers or construction barriers in schools to prevent as far as possible the entry of these pollutants.
Author Contributions

Conceptualization, MJDI, PMS and ASN; methodology, MJDI, PMS, MCCP and EDP; validation, MJDI, PMS and ASN; formal analysis, MJDI, PMS, MCCP, EDP and ASN; investigation, MJDI, PMS and ASN ; resources, MJDI; data curation, ASN; writing—original draft preparation, MJDI.; writing—review and editing, MJDI and PMS; visualization, ASN and EDP; supervision, MJDI, PMS, EDP and ASN ; All authors have read and agreed to the published version of the manuscript.”

Funding

Please add: This research received no external funding

Data Availability Statement

Data are contained within the article.

Acknowledgments

We would like to thank all the school principals who have allowed us to take samples at their schools.

Conflicts of Interest

The authors declare no conflict of interest.

References

  1. Fergusson, J.E.; Ryan, D.E. The Elemental Composition of Street Dust from Large and Small Urban Areas Related to City Type, Source and Particle Size. Sci. Total Environ. 1984, 34, 101–116. [Google Scholar] [CrossRef]
  2. Wang, Z.; Chai, L.; Wang, Y.; Yang, Z.; Wang, H.; Wu, X. Potential Health Risk of Arsenic and Cadmium in Groundwater near Xiangjiang River, China: A Case Study for Risk Assessment and Management of Toxic Substances. Environ. Monit. Assess. 2011, 175, 167–173. [Google Scholar] [CrossRef] [PubMed]
  3. Jahandari, A. Pollution Status and Human Health Risk Assessments of Selected Heavy Metals in Urban Dust of 16 Cities in Iran. Environ. Sci. Pollut. Res. 2020, 27, 23094–23107. [Google Scholar] [CrossRef]
  4. Frankell, A.M.; Dietzen, M.; Al Bakir, M.; Lim, E.L.; Karasaki, T.; Ward, S.; Veeriah, S.; Colliver, E.; Huebner, A.; Bunkum, A.; et al. The Evolution of Lung Cancer and Impact of Subclonal Selection in TRACERx. Nature 2023, 616, 525–533. [Google Scholar] [CrossRef] [PubMed]
  5. De Miguel, E.; Iribarren, I.; Chacon, E.; Ordonez, A.; Charlesworth, S. Risk-Based Evaluation of the Exposure of Children to Trace Elements in Playgrounds in Madrid (Spain). Chemosphere 2007, 66, 505–513. [Google Scholar] [CrossRef] [PubMed]
  6. Linares, C.; Diaz Sr, J. Impact of Particulate Matter of Diameter Less Than 2.5 Microns (PM2. 5) Over Daily Hospital Admissions on Children in Madrid, Spain (2003–2005). Epidemiology 2008, 19, S83. [Google Scholar]
  7. EPA, U. Supplemental Guidance for Developing Soil Screening Levels for Superfund Sites. U. S. Env. Prot Agency 2002, 12, 1–187. [Google Scholar]
  8. BOE-A-2005-895. Real Decreto 9/2005, de 14 de enero, por el que se establece la relación de actividades potencialmente contaminantes del suelo y los criterios y estándares para la declaración de suelos contaminados. https://www.boe.es/eli/es/rd/2005/01/14/9 (accessed on 5 October 2023).
  9. Rodríguez-Seijo, A.; Andrade, M.L.; Vega, F.A. Origin and Spatial Distribution of Metals in Urban Soils. J. Soils Sediments 2017, 17, 1514–1526. [Google Scholar] [CrossRef]
  10. Cortés, J.L.; Bautista, F.; Quintana, P.; Aguilar, D.; Goguichaishvili, A. The Color of Urban Dust as an Indicator of Contamination by Potentially Toxic Elements: The Case of Ensenada, Baja California, Mexico. Rev. Chapingo Ser. Cienc. For. Ambient 2015, 21, 255–266. [Google Scholar] [CrossRef]
  11. Aguilera, A.; Bautista, F.; Gutiérrez-Ruiz, M.; Ceniceros-Gómez, A.E.; Cejudo, R.; Goguitchaichvili, A. Heavy Metal Pollution of Street Dust in the Largest City of Mexico, Sources and Health Risk Assessment. Environ. Monit. Assess. 2021, 193, 193. [Google Scholar] [CrossRef]
  12. Marín Sanleandro, P.; Sánchez Navarro, A.; Díaz-Pereira, E.; Bautista Zuñiga, F.; Romero Muñoz, M.; Delgado Iniesta, M. Assessment of Heavy Metals and Color as Indicators of Contamination in Street Dust of a City in SE Spain: Influence of Traffic Intensity and Sampling Location. Sustainability 2018, 10, 4105. [Google Scholar] [CrossRef]
  13. Fabian, K.; Reimann, C.; McEnroe, S.A.; Willemoes-Wissing, B. Magnetic Properties of Terrestrial Moss (Hylocomium Splendens) along a North–South Profile Crossing the City of Oslo, Norway. Sci. Total Environ. 2011, 409, 2252–2260. [Google Scholar] [CrossRef]
  14. Chaparro, M.A.E. Estudio de Parámetros Magnéticos de Distintos Ambientes Relativamente Contaminados En Argentina y Antartida: México, Universidad Nacional Autónoma de México. Monogr. Inst. Geofísica 2006, 7, 110. [Google Scholar]
  15. Jordanova, D.; Goddu, S.R.; Kotsev, T.; Jordanova, N. Industrial Contamination of Alluvial Soils near Fe–Pb Mining Site Revealed by Magnetic and Geochemical Studies. Geoderma 2013, 192, 237–248. [Google Scholar] [CrossRef]
  16. Rai, P.K. Environmental Magnetic Studies of Particulates with Special Reference to Biomagnetic Monitoring Using Roadside Plant Leaves. Atmos. Environ. 2013, 72, 113–129. [Google Scholar] [CrossRef]
  17. Delgado-Iniesta, M.J.; Marín-Sanleandro, P.; Díaz-Pereira, E.; Bautista, F.; Romero-Muñoz, M.; Sánchez-Navarro, A. Estimation of Ecological and Human Health Risks Posed by Heavy Metals in Street Dust of Madrid City (Spain). Int. J. Environ. Res. Public. Health 2022, 19, 5263. [Google Scholar] [CrossRef] [PubMed]
  18. Albert Munsell Munsell Soil Book 1990;
  19. Ouchir, N.; Aissa, L.B.; Boughdiri, M.; Aydi, A. Assessment of Heavy Metal Contamination Status in Sediments and Identification of Pollution Source in Ichkeul Lake and Rivers Ecosystem, Northern Tunisia. Arab. J. Geosci. 2016, 9, 539. [Google Scholar] [CrossRef]
  20. Chandrasekaran, A.; Mukesh, M.V.; Chidambaram, S.; Singarasubramanian, S.R.; Rajendran, S.; Muthukumarasamy, R.; Tamilselvi, M. Assessment of Heavy Metal Distribution Pattern in the Sediments of Tamirabarani River and Estuary, East Coast of Tamil Nadu, India. Environ. Earth Sci. 2015, 73, 2441–2452. [Google Scholar] [CrossRef]
  21. Yaylalı-Abanuz, G. Heavy Metal Contamination of Surface Soil around Gebze Industrial Area, Turkey. Microchem. J. 2011, 99, 82–92. [Google Scholar] [CrossRef]
  22. Häkanson, L. An Ecological Risk Index for Aquatic Pollution Control.a Sedimentological Approach. Water Res. 1980, 14, 975–1001. [Google Scholar] [CrossRef]
  23. Tomlinson, D.L.; Wilson, J.G.; Harris, C.R.; Jeffrey, D.W. Problems in the Assessment of Heavy-Metal Levels in Estuaries and the Formation of a Pollution Index. Helgoländer Meeresunters. 1980, 33, 566–575. [Google Scholar] [CrossRef]
  24. Chester, R.; Stoner, J.H. Pb in Particulates from the Lower Atmosphere of the Eastern Atlantic. Nature 1973, 245, 27–28. [Google Scholar] [CrossRef]
  25. Zoller, W.H.; Gladney, E.S.; Duce, R.A. Atmospheric Concentrations and Sources of Trace Metals at the South Pole. Science 1974, 183, 198–200. [Google Scholar] [CrossRef] [PubMed]
  26. Sutherland, R.A. Bed Sediment-Associated Trace Metals in an Urban Stream, Oahu, Hawaii. Environ. Geol. 2000, 39, 611–627. [Google Scholar] [CrossRef]
  27. Liu, E.; Yan, T.; Birch, G.; Zhu, Y. Pollution and Health Risk of Potentially Toxic Metals in Urban Road Dust in Nanjing, a Mega-City of China. Sci. Total Environ. 2014, 476–477, 522–531. [Google Scholar] [CrossRef] [PubMed]
  28. Generic SSL, A. Soil Screening Guidance: Fact Sheet. 1996.
  29. Van den Berg, R. Human Exposure to Soil Contamination: A Qualitative and Quantitative Analysis towards Proposals for Human Toxicological Intervention Values (Partly Revised Edition). RIVM Rapp. 725201011 1994. [Google Scholar]
  30. Ferreira-Baptista, L.; De Miguel, E. Geochemistry and Risk Assessment of Street Dust in Luanda, Angola: A Tropical Urban Environment. Atmos. Environ. 2005, 39, 4501–4512. [Google Scholar] [CrossRef]
  31. Zheng, N.; Liu, J.; Wang, Q.; Liang, Z. Health Risk Assessment of Heavy Metal Exposure to Street Dust in the Zinc Smelting District, Northeast of China. Sci. Total Environ. 2010, 408, 726–733. [Google Scholar] [CrossRef]
  32. Zhang, M.; Li, X.; Yang, R.; Wang, J.; Ai, Y.; Gao, Y.; Zhang, Y.; Zhang, X.; Yan, X.; Liu, B.; et al. Multipotential Toxic Metals Accumulated in Urban Soil and Street Dust from Xining City, NW China: Spatial Occurrences, Sources, and Health Risks. Arch. Environ. Contam. Toxicol. 2019, 76, 308–330. [Google Scholar] [CrossRef]
  33. Project, J. Jamovi (Version 0.9)[Computer Software 2018.
  34. Bernabé, J.M.; Carretero, M.I. Caracterización Mediante Microscopía Electrónica de Barrido de Partículas Atmosféricas Del Área Industrial de Huelva (Sw de España). Bol. Soc. Esp. Mineral. 2003, 26, 167–177. [Google Scholar]
  35. Acosta, J.A.; Cano, A.F.; Arocena, J.M.; Debela, F.; Martínez-Martínez, S. Distribution of Metals in Soil Particle Size Fractions and Its Implication to Risk Assessment of Playgrounds in Murcia City (Spain). Geoderma 2009, 149, 101–109. [Google Scholar] [CrossRef]
  36. Xia, X.; Chen, X.; Liu, R.; Liu, H. Heavy Metals in Urban Soils with Various Types of Land Use in Beijing, China. J. Hazard. Mater. 2011, 186, 2043–2050. [Google Scholar] [CrossRef]
  37. Tan, S.Y.; Praveena, S.M.; Abidin, E.Z.; Cheema, M.S. Heavy Metal Quantification of Classroom Dust in School Environment and Its Impacts on Children Health from Rawang (Malaysia). Environ. Sci. Pollut. Res. 2018, 25, 34623–34635. [Google Scholar] [CrossRef]
  38. Moghtaderi, M.; Teshnizi, S.H.; Moghtaderi, T.; Ashraf, M.A.; Faraji, H. The Safety of Schools Based on Heavy Metal Concentrations in Classrooms’ Dust: A Systematic Review and Meta-Analysis. Iran. J. Public Health 2020, 49, 2287. [Google Scholar] [CrossRef]
  39. Sadrizadeh, S.; Yao, R.; Yuan, F.; Awbi, H.; Bahnfleth, W.; Bi, Y.; Cao, G.; Croitoru, C.; de Dear, R.; Haghighat, F. Indoor Air Quality and Health in Schools: A Critical Review for Developing the Roadmap for the Future School Environment. J. Build. Eng. 2022, 104908. [Google Scholar] [CrossRef]
  40. Miteco, gob. Spain., C.D.L. ACTIVIDADES INDUSTRIALES GENERADORAS DE SUSTANCIAS CONTAMINANTES. 2004.
  41. Wise, J.P.; Young, J.L.; Cai, J.; Cai, L. Current Understanding of Hexavalent Chromium [Cr(VI)] Neurotoxicity and New Perspectives. Environ. Int. 2022, 158, 106877. [Google Scholar] [CrossRef]
  42. Mielke, H.W.; Gonzales, C.R.; Smith, M.K.; Mielke, P.W. The Urban Environment and Children’s Health: Soils as an Integrator of Lead, Zinc, and Cadmium in New Orleans, Louisiana, U.S.A. Environ. Res. 1999, 81, 117–129. [Google Scholar] [CrossRef] [PubMed]
  43. Madrid, L.; Dı́az-Barrientos, E.; Madrid, F. Distribution of Heavy Metal Contents of Urban Soils in Parks of Seville. Chemosphere 2002, 49, 1301–1308. [Google Scholar] [CrossRef] [PubMed]
  44. Chronopoulos, J.; Haidouti, C.; Chronopoulou-Sereli, A.; Massas, I. Variations in Plant and Soil Lead and Cadmium Content in Urban Parks in Athens, Greece. Sci. Total Environ. 1997, 196, 91–98. [Google Scholar] [CrossRef]
  45. Fassina, V. The Stone Decay of the Main Portal of Saint Mark’s Basilica in Relation to Natural Weathering Agents and to Air Pollution. VIth Int Congr Deteterioration Conserv. Stone Torun 1988, 276–286. [Google Scholar]
  46. Umbría, A.; Gervilla, J.; Galán, M.; Valdés, R. Caracterización de Partículas. Junta Andal. Cons. Medio Ambiente Sevilla Spain 1999. [Google Scholar]
  47. Jadoon, W.A.; Khpalwak, W.; Chidya, R.C.G.; Abdel-Dayem, S.M.M.A.; Takeda, K.; Makhdoom, M.A.; Sakugawa, H. Evaluation of Levels, Sources and Health Hazards of Road-Dust Associated Toxic Metals in Jalalabad and Kabul Cities, Afghanistan. Arch. Environ. Contam. Toxicol. 2018, 74, 32–45. [Google Scholar] [CrossRef]
  48. Li, H.; Qian, X.; Hu, W.; Wang, Y.; Gao, H. Chemical Speciation and Human Health Risk of Trace Metals in Urban Street Dusts from a Metropolitan City, Nanjing, SE China. Sci. Total Environ. 2013, 456, 212–221. [Google Scholar] [CrossRef]
  49. Sörme, L.; Bergbäck, B.; Lohm, U. Goods in the anthroposphere as a metal emission source a case study of Stockholm, Sweden. Water Air Soil Pollut. Focus 2001, 1, 213–227. [Google Scholar] [CrossRef]
  50. Bergbäck, B.; Johansson, K.; Mohlander, U. Urban Metal Flows – A Case Study of Stockholm. Review and Conclusions. Water Air Soil Pollut. Focus 2001, 1, 3–24. [Google Scholar] [CrossRef]
  51. Jafari, K.; Rezvani Ghalhari, M.; Hayati, R.; Baboli, Z.; Zeider, K.; Ramírez-Andreotta, M.D.; Sorooshian, A.; De Marco, A.; Namdar-Khojasteh, D.; Goudarzi, M.; et al. Using Date Palm (Phoenix Dactylifera L.) as Bio-Monitors of Environmental Quality for Exposure Assessment and Pollution Source Tracking. Atmos. Environ. 2023, 313, 120055. [Google Scholar] [CrossRef]
  52. Sunyer, J.; Esnaola, M.; Alvarez-Pedrerol, M.; Forns, J.; Rivas, I.; López-Vicente, M.; Suades-González, E.; Foraster, M.; Garcia-Esteban, R.; Basagaña, X. Association between Traffic-Related Air Pollution in Schools and Cognitive Development in Primary School Children: A Prospective Cohort Study. PLoS Med. 2015, 12, e1001792. [Google Scholar] [CrossRef] [PubMed]
  53. Forns, J.; Dadvand, P.; Esnaola, M.; Alvarez-Pedrerol, M.; López-Vicente, M.; Garcia-Esteban, R.; Cirach, M.; Basagaña, X.; Guxens, M.; Sunyer, J. Longitudinal Association between Air Pollution Exposure at School and Cognitive Development in School Children over a Period of 3.5 Years. Environ. Res. 2017, 159, 416–421. [Google Scholar] [CrossRef] [PubMed]
  54. Castagna, A.; Mascheroni, E.; Fustinoni, S.; Montirosso, R. Air Pollution and Neurodevelopmental Skills in Preschool-and School-Aged Children: A Systematic Review. Neurosci. Biobehav. Rev. 2022, 136, 104623. [Google Scholar] [CrossRef]
Figure 1. Situation of the study area and location of sampling sites.
Preprints 95912 g001
Figure 2. SEM image of sampled urban dust.
Preprints 95912 g002
Figure 3. Concentration of the magnetic (M) and non-magnetic (Nm) fraction in the different elements, A(Cd), B(Cr), C(Cu), D(Ni), E(Pb), and F(Zn).
Preprints 95912 g003aPreprints 95912 g003b
Table 1. Reference doses (mg kg-1 day-1) (RfDing, RfDder, RfDinh) and cancer slope factor (mg kg-1 day-1) (SF) of heavy metals.
Cd Cr Cu Ni Pb Zn
RfDing 1.00E-03 3.00E-03 4.00E-0.2 2.00E-02 3.50E-03 3.00E-0.1
RfDder 1.00E-05 6.00E-05 1.20E-02 5.40E-03 5.25E-04 6.00E-02
RfDinh 1.00E-03 2.86E-05 4.02E-02 2.06E-02 3.52E-03 3.00E-01
SF 6.30E+00 4.20E+01 8.40E-01 4.20E-02
Table 2. Concentration of heavy metals (mg kg-1) in urban dusts sampled in schools in the city of Murcia.
Cd Cr Cu Ni Pb Zn
Mean 0.42 67.93 77.44 18.56 55.72 453.74
Maximum 8.22 255.51 513.63 80.83 384.51 3518.62
Minimum 0.07 12.76 8.72 3.59 5.29 53.19
SD 1.131 51.423 88.933 13.442 82.856 600.251
Table 3. Relationship between colour of samples and % magnetic particles.
Color
% Magnetic particles Dark Light
Low (<15) 7 15
Medium (15-30) 17 6
High (>30) 5 0
Valor p
χ² 12.2 0.002
Table 4. Relationship between colour and degree of magnetism with toxic pollutant load (PLI).
Color
% Magnetic particles Dark Light
Low (<15) 4229 7810
Medium (15-30) 12325 4133
High (>30) 5194 0
Valor p
χ² 8175 < .001
Table 5. Environmental pollution indices: CF, Contamination Factor. EF, Enrichment Factor. Igeo, Geoaccumulation Index.
Cd Cr Cu Ni Pb Zn
CF 1.57 5.16 4.28 1.65 13.05 13.15
EF 1.68 7.11 5.74 2.13 19.09 18.11
Igeo 0.67 1.40 0.92 0.13 2.25 2.53
Table 6. Mean non-carcinogenic index values for children and adults: Ding, Dinh and Dderm (mg kg-1 day-1) and Hazard Quotient for each element and route of exposure.
Childrens
Ding Dinh Dderm HQing HQinh HQderm HI
Cd 5.4E-06 1.5E-10 8.7E-09 5.4E-03 1.5E-07 1.5E-05 5.43E-03
Cr 8.7E-04 2.4E-08 1.4E-06 2.9E-01 8.5E-04 4.1E-04 2.9E-01
Cu 9.9E-04 2.8E-08 1.6E-06 2.5E-02 6.9E-07 2.3E-06 2.5E-02
Ni 2.4E-04 6.7E-09 3.8E-07 1.2E-02 3.2E-07 1.2E-06 1.2E-02
Pb 6.1E-05 2.0E-08 1.1E-06 1.7E-02 5.7E-06 3.8E-05 1.8E-02
Zn 5.8E-02 1.6E-07 9.3E-05 1.9E-02 5.4E-07 2.7E-06 1.9E-02
Adults
Ding Dinh Dderm HQing HQinh HQderm HI
Cd 5.8E-07 5.5E-11 1.8E-09 5.8E-04 5.5E-08 1.8E-04 7.6E-04
Cr 9.3E-05 8.8E-09 2.8E-07 3.1E-02 3.1E-04 4.7E-03 3.6E-02
Cu 1.1E-04 1.0E-08 3.2E-07 2.7E-03 2.5E-07 2.7E-05 2.7E-03
Ni 2.5E-05 2.4E-09 7.7E-08 1.3E-03 1.2E-07 1.4E-05 1.3E-03
Pb 7.6E-05 7.2E-09 2.3E-07 2.2E-02 2.0E-06 4.4E-04 2.2E-02
Zn 6.2E-04 5.8E-08 1.9E-06 2.1E-03 1.9E-07 3.2E-05 2.1E-03
Table 7. Average cancer risk values for Cd, Cr, Ni and Pb.
CdLADD CrLADD NiLADD PbLADD CdCR CrCR NiCR PbCR
3.2E-11 5.1E-09 1.4E-09 4.2E-09 2.0E-10 2.1E-07 1.2E-09 1.8E-10
Disclaimer/Publisher’s Note: The statements, opinions and data contained in all publications are solely those of the individual author(s) and contributor(s) and not of MDPI and/or the editor(s). MDPI and/or the editor(s) disclaim responsibility for any injury to people or property resulting from any ideas, methods, instructions or products referred to in the content.
Copyright: This open access article is published under a Creative Commons CC BY 4.0 license, which permit the free download, distribution, and reuse, provided that the author and preprint are cited in any reuse.
Prerpints.org logo

Preprints.org is a free preprint server supported by MDPI in Basel, Switzerland.

Subscribe

© 2024 MDPI (Basel, Switzerland) unless otherwise stated