Preprint
Article

Collembola Communities Reflect Soil Recovery After Fire in Mediterranean Pinus pinaster Forests

This version is not peer-reviewed.

Submitted:

09 January 2024

Posted:

10 January 2024

You are already at the latest version

Abstract
In the present work we have studied the short-term edaphic recovery of a burned pine forest of Pinus pinaster Aiton in Cerro del Castillo (Sierra de Guadarrama, Central Spain) in which a hydrological-forestry restoration was being carried out after the fire occurred in July 2022. For this purpose, variations in physicochemical properties (conductivity, relative humidity, organic matter and pH) and collembolan communities were analyzed by comparing the soils of a natural pine forest and a burned pine forest during the 24 weeks after the fire in 3 different samplings. With the data obtained, a series of diversity indices were calculated and statistical analyses such as ANOVA, hierarchical classification and principal component analysis were developed, with the aim of understanding in greater depth the recovery of collembolan populations, the changes in these physicochemical variables and the relationships between both parameters. This study shows how the fire reduced the amount of organic matter and water, and increased soil pH and conductivity, affecting edaphic fauna populations. In the short term, there was an increase in relative humidity and a decrease in electrical conductivity. The edaphic fauna communities of the burned pine forest increased their diversity and equity without reaching the values of the natural pine forest. At the specific level, however, the springtail populations matched the richness and even reached a very slightly higher Shanon-Wiener diversity index than that the natural pine forest populations in just 24 weeks. Finally, it was observed that the samples from the burned pine forest with recovered collembolan populations had the closest physicochemical parameters to those of the natural pine forest.
Keywords: 
Subject: 
Biology and Life Sciences  -   Ecology, Evolution, Behavior and Systematics

1. Introduction

Fires are natural phenomena that have shaped Mediterranean ecosystems since the last glaciation (Naveh 1975, Cowling et al. 1996). However, in recent decades the natural fire regime described by its frequency, intensity, seasonality and type of spread has changed in Mediterranean-type climatic regions generating new ecologically and socioeconomically unsustainable regimes (Pausas 2012, Ubeda Cartañà et al. 2021). Large forest fires have increased outside the summer months, as have the hectares burned by large forest fires originating fifth and sixth generation fires since 2000 and 2016, respectively. The concept of fire generations has to do with how fire behaviour is related to the structure of the landscape. Two issues that interact in a forest fire and that, depending on the circumstances, make us talk about a fire of one type or another (Castellnou et al. 2017). These new fires are characterized by generating their own atmospheric conditions and escape any extinguishing capacity. Some authors such as Ubeda Cartañà et al. (2021) point out as causes of the modification of these regimes the depopulation of rural areas, the abandonment of forestry practices, fire suppression policies and the effects of climate change.
The impact of a wildfire is influenced by the size, intensity and frequency of the fire; and affects the fauna, vegetation, soil and water of the ecosystem (González Ulibarry 2017). Physico-chemical-biological properties and soil productivity are the main factors affected after a wildfire (Mataix-Solera et al. 2011, García-Orenes et al. 2017). This resource has been defined by FAO as a natural body differentiated into horizons composed of weathered minerals, organic matter, water and air. Soils provide a large number of ecosystem services such as freshwater reserve, recycling of organic matter, and regulation of carbon (C) and nitrogen fluxes (Brevik et al. 2015). In addition, soils are the largest reservoir of C in the world, storing more than the atmosphere and vegetation combined (Swift 2001). Fires are one of the most common causes of the depletion of these reservoirs and cause this stored C to be released into the atmosphere in the form of carbon dioxide, a greenhouse gas. For these reasons, soil conservation and restoration is of great importance.
The effects of a fire on the soil can be immediate due to the high temperatures, or indirect due to the new conditions after the fire.High temperatures cause partial (300-400ºC) or complete (500ºC) combustion of the organic matter found in the surface horizons, modifying their color and texture, decreasing their water retention capacity and even generating a hydrophobic layer (Iglesias et al. 1998, Mataix-Solera and Guerrero 2007). The presence of an ash cover usually causes an increase in pH and electrical conductivity when the basic cations contained in it are hydrolyzed (Iglesias et al. 1997, Iglesias et al. 1998). An indirect effect of a forest fire is the risk of soil erosion due to the absence of vegetation cover, especially on steep slopes (Mataix-Solera and Guerrero 2007). Changes in physicochemical parameters disturb the edaphic fauna, which in turn is characterized by being able to significantly modify soil properties, decomposing and dispersing labile organic matter, facilitating subsequent humification and mineralization of this, or creating tunnels and galleries, among many other functions (Bardgett 2002, Brevik et al. 2015).
Topography (e.g., elevation, slope, aspect, complexity) influences fire behavior directly, with rate of spread greatest on steeper slopes (Rothermel 1972), and heading fire more probable on upper-slope than on lower-slope positions (Skinner et al. 2006). Annual and daily meteorological patterns can heavily influence fire behavior (Martín and Birk 2010) in any given fire season (climate) or day (temperature, relative humidity, wind). Fuel, a factor that can be manipulated through management, is a function of vegetation, which is controlled by topographic gradients, climate, and modified by time since previous fire or the severity of previous fire(s) (Collins et al. 2008, Holden et al. 2009).
The ecological complexity of soils and the slowness of their processes mean that they are considered a naturally non-renewable resource at the human time scale, which is why the development of efficient protection and recovery projects is of great importance (FAO, 2015). The efficiency of a hydrological-forest restoration after a fire can be studied through quality indices that integrate the physical, chemical and biological properties of the soil (Trujillo-González et al. 2018).
Springtails (Collembola) are a class of hexapod arthropods that together with oribatid mites represent the most abundant taxa of the edaphic mesofauna (0.1-2 mm) (Arbea and Blasco Zumeta 2001). The main functions of springtails include, due to their feeding, the fractionation and degradation of labile organic matter, influencing the formation of humic substances. They also participate in the control and dispersion of microorganisms, and represent a fundamental element in trophic chains. Due to their wide dispersion, diversity and susceptibility to environmental disturbances, springtails are considered good bioindicators of the characteristics and eventual modifications of a soil (Arbea and Blasco Zumeta 2001, Chauvat et al. 2003, Ponge et al. 2003). These animals can be classified into three morphoecological categories according to their physiognomy and the environment they inhabit. The following categories are considered to be atmobiontic collembolans that inhabit leaf litter or plants, hemiedaphic collembolans that inhabit the most superficial layers of the soil and euedaphic collembolans that inhabit the deepest layers.
The aim of this work is to study the early effects of the hydrological-forest restoration of a burned forest of Pinus pinaster Aiton in the Sierra de Guadarrama (Madrid, Spain). For this purpose, the physicochemical properties and the soil collembolan communities of a burned pine forest and a natural pine forest were analyzed during the 24 weeks after the fire. The starting hypothesis is that soil parameters and springtail communities differ qualitatively and quantitatively between pine forests. The second hypothesis considers that some of these edaphic parameters change in the short term in the burned pine forest due to the restoration project carried out. Furthermore, it is expected that these changes in the physicochemical parameters will be reflected in the springtail populations, and that these will be more similar to those of the natural pine forest when they recover.

2. Materials and Methods

2.1. Study area

This study was carried out in the pine forest of Cerro del Castillo (1,340 m), located on the southern slope of the Sierra de Guadarrama (Central System, Central Spain) and belonging to the municipality of Collado Mediano, NW of Madrid, in the center of the Iberian Peninsula. Specifically, we compared the natural pine forest and the pine forest affected by the fire that took place on July 12, 2022 on the southern slope of this hill (Figure 1).
The climate of this area is characterized as Mediterranean, with an average annual temperature of 11.4°C and accumulated precipitation of 689 mm. Cerro del Castillo, like the Sierra de Guadarrama, is mainly made up of metamorphic rocks with siliceous composition. According to the FAO soil association system, the predominant soil in the area is of the Cambisol type characterized by the accumulation of clays and iron oxides in the B horizon.
According to Rivas-Martínez's vegetation series system (1987), the study area belongs to the subhumid supramediterranean floor, with potential vegetation being holm oaks (Q. ilex L. subsp ballota) and junipers (Juniperus oxycedrus L.) (Rivas-Martínez 1987). At present, black pine (Pinus pinaster Ait.) predominates, which began to be planted in the area in 1940, and was also used in forest restoration after the 2009 fire in which 12 hectares burned (Campo Sanchís 2011, Ayuntamiento de Collado Mediano 2023). To a lesser extent, there are also abundant specimens of Pinus sylvestris L., Quercus ilex and Juniperus oxycedrus. Other species that can be observed are Cistus laurifolius L., Cistus ladanifer L., Lavandula stoechas Lam, Cytisus scoparius Link, roses and brambles. The herbaceous stratum includes species such as Poa bulbosa L., Koeleria sp and Stipa gigantea Link.
The forest fire that occurred in July 2022 had a severity level 1 according to the Infoma protocol and burned 48.28 ha of Cerro del Castillo. In October of the same year, TRAGSA (the company responsible for the execution of works and services for rural development, environmental conservation and emergency actions) began the hydrological-forest restoration actions, which would last 6 months. These measures consisted of the removal of the burnt tree mass and the creation of containment terraces with tree trunks to prevent soil erosion.
It is worth mentioning that this wood was auctioned and partially burned in the same area. The three samplings of this work in September, October and November are aimed at studying the early effects of the previous measures described. The last restoration action was to repopulate the area with Pinus pinaster (Consejería de Medio Ambiente 2022).

2.2. Field work

This work is based on 3 equal samplings carried out on September, October and November, 2022 with the objective of studying the early effects of hydrological-forest restoration on edaphic recovery during the first 8 weeks after the fire (September), 12 weeks (October) and 16 weeks (November). The first sampling was carried out when the intervention had not yet begun; the second when the burned trees had just been felled; and the third after the removal and burning of the forest mass affected by the fire and the creation of containment terraces.
Each sampling consisted of collecting samples at 10 different points, 5 belonging to the burned pine forest and 5 to the natural pine forest (they are thus replicas). These 5 points (Center, South, West, North and East) were arranged in crosses with a separation of 10m. between each one (Figure 1). The initial location of these crosses within the area of interest was random, but it is worth mentioning that subsequent sampling was carried out at the same coordinates: natural pine forest (40.699334, -4.021302) and burned pine forest (40.699630, -4.018994). These points were located in areas with average slopes greater than 40 %, so the topography was the same in both sampling points.
At each point the temperature was recorded and 100 cc of the surface horizon (0-10cm) were collected for the study of soil parameters, which were stored at 4ºC until further analysis. For the faunal analysis, only in the North, Center and South points 250 cc of the superficial horizon (0-10cm) and 750 cc of the leaf litter that was present only in the natural pine forest were collected. Samples are collected with the aid of a shovel, keeping the central core of the soil volume being collected intact. This sampling was repeated in October and November, obtaining a total of 30 samples for the analysis of edaphic parameters and a total of 27 samples for the faunistic study, of which were 9 litter samples and 18 soil simples, 9 of them of natural soil, and 9 of burned soil. All samples were stored in hermetically sealed plastic bags and properly labeled.

2.3. Laboratory work

2.3.1. Soil parameters

The 30 samples of the edaphic study were used to analyze conductivity, relative humidity, organic matter (OM) percentage, pH and hydrophobicity. All samples were weighed before (So) and after being air-dried for 2 weeks (SS), and were also sieved.
Relative humidity was calculated using the following formula (ISO 11465:1993, 1993):
%   H . R . = S o S S S S × 100
Electrical conductivity is a parameter that shows the capacity of a solution to transmit electrical current and depends on the concentration of dissolved salts. In this work it was measured using a conductivity meter on the samples previously suspended in distilled water with 1:5 ratio (Psample: VdiH2O) and stirred for 30 min.
The pH was determined using the potentiometric method, for which the samples were weighed, suspended in distilled water maintaining a 1:2.5 ratio (Psample: VdiH2O) and stirred for 15 minutes.
The percentage of soil OM was analyzed using the Walkley-Black chemical method, which consists of oxidizing the organic carbon present by adding 10 mL of a solution of potassium dichromate and 15 mL of sulfuric acid to the samples. To obtain the blank measurement, this was also performed with a tube without sample. The samples were allowed to oxidize for 30 minutes during which time the organic carbon was transformed to CO2. 150mL of distilled water was added and then the amount of unreduced potassium dichromate was determined. For it, 1 mL of the indicator phenanthroline was added and it was valued pouring a solution of Mohr's salts drop by drop until the coloration had changed. Knowing the initial weight of the samples (Pm) and measuring the volumes of Mohr's salt spent on each sample (Vb) and on the blank (Vm) the OM percentages of each sample could be calculated with the following formula:
%   O . M . = ( V b V m ) × 6.7 20 × P m
Finally, the hydrophobicity of the soil was studied with the WDPT (time of penetration of a drop of water) test, which is based on studying water repellency by measuring the time it takes for drops of distilled water to penetrate the sample.

2.3.2. Faunistic study

The 27 samples of the faunistic study were processed using the Berlese-Tullgren funnel method for 15 days (Palacios-Vargas and Mejía 2007). The fauna was sorted and separated in tubes preserved in 70% alcohol. Individuals belonging to the order Collembola were identified to species level whenever possible. For this purpose, each individual was immersed in lactic acid for 7 days. The individuals were then mounted in semi-permanent preparations using Hoyer's liquid (distilled water, chloral hydrate, gum arabic and glycerin). All data were recorded as shown in Table S1 of the Annex.

2.4. Data analysis

The study of the edaphic parameters was divided into two tests. First, the equality of means of the variables Conductivity, Humidity, O.M. and pH between the burned (B) and natural (N) pine forest soils was contrasted. For this purpose, four analyses of variance (ANOVA) were carried out, having previously checked the requirement of normality of the data by means of the Shapiro-Wilk (S-W) test. It was this test that was used since the sample size (n=30) was less than 50 (Pedrosa et al. 2015). Variables that did not present a normal distribution of their data were transformed by square root, logarithm, inverse or power in order to perform this parametric statistical analysis. The transformation that allowed the best fit of the data to the normal distribution was chosen (Osborne 2002). We then studied whether in the burned pine forest these same variables differed between the months of September, October and November. Another four ANOVAs were produced with Bonferroni tests to see between which months differences existed. The normality of the burned pine forest data (n=15) was also tested using the Shapiro-Wilk test.
The study of communities of springtails was approached from several different methodologies. These four alpha diversity indices were used to compare the communities of springtails at the species level among the different types of samples. They were calculated with their respective formulas, where S is the number of species and pi is the relative abundance of the species.
  • The Shannon-Wiener Diversity index (H' = - Σpi ln pi).
  • The Specific Richness index (Hmax=(LnS)).
  • The Pielou's Equity index (J = H/Hmax).
  • Simpson's Dominance index (λ =∑pi 2).
In addition, a hierarchical classification based on springtail communities was performed to obtain a dendrogram in which the most similar samples grouped in clusters could be easily observed. In this multivariate analysis, the Euclidean distance index was used, the clustering algorithm was between groups and leaf litter samples were excluded. After obtaining the dendrogram, several ANOVAs were conducted to see which species differed between clusters.
A principal component analysis (PCA) was applied to the abundance of the species in order to find groupings among them, and a better understanding of the variables that can condition the distribution of the species throughout the months and in the different types of forest.
It is worth mentioning that all data were collected in matrices using Excel and that the statistical analyses performed using SPSS 28.0 used a significance level of 0.05.

3. Results

3.1. Edaphic parameters

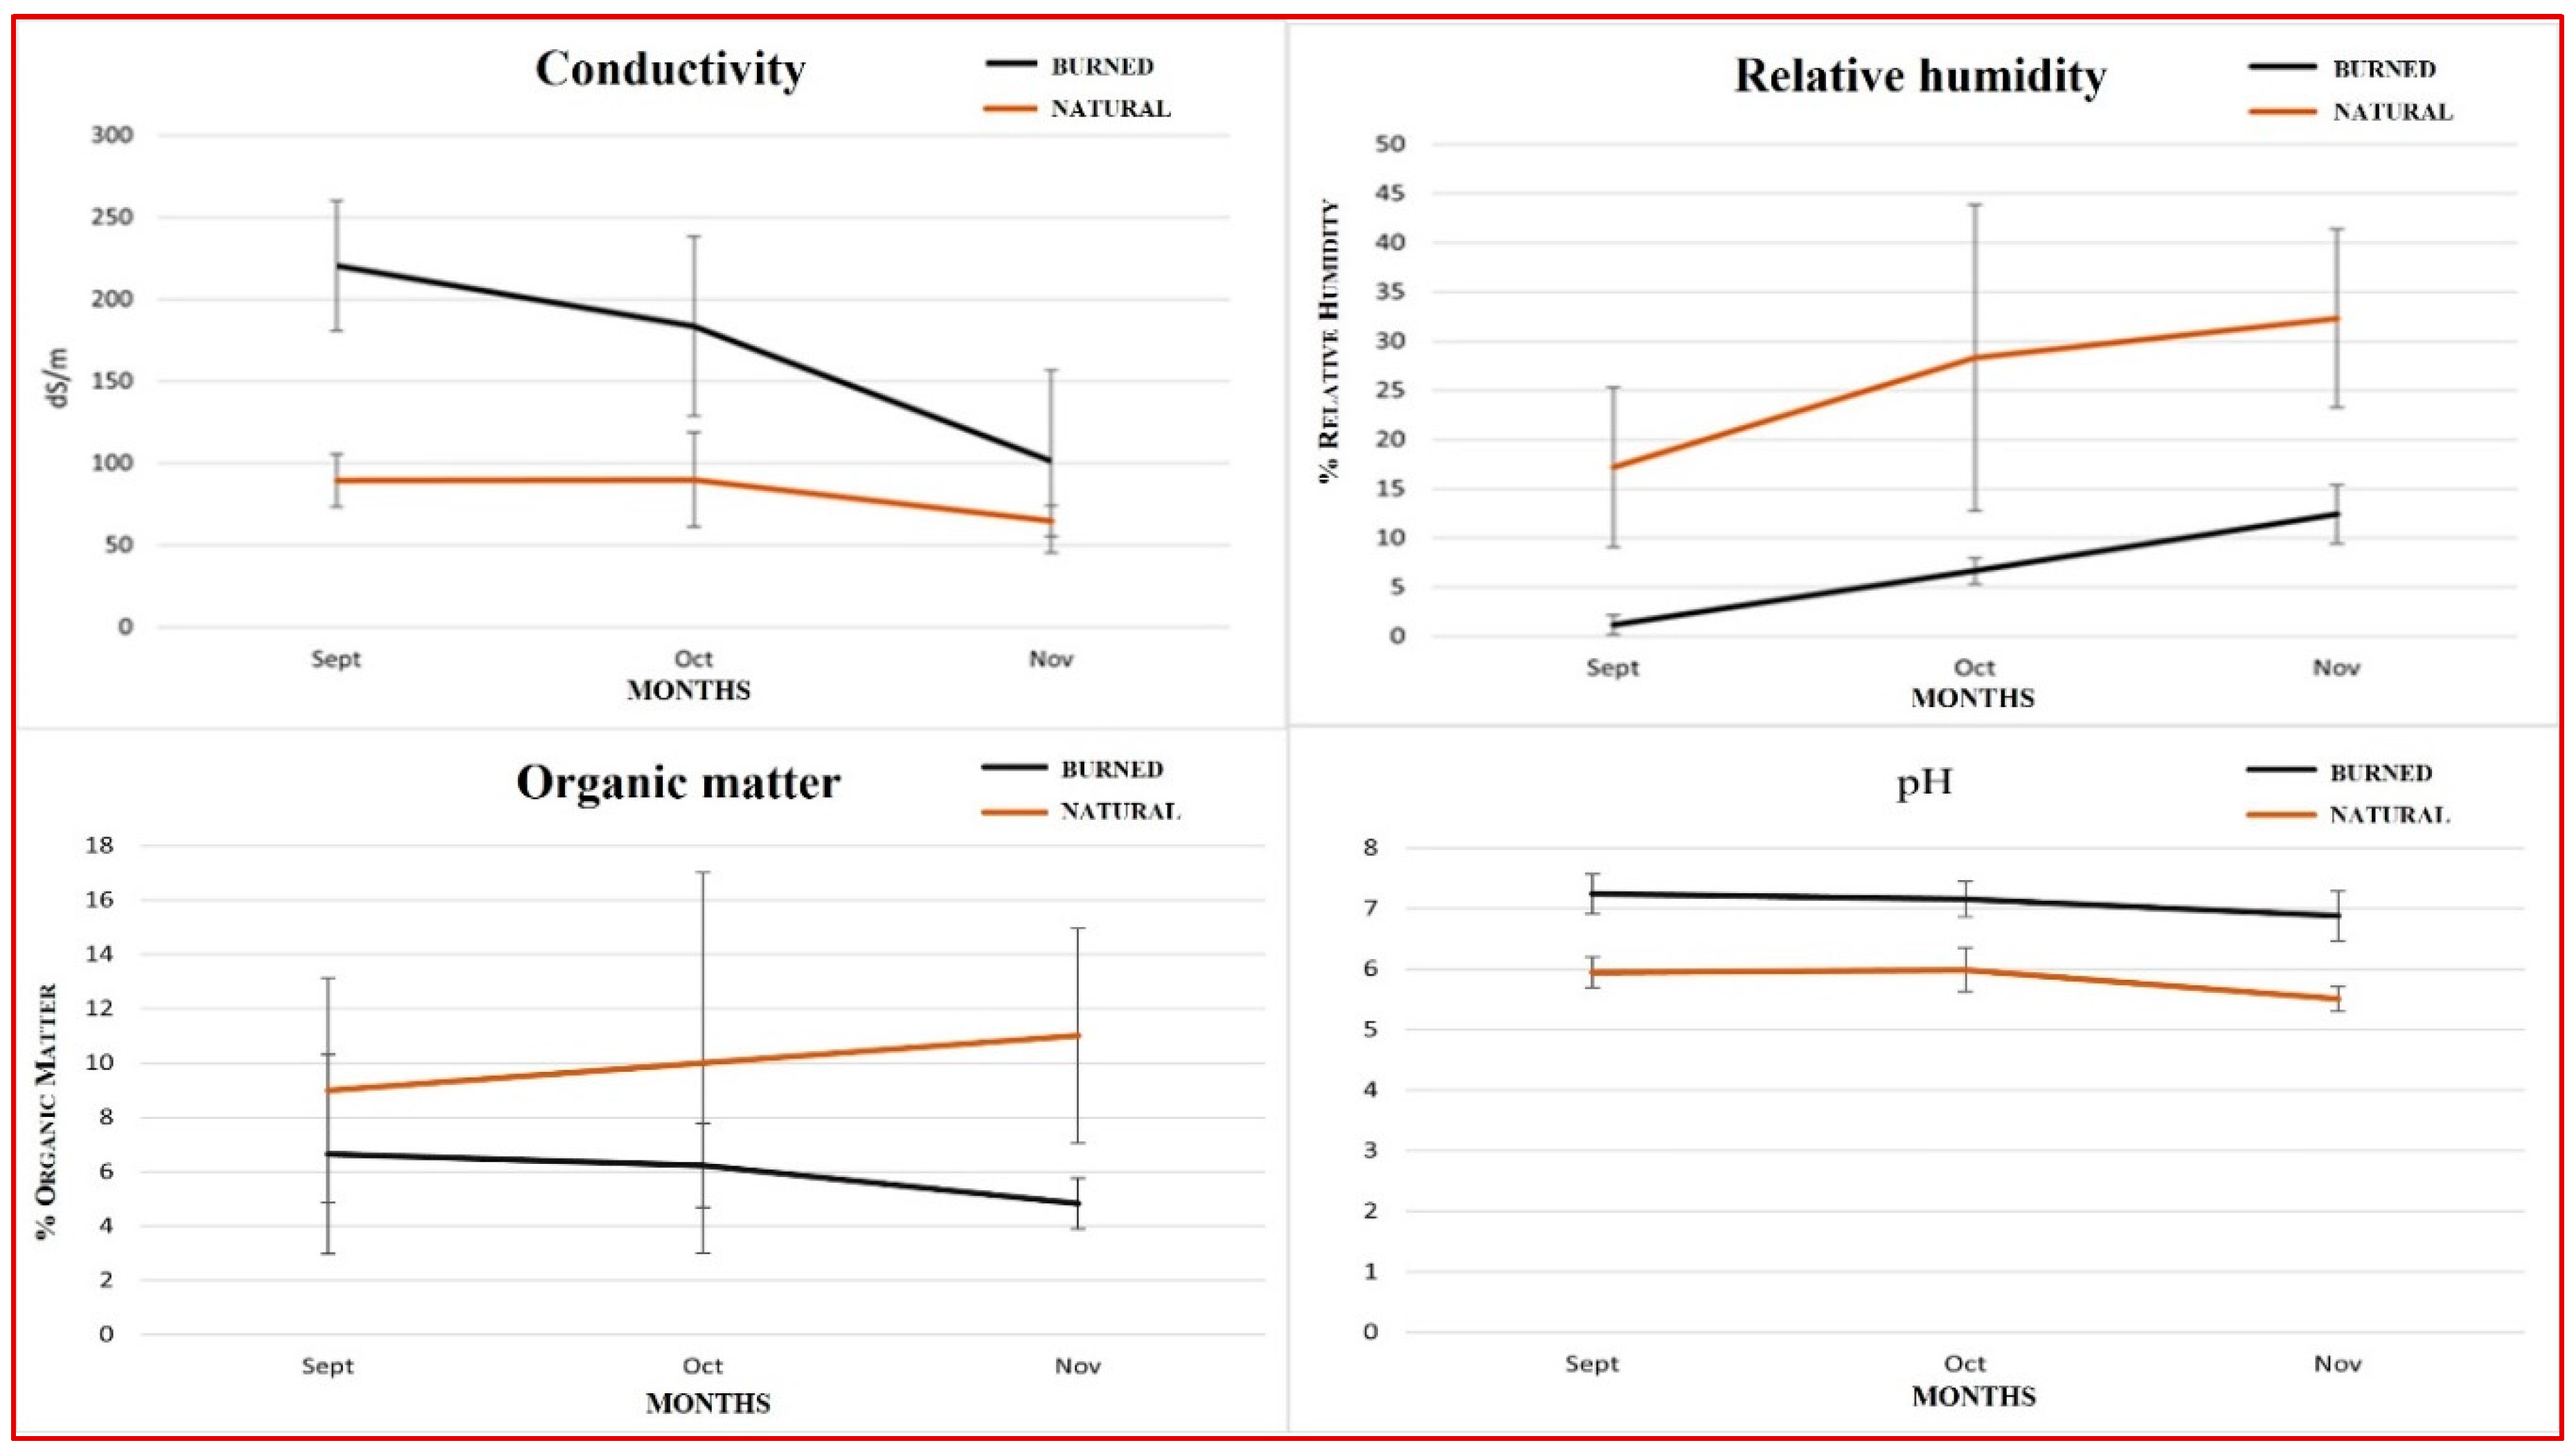
The variables Conductivity, Moisture, OM and pH were transformed to the inverse of Conductivity, the square root of Moisture, the Logarithm of Organic Matter, and the inverse of pH to obtain a normal distribution of their data. After the analysis of variance of these transformed variables, significant differences were observed between the means of the samples of the burned pine forest and the natural pine forest. The burned soil presents higher values for conductivity and pH; on the other hand, OM and moisture are lower than in the soil of the natural pine forest (Table 1).
The second analysis of variance was carried out exclusively with the burned pine forest samples, and in this case only OM required to be transformed to the Inverse of OM. Table 2 shows that the means of OM and pH variables do not differ significantly among the 3 months. Burned soil moisture shows different means in September, October and November, increasing over time. Conductivity only varies between September and November, decreasing over time (Figure 2).
The results of the WDPT test (hydrophobicity) had a mean of 41, 37 and 27 seconds for the burned pine forest soil in September, October and November, respectively. These values belong to class 1 (water repellent) as they are in the range of 5-60 seconds (Bisdom et al. 1993). The control sample of the natural pine forest had a mean of 1 minute 22 seconds belonging to class 2 (strongly water repellent) in the range 60-600 seconds (Bisdom et al. 1993).

3.2. Study of springtail communities

3.2.1. Faunal composition

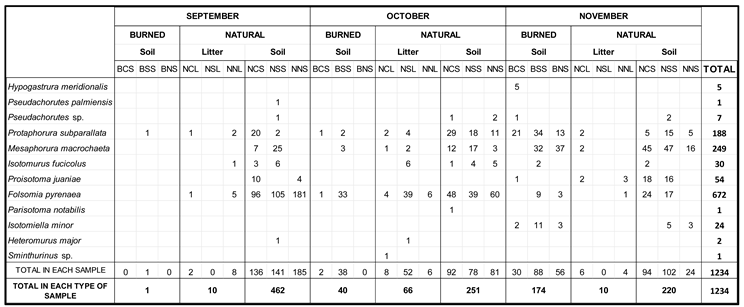
A total of 1,234 springtails belonging to 12 different species were identified. Of these specimens, 215 belonged to the samples from the burned pine forest, and 1,019 to the natural pine forest: 86 from the leaf litter samples and 933 from the soil samples. Table 3 shows in more detail the distribution of springtail communities in these samples.
The main biogeographical and ecological characteristics of the 12 species are briefly mentioned below (Arbea 2021, Arbea and Almeida 2022).
Family Hypogastruridae Börner, 1906
Hypogastrura meridionalis Steiner, 1955
It is an orophilous and atmobic species, found in different types of forests, pine, beech and oak forests. Its distribution is mediterranean and it has been reported from Italy and Spain.
Family Neanuridae Börner, 1901
Pseudachorutes palmiensis Börner, 1903
It is an atmobic species, typically forest-dwelling and occurs in leaf litter, moss and tree bark. It is characterized by its styliform jaws and a diet based on fungal hyphae and mycelia, which indicates a more advanced degree of decomposition of organic matter in the places where it lives. Its distribution is palaearctic, and it is widely distributed throughout the Iberian Peninsula.
Pseudachorutes sp. Tullberg, 1871
Specimens of this species could not be classified to the specific level because they are juveniles and were still too pigmented. All species of this genus are hemiedaphic or atmobic.
Family Onychiuridae Börner, 1901
Protaphorura subparallata Selga, 1962
Euedaphic and troglophic species (Arbea et al. 2021). It is found in different biotopes of the Spanish Central System, mainly forests and grasslands (Jordana et al. 1997). It is endemic to the Sierra de Guadarrama (Arbea et al. 2021).
Mesaphorura macrochaeta Rusek, 1976
Euedaphic species that inhabits forest ecosystems (Luciáñez and Iniesto 2006) although it is considered an ecologically generalist species since it can be found in a great diversity of biotopes (Jordana and Arbea 1989). Its distribution is cosmopolitan, found throughout the Iberian Peninsula showing a preference for acidophilic soils (Arpin et al. 1984).
Family Isotomidae Schäffer 1896
This family is characterized by its adaptability to extreme circumstances of the edaphic environment and its capacity for resistance. For this reason they present phenomena of anhydrobiosis, ecomorphosis, development of crowns, spines and cuticular differentiation.
Isotomurus fucicolus Schött, 1893
It´s a palaearctic species that lives preferably in open ecosystems, in the first levels of the soil.
Proisotoma juaniae Luciáñez and Simón, 1992
Hemiedaphic species found in oak and pine forests in the center and north of the Iberian Peninsula. It is endemic to the Iberian Peninsula.
Folsomia pyrenaea Cassagnau, 1954
Hemiedaphic species found in soils and caves (Arbea et al. 2021). Its distribution is iberian.
Parisotoma notabilis Schäffer, 1896
Hemiedaphic species of cosmopolitan distribution, widely distributed throughout the Iberian Peninsula, being one of the most abundant and frequent Collembola species.
According to Potapov (2001), this species reaches the highest densities in forests of Central Europe and southwestern Russia, and is present at lower densities in any type of biotope. It is found in forests and meadows in addition to crop fields, grasslands, urban soils or even in extremophile environments such as glaciers (von Saltzwedel et al. 2017).
Isotomiella minor Schäffer, 1896
Euedaphic species of Holarctic distribution, widely distributed throughout the Iberian Peninsula. It is found in various types of forests, pine forests, oak forests, oak groves and meadows. It has also been cited on the banks of rivers.
Family Entomobryidae Tömösvari, 1882
Heteromurus major Moniez, 1889
It has an atmobiotic or hemiedaphic character, inhabiting under stones, leaf litter or meadows (Luciáñez and Simón 1988). Distributed mainly in Europe and the mediterranean region. Widely distributed in the Iberian Peninsula.
Family Katiannidae Börner, 1913
Sminthurinus sp.
This is a genus consisting of atmobic species. The specimens found could not be classified to species level because they were juvenile individuals, lacking the characters for species identification.
As a final consideration in this section on the faunistic study, it is noteworthy that despite the few species found, 50% of them are species of restricted distribution, and of these, 30% are endemic to the Iberian Peninsula. This fact is of greater interest given that the populations of these species are the most abundant in the study. In addition, they have a higher population in the natural soil than in the burned soil. Thus, P. subparallata contains 15.2% of all the specimens collected, of which 62.1% were found in burned soil. This shows the fire resistance of this endemic species.
P. juaniae is less abundant (4.37% of the entire community), and its population in burned soil is only 1.9%. Another endemic species is F. pyrenaea, the most abundant species in this work. Its population accounts for 54.5% of all the animals found, and only 7.3% of its large community was collected on burned ground.

3.2.2. Alpha diversity indexes

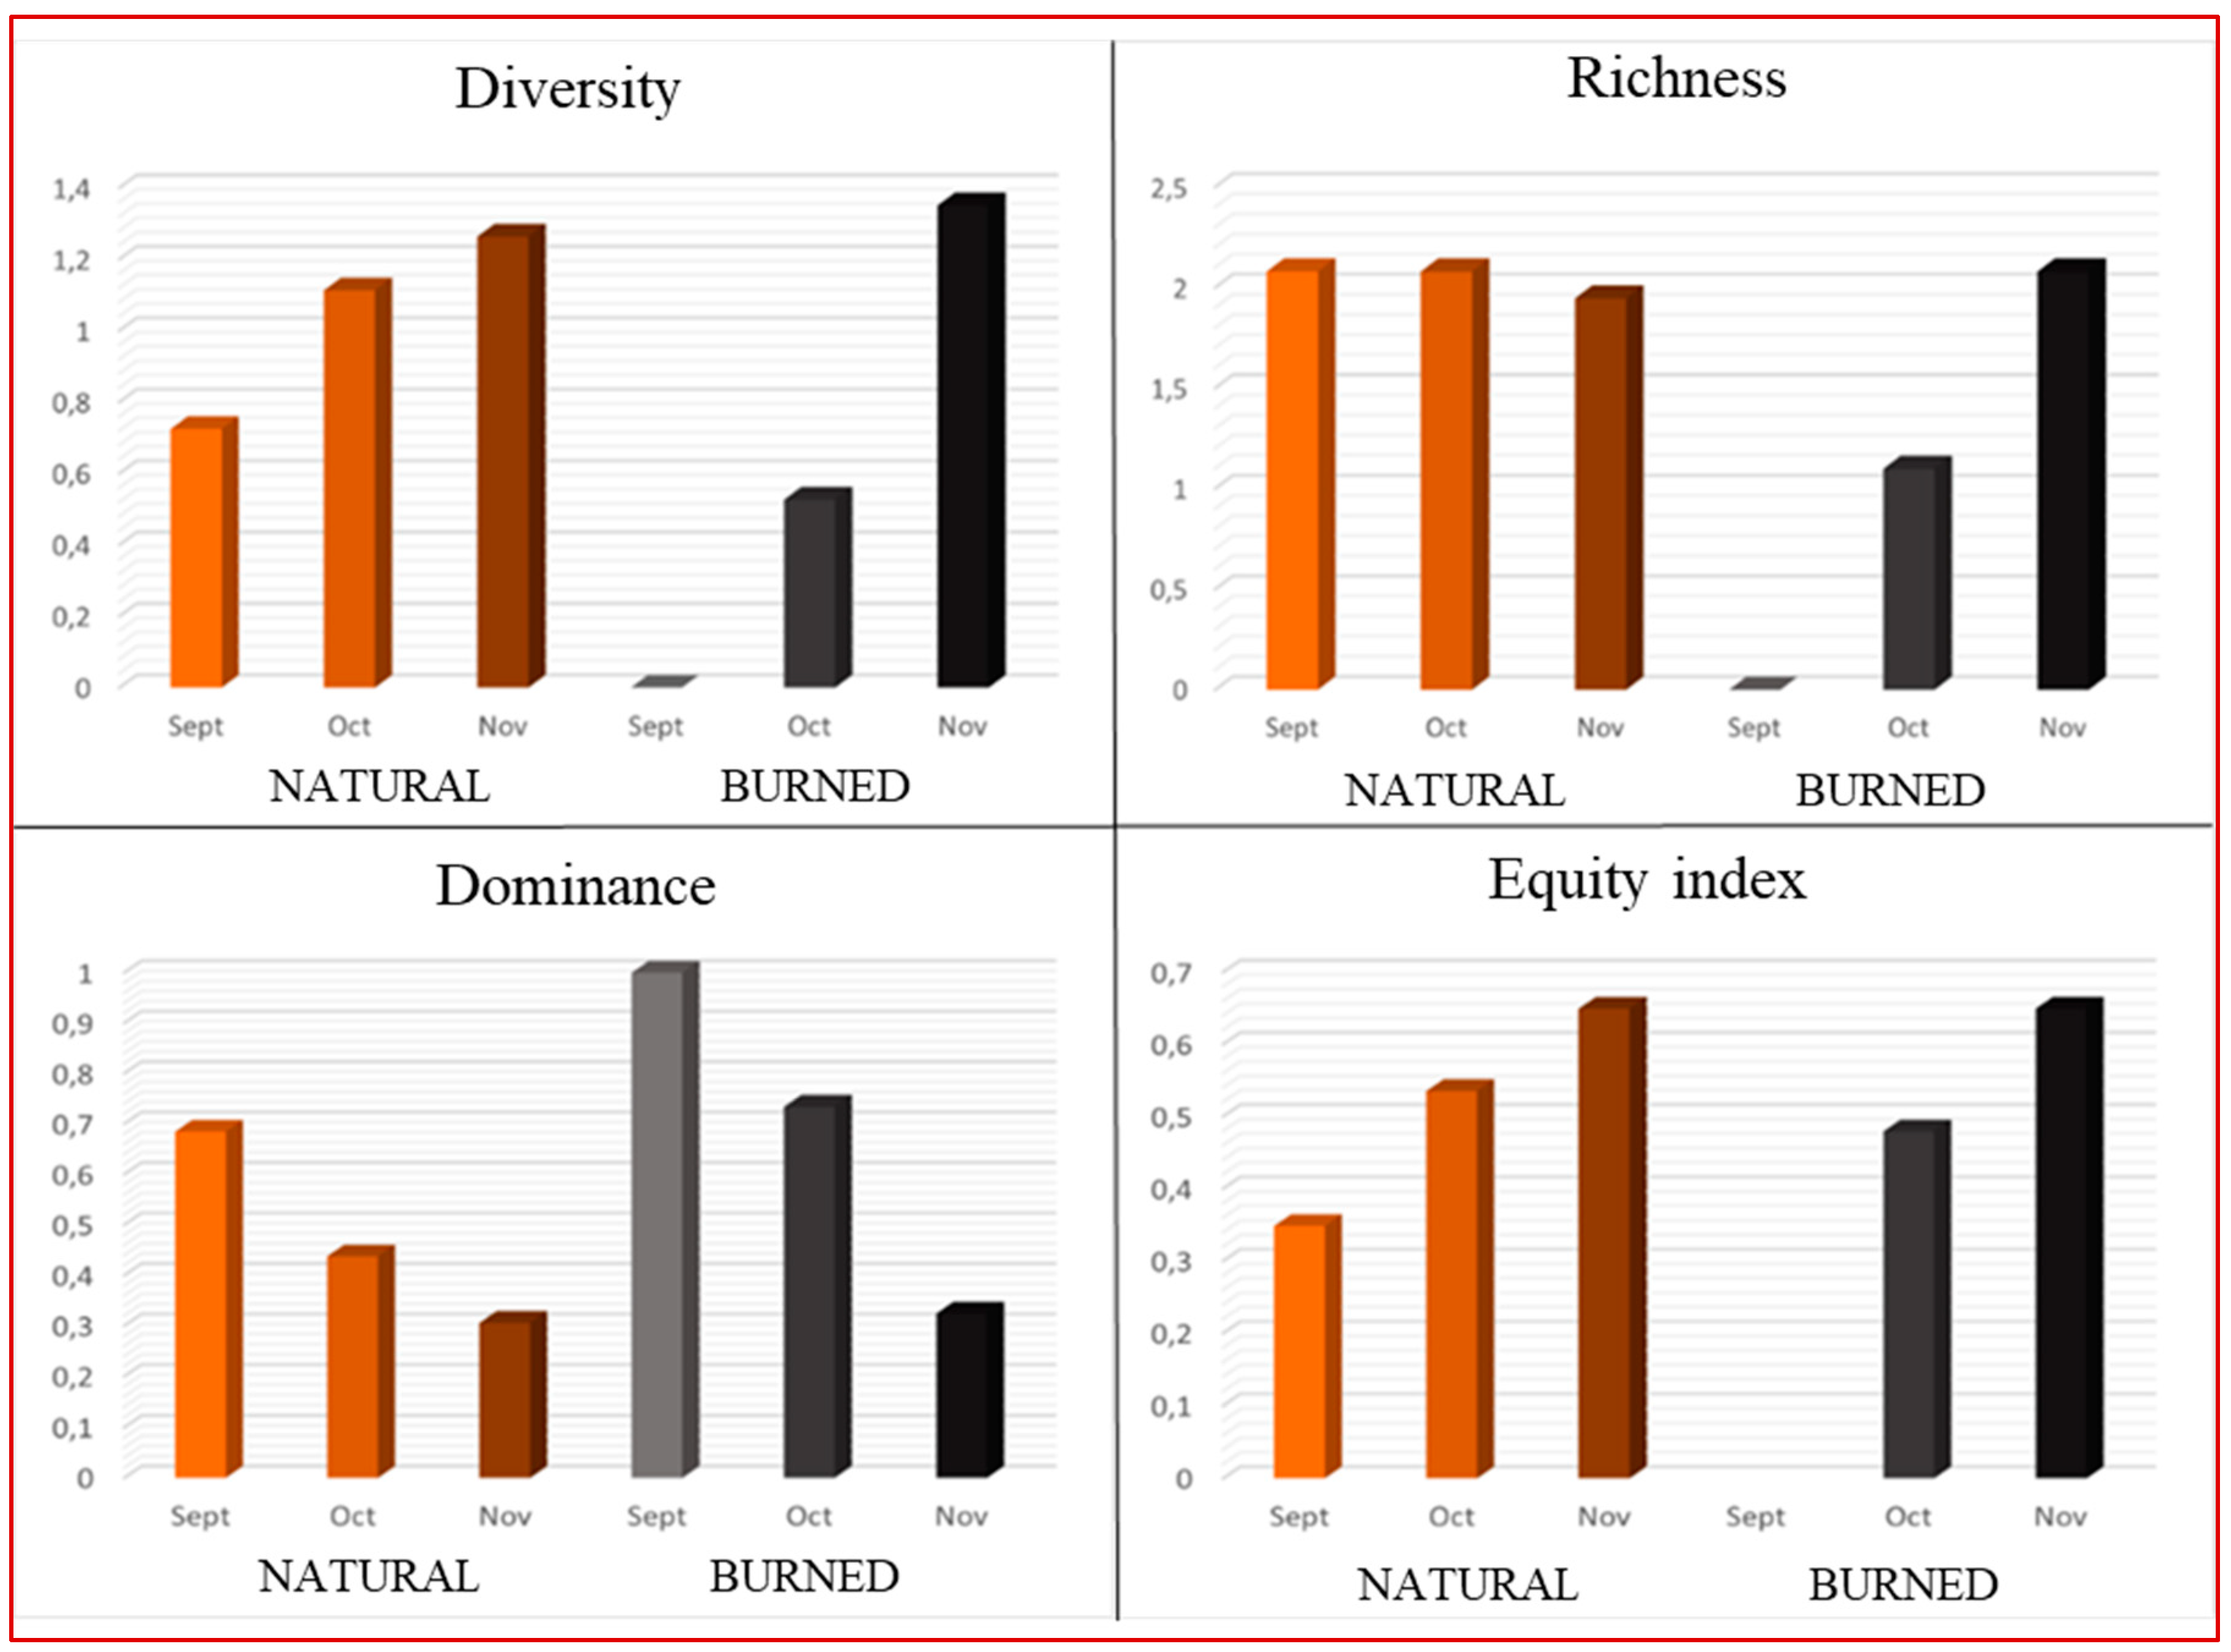
In order to compare the structure of the springtail populations, four alpha diversity indices were calculated, which allow to differentiate the samples according to the pine forest and the month of sampling (Figure 3).
The richness of the samples of the natural pine forest is constant around the value 2, however, in the samples of the burned pine forest it experiences a growth from 0 in September to 2.07 in November. The springtail community in the burned pine forest also becomes more diverse and equitable over time, reaching a higher diversity in November than in the natural pine forest (1.35 vs. 1.26). The springtail community in the natural pine forest shows similar trends, increasing in richness and evenness from September to November.

3.2.3. Hierarchical classification

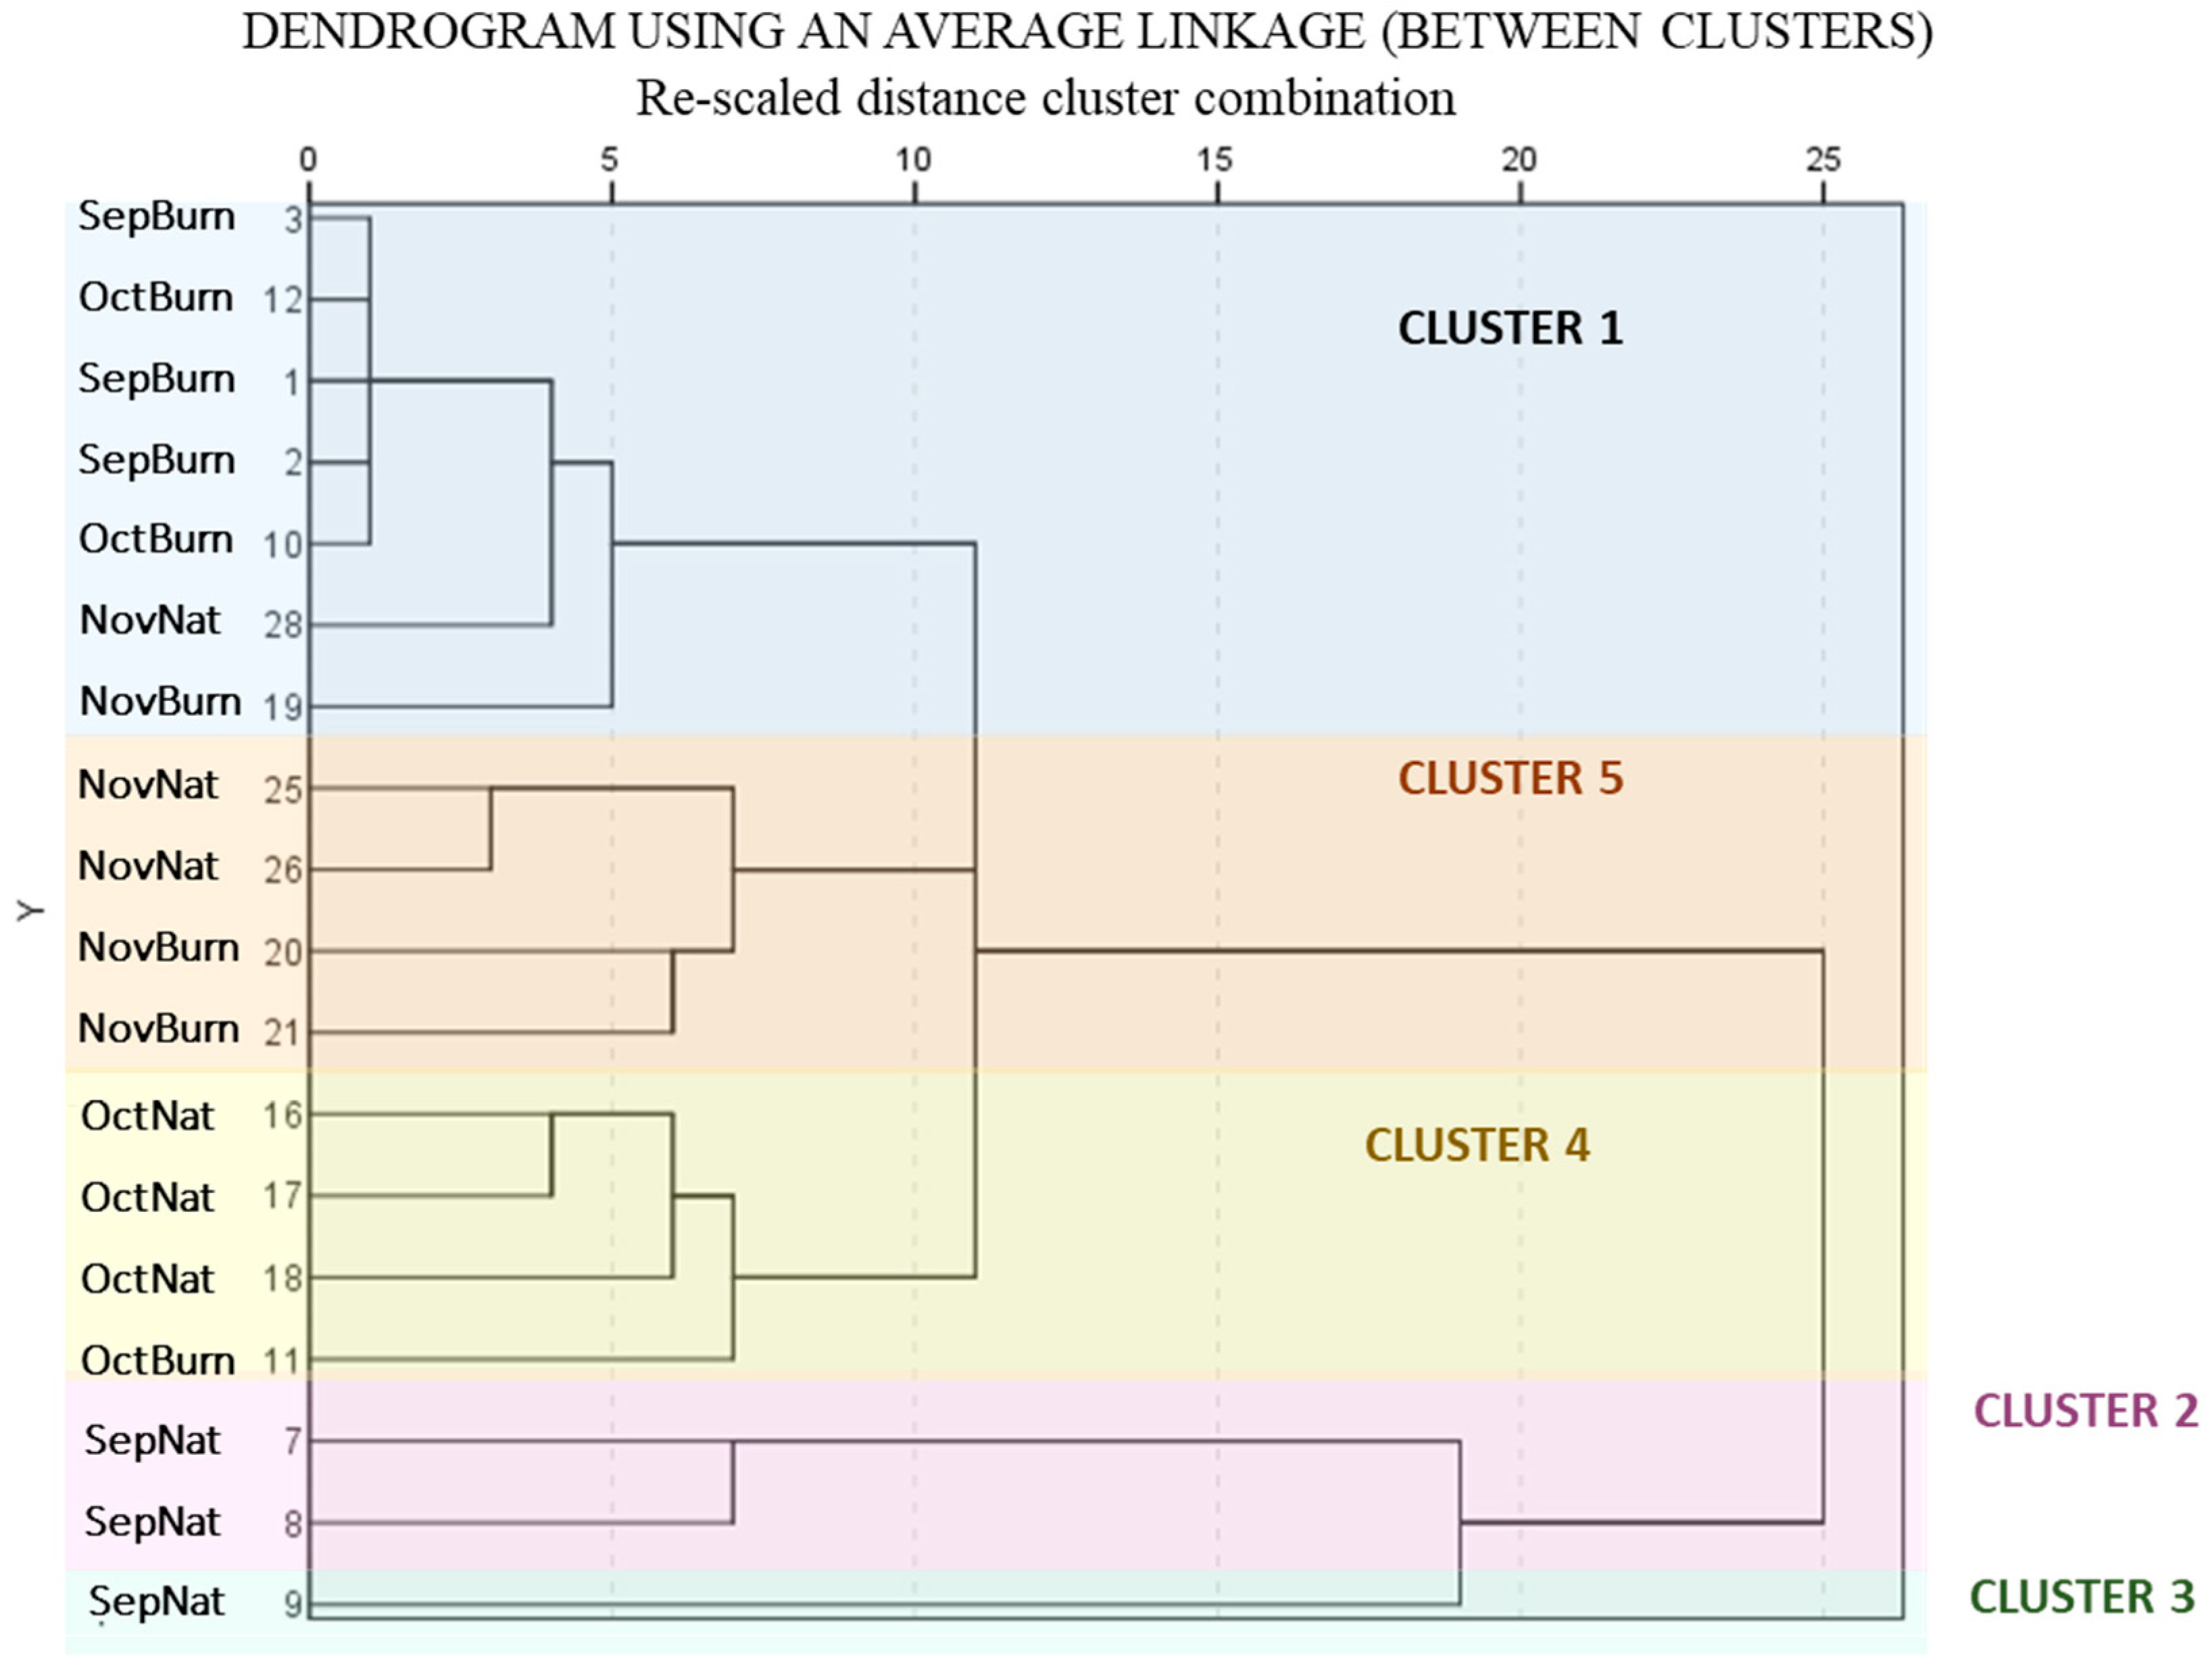
The hierarchical classification based on Euclidean distance, which has been performed with the numerical data of the springtail communities, resulted in 5 clusters or groups (Figure 4). Cluster 1 (Burned) is mainly formed by the burned soil samples, gathering all the September samples, two October samples and one November sample. This cluster also includes a sample from the natural pine forest in November that stands out for containing a low number of springtails. This data can be considered quite normal due to the irregular distribution patterns of collembolans.
The natural pine forest samples collected in September are in clusters 2 and 3 (SeptNat), possibly separated because cluster 3 has a higher abundance of Folsomia pyrenaea and no individuals of the species Mesaphorura macrochaeta or Isotomurus fucicolus (Table 4). Cluster 4 (Oct) groups samples from October only, mixing the three samples from the natural pine forest with one from the burned pine forest. Finally, cluster 5 (Nov) includes only November samples, indicating similarities this month between those from the natural pine forest and two from the burned pine forest.
After analysis of variance (ANOVA), the variables Mesaphorura macrochaeta, Folsomia pyrenaea and Isotomurus fucicolus are the ones that show significantly different means between clusters (Table 4).
  • Mesaphorura macrochaeta: has the smallest mean in cluster 1 (B) and the highest in cluster 5 (Nov).
  • Folsomia pyrenaea: shows the lowest mean in cluster 1 (B). The highest means are in clusters 2 and 3 (SepNat), gradually decreasing in clusters 4 (Oct) and 5 (Nov).
  • Isotomurus fucicolus: is not present in cluster 1 (B) and its mean decreases consecutively in clusters 2 (SepNat), 4 (Oct) and 5 (Nov).

3.2.4. Principal Component Analysis

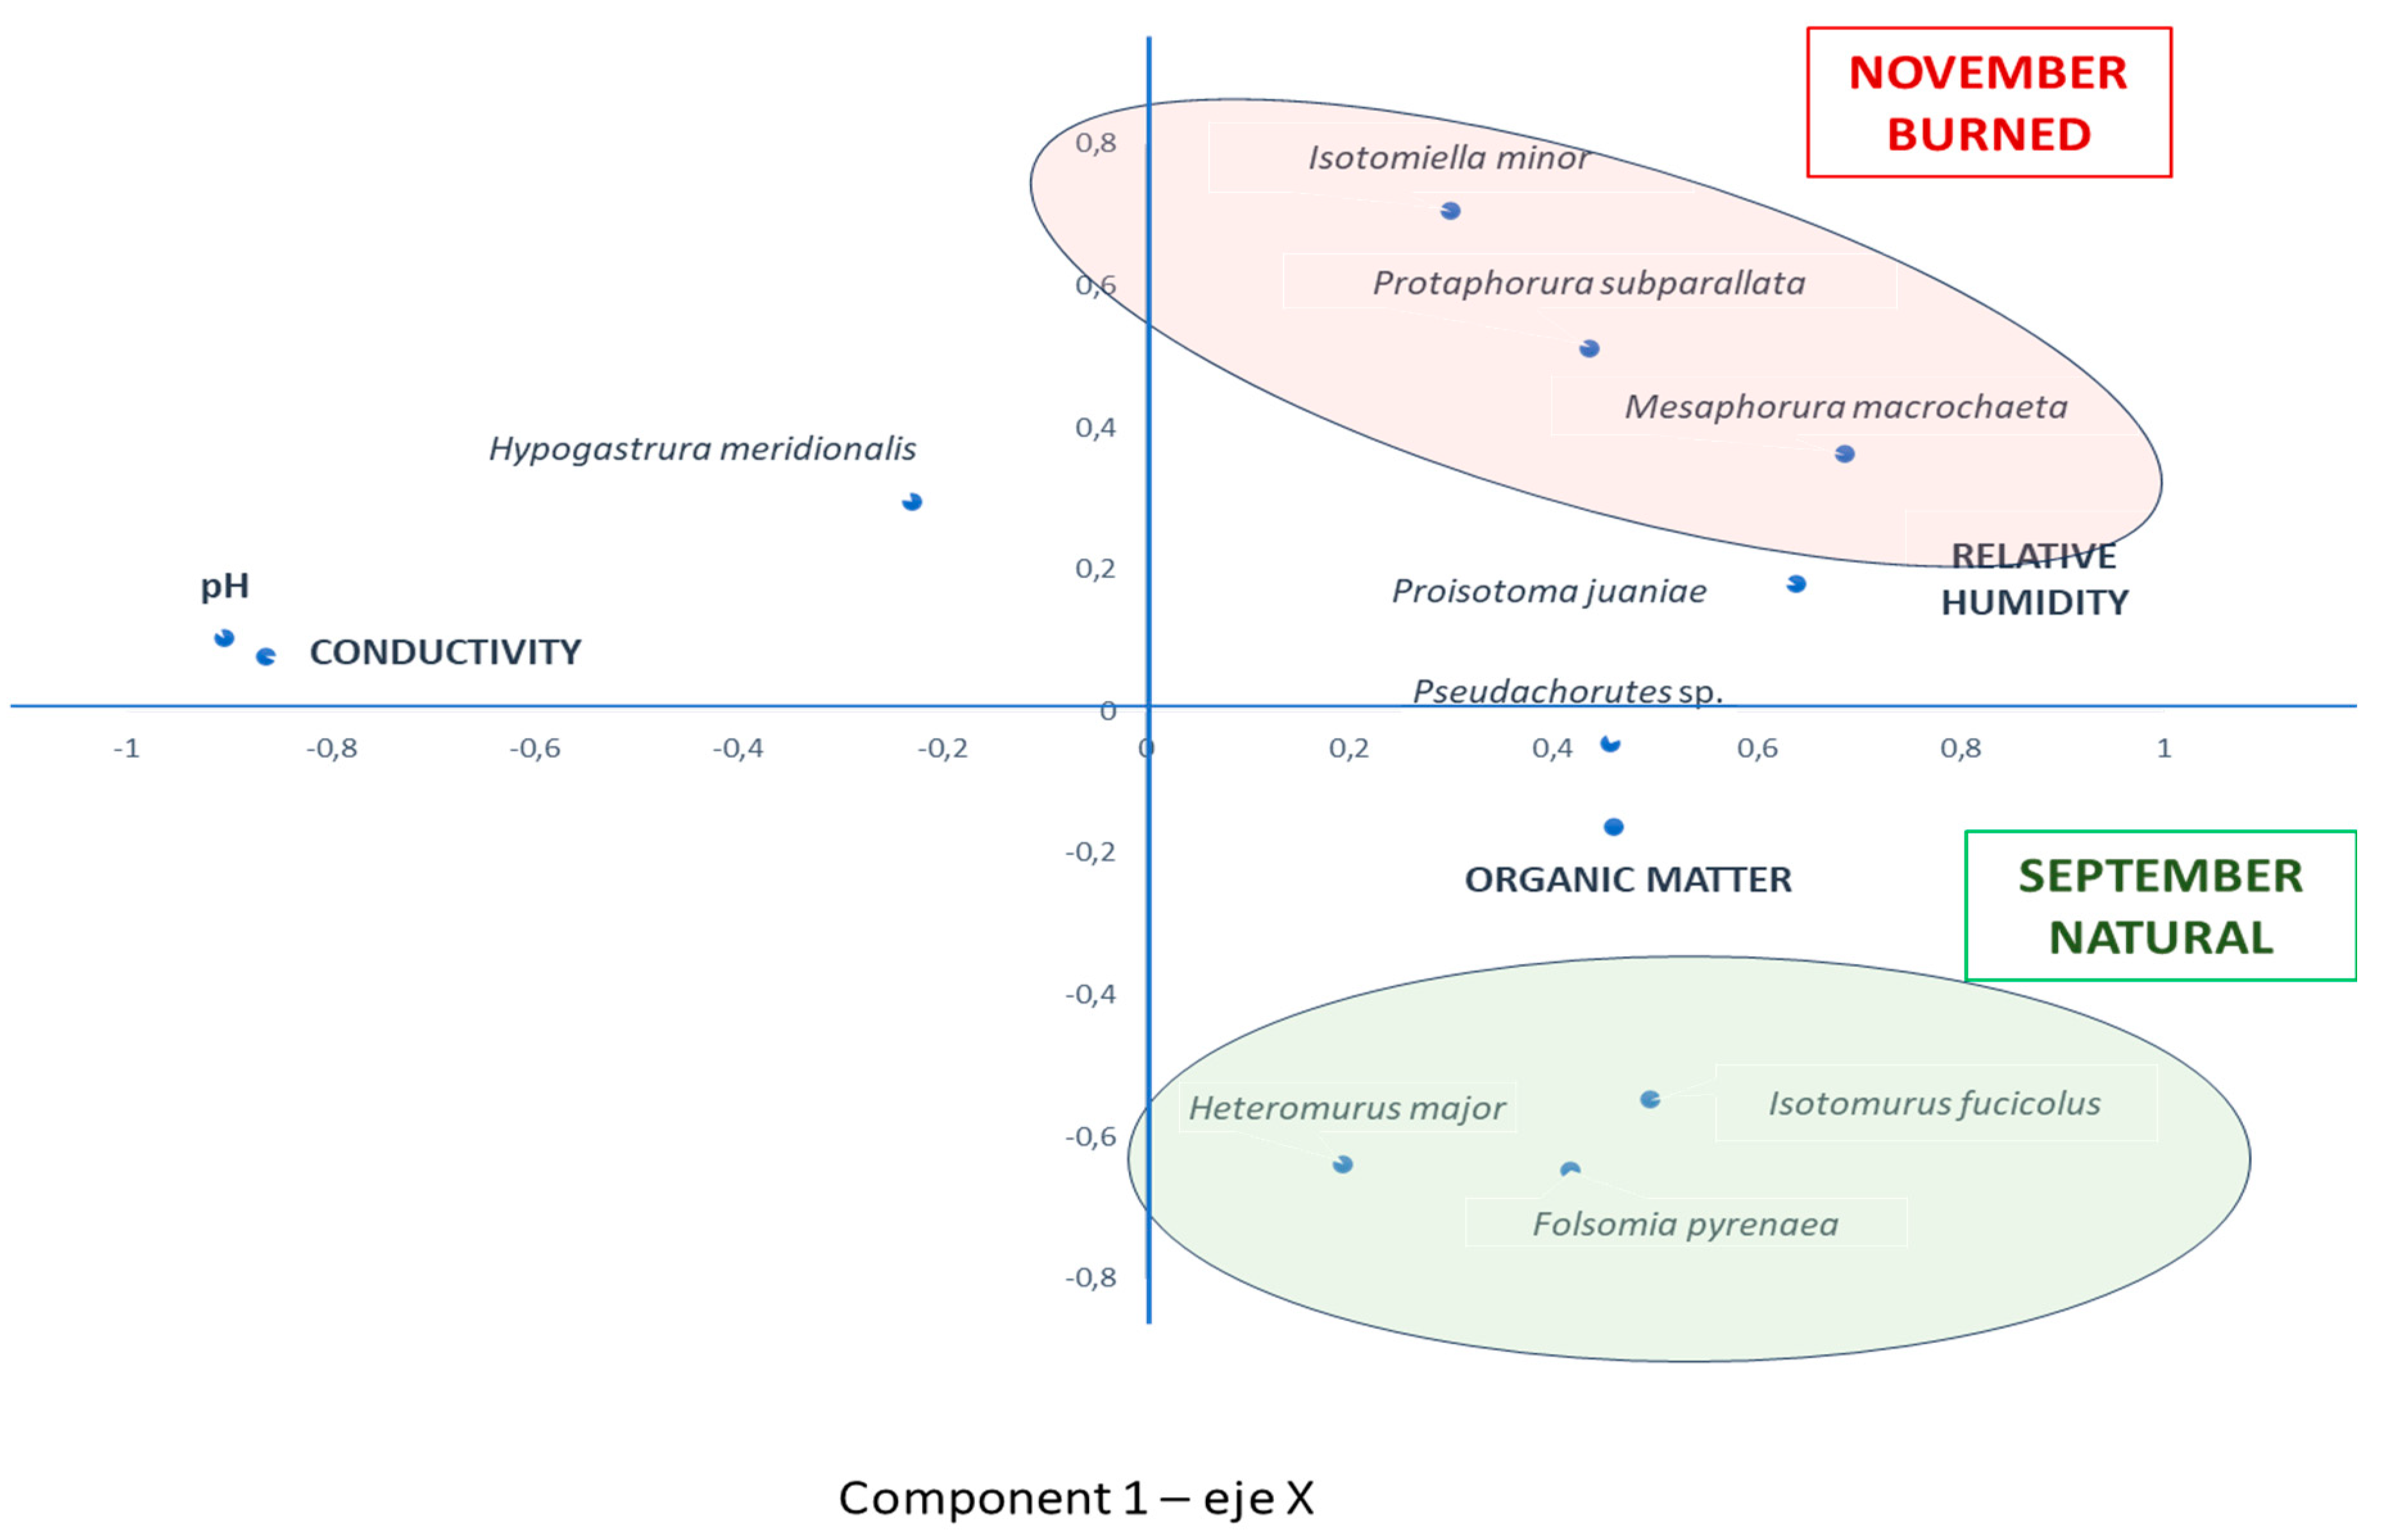
A principal component analysis (PCA) was performed on the numerical data of the species encountered. The results for components 1 and 2, plotted on the X and Y axes respectively, are shown in the graph in Figure 5. Component 1 absorbs 33.8% of the variance, and component 2 absorbs 17.17%.
A group of species distributed in the positive values of the X-axis and negative values of the Y-axis is observed, which are those that make up the predominant community in September in the natural forest. It is made up of the species H. major, I. fucicolus and F. pyrenaea. The rest of the species appear in October and November, or increase notably their population in these months. Component 2 presents in the most positive values of the Y-axis the most important species in the burned forest in November: M. macrochaeta, P. subparallata and I. minor. These last two together with P. juaniae and F. pyrenaea dominate in November, both in the burned soil and in the natural forest. The species present in both soils in this season are therefore the same, with the exception of H. meridionalis, which appears in the natural forest, and never in the burned forest.
The relative humidity and organic matter variables are related to these species groupings. At the opposite extreme, and independently of the species, pH and conductivity are distributed in the plane, which therefore do not seem to affect the distribution of species in the ecosystems studied.
The graphical representation shows, therefore, a clear separation between the initial communities of burned and natural soil.

4. Discussion

In this work we have been able to verify both hypotheses by studying the initial state of the soil after the fire and by analyzing the early effects of hydrological-forest restoration.
The study of the physical-chemical parameters showed that they differed significantly between the natural pine forest and the burned one due to the effects of the fire. As expected, the soil of the burned pine forest had a lower percentage of organic matter (OM) and relative humidity. The black color of the ashes confirmed that the combustion of the OM was partial, so the fire temperatures must have been around 300-400ºC (Iglesias et al. 1998). These high temperatures, the summer drought typical of the Mediterranean climate and the lower percentage of OM explain the lower relative humidity of the soil after the fire. In addition, the burned soil had higher pH and electrical conductivity values due to the presence of ashes (Iglesias et al. 1997). These soil characteristics and the fire itself disturbed the edaphic fauna, recording in September a very low number of springtails compared to the natural pine forest.
The second hypothesis considered that during the soil restoration project some of the physicochemical parameters would change and that these changes would be reflected in the springtail populations. It was found that throughout the study the relative humidity increased in the soil of the burned pine forest due to rainfall in October and November. On the other hand, the electrical conductivity decreased. Some authors such as Mataix-Solera and Guerrero (2007) point out that the rapid reestablishment of normal values of the latter parameter is due to the decrease in the amount of ashes due to wind erosion. The parameters O.M. and pH did not show significant changes between the different sampling months. This invariability of the O.M. demonstrates the efficiency of the containment terraces against water erosion, a process promoted by the absence of vegetation after the fire and the steep slope of the area. It is known that the recovery of pH values is a longer time scale process that depends on the formation of new humus, the washing of basic ions and the buffering capacity of the soil, having taken up to 50 years in some studies (Mataix-Solera and Guerrero 2007).
In addition, the hydrophobicity of the burned soil has decreased compared to the strong water repellency characteristic of pine forest soils. This type of vegetation contributes hydrophobic compounds to the soil that can disappear from the surface horizons due to fires with temperatures between 280 and 400ºC (Jaramillo 2006). The subsequent condensation of these compounds in deeper and cooler horizons can create a hydrophobic layer that increases the risk of surface runoff and erosion, accentuating the importance of retaining terraces (Jaramillo 2006, Mataix-Solera and Guerrero 2007).
Post-fire faunal communities appear to be configured by individuals of species that survived and by others that recolonized the burned area from the unaffected pine forest (Gongalsky et al. 2012). Springtails were the only group of the collected mesofauna that showed significant correlations with all the physicochemical parameters studied, proving to be good bioindicators of soil characteristics.
The number of individuals and species of springtails increased considerably on the burned pine forest floor over time, matching the richness of the natural pine forest communities. Diversity indices have shown that springtail populations became more diverse and equitable in both pine forests, reaching even higher diversity in the burned pine forest. The population changes that also occurred in the natural pine forest show the seasonal variation of the colembofauna (Luciáñez and Simón 1991).
These changes marked by seasonality are again observed in the hierarchical classification based on springtail communities. This analysis separated the samples from the natural pine forest according to the month to which they belonged: September-clusters 2 and 3, October-cluster 4 and November-cluster 5. The analysis of variance carried out subsequently showed that the abundance of Folsomia pyrenaea decreased in the natural pine forest from September to November and that the abundance of Mesaphorura macrochaeta, on the contrary, increased. The separation of the September natural pine forest samples into clusters 2 and 3 may be due to the absence of Mesaphorura macrochaeta and Isotomurus fucicolus specimens in one of them. These data would indicate that the natural distribution of springtails may follow an irregular pattern of presence, concentrating in patches according to the microhabitats of the heterogeneous soil.
The hierarchical classification also shows the greater similarities between the springtail populations of the natural and burned pine forest over time, since clusters 4 (Oct) and 5 (Nov) include respectively one and two samples from the burned pine forest together with those from the natural pine forest.
It is worth mentioning that a November sample from the burned pine forest and another from the natural one were grouped in cluster 1 (Q) together with all the burned ones from September and some from October, showing that both the restocking of a burned soil and the distribution of springtails in an undisturbed soil are heterogeneous. Samples from this cluster had the lowest moisture values and the highest conductivity and pH, persistent effects of the fire. This cluster is characterized by the absence of Isotomurus fucicolus and the low number of individuals of Mesaphorura macrochaeta and Folsomia pyrenaea, being its most representative species Protaphorura subparallata, an euedaphic species endemic to the Central System that would have survived the fire because it inhabits a greater depth.
The results of the principal component analysis ratify the results expressed in the hierarchical classification.
As the number of springtails increased in the burned pine forest despite the fact that the percentage of OM did not vary significantly between sampling months, it can be deduced that initially the growth of populations was limited by the low relative soil moisture after the summer drought and the fire. However, it should be noted that a higher amount of OM in the soil would increase the water retention capacity, and would favor the recovery of edaphic fauna and vegetation after the replanting of this study area with Pinus pinaster (Mataix-Solera and Guerrero 2007).
Some studies suggest alternative restoration actions such as the application of compost amendments to increase the amount of OM and point out the importance of containment terraces (Gómez-Sánchez et al. 2019; González-Polo et al. 2020). The extraction of burned wood is considered by some authors as a management that further degrades the soil by the use of heavy machinery in a vulnerable area (Mataix-Solera et al. 2015). In this study, after the removal and burning of wood the mean OM decreased slightly in the burned soil, although this was not a significant change according to the analysis of variance. Other more long-term effects of this action are the elimination of a reservoir of nutrients and OM that could be incorporated into the soil if this burned wood were not extracted (Castro et al. 2006). Finally, other authors criticize fire suppression as the main long-term strategy and propose controlled recovery of natural fire regimes (Alcasena et al. 2019; Moritz et al. 2014).
From all of the above, it can be concluded that the two starting hypotheses of this work have been verified.

5. Conclusions

In this work we have studied in the short term the beginning of the edaphic recovery of a burned pine forest of Pinus pinaster in Cerro del Castillo (Sierra de Guadarrama) in which a hydrological-forestry restoration was being carried out. As conclusions, the following stand out:
(1)
The effects of the fire on the physicochemical parameters of the soil have consisted of a lower amount of organic matter and water, and a higher pH and conductivity compared to the natural pine forest. During this study of soil recovery, only two parameters varied in the burned pine forest: relative humidity increased and electrical conductivity decreased. The invariability of the OM percentage in spite of the heavy rains has confirmed the effectiveness of the containment terraces.
(2)
The communities of the edaphic fauna of the burned pine forest have increased their diversity and equity with the passage of time, but have not reached the values typical of the natural pine forest. The greater abundance of mites in the burned pine forest is noteworthy.
(3)
The populations of springtails have changed considerably during this short-term study, matching the richness and even reaching a higher diversity than that of the natural pine forest communities. In addition, greater similarities have been observed between the springtail populations of the natural and burned pine forest over time, specifically in samples with physicochemical parameters closer to those of the natural pine forest.

Funding

This research received no external funding.

Conflicts of Interest

The authors declare no conflict of interest.

References

  1. Alcasena, F.J.; Ager, A.A.; Bailey, J.D.; Pineda, N.; Vega-García, C. Towards a comprehensive wildfire management strategy for Mediterranean areas: Framework development and implementation in Catalonia, Spain. J Environ. Manag. 2019, 231, 303–320. [Google Scholar] [CrossRef]
  2. Arbea, J.I. Checklist de Fauna Ibérica. Clase Collembola Lubbock, 1870 (Hexapoda) en la Península Ibérica, Islas Baleares y Macaronesia (edición 2021). In Documentos Fauna Ibérica; Ramos, M.A. and Sánchez Ruiz, M., Ed.; Museo Nacional de Ciencias Naturales CSIC: Madrid, 2021; Volume 16, 2 (sn) + 41 pp. [Google Scholar]
  3. Arbea, J.; Blasco Zumeta, J. Ecología de los Colémbolos (Hexapoda, Collembola) en Los Monegros (Zaragoza, España). Bol. Soc. Entom. Aragonesa (B.S.E.A.) 2001, 28, 35–48. [Google Scholar]
  4. Arbea, J.I.; Almeida, J. Catálogo de los colémbolos de la Península Ibérica, Baleares y Canarias a partir de fotografías en la naturaleza (Hexapoda, Collembola). Soc Entom Aragonesa, 2022; Monografías electrónicas S E A 10 (30-VI-2022). [Google Scholar]
  5. Arbea, J.I.; Baquero, E.; Beruete, E.; Pérez Fernández, T.; Jordana, R. Catálogo de los Colémbolos cavernícolas del área Iberobalear e islas Macaronésicas septentrionales (Collembola). Bol Soc Entom Aragonesa (B.S.E.A.) 2021, 68, 1–80. [Google Scholar]
  6. Arpin, P. : Ponge, J.F.; Dabin, B.; Mori, A. Utilisation des nématodes Mononchida et des collemboles pour caractériser des phénomènes pédobiologiques. Rev Ecol Biol Sol 1984, 21, 243–268. [Google Scholar]
  7. Ayuntamiento de Collado Mediano. Flora y Fauna. El Cerro del Castillo. 2023. Available online: https://www.aytocolladomediano.es/Tu-Ciudad/Entorno-Natural/Flora-y-Fauna/El-Cerro-Del-Castillo.
  8. Bardgett, R. Causes and consequences of biological diversity in soil. Zoology 2002, 105, 367–375. [Google Scholar] [CrossRef]
  9. Bisdom, E.B.A.; Dekker, L.W.; Schoute, J.F.Th. Water repellency of sieve fractions from sandy soils and relationships with organic material and soil structure. Soil Structure/Soil Biota Interrelationships 1993, 105–118. [Google Scholar] [CrossRef]
  10. Brevik, E.C.; Cerdà, A.; Mataix-Solera, J.; Pereg, L.; Quinton, J.N.; Six, J.; Van Oost, K. The interdisciplinary nature of soil. SOIL 2015, 1, 117–129. [Google Scholar] [CrossRef]
  11. Campo Sanchís, A. La restauración arbórea del monte incendiado en Collado Mediano el año 2009. Foresta Especial La Comunidad de Madrid 2011, 52, 158–160. [Google Scholar]
  12. Castellnou, M.; Guiomar, N.; Rego, F.; Fernandes, P.M. Fire growth patterns in the 2017 mega fire episode of October 15, Central Portugal. In: D X Viegas (Ed.), Advances in forest fire research 2017, ch. 3 Fire management, Universidade de Coimbra: 447-453. [CrossRef]
  13. Castro, J.; Maranon-Jimenez, S.; Sánchez-Miranda, A.; Lorite, J. Efecto del manejo de la madera quemada sobre la regeneración forestal post-incendio: desarrollo de técnicas blandas de restauración ecológica. Proyectos de Investigación en Parques Nacionales, 2006–2009. 139–157.
  14. Chauvat, M.; Zaitsev, A.S.; Wolters, V. Successional changes of Collembola and soil microbiota during forest rotation. Oecologia 2003, 137, 269–276. [Google Scholar] [CrossRef]
  15. Collins, B.M.; Miller, J.D.; Thode, A.E.; Kelly, M.; van Wagtendonk, J.W.; Stephens, S.L. Interactions among wildlandfires in a long-established Sierra Nevada natural fire area. Ecosystems, 2008, 12, 114–128. [Google Scholar] [CrossRef]
  16. Consejería de Medio Ambiente, Vivienda y Agricultura. Actuaciones urgentes de restauración hidrológico-forestal sobre los terrenos del Mup. Na200 “Cerro del Castillo” afectados por el incendio. 2022; 3–13. [Google Scholar]
  17. Cowling, R.M.; Rundel, P.W.B.; Lamont, B.B.; Kalin Arroyo, M.; Arianoutsou, M. Plant diversity in mediterranean-climate regions. Trends Ecol. Evol. 1996, 11, 362–366. [Google Scholar] [CrossRef]
  18. . [CrossRef]
  19. FAO. Soil is a non-renewable resource Its preservation is essential for food security and our sustainable future. Food and Agriculture Organization of the United Nations, 2015; 4p. [Google Scholar]
  20. García-Orenes, F.; Arcenegui, V.; Chrenková, K.; Mataix-Solera, J.; Moltó, J.; Jara-Navarro, B.; Torres, M.P. Effects of salvage logging on soil properties and vegetation recovery in a fire-affected Mediterranean forest: A two year monitoring research. Sci. Total Environ. 2017, 586, 1057–1065. [Google Scholar] [CrossRef]
  21. Gómez-Sánchez, M.E.; Lucas-Borja, M.E.; Plaza-Álvarez, P.A.; González-Romero, J.; Sagra, J.; Moya, D.; de las Heras, J. Efecto de los trabajos de restauración forestal post-incendio en ladera sobre la recuperación de la funcionalidad del suelo. Cuadernos de la Sociedad Española de Ciencias Forestales, 2019, 45, 35–44. [Google Scholar]
  22. Gongalsky, K.B.; Malmström, A.; Zaitsev, A.S.; Shakhab, S.V.; Bengtsson, J.; Persson, T. Do burned areas recover from inside? An experiment with soil fauna in a heterogeneous landscape. Appl. Soil Ecol. 2012, 59, 73–86. [Google Scholar] [CrossRef]
  23. González Ulibarry, P. Impacto de los incendios forestales en suelo, agua, vegetación y fauna. Departamento de estudios, extensión y publicaciones. Biblioteca del Congreso Nacional de Chile 2017, 1–8. [Google Scholar]
  24. González-Polo, M.; Agüero, M.; Castán, E. Enmienda con compost y fertilización de suelos afectados por incendios: Respuesta de dos especies nativas de la Patagonia bajo condiciones de invernadero. Ecol. Austr. 2020, 30, 366–379. [Google Scholar] [CrossRef]
  25. Holden, Z.A.; Morgan, P.; Evans, S. Apredictive model of burn severity based on 20-yearsatellite-inferred burn severity data in a largesouthwestern US wilderness area. Forest Ecol. Manag. 2009, 258, 2399–2406. [Google Scholar] [CrossRef]
  26. Iglesias, T.; Cala, V.; Gonzalez, J. Mineralogical and chemical modifications in soils affected by a forest fire in the Mediterranean area. Sci. Total Environ. 1997, 204, 89–96. [Google Scholar] [CrossRef]
  27. Iglesias, T.; Cala, V.; Walter, I.; González, J. Efectos de la temperatura y vegetación en suelos calentados en condiciones controladas de laboratorio. Ecologia 1998, 12, 105–111. [Google Scholar]
  28. ISO 11465:1993; Determination of dry matter and water content on a mass basis. Gravimetric method (pp. 1–3). Technical Committee: ISO/TC 190/SC 3 Chemical and physical characterization. 1993.
  29. Jaramillo, D.F. Repelencia al agua en suelos: una síntesis. Rev Acad Colomb Cienc Exactas Fis Nat. 2006, 30, 215–232. [Google Scholar] [CrossRef]
  30. Jordana, R.; Arbea, J.I. Clave de identificación de los géneros de Colémbolos de España (lnsecta: Collembola). Servicio de Publicaciones de la Universidad de Navarra: Serie zoológica Pamplona. 1989, 19. [Google Scholar]
  31. Jordana, R.; Arbea, J.I.; Simón, J.C.; Luciáñez, M.J. Collembola, Poduromorpha. In Fauna Ibérica 8. Museo Nacional de Ciencias Naturales; Ramos, M.A., Ed.; CSIC: Madrid, 1997; 807p. [Google Scholar]
  32. Luciáñez, M.J.; Iniesto, P. Estudio faunístico y ecológico de las comunidades de Colémbolos (Hexapoda, Collembola) de pinares incendiados en la vertiente sur de la Sierra de Gredos. Bol AeE 2006, 30, 75–95. [Google Scholar]
  33. Luciáñez, M.J.; Simón, J.C. Estudio colembológico de un robledal y un pinar en la vertiente sur de la Sierra de Gredos. Eos 1988, 57–87. [Google Scholar]
  34. Luciáñez, M.J.; Simón, J.C. Estudio de la variación estacional de la colembofauna en suelos de alta montaña en la Sierra de Guadarrama (Madrid). Miscel Zool 1991, 15, 103–113. [Google Scholar]
  35. Martín, S.D.; Birk, E.L. The singular role ofthe atmospheric stability in forestfires. Atmósfera 2010, 23, 129–139. [Google Scholar]
  36. Mataix-Solera, J.; Guerrero, C. Efecto de los incendios forestales en las propiedades edáficas. - In: J Mataix-Solera (ed.): Incendios Forestales, Suelos y Erosión Hídrica. Caja Mediterráneo CEMACAM Font Roja-Alcoi. Alicante, 2007, 1, 7–40. [Google Scholar]
  37. Mataix-Solera, J.; Cerdà, A.; Arcenegui, V.; Jordán, A.; Zavala, L.M. Fire effects on soil aggregation: A review. Earth-Science Reviews, 2011; 109, 44–60. [Google Scholar] [CrossRef]
  38. Mataix-Solera, J.; Moltó, J.; Arcenegui, V.; García-Orenes, F.; Chrenkovà, K.; Torres, P.; Jara-Navarro, A.B.; Díaz, G.; Izquierdo, E. Salvage loggingeffect on soil properties in a fire-affected Mediterranean forest: two years monitoring research. Geophys. Res. Abstr. 2015, 17. EGU General Assembly. [Google Scholar]
  39. Moritz, M.A.; Batllori, E.; Bradstock, R.A.; Gill, A.M.; Handmer, J.; Hessburg, P.F.; Leonard, L.; McCaffrey, S.; Odion, D.C.; Schoennagel, T.; Syphard, A.D. Learning to coexist with wildfire. Nature, 2014, 515, 58–66. [Google Scholar] [CrossRef] [PubMed]
  40. Naveh, Z. The evolutionary significance of fire in the mediterranean region. Vegetatio 1975, 29, 199–208. [Google Scholar] [CrossRef]
  41. Osborne, J. Notes on the use of data transformations. Geophys. Res. Abstr. 2002, 8. [Google Scholar]
  42. Palacios-Vargas, J.G.; Mejía, B.E. Técnicas de colecta, montaje y preservación de microartrópodos edáficos. Universidad Nacional Autónoma de México, 2007; 72p. [Google Scholar]
  43. Pausas, J.G. Incendios forestales. Una visión desde la ecología. Catarata y CSIC Madrid, 2012; 128p. [Google Scholar]
  44. Pedrosa, I.; Juarros-Basterretxea, J.; Robles-Fernández, A.; Basteiro, J.; García-Cueto, E. Pruebas de bondad de ajuste en distribuciones simétricas, ¿qué estadístico utilizar? Univ. Psychol. 2015, 14, 245–254. [Google Scholar] [CrossRef]
  45. Ponge, J.F.; Gillet, F.; Dubs, E.; Fedoroff, L.; Haese, H.; Sousa, J.P.; Lavelle, P. Collembolan communities as bioindicators of land use intensification. Soil Biol. Biochem. 2003, 35, 813–826. [Google Scholar] [CrossRef]
  46. Potapov, M.B. Synopses on Palaearctic Collembola: Isotomidae. Staatliches Museum Für Naturkunde Görlitz 2001, 3. [Google Scholar]
  47. Rivas-Martínez, S. Memoria del mapa de series de vegetación de España ICONA. Ministerio de Agricultura, Pesca y Alimentación Madrid, 1987. [Google Scholar]
  48. Rothermel, R.C. A mathematical model forpredictingfire spread in wildland fuels; Department of Agriculture, Intermountain Forest and Range Experiment Station: Ogden, Utah, USA, 1972. [Google Scholar]
  49. Skinner, C.N.; Taylor, A.H.; Agee, J.K. Klamath Mountain bioregion. Pages 170–194 in Sugihara NG, van Wagtendonk JW, Shaffer KE, Fites-Kaufman J and Thode AE (Eds.). Fire in California’s ecosystems. The University of California Press: Berkeley, California, USA, 2006. [Google Scholar]
  50. Swift, R.S. Sequestration of carbon by soil. Soil Sci. 2001, 166, 858–871. [Google Scholar] [CrossRef]
  51. Trujillo-González, J.M.; Mahecha, J.D.; Torres-Mora, M. El recurso suelo; un análisis de las funciones, capacidad de uso e indicadores de calidad. Revista de Investigación Agraria y Ambiental (RIAA) 2018, 9, 29–36. [Google Scholar]
  52. Ubeda Cartañà, X.; Mataix-Solera, J.; Francos, M.; Farguell, J. Grandes incendios forestales en España y alteraciones de su régimen en las últimas décadas. In Geografía, Riscos e Protecao civil. Homenagen ao Professor doutor Luciano Lorenco; RISCOS-Associacao Portuguesa de Riscos, Prevencao e Seguranca, 2021. [Google Scholar] [CrossRef]
  53. von Saltzwedel, H.; Scheu, S.; Schaeffer, I. Genetic structure and distribution of Parisotoma Jnotabilis (Collembola) in Europe: Cryptic diversity, split of lineages and colonization patterns. PLoS One 2017, 12, e0170909. [Google Scholar] [CrossRef] [PubMed]
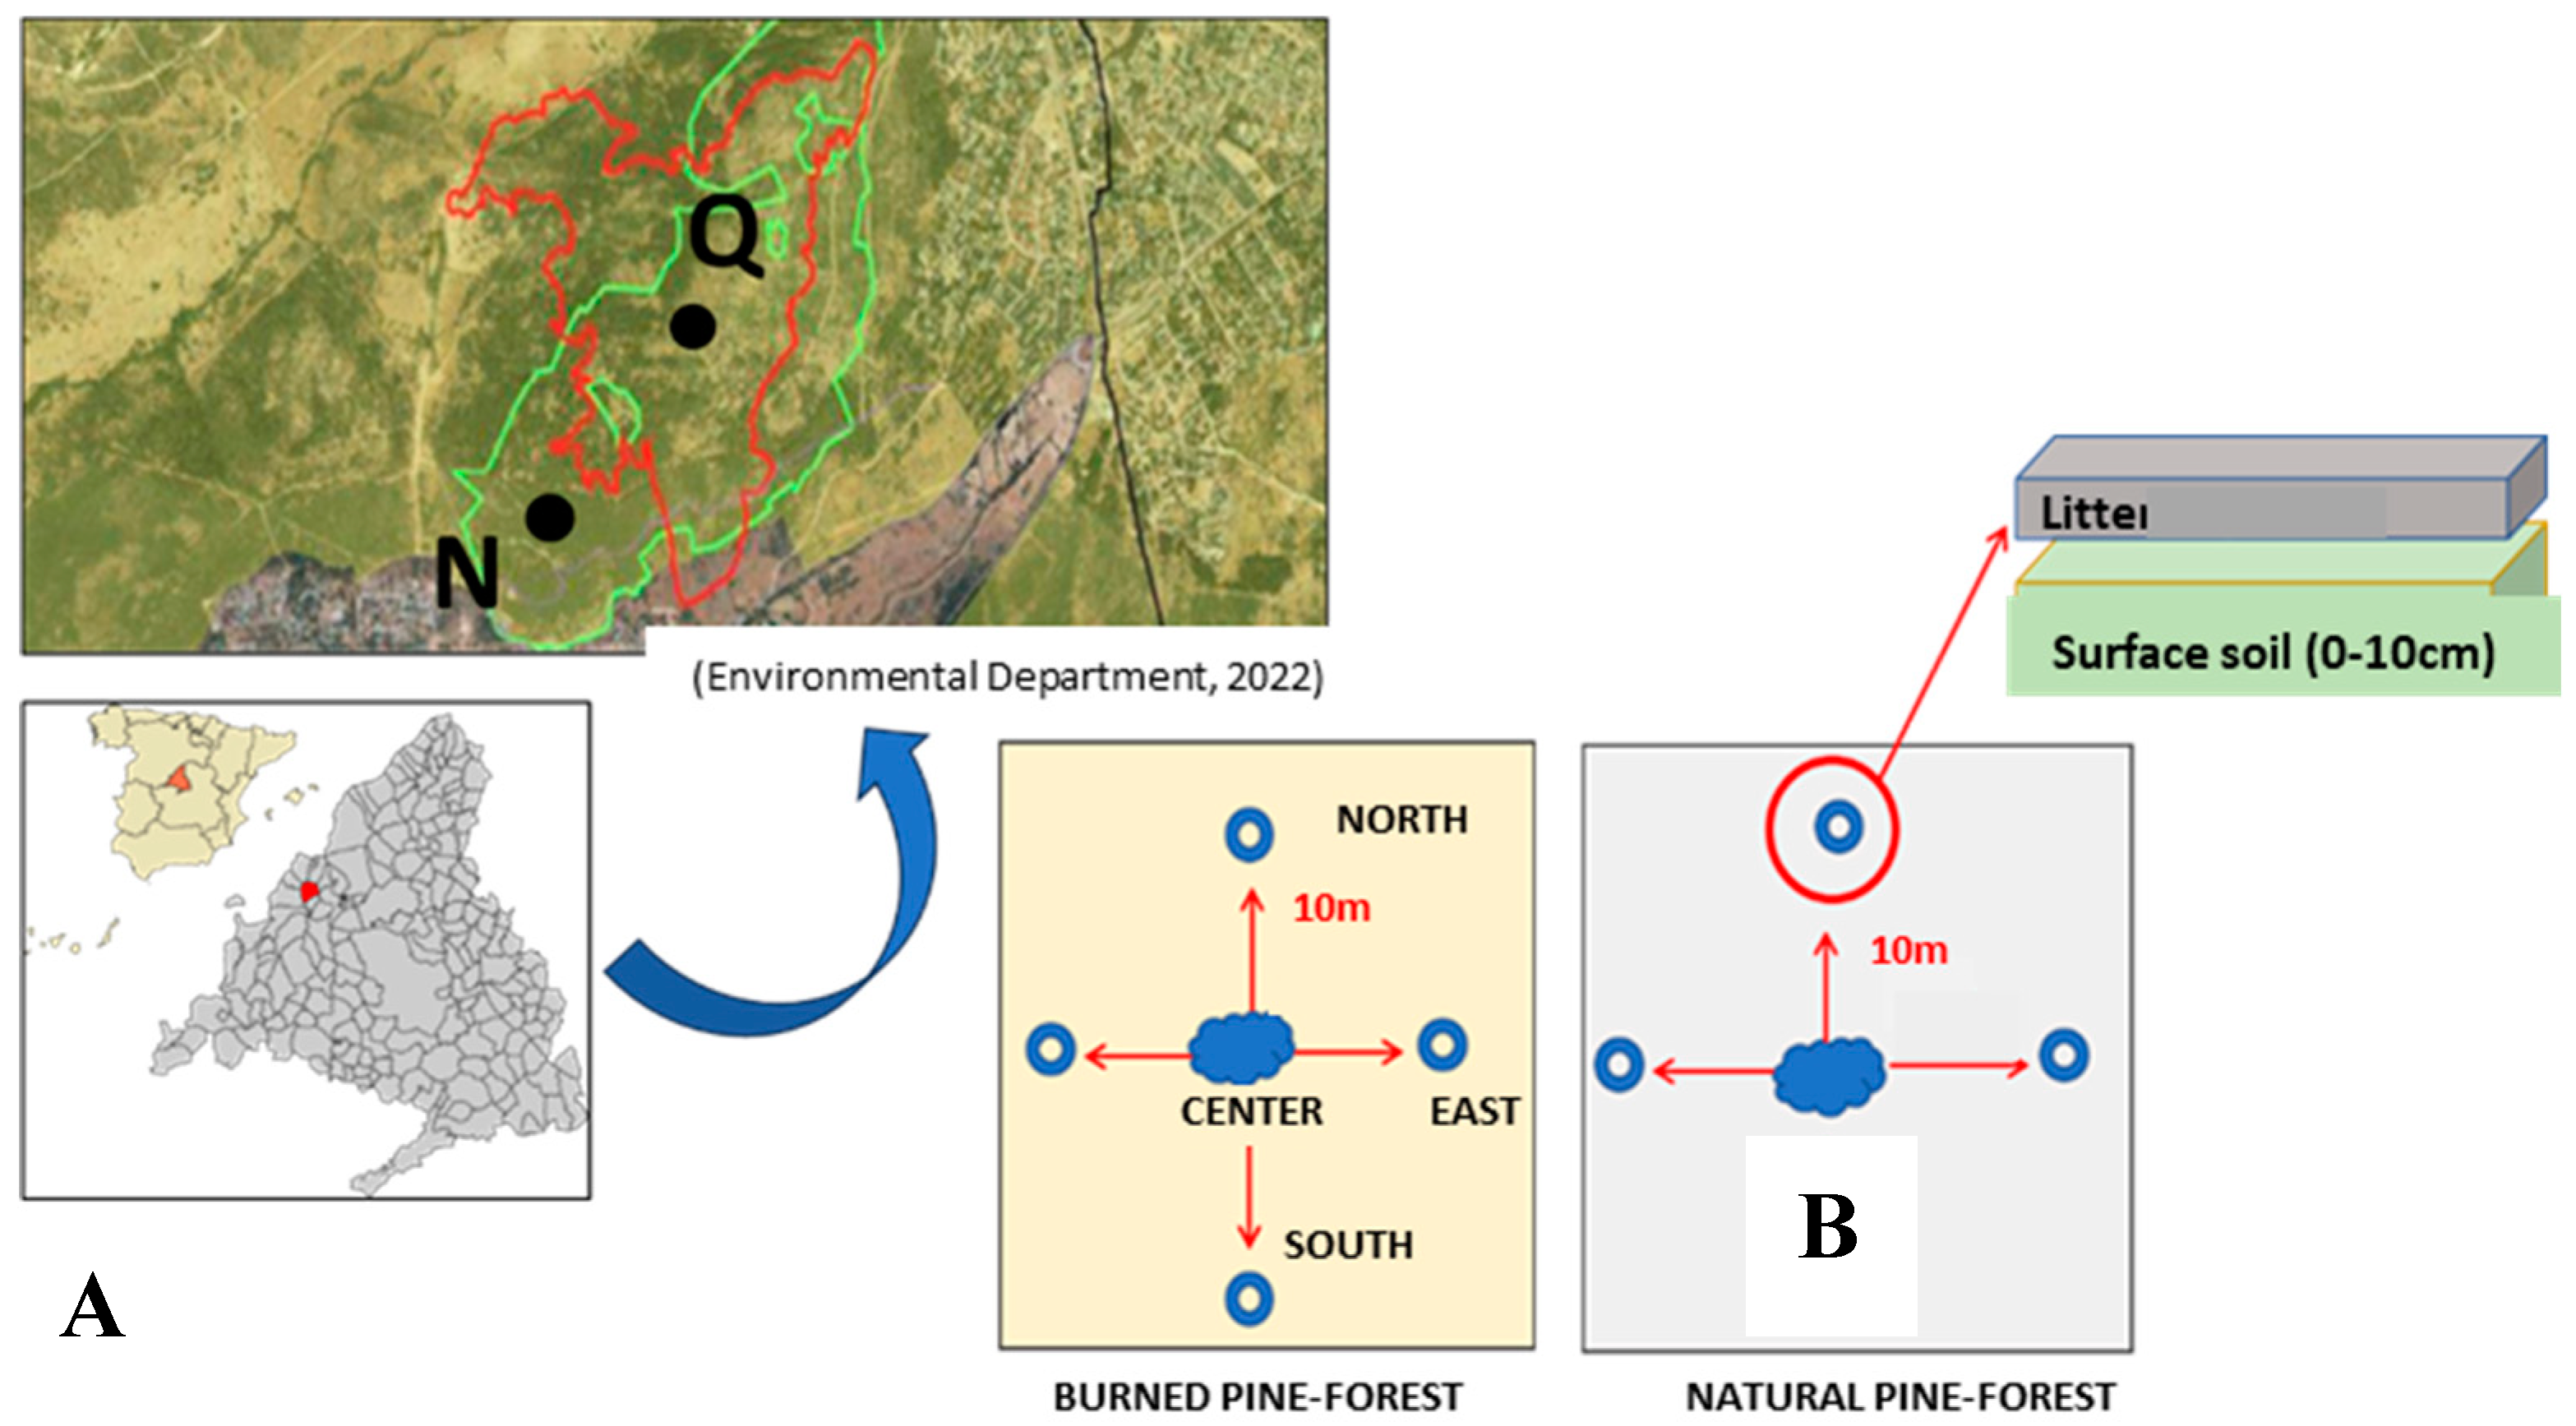
Figure 1. A. Satellite image of the location of the study area. The red line marks the fire area: N: sampling area in the natural pine forest, Q: area in the burned pine forest. B. Sampling design in each of the zones, indicating the sampling points and the levels of samples taken in each of them. In the burned pine forest, surface soil was sampled, except at the eastern point, where leaf litter was also sampled. In the natural pine forest, both levels were taken at all points.
Preprints 95909 g001
Figure 2. Representation of the means and standard deviations of the variables Conductivity, Humidity, O.M., and pH according to soil type (Burnt and Natural) in the months of September, October and November.
Preprints 95909 g002
Figure 3. Values of the indexes of diversity, richness, dominance and equity of springtails according to soil condition (Natural and Burned) in the months of September, October and November.
Preprints 95909 g003
Figure 4. Dendrogram based on the hierarchical classification of springtail species showing 5 groups or clusters grouping the samples.
Preprints 95909 g004
Figure 5. Graphical representation of the results of Principal Components Analysis.
Preprints 95909 g005
Table 1. Values of means and standard deviations of Burned and Natural soil samples for Conductivity, Moisture, OM, and pH, and ANOVA data (F and P-value) performed with the Logarithm of Organic Matter, the inverse of Conductivity, the inverse of pH, and the Square Root of Moisture.
Dependent variable Burned Mean ± SE Natural Mean ± SE F P-value
Conductivity 168.29 ± 69.7 81.36 ± 22.05 10.45 0.003
Moisture 6.74 ± 5.07 25.93 ± 12.45 36.279 0.000
O.M. 5.90 ± 2.33 11.53 ± 5.01 24.445 0.000
pH 7.09 ± 0.35 5.81 ± 0.34 56.342 0.000
Table 2. Means and standard deviations of the burned soils each month (Sept., Oct. and Nov.) for the variables Conductivity, Moisture, O.M. and pH. Also shown are the ANOVA data (F and P-value) and post-hoc comparisons of the Bonferroni test performed with the variables Conductivity, Moisture, Inverse of O.M. and pH. Significant differences between months are indicated as “≠” and absence of significant differences by “=”.
Dependent variable B-September Mean ± SE B-Octuber Mean ± SE B-November Mean ± SE F P-value Multiple comparisons
Conductivity 220.38 ± 39.82 183.48 ± 54.74 101.02 ± 55.61 7.3 0.008 O = S ≠ N = O
Moisture 1.19 ± 0.99 6.65 ± 1.31 12.39 ± 2.99 40.367 0.000 S ≠ O ≠ N
O.M. 6.65 ± 3.68 6.23 ± 1.55 4.82 ± 0.93 1.256 0.32 S = O = N
pH 7.24 ± 0.33 7.16 ± 0.29 6.87 ± 0.41 1.502 0.262 S = O = N
Table 3. Number of individuals of each species of Collembola recorded in each sample (B: burned, N: natural, C: center, S: south, N: north, second S: soil, L: litter).
Preprints 95909 i001
Table 4. Mean ± ES of springtail species that showed significant (p<0.05) differences between dendrogram clusters.
Dependent variable Cluster 1 Cluster 2 Cluster 3 Cluster 4 Cluster 5 F P-value
Mesaphorura macrochaeta 2.29± 6.0 16±12.72 0 8.75±6.95 40.25±6.99 19.451 0.000
Isotomurus fucicolus 0 4.5±2.12 0 2.5±2.38 1±1.16 5.112 0.011
Folsomia pyrenaea 0.14±0.38 100.50±6.37 181.00 45.00±1.75 13.25±9.18 186.723 0.000
Disclaimer/Publisher’s Note: The statements, opinions and data contained in all publications are solely those of the individual author(s) and contributor(s) and not of MDPI and/or the editor(s). MDPI and/or the editor(s) disclaim responsibility for any injury to people or property resulting from any ideas, methods, instructions or products referred to in the content.
Copyright: This open access article is published under a Creative Commons CC BY 4.0 license, which permit the free download, distribution, and reuse, provided that the author and preprint are cited in any reuse.
Alerts
Prerpints.org logo

Preprints.org is a free preprint server supported by MDPI in Basel, Switzerland.

Subscribe

© 2025 MDPI (Basel, Switzerland) unless otherwise stated