Submitted:
09 January 2024
Posted:
10 January 2024
You are already at the latest version
Abstract
Keywords:
1. Introduction
2. Literature review
3. Analysis strategy
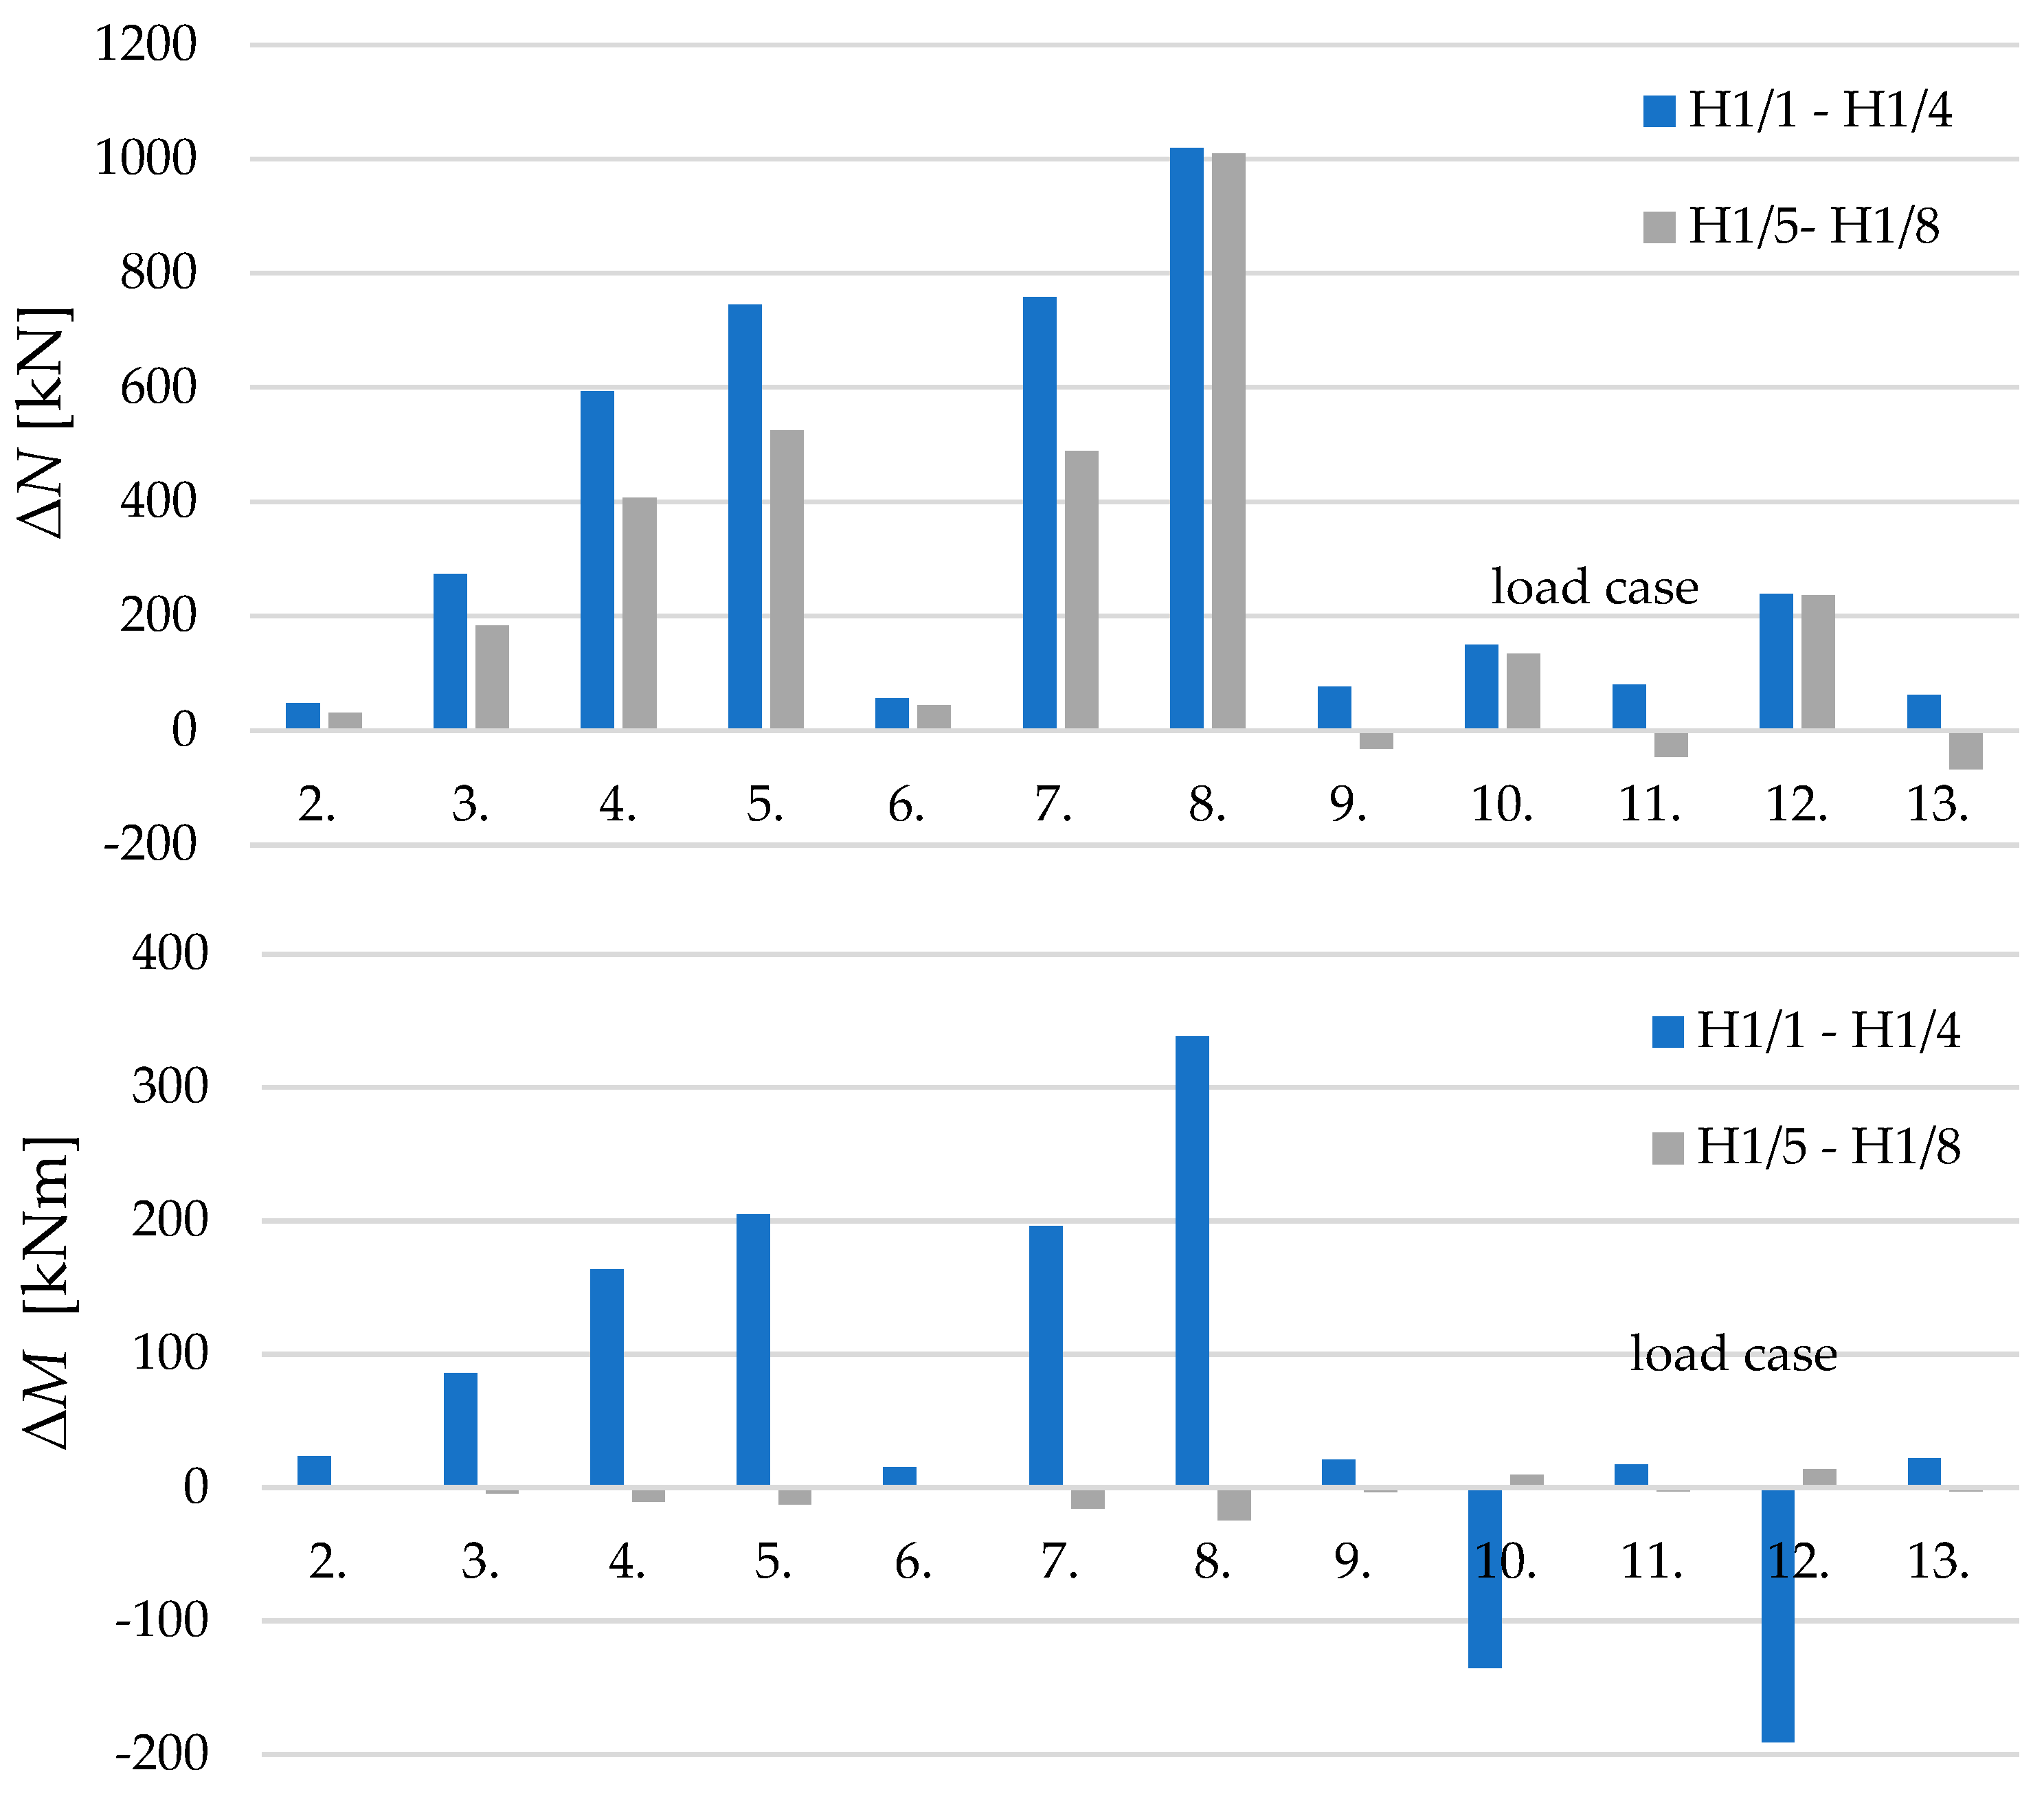
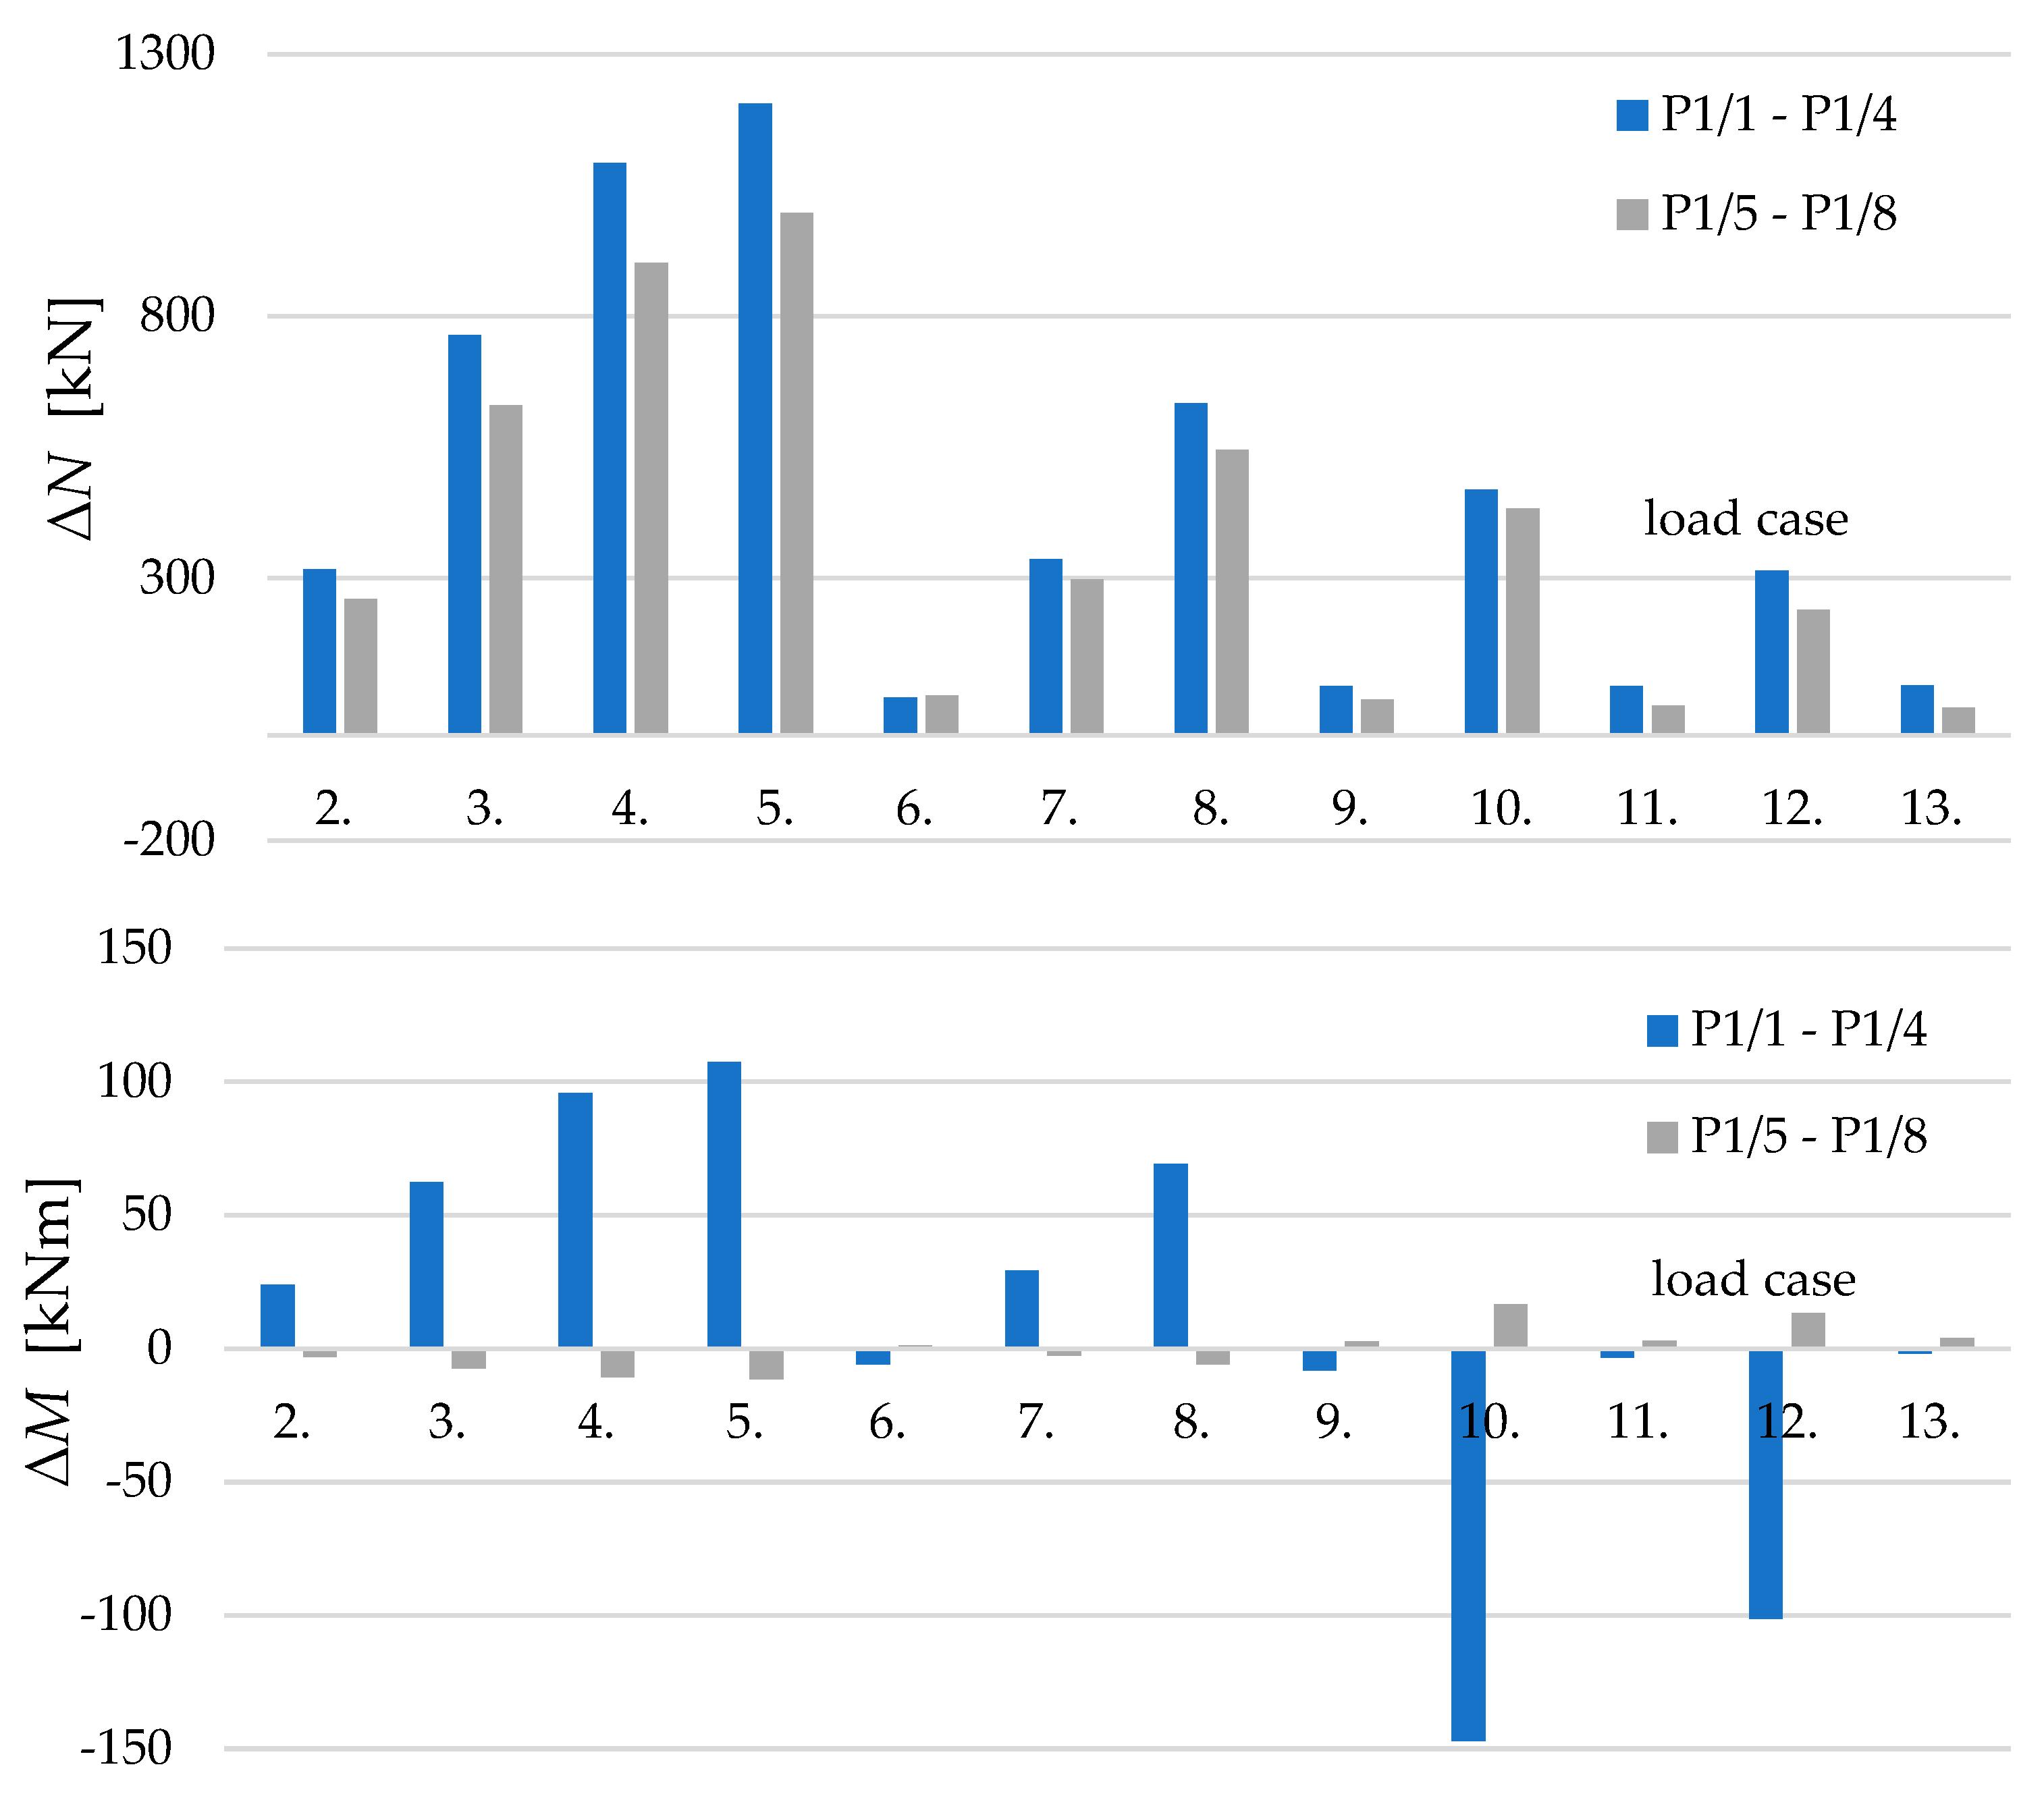
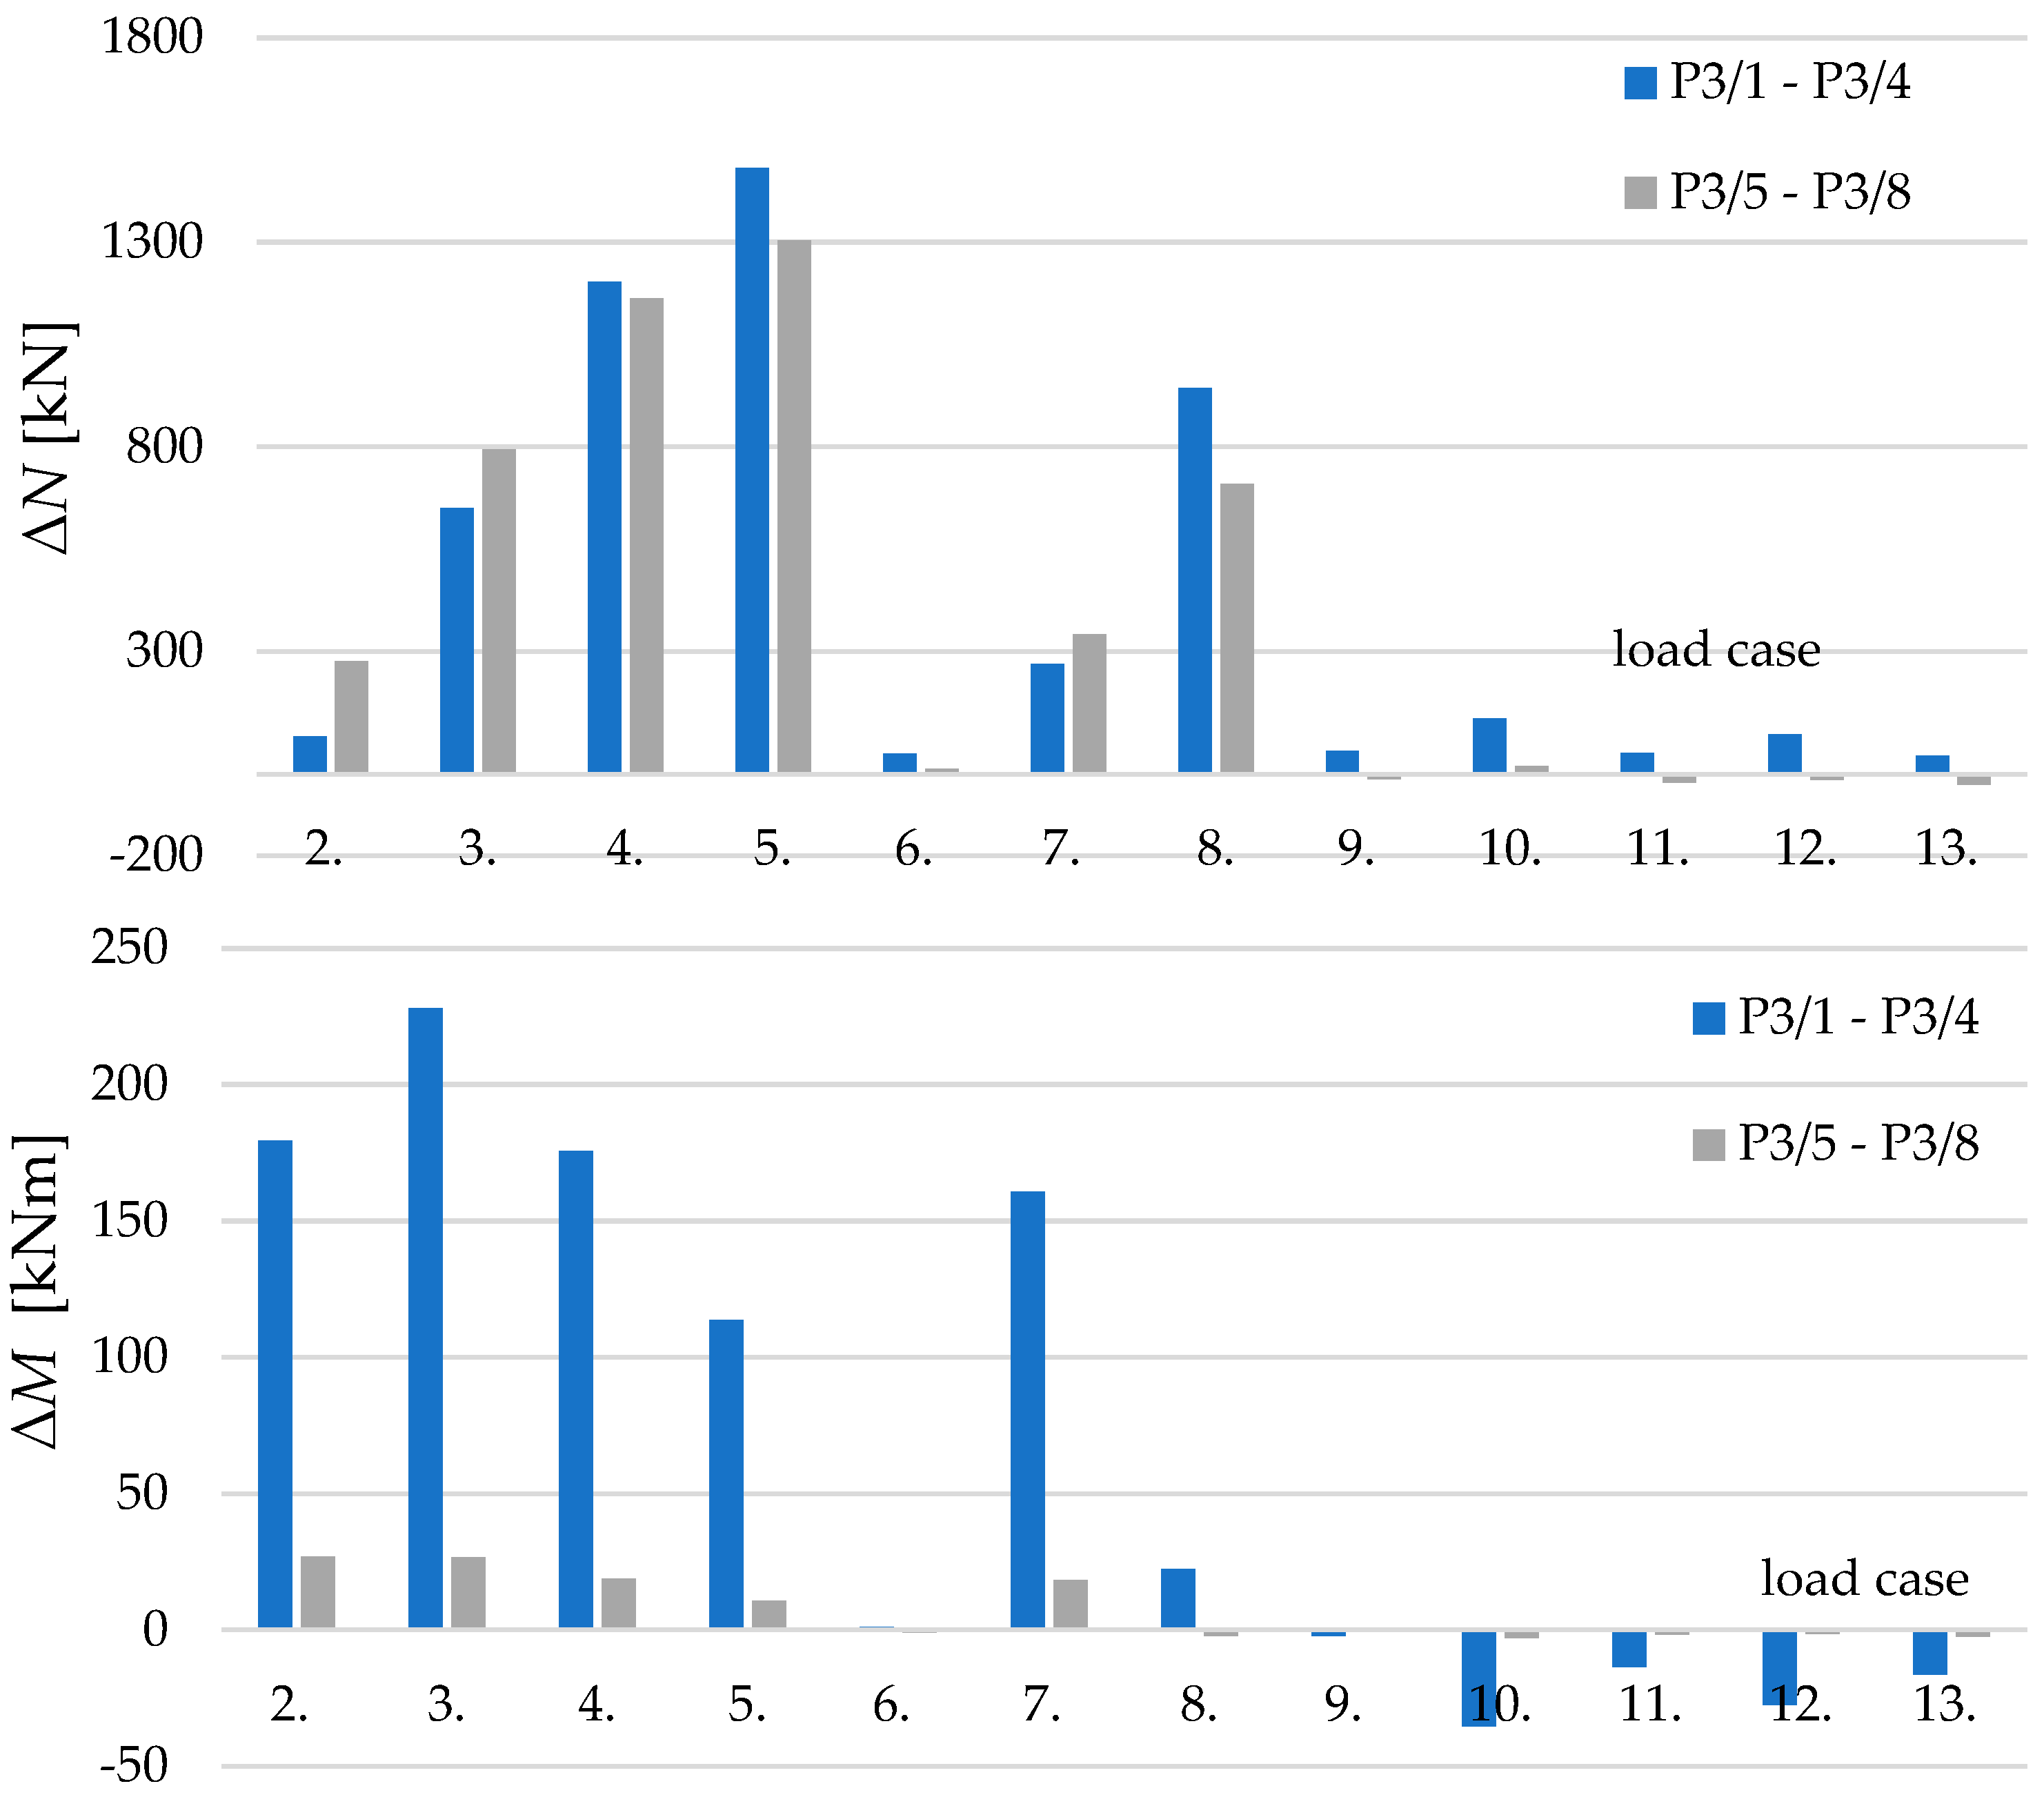
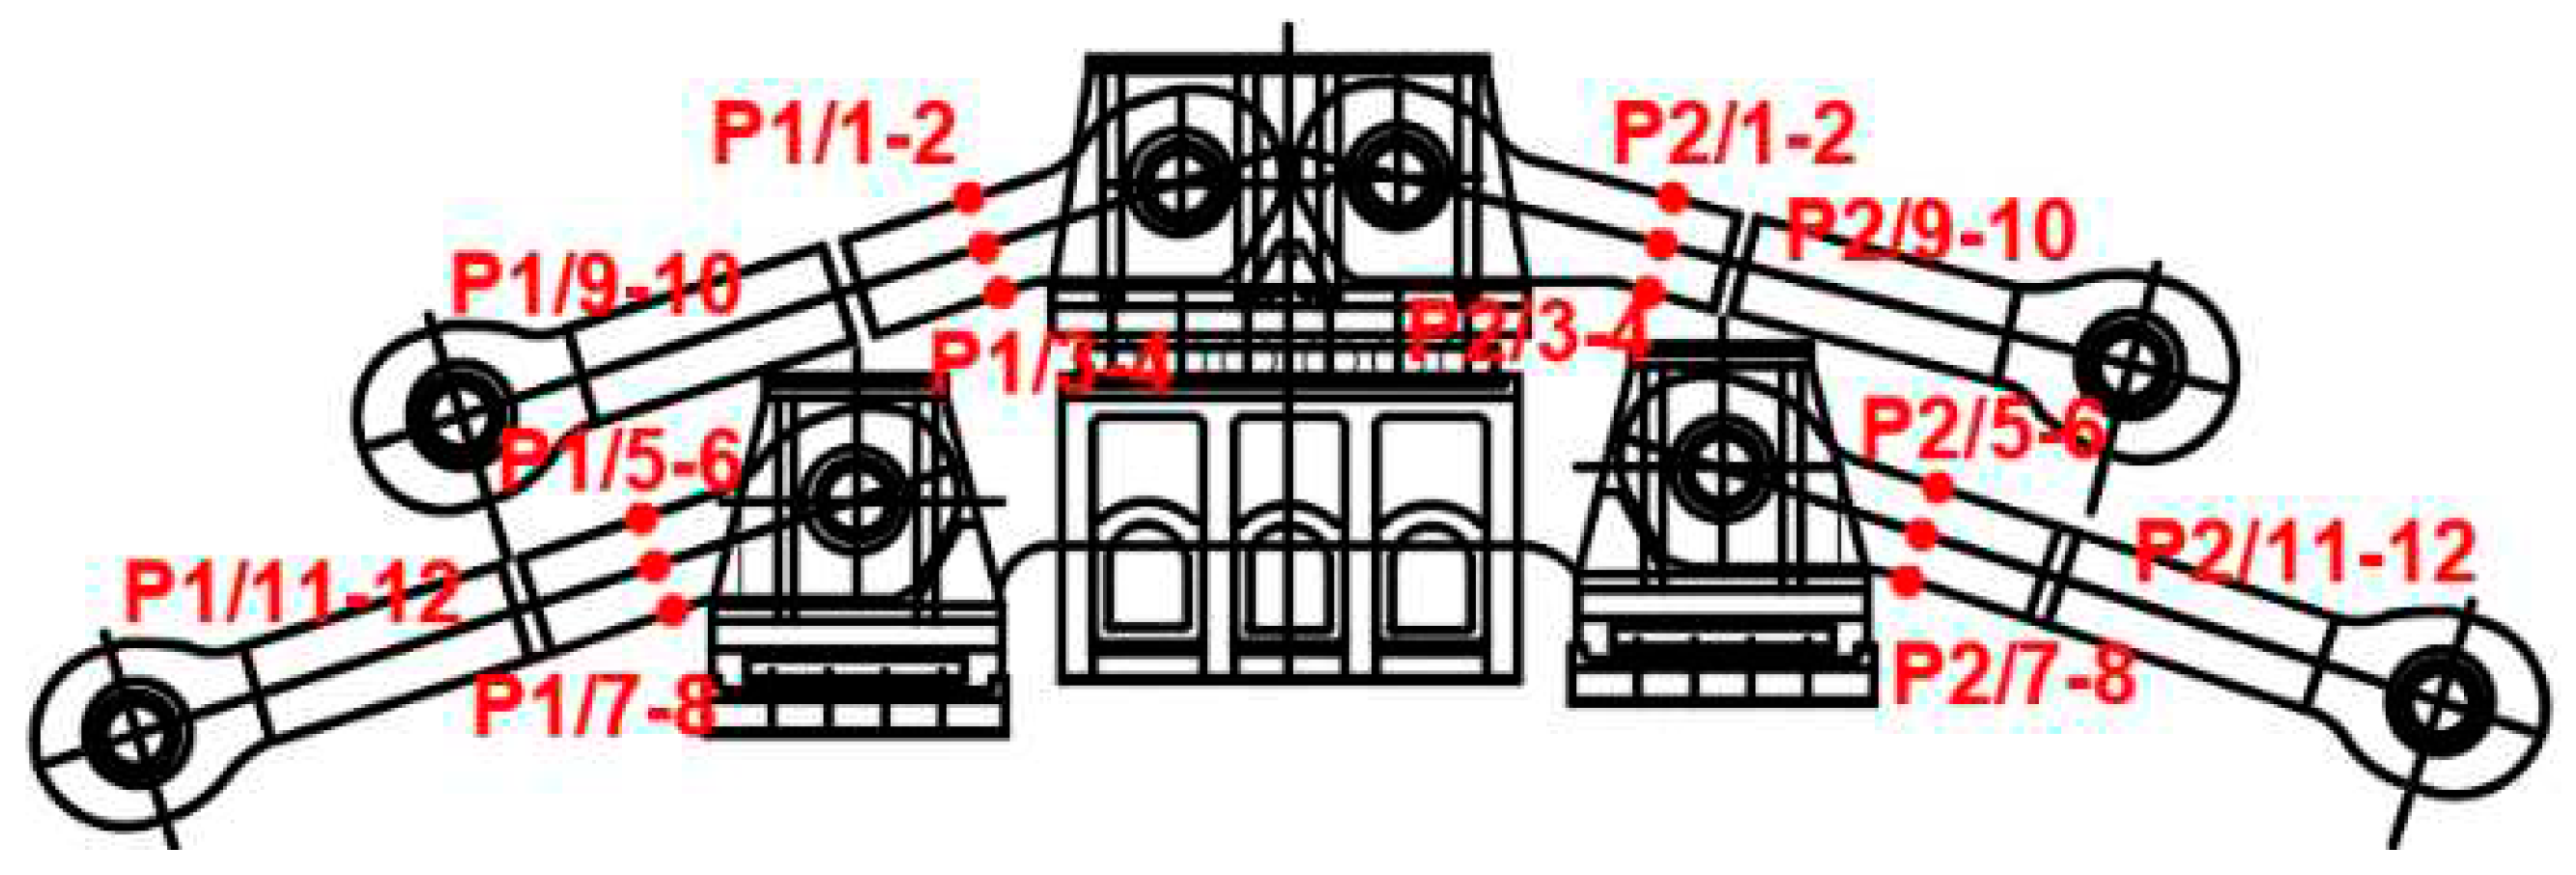
- evaluating the measurement results of a proof load test, which was carried out in 2018, to conclude whether fixed or partly fixed pins would start rotating due to live load on the bridge,
- assessing the temporary measurement results during reconstruction to conclude whether pins would start rotating due to reducing self-weight (dead load), which is mostly dominant for chain bridges.
4. Proof load test
4.1. Configuration and measurement locations
4.2. Load cases
4.3. Measurement results
5. Temporary monitoring system
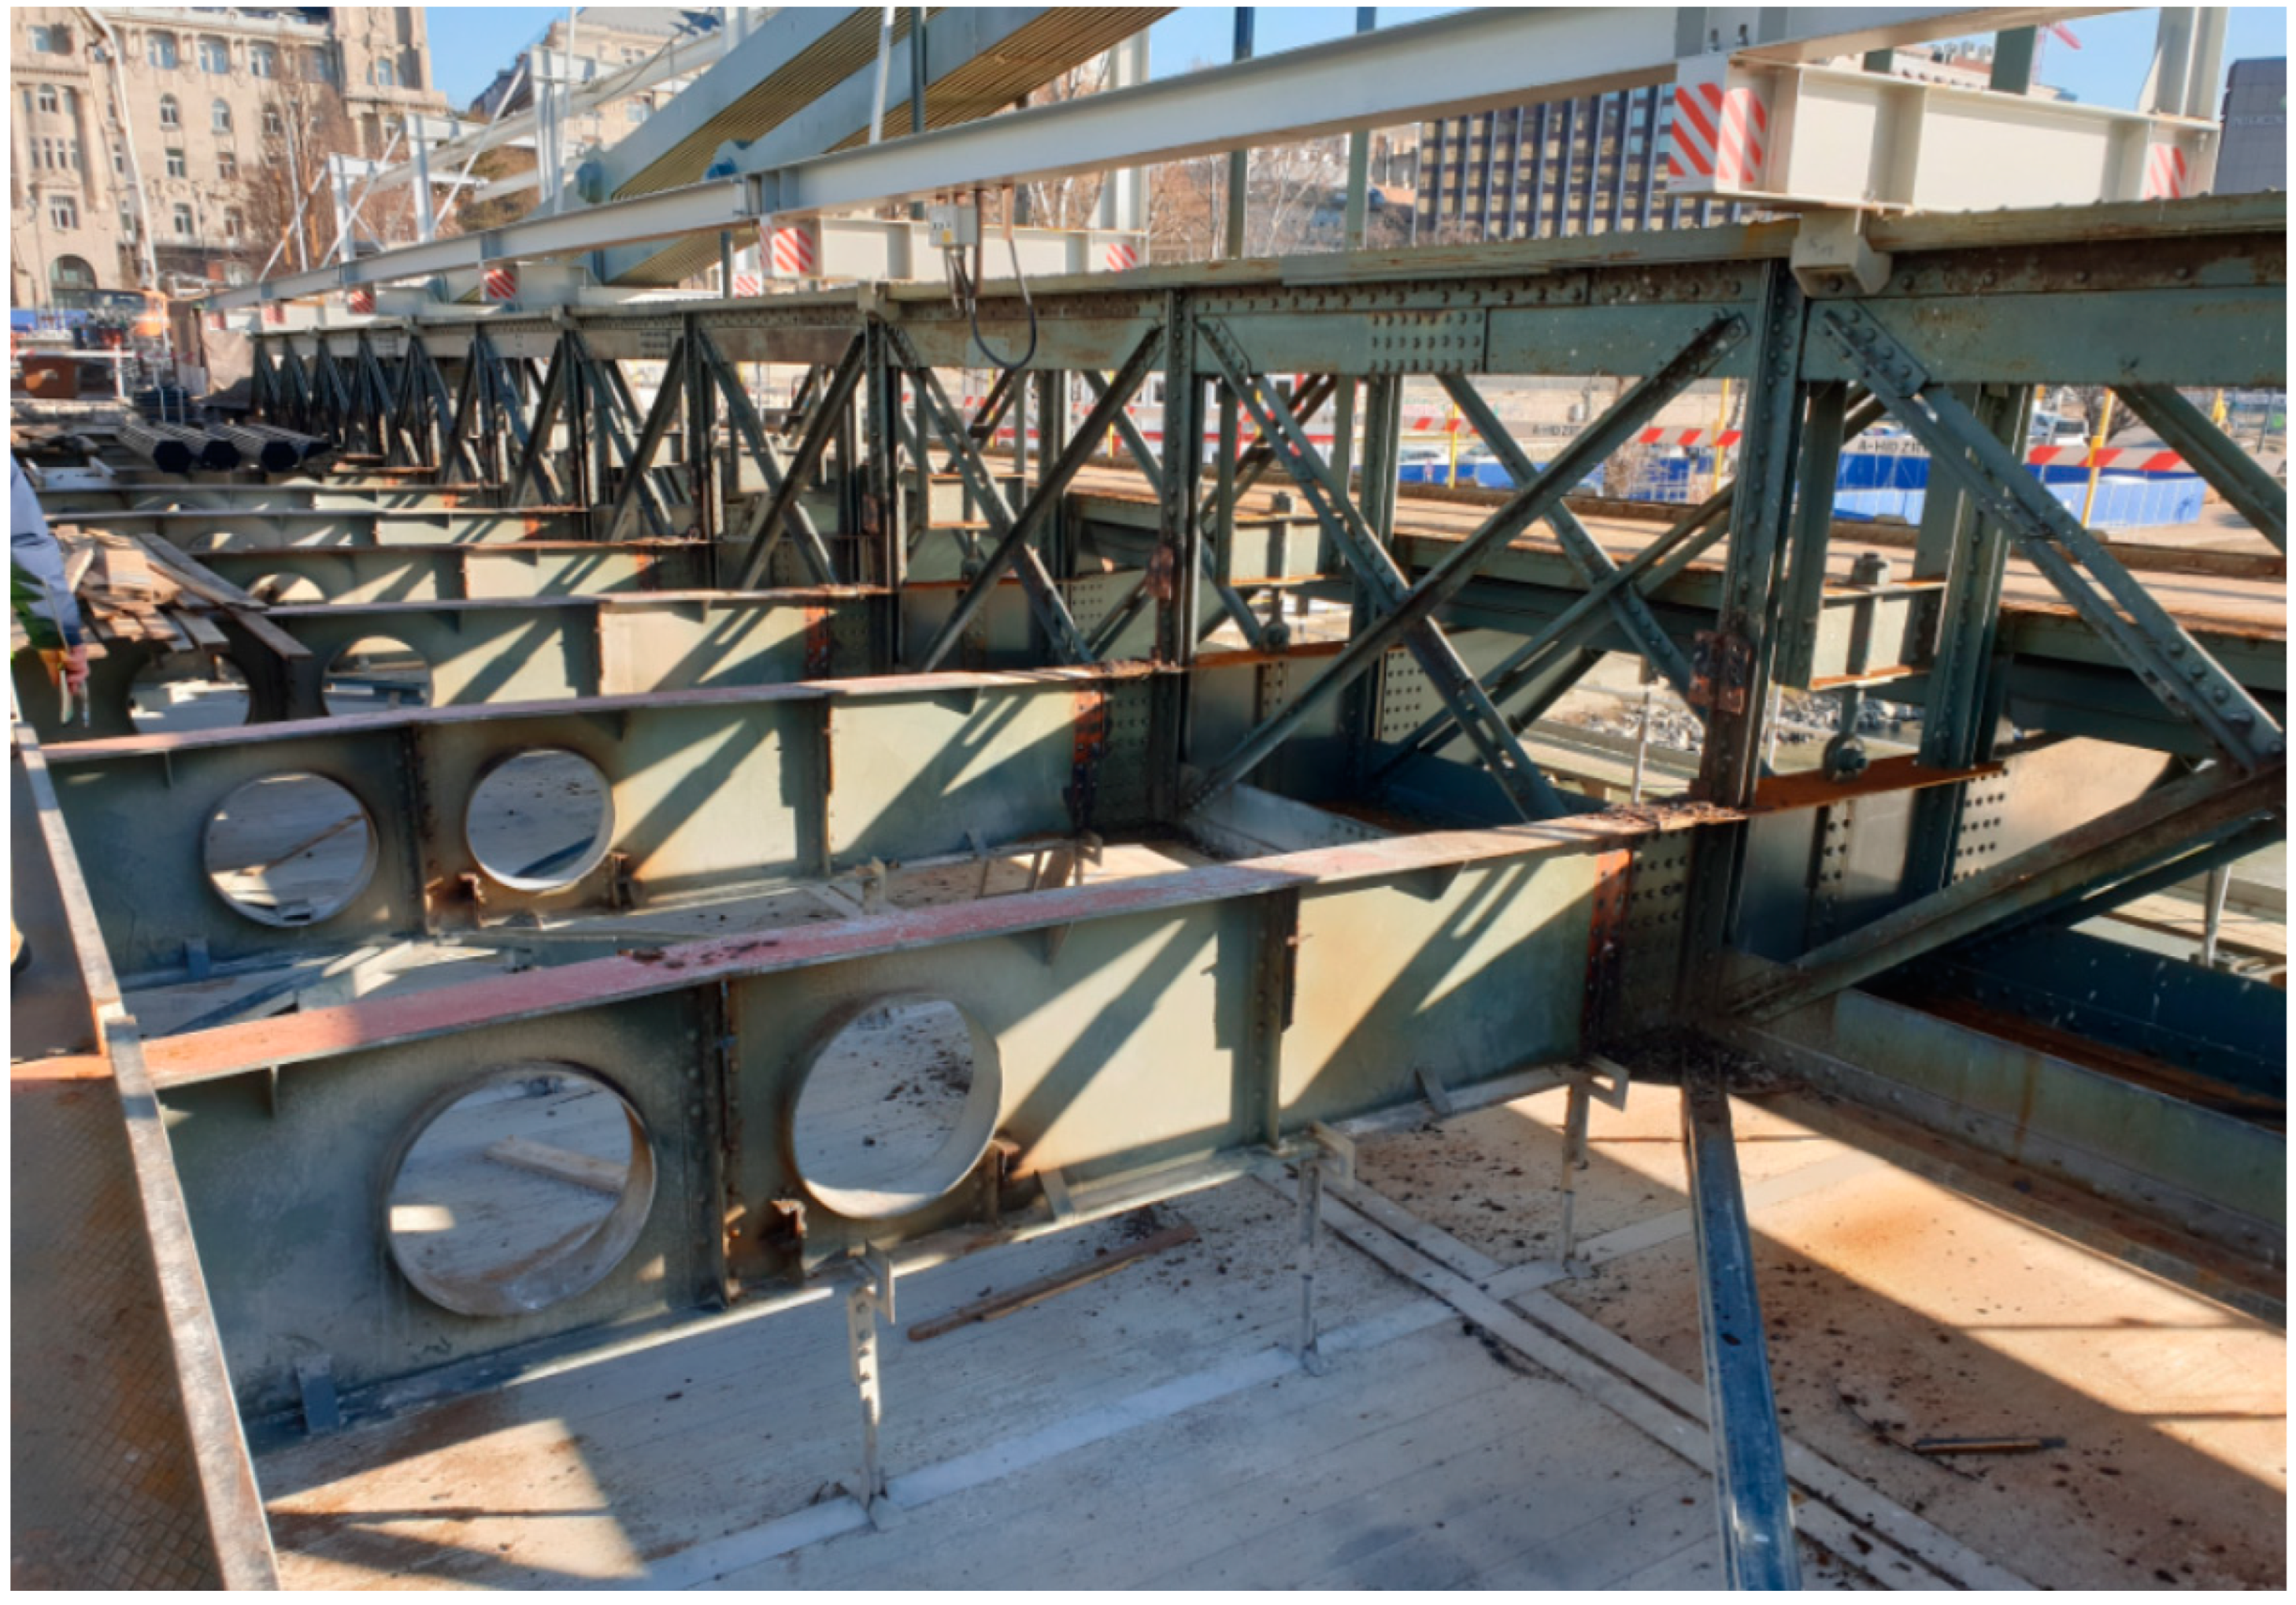
5.1. Configuration and measurement locations
5.2. Reconstruction stages
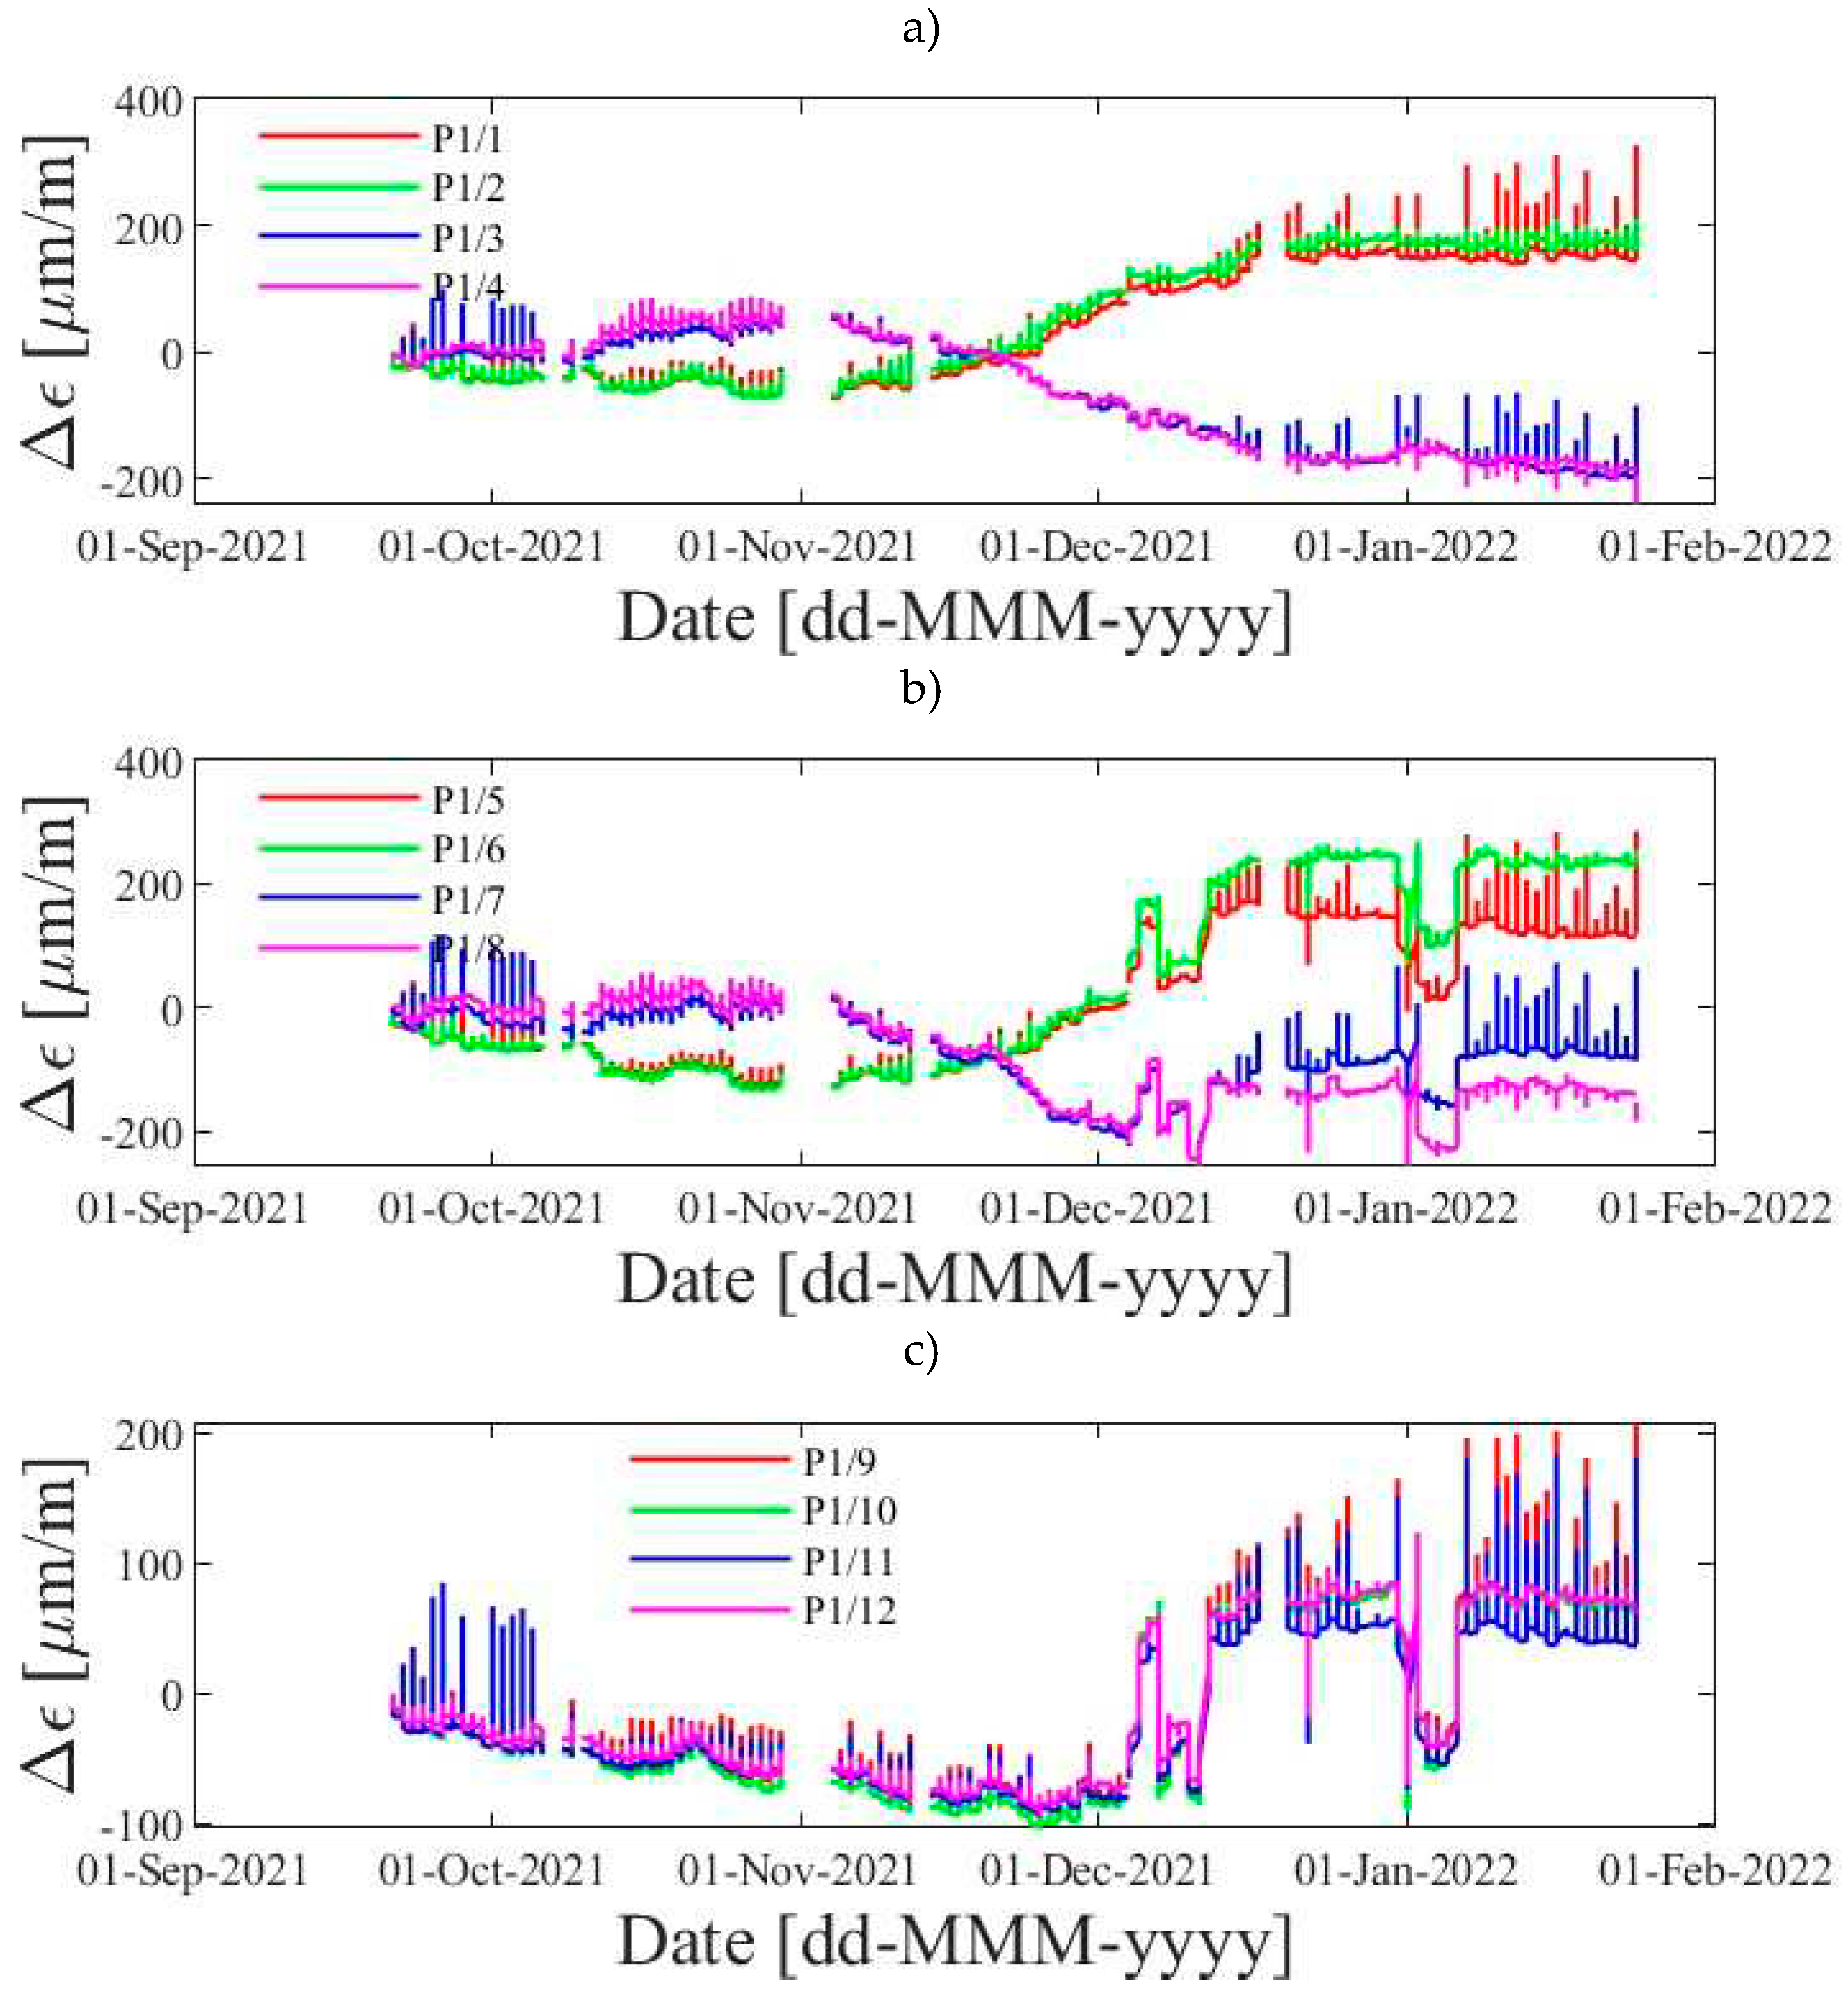
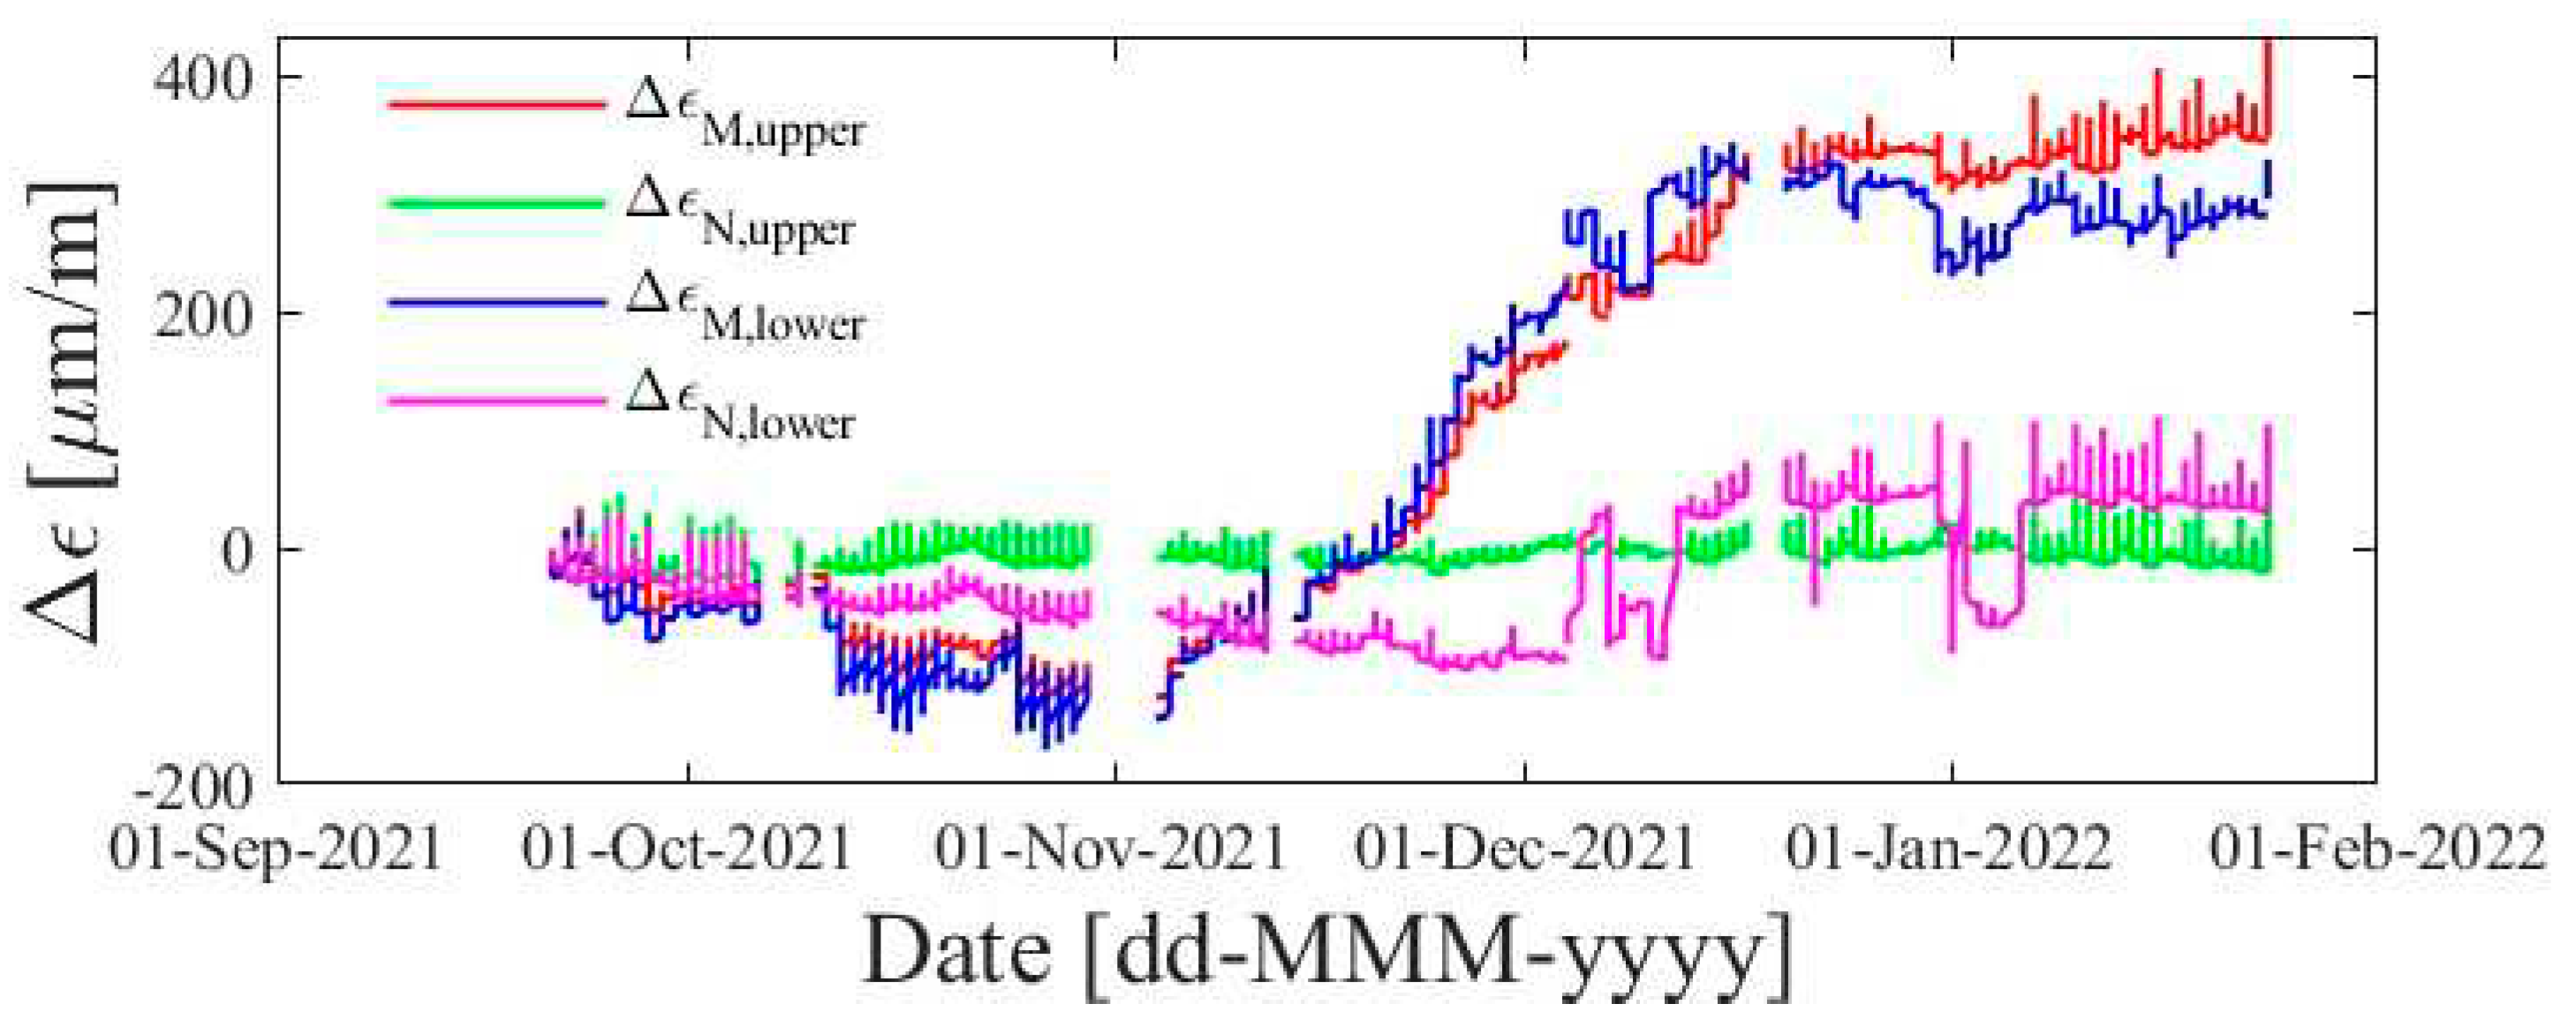
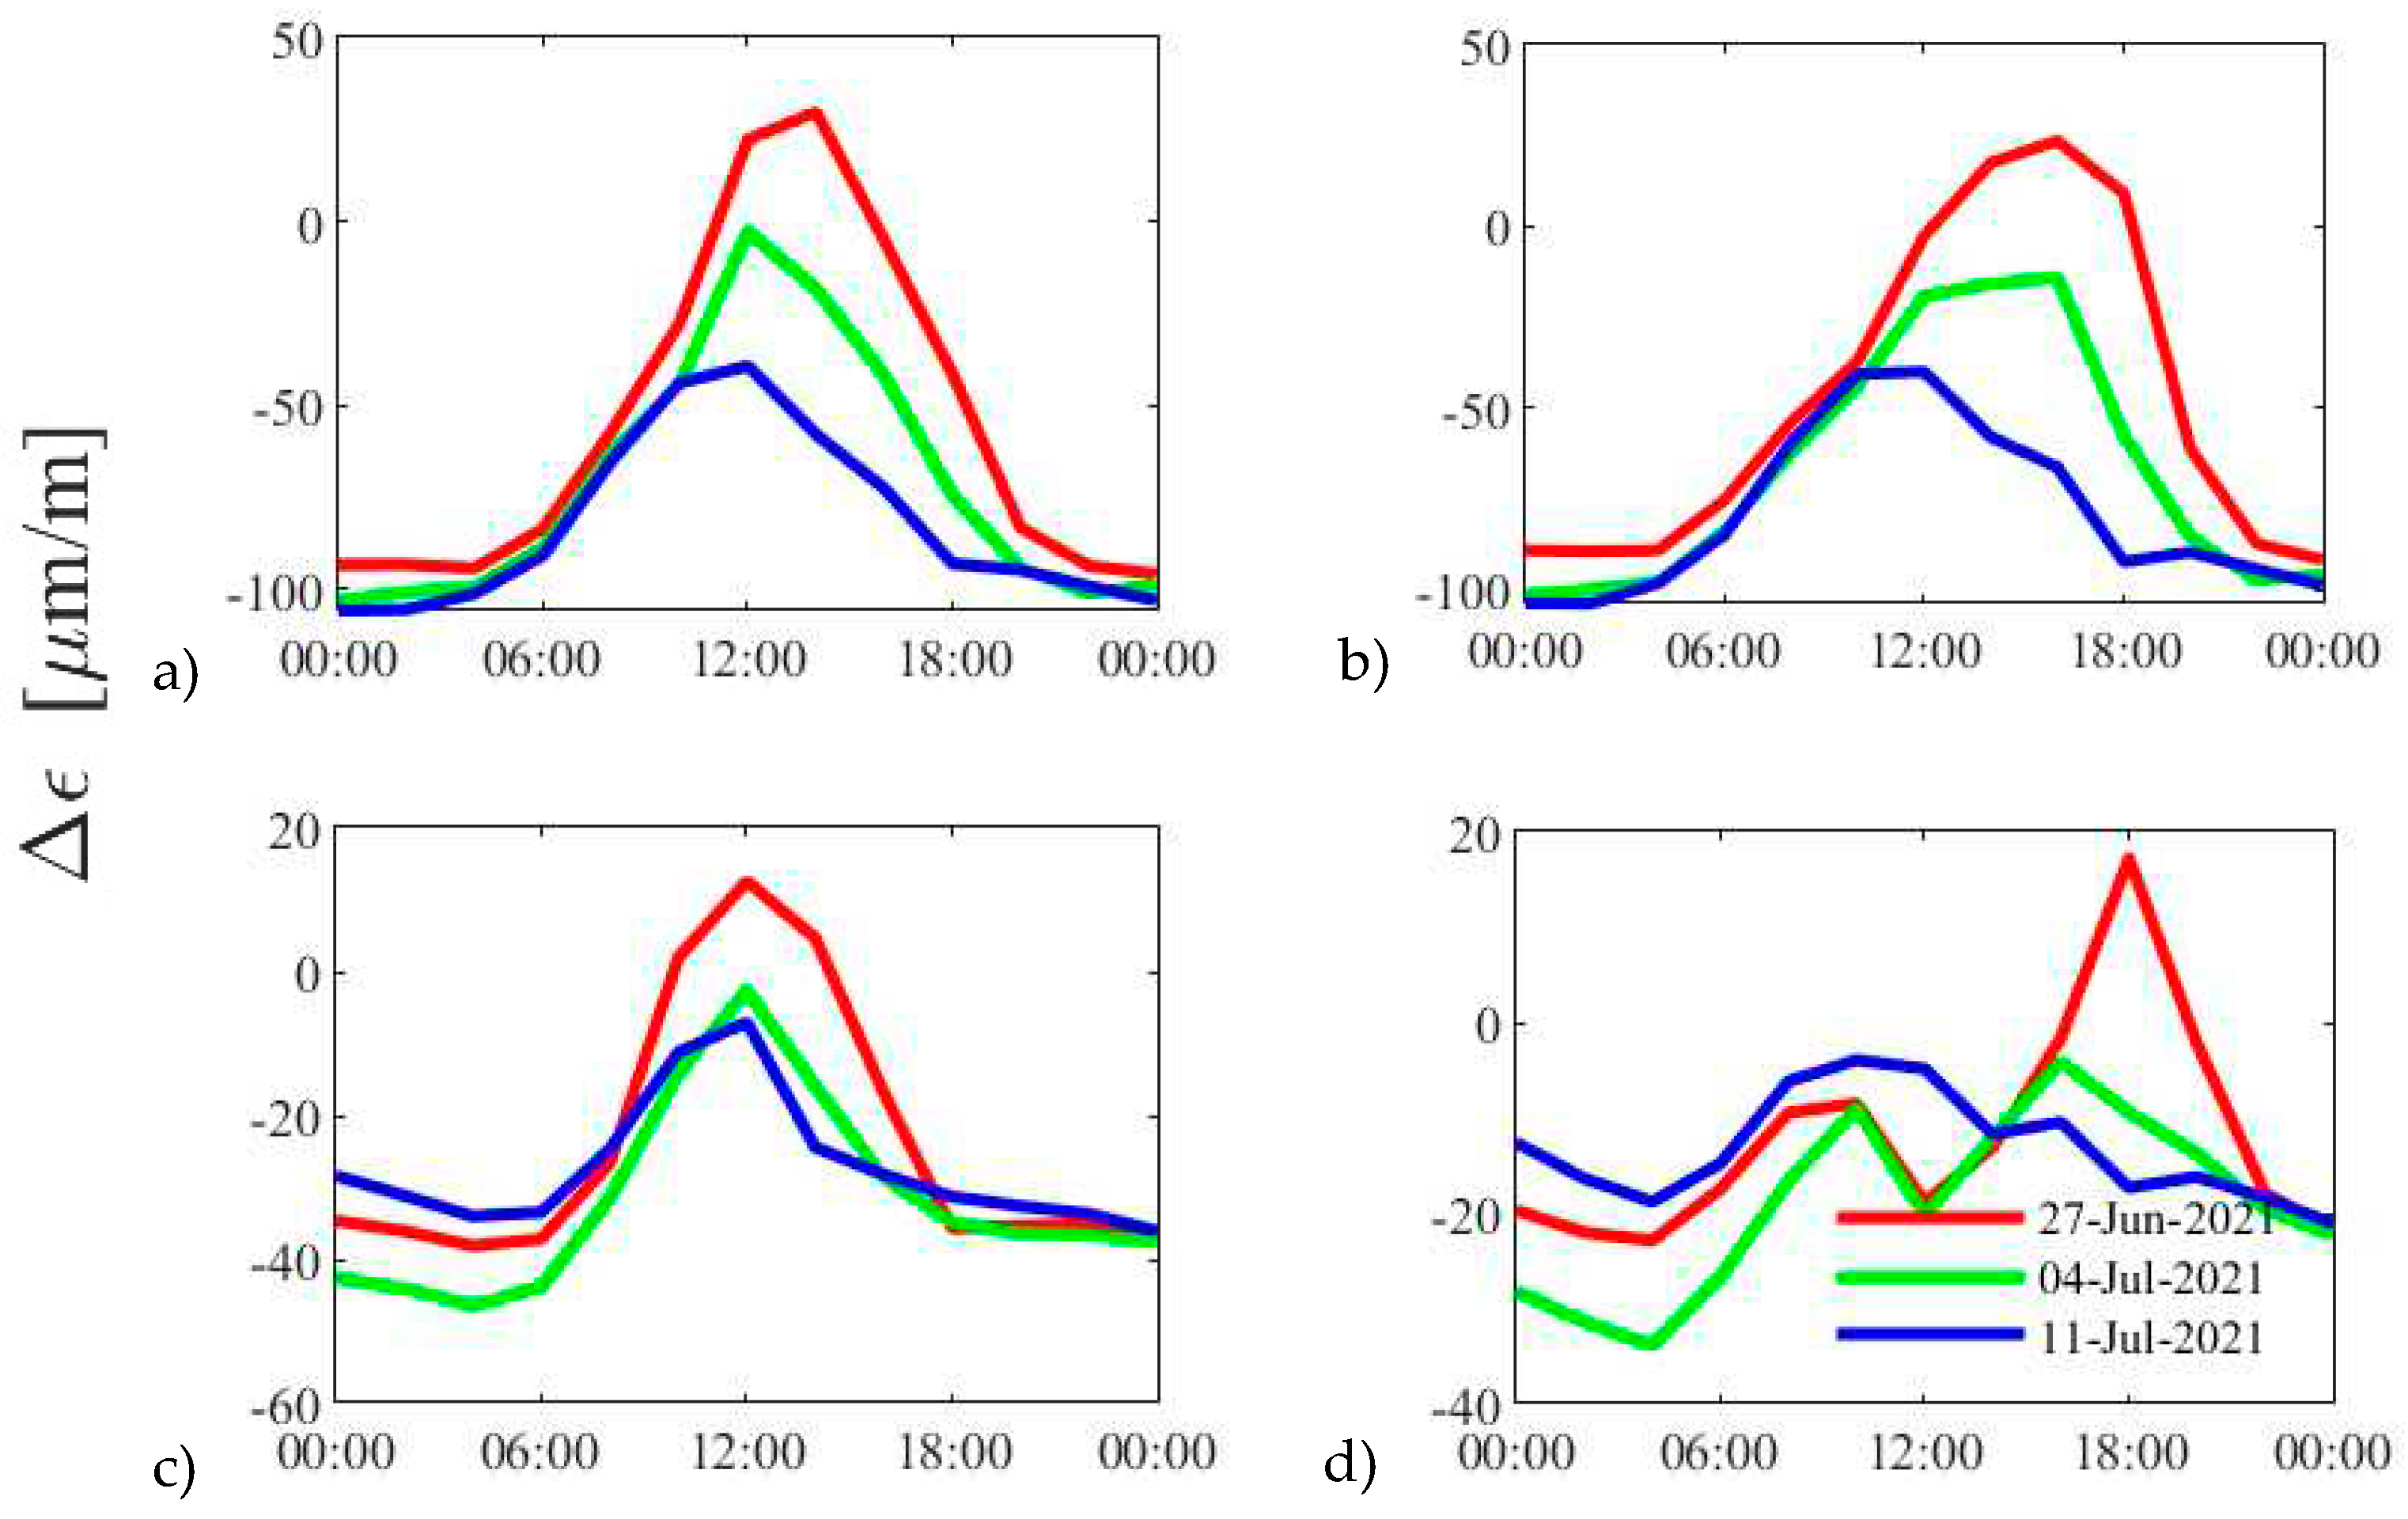
5.3. Measurement results
6. Summary and conclusions
- -
- all the measured pines are stuck, no rotations are expected coming from the live load (proof test load) or temperature change or removing the concrete deck during the reconstruction of the bridge;
- -
- internal forces coming from the daily and/or seasonal temperature change can reach or even overcome of the magnitude of the internal forces coming from the design traffic load, the effect of temperature change is significant on the bridge;
- -
- normal stresses coming from bending within the chain elements are significant; therefore, the bending component should always be considered in the static verification of the chain elements.
Acknowledgments
References
- Åesson, B. Understanding Bridge Collapses, 1st ed.; CRC Press: London, UK, 2008. [Google Scholar] [CrossRef]
- Kövesdi, B.; Kollár, D.; Dunai, L.; Horváth, A. Reliability analysis-based investigation of the historical Széchenyi Chain Bridge deck system. Results Eng. 2022, 15, 100555. [Google Scholar] [CrossRef]
- Neves, A.C.; González, I.; Leander, J.; Karoumi, R. Structural health monitoring of bridges: A model-free ANN-based approach to damage detection. J. Civ. Struct. Health Monit. 2017, 7, 689–702. [Google Scholar] [CrossRef]
- Neves, A.C.; Leander, J.; González, I.; Karoumi, R. An approach to decision-making analysis for implementation of structural health monitoring in bridges. Struct. Control Health Monit. 2019, 26, e2352. [Google Scholar] [CrossRef]
- Li, H.; Ou, J. Design approach of health monitoring system for cable-stayed bridges. In Proceedings of the 2nd International Conference of Structural Health Monitoring for Intelligent Infrastructure, Shenzhen, China, 16–18 November 2005. [Google Scholar]
- Hovhanessian, G. Health monitoring of cable stayed structures experience and implementation. In Conference Proceedings of the Society for Experimental Mechanics Series; Springer: Berlin/Heidelberg, Germany, 2006. [Google Scholar]
- Degrauwe, D.; De Roeck, G.; Lombaert, G. Uncertainty quantification in the damage assessment of a cable-stayed bridge by means of fuzzy numbers. Comput. Struct. 2009, 87, 1077–1084. [Google Scholar] [CrossRef]
- Li, H.; Li, S.; Ou, J.; Li, H. Modal identification of bridges under varying environmental conditions: Temperature and wind effects. Struct. Control Health Monit. 2010, 17, 495–512. [Google Scholar] [CrossRef]
- Okasha, N.M.; Frangopol, D.M. Integration of structural health monitoring in a system performance based life-cycle bridge management framework. Struct. Infrastruct. Eng. 2012, 8, 999–1016. [Google Scholar] [CrossRef]
- Li, D.; Hu, Q.; Ou, J. Fatigue Damage Evolution and Monitoring of Carbon Fiber Reinforced Polymer Bridge Cable by Acoustic Emission Technique. Int. J. Distrib. Sens. Networks 2012, 8, 282139. [Google Scholar] [CrossRef]
- Li, D.; Ou, J.; Lan, C.; Li, H. Monitoring and Failure Analysis of Corroded Bridge Cables under Fatigue Loading Using Acoustic Emission Sensors. Sensors 2012, 12, 3901–3915. [Google Scholar] [CrossRef] [PubMed]
- Li, H.; Lan, C.M.; Ju, Y.; Li, D.S. Experimental and Numerical Study of the Fatigue Properties of Corroded Parallel Wire Cables. J. Bridg. Eng. 2011, 17, 211–220. [Google Scholar] [CrossRef]
- Li, H.; Li, S.; Ou, J.; Li, H. Reliability assessment of cable-stayed bridges based on structural health monitoring techniques. Struct. Infrastruct. Eng. 2012, 8, 829–845. [Google Scholar] [CrossRef]
- Li, H.; Ou, J. The state of the art in structural health monitoring of cable-stayed bridges. J. Civ. Struct. Health Monit. 2016, 6, 43–67. [Google Scholar] [CrossRef]
- Al-Hijazeen, A.Z.O.; Fawad, M.; Gerges, M.; Koris, K.; Salamak, M. Implementation of digital twin and support vector machine in structural health monitoring of bridges. Arch. Civ. Eng. 2023, 69, 31–47. [Google Scholar] [CrossRef]
- Barros, B.; Conde, B.; Cabaleiro, M.; Riveiro, B. Deterministic and probabilistic-based model updating of aging steel bridges. Structures 2023, 54, 89–105. [Google Scholar] [CrossRef]
- Borlenghi, P.; Gentile, C.; Pirrò, M. Vibration-based structural health monitoring of a historic arch bridge. Experimental Vibration Analysis for Civil Engineering Structures. EVACES 2023, Limongelli, M.P., Giordano, P.F., Quqa, S., Gentile, C., Cigada, A., Eds.; Lecture Notes in Civil Engineering, Springer: Berlin/Heidelberg, Germany, 2023; Volume 432. [Google Scholar] [CrossRef]

| Fibre | Chain | P1 | P2 | P3 | P4 |
|---|---|---|---|---|---|
| Top | Upper | 110-125 | 85-110 | 105-120 | 80-105 |
| Lower | 100-125 | 110-135 | 100-140 | 95-140 | |
| Neutral | Upper | 60-80 | 35-80 | 60-80 | 40-80 |
| Lower | 55-70 | 35-80 | 65-85 | 25-80 | |
| Bottom | Upper | 40-50 | 85-120 | 45-50 | 115-125 |
| Lower | 40-110 | 115-115 | 45-110 | 95-140 |
| Chain | Quantity | P1 | P2 | P3 | P4 | ||||||||
|---|---|---|---|---|---|---|---|---|---|---|---|---|---|
| PLT | REC | ΔT | PLT | REC | ΔT | PLT | REC | ΔT | PLT | REC | ΔT | ||
| Upper | ΔN [kN] | 1206 | 1517 | 1904 | 1036 | 1682 | 1439 | 1482 | 4568 | 1768 | 1042 | 2379 | 1426 |
| ΔM [kNm] | 147 | 702 | 151 | 146 | 359 | 268 | 228 | 457 | 142 | 141 | 366 | 285 | |
| Lower | ΔN [kN] | 998 | 2996 | 1215 | 801 | 2943 | 1134 | 1305 | - | 1316 | 959 | 2565 | 1132 |
| ΔM [kNm] | 17 | 560 | 197 | 23 | 263 | 270 | 27 | - | 220 | 21 | 347 | 326 | |
Disclaimer/Publisher’s Note: The statements, opinions and data contained in all publications are solely those of the individual author(s) and contributor(s) and not of MDPI and/or the editor(s). MDPI and/or the editor(s) disclaim responsibility for any injury to people or property resulting from any ideas, methods, instructions or products referred to in the content. |
© 2024 by the authors. Licensee MDPI, Basel, Switzerland. This article is an open access article distributed under the terms and conditions of the Creative Commons Attribution (CC BY) license (http://creativecommons.org/licenses/by/4.0/).


