Preprint
Article

Finger Vein Identification Based on Large Kernel Convolution and Attention Mechanism

Altmetrics

Downloads

69

Views

25

Comments

0

A peer-reviewed article of this preprint also exists.

This version is not peer-reviewed

Submitted:

10 January 2024

Posted:

10 January 2024

You are already at the latest version

Alerts
Abstract
FV (finger vein) identification is a biometric identification technology that extracts the features of FV images for identity authentication. To address the limitations of CNN-based FV identification, particularly the challenge of small receptive fields and difficulty in capturing long-range dependencies, an FV identification method Let-Net(Large kernel and attention mechanism Network) was introduced, which combines local and global information. Firstly, Let-Net employs large kernels to broaden the receptive field and incorporates depthwise convolution with residual connections to reduce parameter count. Secondly, Let-Net integrates an attention mechanism to enhance the information flows in channels and spaces for more comprehensive and distinctive FV feature extraction. The experimental results on nine public datasets show that Let-Net has excellent identification performance, and the EER and accuracy rate on the FV_USM dataset can reach 0.04% and 99.77%. The parameter number and FLOPs of Let-Net are only 0.89M and 0.25G, which means that the time cost of training and reasoning of the model is low, and it is easier to deploy and integrate into various applications.
Keywords: 
Subject: Computer Science and Mathematics  -   Artificial Intelligence and Machine Learning

0. Introduction

In recent years, noteworthy strides have been made in the realm of artificial intelligence, yielding substantial scientific research outcomes. Consequently, the field of biometric technology has entered a pivotal phase of advancement. However, the exposure of irregularities in the acquisition of facial identification technology data has redirected the focus of major research groups toward the exploration of more secure identification methodologies. One such method that has garnered considerable attention is FV identification, owing to its heightened security attributes. The intricate distribution of human finger veins beneath the skin, coupled with the absorption of near-infrared light by hemoglobin to generate vein images, distinguishes this modality. This distinctiveness, not easily replicated in everyday contexts, positions FV identification as a promising alternative. In comparison to prevalent technologies such as face and fingerprint identification, FV identification possesses three fundamental advantages: 1) The reliance on vein characteristics formed by human blood flow establishes it as a bona fide living body identification technology. 2) The in-body nature of FV features, embedded beneath the skin, confers inherent resistance to forgery. 3) The identification process remains impervious to surface environmental factors, ensuring heightened security and significantly augmenting the identification pass rate.
In the context of the rapid evolution of deep learning, a prevalent approach among researchers involves the utilization of deep learning models for the extraction of features from FV datasets. CNN has emerged as a widely adopted framework in FV identification, leveraging its commendable feature representation capabilities to yield exceptional identification performance [1,2,3,4,5]. Despite these advancements, CNN-based methodologies encounter challenges associated with restricted receptive fields, impeding the capture of dependencies within long-distance features present in images. In response to this limitation, Huang et al. [6] pioneered the application of the Transformer architecture to the task of FV identification. Transformer-based methodologies exhibit a capacity to enhance information flows across channels and spaces, effectively modeling global information. However, these approaches often necessitate substantial data for pre-training. Given the limited size of existing FV datasets, relying solely on Transformer architectures becomes impractical. To address these challenges, we introduce a novel model Let-Net, which strategically amalgamates large kernels and attention mechanisms. Let-Net achieves the effective utilization of large kernels and attention mechanisms, striking a favorable balance between identification accuracy and computational cost. Demonstrating its efficacy across multiple datasets, Let-Net exhibits exceptional performance while maintaining a straightforward and lightweight structure. The key contributions of this study are outlined as follows:
1)Pioneering the incorporation of a large kernel solution into the FV identification task, we introduce a large kernel structure featuring taper connection and hybrid depthwise convolution. This innovation significantly reduces parameter volume without compromising accuracy.
2)The introduction of a module that integrates attention mechanisms and residual connections enhances information flows in channels and spaces by emulating visual attention mechanisms. This effectively mitigates limitations associated with convolutional induction bias.
3)By leveraging a dual-channel architecture, Let-Net effectively expands the dataset, seamlessly integrating feature comparison and extraction without explicit feature extraction steps. This innovative approach yields excellent identification results without the need to extract specific areas of interest.
4)Experimental evaluations conducted across nine public datasets underscore Let-Net’s considerable advantages in the domain of FV identification. Notably, on the VERA dataset [7] characterized by its lowest quality, Let-Net outperforms current state-of-the-art methods by a significant margin.

1. Related Works

1.1. FV Identification Method Based on Deep Learning

At present, strides in deep learning technology have markedly advanced the domain of FV identification. Radzi et al. [1] pioneered their application of CNN to FV identification, yet their experiments, conducted on an internal dataset, lacked a comprehensive evaluation of generalization performance. Das et al. [2] proposed a CNN-based FV identification system, assessing its efficacy across four public datasets with an achieved accuracy of approximately 95% merely. Yang et al. [3] introduced FVRAS-net, an embedded FV identification system characterized by lightweight and fast-forward propagation calculations. However, its identification accuracy remains a point of enhancement, particularly evidenced by a 5.61% misidentification rate in the SCUT_RIFV [8] dataset. Shaheed et al. [4] devised an FV identification method based on the Xception model, incorporating depthwise separable convolution and residual connections to interlink feature information between layers. Despite its complex network structure, this method incurs higher computational costs. Yang et al. [9] proposed FV-GAN, an FV identification method leveraging generative adversarial networks and eschewing fully connected layers in favor of a fully convolutional network. While this approach eliminates constraints on FV image size and reduces calculation time, the inherent challenges and instability in training generative adversarial networks persist. Huang et al. [6] introduced Vision Transformer (ViT) [10] for the first time in the realm of FV identification, presenting a novel FVT model that effectively enhances identification accuracy. However, optimization challenges, particularly on small-scale datasets, are evident in the ViT model [11]. Notably, in scenarios where copious data and suitable pre-training models are lacking, the ViT architecture significantly lags behind the CNN architecture in performance.

1.2. Kernel Size in Convolutional Layers

Following the advent of AlexNet, the integration of large kernels into CNN models has been infrequent. The preference for small convolutional kernels, characterized by their limited parameters and reduced computational cost, has swiftly positioned them as the primary choice for mainstream models. Contrary to this trend, recent research underscores the exceptional capabilities of large kernels across diverse vision tasks [12]. The ERF(Effective Receptive Field) theory [11] accentuated that larger kernels facilitate a broader receptive field, enabling the extraction of a more extensive range of information from input images. Empirical evidence from LRNet [13] substantiated that the incremental enlargement of kernel size correlates with gradual improvements in network performance, reaching optimal levels with larger kernels. GCN [14] employed a fusion of two convolutional methods to establish dense connections within expansive areas of the feature map, thereby further amplifying the kernel size in segmentation tasks. The FlexConv approach [15] extended kernel size by dynamically learning it during training and expediting large kernel convolutional operations using the Fourier transform. Liu et al. [16] drew inspiration from the Transformer design paradigm and introduced the ConvNets model, which systematically increases kernel size to elevate the depthwise convolutional layer, consequently enhancing performance. Despite the success of these models in high-level vision tasks, a notable experimental observation is their limited direct applicability to FV identification tasks. Consequently, we delve into the exploration of large kernel design in the context of FV identification. The objective is to extract more precise vein patterns, thereby augmenting identification performance.

1.3. Attention Mechanism

The attention mechanism, inspired by the human visual and cognitive system, finds applications in natural language processing, particularly for handling sequence data such as text, speech, and image sequences. In the realm of deep learning, incorporating the attention mechanism enables neural networks to autonomously learn and selectively emphasize crucial information within input data. This enhancement contributes to improved model performance and generalization capabilities. Attention mechanisms manifest in three primary types: self-attention, spatial attention, and channel attention. In computer vision, the channel attention mechanism stands out and has demonstrated noteworthy efficacy. For instance, Mnih et al. [17] innovatively integrated a deep neural network with an attention mechanism, introducing the RAM model. RAM utilizes RNN(Recurrent Neural Network) for visual attention, predicting salient regions and iteratively updating the entire network in an end-to-end fashion through policy gradient. Some approaches amalgamate channel attention with spatial attention to yield favorable outcomes. Woo et al. [18] introduced the CBAM module, which is seamlessly integrated with any CNN architecture. This module concatenates the channel attention sub-module and the spatial attention sub-module serially, with minimal additional computational cost. Recent studies affirm the attention mechanism’s efficacy in enhancing deep CNN. The synergistic integration of the attention mechanism with CNN architecture has proven advantageous across various visual tasks such as classification, detection, and segmentation. Notably, De et al. [19] amalgamated CNN and ViT to enhance accuracy, striving to establish an optimal plant disease detection model achieving high accuracy with reduced model size, without necessitating pre-training. This study adeptly combines convolutional blocks with attention mechanisms to integrate local and global information, facilitating more precise FV identification.

2. Proposed Method

This chapter provides a comprehensive exposition of Let-Net. Section 2.1 delineates the intricacies of the FV identification process alongside elucidating the overarching network structure. Subsequently, Section 2.2 expounds upon the dual-channel network architecture, offering insights into its design and functionality. Section 2.3 delves into the particulars of the LK Block, shedding light on its structural components and operational characteristics. Finally, Section 2.4 elucidates the attention module employed within the Let-Net model, outlining its role and intricacies in the broader context of the network’s architecture.

2.1. Method Flow and Overall Network Structure

The method flow of our method is shown in Figure 1(a), which mainly includes image input, image preprocessing, FV feature extraction, model prediction, and result matching. First, from the existing database, randomly select an image for each type of finger to add to the new FV database, ensuring that each finger type contains at least one sample image. For the image to be detected, input it and a certain type of image in the database to the Let-Net model. The model then outputs a matching result indicating whether it matches or not. If the match is “True”, it means that the image to be detected and this type of image comes from the same finger. Otherwise, select the next type of image to continue matching until the matching is completed. If no matching image is found after traversing the entire database, it means that the image to be detected cannot match any type of image in the database. Through this method, Let-Net can efficiently use the image information in the databases to gradually determine which type of finger the image to be detected belongs to, thereby achieving the task of FV identification.
The network architecture of Let-Net, illustrated in Figure 1(b), comprises two primary modules: the Stem Block and the Large Kernel Block (LK Block). Given an input FV image size of H × W × 2 , the image undergoes initial processing through the Stem Block, characterized by multiple convolutional layers and max-pooling layers. Following the 3 × 3 convolution, the feature map size becomes H × W × 16 . Subsequently, the feature map bifurcates into two paths: the first path undergoes max-pooling, while the second path undergoes 1 × 1 convolution and 3 × 3 convolution. At this juncture, the feature map size is H 2 × W 2 × 16 , and the two resultant feature maps are concatenated. After traversing three convolutional layers and two max-pooling layers, the final output feature map size is H 8 × Q 8 × 128 . The Stem Block facilitates downsampling, reducing dimensionality and compressing feature map information to enhance network efficiency.
After the Stem Block, the input progresses to the LK Block, where L and S denote the kernel sizes of the large convolution and auxiliary depthwise convolution, respectively. The kernel size transitions from the auxiliary kernel S to the large kernel L, employing pointwise convolution. The large kernel structure affords an ample effective receptive field and spatial aggregation capabilities, proving particularly adept at processing FV images with continuous texture information.
Furthermore, a NAM (Neighborhood Attention Module) attention module is incorporated after each convolutional layer to channel the network’s attention towards channels and spatial locations rich in information content. Importantly, the LK Block maintains the feature map size, resulting in a final output feature map size of W 8 × H 8 × 128 . Ultimately, the feature map undergoes expansion and traverses a fully connected layer, culminating in the output of two neurons representing the probabilities of "True" and "False."

2.2. Dual-channel Network Architecture

CNN, exemplified by architectures such as VGG-Net, Google-Net, and ResNet, is conventionally employed for classification tasks. These deep networks treat each image within a dataset as an individual sample, learning salient features directly from single images through non-linear transformations. This study, however, opts for a novel approach by embracing a dual-channel network architecture, a choice motivated by the desire to maximize the utility of limited data and enhance performance through an augmented number of samples for training.
In the context of a dual-channel architecture, the input to the neural network is conceptualized as a pair of image patches. Consequently, every two images in the training set are amalgamated into a single training sample. This strategic approach results in an expansion of the number of training samples from n to the maximum A 2 n (n represents the number of images in the training set, and the combination of two images ’A’ and ’B’ into sample pairs can occur in different orders, such as ’AB’ and ’BA’ representing distinct sample pairs). Implementing this network paradigm involves jointly feeding two images—originating from either the same or different fingers—into the network. The associated labels "True" or "False" signify whether each pair of images corresponds to the same or different fingers. During the testing phase, the initial input image serves as the template, while the second image functions as the test sample, yielding an output result of "True" or "False."

2.3. Design of the LK Block

Kang et al. [20] underscore that features within FV images extend beyond the vein area, encompassing non-venous regions known as soft biometrics, which substantially contribute to FV identification. Consequently, the objective of this study is to augment the model’s capacity to discern local information and enhance overall performance by expanding the receptive field size. However, the direct adoption of large kernels poses several challenges in practical applications. Firstly, the escalation of kernel size from 3 × 3 to 3 × 3 results in a substantial expansion of the model size, escalating computational overhead exponentially by 19 times. Secondly, as elucidated in [11,13], even meticulously designed large-kernel networks, when trained on extensive datasets, necessitate extensive optimization efforts with the inherent risk of performance degradation. This challenge becomes particularly pronounced in the context of FV network models, given the inherent constraints on training data size. For instance, the VERA dataset [7] comprises a mere 440 training samples. Thus, the direct application of large kernels proves impractical owing to limitations in computing resources and the intricate nature of model optimization. This predicament is especially formidable when addressing FV network models characterized by constrained training data size.
To mitigate the computational burden associated with an expansive kernel size, we propose an LK Block comprising three integral components: hybrid depthwise convolution, residual connection, and pointwise convolution. The hybrid depthwise convolutional kernel encompasses two depthwise convolutional kernels—a primary large kernel with a size of L × L and an ancillary small kernel with a size of S × S . The auxiliary small kernel serves the purpose of capturing small-scale patterns inherent in FV images. For an input image with dimensions of H × W × C i n , the computational cost of this hybrid depthwise convolution is H × W × C i n × ( L 2 + S 2 ) × 1 . Residual connections are employed to synergize large and small kernels, concurrently linking depthwise convolution and 1 × 1 pointwise convolution. Following hybrid depthwise convolution, pointwise convolution is introduced to facilitate the information flows across channels. Notably, pointwise convolution maintains the input dimension, with a computational cost of H × W × C i n × C i n .
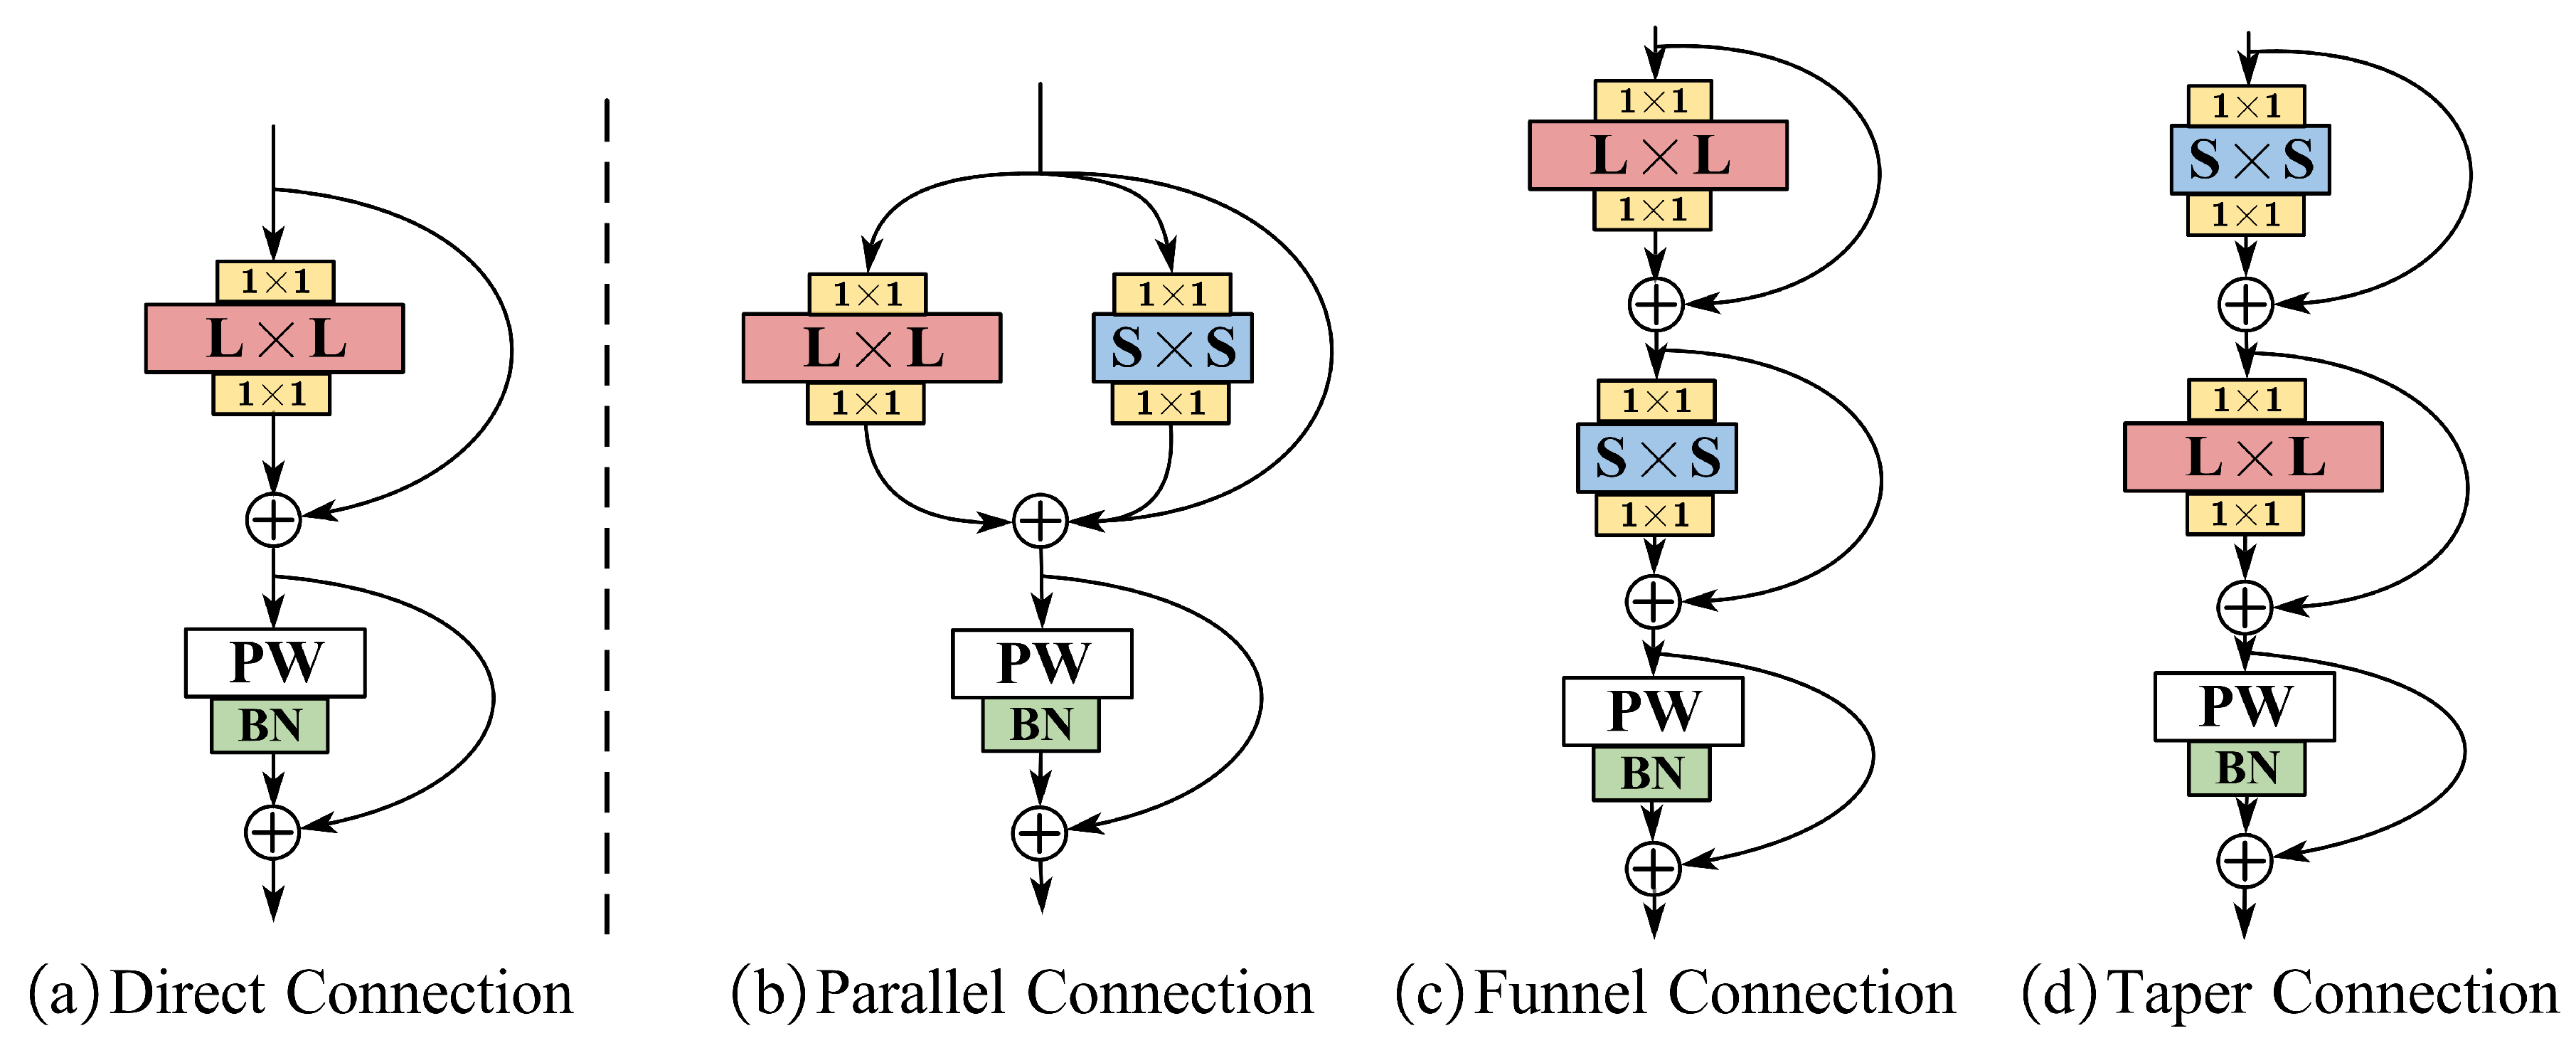
We introduce three distinct architectures for the LK Block, as illustrated in Figure 2. The ultimate Let-Net adopts the configuration depicted in Figure (d). In this representation, L and S denote the kernel sizes for large convolution and auxiliary small depthwise convolution, respectively, while PW signifies pointwise convolution. The designs in columns b, c, and d stem from the direct connections elucidated in column a. 1)Parallel connections (column b): Layer blocks incorporate parallel small cores within large depthwise convolutional layers. pointwise convolutions are subsequently followed by parallel VGG-style convolutions, amalgamated with skip connections. 2)Funnel connection (column c): This configuration mirrors a ResNet-style layer block where the kernel size progressively diminishes from the large kernel L to the auxiliary kernel S. 3)Taper connection (column d): Resembling the funnel connection, this design applies hybrid convolutions in reverse order. Experimental results presented in Section 3.3.2 demonstrate that these three large kernel designs surpass conventional convolutional layers with ordinary small kernels in terms of performance, with only a negligible increase in computational effort. Notably, among these architectures, the taper connection exhibits superior performance and is consequently adopted as the final design:
o 1 = σ x + C o n v S × S d w x
o 2 = σ o 1 + C o n v L × L d w o 1
o = o 2 + σ C o n v 1 × 1 p w o 2
Where x and o denote the input and output feature maps respectively. C o n v L × L d w and C o n v S × S d w denote the depthwise convolution of the large kernel and small kernel respectively, C o n v 1 × 1 p w denotes pointwise convolution, and σ denotes the activation function.
To align dimensions and introduce increased non-linear transformations, two sequences of 1 × 1 convolution operations are conducted within each LK Block. In each set of convolutional layers, the initial operation modifies the dimension of the input feature map from C i n to α C i n , followed by a subsequent transformation to C , This process incurs a computational cost of H × W × C i n × α C i n + H × W × α C i n × C . In the first set of convolutional operations, C is equivalent to C i n , while in the second set, C is equivalent to C o u t . The cumulative computational cost for both sets of convolutions is expressed as H × W × α C i n × 3 C i n + C o u t . Consequently, the total computational cost for an LK Block is delineated by Equation (4). To assess the computational efficiency, the computational cost ratio between the LK Block and a standard convolutional layer is calculated, as presented in Equation (5).
H × W × α C i n × L 2 + S 2 + C i n + α 3 C i n + C o u t
C o s t o u r s C o s t n o r m a l = H × W × α C i n × L 2 + S 2 + C i n + α 3 C i n + C o u t H × W × α C i n × C o u t × L 2 = 1 C o u t + 1 C o u t S 2 L 2 + 1 + 3 α L 2 C i n C o u t + α L 2
In Equation (5), α , C i n and C o u t are constants, C o u t > > 1 . In contrast to conventional large kernel structures, the proposed design in this study diminishes the computational cost to O 1 L 2 showcasing noteworthy enhancements in performance.

2.4. Attention Module

In the context of image identification, the discernment of local information assumes paramount importance. FV images often manifest smooth attributes and present line-like structures, introducing challenges in accurately distinguishing foreground and background within local features. Relying solely on convolutional operations proves insufficient for capturing these local features, given the nuanced properties of FV images. Conversely, attention mechanisms excel in modeling global information. Let-Net strategically integrates the attention mechanism to empower the model to concentrate on task-relevant information, concurrently mitigating the impact of irrelevant details during the training process.
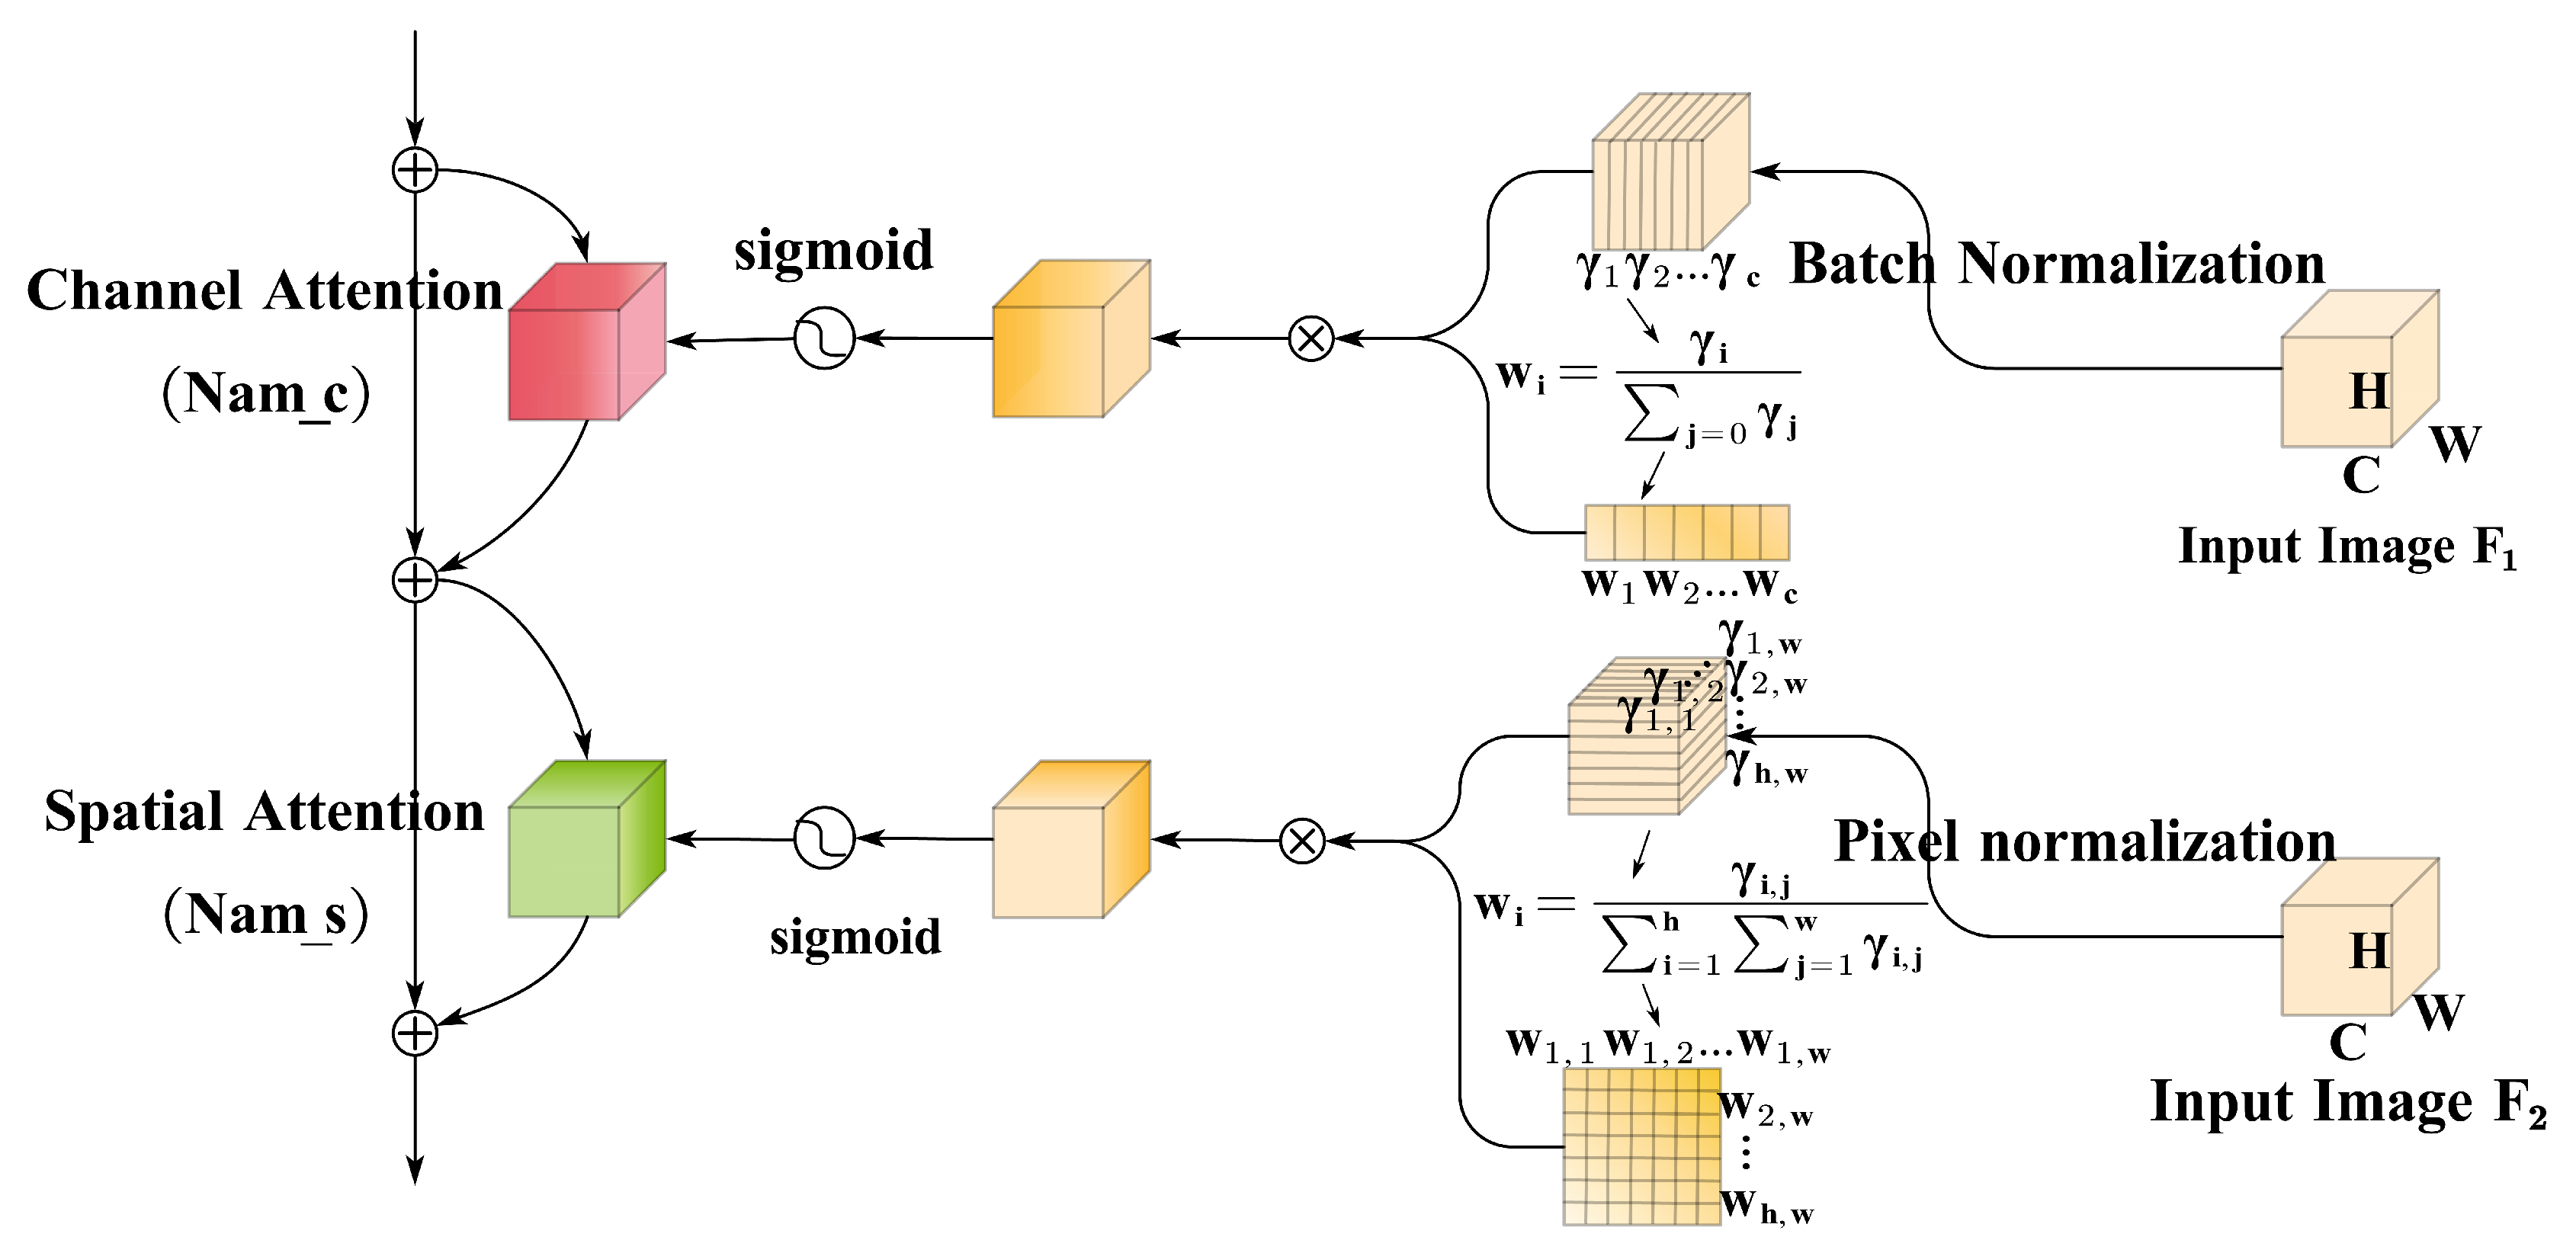
The Normalization-based Attention Mechanism (NAM) [21] employed in this study utilizes the scale factor derived from each dimension in Batch Normalization (BN) to gauge the significance of individual dimensions. Larger variances signify heightened dimensional variability and encapsulate richer information, thereby warranting greater attention. Incorporating this mechanism into the normalization and dimension weight calculations contributes to optimizing feature selection, ultimately enhancing the performance and generalization capabilities of the model. The standardized calculation and dimension weight formulas are articulated as follows:
B o u t = γ B i n μ B σ B 2 + ε + β
W c = c i j = 0 L c j
W s = s i j = 0 L s j
In Equation (6), the variables B i n and B o u t denote the input and output of the BN, respectively, while γ and β represent the scale and displacement. Additionally, μ B and σ B signify the mean and standard deviation of the input data. In Equation (7), i represents the dimension, c i denotes the scaling factor of the dimension, Lindicates the total length of the dimension, and W c represents the weight associated with the channel corresponding to dimension i. The application of the scaling factor from BN to the spatial dimension results in the derivation of the corresponding weight W c , as illustrated in Equation (8). Typically, the dimensions calculated by BN align with channel dimensions. By determining the proportion of the scaling factor for each channel and multiplying it with the original features, the weight for each channel is computed, facilitating the redistribution of channel information. Ultimately, the channel attention is acquired by activating the sigmoid function, followed by dimension transformation to map the dimensions calculated by BN to spatial pixels. The Channel Attention Mechanism based on Normalization (NAM_c) and the Spatial Attention Mechanism (NAM_s) are visually depicted in Figure 3.

3. Experiment and Result Analysis

3.1. Dataset Description

We use nine public datasets for evaluation experiments: SDUMLA [22], FV_USM [23], HKPU_FID [24], SCUT_RIFV [24], PLUSVein [25], MMCBNU_6000 [26], UTFVP [27], VERA [7], THU_FVFVD [28].
1) SDUMLA: This dataset contains images of 636 fingers, each finger is captured six times, resulting in a total of 3,816 FV images. The input of the dual-channel is two pictures, the two pictures belonging to the same category are combined as positive samples, and the two pictures of different categories are combined as negative samples. Without considering the order of channels, a total of 9,540 positive samples can be formed, and a total of 7,269,480 negative samples can be formed. Considering that the number of negative samples is much larger than the number of positive samples, 9,540 negative samples were randomly downsampled. The same applies to the following datasets.
2) FV_USM: This dataset contains images of 492 fingers, each finger was captured six times in a session, resulting in a total of 2,952 FV images (This dataset involves two stages and only data from stage 1 is used for the experiments).
3) HKPU_FID: This dataset contains images of 312 fingers, each finger is captured six times, resulting in a total of 1,872 FV images.
4) SCUT_RIFV: This dataset contains 606 images of fingers, each finger was captured six times, resulting in a total of 3,636 FV images (This dataset involves three rolling poses and six illumination intensities, and only the subset under level 3 illumination with normal finger poses is used for the experiments).
5) PLUSVein: This dataset contains images of 360 fingers, with each finger captured five times, resulting in a total of 1,800 FV images.
6) MMCBNU_6000: This dataset contains images of 600 fingers, each finger is captured ten times, resulting in a total of 6,000 FV images.
7) UTFVP: This dataset contains images of 360 fingers, each finger is captured four times, resulting in a total of 1,440 FV images.
8) VERA: This dataset contains images of 220 fingers, each finger is captured twice, resulting in a total of 440 FV images.
9) THU_FVFVD: This dataset contains 610 finger images, each finger is captured eight times, resulting in a total of 4,880 FV images (This dataset involves two stages, and only data from stage 1 is used for the experiments).
After evaluation and testing, we chose to divide the dataset into a training set and a test set, and split the dataset using a ratio of 7:3. In addition, to achieve optimal performance of the model, the image input size of all datasets is uniformly normalized to 128 × 128 .

3.2. Experimental Settings and Experimental Indicators

The primary metric employed in the experimentation is the Equal Error Rate (EER), a pivotal measure in biometric systems. EER is determined when the False Acceptance Rate (FAR) equals the False Rejection Rate (FRR). Falsely accepted pairs arise when two FV images, belonging to different categories, are erroneously identified as being in the same category. FAR quantifies the percentage of falsely accepted pairs relative to all inter-class pairs, essentially representing the proportion of "unmatched FV images treated as matching FV images." Conversely, falsely rejected pairs occur when two FV images from the same class are erroneously identified as belonging to different classes. FRR is the percentage of falsely rejected pairs among all within-class pairs, signifying the instances where "FV images that should be matched are not considered matched FV images." The computations for FAR and FRR are articulated in Equations (9) and (10) respectively.
F A R = N F A N I R A × 100 %
F R R = N F R N G R A × 100 %
Where N F A and N F R are the number of false acceptances and false rejections, N I R A and N G R A is the total number of inter-class tests and intra-class tests. In addition to EER, we employ the accuracy rate (ACC) as an additional evaluative criterion for the biometric system.
The deep learning model employed in the experimental setup is implemented through the TensorFlow framework. The computational infrastructure comprises an RTX2080ti GPU, and the operating system utilized is Ubuntu 18.04. To mitigate overfitting and enhance the network’s learning and detection capabilities, a pre-trained model initializes the Stem Block, and the training batch size is set to 32. For the initialization of convolutional kernel and depthwise convolutional kernel parameters, the standardized Glorot initialization method is employed. The parameters for the ADAM optimizer are configured as follows: a learning rate of 0.0001; an exponential decay rate for the first-order moment estimation (beta1) of 0.9; an exponential decay rate for the second-order moment estimation (beta2) of 0.999; and epsilon set to 1e-7, where this parameter serves the purpose of preventing division by zero.

3.3. Results Evaluation and Comparison

This section undertakes a thorough performance evaluation of Let-Net, conducting experiments across nine publicly available datasets. The evaluation involves both quantitative and qualitative comparisons with other existing methods.

3.3.1. Comparison and Evaluation with Existing FV models

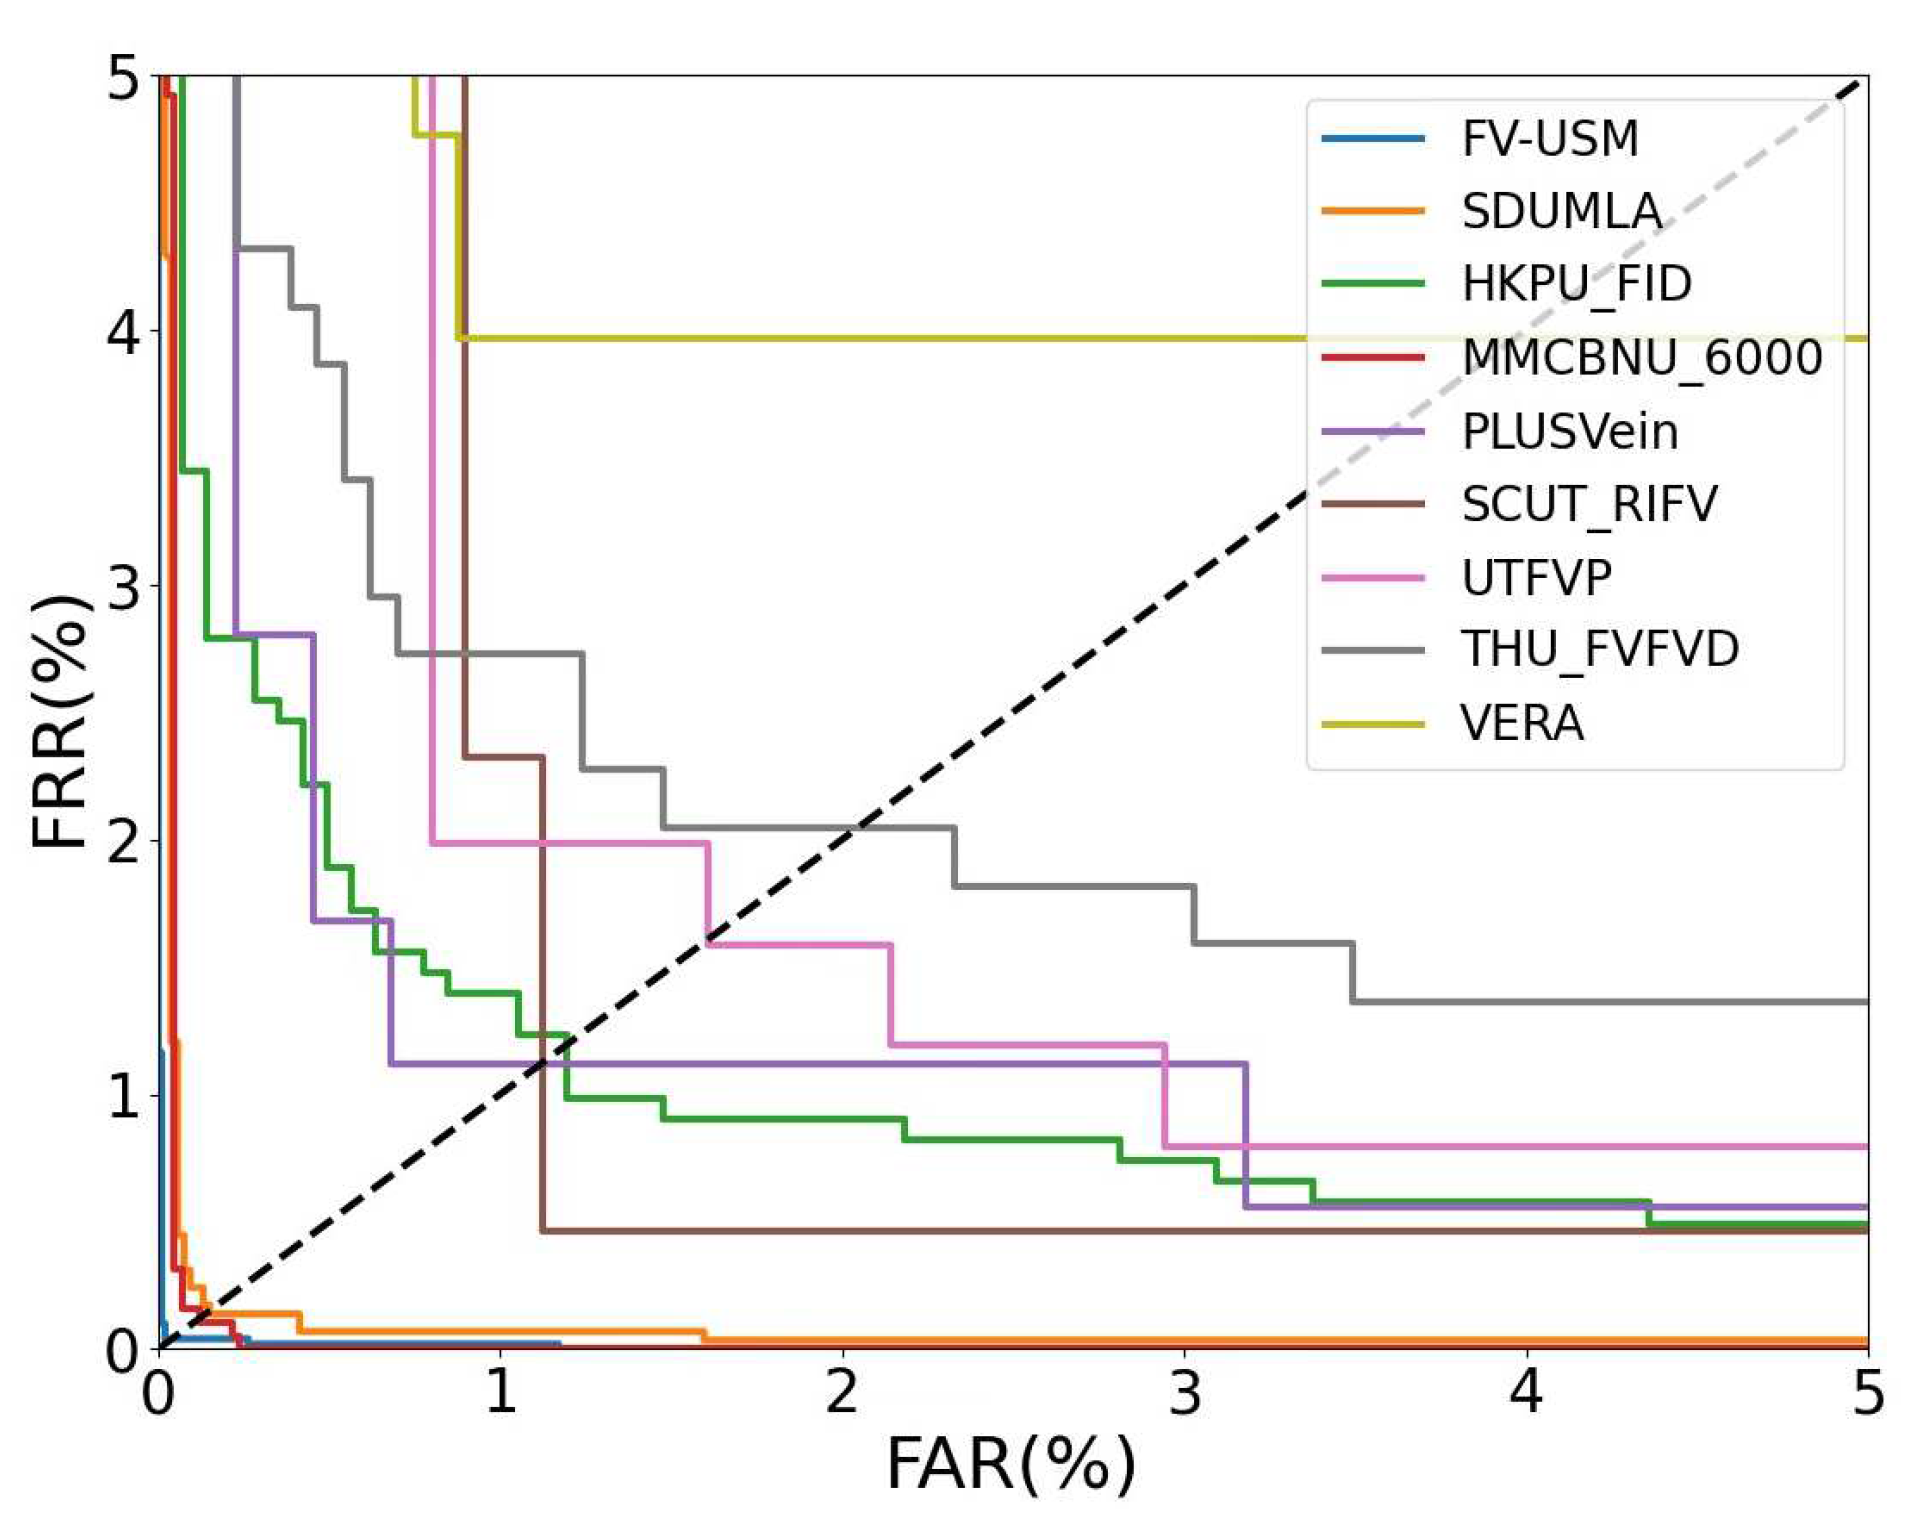
To assess the efficacy of Let-Net, we conducted a comparative analysis with state-of-the-art deep learning-based FV identification models. The benchmark models include FV_CNN [2], a reference to a CNN architecture designed for vein identification. Fvras-net [3], an embedded FV identification system. FV code [29], a method employing FV code indexing. L-CNN [30], a lightweight CNN model. ArcVein [31], which introduces a novel loss function, Arcvein loss. FVSR-Net [32], a model integrating a bio-optical model with a multi-scale CNN E-Net. S-CNN [33], a novel Shallow CNN model. FVT [6], a transformer-based deep model pioneering experiments across nine datasets. And FVFSNet [34], a method concurrently extracting FV features in the spatial and frequency domains. Employing EER as a metric, comparative experiments were conducted across nine public FV datasets outlined in Section 3.1, with the results presented in Table 1. The Receiver Operating Characteristic Curves(ROC) of the proposed Let-Net on nine FV datasets are shown in Figure 4. The outcomes reveal significant advantages of Let-Net when compared with several advanced models. Notably, on the FV_USM and SDUMLA datasets, Let-Net reduces the EER by 0.91% and 1.56%, respectively, in comparison to the Fvras-net algorithm [3]. Furthermore, in comparison to the latest FVSR-Net [34], Let-Net demonstrates competitive results, achieving optimal performance on eight datasets, excluding SCUT_RIFV. The experimental findings underscore Let-Net’s lower EER compared to most currently proposed FV identification methods, substantiating its efficacy and generalization capabilities.

3.3.2. Ablation Experiments

To elucidate the significance of each constituent in the network model design, we conducted three sets of ablation experiments, the outcomes of which are presented in Table 2. The designations highlighted in bold fonts in the table denote components incorporated into the final model.
Kernel Size: The initial exploration assesses the impact of diverse kernel sizes on identification performance. Through manipulating the size of the large kernel, the experiment discerned optimal results when the large kernel size was set to 13 × 13 . Despite the intuitive concern that overly large kernel sizes may adversely affect feature extraction given a feature map size of 16 × 16 × 128 , practical findings demonstrated that large-sized kernels can adapt to small feature maps and even enhance results. For the FV identification task, a larger kernel size minimally impacts experimental outcomes, and even a size of 31 × 31 yields satisfactory results. However, considering accuracy and computational cost, a kernel size of 13 × 13 is ultimately selected.
Components of Let-Net:Table 2 explicitly delineates the influence of large kernels on network performance. The absence of large kernels leads to a 3.12% reduction in accuracy for the SDUMLA dataset. The attention module NAM exerts a profound impact on FV identification, as the removal of NAM results in a direct accuracy drop to 95.17% for SDUMLA. Upon analysis, NAM refines features extracted by CNN, directing the model’s attention to salient feature components. While the Stem Block minimally affects experimental results, it demonstrates a certain degree of generalization effect. Let-Net synergistically leverages the advantages of the Stem Block, LK Block, and NAM. The integration of large kernels and attention modules enables Let-Net to effectively learn and extract FV features, achieving commendable results on both datasets with a high identification rate.
Large Kernel Architecture: The investigation into three hybrid architecture designs (Section 2.3) is detailed in Table 2. The taper connection design outperforms others, showcasing the potent ability of large kernels to optimize FV identification networks. In contrast to some existing work, as evidenced in literature [12], which underscores the efficacy of the parallel reparameterized structure in high-level tasks like image classification, this study finds that the taper connection design yields superior performance. Two potential reasons account for this disparity. Firstly, differences in dataset distribution and quantity, where datasets like ImageNet possess vast amounts of data, while FV datasets comprise significantly fewer samples, posing challenges in optimizing large kernels. Secondly, the task focus diverges, with high-level visual tasks emphasizing semantic information over pixel correspondence between images, as compared to the FV identification task.

3.3.3. Comparative Experimental Results between Let-Net and Classic Models

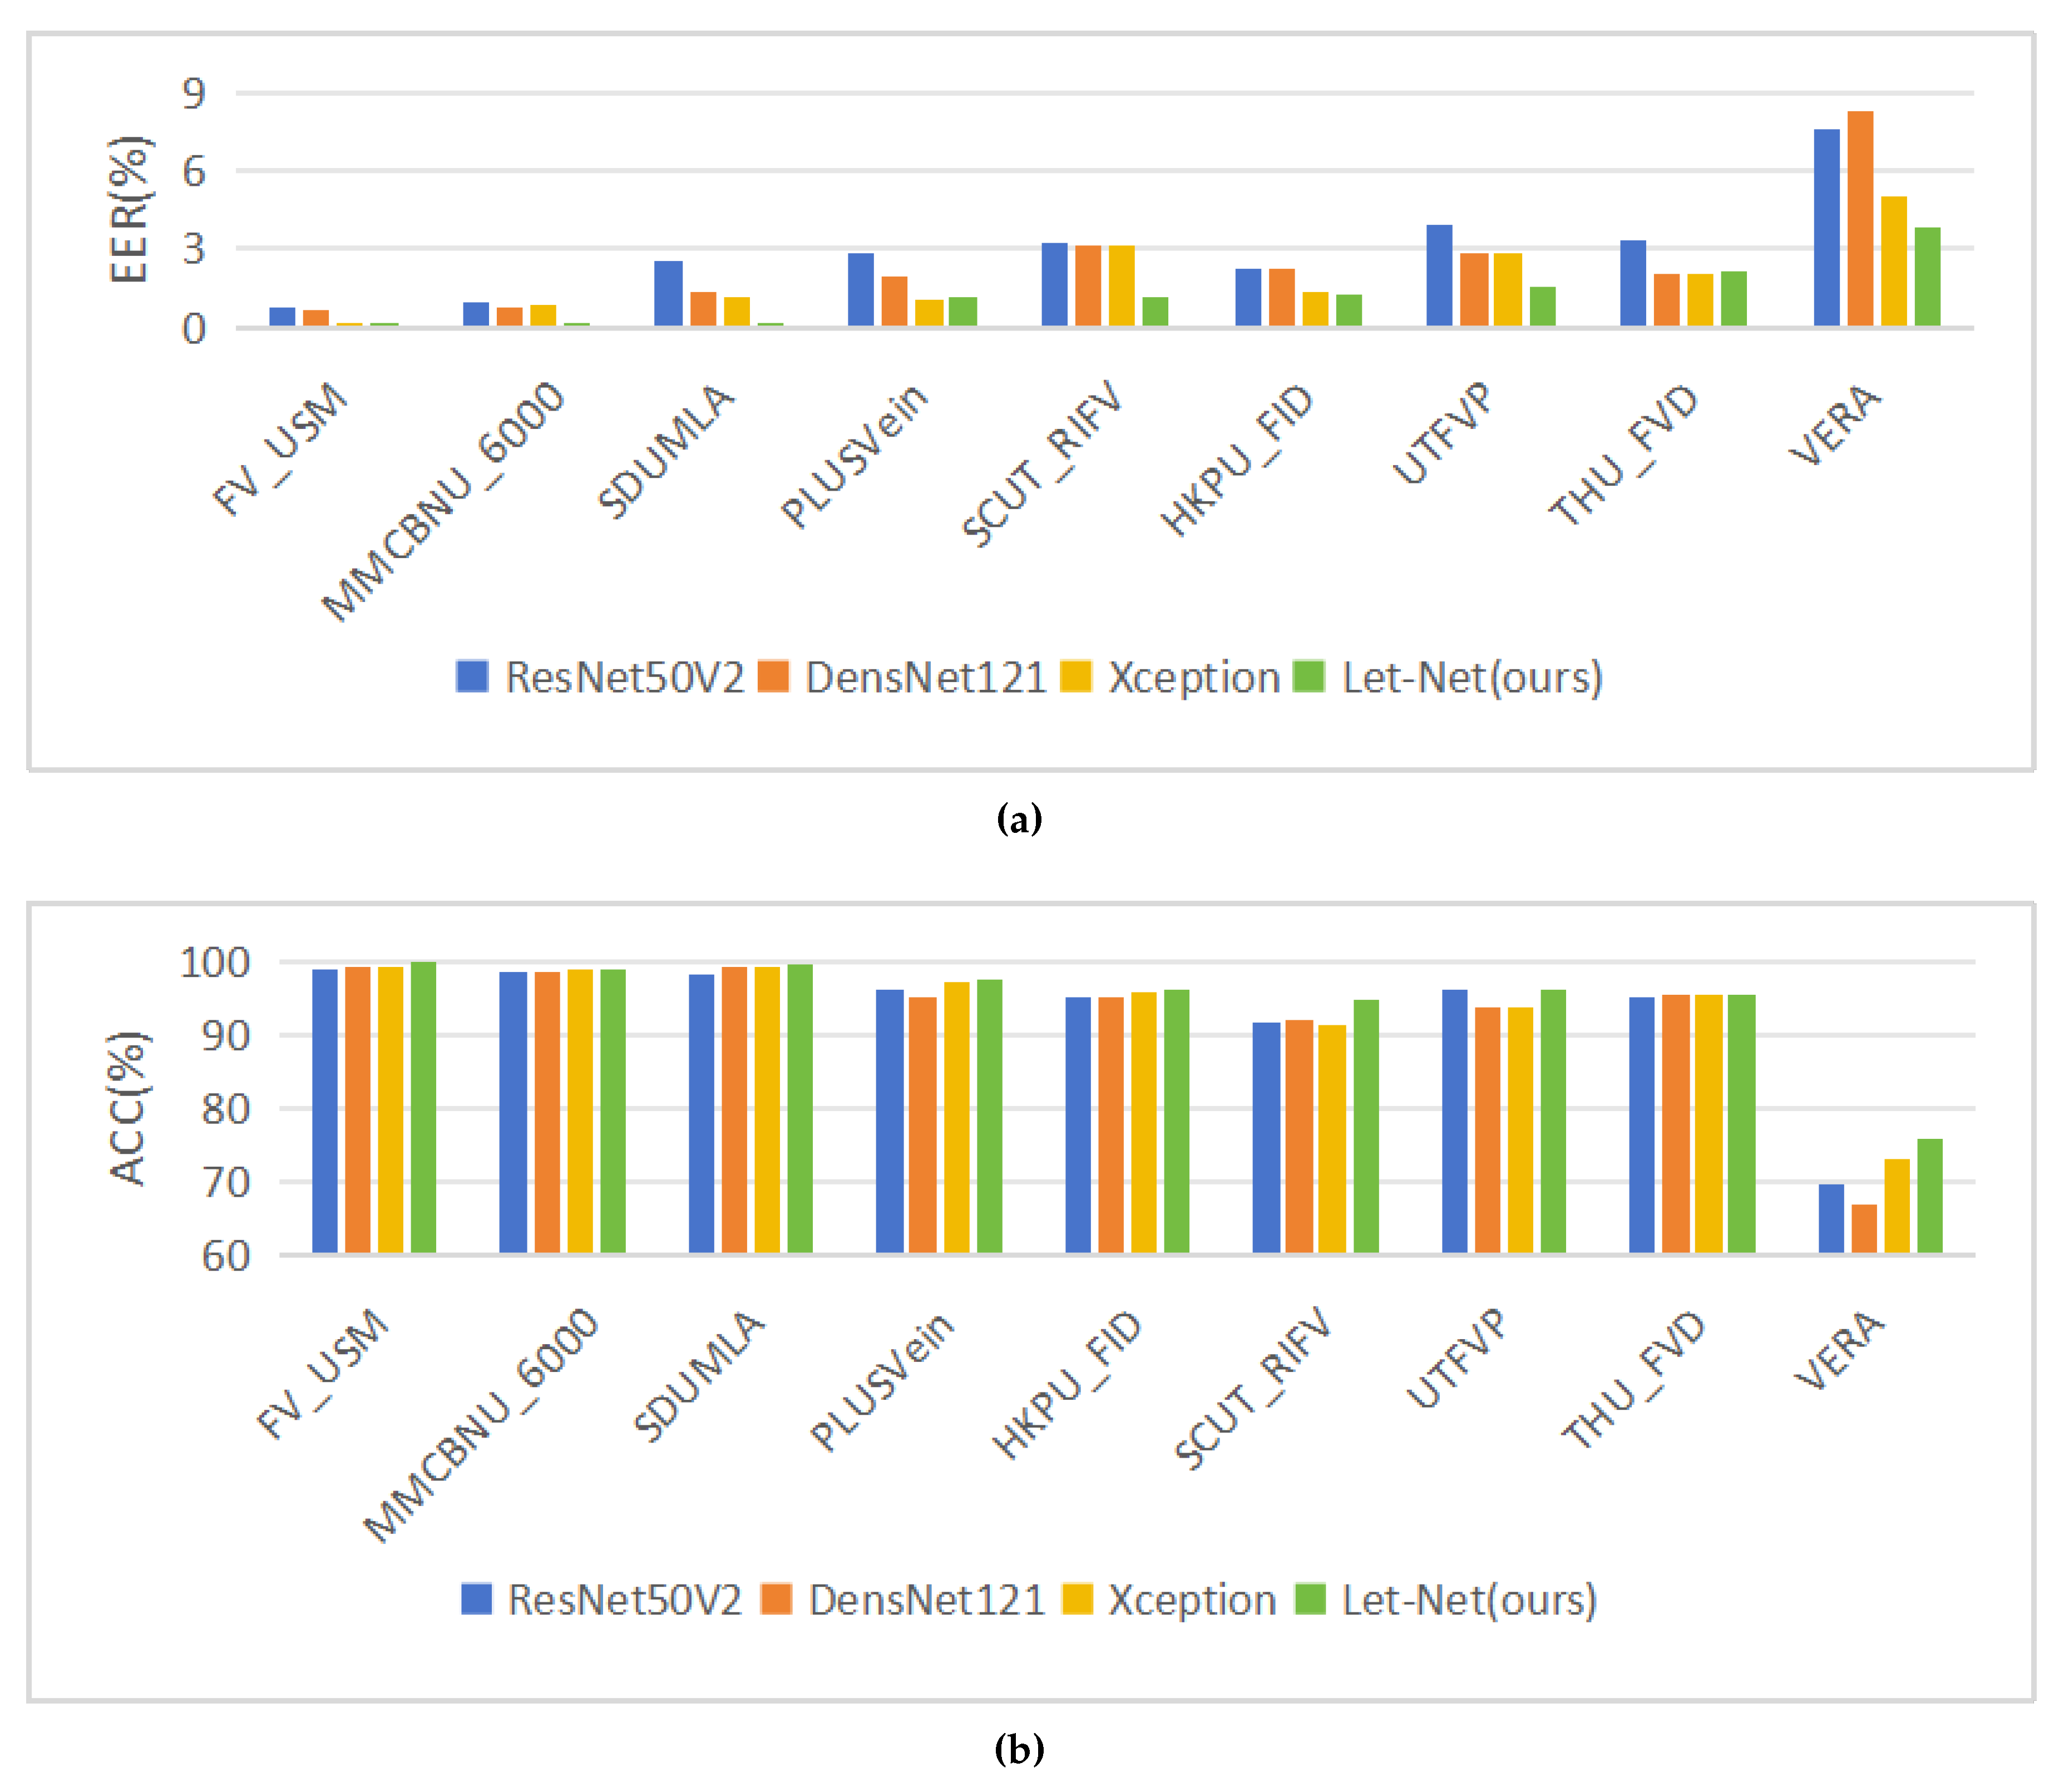
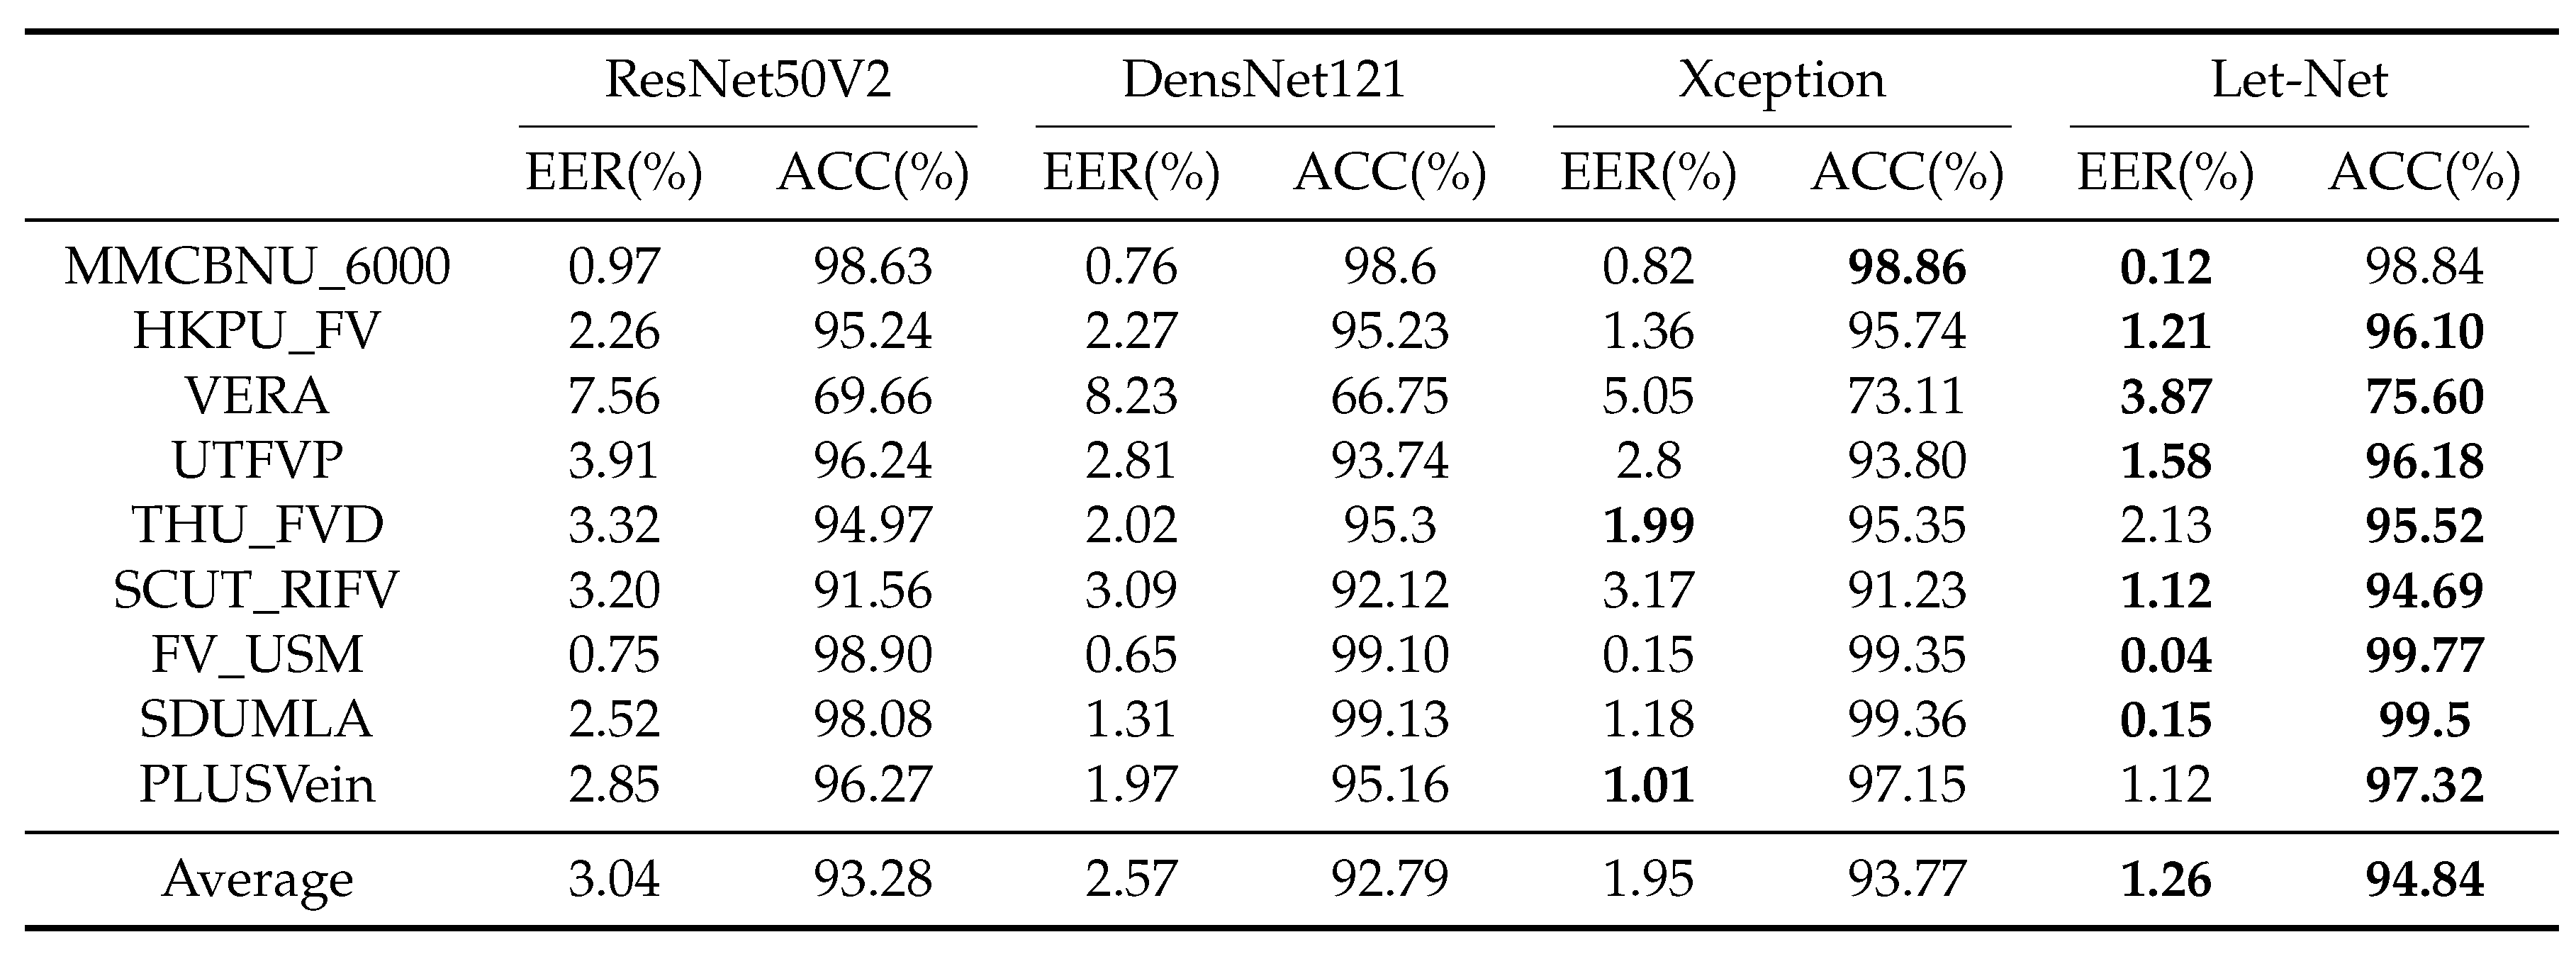
This section employs two evaluation metrics, EER and ACC, to conduct verification experiments across nine publicly accessible FV datasets. The results are comprehensively presented in Table 3. Figure 5 (a) and (b) respectively illustrate the performance comparison between Let-Net and classical models in terms of EER and ACC through bar charts. To establish an intuitive and comparable benchmark, a selection of other deep convolutional network models with analogous network structures is chosen for comparison, including the well-established ResNet50V2, DensNet121, and Xception. The rationale behind choosing these models for comparison lies in their proximity to Let-Net in terms of parameter count and computational cost. Experimental findings reveal that Let-Net consistently outperforms other models in terms of ACC and EER across multiple datasets. Notably, on the MMCBNU_6000 and SCUT_RIFV datasets, Let-Net achieves an EER of only 0.12% and 1.12%, respectively, markedly lower than its counterparts, signifying its robust capability in minimizing EER. Particularly noteworthy are the ACC scores on the SDUMLA and FV_USM datasets, where Let-Net attains ACC values of 99.5% and 99.77%, respectively—remarkable improvements in comparison to other models.
In practical deployment scenarios, especially considering the prevalent use of edge computing devices with constrained resources as the target platform, substantial disparities often exist between the hardware configuration of these devices and the research and development environment employed for model training and optimization. To comprehensively assess the efficacy and viability of the Let-Net model in real-world applications, this study meticulously quantifies pivotal metrics, specifically the count of parameters (Params) and the tally of Floating Point Operations (FLOPs). As depicted in Table 4, Let-Net exhibits remarkable lightweight characteristics when compared to several classic models. With a mere 0.89M parameters, it achieves a controlled total of 0.25G floating point operations, marking it as one of the most resource-efficient models.

3.3.4. Computational Cost

This section conducts experiments to assess the processing time of various datasets using the dual-channel architecture of classical networks. Utilizing the SDUMLA and FV_SUM datasets as exemplars, the time expended in each training round for prominent models, including VGG, ResNet, and Xception, was computed. The outcomes are presented in Table 5 and Table 6, where "Training" and "Prediction" indicate the time required for a training round and predicting the entire test set, respectively. "Total" represents the sum of training and prediction time, while "Single batch time" signifies the time spent training a single batch of samples. Across both FV_USM and SDUMLA datasets, Let-Net exhibits lower time consumption compared to other deep learning models. This can be attributed to several factors. Firstly, the Stem Block employs depthwise convolution, traditional convolution, and max-pooling to reduce the size of the input feature map. Max-pooling downsamples the feature map, while convolution increases the dimension to prevent excessive loss of feature information. Moreover, the extensive use of depthwise convolution in the Stem Block significantly reduces the number of parameters compared to traditional convolution, enhancing the model’s generalization ability. Secondly, the LK Block’s core module employs the principles of deep convolution, and the large kernel itself minimally impacts the parameter count. Lastly, Let-Net’s reliance on a single fully connected layer with only two output neurons reduces parameters compared to mainstream network models like VGG and ResNet. While these models boast tens of millions of parameters, Let-Net maintains a lightweight profile with only tens to hundreds of thousands of parameters. Consequently, the method we proposed demonstrates lower computational cost and memory requirements than other network models.

4. Summary and Outlook

In this work, we introduce Let-Net, a model combining CNN and an attention mechanism. Employing a dual-channel architecture, Let-Net extends the dataset scale, utilizing the large receptive field provided by the large kernel to augment local vein image information. It integrates the attention mechanism to capture long-distance dependencies within images. Experimental results demonstrate Let-Net’s effectiveness in enhancing identification accuracy and reducing misidentification rates, surpassing current state-of-the-art methods across multiple datasets and exhibiting robust generalization. Notably, on the SDUMLA and FV_USM datasets, Let-Net achieves identification accuracies of 99.5% and 99.77%, with EER of only 0.15 and 0.04, ranking it first among published methods. Moreover, Let-Net demonstrates cost-effectiveness in terms of network parameter complexity, boasting the parameter size and FLOPs of only 0.89M and 0.25G compared to other CNN models. Let-Net’s robust feature extraction capabilities not only enhance FV identification but also hold promise for applications in other biometric identification domains. Furthermore, its potential extension to multi-modal biometric scenarios further broadens its applicability.

References

  1. Radzi S A, Hani M K, Bakhteri R. Finger-vein biometric identification using convolutional neural network. Turkish Journal of Electrical Engineering and Computer Sciences, 2016, 24(3): 1863-1878. [CrossRef]
  2. Das R, Piciucco E, Maiorana E, Maiorana E, Campisi P. Convolutional neural network for finger-vein-based biometric identification. IEEE Transactions on Information Forensics and Security, 2018, 14(2): 360-373. [CrossRef]
  3. Yang W, Luo W, Kang W, Huang Z and Wu Q. Fvras-net: An embedded finger-vein recognition and antispoofing system using a unified cnn. IEEE Transactions on Instrumentation and Measurement, 2020, 69(11): 8690-8701. [CrossRef]
  4. Shaheed K, Mao A, Qureshi I, Kumar M, Hussain S, Ullah I, Zhang X. DS-CNN: A pre-trained Xception model based on depthwise separable convolutional neural network for finger vein recognition. Expert Systems with Applications, 2022, 191: 116288. [CrossRef]
  5. Chen L, Guo T, Li L, et al. A Finger Vein Liveness Detection System Based on Multi-Scale Spatial-Temporal Map and Light-ViT Model. Sensors, 2023, 23(24): 9637.
  6. Huang J, Luo W, Yang W, Zheng A, Lian F, Kang W. FVT: Finger Vein transformer for authentication. IEEE Transactions on Instrumentation and Measurement, 2022, 71: 1-13.
  7. Tome P, Marcel S. On the vulnerability of palm vein recognition to spoofing attacks. In Proceedings of the 2015 International Conference on Biometrics (ICB), Phuket, Thailand, 19-22 May 2015; pp.319-325.
  8. Ton B T, Veldhuis R N J. A high quality finger vascular pattern dataset collected using a custom designed capturing device. In Proceedings of the 2013 International conference on biometrics, Madrid, Spain, 4-7 June 2013; pp.1-5.
  9. Yang W, Hui C, Chen Z, Xue J, Liao Q. FV-GAN: Finger vein representation using generative adversarial networks. IEEE Transactions on Information Forensics and Security, 2019, 14(9): 2512-2524.
  10. Liu Z, Lin Y, Cao Y, Hu H, Wei Y, Zhang Z, Lin S, Guo B. Swin transformer: Hierarchical vision transformer using shifted windows. In proceedings of the IEEE/CVF International Conference on Computer Vision (ICCV), virtually, 11-17 March 2021; pp.10012-10022.
  11. Luo W, Li Y, Urtasun R, Zemel R. Understanding the effective receptive field in deep convolutional neural networks. Advances in neural information processing systems, 2016, 29.
  12. Ding X, Zhang X, Han J, Ding G. Scaling up your kernels to 31x31: Revisiting large kernel design in cnns. In proceedings of the IEEE/CVF Conference on Computer Vision and Pattern Recognition (CVPR), New Orleans, Louisiana, 19-23 June 2022; pp.11963-11975.
  13. Hu H, Zhang Z, Xie Z, Lin S. Local relation networks for image identification. In proceedings of the IEEE/CVF International Conference on Computer Vision (ICCV), Seoul, Korea, 27 October-2 November 2019; pp.3464-3473.
  14. Peng C, Zhang X, Yu G, Luo G, Sun J. Large kernel matters–improve semantic segmentation by global convolutional network. In Proceedings of the IEEE conference on computer vision and pattern recognition (CVPR), Honolulu, Hawaii, 21-26 July 2017; pp.4353-4361.
  15. Romero D W, Bruintjes R J, Tomczak J M, Bekkers E J, Hoogendoom M, van Gemert J C. Flexconv: Continuous kernel convolutions with differentiable kernel sizes. arXiv 2021, arXiv:2110.08059.
  16. Liu Z, Mao H, Wu C Y, Feichtenhofer C, Darrell T, Xie S. A convnet for the 2020s. In proceedings of the IEEE/CVF conference on computer vision and pattern recognition (CVPR), New Orleans, Louisiana, 19-23 June 2022; pp.11976-11986.
  17. Mnih V, Heess N, Graves A. Recurrent models of visual attention. Advances in neural information processing systems, 2014, 27.
  18. Woo S, Park J, Lee J Y, Kweon I S. Cbam: Convolutional block attention module. In proceedings of the European conference on computer vision (ECCV), Munich, Germany, 8-14 September 2018; pp.3-19.
  19. De Silva M, Brown D. Multispectral Plant Disease Detection with Vision Transformer–Convolutional Neural Network Hybrid Approaches. Sensors, 2023, 23(20): 8531. [CrossRef]
  20. Kang W, Lu Y, Li D, Jia W. From noise to feature: Exploiting intensity distribution as a novel soft biometric trait for finger vein recognition. IEEE transactions on information forensics and security, 2018, 14(4): 858-869.
  21. Liu Y, Shao Z, Teng Y, Hoffmann N. NAM: Normalization-based attention module. arXiv 2021, arXiv:2111.12419.
  22. Yin Y, Liu L, Sun X. SDUMLA-HMT: a multimodal biometric database. In proceedings of the Chinese Conference on Biometric Recognition (CCBR), Beijing, China, 3-4 December 2011; pp.260-268.
  23. Asaari M S M, Suandi S A, Rosdi B A. Fusion of band limited phase only correlation and width centroid contour distance for finger based biometrics. Expert Systems with Applications, 2014, 41(7): 3367-3382. [CrossRef]
  24. Kumar A, Zhou Y. Human identification using finger images. IEEE Transactions on image processing, 2011, 21(4): 2228-2244. [CrossRef]
  25. Tang S, Zhou S, Kang W, Wu Q, Deng F. Finger vein verification using a Siamese CNN. IET biometrics, 2019, 8(5): 306-315. [CrossRef]
  26. Kauba C, Prommegger B, Uhl A. Focussing the beam-a new laser illumination based dataset providing insights to finger-vein recognition. In proceedings of the 2018 IEEE 9th International Conference on Biometrics Theory, Applications and Systems (BTAS), Redondo Beach, CA, USA, 25 October 2018; pp.1-9.
  27. Lu Y, Xie S J, Yoon S, Wang Z, Park D S. An available database for the research of finger vein recognition. In proceedings of the 2013 6th International congress on image and signal processing (CISP), Hangzhou, China, 16-18 December 2013; pp.1: 410-415.
  28. Yang W, Qin C, Liao Q. A database with ROI extraction for studying fusion of finger vein and finger dorsal texture. In proceedings of the Biometric Recognition: 9th Chinese Conference(CCBR), Shenyang, China, 7-9 November 2014; pp.266-270.
  29. Yang L, Yang G, Xi X, Su Kun, Chen C, Yin Y. Finger vein code: From indexing to matching. IEEE Transactions on Information Forensics and Security, 2018, 14(5): 1210-1223.
  30. Shen J, Liu N, Xu C, Sun H, Xiao Y, Li D, Zhang Y. Finger vein recognition algorithm based on lightweight deep convolutional neural network. IEEE Transactions on Instrumentation and Measurement, 2021, 71: 1-13. [CrossRef]
  31. Hou B, Yan R. ArcVein-arccosine center loss for finger vein verification. IEEE Transactions on Instrumentation and Measurement, 2021, 70: 1-11.
  32. Du S, Yang J, Zhang H, Zhang B, Su Z. FVSR-net: an end-to-end finger vein image scattering removal network. Multimedia Tools and Applications, 2021, 80: 10705-10722. [CrossRef]
  33. Liu J, Chen Z, Zhao K, Wang M, Hu Z, Wei X, Zhu Y, Feng Z, Kim H, Jin C. Finger vein recognition using a shallow convolutional neural network. In proceedings of the Biometric recognition: 15th Chinese Conference (CCBR), Shanghai, China, 10–12 September 2021; pp.195-202.
  34. Huang J, Zheng A, Shakeel M S, Yang W, Kang W. FVFSNet: Frequency-spatial coupling network for finger vein authentication. IEEE Transactions on Information Forensics and Security, 2023, 18: 1322-1334. [CrossRef]
Figure 1. Method flow and overall structure of Let-Net.
Preprints 96002 g001
Figure 2. Structural design of large kernel.
Preprints 96002 g002
Figure 3. Channel attention mechanism and spatial attention mechanism.
Preprints 96002 g003
Figure 4. ROC curves of Let-Net on nine FV datasets.
Preprints 96002 g004
Figure 5. Bar charts of the results of classical models on nine FV datasets. (a)Bar charts of the EERs. (b)Bar charts of the ACC.
Preprints 96002 g005
Table 1. Comparison with Other FV Models.
EER(%)
FV_USM SDUMLA MMCBNU _6000 HKPU_FV THU_FVD SCUT_RIFV UTFVP PLUSVein VERA
FV_CNN [2] - 6.42 - 4.67 - - - - -
Fvras-net [3] 0.95 1.71 1.11 - - - - - -
FV code [29] - - - 3.33 - - - - -
L-CNN [30] - 1.13 - 0.67 - - - - -
ArcVein [31] 0.25 1.53 - 1.3 - - - - -
FVSR-Net[32] - 5.27 - - - - - - -
S-CNN [33] - 2.29 0.47 - - - - - -
FVT [6] 0.44 1.5 0.92 2.37 3.6 1.65 1.97 2.08 4.55
FVFSNet [34] 0.20 1.10 0.18 0.81 2.15 0.83 2.08 1.32 6.82
Let-Net(ours) 0.04 0.15 0.12 1.54 2.13 1.12 1.58 1.12 3.87
Notes: Numbers in bold indicate the minimum EER.
Table 2. Ablation experiment.
Method FV_USM EER(%) SDUMLA EER(%) Parameters(M)
Kernel Size 7 × 7 99.57 99.1 0.72
11 × 11 99.66 99.35 0.81
13 × 13 99.77 99.42 0.89
17 × 17 99.68 99.34 1.08
31 × 31 99.66 99.33 1.67
Components of
Let-Net
No Stem 98.25 97.86 0.51
No LK 96.65 96.27 0.78
No NAM 95.76 95.17 0.66
No Stem&Lk 94.71 94.16 0.52
No Stem&NAM 93.64 93.11 0.27
No LK&NAM 88.12 87.76 0.55
Stem&LK&NAM 99.77 99.5 0.89
Large Kernel
Architecture
Direct Connection 96.32 96.01 0.88
Parallel Connection 98.46 97.26 0.89
Funnel Connection 98.26 97.49 0.89
Taper Connection 99.77 99.5 0.89
Notes: Bold font indicates the optimal structure and its corresponding parameter values.
Table 3. Comparison with the classical Models.
Preprints 96002 i001
Notes: Numbers in bold indicate the minimum EER.
Table 4. Comparison of Let-Net with the classical models in parameters and FLOPs.
Model Params(M) FLOPs(G) EER(%)* ACC(%)*
ResNet50V2 23.63 6.99 3.04 93.28
DensNet121 7.07 5.70 2.57 92.79
Xception 2.09 16.8 1.95 93.77
Let-Net(ours) 0.89 0.25 1.26 94.84
*The average values of nine FV datasets.
Table 5. Processing time on FV_USM.
Training(s) Prediction(s) Total(s) Single batch time(ms)
VGG16 10 5 15 48
VGG19 12 6 18 55
Resnet50V2 11 6 17 53
InceptionV3 16 9 25 78
DensNet121 22 11 33 102
Xception 19 6 25 77
RepLKNet 96 6 120 373
Let-Net(ours) 3 3 6 17
Table 6. Processing time on SDUMLA.
Training(s) Prediction(s) Total(s) Single batch time(ms)
VGG16 13 7 20 48
VGG19 15 8 23 55
Resnet50V2 14 9 23 54
InceptionV3 20 12 32 77
DensNet121 26 15 41 97
Xception 25 7 32 78
RepLKNet 126 32 158 379
Let-Net(ours) 4 3 7 18
Disclaimer/Publisher’s Note: The statements, opinions and data contained in all publications are solely those of the individual author(s) and contributor(s) and not of MDPI and/or the editor(s). MDPI and/or the editor(s) disclaim responsibility for any injury to people or property resulting from any ideas, methods, instructions or products referred to in the content.
Copyright: This open access article is published under a Creative Commons CC BY 4.0 license, which permit the free download, distribution, and reuse, provided that the author and preprint are cited in any reuse.
Prerpints.org logo

Preprints.org is a free preprint server supported by MDPI in Basel, Switzerland.

Subscribe

© 2024 MDPI (Basel, Switzerland) unless otherwise stated