Submitted:
10 January 2024
Posted:
10 January 2024
You are already at the latest version
Abstract
Keywords:
1. Introduction
2. Materials and Methods
2.1. Study Site
2.2. Experimental Set-Up
2.3. Weeds Investigation
2.4. Sampling and Measurements
2.4.1. Growth index
2.4.2. Photosynthetic parameters
2.4.3. Antioxidant and nitrogen metabolism enzymes
2.4.4. Yield and effective components
2.5. Data Analysis
3. Results
3.1. Weeds Investigation
3.2. Growth of Licorice
3.3. Photosynthetic Parameters
3.4. Antioxidant Enzyme Activities
3.5. Nitrogen Metabolism Enzyme Activities
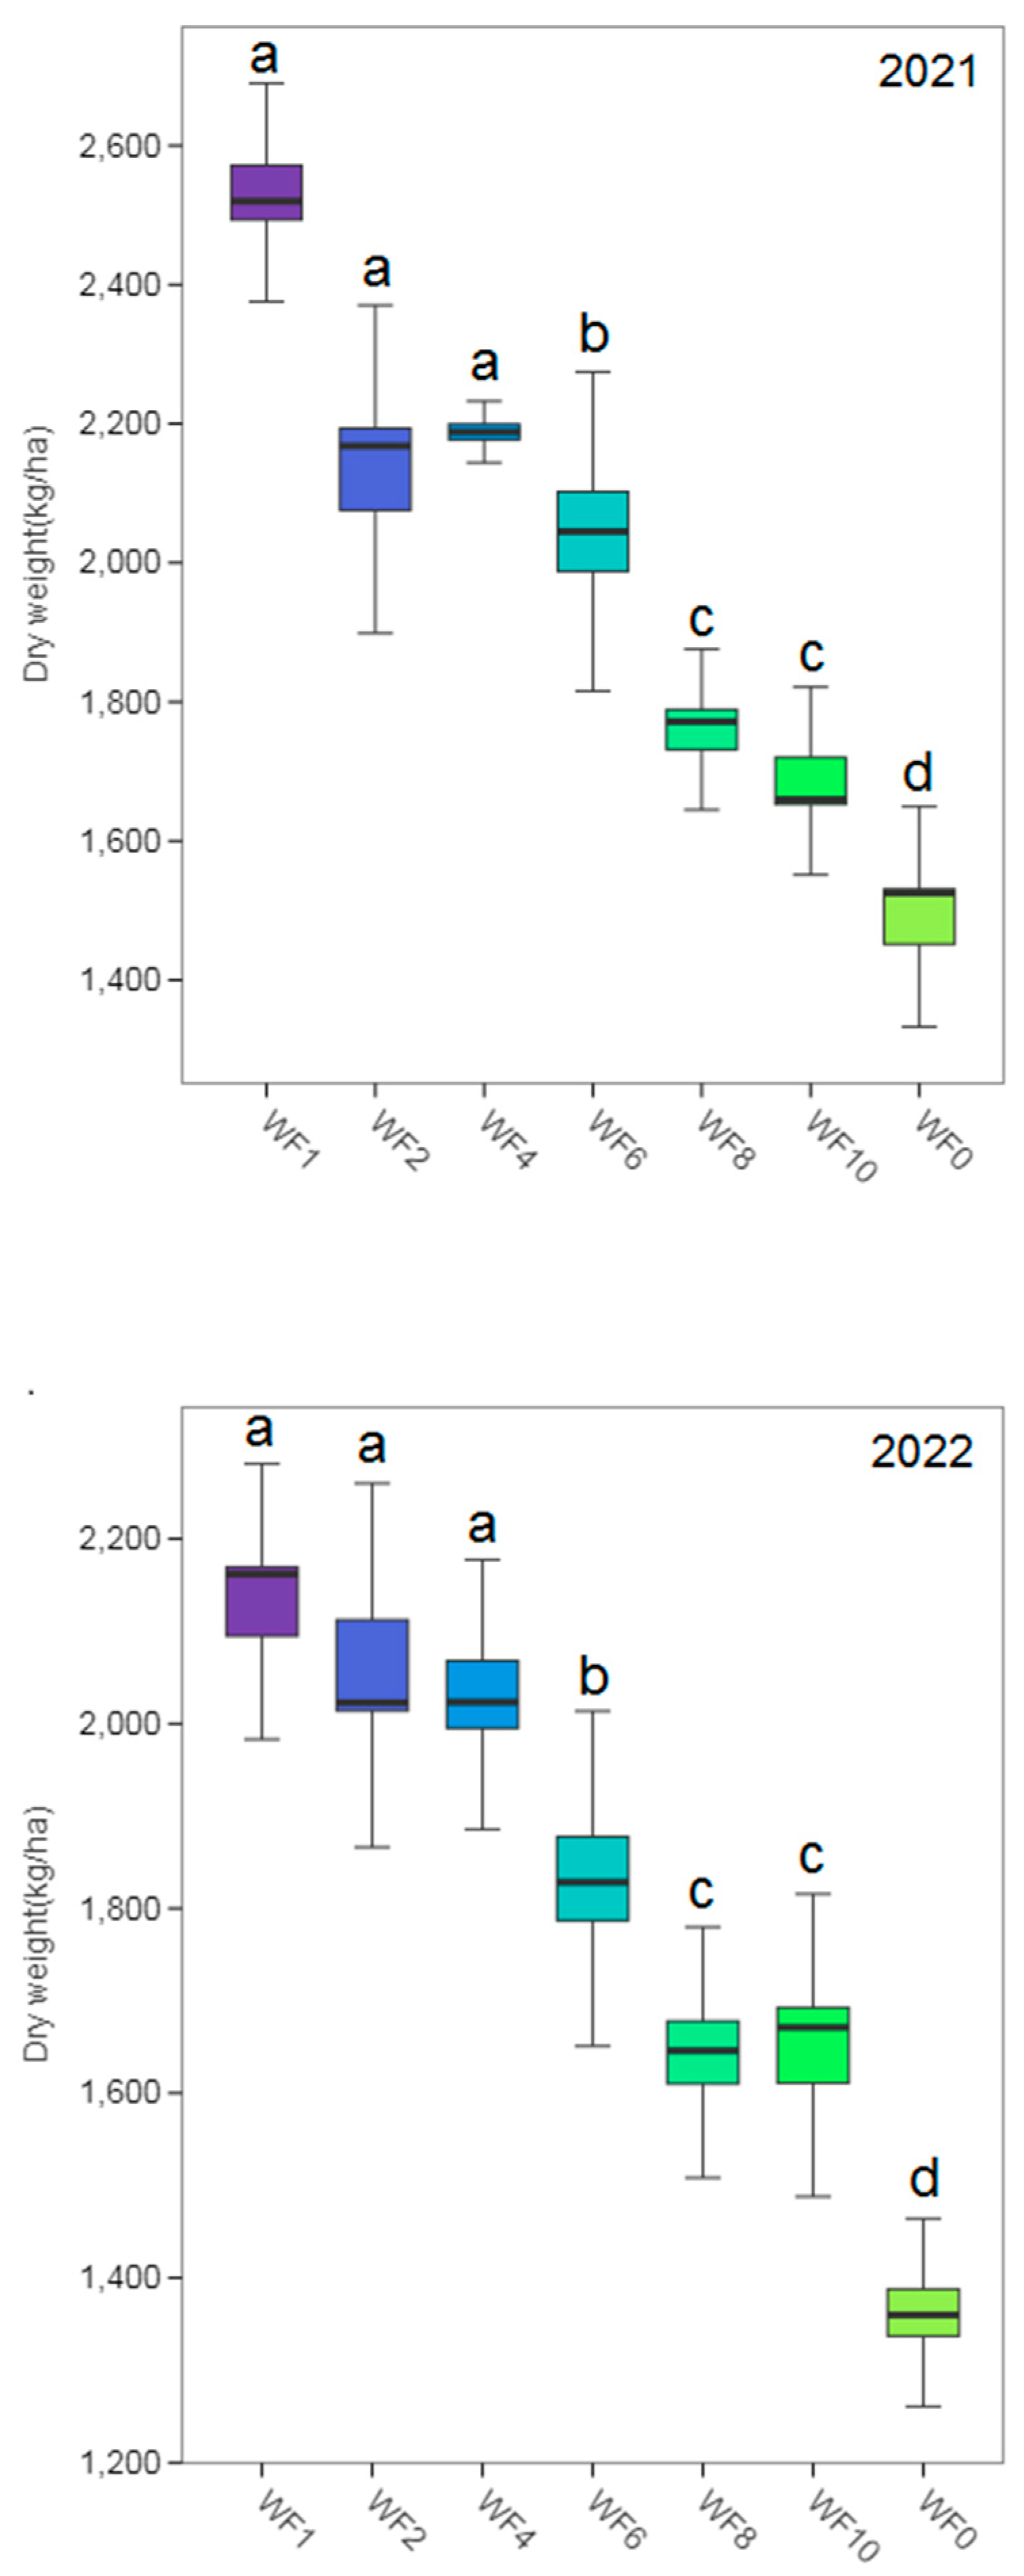
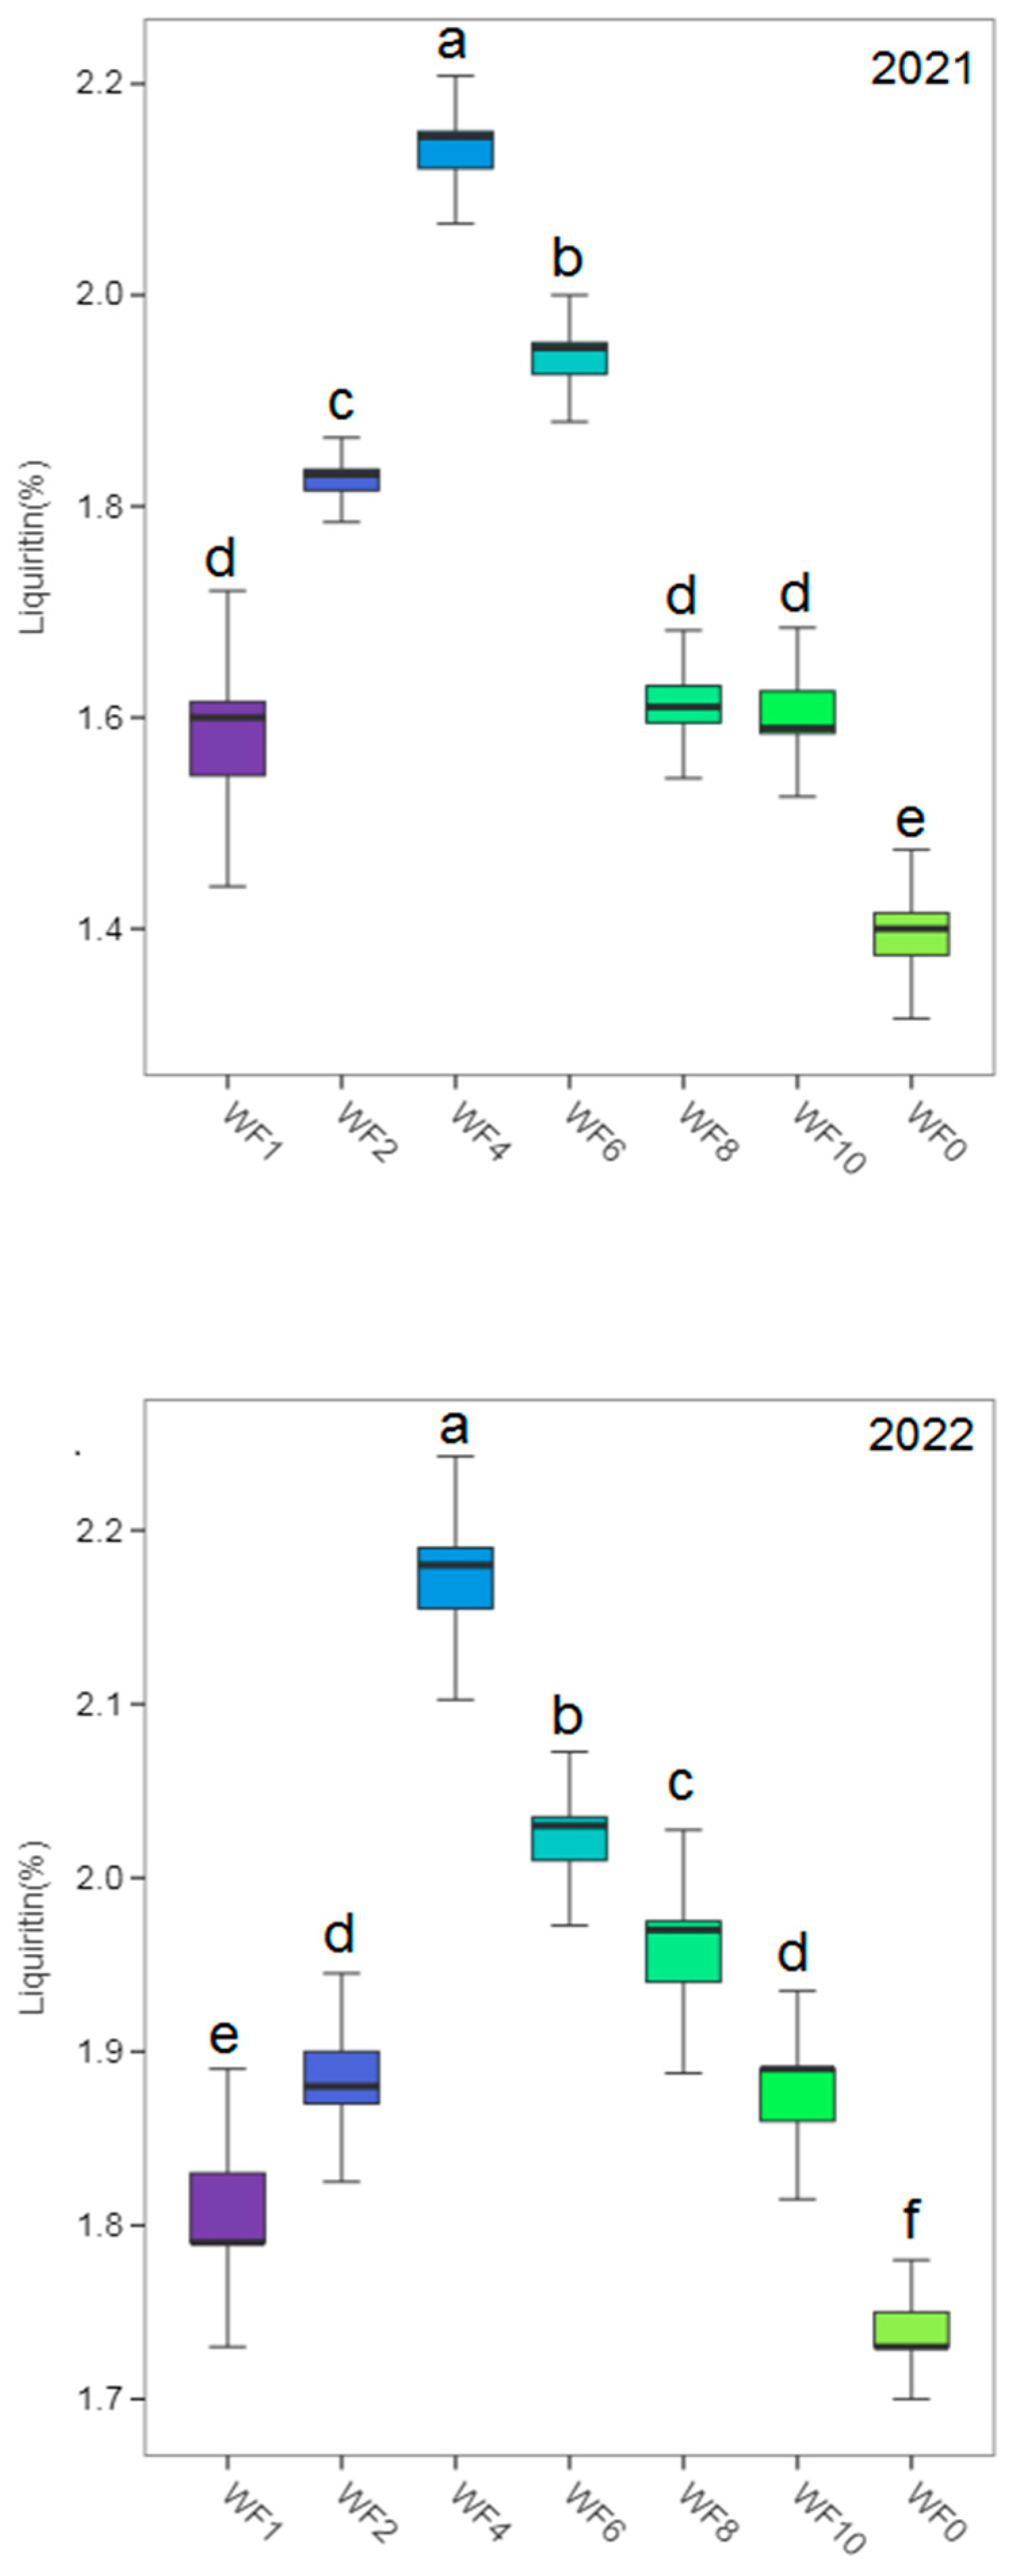
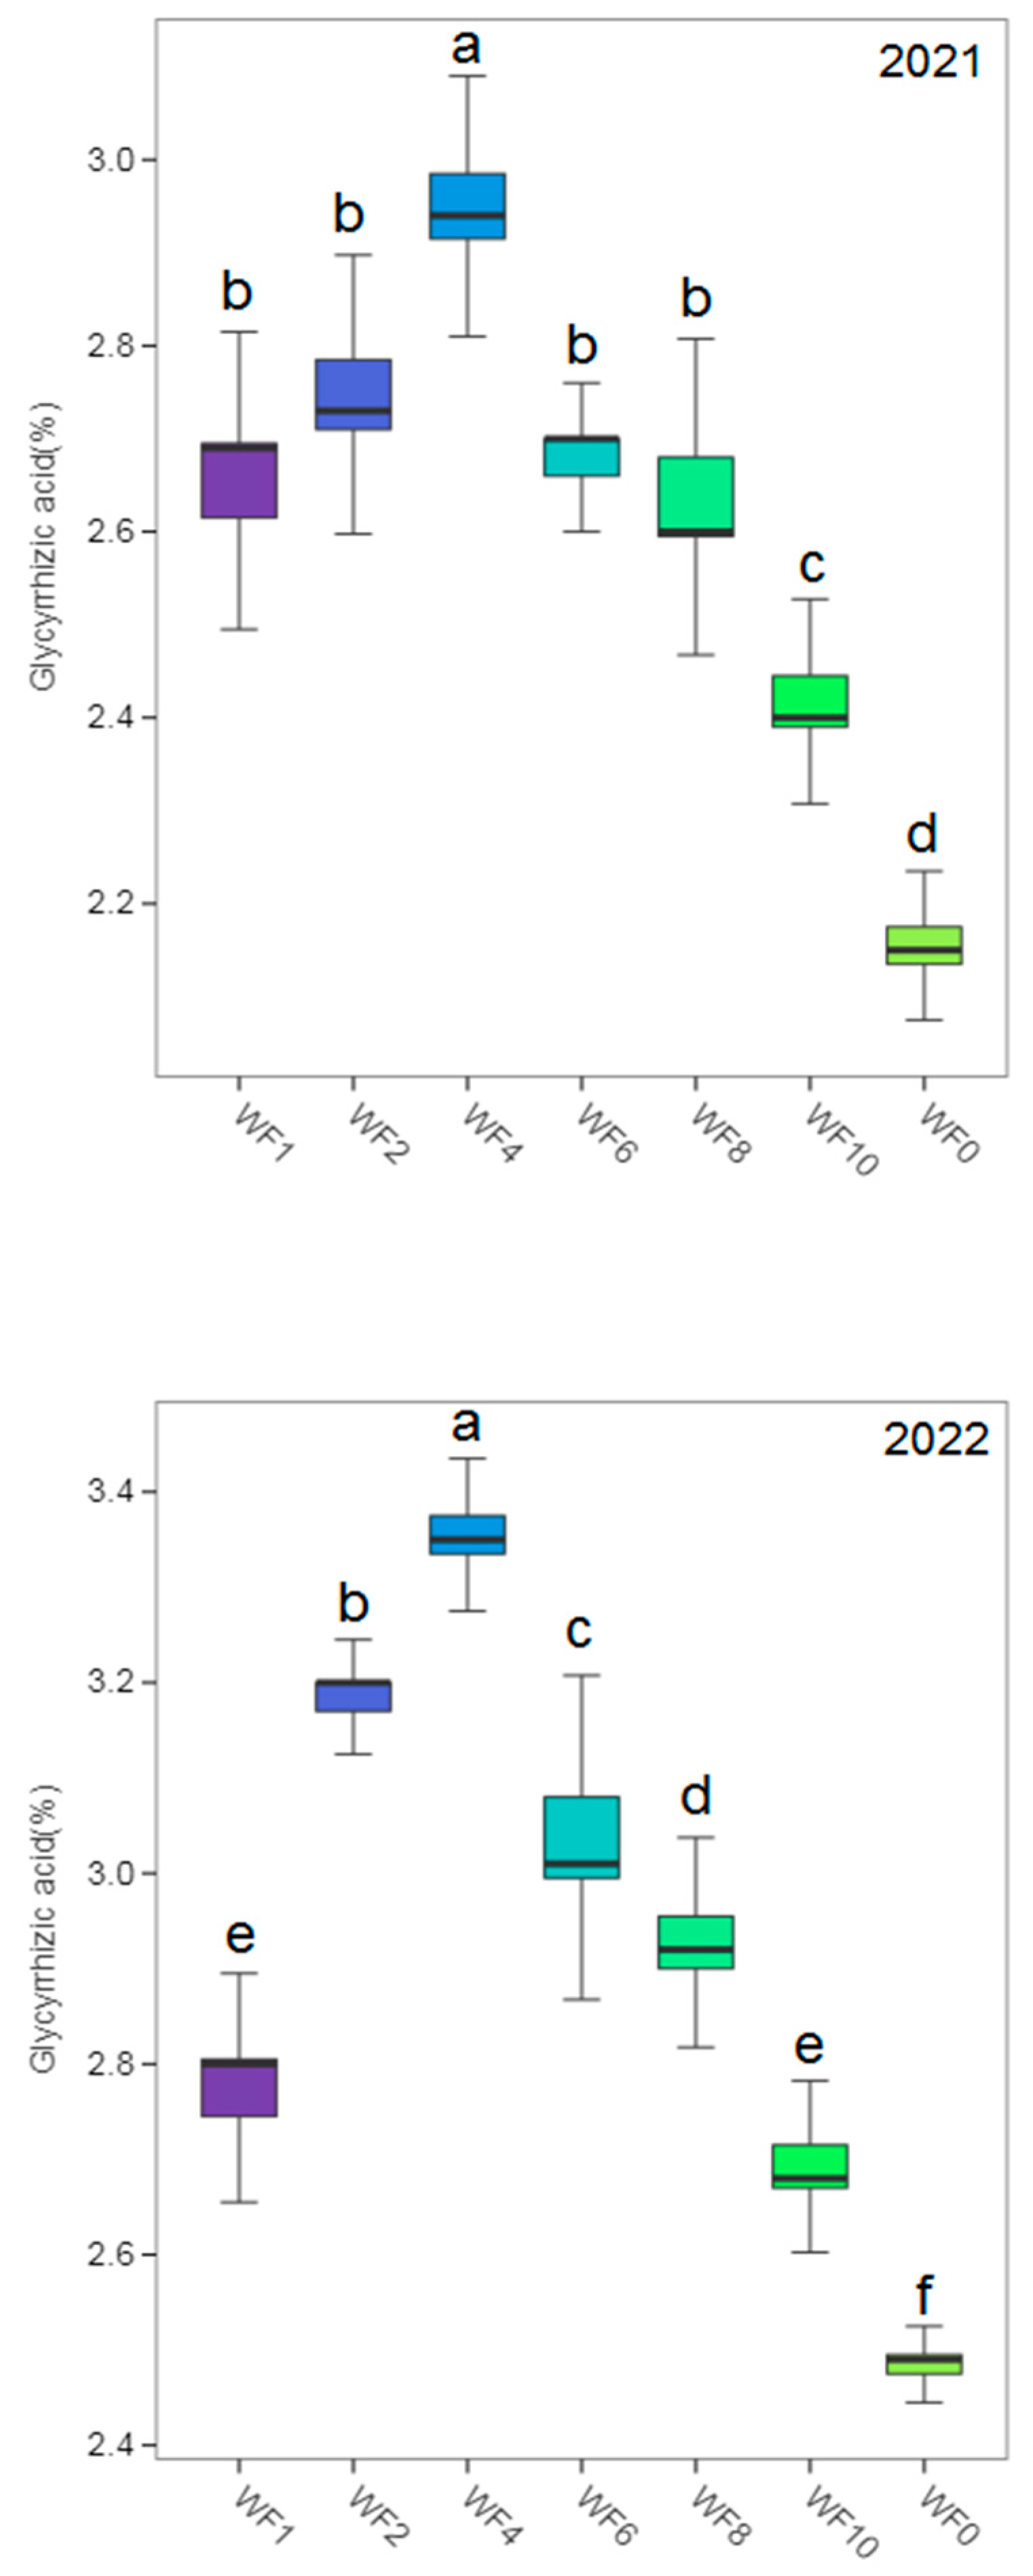
3.6. Yield and Effective Components
3.7. Economic Benefit
| Year | Weeds interference frequency | Weeding costs (CNY/ha) |
Gross income (CNY/ha) |
Net income (CNY/ha) |
|---|---|---|---|---|
| 2021 | WF1 | 12000 | 40583.31±1276.38a | 16583.31±1276.38bc |
| WF2 | 6000 | 33973.09±1986.02b | 15973.09±1986.03cd | |
| WF4 | 3000 | 35011.40±353.84 b | 20011.40±353.84a | |
| WF6 | 1950 | 32720.22±1834.66b | 18770.22±1834.66ab | |
| WF8 | 1500 | 28103.03±946.79c | 14603.03±946.79cd | |
| WF10 | 1200 | 27122.79±1186.75c | 13922.79±1186.75de | |
| WF0 | 0 | 23675.86±1413.25d | 11675.85±1413.25e | |
| 2022 | WF1 | 12000 | 33955.20±1312.96 a | 9955.20±1312.96d |
| WF2 | 6000 | 33225.60±1743.35a | 15225.60±1743.35b | |
| WF4 | 3000 | 32548.80±1177.42 a | 17548.80±1177.42a | |
| WF6 | 1950 | 29336.00±1452.55 b | 15386.00±1452.55ab | |
| WF8 | 1500 | 26294.40±1086.57c | 12794.40±1086.57c | |
| WF10 | 1200 | 26325.60±1358.29c | 13125.60±1358.29bc | |
| WF0 | 0 | 21814.40±815.04d | 9814.40±815.04d |
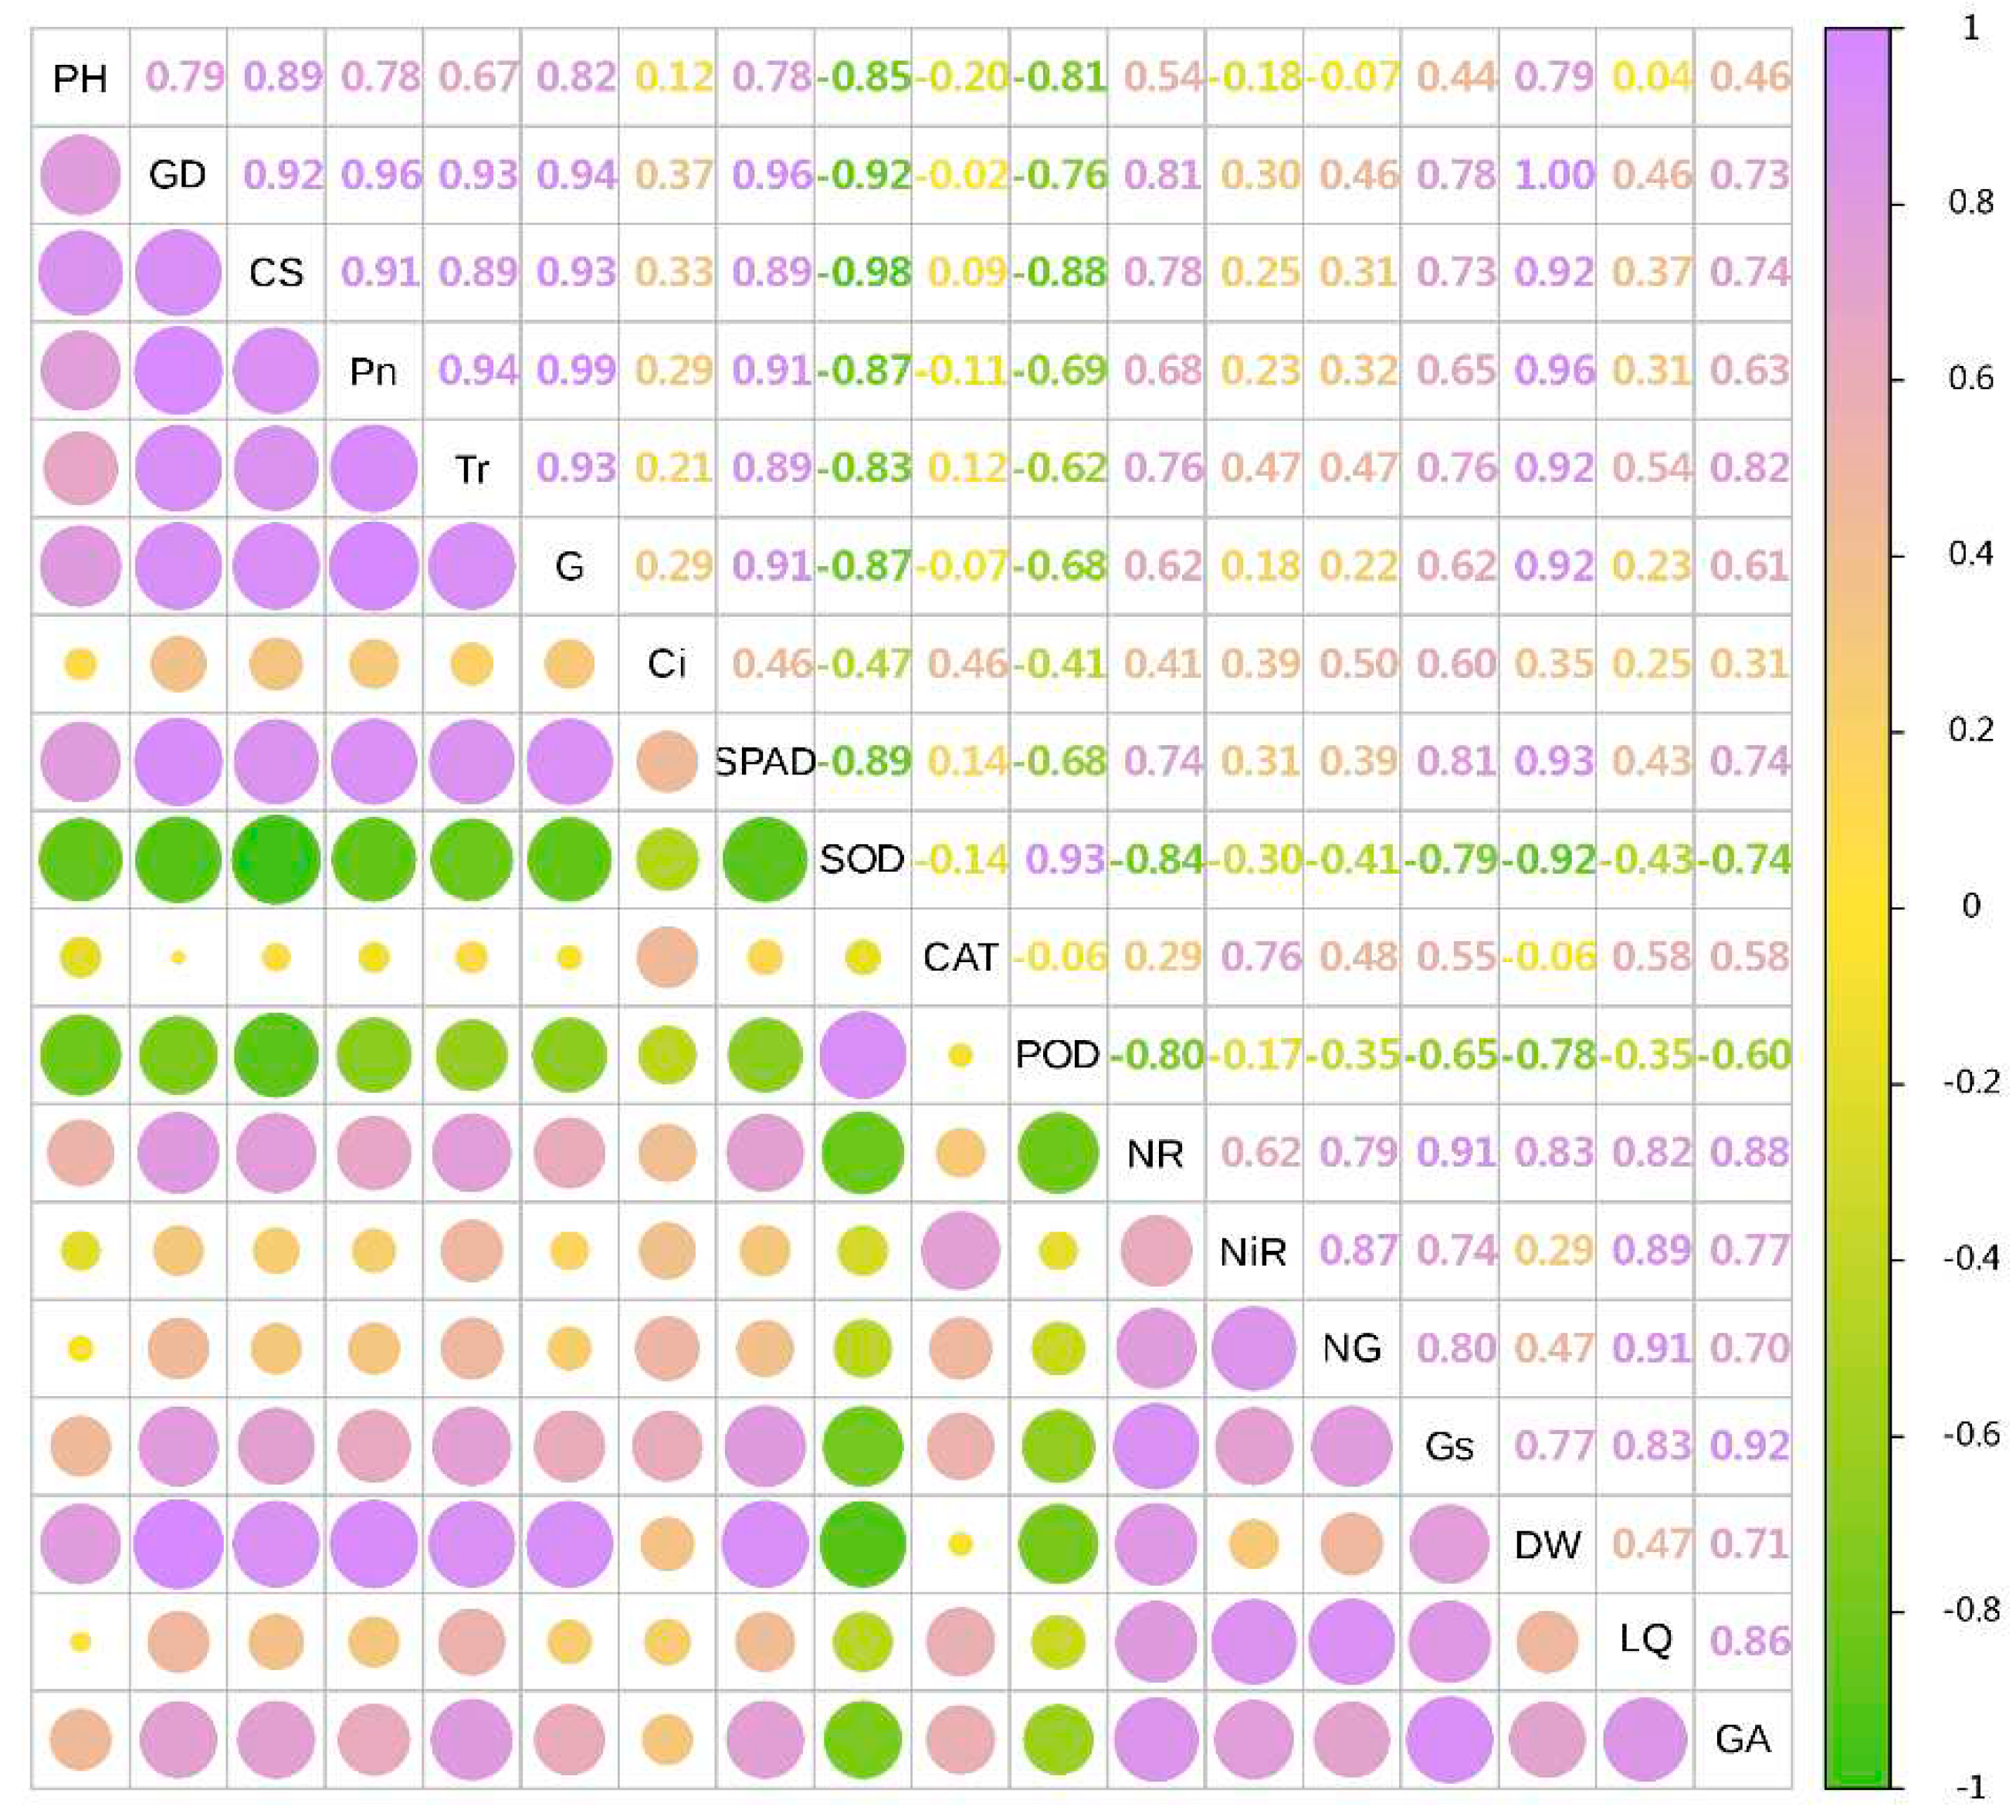
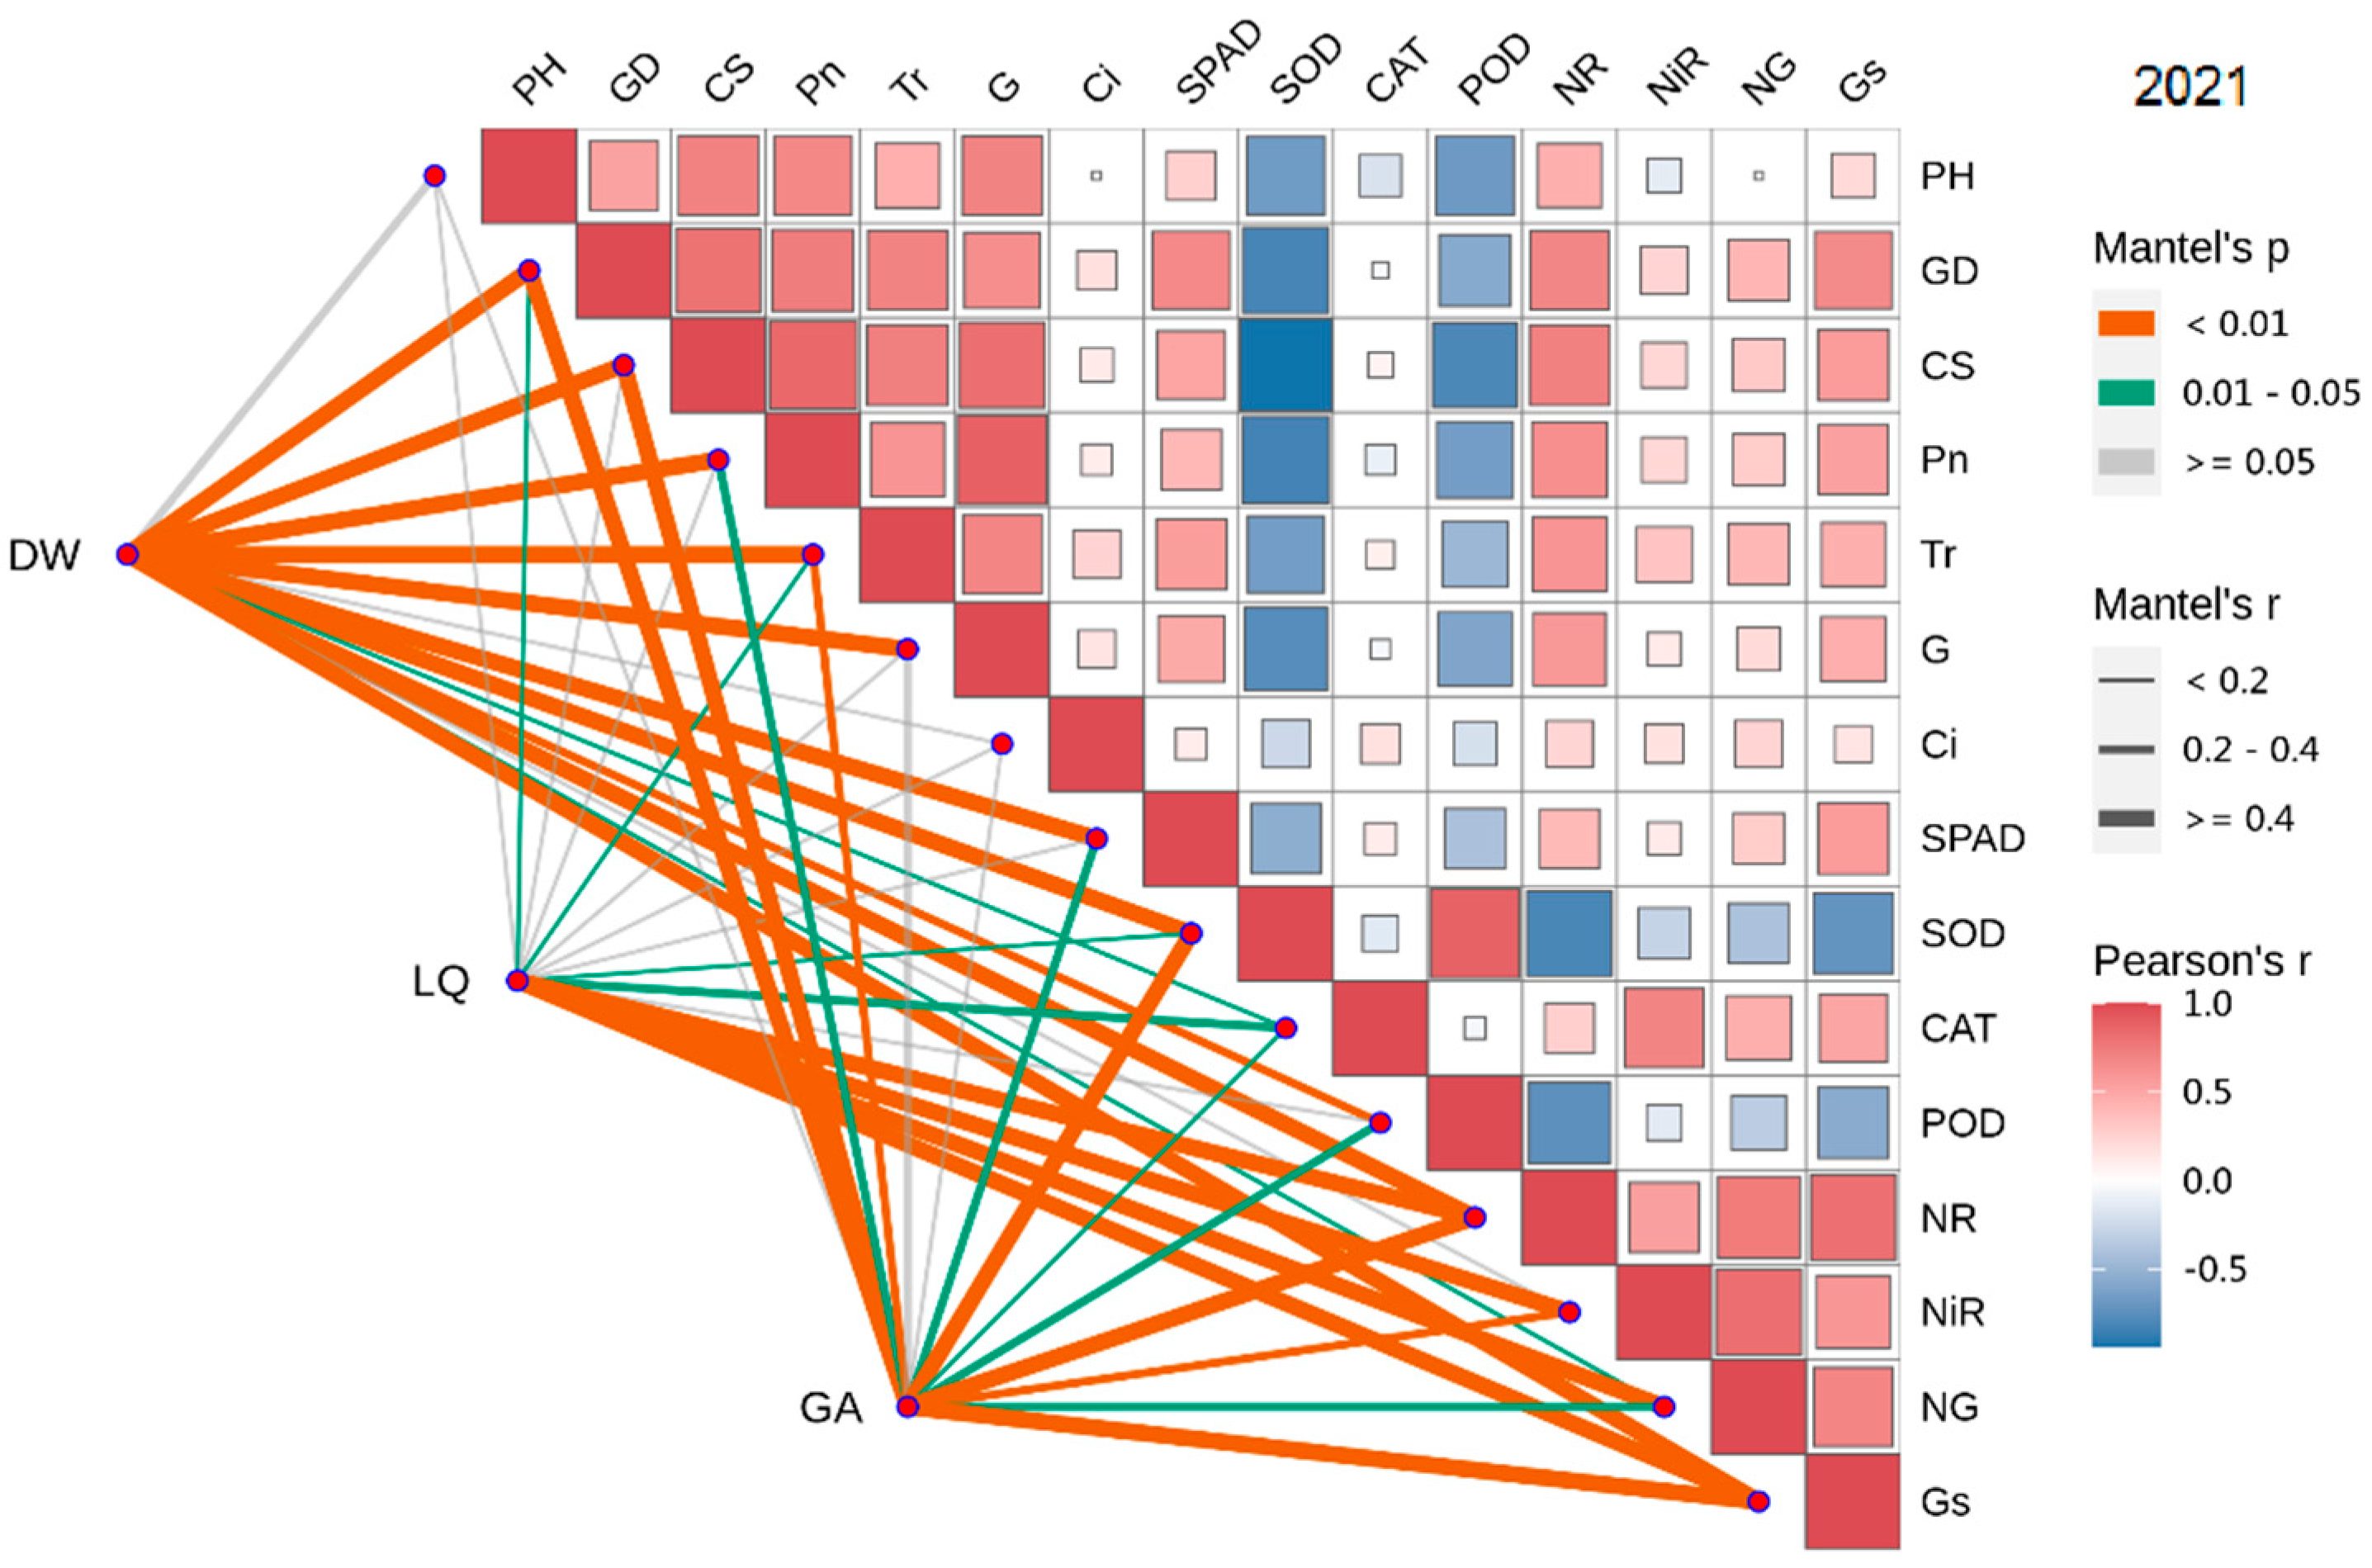
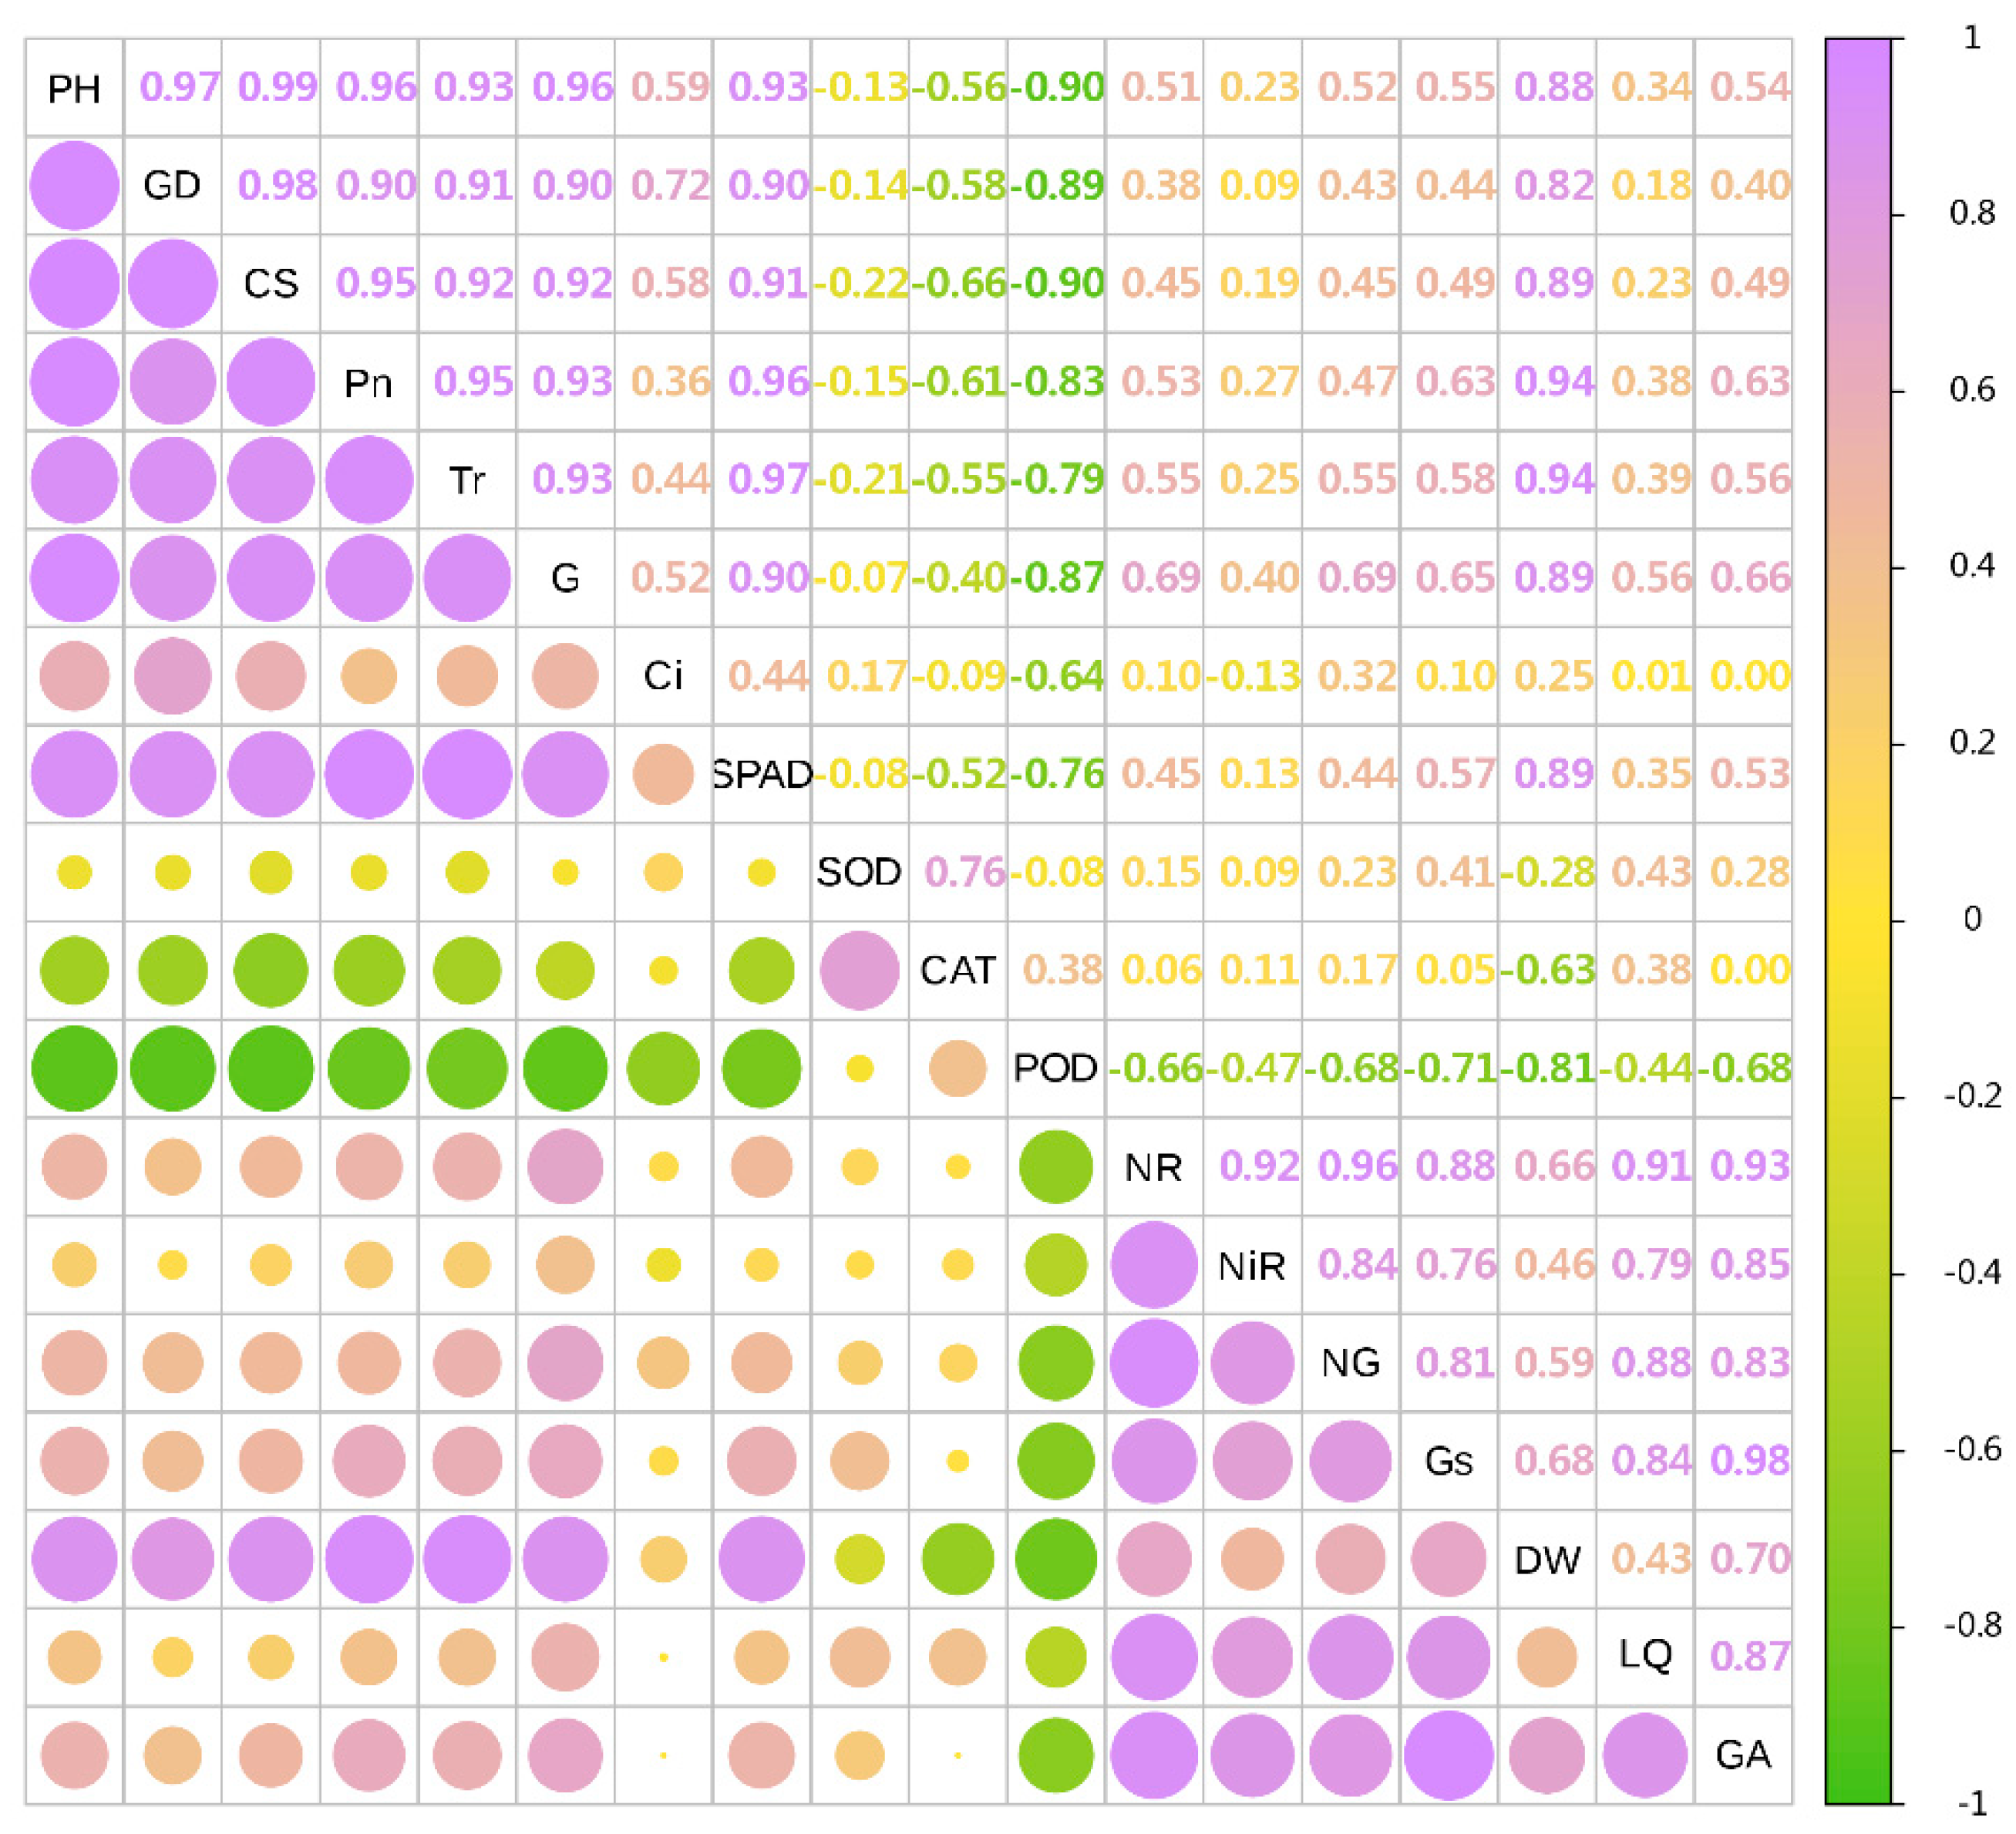
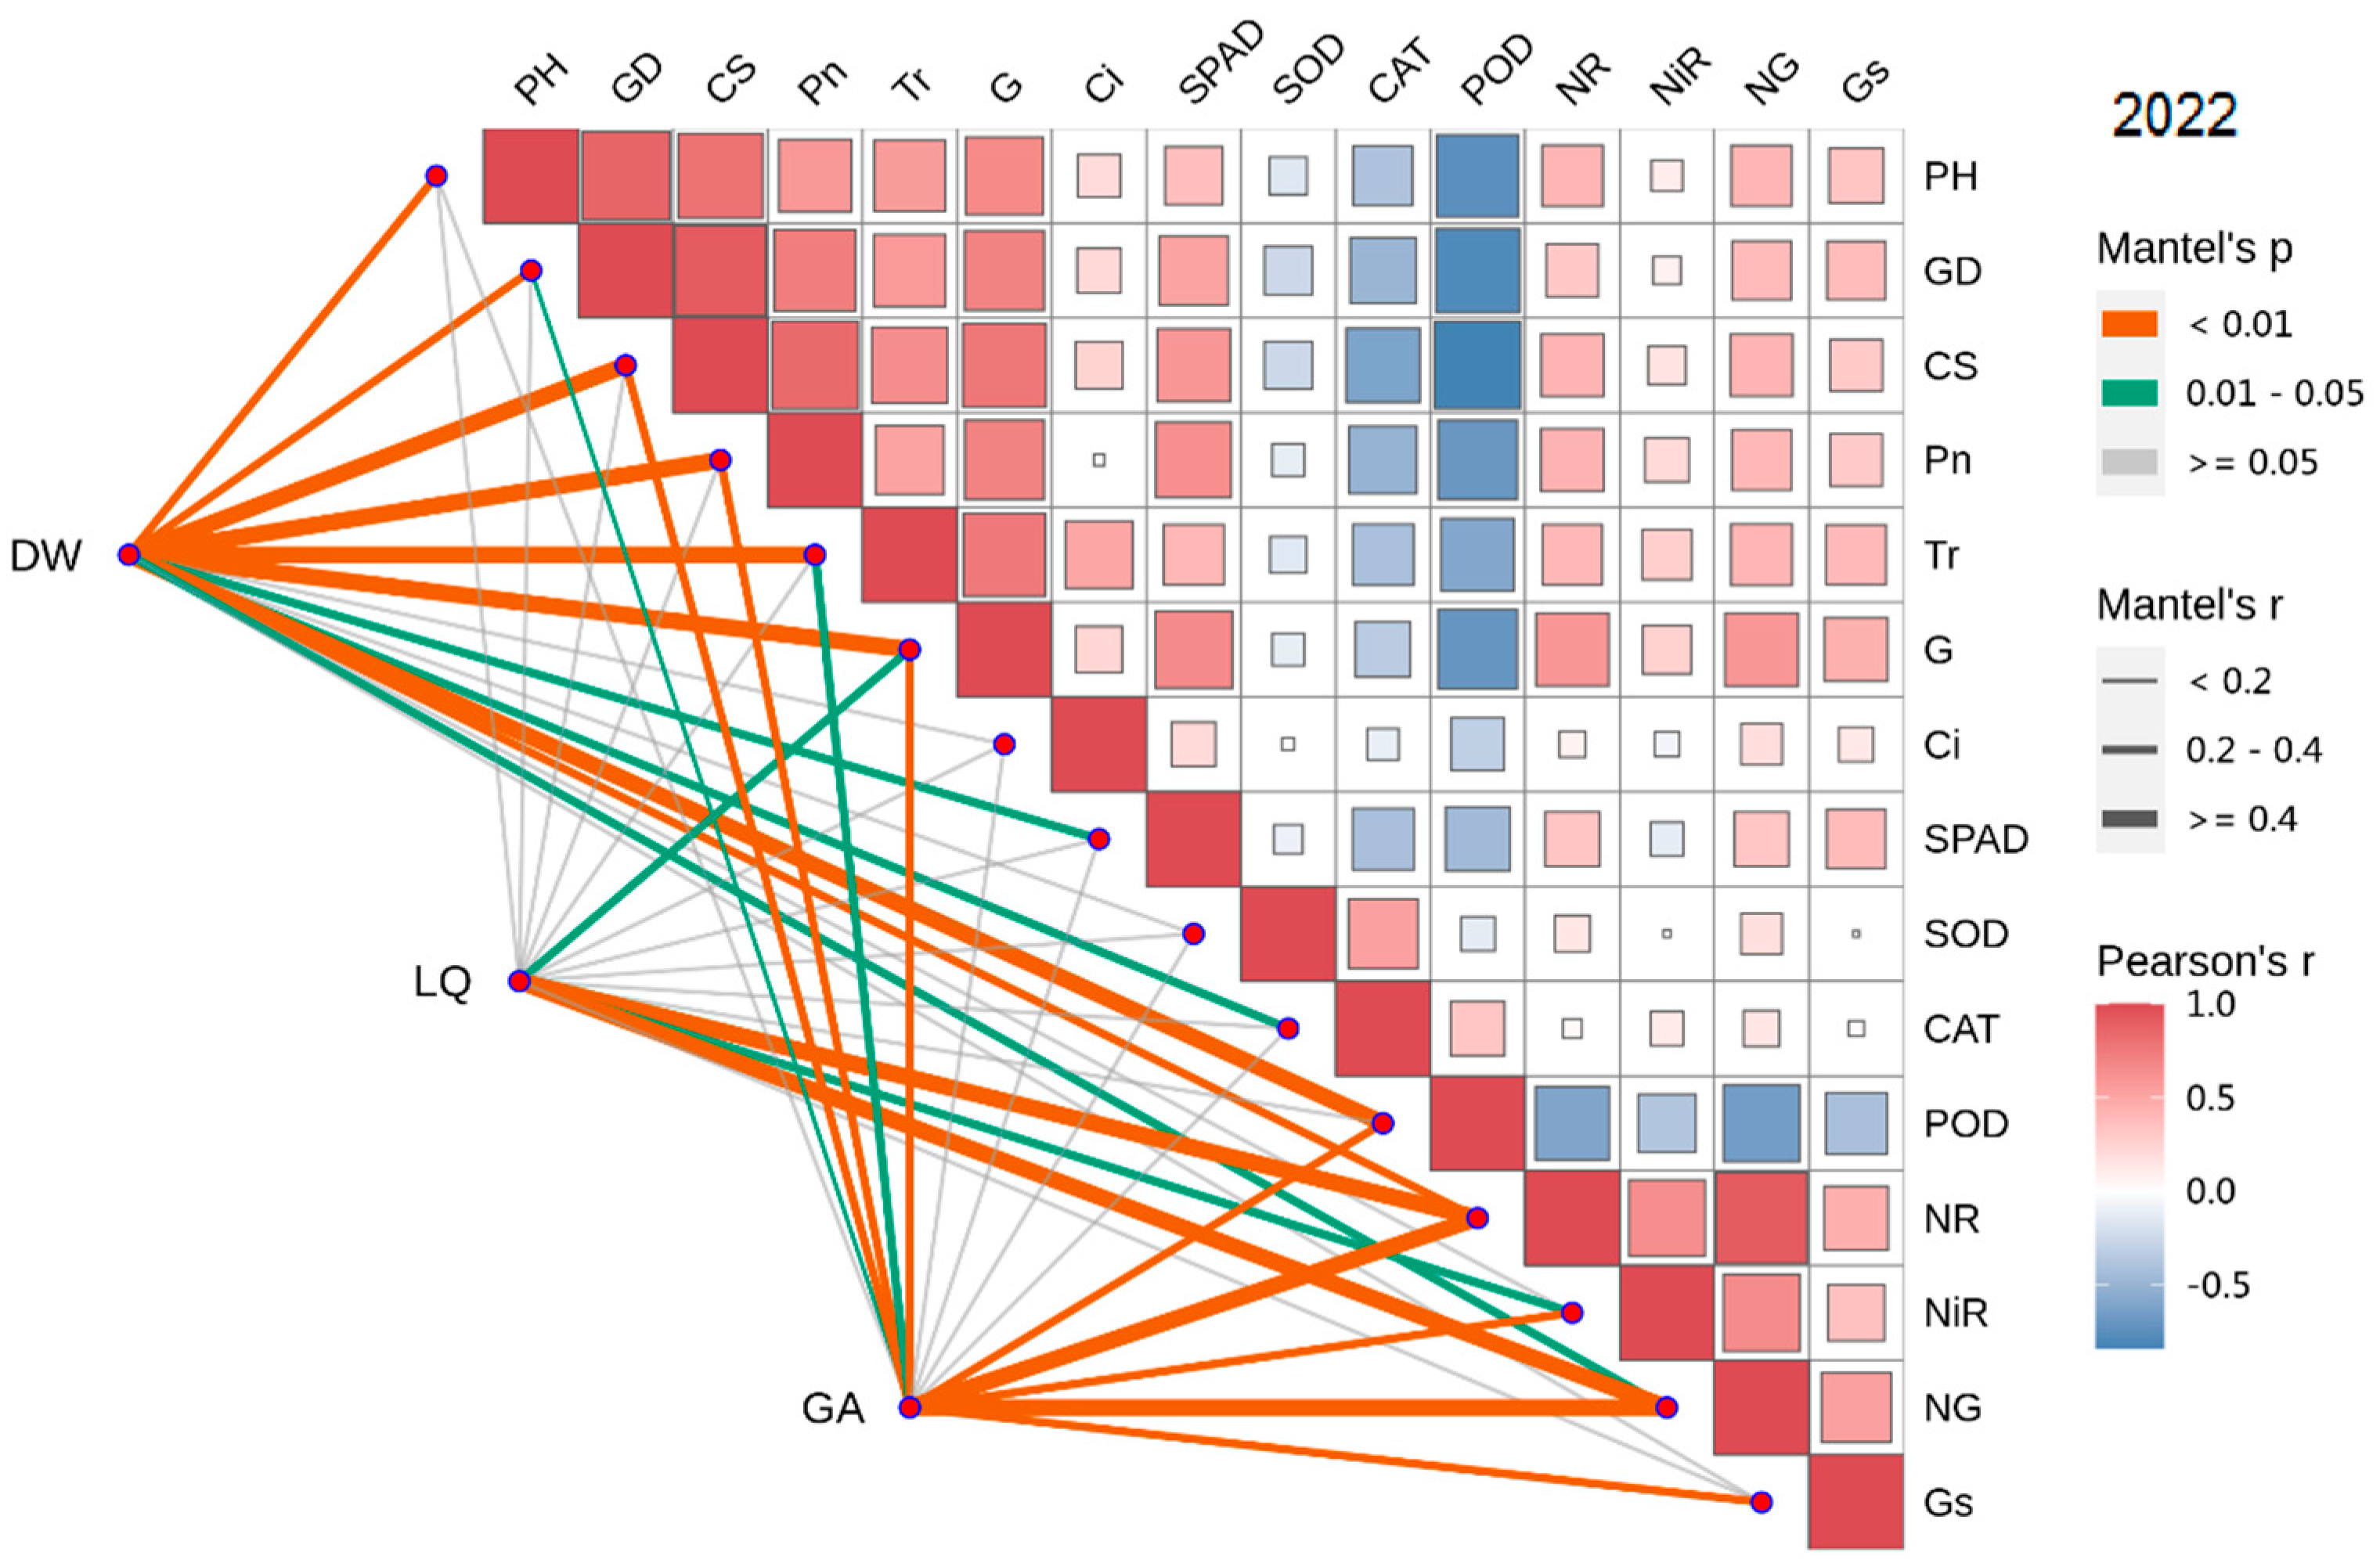
3.8. Combined Correlation Analysis of Growth and Physiological Indexes with Yield and Effective Components
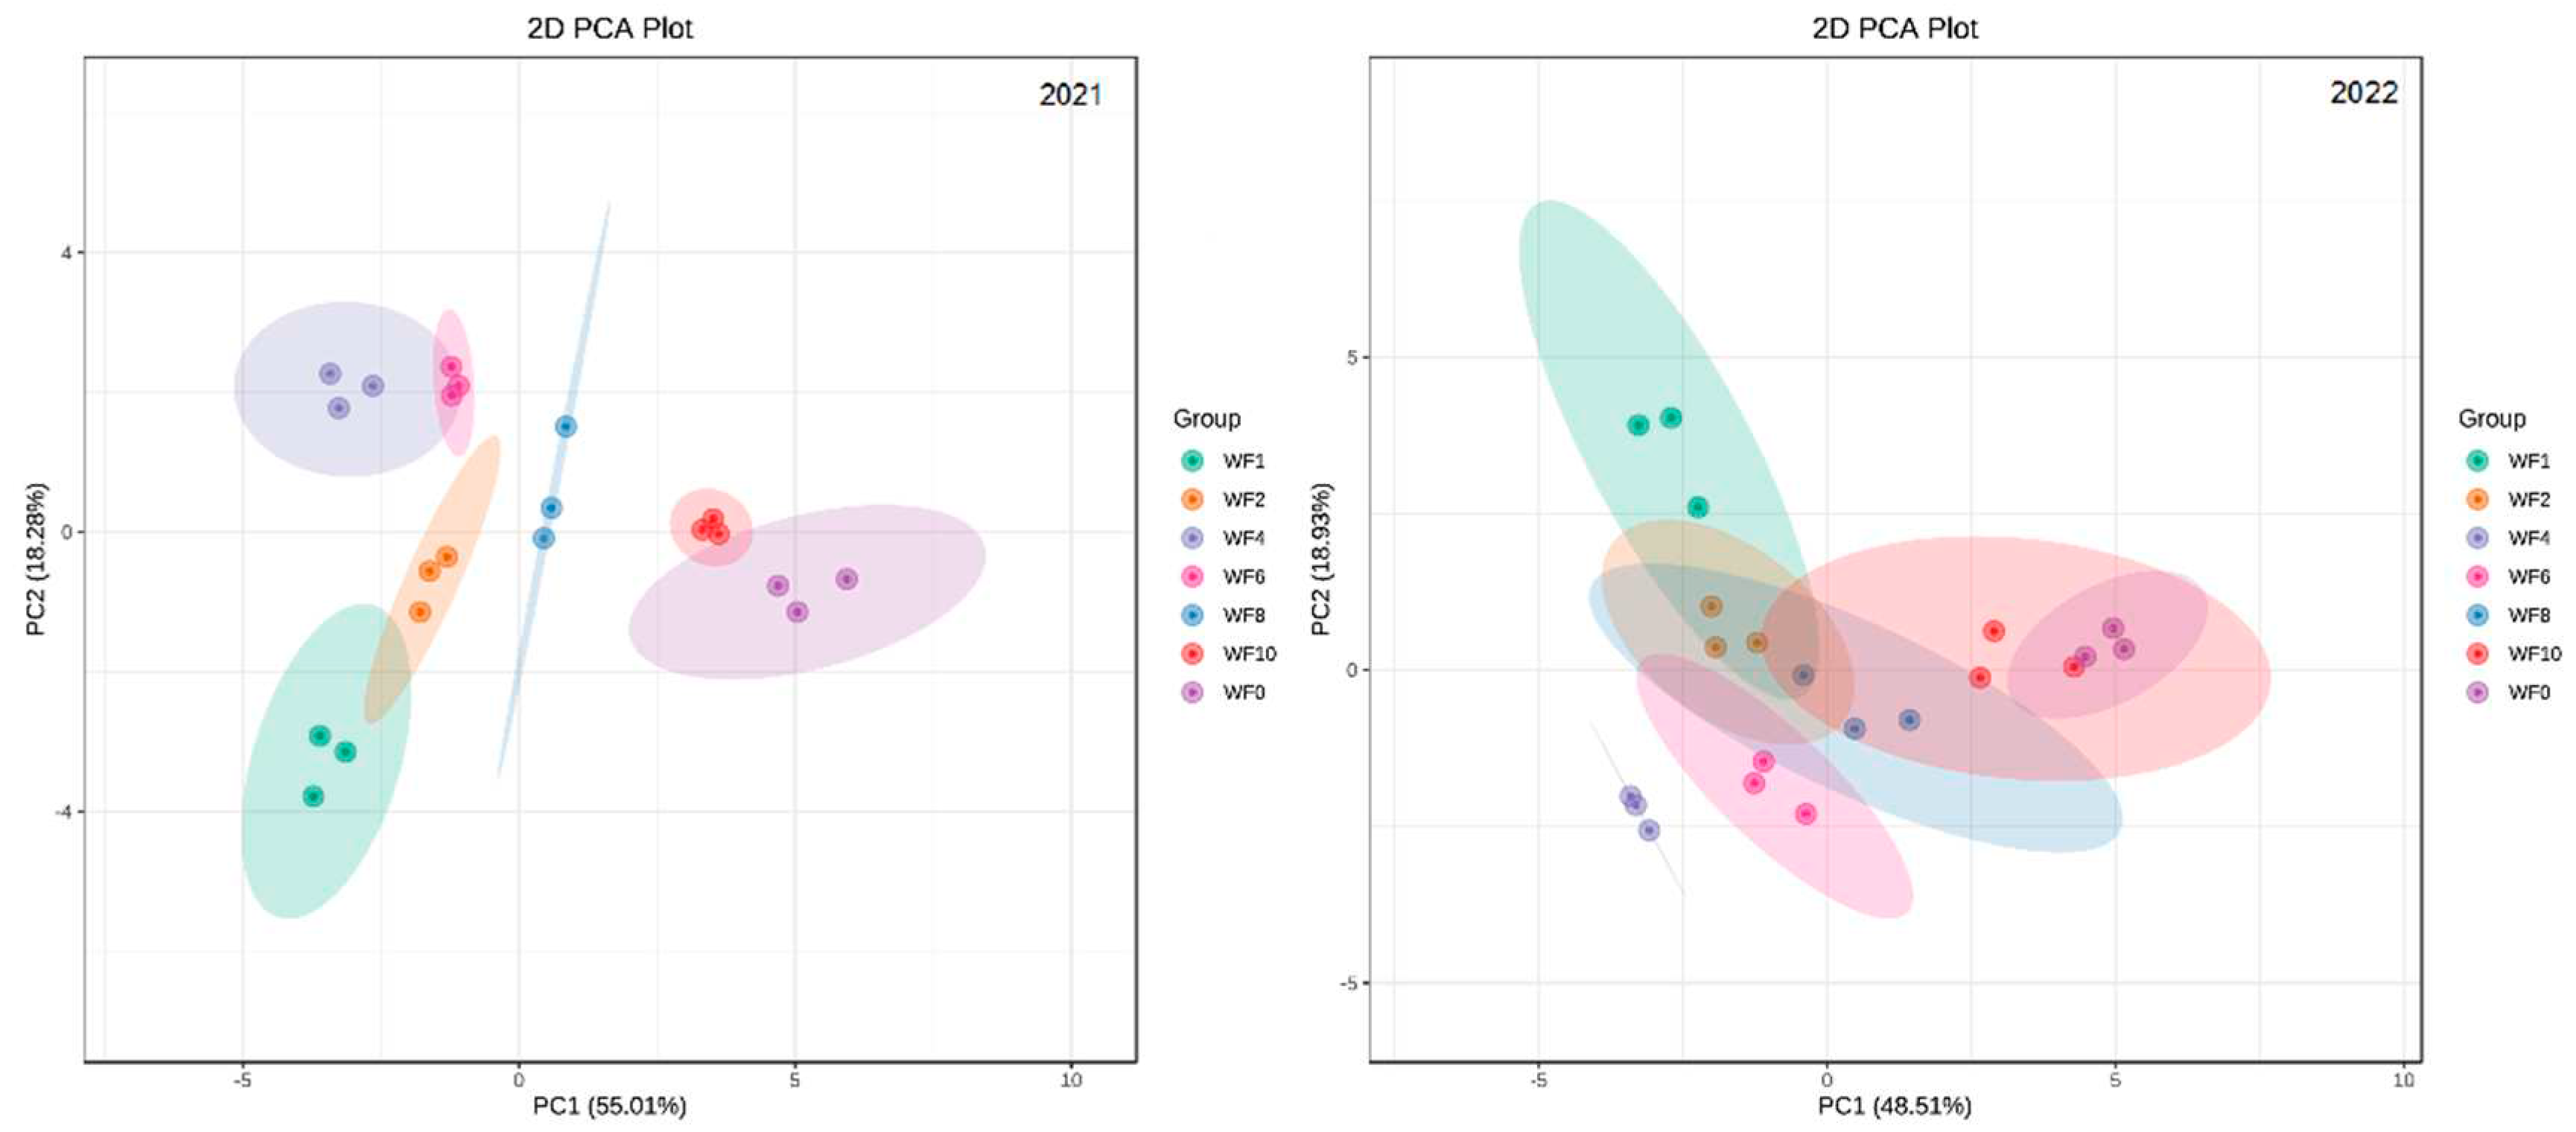
3.9. PCA of Weed Interference Frequencies
4. Discussion
4.1. Effect of Weed Interference Frequencies on Growth of Licorice
4.2. Effect of Weed Interference Frequencies on Photosynthetic Parameters of Licorice
4.3. Effect of Weed Interference Frequencies on Antioxidant Enzyme Activities of Licorice
4.4. Effect of Weed Interference Frequencies on Nitrogen Metabolism Enzyme Activities of Licorice
4.5. Effect of Weed Interference Frequencies on Yield and Effective Components of Licorice
5. Conclusions
Author Contributions
Funding
Institutional Review Board Statement
Informed Consent Statement
Data Availability Statement
Acknowledgments
Conflicts of Interest
Abbreviations
| PH | Plant height |
| GD | ground diameter |
| CS | crown size |
| Pn | net photosynthetic rate |
| Tr | transpiration rate |
| G | stomatal conductance |
| Ci | intercellular CO2 concentration |
| SOD | superoxide dismutase |
| POD | peroxidase |
| CAT | catalase |
| GS | glutamine synthetase |
| NR | nitrate reductase |
| NiR | nitrite reductase |
| NG | glutamate synthase |
| DW | dry weight |
| LQ | liquiritin |
| GA | glycyrrhizic acid |
References
- Vasileiou, M., et al., Transforming weed management in sustainable agriculture with artificial intelligence: a systematic literature review towards weed identification and deep learning. 2024. 176: p. 106522. [CrossRef]
- Ekwealor, K.U., et al., Economic Importance of Weeds: A Review. Asian Plant Research Journal, 2019. 3(2): p. 1-11. [CrossRef]
- Worthington, M., et al., Breeding Cereal Crops for Enhanced Weed Suppression: Optimizing Allelopathy and Competitive Ability. Journal of Chemical Ecology, 2013. 39(2): p. 213-231. [CrossRef]
- Hossain, M.S., et al., Determination of Critical Period for Sustainable Weed Management and Yield of Jute (Corchorus olitorius L.) under Sub-Tropical Condition. 2023. 15(12): p. 9282. [CrossRef]
- Adenawoola, A.R., et al., Effects of frequency of weeding on the growth and yield of long-fruited jute (Corchorus olitorius) in a rainforest area of southwestern Nigeria. Crop Protection, 2005. 24(5): p. 407-411. [CrossRef]
- Pahade, S., et al., Efficacy of Sulfentrazone 39.6% and Pendimethalin as a Pre Emergence Application against Weed Spectrum of Soybean (Glycine max L. Merrill). International Journal of Plant & Soil Science, 2023. 35(12): p. 51-58. [CrossRef]
- Tomar, D.S., et al., Comparative Efficacy of Different Herbicidal Combinations on Weed Growth and Yield Attributes of Wheat. International Journal of Environment and Climate Change, 2023. 13(8): p. 889-898. [CrossRef]
- Moss, S., Integrated weed management (IWM): why are farmers reluctant to adopt non-chemical alternatives to herbicides? Pest Management Science, 2019. 75(5): p. 1205-1211. [CrossRef]
- Emmanuel, K., et al., The effect of weed control timing on the growth and yield of upland rice (Oryza sativa L.). Journal of Agricultural Sciences,Belgrade, 2021. 66(1): p. 27-38. [CrossRef]
- Kraehmer, H., et al., Herbicides as Weed Control Agents: State of the Art: I. Weed Control Research and Safener Technology: The Path to Modern Agriculture. Plant Physiology, 2014. 166(3): p. 1119-1131. [CrossRef]
- Adeux, G., et al., Mitigating crop yield losses through weed diversity. Nature Sustainability, 2019. 2(11): p. 1018-1026. [CrossRef]
- Storkey, J., et al., What good is weed diversity? Weed Research, 2018. 58(4): p. 239-243. [CrossRef]
- D.Gajic, Interaction between wheat and corn cockle on brown soil and smonitsa. J Sci Agric Res, 1966. 19: p. 63. [CrossRef]
- Søgaard, B., et al., A positive allelopathic effect of corn cockle, Agrostemma githago, on wheat, Triticum aestivum. Canadian Journal of Botany, 1992. 70(9): p. 1916-1918. [CrossRef]
- Ferrero, R., et al., Weed Diversity Affects Soybean and Maize Yield in a Long Term Experiment in Michigan, USA. Front. Plant Sci., 2017. 8: p. 236. [CrossRef]
- Mubeen, K., et al., Interference of horse purslane (Trianthema portulacastrum L.) and other weeds affect yield of autumn planted maize (Zea mays L.). Saudi Journal of Biological Sciences, 2021. 28(4): p. 2291-2300. [CrossRef]
- Priyanka, et al., Effect of Combined Application of Herbicides on the Growth, Yield Attributes, Yield and Profitability of Kharif Groundnut [Arachis hypogaea (L.)]. International Journal of Environment and Climate Change, 2023. 13(9): p. 2413-2424. [CrossRef]
- Liu, C., et al., Benefits of mechanical weeding for weed control, rice growth characteristics and yield in paddy fields. Field Crops Research, 2023. 293: p. 108852. [CrossRef]
- Abdallah, I.S., et al. Weed Control, Growth, Nodulation, Quality and Storability of Peas as Affected by Pre- and Postemergence Herbicides. Horticulturae, 2021. 7, p.307. [CrossRef]
- Liao, P., et al., Effects of different density of Cyperus difformis and Ammannia baccifera on rice yield,processing and appearance quality. Acta Agriculturae Zhejiangensis, 2022. 34(11): p. 2348-2357.
- Stefanic, E., et al., The Critical Period of Weed Control Influences Sunflower (Helianthus annuus L.) Yield, Yield Components but Not Oil Content. Agronomy, 2023. 13(8): p. 2008. [CrossRef]
- Tian, Y., et al., Effects of different weeding frequencies and methods on the yield and quality of Radix bupleuri. Plant Doctor, 2021. 34(3): p. 49-57. [CrossRef]
- Walter, J., et al., Here comes the sun: How optimization of photosynthetic light reactions can boost crop yields. Journal of Integrative Plant Biology, 2022. 64(2): p. 564-591. [CrossRef]
- Wu, A., et al., A cross-scale analysis to understand and quantify the effects of photosynthetic enhancement on crop growth and yield across environments. Plant, Cell & Environment, 2023. 46(1): p. 23-44. [CrossRef]
- Jhanzab, H.M., et al. Chemo-Blended Ag & Fe Nanoparticles Effect on Growth, Physiochemical and Yield Traits of Wheat (Triticum aestivum). Agronomy, 2022. 12, 757.
- LIU, X., et al., Effects of microbial agents and corn protein ferment on physiological characteristics in leaves and yield of tomato. Chinese Journal of Applied Ecology, 2023. 34(11): p. 3039-3044. [CrossRef]
- Hanli, D., et al., Differences in the endophytic fungal community and effective ingredients in root of three Glycyrrhiza species in Xinjiang, China. Peer J, 2021. 9: p. e11047. [CrossRef]
- Man, S., et al., Chemical analysis and anti-inflammatory comparison of the cell culture of Glycyrrhiza with its field cultivated variety. Food Chemistry, 2013. 136(2): p. 513-517. [CrossRef]
- Li, X., et al., Study on classification system and experimental biology of Glycyrrhiza L. 2015: Fudan University Press.
- Liu, G., et al., Chemical Constituents in Glycyrrhiza uralensis: AReview. Modern Chinese Medicine, 2021. 23(11): p. 023.
- Kong, S., et al., Chemical and pharmacological difference between honey-fried licorice and fried licorice. Journal of Ethnopharmacology, 2023. 302: p. 115841. [CrossRef]
- Li, N., et al., Research progress on chemical constituents and pharmacological effects of different varieties of Glycyrrhizae Radix et Rhizoma and predictive analysis of quality markers. Chinese Traditional and Herbal Drugs, 2021. 52(24): p. 7680-7692. [CrossRef]
- Hao, J., et al., A Study of the Ionic Liquid-Based Ultrasonic-Assisted Extraction of Isoliquiritigenin from Glycyrrhiza uralensis. BioMed Research International, 2020. 2020: p. 7102046. [CrossRef]
- Lee, E.J., et al. Isolation and Characterization of Compounds from Glycyrrhiza uralensis as Therapeutic Agents for the Muscle Disorders. International Journal of Molecular Sciences, 2021. 22, p.876. [CrossRef]
- Shen, M., et al., Research Progress on Extraction and Separation Methods of Licorice Flavonoids. Chinese Traditional Patent Medicine, 2021. 43(1): p. 154-159. Medicine.
- Bai, H., et al., Metabolomics study of different parts of licorice from different geographical origins and their anti-inflammatory activities. Journal of Separation Science, 2020. 43: p. 1593–1602. [CrossRef]
- Zhang, D., et al., Widely target metabolomics analysis of the differences in metabolites of licorice under drought stress. Industrial Crops and Products, 2023. 202: p. 117071. [CrossRef]
- Yang, L., et al., The anti-diabetic activity of licorice, a widely used Chinese herb. Journal of Ethnopharmacology, 2020. 263: p. 113216. [CrossRef]
- Bell, R.F., et al., Liquorice for pain? Therapeutic Advances in Psychopharmacology., 2021. 11. [CrossRef]
- Zhang, Q.-h., et al., Traditional Uses, Pharmacological Effects, and Molecular Mechanisms of Licorice in Potential Therapy of COVID-19. Frontiers in Pharmacology, 2021. 12: p. 719758. [CrossRef]
- Li, R., et al., Salicylic acid improved salinity tolerance of Glycyrrhiza uralensis Fisch during seed germination and seedling growth stages. ACTA AGRONOMICA SINICA, 2020. 46(11): p. 1810-1816. [CrossRef]
- Huang, W., et al., Study on seed germination characteristics of Glycyrrhiza uralensis Fisch Seed, 2018. 37(8): p. 12-15.
- Zhu, L., et al., Influence of Seeding Date on Glyrrhiz a uralensis Fisch Surviving through Winter and Growth Characteristic of Root System. Journal of Desert Research, 2007. 27(3): p. 469-472.
- Ye, J., et al., Comparisons of yields and effective constituents of various kinds of licorice in different picking time. Chinese Traditional Patent Medicine, 2016. 38(5): p. 1088-1092. Medicine.
- Song, K., et al. The Effect of Soil Water Deficiency on Water Use Strategies and Response Mechanisms of Glycyrrhiza uralensis Fisch. Plants, 2022. 11, p. 1464. [CrossRef]
- Huang, J., et al., Changes in C:N:P stoichiometry modify N and P conservation strategies of a desert steppe species Glycyrrhiza uralensis. Scientific Reports, 2018. 8(1): p. 12668. [CrossRef]
- Chang, H., et al., Feeding preference of Altica deserticola for leaves of Glycyrrhiza glabra and G. uralensis and its mechanism. Scientific Reports, 2020. 10(1): p. 1534. [CrossRef]
- Bond, W.J., et al. , Ecology of sprouting in woody plants: the persistence niche. Trends in Ecology and Evolution. Trends in Ecology & Evolution, 2001. 16(1): p. 45-51. [CrossRef]
- An, W., et al., Weed species and control measures in cultivated licorice field. Agricultural Science-Technology and Information, 2008. 12: p. 33-34.
- Kaur, S., et al., Understanding crop-weed-fertilizer-water interactions and their implications for weed management in agricultural systems. Crop Protection, 2018. 103: p. 65-72. [CrossRef]
- Flexas, J., et al., Drought-inhibition of Photosynthesis in C3 Plants: Stomatal and Non-stomatal Limitations Revisited. Annals of Botany, 2002. 89(2): p. 183-189. [CrossRef]
- Joshi, R., et al., Transcription Factors and Plants Response to Drought Stress: Current Understanding and Future Directions. 2016. 7: p. 1029. [CrossRef]
- Gadelha, C.G., et al., Exogenous nitric oxide improves salt tolerance during establishment of Jatropha curcas seedlings by ameliorating oxidative damage and toxic ion accumulation. Journal of Plant Physiology, 2017. 212: p. 69-79. [CrossRef]
- Sheng, Z., et al., Osmotic Regulation, Antioxidant Enzyme Activities and Photosynthetic Characteristics of Tree Peony ( Andr.) in Response to High-Temperature Stress. Phyton-International Journal of Experimental Botany, 2023. 92(11): p. 3133--3147. [CrossRef]
- Li, B., et al., Elevated CO2-induced changes in photosynthesis, antioxidant enzymes and signal transduction enzyme of soybean under drought stress. Plant Physiology and Biochemistry, 2020. 154: p. 105-114. [CrossRef]
- Saloner, A., et al., Nitrogen supply affects cannabinoid and terpenoid profile in medical cannabis (Cannabis sativa L.). Industrial Crops and Products, 2021. 167: p. 113516. [CrossRef]
- Radušienė, J., et al., Effect of nitrogen on herb production, secondary metabolites and antioxidant activities of Hypericum pruinatum under nitrogen application. Industrial Crops and Products, 2019. 139: p. 111519. [CrossRef]
| Family | Genus | Species | Density(no.·m-2) | Biomass(g·m-2) | |
|---|---|---|---|---|---|
| 1 | Poaceae | Setaria | S. viridis | 27 | 62.12 |
| 2 | Poaceae | Echinochloa | E. crusgalli | 2 | 3.84 |
| 3 | Chenopodiaceae | Corispermum | C. declinatum | 2 | 16.52 |
| 4 | Chenopodiaceae | Chenopodium | C. album | 7 | 236.71 |
| 5 | Chenopodiaceae | Chenopodium | C. foetidum | 2 | 4.80 |
| 6 | Chenopodiaceae | Chenopodium | C. aristatum | 1 | 1.09 |
| 7 | Compositae | Artemisia | A. scoparia | 3 | 0.38 |
| 8 | Chenopodiaceae | Salsola | S. collina | 1 | 1.72 |
| 9 | Geraniaceae | Geranium | G.sibiricum | 1 | 2.64 |
| total | 46 | 329.82 |
| Year | Weeds interference frequency | Plant height (cm) |
Ground diameter (mm) |
Crown size (cm2) |
|---|---|---|---|---|
| 2021 | WF1 | 51.17±6.59a | 5.51±0.23a | 963.23±38.11a |
| WF2 | 49.43±5.51ab | 5.01±0.19bc | 823.63±55.35b | |
| WF4 | 43.30±1.55bc | 5.07±0.15b | 809.19±62.07b | |
| WF6 | 40.50±1.23c | 4.93±0.25bcd | 672.96±90.32c | |
| WF8 | 42.37±5.95bc | 4.64±0.24cd | 730.74±46.48bc | |
| WF10 | 39.33±2.52c | 4.54±0.21de | 504.04±30.34d | |
| WF0 | 38.90±1.73 c | 4.20±0.26e | 495.11±17.91d | |
| 2022 | WF1 | 42.67±1.45a | 5.13±0.40a | 747.52±20.26a |
| WF2 | 34.89±5.05ab | 3.93±0.49b | 586.41±46.01b | |
| WF4 | 36.89±7.04ab | 3.83±0.25b | 574.07±51.27bc | |
| WF6 | 31.44±2.72bcd | 3.73±0.47b | 470.52±91.19d | |
| WF8 | 33.00±6.69bc | 3.77±0.85b | 491.41±60.78cd | |
| WF10 | 25.00±5.03cd | 2.67±0.25c | 322.15±24.30e | |
| WF0 | 23.45±5.18d | 2.63±0.23c | 314.89±13.45e |
| Year | Weeds interference frequency | Pn (μmol/m2·s) | Tr(mmol/m2·s) |
G (mmol/m2·s) |
Ci(μmol/mol) | SPAD |
|---|---|---|---|---|---|---|
| 2021 | WF1 | 34.88±1.35a | 16.19±1.07a | 890.64±137.21a | 309.03±13.07a | 44.90±4.97a |
| WF2 | 25.49±2.56bc | 13.97±2.03bc | 557.30±147.16bc | 299.63±19.21a | 41.53±4.71ab | |
| WF4 | 28.57±1.48b | 15.80±0.36 ab | 629.25±104.12b | 300.38±11.03a | 40.80±4.00ab | |
| WF6 | 24.62±2.41c | 13.43±1.28c | 491.88±115.33bc | 322.00±30.00a | 41.07±1.40ab | |
| WF8 | 24.06±1.54c | 13.56±0.83c | 550.73±59.40bc | 310.73±19.40a | 40.00±5.01ab | |
| WF10 | 22.15±3.67cd | 12.97±1.46cd | 431.91±43.81cd | 293.71±10.77a | 38.33±2.72ab | |
| WF0 | 18.87±1.09d | 11.02±1.03d | 300.71±10.54d | 297.62±18.33a | 33.77±7.35b | |
| 2022 | WF1 | 22.43±3.23a | 12.15±1.71a | 603.21±102.03a | 325.30±12.50a | 40.17±5.29a |
| WF2 | 20.21±1.66ab | 10.39±0.81ab | 446.60±83.45bc | 295.74±5.03a | 36.53±1.18a | |
| WF4 | 20.24±4.27ab | 10.68±1.30ab | 581.78±81.98ab | 299.37±40.59a | 36.60±3.38a | |
| WF6 | 16.15±0.75c | 10.10±1.43ab | 447.70±118.98bc | 317.73±14.08a | 34.87±4.95ab | |
| WF8 | 17.57±1.21bc | 9.36±1.28bc | 430.27±116.35bc | 315.40±21.86a | 35.77±1.40ab | |
| WF10 | 14.87±0.63cd | 9.04±2.92bc | 308.39±16.75cd | 283.54±49.72a | 33.80±1.30ab | |
| WF0 | 11.46±1.34d | 7.02±0.56c | 241.63±20.23d | 301.78±10.44a | 28.80±6.94b |
| Year | Weeds interference frequency | SOD ( U/g FW ) |
CAT ( μmol/min/g FW ) |
POD ( U/g FW ) |
|---|---|---|---|---|
| 2021 | WF1 | 415.23±60.15d | 128.36±17.58e | 89.16±3.57e |
| WF2 | 802.89±66.61c | 300.04±10.20c | 92.73±21.40de | |
| WF4 | 947.39±50.11c | 399.19±55.07b | 160.49±32.10c | |
| WF6 | 1122.11±58.57b | 411.90±45.74b | 181.89±32.10bcd | |
| WF8 | 1203.29±129.87b | 511.35±30.34a | 210.42±17.84bc | |
| WF10 | 2080.94±119.27a | 234.78±5.96d | 385.04±7.69a | |
| WF0 | 1967.78±93.04a | 145.63±13.16e | 256.79±92.73b | |
| 2022 | WF1 | 1648.03±246.22c | 27.87±11.15c | 21.93±8.00c |
| WF2 | 1817.54±42.030bc | 54.25±13.54c | 30.67±11.72bc | |
| WF4 | 1891.68±155.685bc | 164.43±22.15b | 34.00±9.17bc | |
| WF6 | 1990.55±154.53ab | 206.98±17.16a | 40.67±1.15c | |
| WF8 | 2255.41±204.68a | 217.55±19.32a | 50.67±15.28b | |
| WF10 | 1811.35±164.48bc | 164.41±27.28b | 124.33±18.50a | |
| WF0 | 1784.57±249.06bc | 161.76±29.38b | 102.33±27.32a |
| Year | Weeds interference frequency | NR (nmol/min/gFW) |
NiR (μmol/h/gFW) |
NG(nmol/min/gFW) | Gs (μmol/h/gFW) |
|---|---|---|---|---|---|
| 2021 | WF1 | 197.89±25.41b | 4.70± 0.50d | 196.16±18.75b | 12.47±0.94ab |
| WF2 | 215.28±12.58ab | 4.90±0.37cd | 205.40±10.52b | 12.56±0.61ab | |
| WF4 | 239.58±22.24a | 7.05±0.29a | 384.95±24.30a | 13.15±0.84ab | |
| WF6 | 210.89±14.29ab | 6.26±0.35b | 390.32±8.83a | 13.31±0.59a | |
| WF8 | 128.59±19.64c | 5.65±0.68bc | 158.70±13.49c | 12.04±0.69bc | |
| WF10 | 91.20±11.31d | 4.90±0.48d | 153.46±9.01c | 10.90±0.47cd | |
| WF0 | 86.74±7.44d | 4.22±0.13d | 122.45±12.51d | 9.76±0.80 d | |
| 2022 | WF1 | 98.59±19.64d | 3.55±0.68c | 205.40±8.44b | 9.47±0.94ab |
| WF2 | 147.89±25.41c | 5.13±1.01ab | 208.70±13.49b | 10.56±1.42a | |
| WF4 | 252.91±39.14a | 6.05±0.29a | 359.68±11.99a | 10.80±1.41a | |
| WF6 | 188.61±23.69b | 5.32±0.89a | 344.54±9.28a | 10.36±0.52a | |
| WF8 | 90.02±11.14d | 3.68±0.74c | 190.21±11.60b | 10.15±0.84ab | |
| WF10 | 61.20±11.31de | 3.65±1.11c | 120.62±24.08c | 9.26±0.71ab | |
| WF0 | 31.91±4.54e | 3.89±0.27bc | 108.07±9.81c | 8.51±1.09b |
Disclaimer/Publisher’s Note: The statements, opinions and data contained in all publications are solely those of the individual author(s) and contributor(s) and not of MDPI and/or the editor(s). MDPI and/or the editor(s) disclaim responsibility for any injury to people or property resulting from any ideas, methods, instructions or products referred to in the content. |
© 2024 by the authors. Licensee MDPI, Basel, Switzerland. This article is an open access article distributed under the terms and conditions of the Creative Commons Attribution (CC BY) license (https://creativecommons.org/licenses/by/4.0/).


