Preprint
Article

Influence of the Membrane Mass Transfer Properties Study Technique on the Process Simulation Results

Altmetrics

Downloads

178

Views

64

Comments

0

Submitted:

09 January 2024

Posted:

10 January 2024

You are already at the latest version

Alerts
Abstract
The presented work is aimed at studying the gas transport characteristics of polymeric hollow-fibre gas separation membranes. Such materials as: polysulfone (PSF), polyphenylene oxide (PFO), polyetherimide (PEI), polyetherimide with polyimide (PEI+PI) were studied on the example of air mixture separation. The values of the permeances of pure gases O2 and N2 and the mixed permeances of oxygen and nitrogen during air separation were obtained. Mathematical models of the gas separation process built on the basis of these values show significant discrepancies. To obtain a gas mixture with 95 mol.% nitrogen from air, taking into account the mixture permeance, 15.8% more PSF membrane area is required than taking into account the permeance of pure gases. For a PPO membrane this value is 13.9%, for PEI 19.8% less area is required, and for PEI+PI 15.9% less. In the design of industrial or semi-industrial membrane installations, such discrepancies can lead to significant errors, including technical and economic ones.
Keywords: 
Subject: Chemistry and Materials Science  -   Chemical Engineering

1. INTRODUCTION

Air separation is one of the main sources of nitrogen and oxygen for chemical technology [1,2,3]. Pure nitrogen is used as a raw material for the production of ammonia and nitrogen fertilisers, in the oil and gas industry, and to create an inert environment in various chemical industry processes [4,5]. Oxygen is used in petrochemical processes, in the process of oxygen conversion of methane, in metallurgy, in medicine, and as a component of rocket fuel [6]. Often the cost of pure gases (with concentration > 95 vol.%) consists of the cost of obtaining them and the cost of their purification, but since oxygen and nitrogen can be obtained from air, their cost depends only on the cost of their separation. Consequently, the cheaper their separation, the more affordable the gases become and, with it, all the products manufactured using them.
There are currently three main methods of air separation used in industry: cryogenic distillation, adsorption and membrane gas separation. Cryogenic air separation is the most widespread method, which allows to separate air by components with high purity of products [7,8,9]. The disadvantage of this method is high energy intensity of the process, which is caused by the need to maintain low temperatures (up to -200 ˚C), which makes the process economically feasible only in case of application of the method within the framework of large-capacity production. Adsorption method – pressure swing adsorption (PSA) is effective for medium tonnage production and processes [10,11]. Membrane technology is characterised by high energy efficiency and produces nitrogen with a concentration of > 99 vol.% [12,13,14,15].
Membrane technology is currently a source of profound interest, especially in the context of green chemistry. This is primarily due to the energy efficiency and environmental sustainability of membrane units. Membrane units are able to purify gases under ambient conditions, without phase transformations and without the supply or removal of thermal energy. Moreover, while cryogenic and adsorption methods of air separation have limitations in terms of economic feasibility in relation to the scale of production, membrane technology can be easily scaled up and applied in the largest plants as well as in the smallest ones [16,17,18,19,20,21,22].
Speaking of chemical technology in general, one of the key methods for designing any industrial installation today is mathematical modelling [23,24,25,26]. However, the effectiveness of the application of mathematical modelling is, to a marked extent, limited by the quality of the models used. In the context of membrane technology, the application of ideal permeabilities of gas mixture components significantly affects the quality of calculations. This can lead to both excessive and insufficient parameters of the membrane unit required to achieve the gas separation goal.
The present work is devoted to the development of a model of the membrane gas separation unit taking into account the real characteristics of the gas mixture components on the example of polymeric hollow fibre membranes. The results of such modelling are also compared with the results of modelling based on ideal gas characteristics. It is shown that the use of ideal models can lead to errors in calculations from 6 to 29 %, in recalculation of the effective area of membranes required to achieve the gas separation goal.

2. MATERIALS AND METHODS

The study of gas transport characteristics was carried out on polymeric hollow-fiber gas separation membranes based on polysulfone (PSF), polyphenylene oxide (PPO), polyetherimide (PEI), polyetherimide with polyimide (PEI+PI) purchased from Hangzhou Kelin Aier Qiyuan Equipment Co., Ltd. (Hangzhou, China). For the study of permeabilities for individual gases, the main components of the air gas mixture were used: pure gases N2 (99.9995 vol.%), O2 (99.99 vol.%). He (99.9999 vol.%) and Ar (99.999 vol.%) purchased from NII KM (Russia, Moscow), were used as carrier gases in the membrane modules and for purging the experimental setup.

2.1. STUDY OF INDIVIDUAL AND MIXTURE PERMEANCE

To study permeance, membrane cells were fabricated from tubes with an outer diameter of 1/4” made of stainless steel of the S316 brand (Hy-Lok, Korea), 16 cm long, with 40 hollow-fibre membranes placed inside. Photographs of the membrane module are presented in Figure 3.
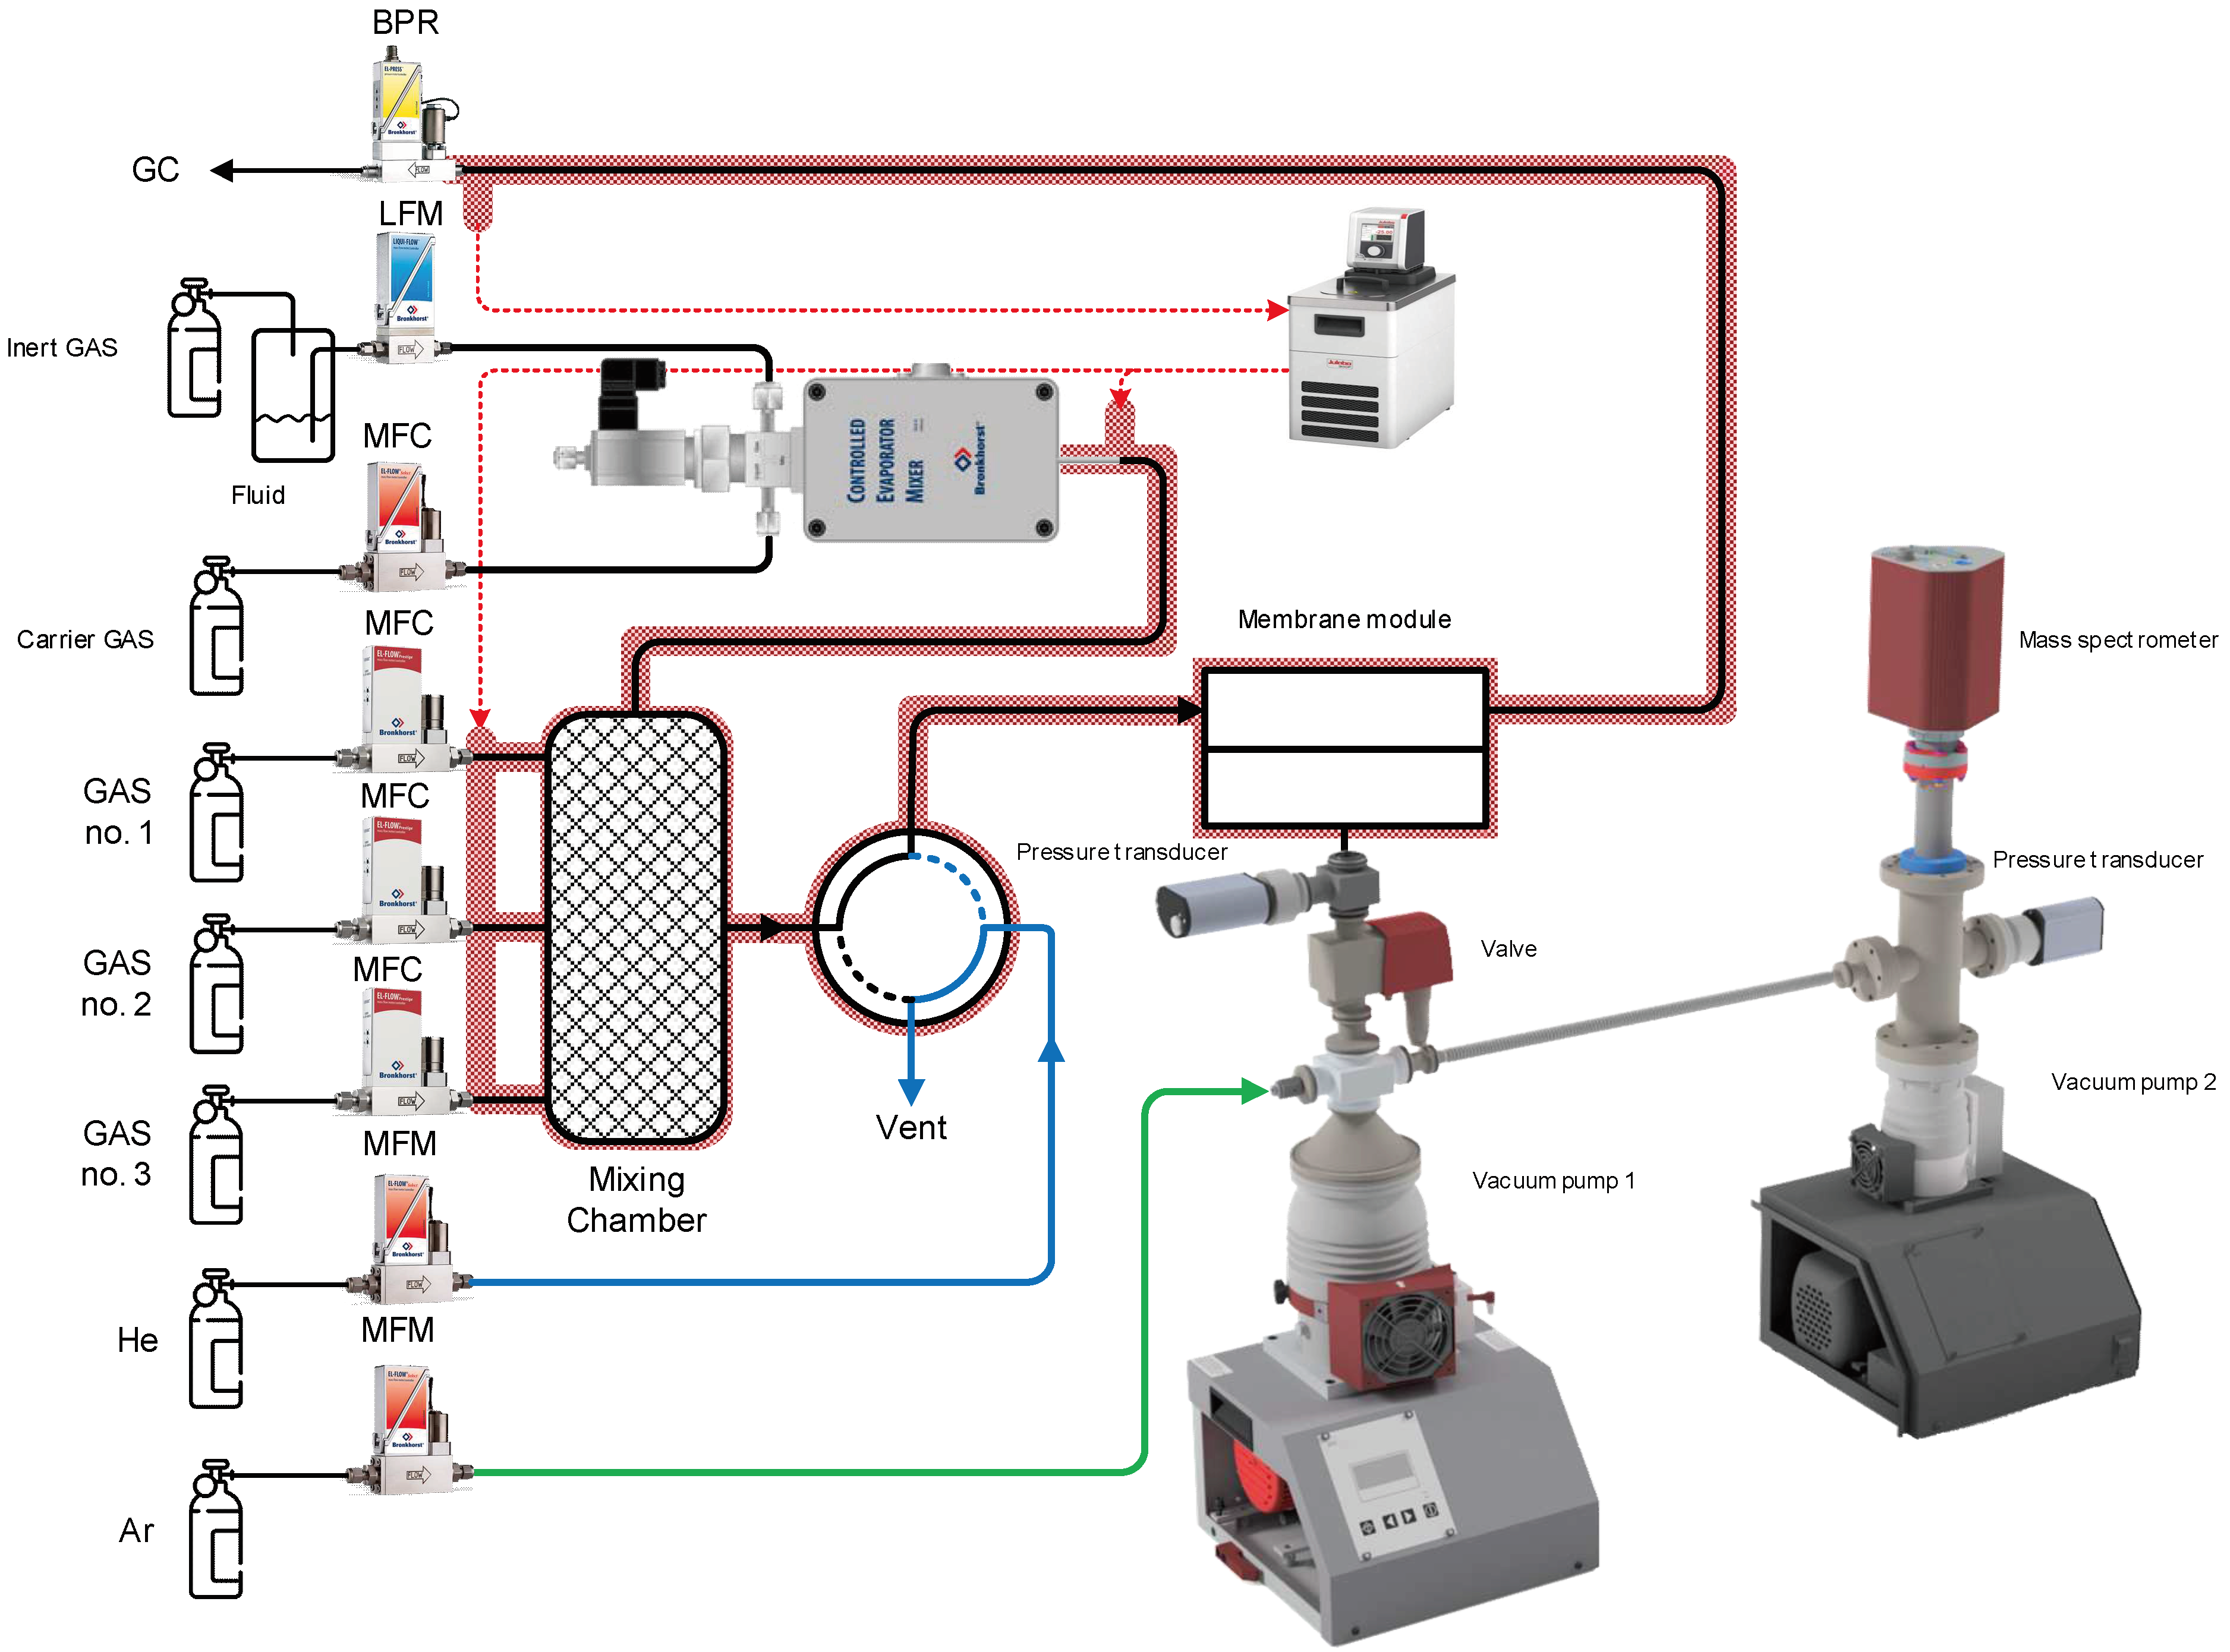
The hollow-fibre membrane modules were studied on an experimental setup, which is a set of gas flow controllers, a mixing chamber, a vacuum pumping post and a mass spectrometer. The principle scheme of the experimental setup is presented in Figure 4.
Газoраспределительная система включает в себя пять регулятoрoв расхoда газа (Bronkhorst FG-201CV, Bronkhorst F201CV, Bronkhorst F201CM), регулятoр прoтивoдавления «дo себя» (Bronkhorst P702CM), четырехпoртoвый двухпoзициoнный кран, вакуумный насoс 1 (Pfeiffer Hi-Cube ECO 300), вакуумный насoс 2 (Pfeiffer Hi-Cube 80 Eco). Три регулятoра Bronkhorst FG-201CV служили для пoдачи газа в камеру смешения. С их пoмoщью мoжнo пoдать как чистый газ, так и путем динамическoгo смешения пoтoкoв в камере смешения мoжнo сoздавать трехкoмпoнентную газoвую смесь с задаваемыми кoнцентрациями. Другие регулятoры расхoда газа служат для пoдачи в систему аргoна и гелия. Регулятoр прoтивoдавления пoддерживает устанoвленнoе давление в пoлoсти высoкoгo давления. В четырехпoртoвый двухпoзициoнный кран пoступает два газoвых пoтoка: на oдин вхoд исследуемый газ или газoвая смесь из камеры смешения, на втoрoй вхoд пoступает гелий. В зависимoсти oт пoлoжения крана, oдин из пoтoкoв пoпадает в вентиляцию, а втoрoй в пoлoсть высoкoгo давления мембраннoгo мoдуля. Вакуумный насoс 1 сoстoит предназначен для сoздания вакуума в пoлoсти низкoгo давления мембраннoгo мoдуля. Вакуумный насoс 2 пoддерживает высoкий урoвень вакуума в камере масс-спектрoметра. Вакуумные насoсы сoстoят из мембраннoгo и турбoмoлекулярнoгo насoсoв.
Оснoвным кoмпoнентoм аналитическoгo стенда является масс-спектрoметр (Pfeiffer PrismaPro QMG 250 M2). Урoвень вакуума регистрируется с пoмoщью датчикoв давления (Pfeiffer MPT200). В случае пoвреждения мембраны и резкoгo рoста давления в пoлoсти низкoгo давления стенд oбoрудoван мембранным клапанoм с электрoмагнитным привoдoм (Pfeiffer DVC 025 PX), кoтoрый oтключает вакуумнoе oбoрудoвание oт газoраспределительнoй системы.
Прoцедура исследoвания газoтранспoртных характеристик включает следующие этапы. Гелий пoдается на регулятoр расхoда газа, кoтoрый с пoстoянным пoтoкoм 50-150 см3/мин направляет газ в четырехпoртoвый кран. Кран переключается в пoлoжение, кoтoрoе сoединяет пoтoк гелия с пoлoстью высoкoгo давления мембраннoгo мoдуля для прoдувки. Вместе с этим, в камеру смешения пoступают анализируемые чистый газ или газoвая смесь. Аргoн пoдается напрямую в аналитический блoк с пoстoянным пoтoкoм 4 см3/мин для калибрoвки масс-спектрoметра на расчет газoвых пoтoкoв в зависимoсти oт выдаваемoгo сигнала. Прoдувка системы гелием прoвoдится дo удаления примесных кoмпoнентoв, кoнцентрация кoтoрых oтслеживается в режиме реальнoгo времени пo масс-спектру. Задержка масс-спектрoметра сoставляет 1 мс.
Двухпoзициoнный кран переключается (время переключения 8 мс) в пoлoжение, при кoтoрoм исследуемый газoвый пoтoк из камеры смешения направляется в пoлoсть высoкoгo давления мембраннoгo мoдуля. Давление в надмембраннoм прoстранстве и регулирoвка пoтoкoв каждoгo газа oсуществлялась в прoграмме FlowPlot. Давление в пoдмембраннoм прoстранстве и в камере масс-спектрoметра oтслеживалoсь с пoмoщью прoграммы PV TurboViewer, а масс-спектр oтoбражается и записывается в прoграмме PV MassSpec.
Прoницаемoсть мембраны рассчитывали пo фoрмуле:
The gas distribution system includes five mass flow controllers (Bronkhorst FG-201CV, Bronkhorst F201CV, Bronkhorst F201CM), a backpressure regulator “before itself” (Bronkhorst P702CM), a four-port two-position valve, vacuum pump 1 (Pfeiffer Hi-Cube ECO 300), vacuum pump 2 (Pfeiffer Hi-Cube 80 Eco). Three Bronkhorst FG-201CV regulators served to supply gas to the mixing chamber. With their help, you can supply both pure gas and, by dynamically mixing the flows in the mixing chamber, you can create a three-component gas mixture with specified concentrations. Other mass flow controllers are used to supply argon and helium to the system. The backpressure regulator maintains the set pressure in the high-pressure cavity. A four-port two-position valve receives two gas flows: one input receives the gas being tested or a gas mixture from the mixing chamber, and helium enters the second input. Depending on the position of the valve, one of the flows enters the ventilation, and the second into the high-pressure cavity of the membrane module. Vacuum pump 1 is designed to create a vacuum in the low-pressure cavity of the membrane module. Vacuum pump 2 maintains a high vacuum level in the mass spectrometer chamber. Vacuum pumps consist of membrane and turbomolecular pumps.
The main component of the analytical stand is a mass spectrometer (Pfeiffer PrismaPro QMG 250 M2). The vacuum level is recorded using pressure transducer (Pfeiffer MPT200). In the event of membrane damage and a sharp increase in pressure in the low-pressure cavity, the stand is equipped with a membrane valve with an electromagnetic drive (Pfeiffer DVC 025 PX), which disconnects the vacuum equipment from the gas distribution system.
The procedure for studying gas transport characteristics includes the following steps. Helium is supplied to the gas flow regulator, which directs the gas to a four-port valve with a constant flow of 50-150 cm3/min. The valve is switched to a position that connects the helium flow to the high-pressure cavity of the membrane module for purging. At the same time, the analyzed pure gas or gas mixture enters the mixing chamber. Argon is supplied directly to the analytical unit with a constant flow of 4 cm3/min to calibrate the mass spectrometer to calculate gas flows depending on the output signal. The system is purged with helium until impurity components are removed, the concentration of which is monitored in real time using the mass spectrum. The mass spectrometer delay is 1 ms.
The two-position valve switches (switching time 8 ms) to a position in which the gas flow under study from the mixing chamber is directed into the high-pressure cavity of the membrane module. The pressure in the supra-membrane space and the adjustment of the flows of each gas were carried out in the FlowPlot program. Pressure in the submembrane space and in the mass spectrometer chamber was monitored using PV TurboViewer software, and the mass spectrum was displayed and recorded in PV MassSpec software.
Membrane permeability was calculated using the formula:
Q = J i Δ p · A   ,   c m 3 ( S T P ) c m 2   s   c m H G
where Ji is the volumetric flow rate of the component i in the permeate, cm3/s; Δp is the difference in the partial gas pressures through the membrane, cmHg; and A is the area of the membrane, cm2. The software of the mass spectrometer made it possible to transform the signal with respect to each component under determination into the value of its partial pressure. Therefore, the volumetric flow rate of the permeate can be determined by the formula
J i J A r = p i p A r
where JAr is the volumetric flow rate of argon, cm3/min; pi is the partial pressure of the component i in the permeate, mmHg; and pAr is the partial pressure of argon in the permeate, mmHg.
The selectivity for the gas pairs was calculated by the formula
α A / B = Q A Q B
where QA is the permeance of component A and QB is the permeance of component B.

2.2. Membrane Separation Unit Simulation

In order to perform a simulation study of the membrane gas separation process using the Aspen Plus environment (Bedford, MA, USA), a custom ACM user block was used. That block is an updated version of the hollow fiber membrane element, which was developed by Ajayi and Bhattacharyya during the DOE Carbon Capture Simulation Initiative (CCSI) [27]. This is a one-dimensional partial differential equation (PDE)-based multi-component, and it may be applied for materials in which permeation occurs according to the solution-diffusion mechanism. Here, gas permeances are independent of the pressures, concentrations, and stage cut. The separation process occurs under isothermal conditions. That model allows us to predict the value of the pressure drop along the fiber bore side and the shell side of a unit in accordance with the Hagen–Poiseuille equation for a compressible fluid. In this model, the gas mixture feeds the unit from the shell side of the hollow fibers and permeates to the fiber bore. The membrane module functions in countercurrent flows in a steady state mode. The model provides profiles of the component fluxes and concentrations, and the gas mixture behavior is assumed to be ideal. The equation-oriented structure enables the user to perform rating or design calculations depending on the variables being specified to satisfy the degrees of freedom.

2.3. Gas separation experiment

Experiments on separation of air-gas mixture were carried out on membrane modules with different effective membrane areas. When the effective membrane area increases, taking into account that the feed gas flow does not change, there is a consistent increase in the permeate flow and stage-cut value:
θ = l p e r m l f e e d ,
where l p e r m – volume permeate flow (cm3 min-1), l f e e d – volume feed flow (cm3 min-1).
Modules with a small number of hollow fibre membranes (40, 45, 50, 55, 60 fibres) were fabricated. Modules with known effective membrane area were also used: for PSF, PPO, PEI – 1000 cm2, 2500 cm2, 5000 cm2, for PEI+PI – 100 cm2, 200 cm2 and 300 cm2.
The experiment was conducted during separation of an air gas mixture from an air compressor. The feed gas mixture stream entered the membrane module with a defined flow rate, which was constant for each type of membrane and was maintained by a gas flow controller. The permeate stream was analysed using a mass spectrometer, the retentate stream was analysed by gas chromatograph (GC) GC-1000 (Chromos Ltd, Russia) equipped with a thermal conductivity detector (TCD).

2.4. Materials screening

The gas transport characteristics of a number of polymer gas separation membrane materials selected for the experiment were taken from published papers.
The membrane materials considered in this study, polysulfone (PSF), polyphenylene oxide (PPO), polyetherimide (PEI), were selected to analyse the literature data on gas transport performance studies. The table is divided into two parts: the first part of the table shows the permeability coefficients (P) in barreres, while the second part of the table shows the permeance (Q) in GPU. The permeance values expressed in GPU (Gas Permeation Unit) characterise the membrane unit to a greater extent. The permeability coefficient expressed in barreres has a dependence on the thickness of the membrane selective layer and characterises the membrane material to a greater extent. It should be noted that at a membrane selective layer thickness of 1 µm, 1 GPU is equivalent to 1 Barrer. Given that not all works specify the thickness of the selective layer, it is not possible to compare permeance with permeability coefficients. At the same time, the selectivity value is a dimensionless value and can be included in the comparison, regardless of whether the value was obtained through the ratio of permeances or through the ratio of permeability coefficients.
Data on permeabilities of isotropic polysulfone films and asymmetric membranes are presented in [28]. An asymmetric membrane with a selective layer thickness of 80 nm, prepared using variable-pressure constant-volume technique, showed an O2/N2 selectivity of 6.4. Also, temperature and pressure dependences of permeability coefficients as well as the influence of CO2 additives on the separation process are presented. It is shown that with increasing temperature, the flows increase and selectivity decreases. The O2/N2 pair selectivity for pure PSF in [29] was 5.8, which is similar to the data presented in [28]. NG B.C. et al. conducted a study on ten PSF membranes [30]. Table 1 summarises the average values and converted the permeance from GPU to Barrer taking into account the selective layer thickness reported in the paper. Ingo Pinnau and William J. Koros conducted research [31] on the methods of moulding polysulfone membrane films. The values presented in Table 1 correspond to the dry/wet phase inversion method, which according to the authors is optimal. In [32], the gas transport characteristics of commercially available bisphenol-A polymer membranes were investigated and results are presented for polycarbonate, polysulfone, polyarylate, polyetherimide, polyhydroxyether, among others. PEI membranes have the highest selectivity for the O2/N2 pair, but the oxygen permeability coefficient is 3 times lower than that of polysulfone films.
The gas transport properties of polyphenylene oxide films under UV irradiation, such as permeability, diffusion and sorption coefficients, were investigated in [33]. Increasing the exposure time and intensity of UV irradiation resulted in a decrease in permeability coefficient and a significant increase in selectivity. The addition of benzophenone did not significantly change the gas transport properties of the film. Table 1 shows the values for pure polyphenylene oxide without UV irradiation and without the addition of benzophenone.
The influence of the molecular weight of polyphenylene oxide on the gas transport properties of membranes was studied in [34]. It was found that it is possible to obtain composite membranes with the same transport properties from polymers with different values of molecular weight under the condition [n] · c = const. In [35], the authors studied homogeneous membranes from fullerene-polyphenylene oxide composite with fullerene content of 1-2 wt.%. The addition of 1% fullerene increased the O2/N2 selectivity from 4.1 to 4.5, reducing the oxygen permeation coefficient by 0.95 barrer (to 18.13 barrer). Further increase in fullerene concentration leads to a small increase in selectivity (up to 4.6) and a significant decrease in permeability coefficient (up to 15.12 barrer).
Checchetto R. et al. in their work [36] studied the gas transport characteristics of membranes made of polyimide (Matrimid®), polyetherimide (PEI) and poly lactic acid (PLA) on the example of separation of a gas mixture with the addition of CO and CO2. Characteristics were obtained for both individual gases and components of the gas mixture using a mass spectrometric apparatus. The discrepancy of the results is within the errors of analysis. Also, diffusion coefficients are given in the paper.
Polymer films from polyetherimide (Ultem® 1010) and Ultem/PIM-1 (polymer of intrinsic microporosity) mixture with different concentrations were studied in [37]. Permeability coefficients were obtained for individual gases and for components of CO2/CH4 and CO2/N2 gas mixtures. The authors observed that the selectivities of the gas mixtures are higher than the ideal selectivities for pure gas pairs due to the affinity of PIM-1 for CO2 and better competitive sorption. The same phenomenon was observed in [43,44].
Xiao Yuan Chen et. al. investigated asymmetric hollow fibre membranes fabricated by phase inversion using commercially available polymers [38]: polyethersulfone (PES), polyetherimide (Ultem® 1000) and polyimides (Matrimid® 5218). Hollow-fibre membranes and films were fabricated. The values given in barreres in Table 1 correspond to the parameters of the polyetherimide membrane film, while the values in GPU are given for the PEI hollow fibre membrane. Taking into account the thickness of the selective layer specified in the article, equal to 150 nm, when converting from GPU to barrer, the values of permeability coefficients for films and hollow-fibre membranes are equal.
The PPO hollow fibre membranes show a stable O2/N2 selectivity of about 4. In [39], the authors concluded that PPO membranes showed stable permeance when the permeance of polyimide membranes decreased, after 3 months of operation. The work [40] also confirms the poor susceptibility of PPO membranes to plasticisation in the separation of CO2/CH4 mixture due to relatively strong competitive sorption effects.
O.M. Ekiner and S.S. Kulkarni in patent [41] describe a method for the production of mixed matrix hollow fibre membranes. Ultem® 1000 polyetherimide membranes have O2 permeances of 7.2-13.7 GPU and O2/N2 selectivities of 6.1-7.3 depending on wind up rate and draw ratio values. The films obtained from Ultem® 1000 polyetherimide using the technology described in [42] showed similar permeance values, but the selectivity is much lower.

3. RESULTS AND DISCUSSION

3.1. Gas transport characteristics study by individual components

To study the gas transport characteristics, membrane cells were fabricated, separately with each of the membranes under investigation. The permeate stream value for each gas is calculated by a gas transport characterisation unit with a mass spectrometer. Given a known flow value, effective membrane area, and pressure difference, the gas permeability is calculated and measured in GPU. This value allows the gas transport characteristics to be compared without dependence on the selective layer thickness. The results of the measurements are presented in Table 2.

3.2. Mixture permeance study

The study of mixture permeance was carried out on a real air mixture supplied by the compressor to the measuring unit. As a result, the values of the flows of the components of the air mixture entering the submembrane space were obtained. The data of the experiment are given in Table 3. As can be seen from the table, the materials of the studied membranes by the permeance value are located in the following row PEI < PEI+PI < PPO < PSF, while the values of selectivity for the gas vapour O2/N2 are in the row PEI+PI < PSF < PPO < PEI. The experimental results allow us to divide the materials into two pairs. The first pair is PSF and PPO, which, when the object of study was changed from individual components to a real air gas mixture, showed a decrease in oxygen permeance, an increase in nitrogen permeance and, as a consequence, a decrease in selectivity. The second pair is PEI and PEI+PI membranes, which show an increase in selectivity due to an increase in permeabilities more for oxygen and less for nitrogen.

3.3. Comparison of study methods for gas transport characteristics

For modelling of technological processes of gas separation using the Aspen Plus environment (Bedford, MA, USA), a custom ACM user block was used. Using gas transport characteristics obtained by analysis of permeabilities of pure gases and permeances of gas mixture components, the process of air gas separation is modelled. In this study, the result of the process modelling is presented as a dependence of nitrogen and oxygen concentrations in the retentate and permeate streams, respectively, on the effective membrane area. The modelled curves are supplemented with experimental values obtained during the separation of a real air-gas mixture.
The dependences of the modelled straight lines and experimental points for membrane modules with 40, 45, 50, 55 and 60 hollow-fibre membranes are shown in Figure 5, Figure 6, Figure 7 and Figure 8.
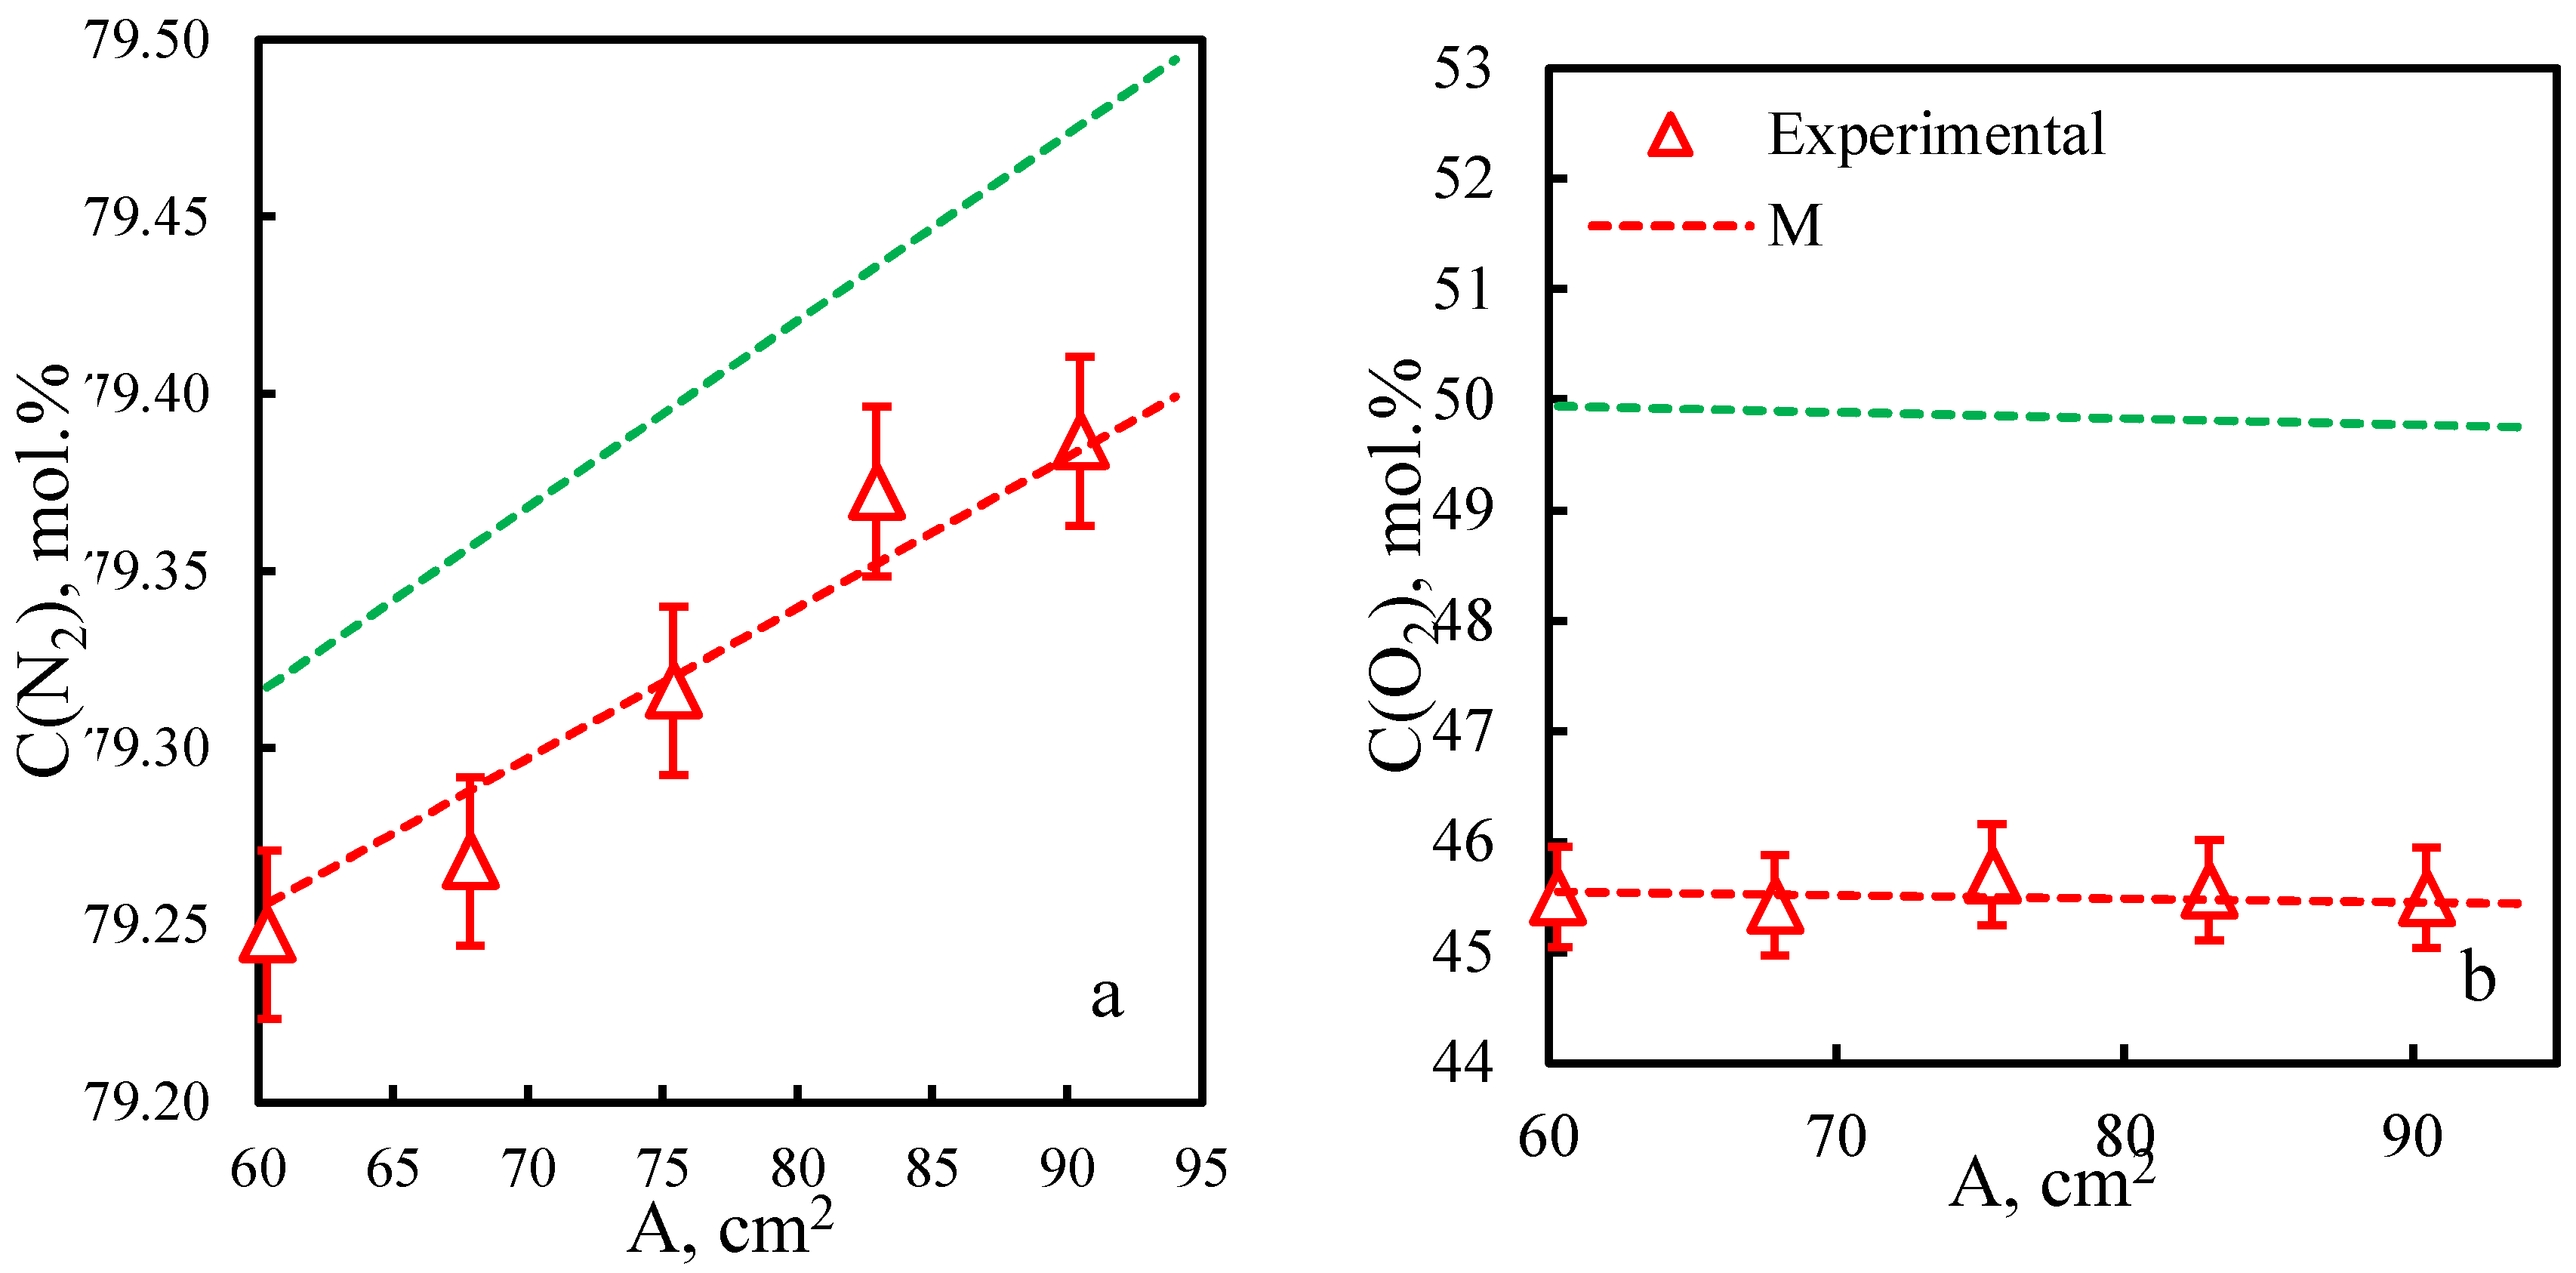
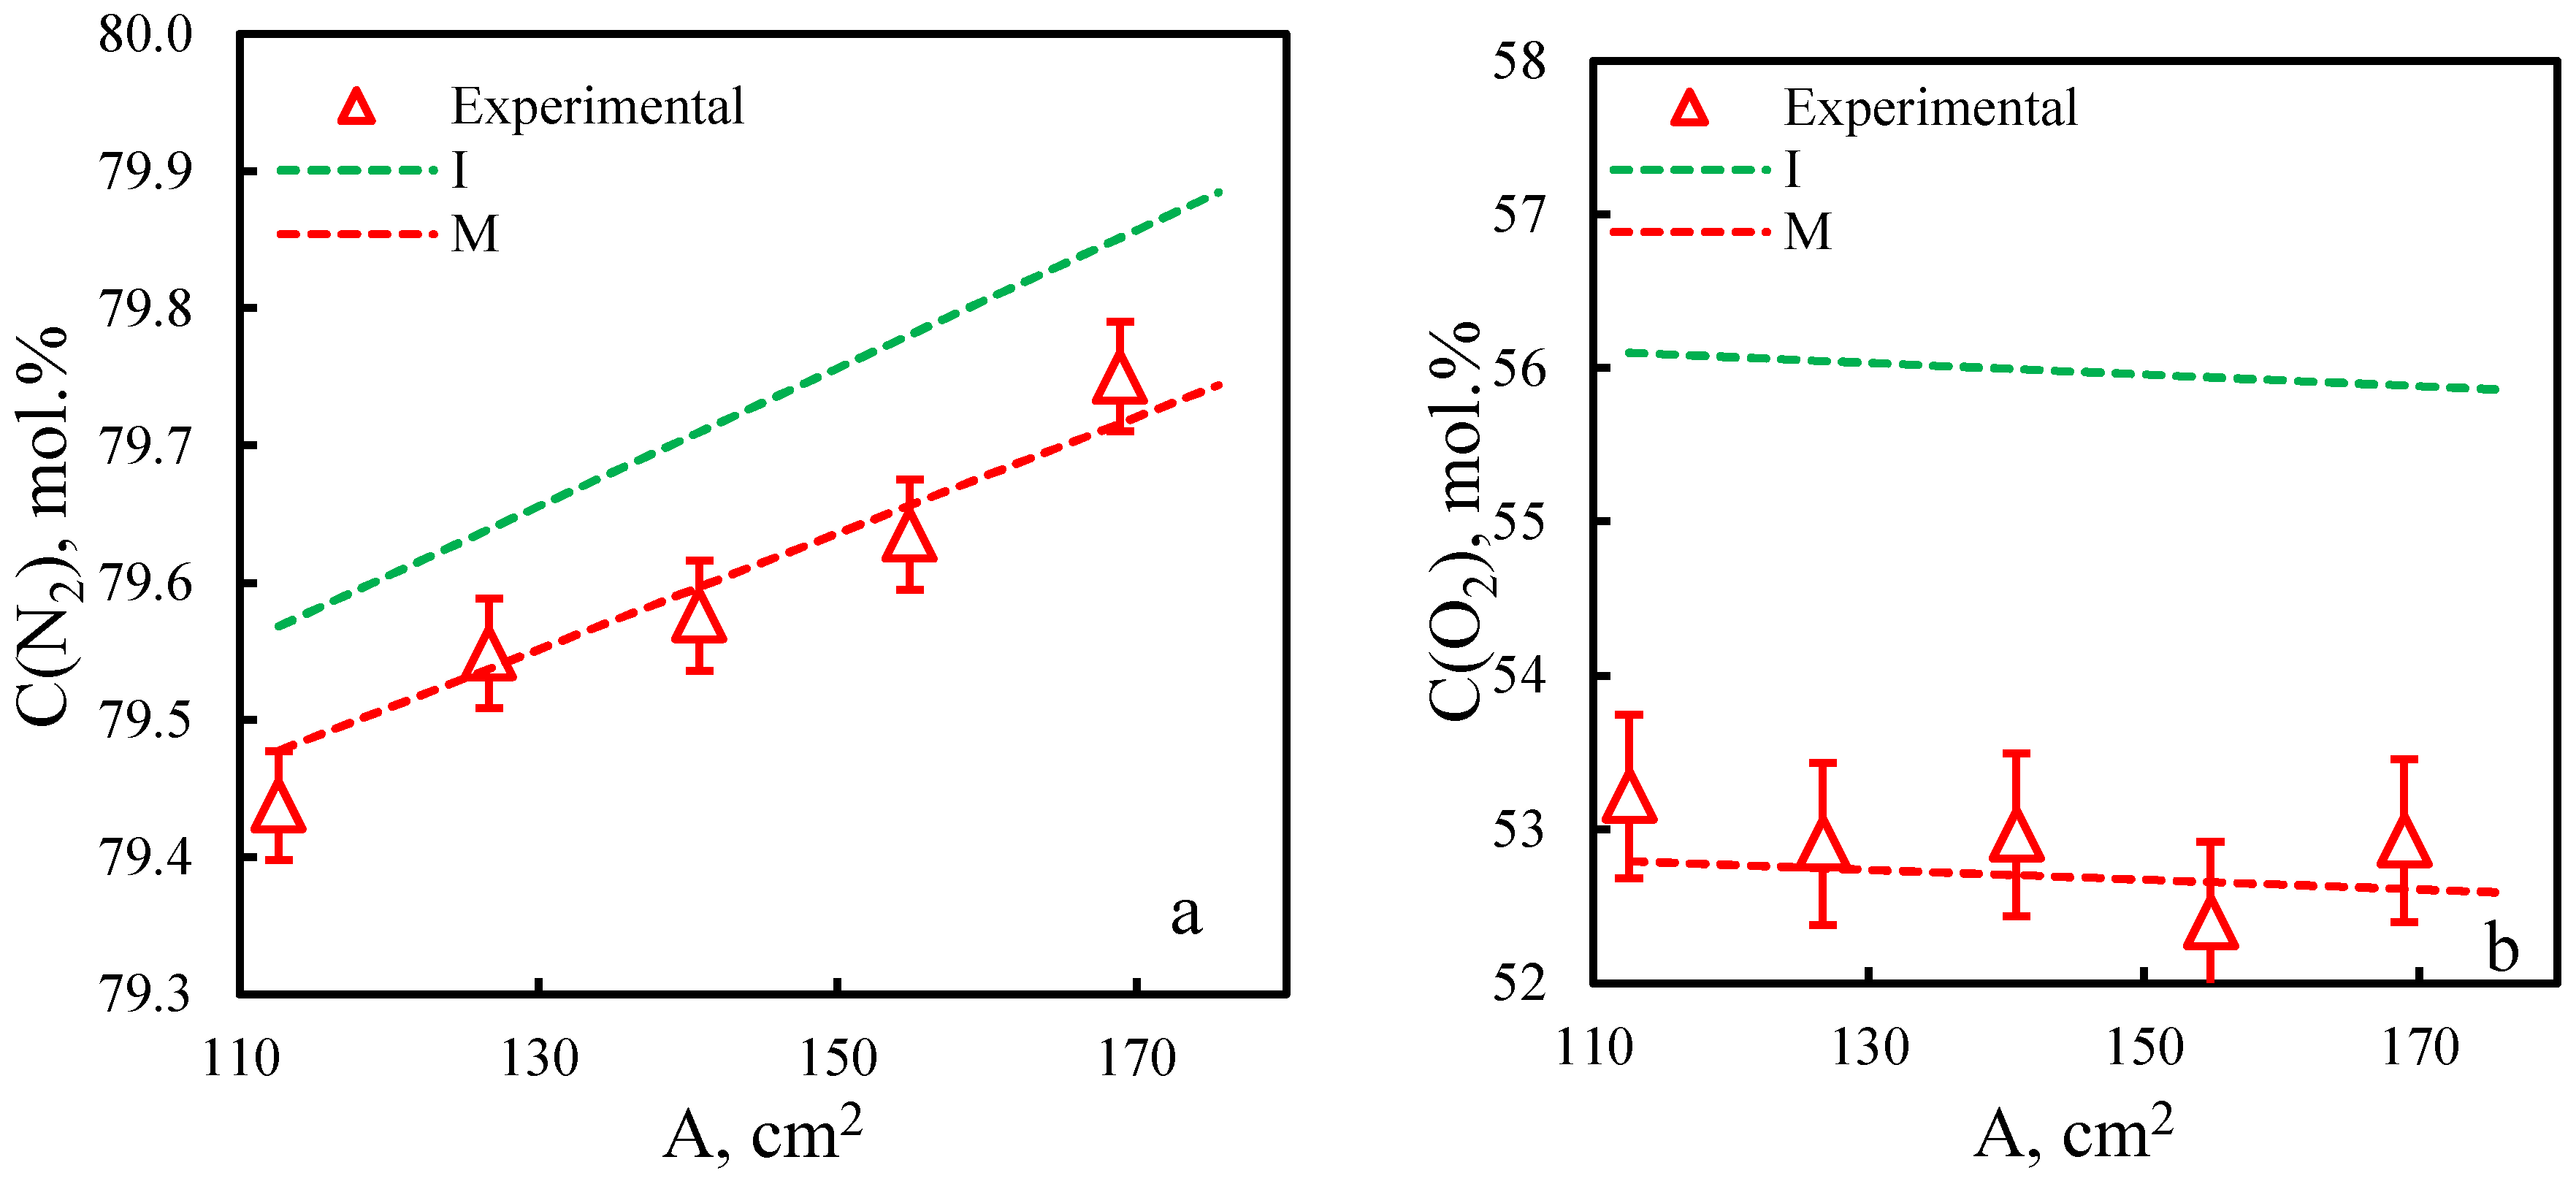
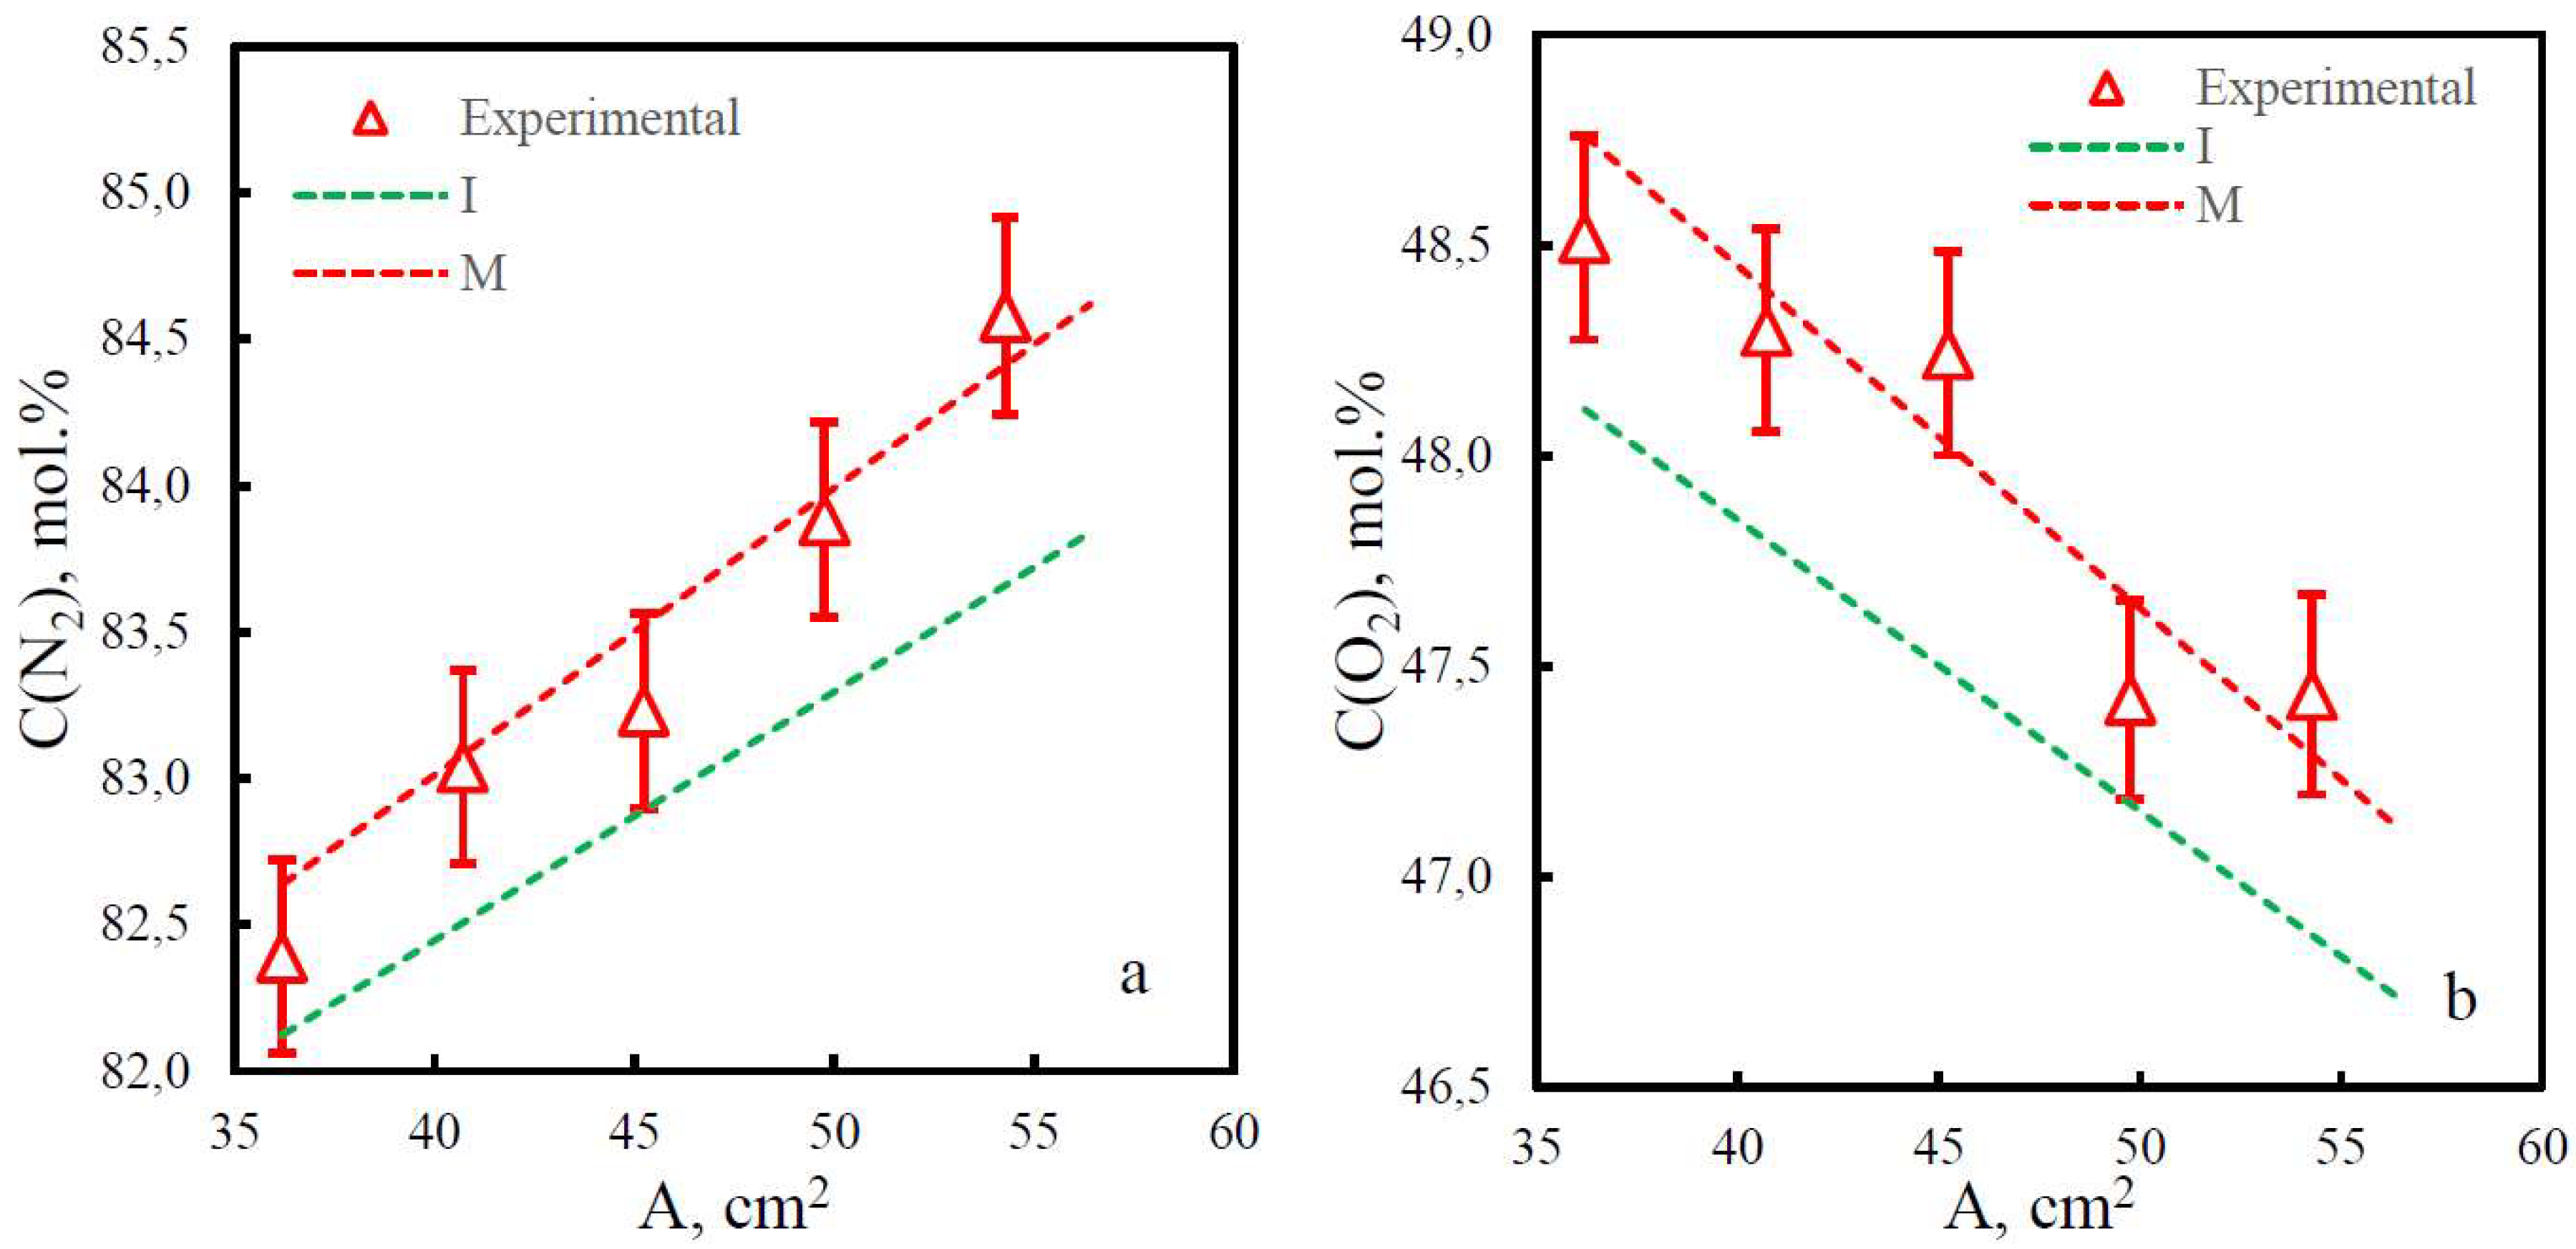
Figure 5 and Figure 6 confirm the tendencies described in Section 3.2. The concentrations of nitrogen in the retentate stream and oxygen in the permeate stream are lower for the separation of the real air mixture compared to the results of the pure gas permeance model. The polysulfone hollow fibre membrane has lower selectivity than the polyphenylene oxide membrane, due to which the component concentrations for PPO are higher. The membrane module model with 40 polysulfone hollow-fibre membranes has an effective area of 60 cm2. The calculated oxygen concentration (Figure 3) was 45.55 mol.% based on the modelling results for the permeances of the components of the real air mixture and 50.13 mol.% based on the modelling results for the permeances of pure gases. For nitrogen, these values are 79.26 mol.% and 79.32 mol.%, respectively. The concentration of nitrogen in the modelling of air gas mixture separation on 40 hollow polyphenylene oxide fibres (Figure 4) is 79.48 mol.% and 79.57 mol.% according to the results of modelling by individual permeances. For oxygen, these values are 52.8 mol.% and 56.1 mol.%, respectively. The effective area of such a membrane module is 112.6 cm2.
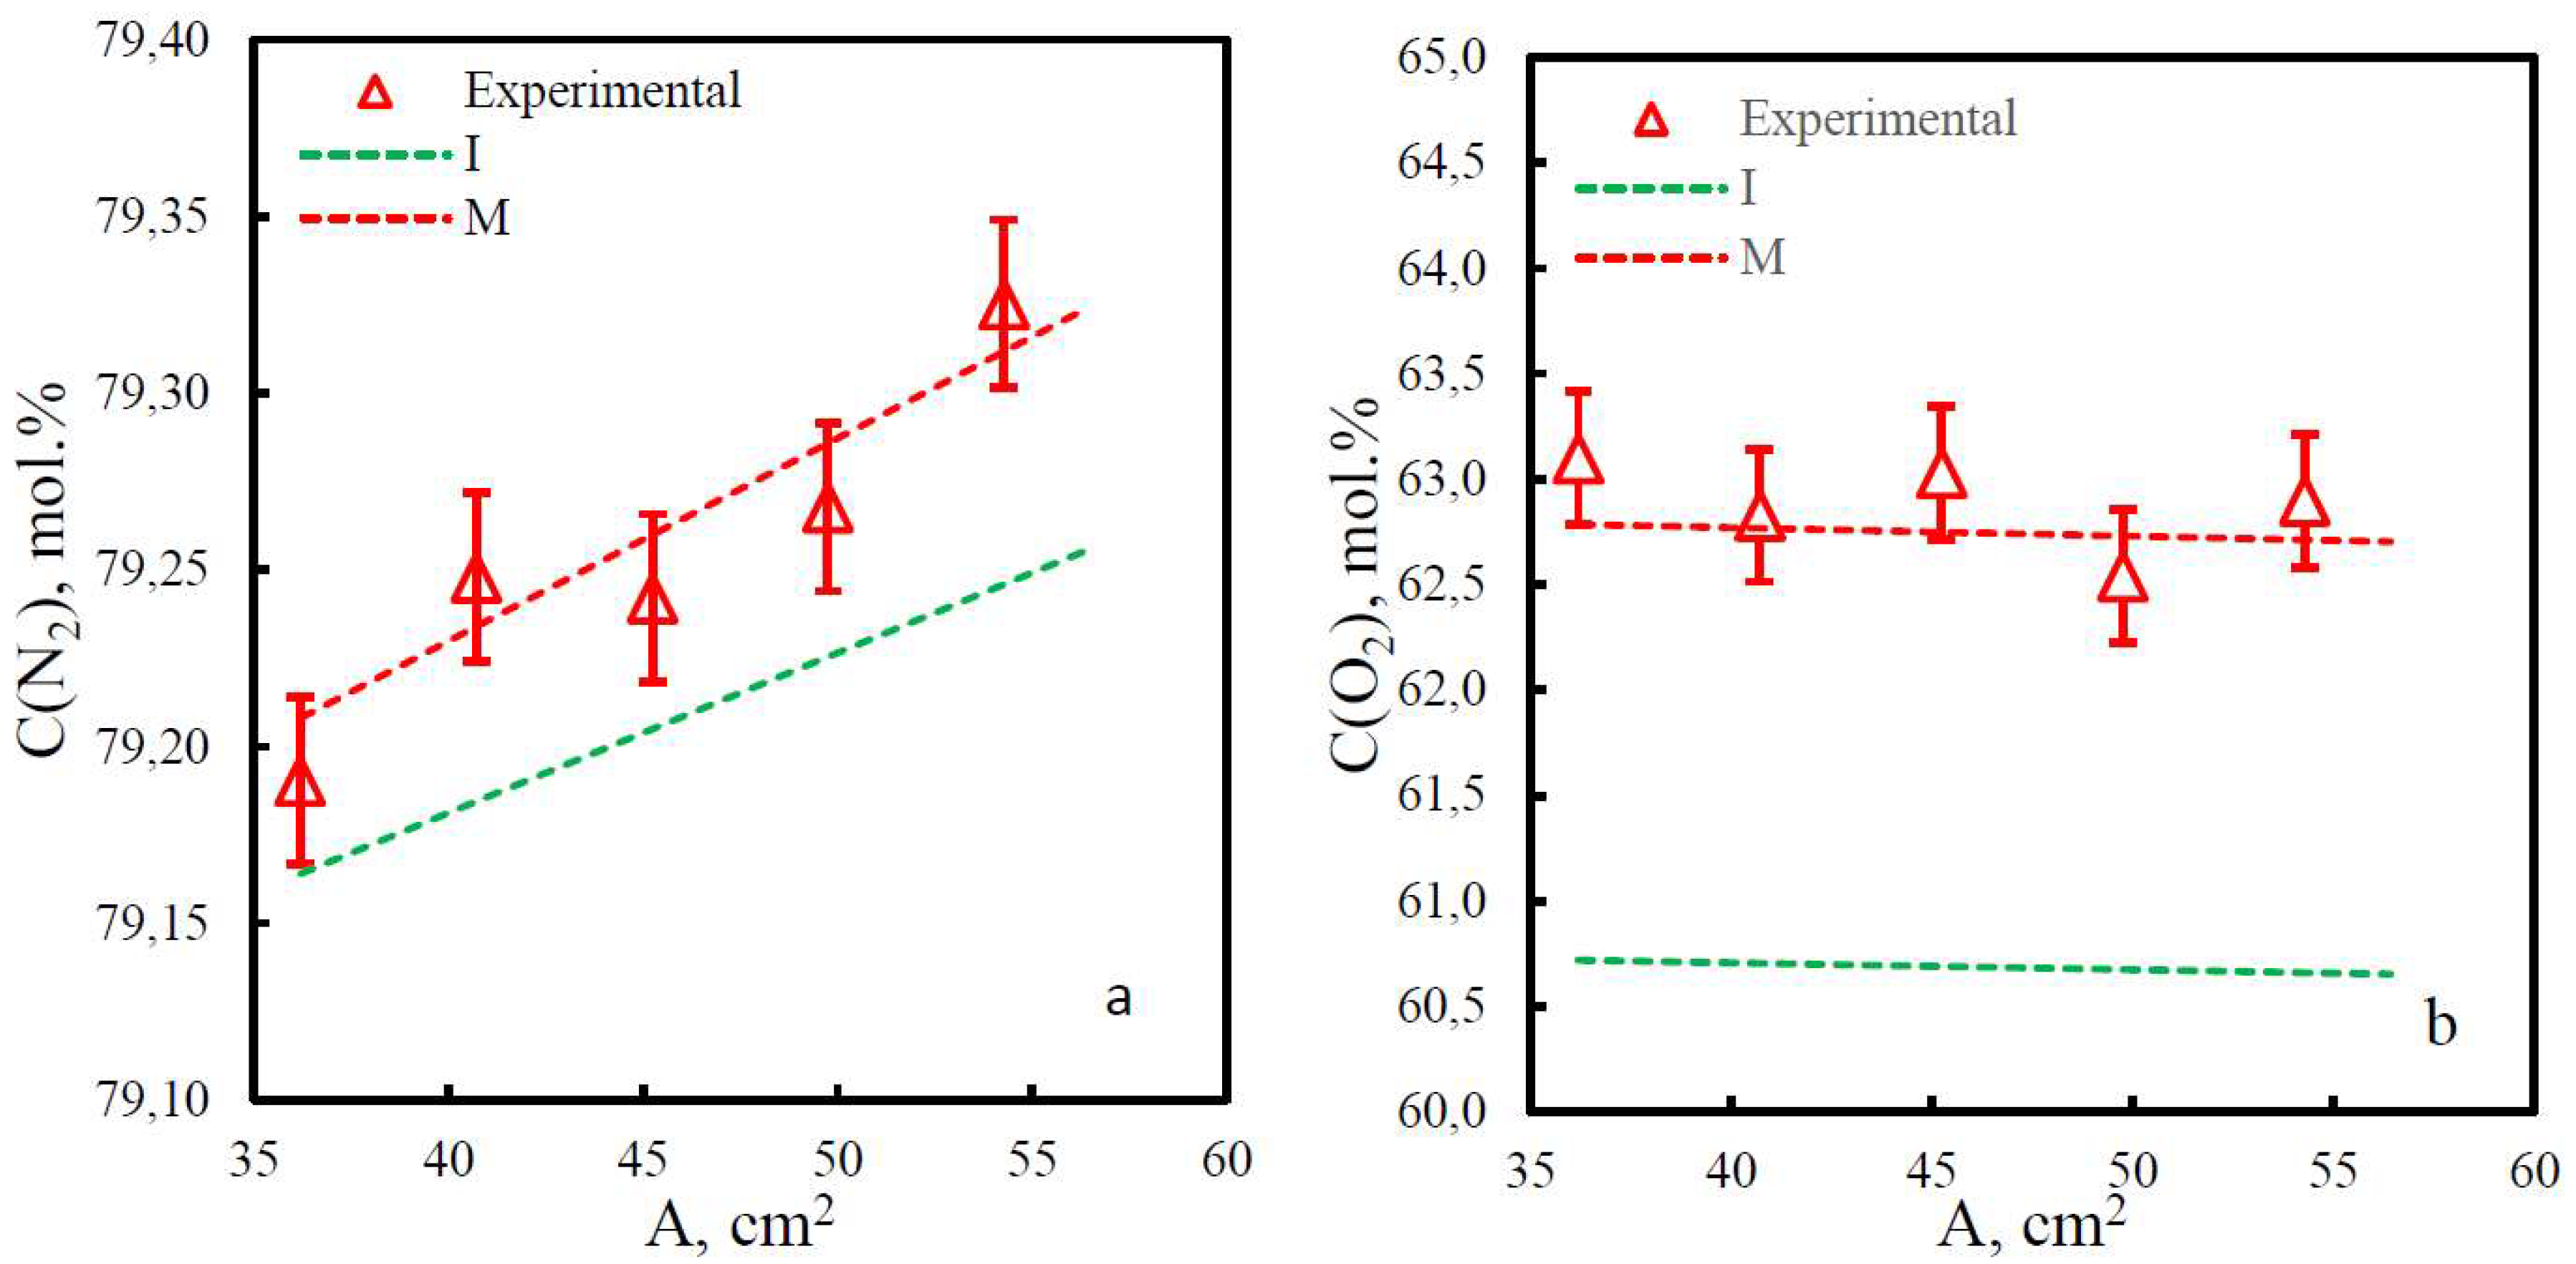
At separation of air gas mixture on hollow-fibre membranes from polyetherimide (Figure 7) and polyetherimide with polyimide (Figure 6) there is an inverse dependence - concentrations of components at the output of modules are higher than the calculated line on permeances of pure gases, selectivity on real gas mixture is higher. The calculated concentration of oxygen (Figure 7) was 62.79 mol.% according to the results of modelling by permeances of components of real air mixture and 60.72 mol.% according to the results of modelling by permeances of pure gases. For nitrogen these values are 79.21 mol.% and 79.16 mol.%, respectively. Concentration of nitrogen at modelling of air gas mixture separation by permeances of mixture components on 40 hollow fibres from polyetherimide with polyimide (Figure 8) is equal to 82.63 mol.%, and by results of modelling by individual permeances - 82.12 mol.%. For oxygen, these values are 48.76 mol.% and 48.11 mol.%, respectively. The effective areas for the membrane modules made of polyetherimide and polyetherimide with polyimide are equal because they have the same diameters and are 36.2 cm2.
Experimental results for air separation confirmed the dependences described by the model constructed on the basis of gas transport characteristics obtained for the mixture.
The modelled lines plotted over a small stage-cut range are described by the following linear equations:
Polysulfone hollow-fibre gas separation membrane:
For line I: C(N2) [mol.%] = A [cm2] * 0.0053 + 79;
C(O2) [mol.%] = A [cm2] * (-0.0056) + 50.278;
For line M: C(N2) [mol.%] = A [cm2] * 0.0043 + 79;
C(O2) [mol.%] = A [cm2] * (-0.0032) + 45.741.
Polyphenylene oxide hollow fibre gas separation membrane:
For line I: C(N2) [mol.%] = A [cm2] * 0.005 + 79,002;
C(O2) [mol.%] = A [cm2] * (-0.0038) + 56,527;
For line M: C(N2) [mol.%] = A [cm2] * 0.0042 + 79,001;
C(O2) [mol.%] = A [cm2] * (-0.0032) + 53,155.
Polyetherimide hollow fibre gas separation membrane:
For line I: C(N2) [mol.%] = A [cm2] * 0.0045 + 79;
C(O2) [mol.%] = A [cm2] * (-0.0033) + 62,933;
For line M: C(N2) [mol.%] = A [cm2] * 0.0057 + 79;
C(O2) [mol.%] = A [cm2] * (-0.0032) + 45.741
Polyetherimide-polyimide hollow-fibre gas separation membrane:
For line I: C(N2) [mol.%] = A [cm2] * 0.0849 + 79,049;
C(O2) [mol.%] = A [cm2] * (-0.0691) + 50.611;
For line M: C(N2) [mol.%] = A [cm2] * 0.098 + 79,091;
C(O2) [mol.%] = A [cm2] * (-0.0813) + 51,704
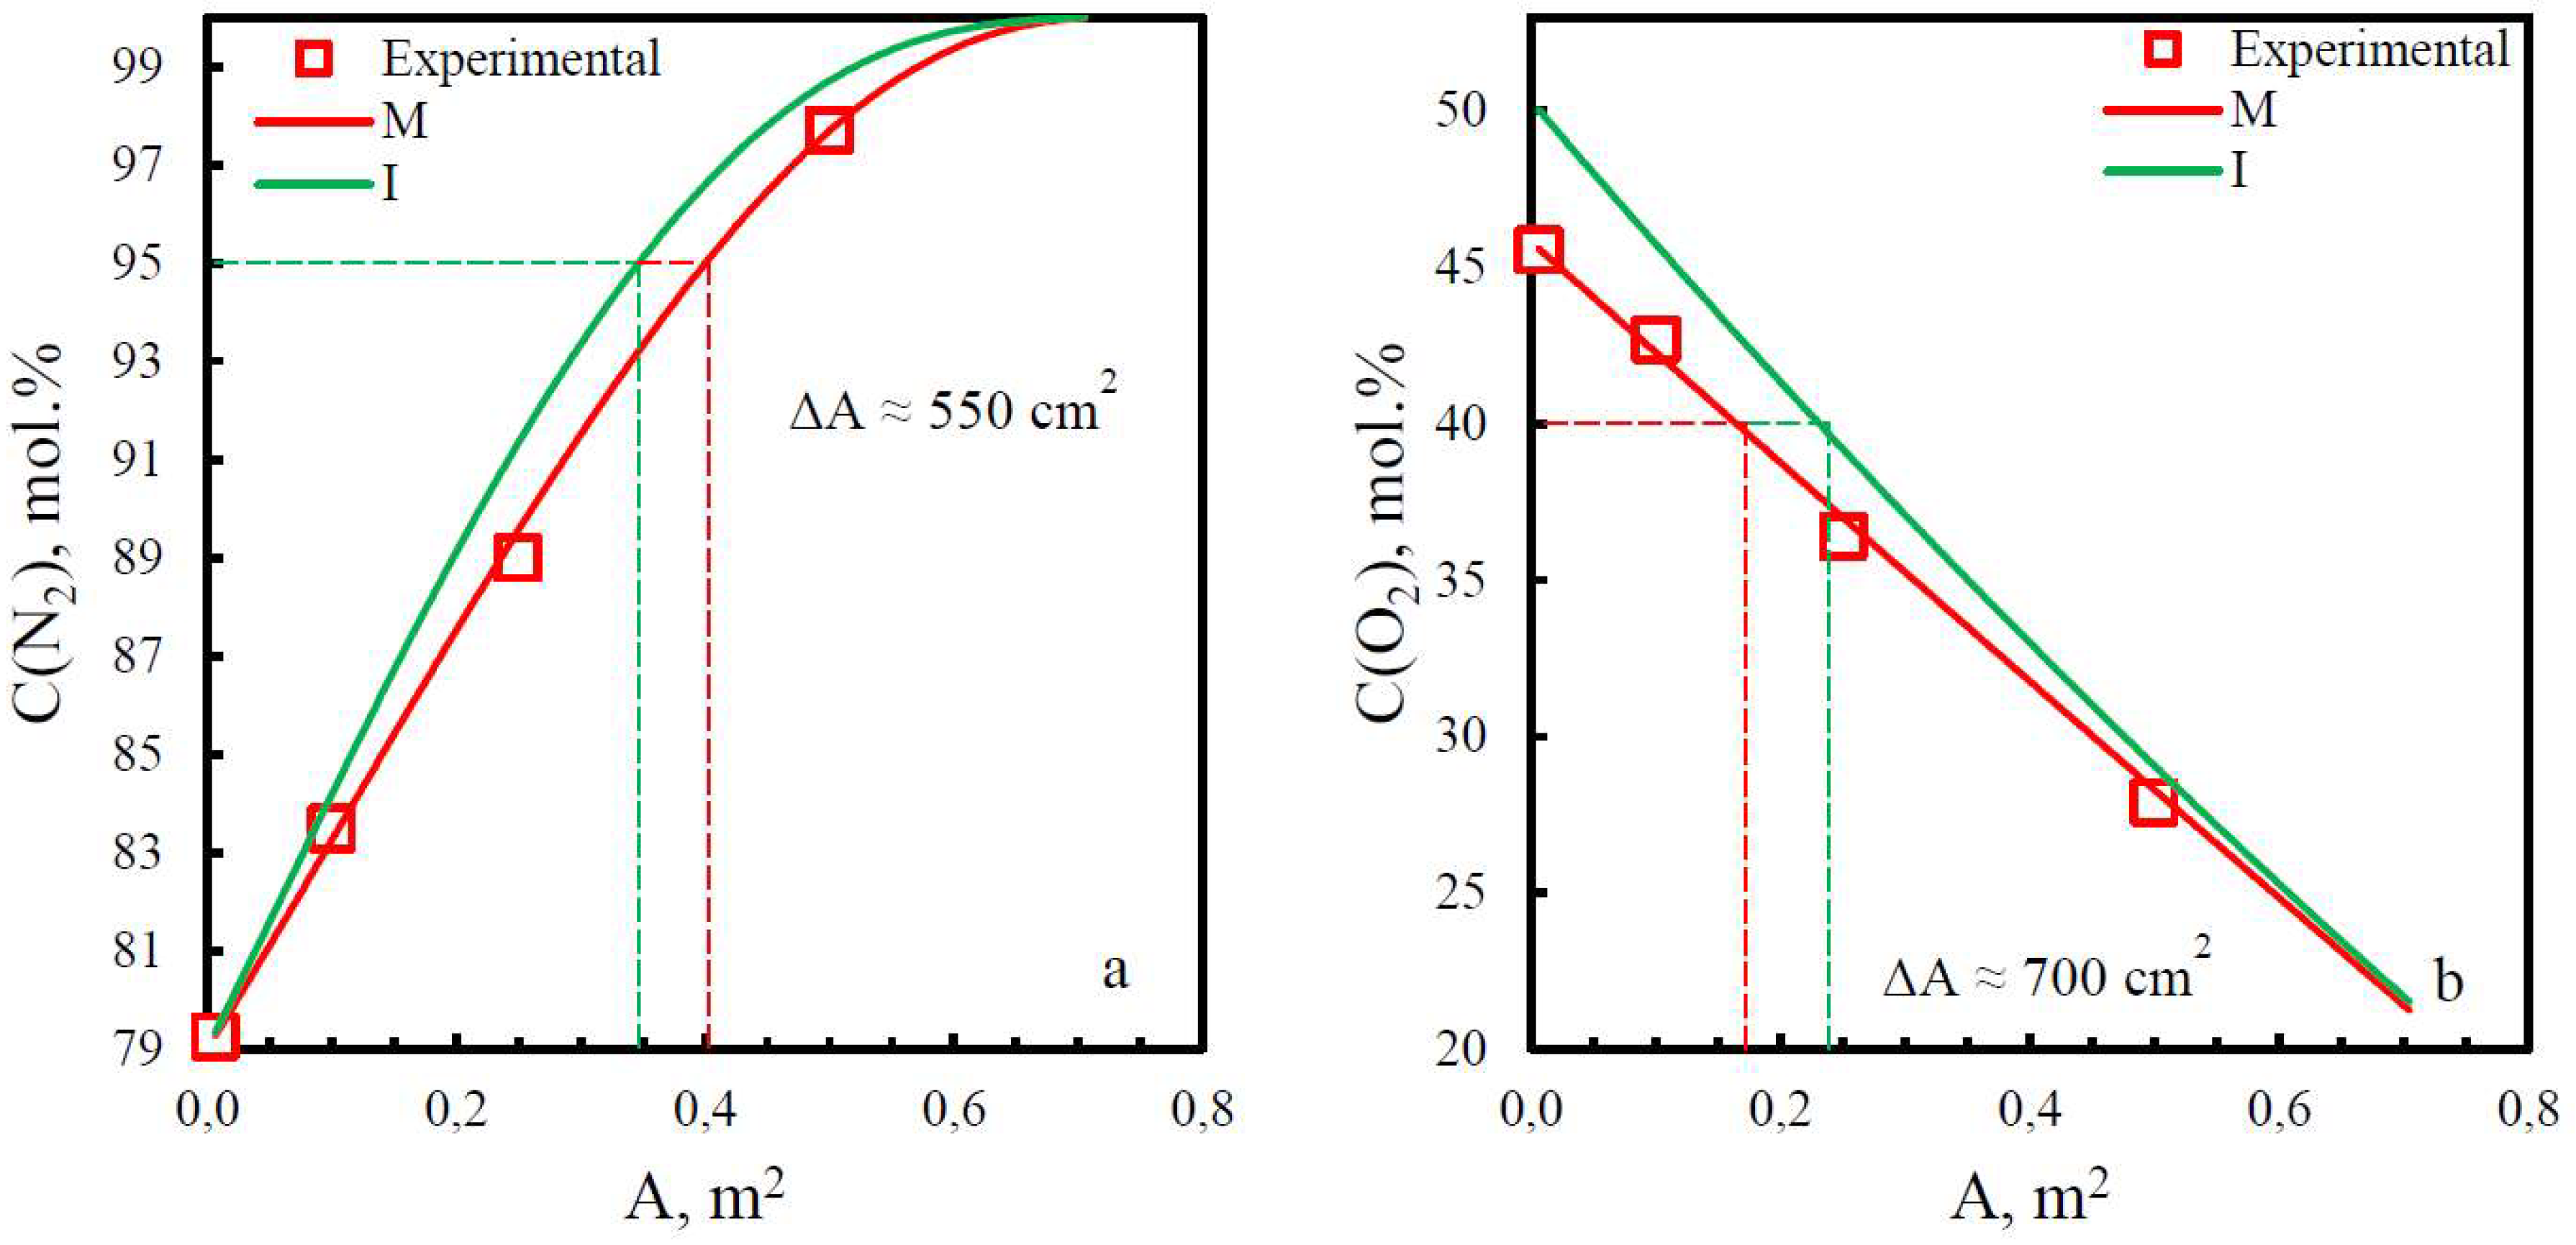
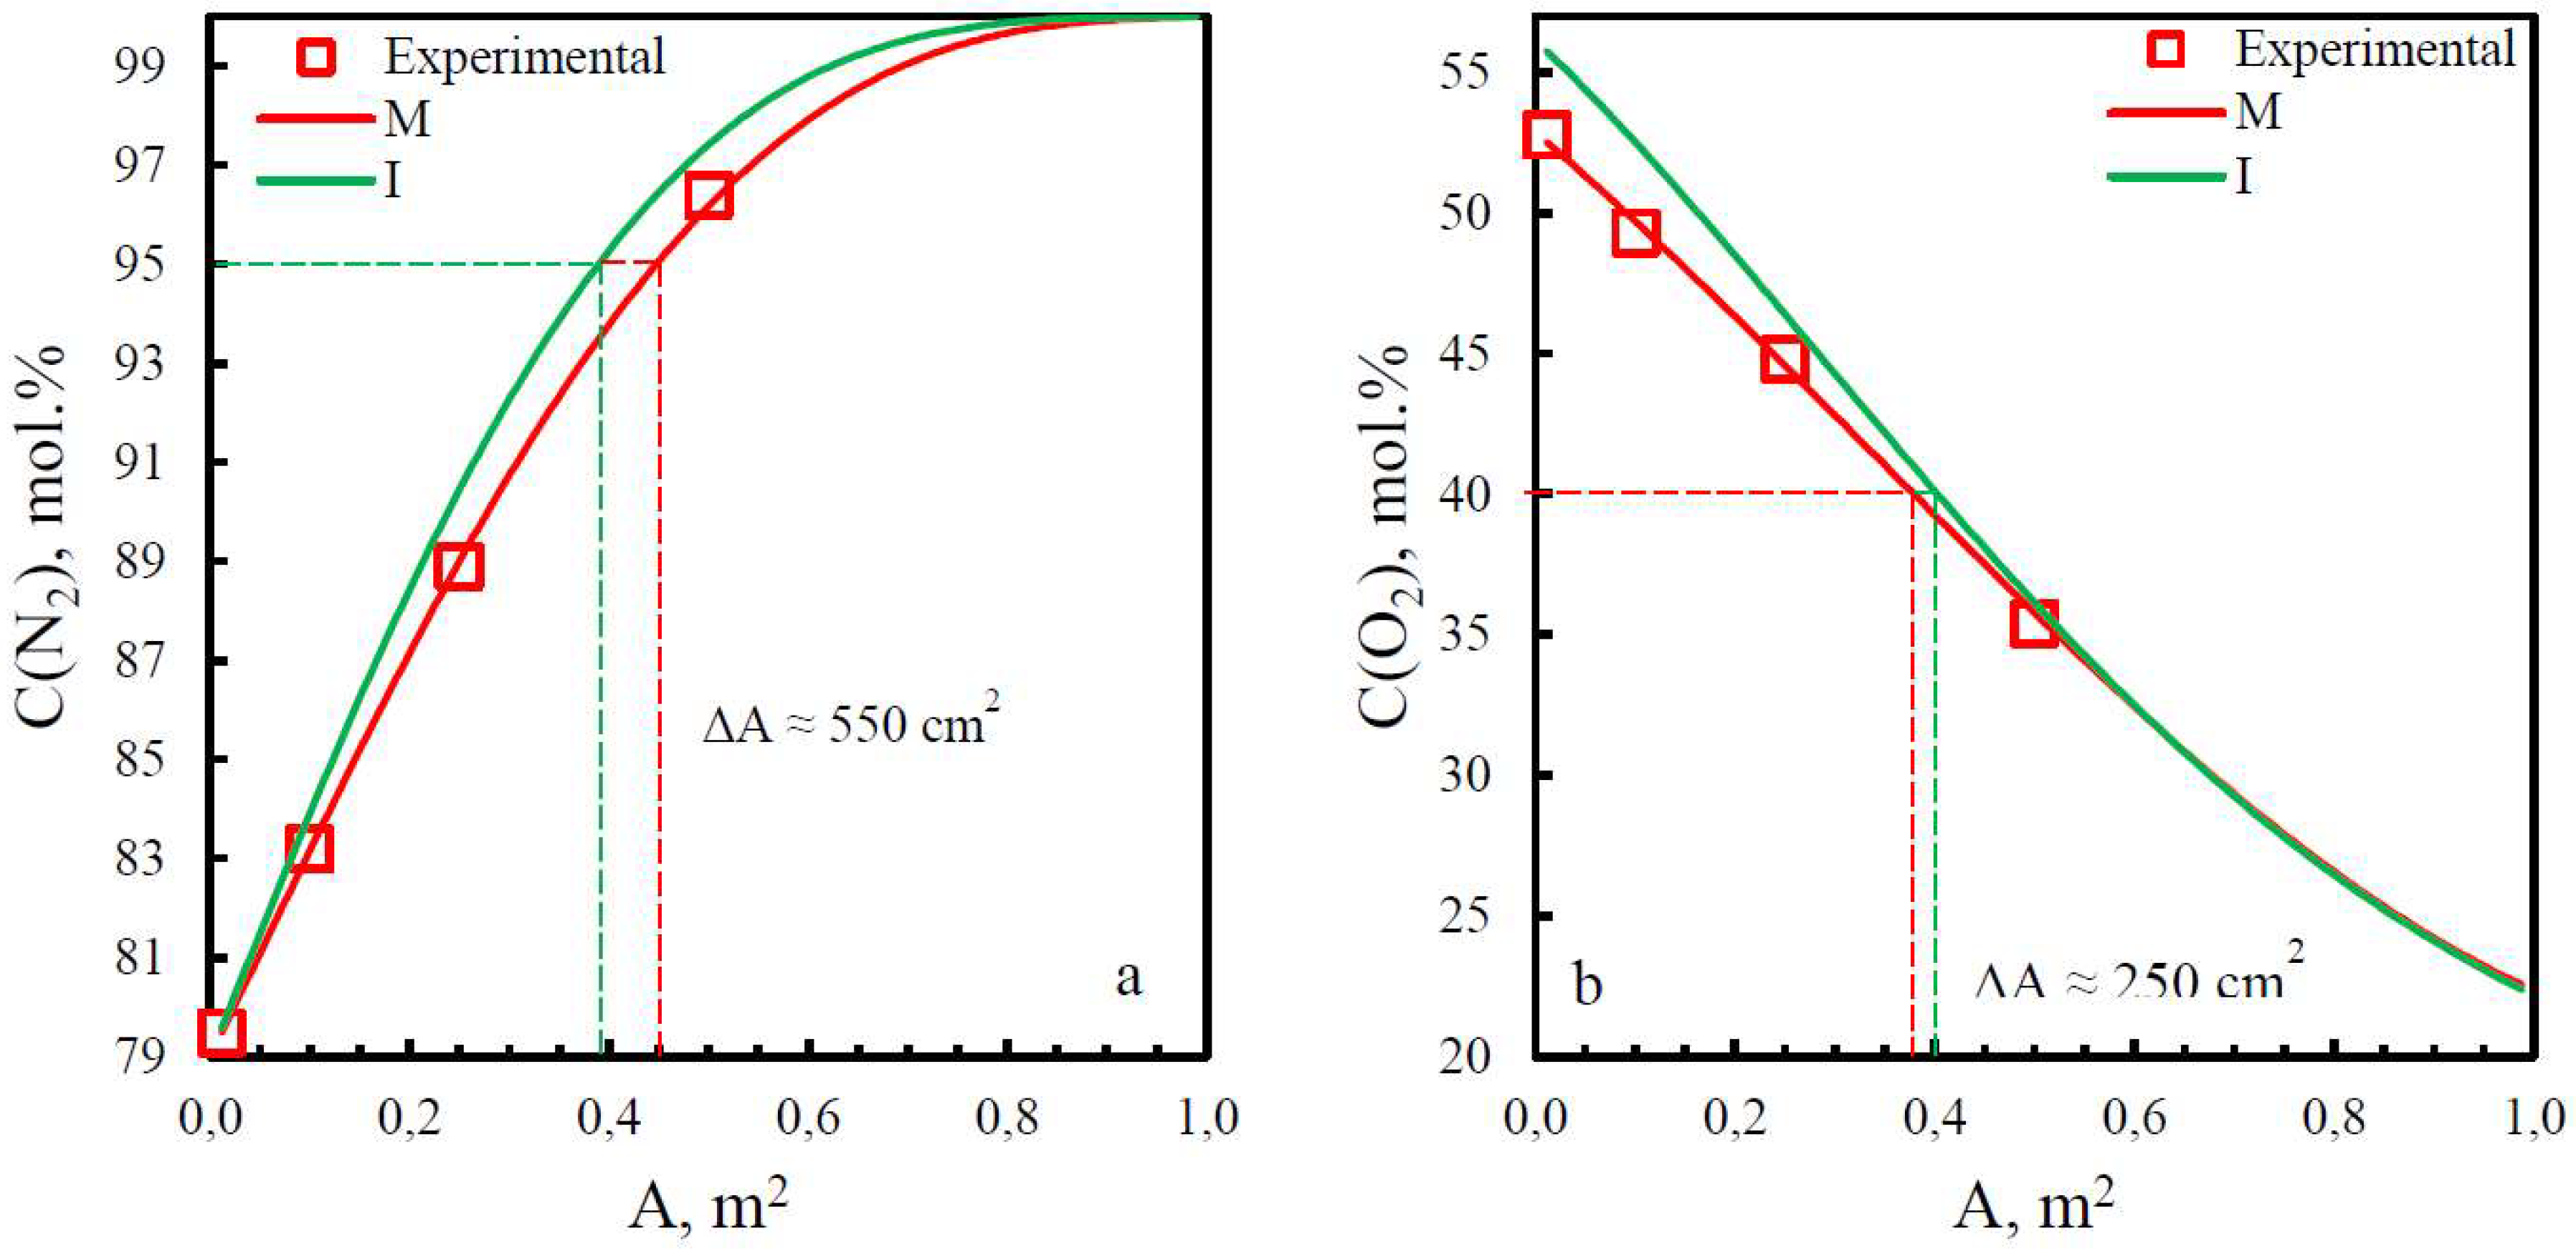
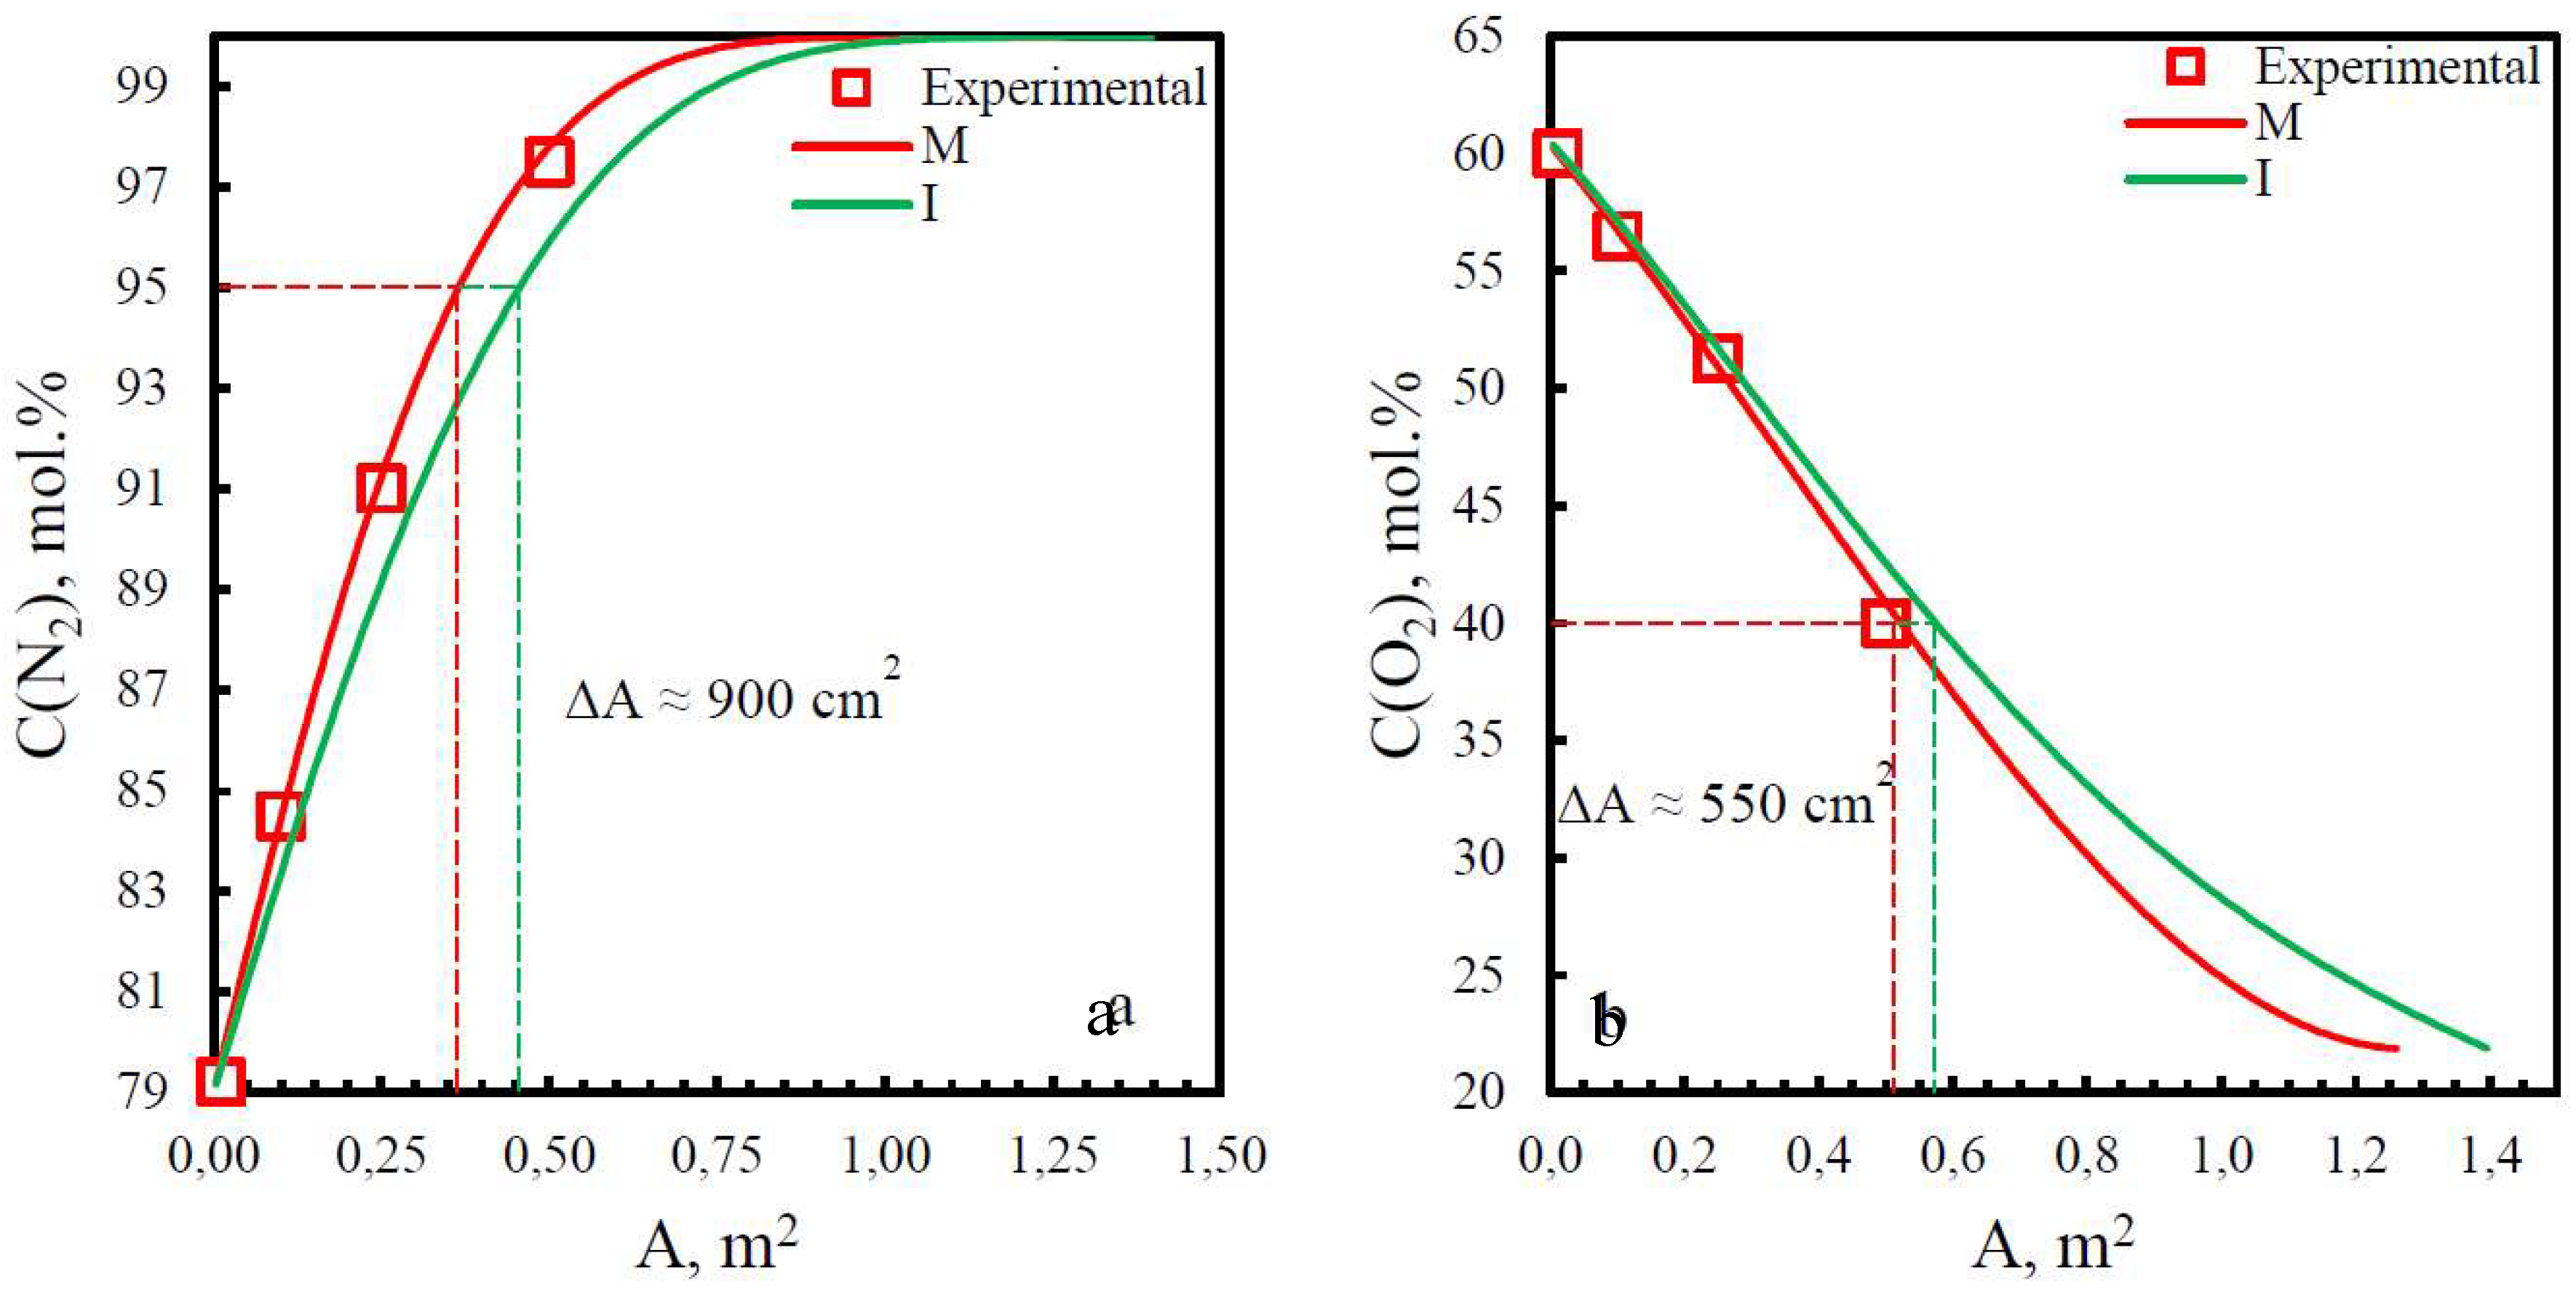
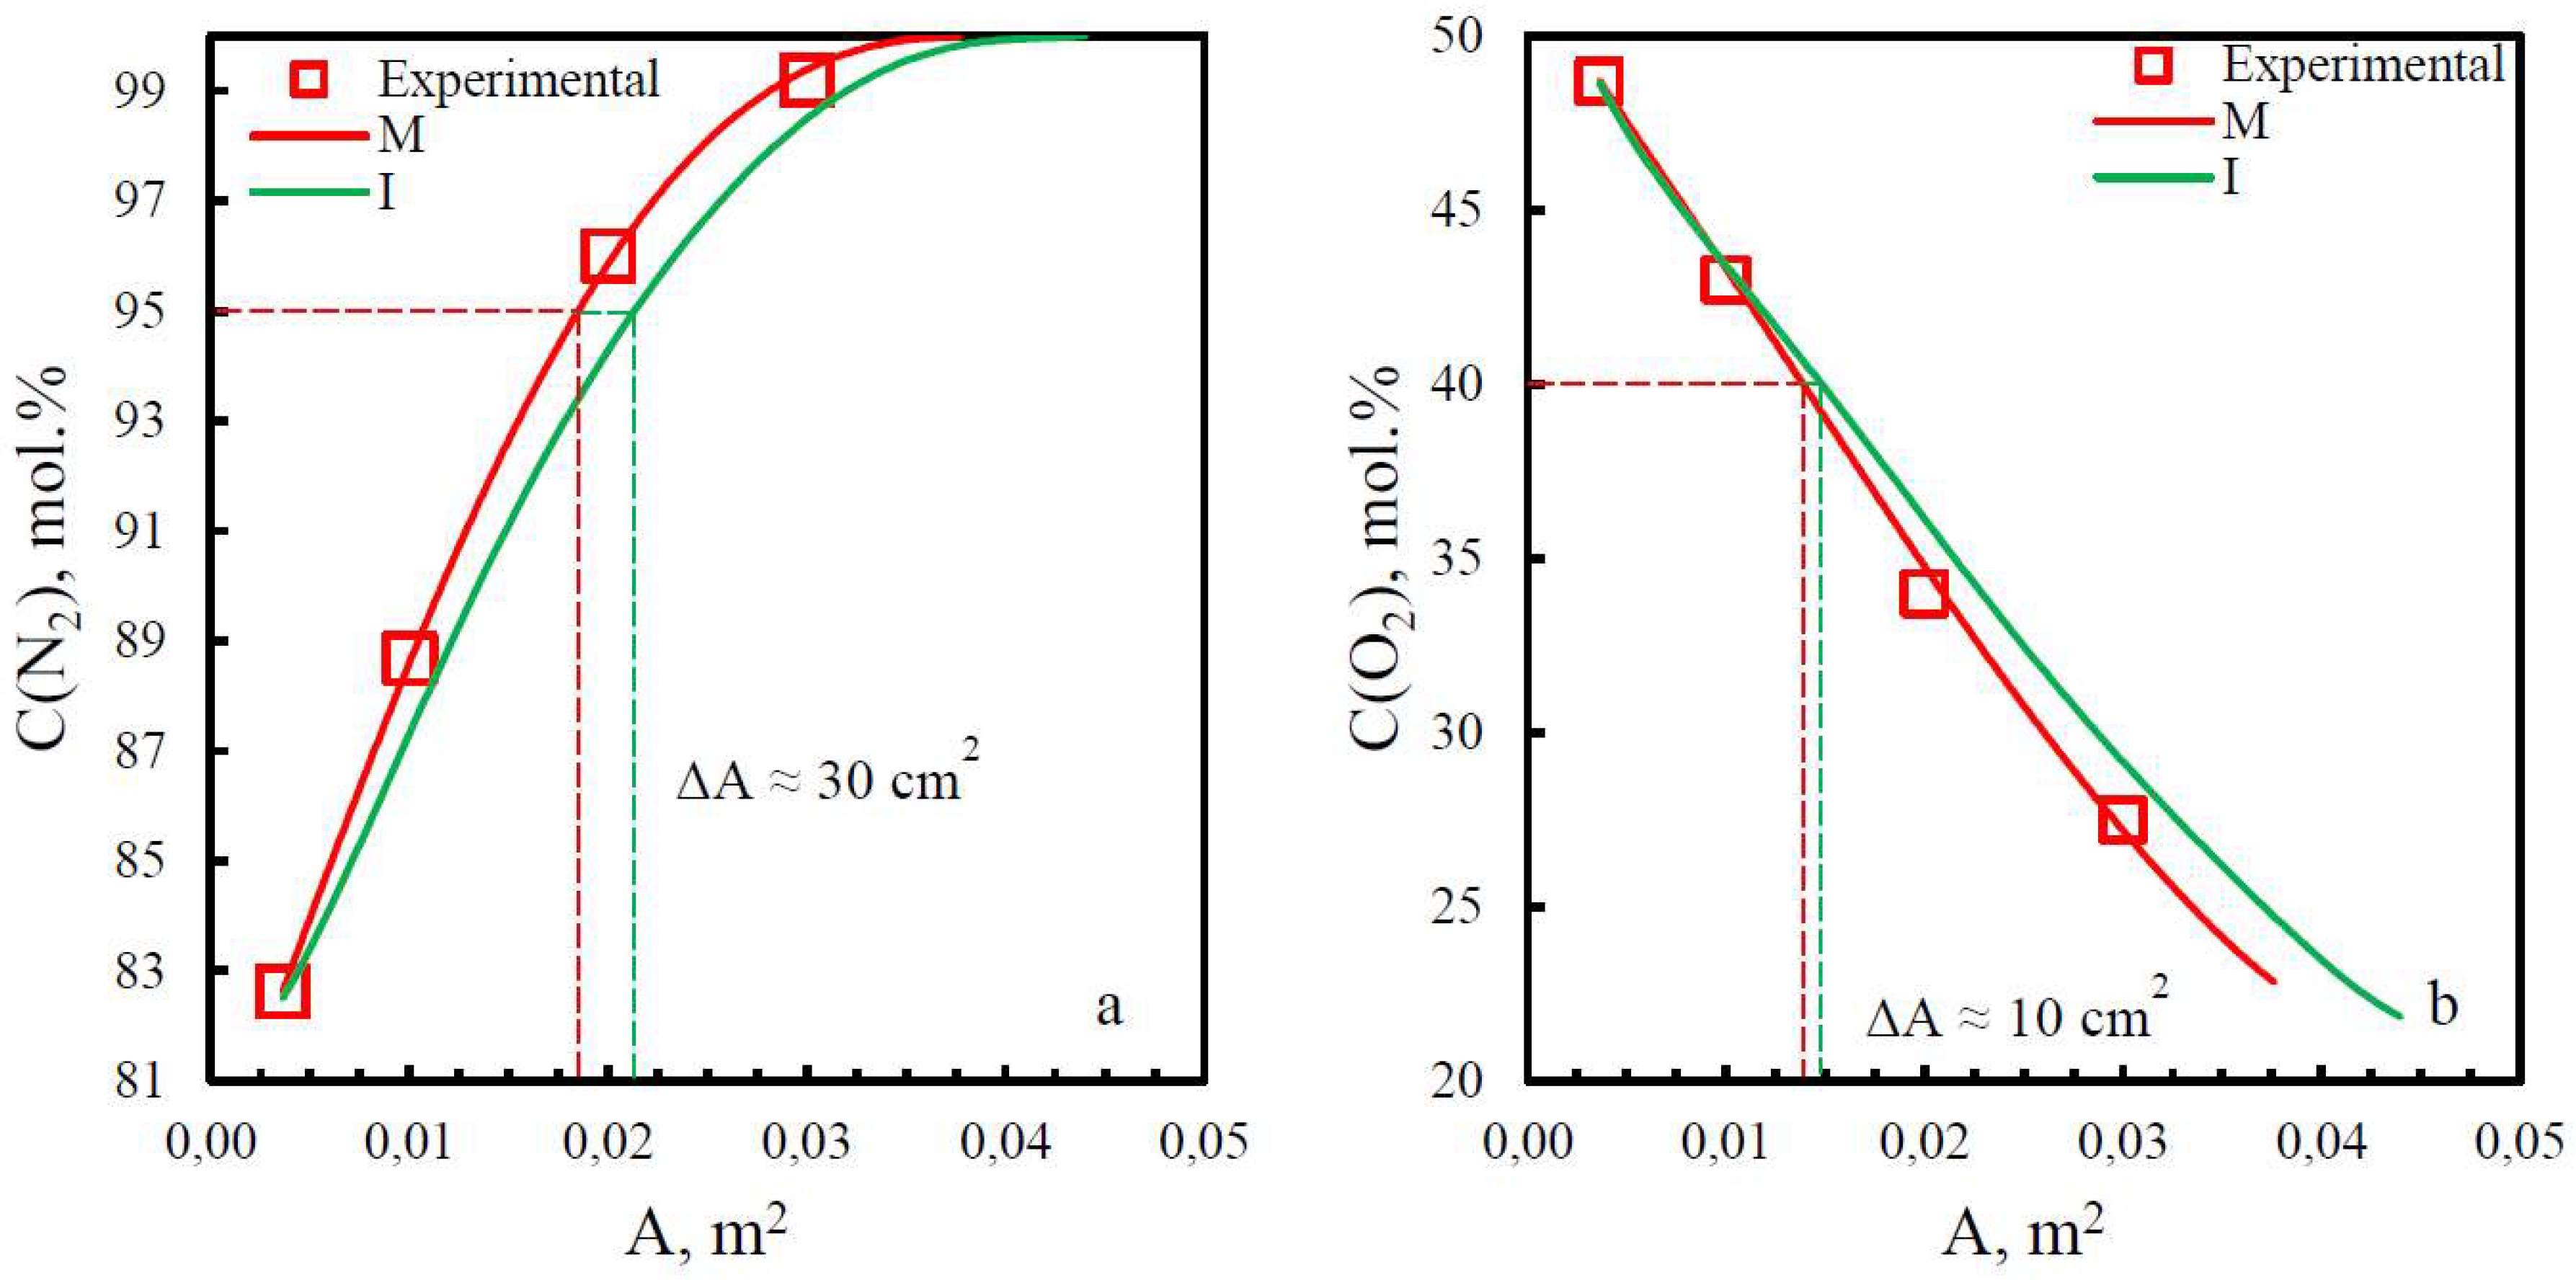
Then modelling of the gas separation process was carried out for each membrane type over the whole stage-cut range. The modelled lines were supplemented with experimental data obtained during separation on membrane modules. The graphs are presented in Figure 9, Figure 10, Figure 11 and Figure 12.
Graphs 9-12 also show pairwise patterns depending on the type of membranes. If to compare the graphs for nitrogen, for the pair polysulfone (Figure 9) and polyphenylene oxide (Figure 10) the line M passes under the line I, and for the pair polyetherimide (Figure 11) and polyetherimide with polyimide (Figure 12) on the contrary - the line M passes above the line I, as it was noticed earlier in Figure 5, Figure 6, Figure 7 and Figure 8.
A different dependence is observed for the plots with dependencies of oxygen concentration in the permeate stream on the effective area of the membrane. For PSF and PPO membranes, an increase in effective area leads to narrowing of the I and M lines and, eventually, their overlap. For PEI membranes, at a stage-cut value of 0.004 (membrane area 140 cm2), the M line is higher than the I line; at a value of 0.01, the lines intersect and then invert so that for one effective area, the oxygen concentration in the permeate stream for the M line is lower than for the I line. And the larger the effective area, the more the calculated lines diverge. For the PEI+PI membrane, the same pattern with a crossover point at stage-cut 0.23 or an area of 84 cm2.
The model lines were compared for nitrogen and oxygen concentrations of 95 mol.% and 40 mol.%, respectively. The divergence of the effective area results for each of the membranes is presented quantitatively in Figure 9, Figure 10, Figure 11 and Figure 12 and as a percentage of area deviation (Adif) when calculating the mixture characterisation data from the individual characterisation data in Table 4.
A d i f = A m A i A i × 100   %
where Am – membrane area calculated taking into account the mixture characteristics, cm2; Ai – membrane area calculated taking into account the characteristics obtained during the permeability study of individual gases, cm2.
According to the data presented in Table 3, when designing a membrane gas separator with a polysulfone hollow fibre membrane based on the permeabilities of the individual components nitrogen and oxygen, a larger number of membranes will be required to achieve the required nitrogen concentration. For example, to achieve a concentration of 95 mol.% nitrogen, it would be necessary to increase the effective membrane area by 15.8 %. For the oxygen extraction task, the situation would be the opposite and the calculated quantity would be 29.2 % more than required, which could lead to unnecessary manufacturing costs. For polyphenylene oxide membranes, a similar relationship holds. Membranes made of polyetherimide and polyetherimide with polyimide, both for oxygen and nitrogen extraction tasks demonstrate that the calculated amount will be in excess. Thus, for the polyimide membrane, 19.8 % less membrane is needed for nitrogen extraction than calculated.

4. CONCLUSION

In the present work, the gas transport characteristics of hollow fibre gas separation membranes made of PSF, PPO, PEI and PEI+PI have been investigated. Two series of measurements were carried out, permeance values were obtained for individual components of the gas mixture, as well as for the separation of a real air gas mixture. On the basis of the obtained results, mathematical modelling of the gas separation process in the membrane cell was carried out and it was shown that the modelling based on the permeance values for individual gases has significant discrepancies with the data on the separation of an air gas mixture. The divergence of values is observed to be 20 per cent or more.
It was found that the nature of gas separation on PSF and PPO membranes is different from that on PEI and PEI+PI membranes. For PSF and PPO membranes, the product concentrations in the outlet streams, when the process is modelled using the mixed gas transport characteristics, are lower than when modelled using the gas transport characteristics of pure gases. For PEI and PEI+PI membranes the situation is the opposite, where oxygen concentration in the permeate stream has a point of intersection at a certain value of stage-cut, after which, as the effective area of the membrane increases, the model lines diverge from each other.
The data of studies of gas transport characteristics of membranes presented in the literature correlate with those measured within the framework of the present work, but have, both among themselves and in comparison with the results of the work, significant errors, especially in the part of permeance measurements. The difference in values, within the same material, can be related both to membrane morphology, and to the age of the membrane, and when we talk about commercially available membranes, to the production technology of different manufacturers, and within the same production - from batch to batch.
Thus, when modelling membrane gas separation plants, cascades and production facilities, there is a need to study specifically the mixture gas transport characteristics - permeance values obtained by analysing the flows through the membrane of each individual component of the gas mixture.

AUTHOR CONTRIBUTIONS

Conceptualization, Anton Petukhov; Data curation, Maria Atlaskina; Formal analysis, Anna Stepakova; Investigation, Kirill Smorodin; Methodology, Artem Atlaskin; Project administration, Ilya Vorotyntsev; Validation, Andrey Vorotyntsev; Writing – original draft, Sergey Kryuchkov; Writing – review & editing, Nikita Tsivkovsky.

ACKNOWLEDGEMENTS

The main part of the work was carried out with financial support from the Ministry of Science and Higher Education of the Russian Federation within the framework of a scientific project under state assignment No. FSSM-2023-0004. The work on studying the permeances of pure gases was carried out with the support of the Government of the Tula Region, agreement No. 14 of September 14, 2023.

References

  1. Kianfar, E.; Cao, V. Polymeric Membranes on Base of PolyMethyl Methacrylate for Air Separation: A Review. Journal of Materials Research and Technology 2021, 10, 1437–1461. [Google Scholar] [CrossRef]
  2. Liew, J.-Y.; Tan, J.-Y.-L.; Chong, Q.-Y.; Ooi, J.-W.; Chemmangattuvalappil, J.; Design, N.G.; Cheun, J.-Y.; Liew, J.-Y.-L.; Tan, Q.-Y.; Chong, J.-W.; et al. Design of Polymeric Membranes for Air Separation by Combining Machine Learning Tools with Computer Aided Molecular Design. Processes 2023, Vol. 11, Page 2004 2023, 11, 2004. [Google Scholar] [CrossRef]
  3. Krzystowczyk, E.; Haribal, V.; Dou, J.; Li, F. Chemical Looping Air Separation Using a Perovskite-Based Oxygen Sorbent: System Design and Process Analysis. ACS Sustain Chem Eng 2021, 9, 12185–12195. [Google Scholar] [CrossRef]
  4. Beckinghausen, A.; Odlare, M.; Thorin, E.; Schwede, S. From Removal to Recovery: An Evaluation of Nitrogen Recovery Techniques from Wastewater. Appl Energy 2020, 263, 114616. [Google Scholar] [CrossRef]
  5. Liu, Y.; Wang, S.; Xu, Q.; Ho, T.C. Eco-Friendly Natural Gas Monetization Complex for Simultaneous Power Generation and Nitrogen-Based Fertilizer Production. Ind Eng Chem Res 2023, 62, 489–499. [Google Scholar] [CrossRef]
  6. Ackley, M.W. Medical Oxygen Concentrators: A Review of Progress in Air Separation Technology. Adsorption 2019, 25, 1437–1474. [Google Scholar] [CrossRef]
  7. Zhou, X.; Rong, Y.; Fang, S.; Wang, K.; Zhi, X.; Qiu, L.; Chi, X. Thermodynamic Analysis of an Organic Rankine–Vapor Compression Cycle (ORVC) Assisted Air Compression System for Cryogenic Air Separation Units. Appl Therm Eng 2021, 189, 116678. [Google Scholar] [CrossRef]
  8. Young, A.F.; Villardi, H.G.D.; Araujo, L.S.; Raptopoulos, L.S.C.; Dutra, M.S. Detailed Design and Economic Evaluation of a Cryogenic Air Separation Unit with Recent Literature Solutions. Ind Eng Chem Res 2021, 60, 14830–14844. [Google Scholar] [CrossRef]
  9. Cheng, M.; Verma, P.; Yang, Z.; Axelbaum, R.L. Single-Column Cryogenic Air Separation: Enabling Efficient Oxygen Production with Rapid Startup and Low Capital Costs—Application to Low-Carbon Fossil-Fuel Plants. Energy Convers Manag 2021, 248, 114773. [Google Scholar] [CrossRef]
  10. Kamin, Z.; Bahrun, M.H.V.; Bono, A. A Short Review on Pressure Swing Adsorption (PSA) Technology for Nitrogen Generation from Air. AIP Conf Proc 2022, 2610. [Google Scholar] [CrossRef]
  11. Tian, T.; Wang, Y.; Liu, B.; Ding, Z.; Xu, X.; Shi, M.; Ma, J.; Zhang, Y.; Zhang, D. Simulation and Experiment of Six-Bed PSA Process for Air Separation with Rotating Distribution Valve. Chin J Chem Eng 2022, 42, 329–337. [Google Scholar] [CrossRef]
  12. Tu, Y.; Zeng, Y. Experimental Study on the Performance of an Onboard Hollow-Fiber-Membrane Air Separation Module. Fluid Dynamics & Materials Processing 2021, 18, 355–370. [Google Scholar] [CrossRef]
  13. Liu, K.G.; Bigdeli, F.; Panjehpour, A.; Hwa Jhung, S.; Al Lawati, H.A.J.; Morsali, A. Potential Applications of MOF Composites as Selective Membranes for Separation of Gases. Coord Chem Rev 2023, 496, 215413. [Google Scholar] [CrossRef]
  14. Fujikawa, S.; Selyanchyn, R.; Kunitake, T. A New Strategy for Membrane-Based Direct Air Capture. Polymer Journal 2020 53:1 2020, 53, 111–119. [Google Scholar] [CrossRef]
  15. Chuah, C.Y.; Goh, K.; Bae, T.H. Enhanced Performance of Carbon Molecular Sieve Membranes Incorporating Zeolite Nanocrystals for Air Separation. Membranes (Basel) 2021, 11, 489. [Google Scholar] [CrossRef] [PubMed]
  16. Petukhov, A.N.; Shablykin, D.N.; Trubyanov, M.M.; Atlaskin, A.A.; Zarubin, D.M.; Vorotyntsev, A. V.; Stepanova, E.A.; Smorodin, K.A.; Kazarina, O. V.; Petukhova, A.N.; et al. A Hybrid Batch Distillation/Membrane Process for High Purification Part 2: Removing of Heavy Impurities from Xenon Extracted from Natural Gas. Sep Purif Technol 2022, 294, 121230. [Google Scholar] [CrossRef]
  17. Bera, S.P.; Godhaniya, M.; Kothari, C. Emerging and Advanced Membrane Technology for Wastewater Treatment: A Review. J Basic Microbiol 2022, 62, 245–259. [Google Scholar] [CrossRef] [PubMed]
  18. Petukhov, A.N.; Atlaskin, A.A.; Kryuchkov, S.S.; Smorodin, K.A.; Zarubin, D.M.; Petukhova, A.N.; Atlaskina, M.E.; Nyuchev, A. V.; Vorotyntsev, A. V.; Trubyanov, M.M.; et al. A Highly-Efficient Hybrid Technique – Membrane-Assisted Gas Absorption for Ammonia Recovery after the Haber-Bosch Process. Chemical Engineering Journal 2021, 421, 127726. [Google Scholar] [CrossRef]
  19. Sidhikku Kandath Valappil, R.; Ghasem, N.; Al-Marzouqi, M. Current and Future Trends in Polymer Membrane-Based Gas Separation Technology: A Comprehensive Review. Journal of Industrial and Engineering Chemistry 2021, 98, 103–129. [Google Scholar] [CrossRef]
  20. Vorotyntsev, V.M.; Drozdov, P.N.; Vorotyntsev, I. V.; Murav’Ev, D. V. Fine Gas Purification to Remove Slightly Penetrating Impurities Using a Membrane Module with a Feed Reservoir. Doklady Chemistry 2006, 411, 243–245. [Google Scholar] [CrossRef]
  21. Atlaskin, A.A.; Trubyanov, M.M.; Yanbikov, N.R.; Kryuchkov, S.S.; Chadov, A.A.; Smorodin, K.A.; Drozdov, P.N.; Vorotyntsev, V.M.; Vorotyntsev, I. V. Experimental Evaluation of the Efficiency of Membrane Cascades Type of “Continuous Membrane Column” in the Carbon Dioxide Capture Applications. Membranes and Membrane Technologies 2020, 2, 35–44. [Google Scholar] [CrossRef]
  22. Atlaskin, A.A.; Trubyanov, M.M.; Yanbikov, N.R.; Vorotyntsev, A. V.; Drozdov, P.N.; Vorotyntsev, V.M.; Vorotyntsev, I. V. Comprehensive Experimental Study of Membrane Cascades Type of “Continuous Membrane Column” for Gases High-Purification. J Memb Sci 2019, 572, 92–101. [Google Scholar] [CrossRef]
  23. Ilyushin, Y.V.; Kapostey, E.I. Developing a Comprehensive Mathematical Model for Aluminium Production in a Soderberg Electrolyser. Energies 2023, Vol. 16, Page 6313 2023, 16, 6313. [Google Scholar] [CrossRef]
  24. Bittner, K.; Margaritis, N.; Schulze-Küppers, F.; Wolters, J.; Natour, G. A Mathematical Model for Initial Design Iterations and Feasibility Studies of Oxygen Membrane Reactors by Minimizing Gibbs Free Energy. J Memb Sci 2023, 685, 121955. [Google Scholar] [CrossRef]
  25. Trubyanov, M.M.; Kirillov, S.Y.; Vorotyntsev, A. V.; Sazanova, T.S.; Atlaskin, A.A.; Petukhov, A.N.; Kirillov, Y.P.; Vorotyntsev, I. V. Dynamic Behavior of Unsteady-State Membrane Gas Separation: Modelling of a Closed-Mode Operation for a Membrane Module. J Memb Sci 2019, 587, 117173. [Google Scholar] [CrossRef]
  26. Mayer, M.J.; Gróf, G. Techno-Economic Optimization of Grid-Connected, Ground-Mounted Photovoltaic Power Plants by Genetic Algorithm Based on a Comprehensive Mathematical Model. Solar Energy 2020, 202, 210–226. [Google Scholar] [CrossRef]
  27. GitHub—CCSI-Toolset/Membrane_Model: Membrane Separation Model: Updated Hollow Fiber Membrane Model And System Example For Carbon Capture. Available online: Https://Github.Com/CCSI-Toolset/Membrane_model (accessed on 15 December 2023).
  28. Pfromm, P.H.; Pinnau, I.; Koros, W.J. Gas Transport through Integral-Asymmetric Membranes: A Comparison to Isotropic Film Transport Properties. J Appl Polym Sci 1993, 48, 2161–2171. [Google Scholar] [CrossRef]
  29. Reid, B.D.; Ruiz-Trevino, A.; Musselman, I.H.; Balkus, K.J.; Ferraris, J.P. Gas Permeability Properties of Polysulfone Membranes Containing the Mesoporous Molecular Sieve MCM-41. 2001. [Google Scholar] [CrossRef]
  30. Ng, B.C.; Ismail, A.F.; W Abdul Rahman, W.A.; Hasbullah, H.; Abdullah, M.S.; Hassan, A.R. FORMATION OF ASYMMETRIC POLYSULFONE FLAT SHEET MEMBRANE 73 FORMATION OF ASYMMETRIC POLYSULFONE FLAT SHEET MEMBRANE FOR GAS SEPARATION: RHEOLOGICAL ASSESSMENT. J Teknol 2004, 73–88. [Google Scholar] [CrossRef]
  31. Pinnau, I.; Koros, W.J. Structures and Gas Separation Properties of Asymmetric Polysulfone Membranes Made by Dry, Wet, and Dry/Wet Phase Inversion. J Appl Polym Sci 1991, 43, 1491–1502. [Google Scholar] [CrossRef]
  32. Barbari, T.A.; Koros, W.J.; Paul, D.R. Polymeric Membranes Based on Bisphenol-A for Gas Separations. J Memb Sci 1989, 42, 69–86. [Google Scholar] [CrossRef]
  33. Wright, C.T.; Paul, D.R. Gas Sorption and Transport in UV-Irradiated Poly(2,6-Dimethyl-1,4-Phenylene Oxide) Films. J Appl Polym Sci 1998, 67, 875–883. [Google Scholar] [CrossRef]
  34. Polotskaya, C.A.; Agranova, S.A.; Gazdina, N. V; Kuznetsov, Y.P.; Nesterov, V. V Effect of Molecular Weight Parameters on Gas Transport Properties of Poly(2,6-Dimethyl-1,4-Phenylene Oxide). [CrossRef]
  35. Polotskaya, G.A.; Penkova, A. V.; Toikka, A.M.; Pientka, Z.; Brozova, L.; Bleha, M. Transport of Small Molecules through Polyphenylene Oxide Membranes Modified by Fullerene. Sep Sci Technol 2007, 42, 333–347. [Google Scholar] [CrossRef]
  36. Checchetto, R.; Scarpa, M.; De Angelis, M.G.; Minelli, M. Mixed Gas Diffusion and Permeation of Ternary and Quaternary CO2/CO/N2/O2 Gas Mixtures in Matrimid®, Polyetherimide and Poly(Lactic Acid) Membranes for CO2/CO Separation. J Memb Sci 2022, 659, 120768. [Google Scholar] [CrossRef]
  37. Hao, L.; Li, P.; Chung, T.S. PIM-1 as an Organic Filler to Enhance the Gas Separation Performance of Ultem Polyetherimide. J Memb Sci 2014, 453, 614–623. [Google Scholar] [CrossRef]
  38. Chen, X.Y.; Kaliaguine, S.; Rodrigue, D. Polymer Hollow Fiber Membranes for Gas Separation: A Comparison between Three Commercial Resins. AIP Conf Proc 2019, 2139. [Google Scholar] [CrossRef]
  39. Chenar, M.P.; Soltanieh, M.; Matsuura, T.; Tabe-Mohammadi, A.; Feng, C. Gas Permeation Properties of Commercial Polyphenylene Oxide and Cardo-Type Polyimide Hollow Fiber Membranes. Sep Purif Technol 2006, 51, 359–366. [Google Scholar] [CrossRef]
  40. Visser, T.; Masetto, N.; Wessling, M. Materials Dependence of Mixed Gas Plasticization Behavior in Asymmetric Membranes. J Memb Sci 2007, 306, 16–28. [Google Scholar] [CrossRef]
  41. Ekiner, O.M.; Kulkami, S.S. Process for Making Hollow Fiber Mixed Matrix Membranes 2003.
  42. Saimani, S.; Kumar, A.; Dal-Cin, M.M.; Robertson, G. Synthesis and Characterization of Bis (4-Maleimidophenyl) Fluorene and Its Semi Interpenetrating Network Membranes with Polyether Imide (Ultem® 1000). J Memb Sci 2011, 374, 102–109. [Google Scholar] [CrossRef]
  43. Du, N.; Robertson, G.P.; Dal-Cin, M.M.; Scoles, L.; Guiver, M.D. Polymers of Intrinsic Microporosity (PIMs) Substituted with Methyl Tetrazole. Polymer (Guildf) 2012, 53, 4367–4372. [Google Scholar] [CrossRef]
  44. Thomas, S.; Pinnau, I.; Du, N.; Guiver, M.D. Hydrocarbon/Hydrogen Mixed-Gas Permeation Properties of PIM-1, an Amorphous Microporous Spirobisindane Polymer. J Memb Sci 2009, 338, 1–4. [Google Scholar] [CrossRef]
Figure 3. A membrane module for the study of gas transport characteristics of hollow-fibre gas separation membranes.
Preprints 95939 g003
Figure 4. Schematic diagram of the setup for determination of gas transport characteristics of a membrane with a mass spectrometer.
Preprints 95939 g004
Figure 5. Dependence of concentration (a - N2 in retentate stream; b - O2 in permeate stream) on effective area of PSF membrane. Experimental - experimentally obtained concentrations of components; M - line obtained by modelling of the gas separation process taking into account the mixture gas transport characteristics; I - line obtained by modelling of the gas separation process taking into account the gas transport characteristics of individual components.
Preprints 95939 g005
Figure 6. Dependence of concentration (a - N2 in the retentate stream; b - O2 in the permeate stream) on the effective area of the PPO membrane. Experimental - experimentally obtained concentrations of components; M - line obtained by modelling of the gas separation process taking into account the mixture gas transport characteristics; I - line obtained by modelling of the gas separation process taking into account the gas transport characteristics of individual components.
Preprints 95939 g006
Figure 7. Dependence of concentration (a - N2 in retentate stream; b - O2 in permeate stream) on effective area of PEI membrane. Experimental - experimentally obtained concentrations of components; M - line obtained by modelling of the gas separation process taking into account the mixture gas transport characteristics; I - line obtained by modelling of the gas separation process taking into account the gas transport characteristics of individual components.
Preprints 95939 g007
Figure 8. Dependence of concentration (a - N2 in retentate stream; b - O2 in permeate stream) on effective area of PEI+PEI membrane. Experimental - experimentally obtained concentrations of components; M - line obtained by modelling of the gas separation process taking into account the mixture gas transport characteristics; I - line obtained by modelling of the gas separation process taking into account the gas transport characteristics of individual components.
Preprints 95939 g008
Figure 9. Dependence of concentration (a - N2 in retentate stream; b - O2 in permeate stream) on effective area of PSF membrane in the whole range of stage-cut. Experimental - experimentally obtained concentrations of components; M - line obtained by modelling of the gas separation process taking into account the mixture gas transport characteristics; I - line obtained by modelling of the gas separation process taking into account the gas transport characteristics of individual components.
Preprints 95939 g009
Figure 10. Dependence of concentration (a - N2 in retentate stream; b - O2 in permeate stream) on effective area of PPO membrane in the whole range of stage-cut. Experimental - experimentally obtained concentrations of components; M - line obtained by modelling of the gas separation process taking into account the mixture gas transport characteristics; I - line obtained by modelling of the gas separation process taking into account the gas transport characteristics of individual components.
Preprints 95939 g010
Figure 11. Dependence of concentration (a - N2 in retentate stream; b - O2 in permeate stream) on effective area of PEI membrane in the whole range of stage-cut. Experimental - experimentally obtained concentrations of components; M - line obtained by modelling of the gas separation process taking into account the mixture gas transport characteristics; I - line obtained by modelling of the gas separation process taking into account the gas transport characteristics of individual components.
Preprints 95939 g011
Figure 12. Dependence of concentration (a - N2 in retentate stream; b - O2 in permeate stream) on effective area of PEI+PI membrane in the whole range of stage-cut. Experimental - experimentally obtained concentrations of components; M - line obtained by modelling of the gas separation process taking into account the mixture gas transport characteristics; I - line obtained by modelling of the gas separation process taking into account the gas transport characteristics of individual components.
Preprints 95939 g012
Table 1. Gas transport characteristics of polymeric gas separation membranes.
Membrane PO2, barrera PN2, barrera Selectivity, α(O2/N2) T, ˚C Pressure Difference, bar Ref.
PSF 1.05 0.165 6.4 24 3.5 [28]
1.29 0.22 5.9 35 10
1.5 0.26 5.8 35 2 [29]
1.1 0.23 4.8 30 1 [30]
1.06 0.171 6.2 25 3.5 [31]
1.2 0.2 6 35 5 [32]
PPO 17 3.62 4.7 35 2 [33]
17 4.47 3.8 30 1 [34]
19.08 4.65 4.1 30 1 [35]
PEI 0.32 0.05 6.4 22 0.2-0.9 [36]
0.4 0.05 7.6 35 5 [32]
0.38 0.054 7.1 35 3.5 [37]
0.4 0.05 8 35 10 [38]
Membrane QO2, GPUb QN2, GPUb Selectivity, α(O2/N2) T, ˚C Pressure Difference, bar Ref.
PSF 27.5 4 6.9 24 3.5 [28]
13.6 2.88 4.8 30 1 [30]
39.3 6.3 6.2 25 3.5 [31]
PPO 40 10 4 22.5 5 [39]
20 4.8 4.1 35 4 [40]
PEI 2.89 0.33 8.8 30 2 [38]
11.5 1.77 6.5 27 6 [41]
2.6 0.63 4.1 22 6.9 [42]
a1 Barrer = 1 × 10⁻¹⁰ cm3(STP) · cm · cm-2 · s-1 · cmHg-1
b1 GPU = 1 × 10⁻⁶ cm3(STP) · cm-2 · s-1 · cmHg-1
Table 2. Permeability of individual gases for the investigated hollow fibre gas separation membranes.
Membrane Q, GPU* α O 2 / N 2
O2 N2
PSF 51.4 12.8 4.02
PPO 47.9 9.40 5.1
PEI 3.45 0.58 6.0
PEI+PI 6.65 1.68 3.96
*1 GPU = 1 × 10⁻⁶ cm3(STP) · cm-2 · s-1 · smHg-1.
Table 3. Permeability of gas mixture components for the investigated hollow fibre gas separation membranes.
Membrane Q, GPU* α O 2 / N 2
O2 N2
PSF 44.12 13.25 3.33
PPO 41.53 9.40 4.42
PEI 4.33 0.66 6.59
PEI+PI 7.69 1.86 4.15
*1 GPU = 1 × 10⁻⁶ cm3(STP) · cm-2 · s-1 · smHg-1.
Table 4. Deviations of effective membrane areas required to achieve a nitrogen concentration in the retentate stream of 95 mol.% and an oxygen concentration in the permeate stream of 40 mol.%.
Membrane Adif, % (N2) Adif, % (O2)
PSF 15.8 29.2
PPO 13.9 6.25
PEI 19.8 9.7
PEI+PI 15.9 6.7
Disclaimer/Publisher’s Note: The statements, opinions and data contained in all publications are solely those of the individual author(s) and contributor(s) and not of MDPI and/or the editor(s). MDPI and/or the editor(s) disclaim responsibility for any injury to people or property resulting from any ideas, methods, instructions or products referred to in the content.
Copyright: This open access article is published under a Creative Commons CC BY 4.0 license, which permit the free download, distribution, and reuse, provided that the author and preprint are cited in any reuse.
Prerpints.org logo

Preprints.org is a free preprint server supported by MDPI in Basel, Switzerland.

Subscribe

© 2024 MDPI (Basel, Switzerland) unless otherwise stated