1. Introduction
The middle atmosphere (20–100 km) is full of complex physical and chemical dynamic processes, and they are the major mechanism for the energy and momentum coupling between the lower atmosphere and the upper atmosphere [
1]. As one of the most common dynamic processes, atmospheric gravity waves (AGWs) contribute substantially to large-scale circulation and play essential roles in establishing composition and thermal structures in the atmosphere. In the past several decades, since the pioneering works of Hines [
2], numerous experimental observations and numerical simulations have been carried out at different locations worldwide to characterize gravity wave features, trace wave sources and propagations, and evaluate their impacts [
3,
4,
5,
6,
7,
8,
9]. However, because AGW activities generally vary with location, large uncertainties and discrepancies still exist in characterizing AGW features and their effects, and more detailed observational evidences at different latitudes are needed for accurate AGW parameterization within global models.
Lidar is an effective optical instrument for the observation of AGW activities in the middle and upper atmosphere, and wave information (e.g., the wavelength, period, phase speed, and vertical propagation direction) can be precisely extracted through lidar observations [
3,
7,
10,
11]. In recent decades, many lidar studies regarding AGW characteristics in wave propagations or seasonal variations have been reported at different latitudes [
12,
13,
14,
15]. However, most of those studies focused on AGW activities in the mesopause region (80–105 km) at middle and higher latitudes, and only a few lidar observation results concerning AGW activities in the low-latitude middle atmosphere (30–70 km) have been reported. Rayleigh lidar observations can be conducted to obtain measurements of atmospheric structures in the middle atmosphere, and AGW activities can be effectively studied by analyzing wavelike structures in lidar-measured atmospheric density and temperature profiles. In 1981, gravity wave activities in the middle atmosphere were first studied by Chanin and Hauchecorne with Rayleigh lidar at Haute-Provence (44°N, 6°E) [
16]. Subsequently, AGW activities in the middle atmosphere were studied by Takkashi et al. with a Rayleigh lidar at Fukuoka (33.6°N, 130.4°E) [
17]. By calculating the power spectra of wave-induced atmospheric perturbations, characteristics of AGW activities in the middle atmosphere were studied by McDonald et al. with a Rayleigh lidar at Aberystwyth (52.4°N, 4.1°W) [
18]. The features of AGW activities in the low-latitude middle atmosphere were first investigated by Beatty et al. based on CEDAR Rayleigh/Na lidar observations at Arecibo (18°N, 67°W), and they reported that the vertical wavelengths of lidar-observed quasi-monochromatic AGWs ranged from 1.1 km to 17 km in the middle atmosphere (25–55 km) and the mesopause region (80-105 km) [
19]. The observed wave periods ranged from 5 min to 65 hours. At Reunion Island (21°S, 55°E), a continuous wavelet transform with the Morlet wavelet was applied by Chane-Ming et al. to measure the characteristics of AGW activities, and the vertical wavelengths of Rayleigh lidar-observed AGWs were determined to range from 2 km to 10 km in the middle atmosphere (30–60 km) [
20]. The wave periods were 2-14 hours. At Gadanki (13.5°N, 79.2°E), by calculating the vertical wavenumber and frequency spectra of lidar-measured relative temperature fluctuations, Sivakumar et al. found that the vertical wavelengths of AGWs in the middle atmosphere (30–70 km) were on the order of 5–38 km, and the wave periods ranged from 20 min to 4.5 hours [
21]. At Hawaii (19.5°N, 155.6°E), the seasonal and interannual variabilities of AGW variances in the middle atmosphere (35–63 km) were studied by Li et al. [
22]. Rayleigh lidar observations revealed that the seasonal variabilities were dominated by annual and semiannual oscillations in the upper stratosphere (35–50 km) and the lower mesosphere (48–63 km), respectively, while quasi-biennial oscillation modulation in the interannual variability was not evident in this region.
Hainan Island is located in the South China Sea near the equator, and AGWs are active in this region. By analyzing Na lidar observations during 2010–2013, Gong et al. reported that lidar-observed AGWs typically had vertical wavelengths of 2–4 km and wave periods of 1–4 hours in the mesopause region over Haikou (19.9°N, 110.3°E) [
14]. Moreover, according to the measurement results from the lidar and meteor radar, it was qualitatively speculated that the deep convection over the South China Sea is the major source of those lidar-observed typical AGWs, except for the topography and convection above the Qinghai-Tibet Plateau. However, only the AGW activities in the mesopause region (80–105 km) were the focus of that work, and the characteristics of the AGW activities in the middle atmosphere are probably different. In this paper, the statistical features of the AGW activities in the middle atmosphere (30–65 km) over Haikou (19.9°N, 110.3°E) are investigated by analyzing long-term Rayleigh lidar observations during 2010–2022. The vertical wavelength, observed wave period, and vertical propagation direction of dominant waves are extracted for every lidar-observed quasi-monochromatic AGW event by analyzing the power spectra of wave-induced temperature perturbations. In particular, lidar-observed AGW events associated with simultaneous upward and downward propagating waves are first reported, and the possible formation mechanism is discussed. These works may enhance the understanding of the climatology of AGW activities in the low-latitude middle atmosphere and benefit the accurate parameterization of AGW effects in global models.
2. Lidar Instrument, Dataset, and Analysis Methodology
The Hainan lidar station was built at Haikou (19.9°N, 110.3°E) in 2010 with support from the Chinese Meridian Project [
14,
23]. Lidar observation experiments were carried out in clear nighttime with two beams working at wavelengths of 532 nm and 589 nm, and the pulse energies were ~460 mJ and ~60 mJ, respectively. Backscattered photons from the middle and upper atmosphere were collected with a receiving telescope with a diameter of ~1000 mm. For an individual lidar profile, photons were accumulated for every 5000 laser pulses in ~3 min, and the atmospheric density and temperature in the middle atmosphere (30–65 km) can be measured with high temporal and spatial resolutions (3 min and 96 m).
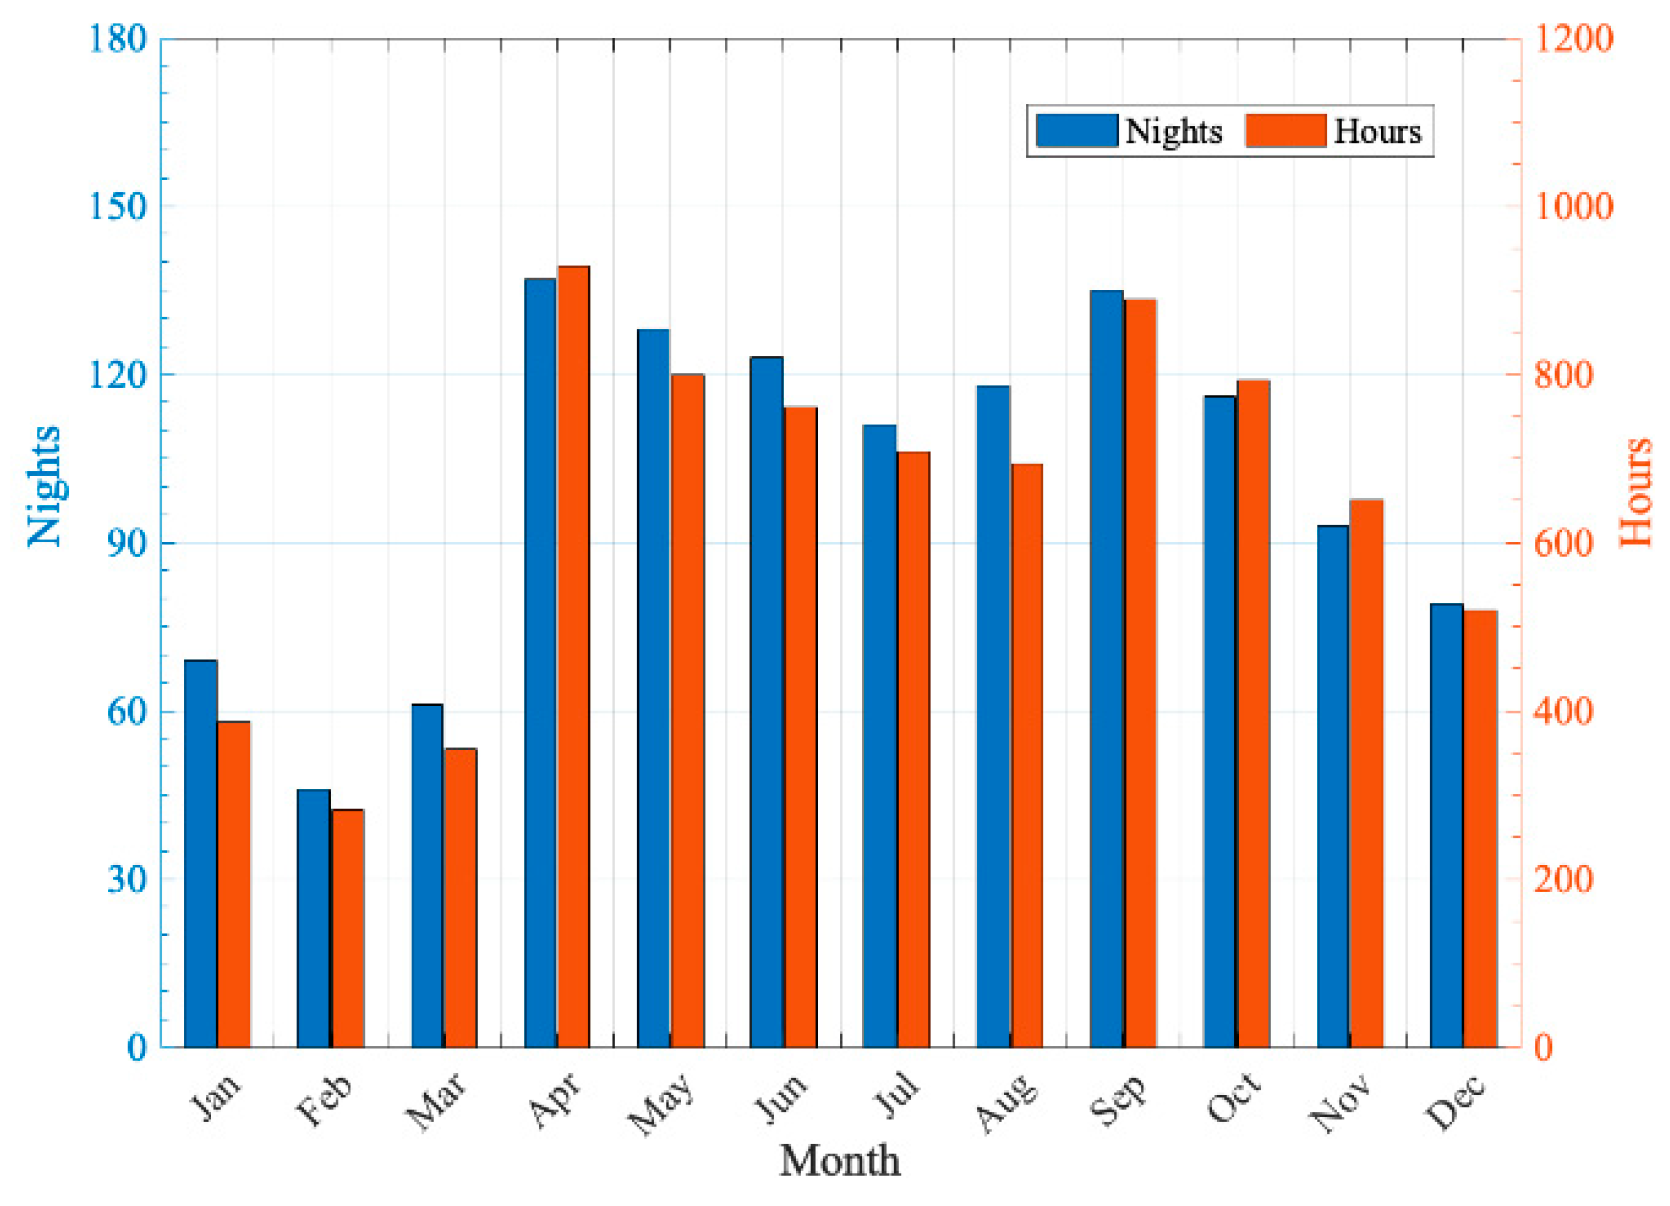
From May 2010 to August 2022, effective lidar observations were made over 1216 nights, corresponding to a database of 7765 hours. Monthly distributions of the observing nights and the observing hours are shown in
Figure 1. By using the method described by Hauchecorne and Chanin, atmospheric density and temperature profiles in the middle atmosphere (30-65 km) were retrieved according to these lidar observation data [
24].
where
,
, and
are the atmospheric density, temperature, and lidar-received photon counts, respectively, at altitude
.
,
M, and
R are the background noise, atmospheric molar mass and thermodynamic constant, respectively.
and
are the atmospheric density and temperature at the reference altitude
, respectively, and they are generally obtained from the results of model and satellite measurements.
AGW activities can be studied by analyzing the wave-induced temperature perturbations in the middle atmosphere, and the vertical wavelength, observed wave period, phase speed, and vertical propagation direction can be obtained according to lidar observations [
7,
10]. For a lidar-observed AGW event, the power spectrum may comprise the contributions from wave packets with different scales and frequencies, and the vertical wavenumber spectrum,
, and temporal frequency spectrum,
, can be calculated with Equations (3) and (4), respectively [
12,
25]:
where
and
are the autocorrelation functions of the temperature perturbations in the spatial and temporal sequences, respectively;
and
are respectively the vertical wavenumber and wave frequency, respectively; and
and
are the predetermined altitude and time difference for sampling, respectively.
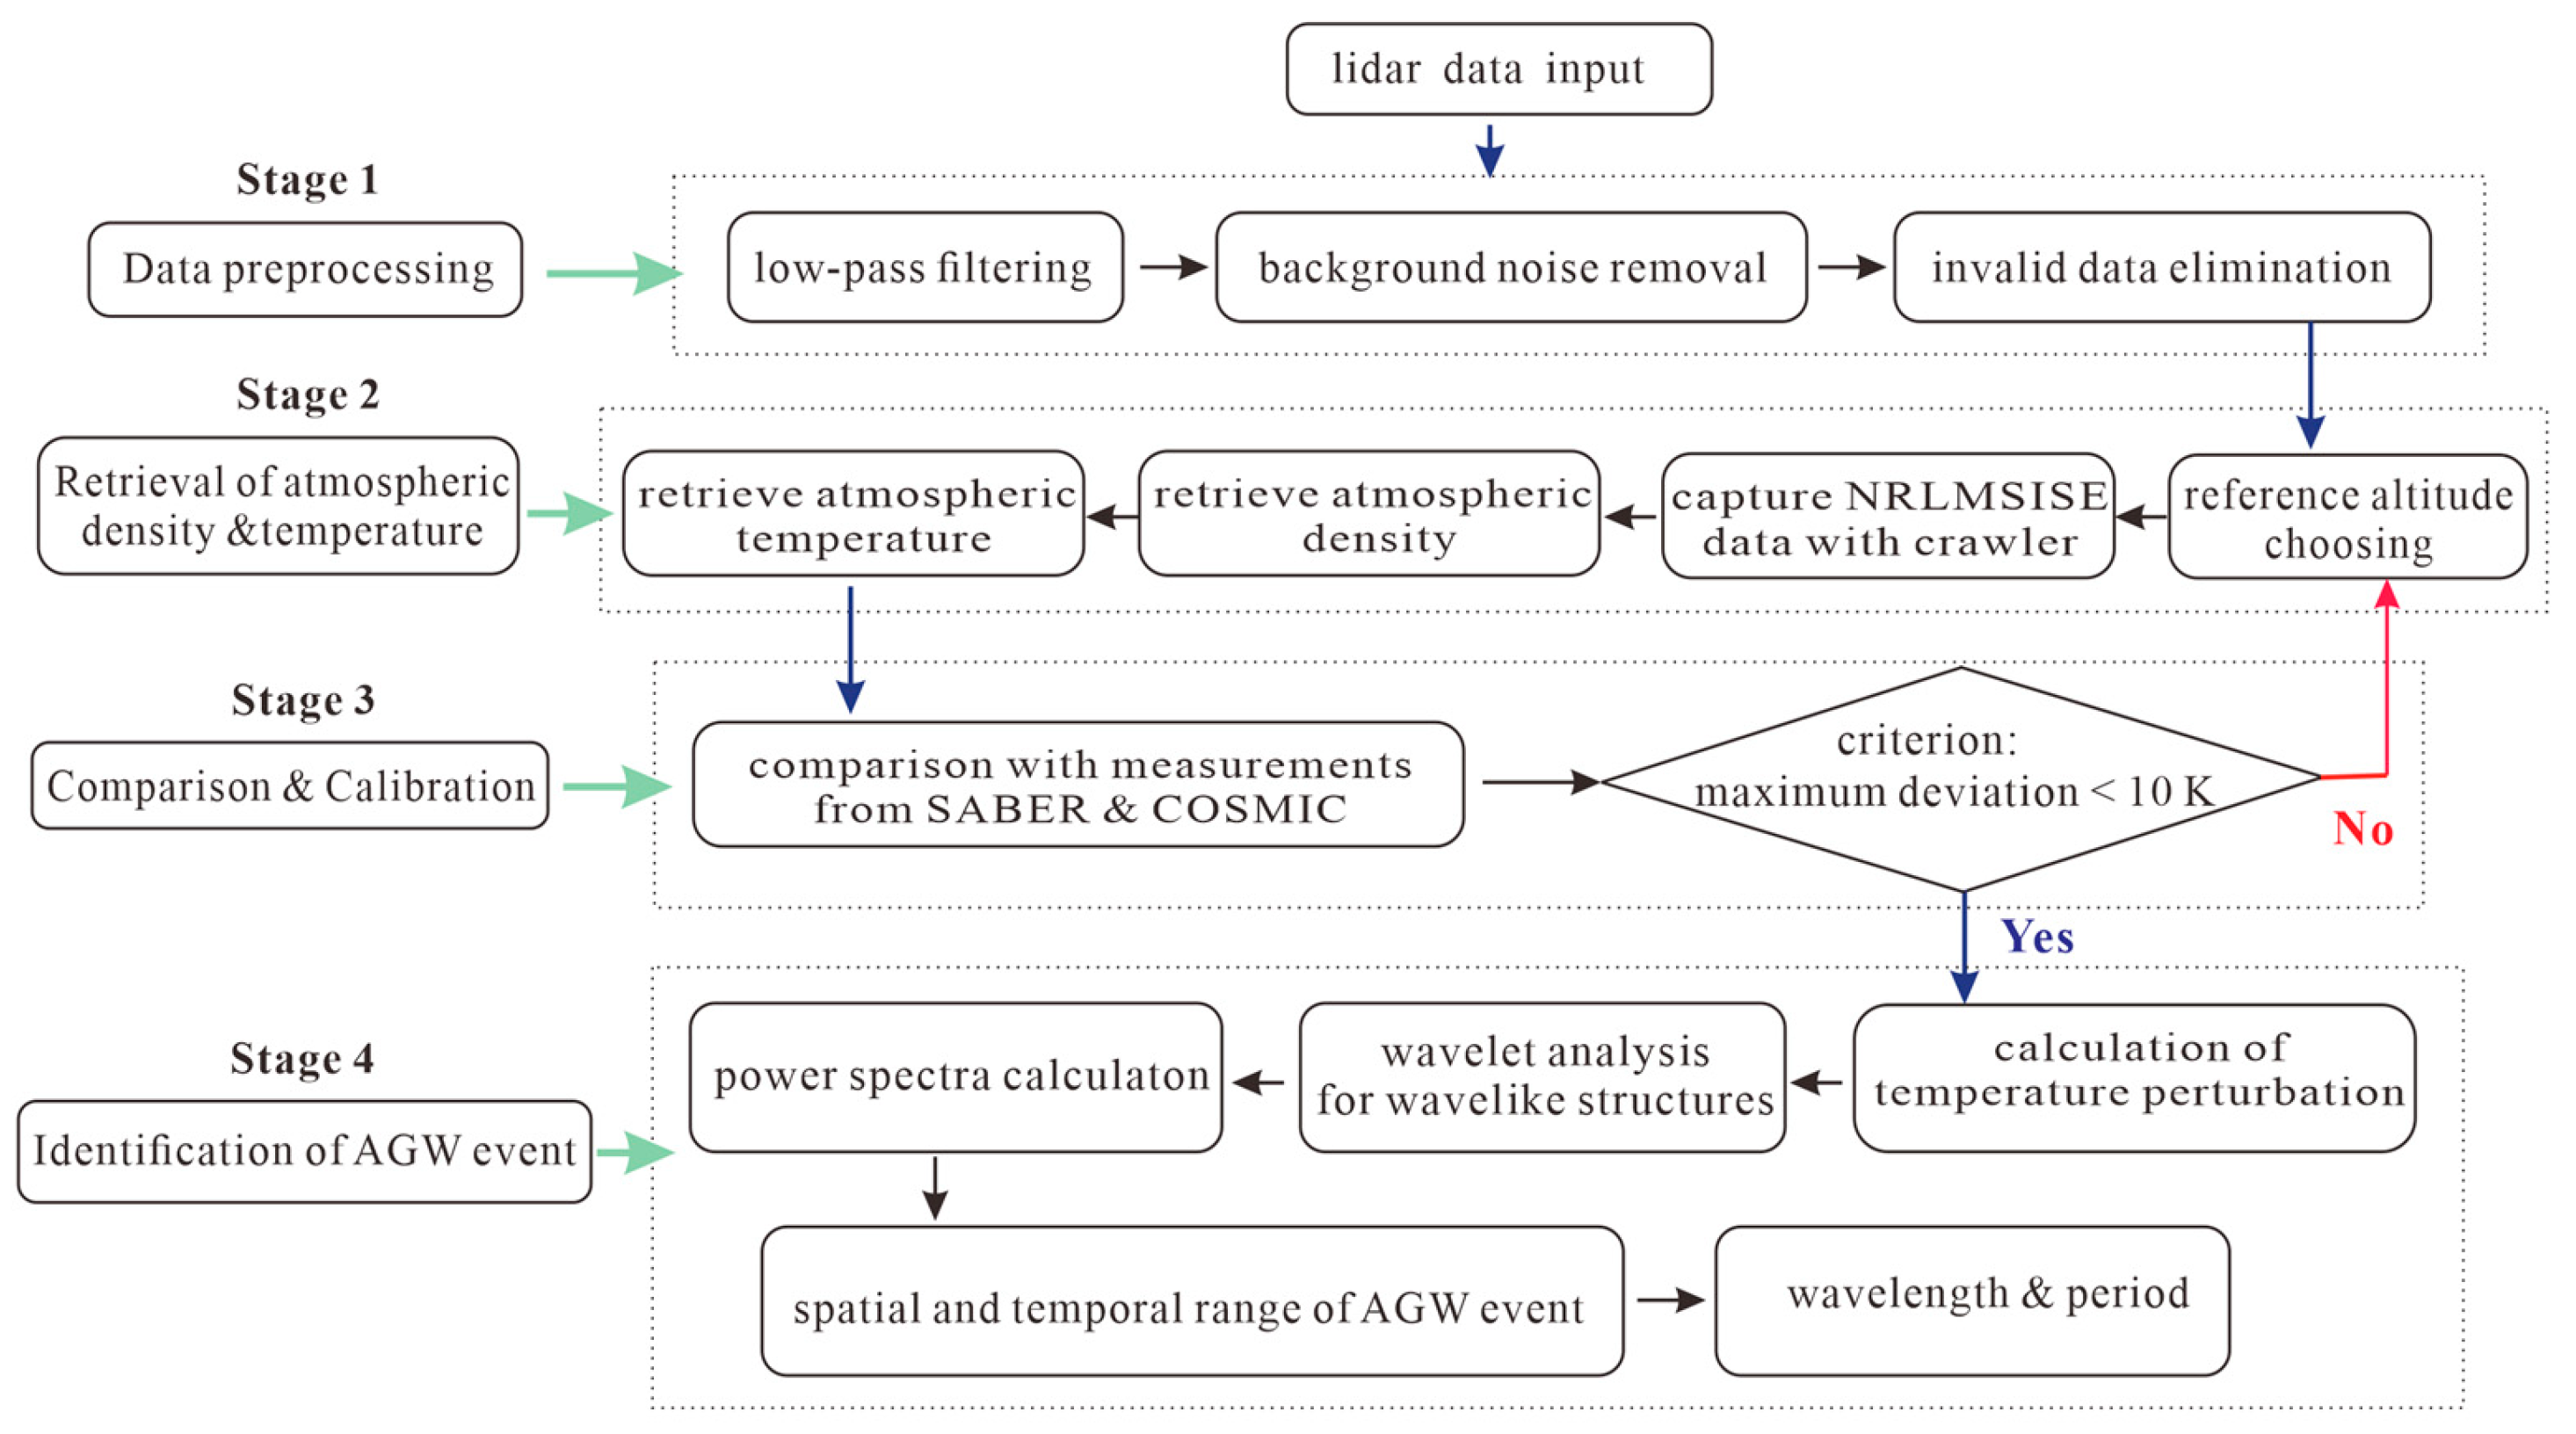
The designed data analysis process for the identification of AGW events is shown in
Figure 2, and the flowchart is divided into four stages. First, background noise and invalid data are removed from the lidar observation data during the data preprocessing. Then, atmospheric density and temperature are calculated with Equations (1-2) when a reference altitude
is correctly selected. Subsequently, these calculation results are compared with the simultaneous measurement results from satellites (e.g., SABER/TIMED, COSMIC), and the adopted calibration criterion is that the maximum deviation between their temperature measurements is less than 10 K. After the temperature structure in the middle atmosphere is correctly retrieved, temperature deviations from the nightly mean
are calculated, and AGW events are identified according to the temperature perturbations induced by AGW activities. Finally, AGW parameters (i.e., wavelength, period, and vertical propagation direction) are extracted by analyzing the power spectra of wave perturbations.
3. Observation Results
3.1. AGW Event Dominated by Upward-Propagating Waves
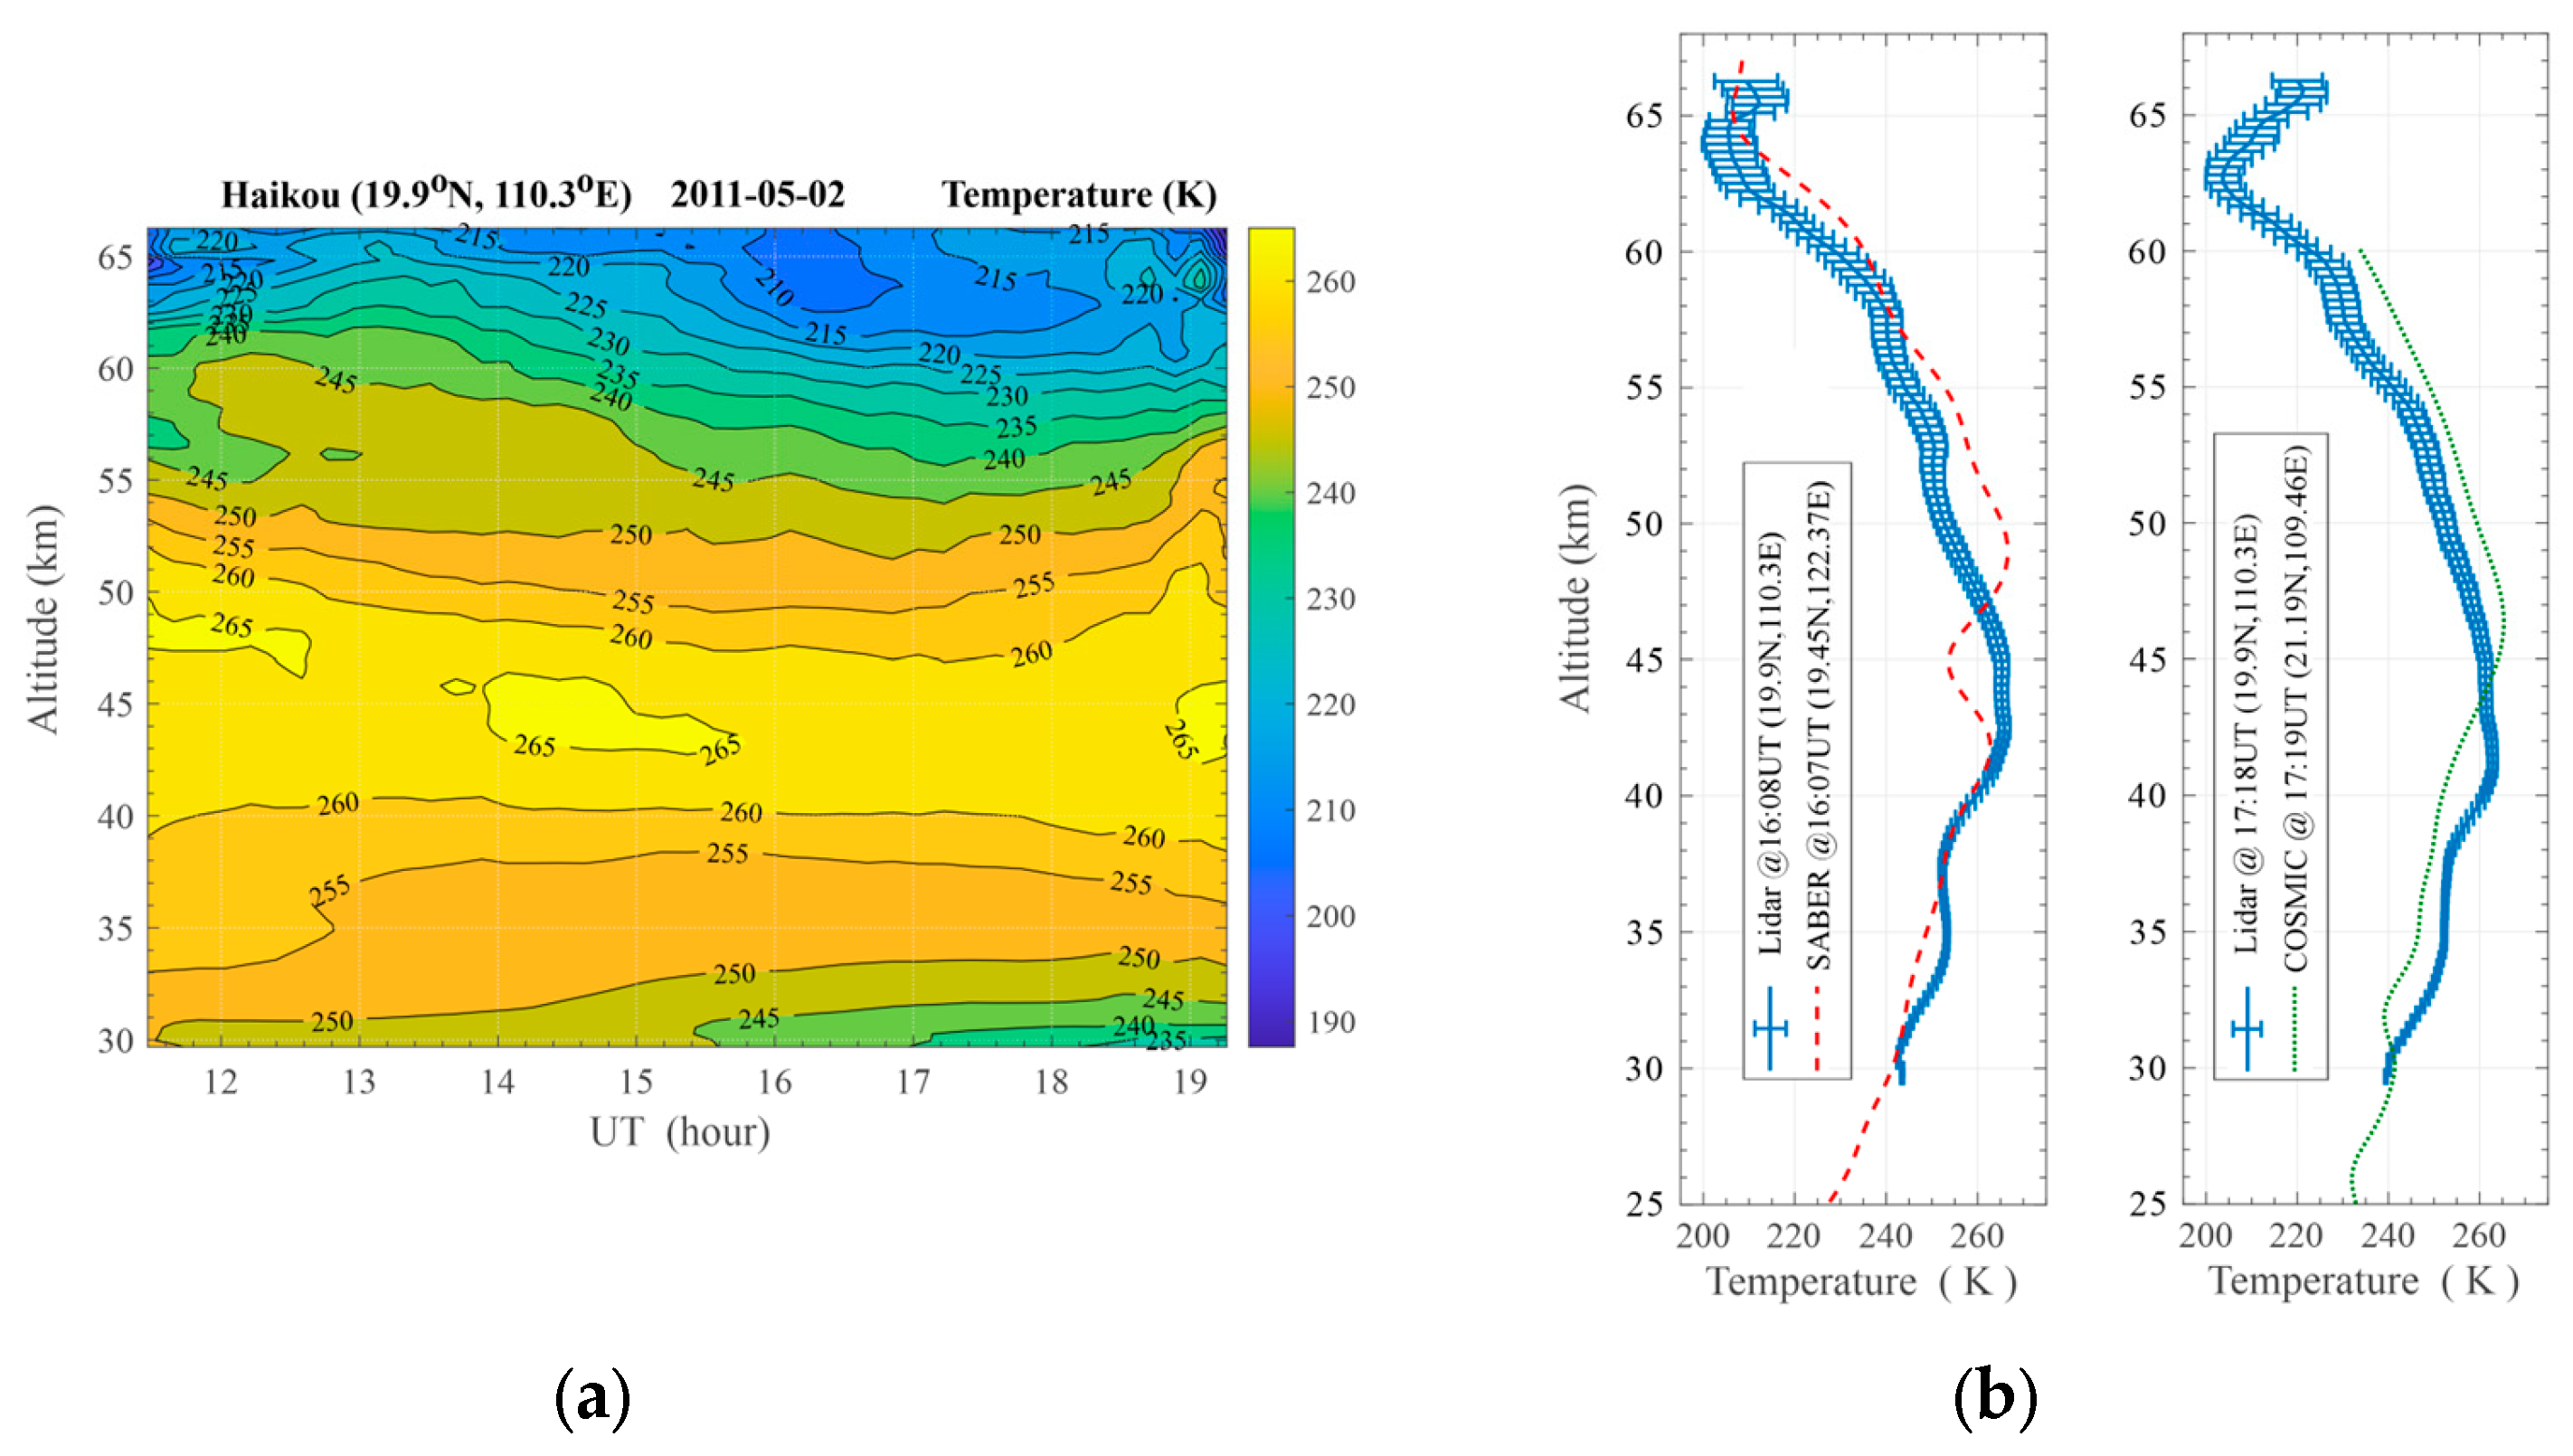
According to the lidar observations at night on 2 May 2011, the temperature structure in the middle atmosphere is retrieved and plotted in
Figure 3(a). The Rayleigh backscatter signal at 589 nm is used to derive the temperature profiles at an altitude range of 30–66 km, and the temperature value at the reference altitude is obtained from the NRLMSISE-00 model (
https://kauai.ccmc.gsfc.nasa.gov/instantrun/nrlmsis/). Since the photon counting process can be described by a Poisson distribution, the relative uncertainty in the retrieved temperature at each altitude is proportional to the inverse square root of the number of counts in the corresponding range bin [
26]. To reduce the relative statistical uncertainty, lidar signals are integrated to obtain profile series with ~300-m spatial resolution and ~10-min temporal resolution, and the relative measurement errors in the final retrieved temperature are typically ~0.11% at 35 km and ~1% at 60 km on a relatively clear night. In
Figure 3(b), the lidar observation results are compared to the simultaneous measurements from SABER/TIMED and COSMIC. It is found that the lidar-measured temperature profiles (@ 16:08 UT, 17:18 UT) are similar to those measured by satellites in variation tendency, and the maximum temperature difference is less than ~10 K at different altitudes. These comparisons are designed to calibrate the lidar measurements in the data analysis flowchart (
Figure 2), and these adopted criterions can ensure that the retrieved atmospheric temperature structures according to lidar observations are reliable. In addition, there may exist some measurement differences at different altitudes (e.g., @49 km) between lidar and satellites in
Figure 3(b), and they are mainly related the following two facts:
1. The atmospheric temperature profiles were measured by lidar at Haikou (19.9°N, 110.3°E), while the simultaneous measurements from satellites were carried out at the footprints (19.45°N, 122.37°E) and (21.19°N, 109.46°E); and
2. The atmospheric temperature profiles were measured by lidar using a vertical detection method, while the limb-scanning and radio occultation detection technique were utilized respectively in measurements of SABER/TIMED and COSMIC.
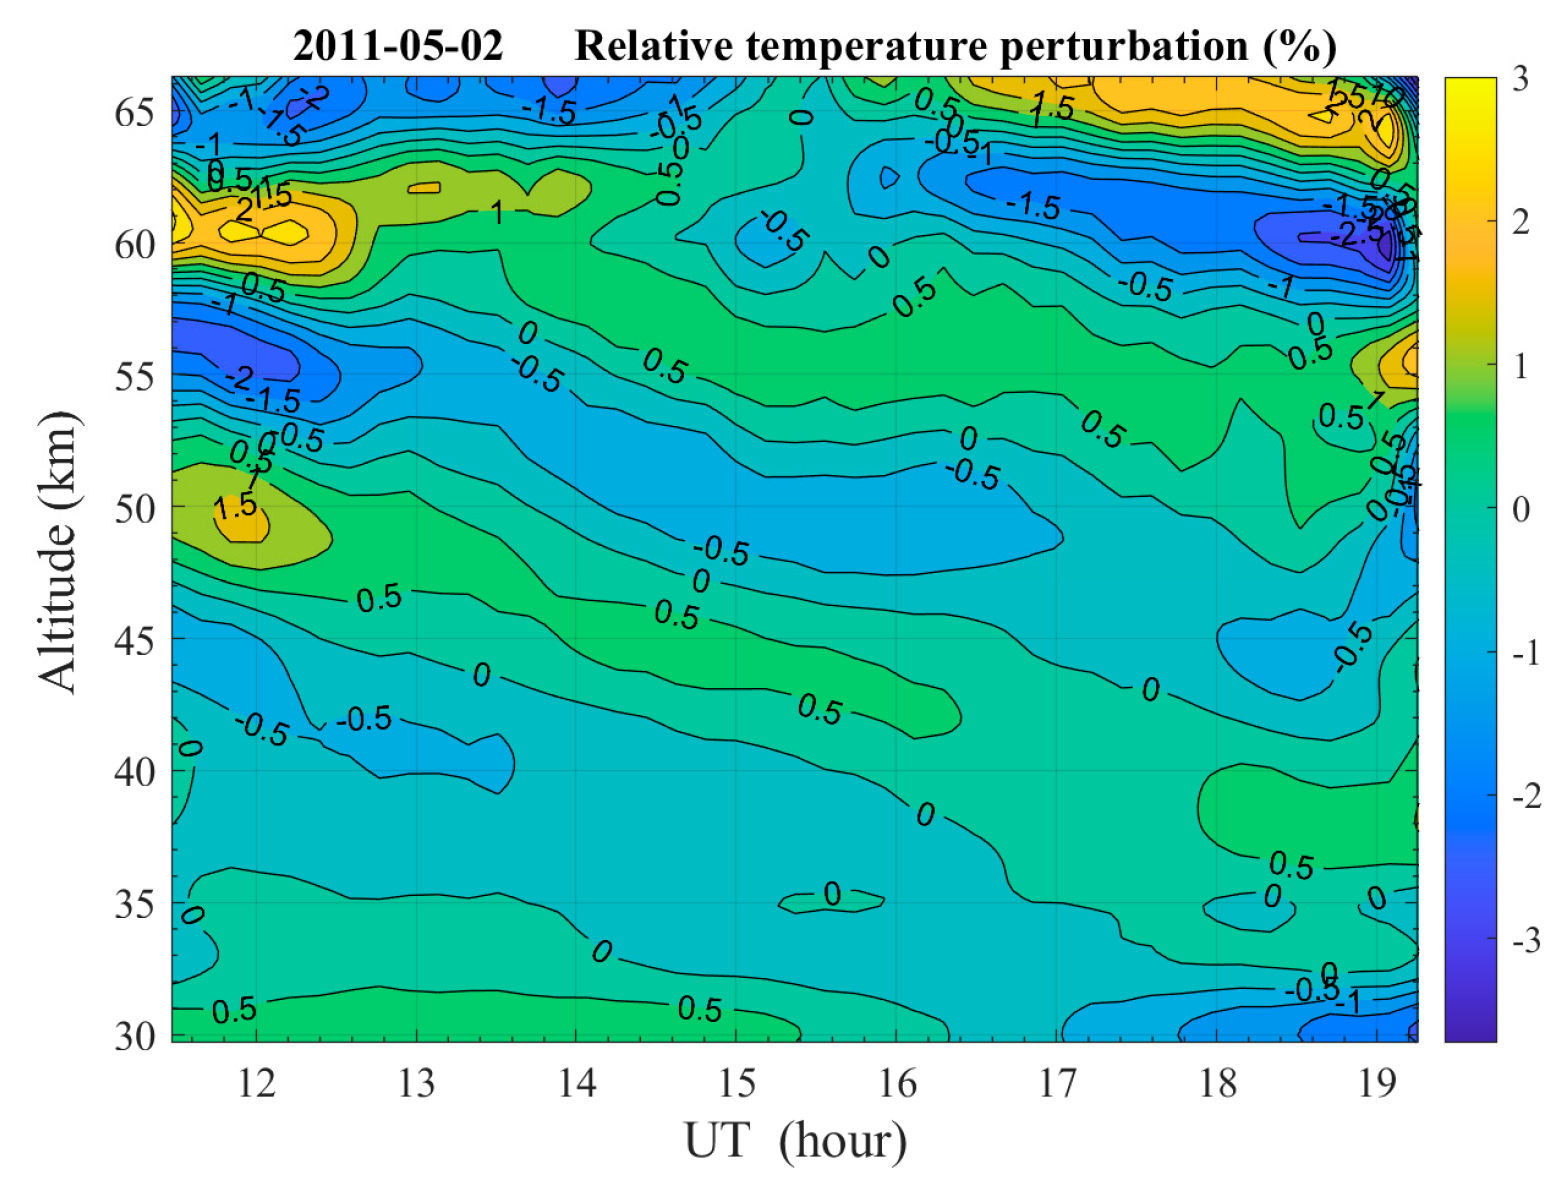
Temperature deviations from the nightly mean
are calculated at different altitudes, and the relative temperature perturbation,
, is plotted in
Figure 4. A striking feature is the coherent wavelike structures in the lidar observation results, showing that the temperature structure is distinctly perturbed by AGWs in the altitude range of 30–66 km. Furthermore, the coherent wavelike structures present a persistently downward phase progression in
Figure 4, indicating that AGWs were propagating upward in the middle atmosphere throughout the nighttime on 2 May 2011 [
27].
Since the atmospheric temperature structure is persistently perturbed by AGWs throughout the lidar observation period in
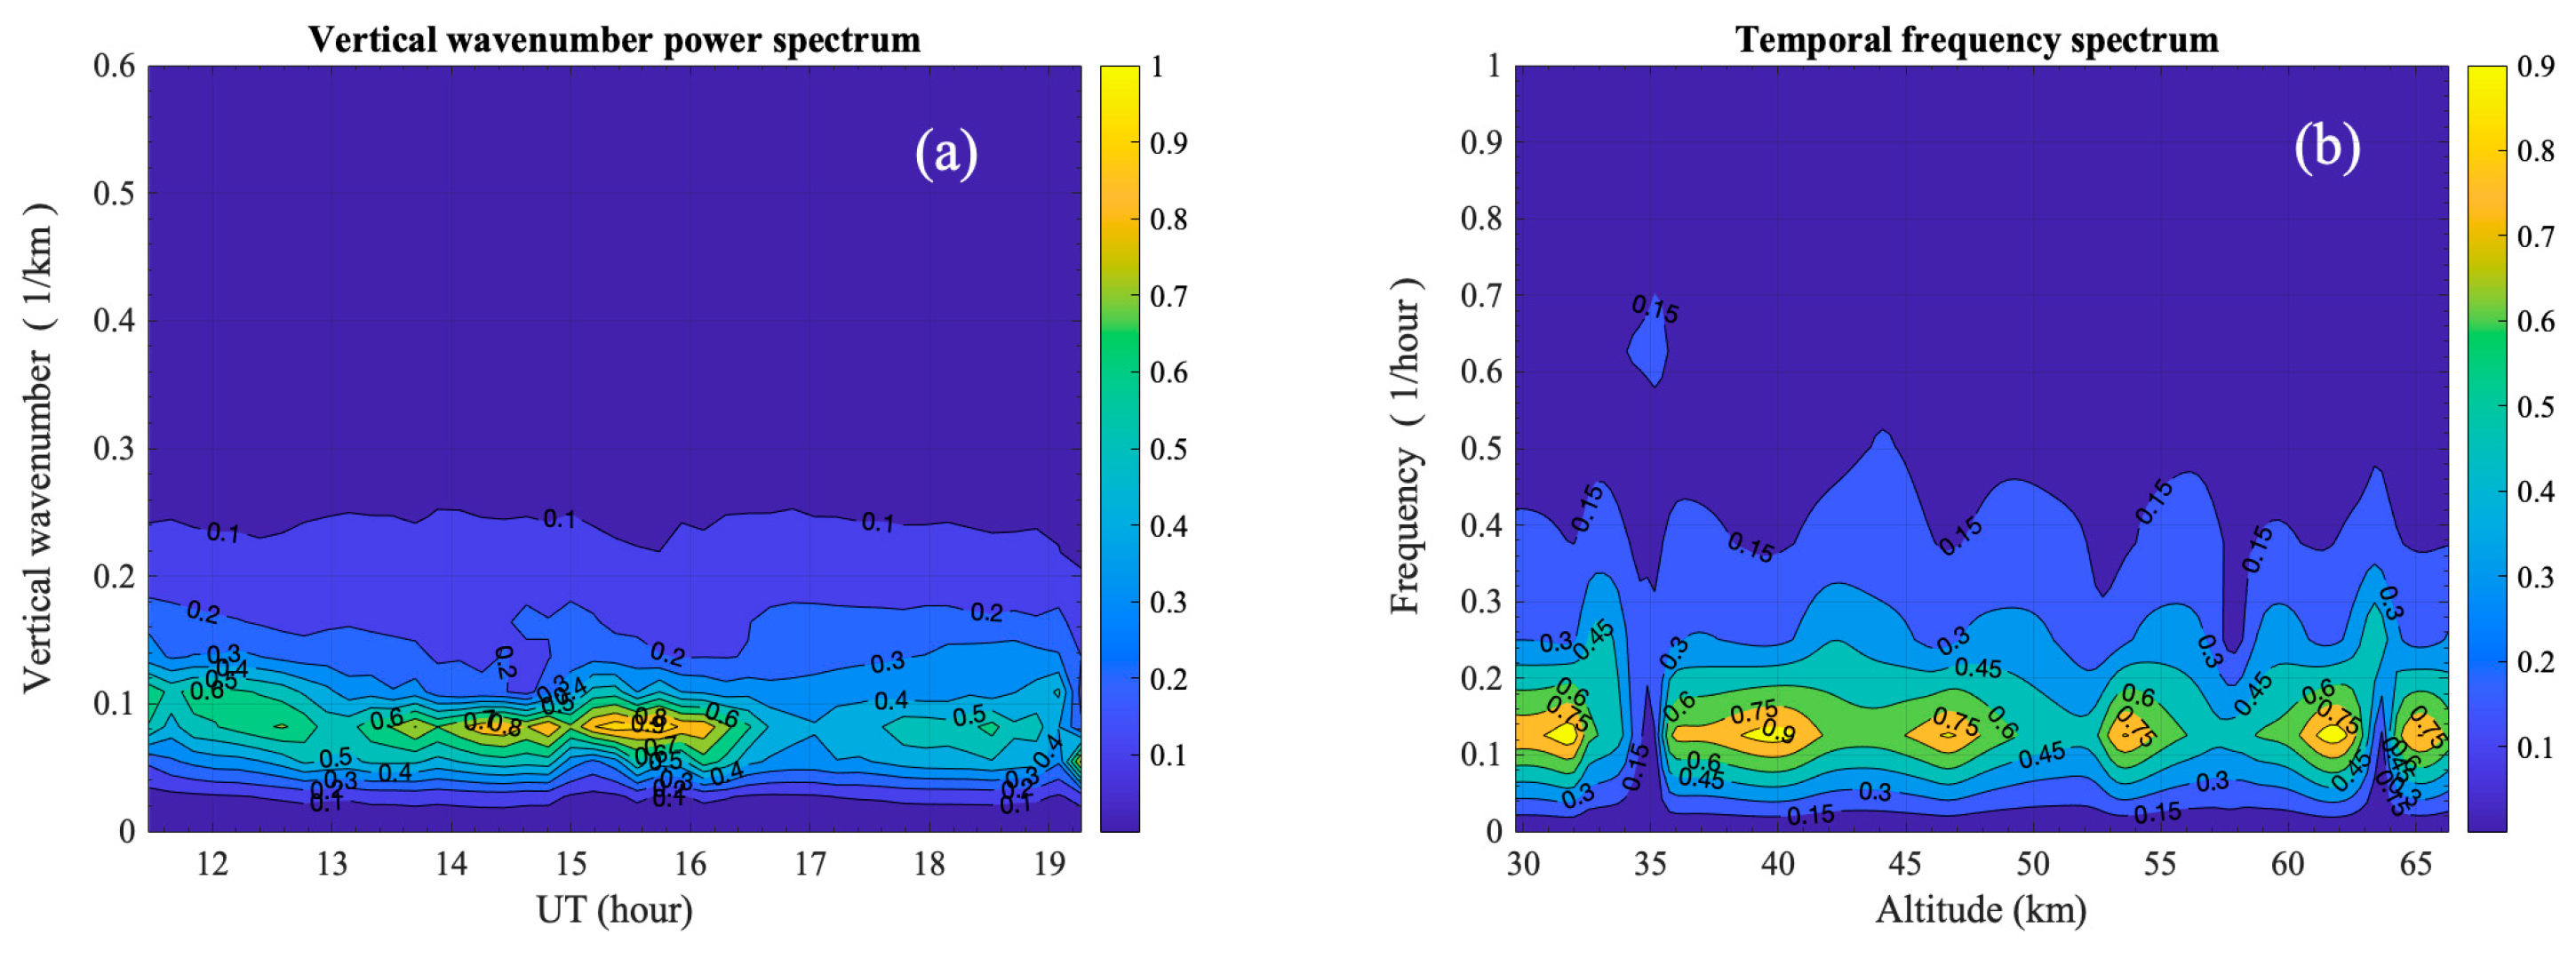
Figure 4, wave spectra are calculated with Equations (3-4) to reveal the contributions from different wave components, and the calculated vertical wavenumber spectrum and the temporal frequency spectrum are shown in
Figure 5. The power spectrum density (PSD) mainly ranges from 0.05 to 0.1 km
-1 in
Figure 5 (a) and from 0.06 to 0.2 hour
-1 in
Figure 5 (b), indicating that the contributions are mainly from AGWs with vertical wavelengths of 10–20 km and wave periods of 5–16 hours. Moreover, the peaks of the PSD are mainly located at approximately 0.08 km
-1 in
Figure 5 (a) and 0.14 hour
-1 in
Figure 5 (b), suggesting that the lidar-observed AGW event at nighttime on 2 May 2011 was persistently dominated by AGWs with vertical wavelengths of ~12.5 km and wave periods of ~7.1 hour. In fact, lidar-measured temperature perturbations may comprise wave perturbations at different scales, even partial fluctuations of background noise. To extract the dominant wave perturbations, discrete wavelet decomposition is generally performed on every lidar-measured temperature perturbation profile during the data analysis process.
3.2. AGW Event Dominated by Downward-Propagating Waves
In the same data analysis method, the atmospheric temperature structure and wave perturbations at night on 8 August 2020 are derived and plotted in
Figure 6 according to the lidar observation data. A coherent wavelike structure with upward phase progression is presented in
Figure 6(b), indicating that the temperature structure in the middle atmosphere was obviously perturbed by downward-propagating AGWs in the nighttime.
Since the temperature structure is persistently perturbed by downward-propagating AGWs throughout the lidar observation period in
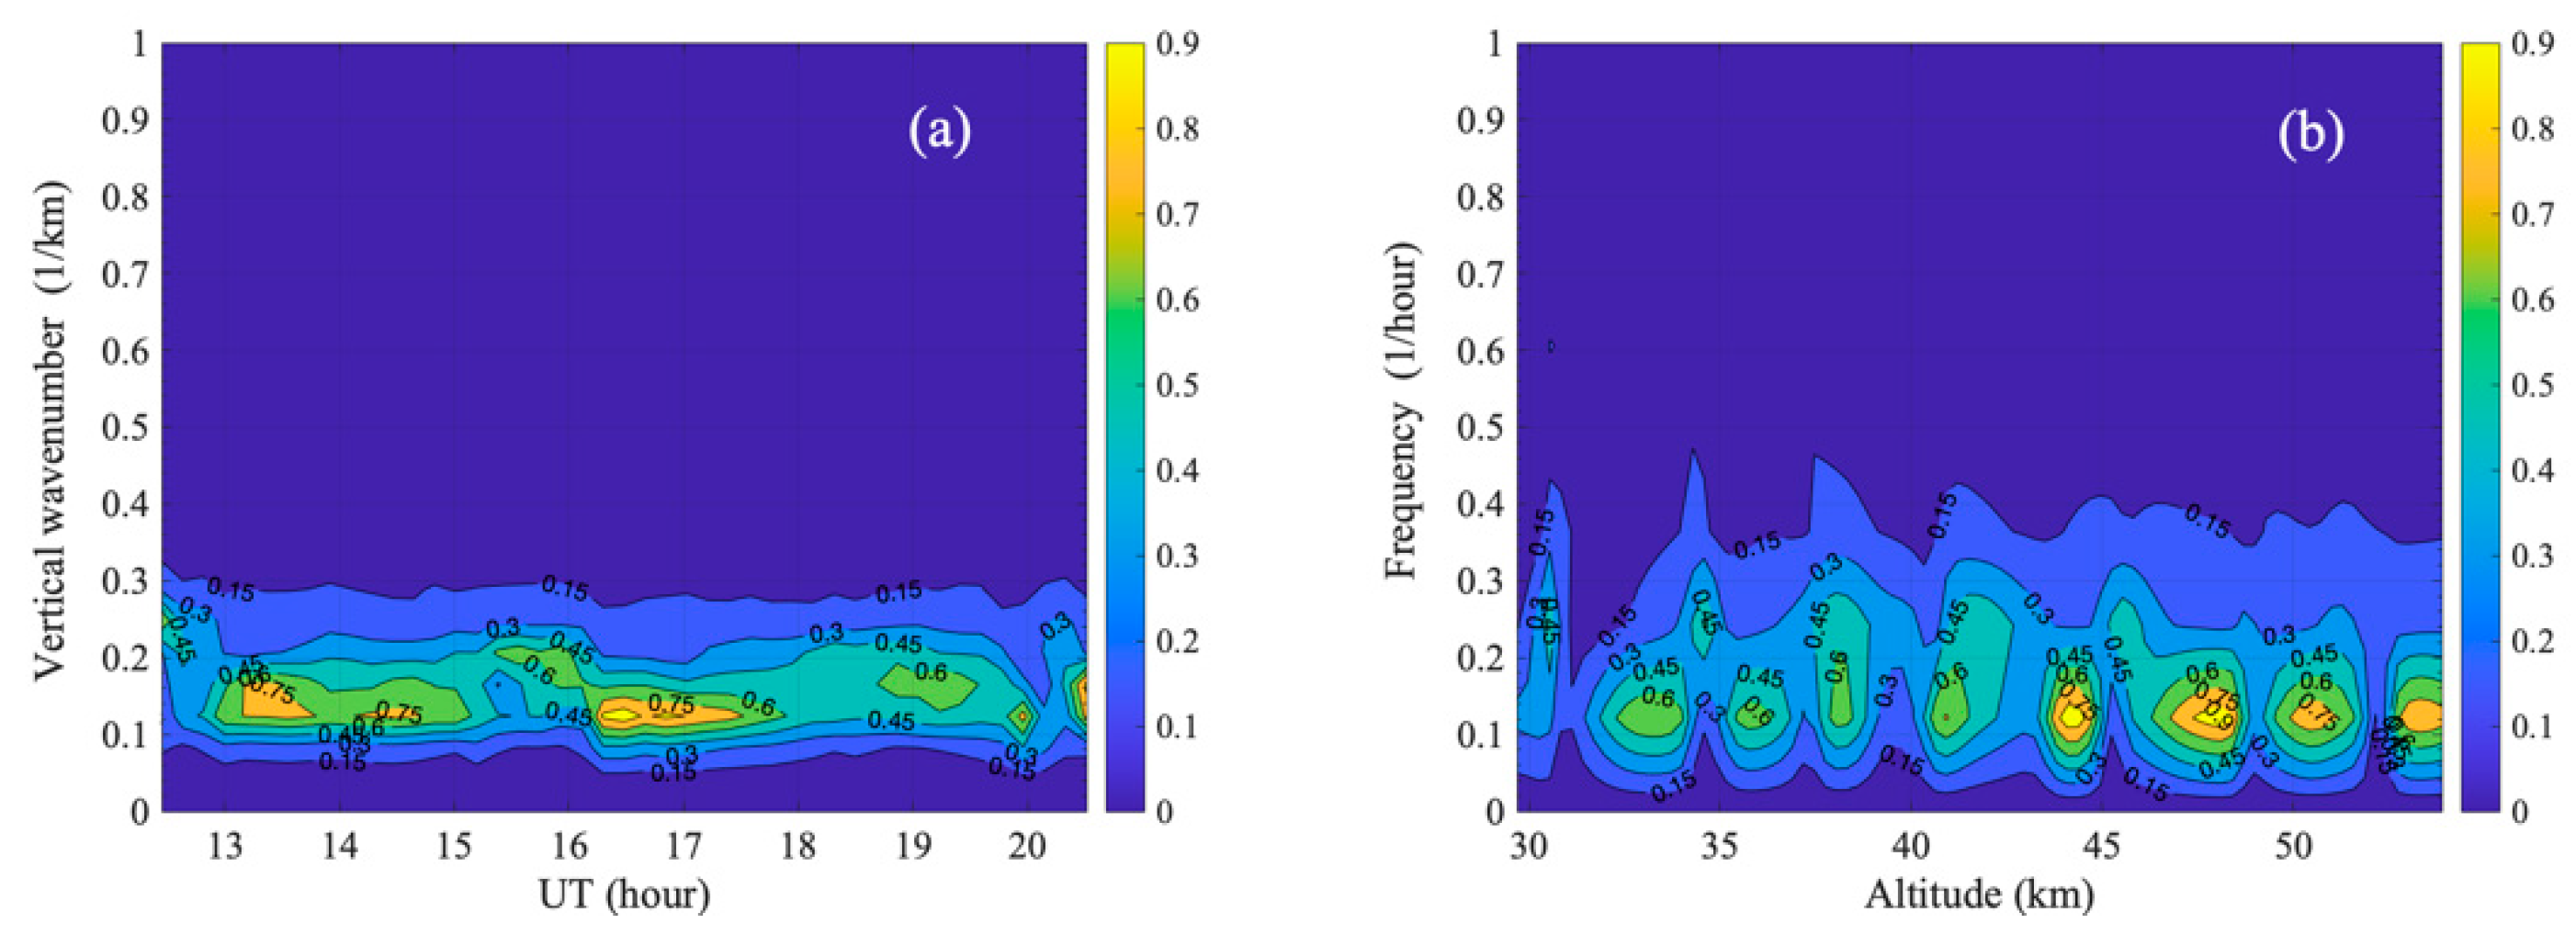
Figure 6(b), the vertical wavenumber spectrum and temporal frequency spectrum are calculated with Equations (3-4) and plotted in
Figure 7. The PSD mainly ranges from 0.1 to 0.2 km
-1 in
Figure 7 (a) and 0.06 to 0.2 hour
-1 in
Figure 7 (b), suggesting that the contribution of wave perturbations is mainly from AGWs with vertical wavelengths of 5–10 km and wave periods of 5–16.7 hours. Moreover, the peaks of the PSD are mainly located at approximately 0.14 km
-1 in
Figure 7 (a) and 0.12 hour
-1 in
Figure 7 (b), suggesting that this lidar-observed AGW event in the middle atmosphere (30–55 km) was persistently dominated by AGWs with a vertical wavelength of ~7.1 km and a wave period of ~8.3 hours.
3.3. AGW Event Associated with Simultaneous Upward and Downward Propagating Waves
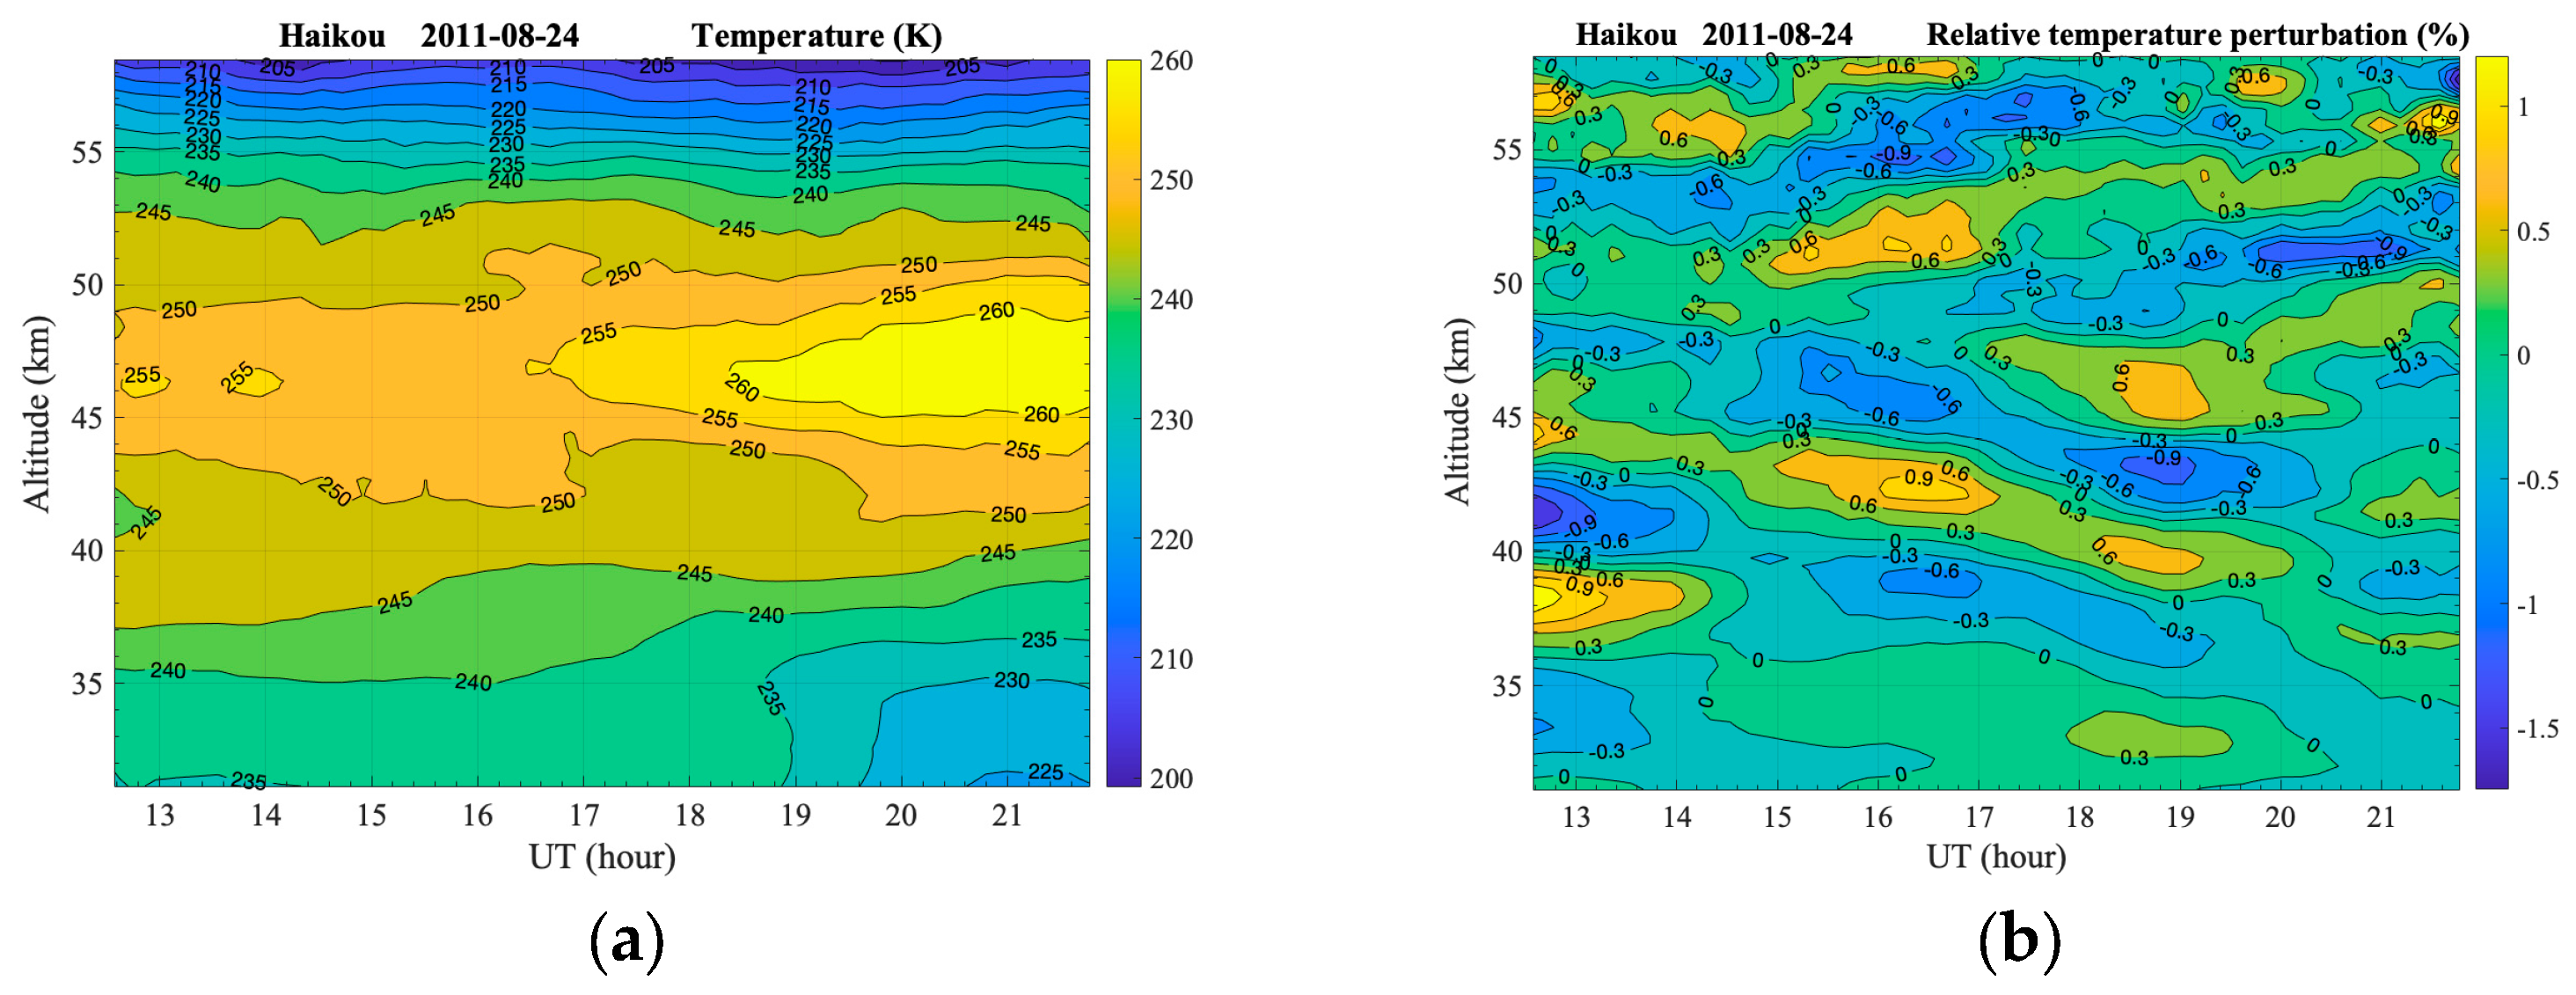
The lidar-observed AGW event on 24 August 2011 is analyzed with the same methodology, and the derived temperature structure and wave perturbations in the middle atmosphere are shown in
Figure 8. It is found that the stratopause is located at ~46 km in
Figure 8 (a), and the wave perturbations in
Figure 8 (b) present a coherent wavelike structure with an upward phase progression above ~46 km, while the wavelike structure below 46 km maintains a downward phase progression. Moreover, as shown in
Figure 8 (b), the two branches of the wavelike structure are roughly symmetric in altitude, and the positive and negative wave phase lines approximately meet at a centric altitude of ~46 km. These results indicate that a simultaneous upward and downward propagating AGW event was observed by lidar in the middle atmosphere at night on 24 August 2011. AGWs above the stratopause propagated downward, while the waves below the stratopause propagated upward.
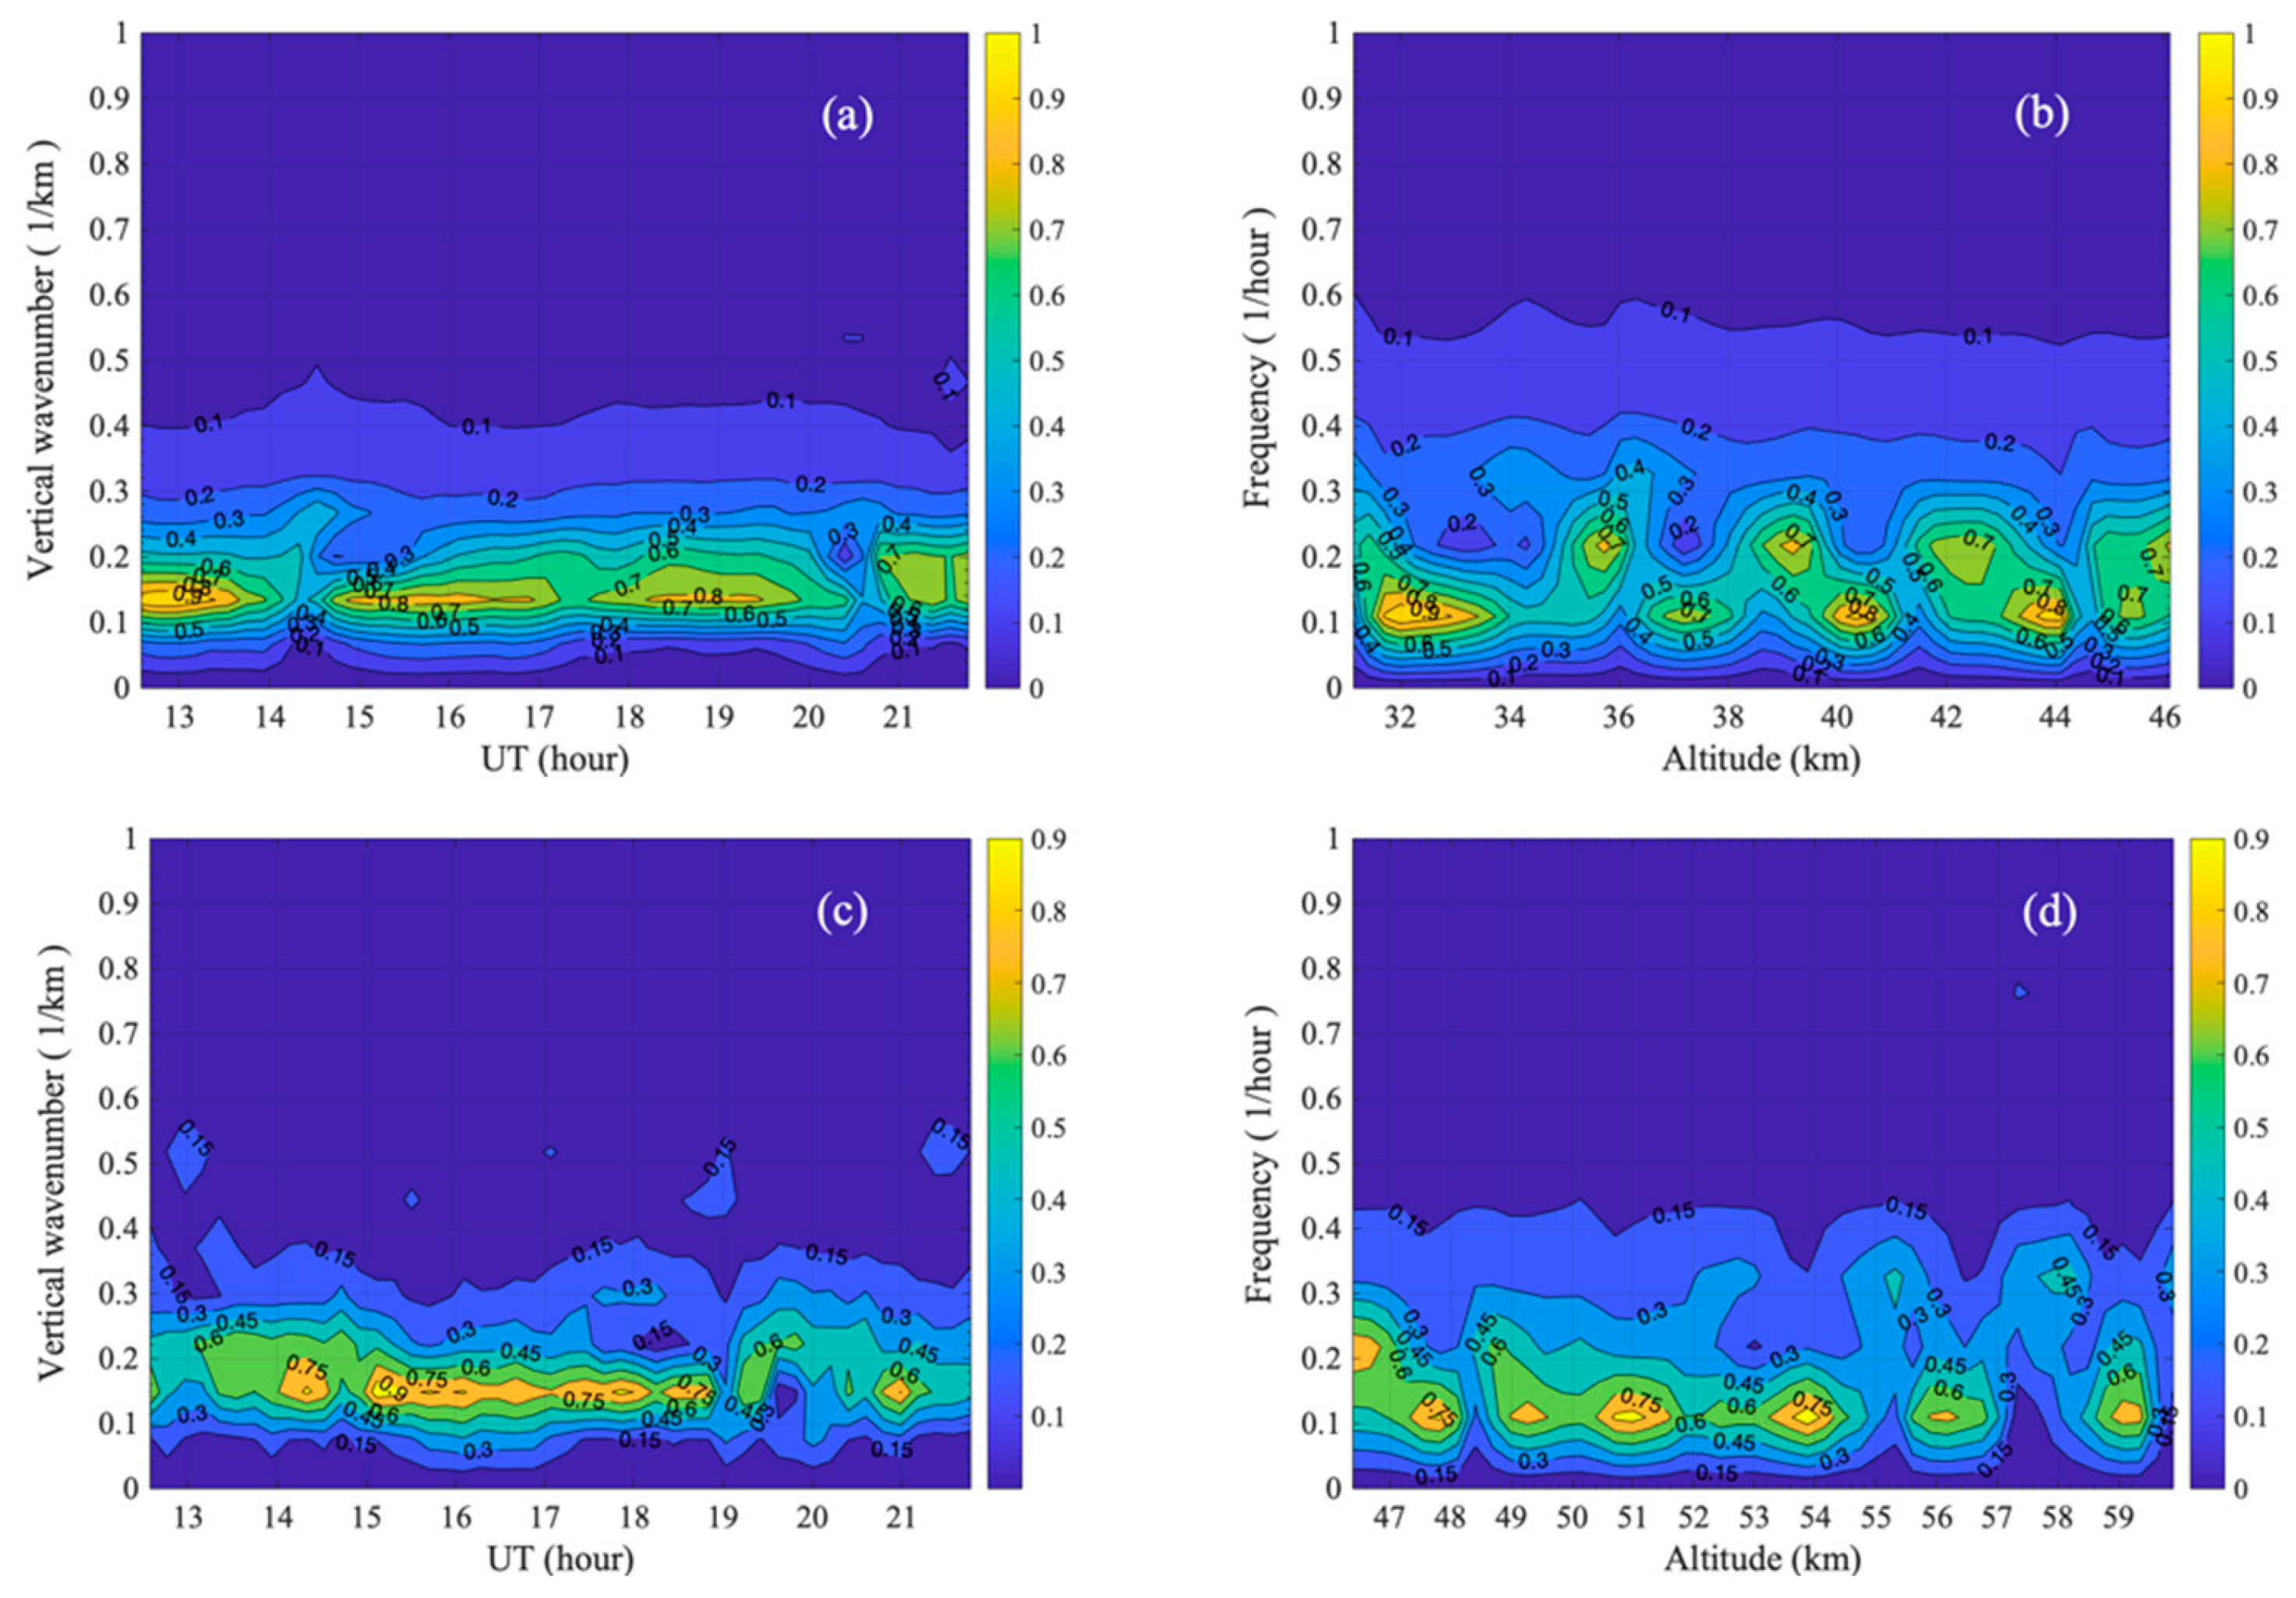
Since different wave propagations are simultaneously observed by lidar, power spectra are separately calculated for the two branches of wave perturbations, and the calculation results are shown in
Figure 9. For the wave perturbations below 46 km, the PSD of the vertical wavenumber spectrum is mainly localized in the range of 0.1–0.2 km
-1 in
Figure 9(a), and its peak persistently occurs at approximately 0.15 km
-1 during the lidar observations. As shown in
Figure 9(b), the PSD of the temporal frequency spectrum is mainly distributed from 0.08–0.25 hour
-1, and the peak PSD alternatively occurs at approximately 0.11 hour
-1 and 0.21 hour
-1 as the altitude increases from 30 km to 46 km. For the wave perturbations above 46 km, the PSD of the vertical wavenumber power spectrum is mainly located in the range of 0.12–0.22 km
-1 in
Figure 9(c), and its peak persistently occurs at approximately 0.16 km
-1 for the whole lidar observation. Moreover, the PSD of the temporal frequency spectrum mainly ranges from 0.08–0.24 hour
-1 in
Figure 9(d), and the peak is also mainly located at approximately 0.11 hour
-1 at altitudes of 46–60 km. Thus, similar characteristics in the power spectra are found for the two branches of wave perturbations in
Figure 8(b), although there are some minor differences in the distributions of the temporal frequency spectrum. That is, at the two sides of the centric altitude of ~46 km, the vertical wavelengths of AGWs mainly range from 5–10 km, and their observed wave periods are distributed from 4–12 hours. In particular, the dominant AGWs have the same vertical wavelength of ~6.8 km in the whole lidar observation period and a similar wave period of ~9 hours in the middle atmosphere (30-60 km).
3.4. Statistics of Lidar-Observed Gravity Waves during 2010–2022
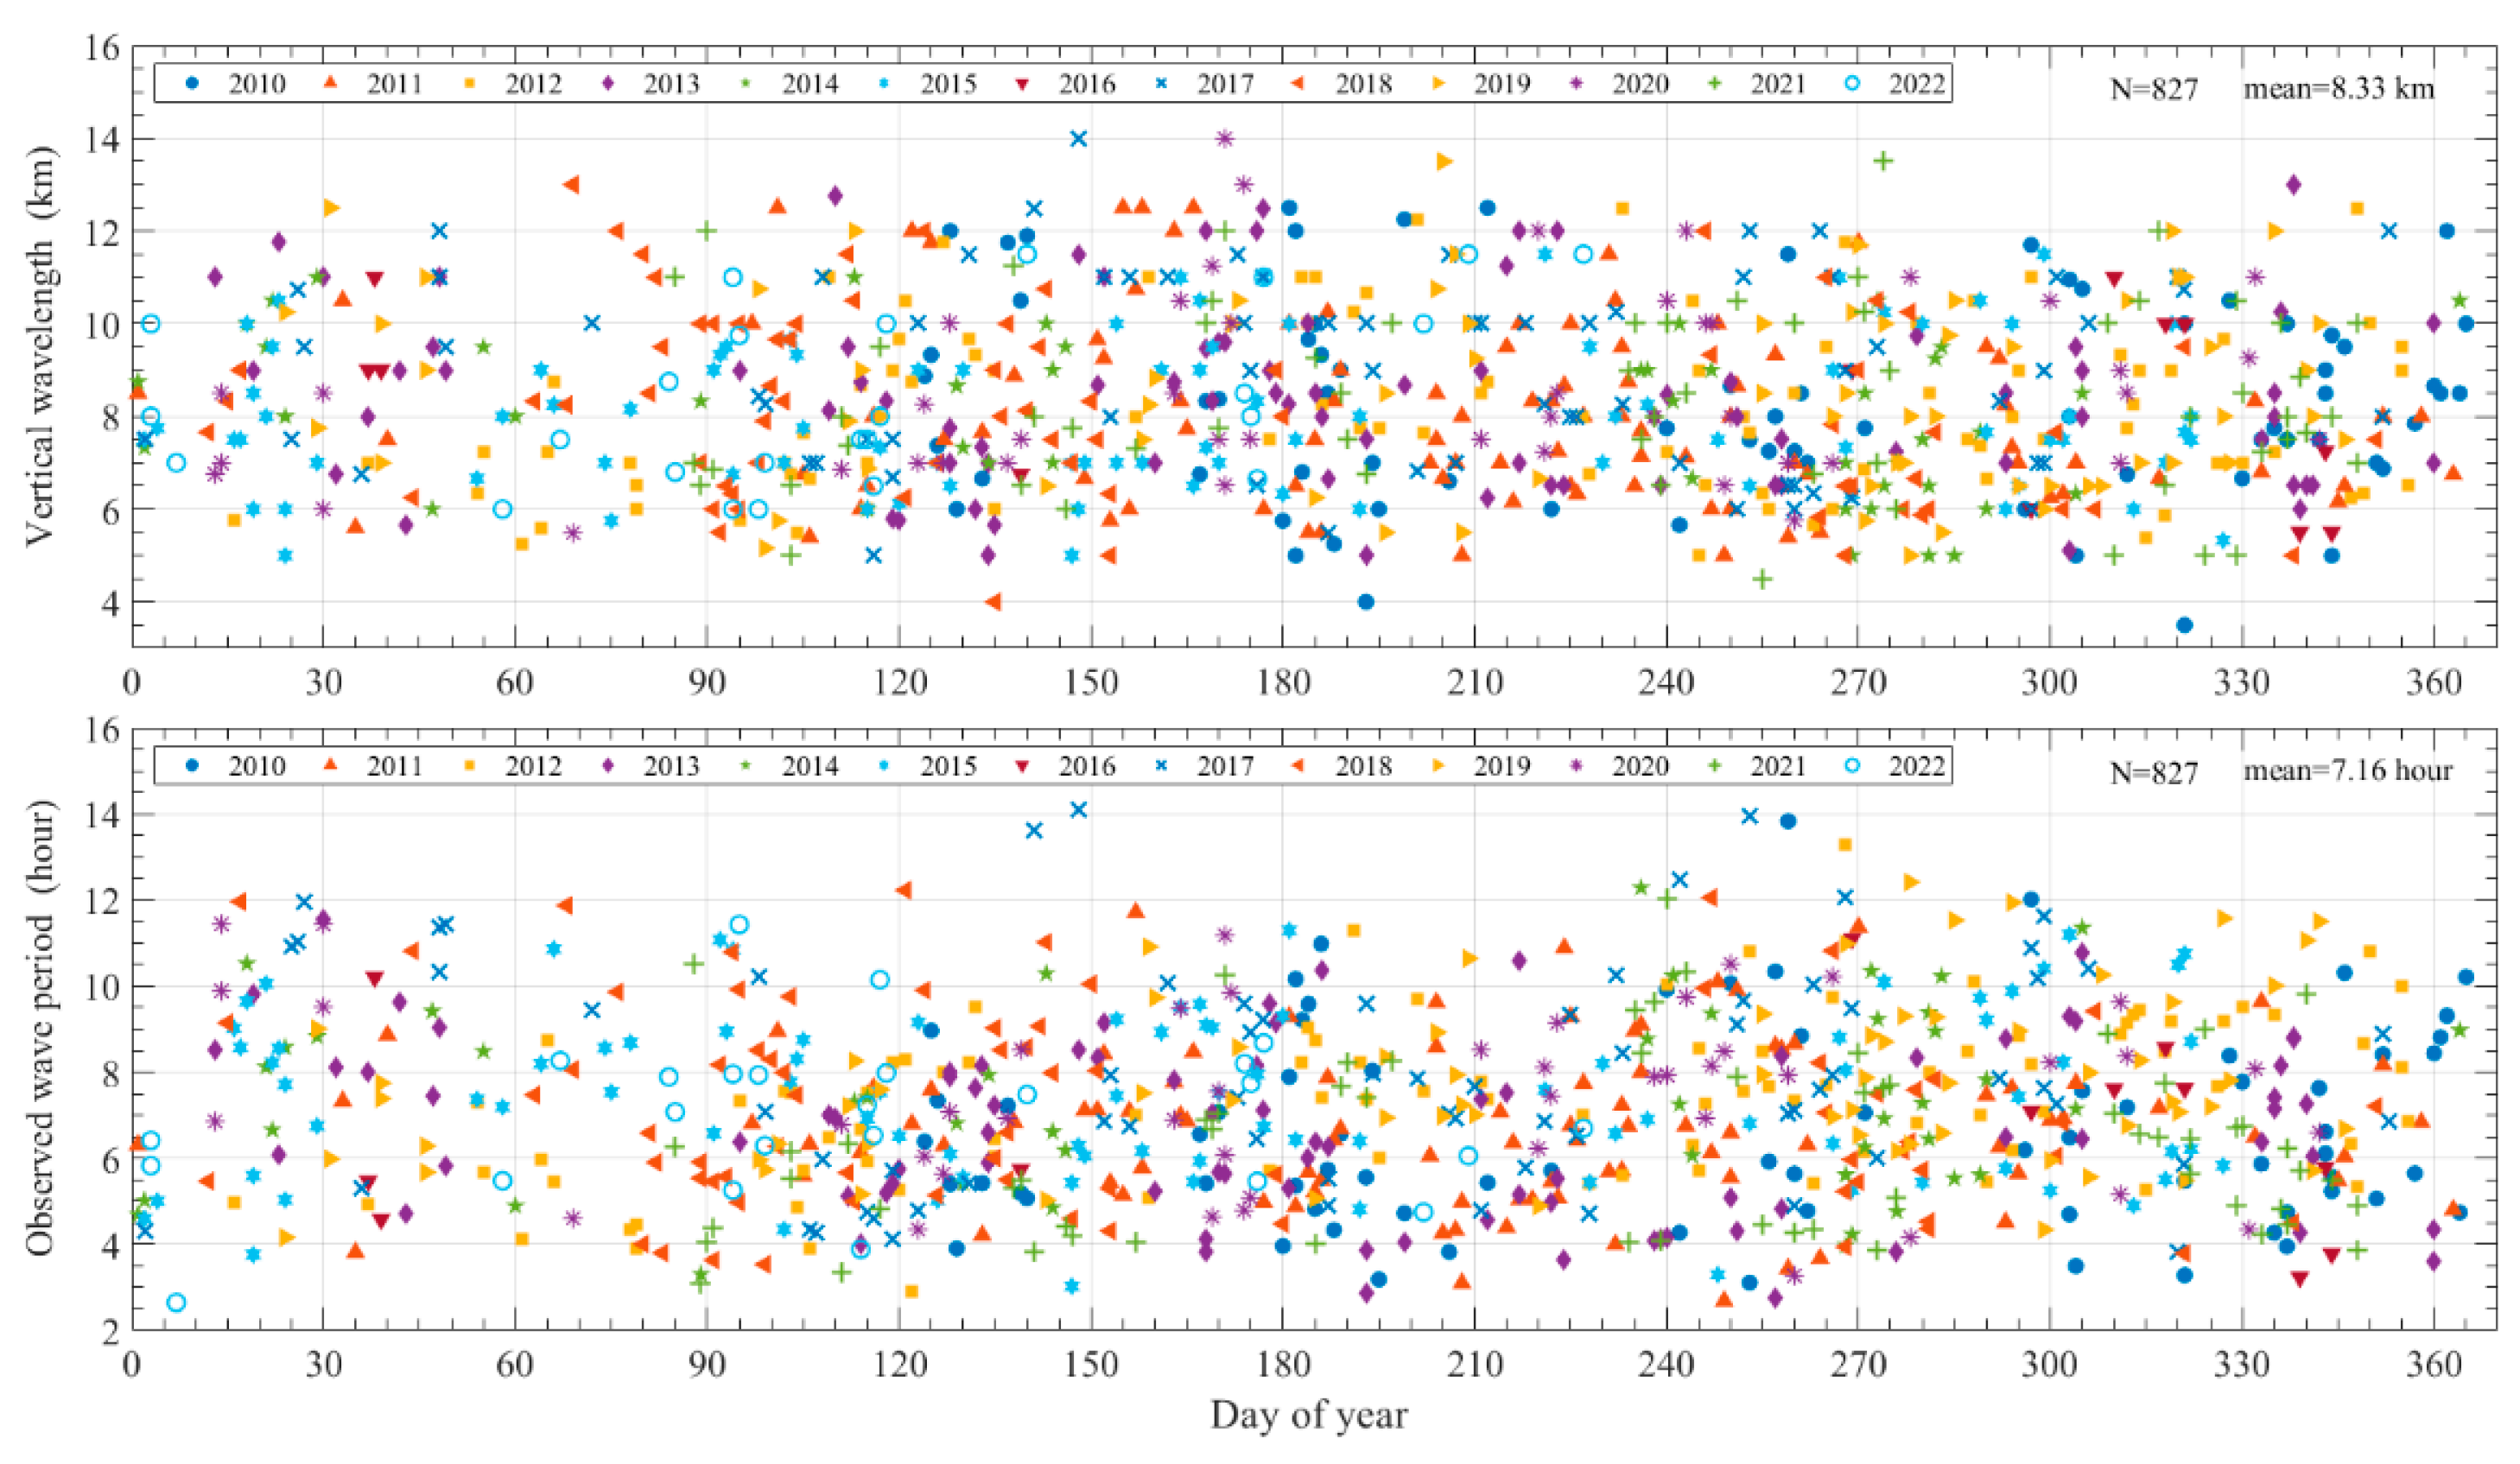
By applying this data analysis method, statistical features of AGW activity in the middle atmosphere over Haikou (19.9°N, 110.3°E) are investigated, and 827 quasi-monochromatic AGWs are identified from the accumulated lidar data during 2010–2022. In the process of data analysis, the criterion of AGW events described by Beatty et al. is adopted, and only those wavelike structures that occurred in several successive temperature perturbation profiles and exhibited coherent phase progression are considered to be quasi-monochromatic AGW events [
19]. The vertical wavelengths and observed wave periods of the dominant waves are extracted for every AGW event and are plotted in
Figure 10. The value of the vertical wavelength ranges from 3.5 to 14 km, with an average of 8.33 km. The observed wave period is distributed from 2.6 to 14.1 hours, with an annual average value of 7.16 hours.
Since the wave propagation directions are generally used to characterize the vertical transportation of heat and energy between different layers in the atmosphere, lidar-observed AGWs propagating in different vertical directions are statistically analyzed in
Table 1. The number of upward-propagating AGWs is 676, corresponding to a percentage of 81.7% of the total lidar-observed AGW events. AGWs propagating downward are observed in 151 events, and the proportion of total lidar-observed AGWs,
, is only 18.3%. This statistical result reveals that a majority of AGWs propagate upward in the middle atmosphere over Haikou (19.9°N, 110.3°E), and the vertical transport of heat and energy is mainly associated with the passage of upward-propagating AGWs.
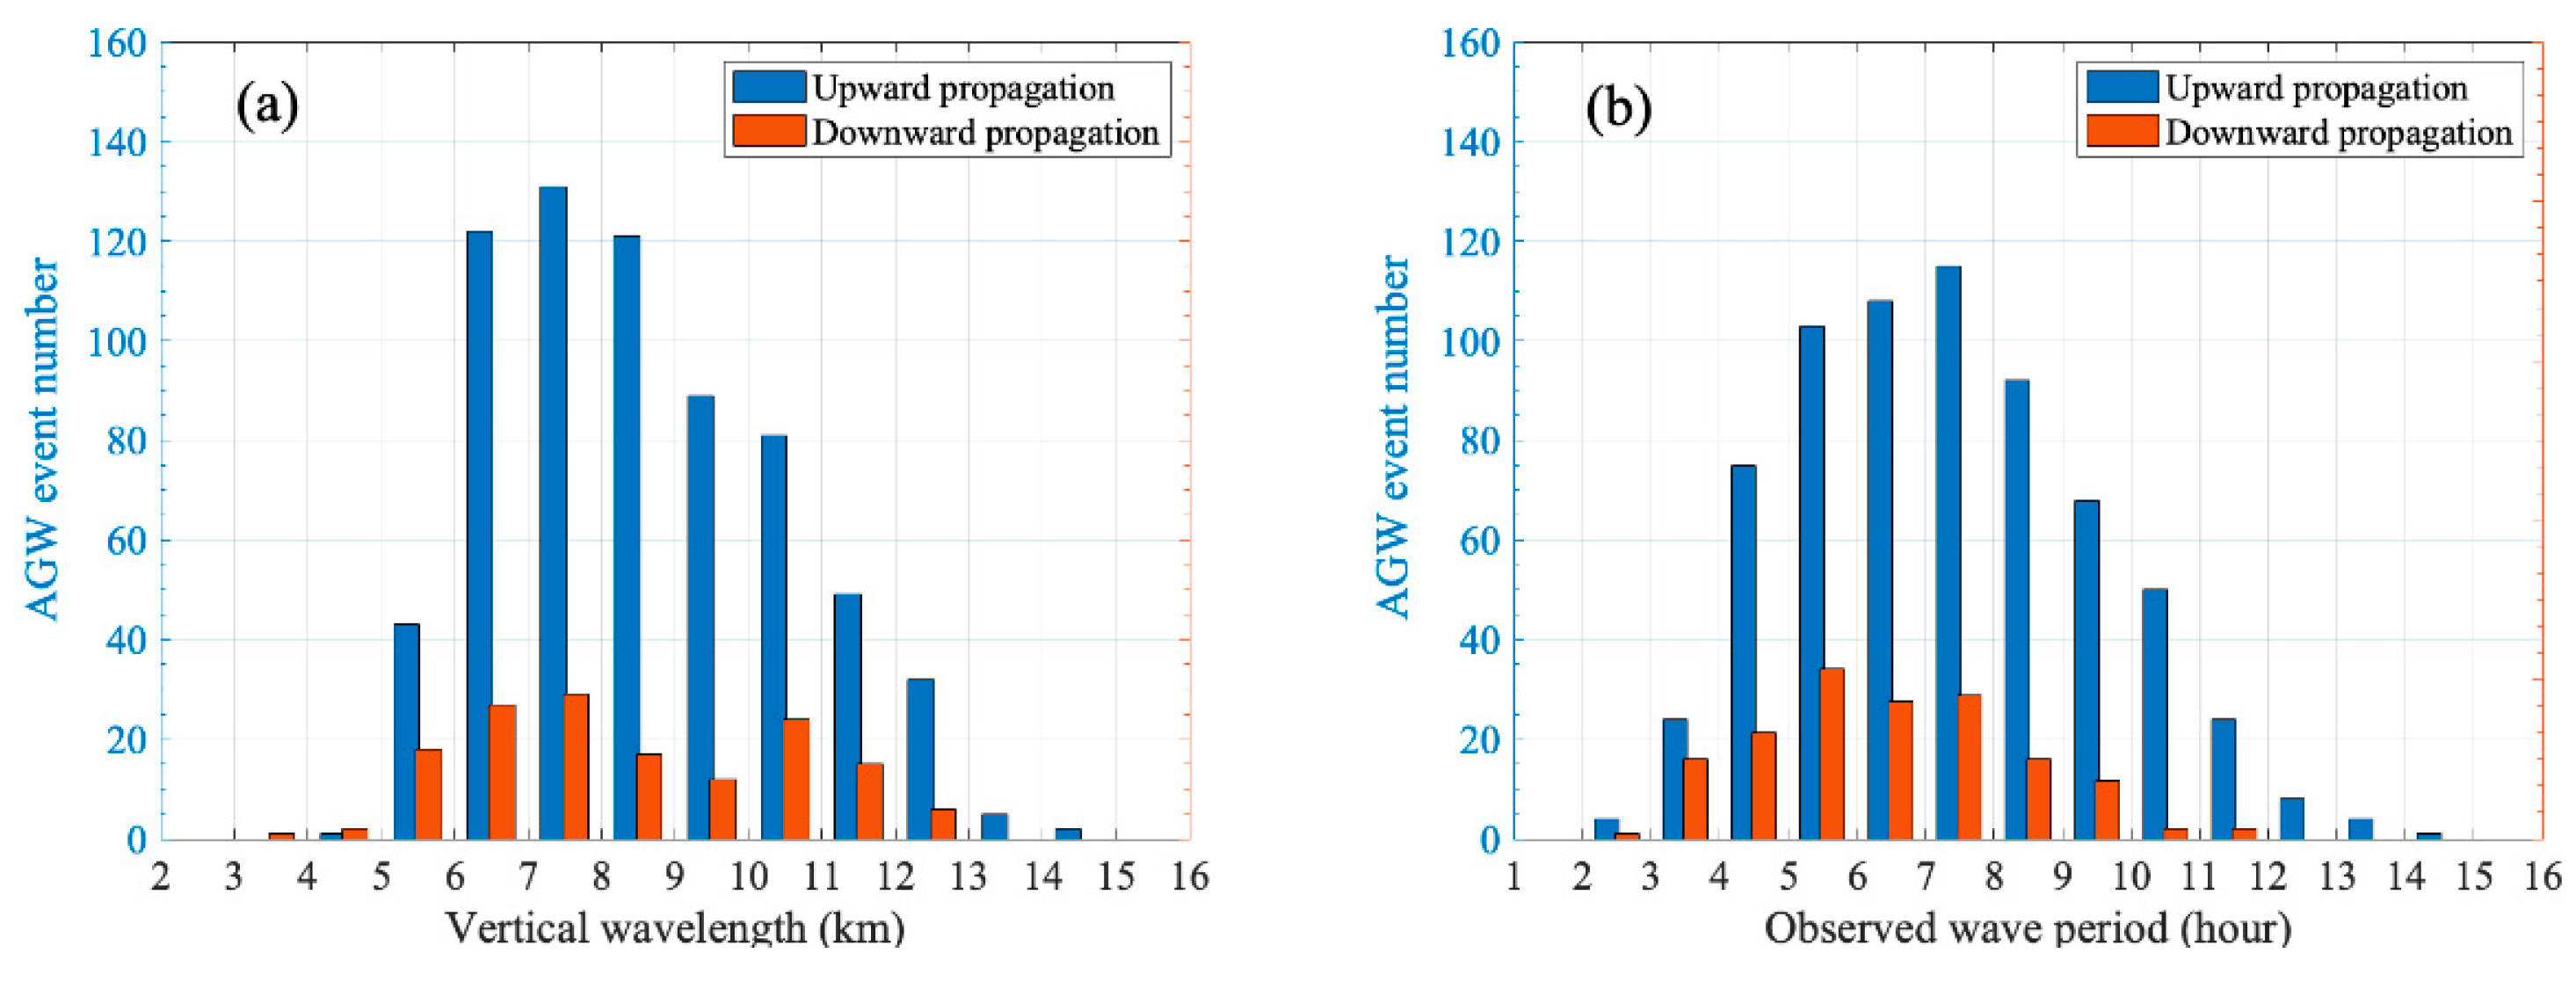
The vertical wavelengths and wave periods of these lidar-observed AGWs are statistically analyzed, and the histograms are plotted in
Figure 9. For the AGWs propagating upward, the most common vertical wavelength ranges from 6 to 11 km in
Figure 11(a), and the most common wave period is distributed from 4 to 10 hours in
Figure 11(b). For the AGWs propagating downward, the most common vertical wavelengths and wave periods are 5–12 km and 3–9 hours, respectively. To combine the two statistical results, it is revealed that the typical AGWs observed by lidar in the middle atmosphere over Haikou (19.9°N, 110.3°E) have vertical wavelengths of 6–11 km and wave periods of 4–10 hours.
The seasonal distribution of these lidar-observed AGW events is analyzed in
Table 1, and significant seasonal variations in the AGW activities are found at this low-latitude region. Statistical results show that the percentages of AGW events associated with upward-propagating waves are 79.8%, 82.1%, 86.6%, and 74.8% in the four different seasons, indicating that the proportion of upward-propagating AGWs reached a maximum in autumn and a minimum in winter. Moreover, the proportion of downward-propagating AGWs is obviously greater in winter (25.2%) than in summer (17.9%) and autumn (13.4%).
The lidar-observed AGW event associated with simultaneous upward and downward propagating waves has been previously reported by Huang et al. (2017) as a rare dynamical process in the mesopause region (80–105 km) over the Andes (30.3°S, 70.7°E). However, it is surprising to find in
Table 1 that such a special AGW phenomenon can be observed by lidar during 68 AGW events in the middle atmosphere (30–65 km) over Haikou (19.9°N, 110.3°E), but the percentage of total lidar-observed AGW events is only 8.2%.
4. Comparison and Discussion
4.1. Vertical Wavelengths and Wave Periods of AGWs in the Low-Latitude Middle Atmosphere
In recent decades, most lidar studies on AGW activities in the middle atmosphere have been confined to the middle and higher latitudes, and the features of AGW activities in the low-latitude middle atmosphere have been reported only at Gadanki (13.5°N, 79.2°E), Arecibo (18°N, 67°W), Hawaii (19.5°N, 155.6°E), Haikou (19.9°N, 110.3°E), and Reunion Island (21°S, 55°E) to date. As shown in
Table 2, the statistics regarding the vertical wavelengths and wave periods of lidar-observed AGWs at those locations are listed for comparison.
At Arecibo (18°N, 67°W), by analyzing 160 hours of Rayleigh/Na lidar observation data obtained during January, March and April in 1989, Beatty et al. reported that the vertical wavelengths of lidar-observed AGWs range from 2.8–17 km in the stratopause region (22–55 km) and 1.1–12.8 km in the mesopause region (80–105 km) [
19]. The most common vertical wavelengths are between 4 km and 8 km in the stratopause region and between 2 km and 6 km in the mesopause region. The wave periods range from 104 min to 65 hours in the stratopause region and from 5 min to 18 hours in the mesopause region. The most common wave periods are distributed in the range of 100–300 min in the stratopause region and 10–100 min in the mesopause region. At Reunion Island (21°S, 55°E), 15 nights of Rayleigh lidar observation data (May-November 1994) were analyzed by Chane-Ming et al., and they found that the lidar-observed AGWs in the middle atmosphere (30–60 km) typically have vertical wavelengths ranging from 2 to 10 km and wave periods ranging from 2 to 14 hours [
20]. At Hawaii (19.5°N, 155.6°E), only the vertical wavelength distribution was reported by Li et al. (their Table 1) by analyzing 10.5 years of Rayleigh lidar data [
22]. They determined that the vertical wavelengths of lidar-observed AGWs range from 0.6 km to 15 km in the middle atmosphere (30–63 km). At Gadanki (13.5°N, 79.2°E), by calculating the vertical wavenumber and frequency spectra of lidar-measured relative temperature fluctuations, Sivakumar et al. found that from March 1998 to December 2002 (310 nights), the wave activity observed by Rayleigh lidar in the middle atmosphere (30–70 km) has a vertical wavelength on the order of 5–38 km, and the time period ranges from 20 min to 4.5 hours [
21].
For the lidar observation results at Haikou (19.9°N, 110.3°E), the vertical wavelengths of the lidar-observed AGWs in the middle atmosphere (30–65 km) range from 3.5 km to 14 km, and the most common vertical wavelengths are 6–11 km. This lidar-observed statistical feature of AGW activities is different from those obtained at the other low latitudes shown in
Table 2. Moreover, the wave periods of lidar-observed AGWs in the middle atmosphere (30–65 km) range from 2.6 hours to 14.1 hours, and the most common wave periods are 4–10 hours. This statistical feature in the wave period is similar to that obtained at Reunion Island (21°S, 55°E), but it is obviously different from those reported at other low latitudes. Therefore, different statistical features of AGW activities in the middle atmosphere may be observed by lidar at different low latitudes, and AGW activities probably have their own regional characteristics at different locations. Certainly, this general conclusion may satisfy the understanding of most researchers, and the features of lidar-observed AGW activity in the middle atmosphere should be determined by the source characteristics and effects of background winds, which always vary at different locations [
1,
14].
At the same observation location, the AGW activities in the mesopause region (80–105 km) have been studied by Gong et al. by analyzing Na lidar observation data [
14]. It is found that the vertical wavelengths of lidar-observed AGWs in the mesopause region range from 1.85 km to 10.78 km, with an average value of 3.76 km. The wave periods are distributed in the range of 1.03–13.88 hours, corresponding to a mean value of 3.53 hours. The most common vertical wavelengths and wave periods are 2–4 km and 1–4 hours, respectively. Compared with the Rayleigh lidar observation results in the middle atmosphere (30–65 km), it is found that both the vertical wavelengths (with an average value of 8.33 km) and wave periods (with an average value of 7.16 hours) are much greater than those observed in the mesopause region. Parameter values of the most common AGWs are also significantly different. Similar altitude-dependent AGW activities were observed by Beatty et al. at Arecibo (18°N, 67°W) [
19]. As shown in
Table 2, the vertical wavelengths of Na lidar-observed AGWs in the mesopause region (80–105 km) are in the range of 1.1–12.8 km, and the wave periods range from 5 min to 18 hours. However, for the Rayleigh lidar-observed AGWs in the stratopause region (22–55 km), their vertical wavelengths and wave periods range from 2.8–17 km and 1.7–65 hours, respectively. Moreover, the most common vertical wavelengths are from 4 km to 8 km in the stratosphere, while they range from 2–6 km in the mesopause region; the most common wave periods range from 100-300 min in the stratosphere, while they range from 10 min to 100 min in the mesopause region. That is, different statistical features of AGW activities were observed by lidars in the stratosphere and in the mesopause region at Arecibo (18°N, 67°W), and the parameter values of the AGWs measured in the stratosphere are also typically much greater than those measured in the mesopause region. Therefore, at the same observation site, different features of AGW activities may be observed at different altitudes, and the wavelengths and periods of AGWs in the middle atmosphere (30–65 km) are generally much greater than those in the mesopause region (80–105 km).
Indeed, because of the effects of the background atmosphere (e.g., absorption, dissipation, and filtering), a large number of small-scale AGWs may disappear during their propagations from the lower atmosphere to the upper atmosphere [
28,
29]. On the other hand, due to the exponential decrease in the atmosphere density, some wave packages in large-scale will become saturated and broken with the rapid growth of amplitude during obliquely upward propagations. Thus, different statistical features of AGW activities can be observed at different altitudes by lidars at the same observation site. At Gadanki (13.5°N, 79.2°E), altitude-dependent AGW activities in the altitude range of 30-70 km was also observed by Sivakumar et al., and they reported that the Rayleigh lidar-observed AGW activities are distinctly different from the stratosphere to the mesosphere [
21].
In addition, these comparison results can possibly be affected by the lidar measurement capability. To decrease the relative measurement error in the retrieved temperature profiles, the spatial and temporal resolutions are preset to ~300 m and ~10 min by integrating the lidar signals in this study, and the shortest vertical wavelength and wave period, which can be measured by Rayleigh lidar, are estimated to be ~2 km and ~1 hour [
3]. Due to the presence of background winds, the lidar-observed wave periods of AGWs are actually the Doppler-shifted periods rather than wave intrinsic periods. Since the accuracy values of these extracted wave parameters are typically affected by photon noise, a low-pass filter with a cutoff vertical wavelength of 1.5 km and a period of 60 min is applied to the lidar observation data, and the relative RMS errors associated with the measured vertical wavelengths and wave periods in
Figure 8 are generally less than 1.5% [
12,
14].
4.2. Vertical Propagation Direction of AGWs in the Middle Atmosphere
Lidar observation is an effective method for unambiguously determining the AGW propagation direction in the middle atmosphere, and the vertical propagation directions of waves are often used to characterize the heat and energy transport between the lower atmosphere and the upper atmosphere. However, for the statistical features of AGW propagation directions in the middle atmosphere, only several lidar (or radar) observation results have been reported at middle and higher latitudes to date. At McMurdo (77.84°S, 166.67°E), Zhao et al. reported that ~64% of all observed AGWs in the stratosphere (30-50 km) are propagating upward according to Fe Boltzmann lidar observations during 2011–2015, and the fractions of upward propagating gravity waves increase from summer ~59% to winter ~70% [
15]. At Norway (69.3°N, 16.0°E), Strelnikova et al. reported that 67.8% of all identified AGWs from Rayleigh lidar wind measurements are propagating upward in the stratosphere and mesosphere (30-80 km) [
30]. By analyzing MU radar measurement data, Gavrilov et al. found that the percentage of upward propagating AGWs is 49%–56% in the altitude range of 70–80 km [
31]; that is, almost one half of radar-observed AGWs are propagating downward in the upper mesosphere over Shigaraki (34.9°N, 139.4°E). For the observation results in the mesopause region (84–104 km), Hu et al. reported that 84.4% of all AGWs observed by Na Doppler lidar are propagating upward at the Starfire Optical Range (35°N, 106.5°E) [
13].
For the lidar observation results at Haikou (19.9°N, 110.3°E), as shown in
Table 1, 81.7% of all AGWs propagate upward in the middle atmosphere (30–65 km). Compared with the observation results above, this percentage is obviously greater than those obtained at Shigaraki (34.9°N, 139.4°E), Norway (69.3°N, 16.0°E), and McMurdo (77.84°S, 166.67°E), but it is similar to the proportion of upward-propagating waves observed in the mesopause region (84–104 km) over the Starfire Optical Range (35°N, 106.5°E). Moreover, in
Table 1, the values of
are 79.8% in spring, 82.1% in summer, 86.6% in autumn, and 74.8% in winter. This statistical result suggests that the proportion of upward-propagating AGWs reached a maximum in autumn and a minimum in winter, and it gradually increased from spring to autumn first and then drastically decreased from autumn to winter. This lidar-observed seasonal variation in AGW activities at Haikou (19.9°N, 110.3°E) is different from that obtained by Zhao et al. at McMurdo (77.84°S, 166.67°E), where the fractions of upward propagating AGWs increased reasonably from summer to winter [
15]. Therefore, the statistical features of AGW propagation directions in the middle atmosphere may also vary over a relatively wide range depending on the location and altitude, but a majority of AGWs propagate upward in the middle atmosphere.
There are a variety of AGW sources, such as wind flow over topography, deep convection, wind shears, jet streams, geostrophic adjustment, body forces created by wave dissipation, and wave‒wave interactions [
1]. Lidar-observed characteristics of AGW activities in the middle atmosphere should be closely related to the properties of significant wave sources that may exist in the different atmospheric layers. Based on numerous experimental observations and model simulations, it is accepted by most researchers that AGWs observed in the middle atmosphere by different instruments are mainly from sources in the troposphere and stratosphere below 20 km [
5,
9,
14]. For the quasi-monochromatic AGW event observed on 2 May 2011 (
Figure 4), persistent upward propagating AGWs were observed by lidar in the altitude range of 30–66 km, and it is not difficult to infer that their dominant sources should be located in the lower atmosphere. However, for the AGW event shown in
Figure 6, the waves mainly kept propagating downward at altitudes of 30–55 km for the whole lidar observation period, and their significant sources are probably located in the upper atmosphere. In fact, except for typical wave sources in the lower atmosphere (i.e., convection, wind shear instability, flow over topography, and geostrophic adjustment), AGWs can be generated by body forcing accompanying localized wave dissipation, auroral heating, and wave‒wave interactions in the upper atmosphere [
4,
9,
11,
32,
33,
34]. Therefore, these lidar-observed downward-propagating AGWs in the middle atmosphere may come from possible sources located in the upper atmosphere. Of course, waves reflecting at higher altitudes or propagating in atmospheric ducts can be possible occurrence mechanisms for lidar-observed downward-propagating AGW events in the middle atmosphere [
11,
35,
36].
For the AGW event shown in
Figure 8, two separate branches of wave perturbations were simultaneously observed by lidar in the altitude range of 30–60 km. Their wave structures are roughly symmetric at the centric altitude of ~46 km, and the power spectra analysis (
Figure 9) shows that these AGWs have similar vertical wavelengths and wave periods. Similar AGW events in the middle atmosphere (30-70 km) have been observed by Vadas et al. (their Figures 15 &18) at McMurdo (77.84°S, 166.67°E) [
32]. They reported that due to the perturbations from the simultaneous upward and downward propagating waves, the lidar-measured temperature perturbations presented fishbone structures, and the symmetric center was located in the vicinity of the stratopause (i.e.,
). Furthermore, the model simulations suggested that those simultaneous upward and downward propagating AGWs are probably secondary waves generated by body forcing at the altitude
, where the primary waves dissipate and deposit their momentum on spatial and temporal scales of the wave packet [
8,
32]. Therefore, considering the probable severe dissipations of AGWs in the vicinity of the stratopause, this lidar-observed AGW event over Haikou (19.9°N, 110.3°E) on 24 August 2011 may have the same occurrence mechanism, and the symmetric perturbation structures in
Figure 8(b) are possibly induced by the secondary waves generated by the dissipation of primary waves near the stratopause. However, in
Figure 8(b), the vertical propagation direction of the waves is downward above the centric altitude (~46 km) and upward below the centric altitude, which is opposite to the propagation directions of the secondary waves reported by Vadas et al. (their Figure 13) [
32]. Thus, instead of the secondary waves originating in the vicinity of the stratopause, the lidar-observed upward-propagating waves below ~46 km are probably from sources in the lower stratosphere, and the downward-propagating waves above ~46 km are possibly the results of the upward-propagating waves reflected from above. Furthermore, a case study of simultaneous upward and downward propagating AGW event in the mesopause region (80–105 km) was previously reported by Huang et al. based on Na wind/temperature lidar observations at Andes (30.3°S, 70.7°E) [
37]. The lidar observations show that the upward and the downward propagating AGWs have different vertical wavelengths, and the ray-tracing analysis preliminarily suggests that the lidar-observed simultaneously upward and downward propagating waves are separately generated by different sources. The upward-propagating waves (
) are likely to originate from stratospheric jet adjustments under 30 km, while the source of the downward-propagating waves (
) is located above the mesopause. Therefore, for these lidar-observed simultaneous upward and downward propagating AGW events in the middle atmosphere over Haikou (19.9°N, 110.3°E), there may exist different formation mechanisms, and detailed studies on AGW propagation processes are needed for further investigation. Certainly, as shown in
Table 1, simultaneous upward- and downward-propagating AGW events are observed by lidar on 68 nights during 2010-2022, corresponding to a percentage of only 8.2%. This finding suggests that such a special AGW phenomenon only occasionally occurs in the middle atmosphere over Haikou (19.9°N, 110.3°E).
5. Conclusions
A data analysis method was developed for the identification of AGW events in the middle atmosphere based on the lidar observation data. Wave parameters (i.e., vertical wavelength, observed wave period, and vertical propagation direction) can be precisely extracted by analyzing the power spectra of wave-induced temperature perturbations. This data analysis method was used to analyze the long-term Rayleigh lidar observations at Haikou (19.9°N, 110.3°E), and the statistical features of AGW activities in the low-latitude middle atmosphere (30–65 km) were investigated. In total, 827 quasi-monochromatic AGWs were identified from the lidar dataset obtained from May 2010 to August 2022, and the following statistical results were obtained.
1. The vertical wavelengths of the lidar-observed AGWs ranged from 3.5–14 km, with an annual mean value of 8.33 km. The observed wave period was distributed in the range of 2.6–14.1 hours, and its average value was 7.16 hours. The most common vertical wavelengths and wave periods were 6–11 km and 4–10 hours, respectively.
2. In total, 81.7% of all lidar-observed AGW events were associated with upward-propagating waves, showing that a majority of AGWs propagated upward in the middle atmosphere (30–65 km) over Haikou. The proportion of upward-propagating AGWs reached a maximum in autumn and a minimum in winter.
3. Sixty-eight AGW events associated with simultaneous upward and downward propagating waves were observed in the middle atmosphere over Haikou from May 2010 to August 2022, corresponding to a percentage of 8.2%.
Lidar observation results were compared with those previously reported at different locations, and it was concluded that statistical features of AGW activity in the low-latitude middle atmosphere may vary over a relatively wide range depending on location and altitude, but a majority of AGWs were propagating upward in the middle atmosphere. A surprising discovery was the simultaneous upward and downward propagating AGW events in the middle atmosphere, and multiple formation mechanisms could likely exist for these lidar-observed special phenomena. The Hainan lidar station is a mid-ocean observation site near the equator, and long-term lidar observations of AGW activities are helpful for researches on the energy and momentum coupling between the lower atmosphere and upper atmosphere. Moreover, these statistical results can enhance people’s understanding of the characteristics of AGW activities in the low-latitude middle atmosphere.
Author Contributions
Conceptualization, X.C. and J.X.; methodology, F.L., X.C., and S.G.; software, S.G. and Y.Z.; validation, S.G., Y.Z., and X.C.; formal analysis, S.G., Y.C., and Y.Y.; investigation, S.G., J.L., S.L., X.H., and X.Z.; resources, G.Y., Y.X., and J.J.; data curation, X.C., X.L., and F.L.; writing—original draft preparation, S.G.; writing—review and editing, S.G.; visualization, S.G.; supervision, J.X., X.C., and G.Y.; project administration, Y.W.; funding acquisition, S.G. and J.J. All authors have read and agreed to the published version of the manuscript.
Funding
This research was funded by the National Natural Science Foundation of China (42364012, 41864005 and 42004134), the Innovational Fund for Scientific and Technological Personnel of Hainan Province (S.G.), the Scientific Projects of Hainan Province (ZDYF2021GXJS040, S202211658010X, X202311658001X, X202311658002X), and Project Supported by the Specialized Research Fund for State Key Laboratories.
Data Availability Statement
Acknowledgments
We thank Chu Xinzhao for her fruitful discussions which have stimulated this work, and we acknowledge the use of data from the Chinese Meridian Project. The authors are thankful to the COSMIC team and SABER/TIMED team for the freely downloadable data.
Conflicts of Interest
The authors declare no conflict of interest.
References
- Fritts, D.C.; Alexander, M.J. Gravity wave dynamics and effects in the middle atmosphere. Rev. Geophys. 2003, 41, 1003. [CrossRef]
- Hines, C.O. Internal atmospheric gravity waves at ionospheric heights. Can. J. Phys. 1960, 38, 1441–1481. [CrossRef]
- Gardner, C.S.; Voelz D.G. Lidar studies of the nighttime sodium layer over Urbana, Illinois, 2. Gravity waves. J. Geophys. Res. 1987, 92(A5), 4673–4694. [CrossRef]
- Fritts, D.C.; Vadas, S.L.; Yamada, Y. An estimate of strong local body forcing and gravity wave radiation based on OH airglow and meteor radar observations. Geophys. Res. Lett. 2002, 29(10), 1429. [CrossRef]
- Gavrilov, N.M.; Jacobi, C. A study of seasonal variations of gravity wave intensity in the lower thermosphere using LF D1 wind observations and a numerical model. Ann. Geophys. 2004, 22, 35–45. [CrossRef]
- Alexander, M.J.; Geller, M.; McLandress, C.; Polavarapu, S.; Preusse, P.; Sassi, F.; et al. Recent developments in gravity-wave effects in climate models and the global distribution of gravity-wave momentum flux from observations and models. Q. J. ROY. METEOR. SOC. 2010, 136, 1103–1124. [CrossRef]
- Chen, C.; Chu, X. Two-dimensional Morlet wavelet transform and its application to wave recognition methodology of automatically extracting two-dimensional wave packets from lidar observations in Antarctica. J. Atmos. Sol. Terr. Phys. 2017, 162, 28–47. [CrossRef]
- Becker, E.; Vadas, S.L. Secondary gravity waves in the winter mesosphere: Results from a high-resolution global circulation model. J. Geophys. Res. Atmospheres 2018, 123(5), 2605–2627. [CrossRef]
- Li, Q.; Xu, J.; Liu, H.; Liu, X.; Yuan, W. How do gravity waves triggered by a typhoon propagate from the troposphere to the upper atmosphere? Atmos. Chem. Phys. 2022, 22, 12077–12091. [CrossRef]
- Gong, S.; Yang, G.; Xu, J.; Liu, X.; Li, Q. Gravity Wave Propagation from the Stratosphere into the Mesosphere Studied with Lidar, Meteor Radar, and TIMED/SABER. Atmosphere 2019. 10(2), 81. [CrossRef]
- Chu, X.; Gardner, C.S.; Li, X.; Lin, C.Y.-T. Vertical transport of sensible heat and meteoric Na by the complete temporal spectrum of gravity waves in the MLT above McMurdo (77.84°S, 166.67°E), Antarctica. J. Geophys. Res. Atmospheres 2022, 127, e2021JD035728. [CrossRef]
- Senft, D.C.; Gardner, C.S. Seasonal variability of gravity wave activity and spectra in the mesopause region at Urbana. J. Geophys. Res. 1991, 96, 17229–17264. [CrossRef]
- Hu, X.; Liu, A. Z.; Gardner, C.S.; Swenson, G.R. Characteristics of quasi-monochromatic gravity waves observed with Na lidar in the mesopause region at Starfire Optical Range, NM. Geophys. Res. Lett. 2002, 29(24), 221–224. [CrossRef]
- Gong, S.; Yang, G.; Dou, X.; Xu, J.; Chen, C.; Gong, S. Statistical study of atmospheric gravity waves in the mesopause region observed by a lidar chain in eastern China. J. Geophys. Res. Atmospheres 2015, 120, 7619–7634. [CrossRef]
- Zhao, J.; Chu, X.; Chen, C.; Lu, X.; Fong, W.; Yu, Z.; Michael Jones, R.; et al. Lidar observations of stratospheric gravity waves from 2011 to 2015 at McMurdo (77.84°S, 166.69°E), Antarctica: 1. Vertical wavelengths, periods, and frequency and vertical wave number spectra. J. Geophys. Res. Atmospheres 2017, 122, 5041–5062. [CrossRef]
- Chanin, M.L.; Hauchecorne, A. Lidar observation of gravity and tidal waves in the stratosphere and mesosphere. J. Geophys. Res. 1981, 86, C10: 9715–9721. [CrossRef]
- Takashi, S.; Terunobu, F.; Mitsuo, M. Density fluctuations in the middle atmosphere over Fukuoka observed by an XeF Rayleigh lidar. Geophys. Res. Lett. 1986, 13(11), 1121–1124. [CrossRef]
- McDonald, A. J.; Thomas, L.; Wareing, D.P. Night-to-night changes in the characteristics of gravity waves at stratospheric and lower-mesospheric heights. Ann. Geophys. 1998, 16(80), 229–237. [CrossRef]
- Beatty, T.J.; Hostetler, C.A.; Gardner, C.S. Lidar observations of gravity waves and their spectra near the mesopause and stratopause at Arecibo. J. Atmos. Sci. 1992, 49(6): 477–496. [CrossRef]
- Chane-Ming, F.; Molinaro, F.; Leveau, J.; Keckhut, P.; Hauchecorne A. Analysis of gravity waves in the tropical middle atmosphere over La Reunion Island. Ann. Geophys. 2000, 18, 485–498. [CrossRef]
- Sivakumar, V.; Rao, P.B.; Bencherif, H. Lidar observations of middle atmospheric gravity wave activity over a low-latitude site (Gadanki, 13.5°N, 79.2°E). Ann. Geophys. 2006, 24(3), 823–834. [CrossRef]
- Li, T.; Leblanc, T.; McDermid, I.S.; Wu, D.L.; Dou, X.; Wang, S. Seasonal and interannual variability of gravity wave activity revealed by long-term lidar observations over Mauna Loa Observatory, Hawaii. J. Geophys. Res. 2010, 115, D13103. [CrossRef]
- Wang, C. New chains of space weather monitoring stations in China. Space Weather 2010, 8, S08001. [CrossRef]
- Hauchecorne, A.; Chanin, M.L. Density and temperature profiles obtained by lidar between 35 km and 70 km. Geophys. Res. Lett. 1980, 7(8), 565–568. [CrossRef]
- Yang, G.; Clemesha, B.; Batista, P.; Simonich, D. Gravity wave parameters and their seasonal variations derived from Na lidar observations at 23°S. J. Geophys. Res. 2006, 111, D21107. [CrossRef]
- Alpers, M.; Eixmann, R.; Fricke-Begemann, C.; Gerding, M.; Höffner, J. Temperature lidar measurements from 1 to 105 km altitude using resonance, Rayleigh, and Rotational Raman scattering. Atmos. Chem. Phys. 2004, 4, 793–800. [CrossRef]
- Dörnbrack, A.; Gisinger, S.; Kaifler, B. On the interpretation of gravity wave measurements by ground-based lidars. Atmosphere, 2017, 8(3), 49. [CrossRef]
- Gardner, C.S. Diffusive filtering theory of gravity wave spectra in the atmosphere. J. Geophys. Res. 1994, 99, 20601–20622. [CrossRef]
- Medeiros, A.M.; Taylor, M.J.; Takahashi, H.; Batista, P.P.; Gobbi, D. An investigation of gravity wave activity in the low-latitude upper mesosphere: Propagation direction and wind filtering. J. Geophys. Res. 2003, 108(D14), 4411. [CrossRef]
- Strelnikova, I.; Baumgarten, G.; Lübken, F.-J. Advanced hodograph-based analysis technique to derive gravity-wave parameters from lidar observations. Atmos. Meas. Tech. 2020, 13(2), 479–499. [CrossRef]
- Gavrilov, N.M.; Fukao, S.; Nakamura, T.; Tsuda, T.; Yamanaka, M.D.; Yamamoto, M. Statistical analysis of gravity waves observed with the middle and upper atmosphere radar in the middle atmosphere: 1. Method and general characteristics. J. Geophys. Res. 1996, 101(D23), 29511–29521. [CrossRef]
- Vadas, S.L.; Zhao, J.; Chu, X.; Becker, E. The excitation of secondary gravity waves from local body forces: Theory and observation. J. Geophys. Res. Atmospheres 2018, 123, 9296–9325. [CrossRef]
- Sofko, G. J.; Huang, C.S. SuperDARN observations of medium-scale gravity wave pairs generated by Joule heating in the auroral zone. Geophys. Res. Lett. 2000, 27, 485–488. [CrossRef]
- Huang, K.; Zhang, S.; Yi, F.; Huang, C.; Gan, Q.; Gong, Y.; Zhang, Y. Third-order resonant interaction of atmospheric gravity waves. J. Geophys. Res. Atmospheres 2013, 118, 2197–2206. [CrossRef]
- Yu, Y.; Hickey, M.P. Numerical modeling of a gravity wave packet ducted by the thermal structure of the atmosphere. J. Geophys. Res 2007, 112(A6), A06308. [CrossRef]
- Walterscheid, R.L.; Hickey, M.P. Gravity wave ducting in the upper mesosphere and lower thermosphere duct system. J. Geophys. Res. 2009, 114(D19), D19109. [CrossRef]
- Huang, K.M.; Liu, A.Z.; Zhang, S.D.; Yi, F.; Huang, C.M.; Gong, Y.; et al. Simultaneous upward and downward propagating inertia-gravity waves in the MLT observed at Andes Lidar Observatory. J. Geophys. Res. Atmospheres 2017, 122, 2812–2830. [CrossRef]
Figure 1.
Histogram plot of lidar observing nights and observing hours in different months during 2010–2022.
Figure 1.
Histogram plot of lidar observing nights and observing hours in different months during 2010–2022.
Figure 2.
Data analysis flowchart designed for the identification of lidar-observed atmospheric gravity wave events in the middle atmosphere.
Figure 2.
Data analysis flowchart designed for the identification of lidar-observed atmospheric gravity wave events in the middle atmosphere.
Figure 3.
Lidar observation results at Haikou (19.9°N, 110.3°E) at night on 2 May 2011. (a) Temperature structure evolution in the middle atmosphere, and (b) comparisons with the simultaneous measurements from COSMIC and SABER/TIMED. The horizontal error bars represent standard deviations of the lidar-measured temperature.
Figure 4.
Lidar-observed relative temperature perturbation in the middle atmosphere over Haikou (19.9°N, 110.3°E) at night on 2 May 2011.
Figure 4.
Lidar-observed relative temperature perturbation in the middle atmosphere over Haikou (19.9°N, 110.3°E) at night on 2 May 2011.
Figure 5.
Power spectra of AGW perturbations on 2 May 2011. (a) Vertical wavenumber spectrum and (b) temporal frequency spectrum.
Figure 5.
Power spectra of AGW perturbations on 2 May 2011. (a) Vertical wavenumber spectrum and (b) temporal frequency spectrum.
Figure 6.
Lidar-observed AGW event at night on 8 August 2020. (a) Atmospheric temperature structure and (b) the relative temperature perturbation in the middle atmosphere.
Figure 6.
Lidar-observed AGW event at night on 8 August 2020. (a) Atmospheric temperature structure and (b) the relative temperature perturbation in the middle atmosphere.
Figure 7.
Power spectra of AGW perturbations on 8 August 2020. (a) Vertical wavenumber spectrum and (b) temporal frequency spectrum.
Figure 7.
Power spectra of AGW perturbations on 8 August 2020. (a) Vertical wavenumber spectrum and (b) temporal frequency spectrum.
Figure 8.
Lidar-observed AGW event at night on 24 August 2011. (a) Atmospheric temperature structure and (b) the relative temperature perturbation in the middle atmosphere.
Figure 8.
Lidar-observed AGW event at night on 24 August 2011. (a) Atmospheric temperature structure and (b) the relative temperature perturbation in the middle atmosphere.
Figure 9.
Power spectra of AGW perturbations on 24 August 2011. (a) Vertical wavenumber spectrum below 46 km, (b) temporal frequency spectrum below 46 km, (c) vertical wavenumber spectrum above 46 km, and (d) temporal frequency spectrum above 46 km.
Figure 9.
Power spectra of AGW perturbations on 24 August 2011. (a) Vertical wavenumber spectrum below 46 km, (b) temporal frequency spectrum below 46 km, (c) vertical wavenumber spectrum above 46 km, and (d) temporal frequency spectrum above 46 km.
Figure 10.
Vertical wavelengths and observed wave periods of lidar-observed AGWs in the middle atmosphere over Haikou (19.9°N, 110.3°E) during 2010–2022.
Figure 10.
Vertical wavelengths and observed wave periods of lidar-observed AGWs in the middle atmosphere over Haikou (19.9°N, 110.3°E) during 2010–2022.
Figure 11.
Histograms of the AGW parameter values. (a) Vertical wavelength and (b) observed wave period.
Figure 11.
Histograms of the AGW parameter values. (a) Vertical wavelength and (b) observed wave period.
Table 1.
Statistics on the wave propagation direction for the lidar-observed AGWs in the middle atmosphere over Haikou (19.9°N, 110.3°E) during 2010–2022.
Table 1.
Statistics on the wave propagation direction for the lidar-observed AGWs in the middle atmosphere over Haikou (19.9°N, 110.3°E) during 2010–2022.
| |
|
|
|
|
|
|
|
| Total |
827 |
676 |
151 |
68 |
81.7% |
18.3% |
8.2% |
| Spring |
203 |
162 |
41 |
15 |
79.8% |
20.2% |
7.4% |
| Summer |
235 |
193 |
42 |
16 |
82.1% |
17.9% |
6.8% |
| Autumn |
254 |
220 |
34 |
21 |
86.6% |
13.4% |
8.3% |
| Winter |
135 |
101 |
34 |
16 |
74.8% |
25.2% |
11.9% |
Table 2.
Statistical features of the AGW activities in the middle atmosphere observed by lidar at low latitudes.
Table 2.
Statistical features of the AGW activities in the middle atmosphere observed by lidar at low latitudes.
| References |
Locations |
Instruments |
Experimental data |
Altitude range |
Vertical wavelength |
Observed wave period |
| Beatty et al. (1992) |
Arecibo (18°N, 67°W) |
Rayleigh/Na lidar |
January, March, April 1989
(160 hours) |
22-55 km |
2.8-17 km
(4-8 km) |
104 min - 65 h
(100-300 min) |
| 80-105 km |
1.1-12.8 km
(2-6 km) |
5 min - 18 h
(10-100 min) |
Chane-Ming et al.
(2000) |
Reunion Island
(21°S, 55°E) |
Rayleigh lidar |
May-November 1994
(15 nights) |
30-60 km |
2-10 km |
2-14 hours |
Sivakumar et al.
(2006) |
Gadanki
(13.5°N, 79.2°E) |
Rayleigh lidar |
March 1998 - December 2002
(310 nights) |
30-70 km |
5-38 km |
20 min - 4.5 h |
Li et al.
(2010) |
Hawaii
(19.5°N, 155.6°E) |
Rayleigh lidar |
January 1997 - June 2007
(10.5 years) |
35-50 km
48-63 km |
0.6-15 km |
|
Gong et al.
(this study) |
Haikou
(19.9°N, 110.3°E) |
Rayleigh lidar |
May 2010 - August 2022
(12.3 years) |
30-65 km |
3.5-14 km
(6-11 km) |
2.6-14.1 h
(4-10 h) |
Gong et al.
(2015) |
Haikou
(19.9°N, 110.3°E) |
Na lidar |
May 2010 - April 2012
(3 years) |
80-105 km |
1.85-10.78 km
(2-4 km) |
1.03-13.88 h
(1-4 h) |
|
Disclaimer/Publisher’s Note: The statements, opinions and data contained in all publications are solely those of the individual author(s) and contributor(s) and not of MDPI and/or the editor(s). MDPI and/or the editor(s) disclaim responsibility for any injury to people or property resulting from any ideas, methods, instructions or products referred to in the content. |
© 2024 by the authors. Licensee MDPI, Basel, Switzerland. This article is an open access article distributed under the terms and conditions of the Creative Commons Attribution (CC BY) license (http://creativecommons.org/licenses/by/4.0/).
