
Submitted:
08 January 2024
Posted:
11 January 2024
Read the latest preprint version here
Abstract
This research investigates the exposure of plant species to extreme drought events in the Brazilian Atlantic Forest, employing an extensive dataset collected from 205 automatic weather stations across the region. Meteorological indicators derived from hourly data, encompassing precipitation, maximum and minimum air temperature, were utilized to quantify past, current, and future drought conditions. The dataset, comprising 10,299,236 data points, spans a substantial temporal window and exhibits a modest percentage of missing data. Missing data were excluded from analysis, aligning with the decision to refrain from imputation methods due to potential bias. Drought quantification involved the computation of the Aridity Index, the analysis of consecutive hours without precipitation, and the classification of wet and dry days per month. Mann-Kendall trend analysis was applied to assess trends in evapotranspiration and maximum air temperature, considering their significance. The hazard assessment, incorporating environmental factors influencing tree growth dynamics, facilitated the ranking of meteorological indicators to identify regions most exposed to drought events. The results revealed consistent occurrences of extreme rainfall events, indicated by positive outliers in monthly precipitation values. However, significant trends were observed, including an increase in daily maximum temperature and consecutive hours without precipitation, coupled with a decrease in daily precipitation across the Brazilian Atlantic Forest. No significant correlation between vulnerability ranks and weather station latitudes and elevation were found, suggesting geographical location and elevation does not strongly influence observed dryness trends.
Keywords:
Brazilian Atlantic forest
; drought exposure
; dryness
1. Introduction
The Brazilian Atlantic Forest, once sprawling across 150 million hectares and dominating the country’s coastal regions, has undergone significant transformations over the centuries. Originally contiguous, the forest has evolved into fragmented patches, especially along the Brazilian coast, due to historical land use changes and urban expansion [13]. This fragmentation, particularly noticeable in smaller fragments of less than 50 hectares, has placed a substantial portion of the forest’s diverse biodiversity at risk of extinction [14,15,16]. Fragmented landscapes often experience edge effects driven by abiotic factors like water, wind, and temperature, pushing plant communities toward early successional stages [17,18,19,20].
As one of the planet’s most biodiverse ecosystems, the Brazilian Atlantic Forest faces escalating threats, with climate change posing a formidable challenge. The biome’s intricate web of life and ecological significance is now confronted with shifting aridity patterns, exacerbated by habitat fragmentation and ecological succession processes [1]. Recent ecological shifts in the Atlantic Forest have intensified, contributing to increased aridity and prompting concerns about the separation of Amazonian and Atlantic Forest lineages in Brazil [2].
Amidst these ecological transformations, environmental variables, particularly precipitation, play a pivotal role in shaping the vitality of the Atlantic Forest. Anthropogenic pressures and climate change effects loom large, and long-term forecasts signal a concerning decline in precipitation levels [3]. Such changes could significantly impact the delicate balance of this vulnerable ecosystem [4,5]. This study, conducted between 2000 and 2022, seeks to delve into the repercussions of evolving aridity patterns on the Brazilian Atlantic Forest.
This study focuses on meteorological indicators to unveil nuanced trends and pinpoint regions undergoing substantial alterations in aridity conditions. By scrutinizing the impact of changing climate patterns on the Atlantic Forest, this research aims to contribute valuable insights into the ecological dynamics of this biome. Subsequent sections provide a description of the methodology, data, and outcomes, shedding light on the complex relationship between climate variability and the status of the Brazilian Atlantic Forest.
2. Materials and Methods
We adopted the boundaries of the Brazilian Atlantic forest to be congruent with those delineated for the Atlantic forest biome by the Instituto Brasileiro de Geografia e Estatística (IBGE). The definition of the Atlantic forest biome by IBGE was based on an extensive process involving literature review, interinstitutional validation, and field surveys to verify the presence of the physical-biotic environment and historical evidence of the Atlantic forest within the demarcated boundaries [6]. These boundaries were sourced from TerraBrasilis, a platform managed by the Instituto Nacional de Pesquisas Espaciais (INPE), which facilitates data organization, accessibility, and utilization for Brazil’s environmental monitoring efforts.
To assess the exposure of plant species to extreme drought events in the Brazilian Atlantic forest, we relied on meteorological indicators. These indicators were derived from hourly data of precipitation, maximum and minimum air temperature recorded at 205 automatic weather stations, accessible from the Instituto Nacional de Meteorologia (INMET) database [https://bdmep.inmet.gov.br, accessed in August 2023]. An overview of these datasets, including station codes, sample sizes, monitoring periods, and the percentage of missing data, is provided in the supplementary materials. The geographic distribution of the 205 automatic weather stations as well as the boundaries for the Atlantic forest used in this study are presented in Figure 1. This dataset stands as an extensive and robust compilation, with a total of 10,299,236 data points. Spanning a broad temporal window, from distinct station-specific start dates to a standardized endpoint on December 31, 2022, the dataset exhibits a relatively modest percentage of missing data.
Past, current, and future drought conditions were quantified using several meteorological indicators, including the number of consecutive hours without precipitation, the number of dry and wet days per month, the Aridity Index, and the Mann-Kendall test statistic (Z) for trend analysis in evapotranspiration (ET) and maximum air temperature (). The choice of these indicators was motivated by their relevance to recent severe drought events [11]. We opted against employing imputation methods to replace missing data, as this approach can introduce systematic bias into the meteorological indicators [7,8]. Consequently, all missing data were excluded from the analysis, and the accumulated or averaged values resulting from any missing hourly data from the 205 automatic weather stations were disregarded.
The Aridity Index was computed as the ratio of monthly precipitation to evapotranspiration. Monthly precipitation values were determined by aggregating the available hourly precipitation data, while monthly evapotranspiration values were calculated by aggregating daily reference crop evapotranspiration estimates. These daily estimates were generated using the Hargreaves and Samani equation [9], with input data encompassing measured hourly maximum and minimum air temperatures, elevation, and latitude.
The classification of wet and dry days per month was performed using a precipitation threshold of 0 mm per weather station. Days with precisely 0 mm of precipitation were categorized as dry, while those with precipitation exceeding 0 mm were classified as wet. Subsequently, the median values for the number of wet and dry days per month were employed as meteorological indicators to gauge drought exposure.
To determine the duration of consecutive hours without precipitation, we analyzed sequences of hours with no recorded precipitation. In instances of missing data within a sequence, we adopted a conservative approach by considering two distinct sequences. This approach was necessary as missing data could inadvertently elongate the periods to be without precipitation.
Mann-Kendall (MK) trend analysis was employed to examine the daily evapotranspiration estimates and maximum air temperature data at each weather station. A trend was considered statistically significant when the associated p-value was less than 0.05. The MK test statistics, Z and S, were used to assess both the presence and the strength of a monotonic upward or downward trend in daily evapotranspiration and maximum air temperature. The MK test statistic Z was further utilized as an indicator for evaluating potential future drought exposure.
Lastly, we conducted a hazard assessment by ranking the meteorological indicators calculated for each weather station, which allowed us to identify the regions most exposed to drought events. This hazard assessment was developed, taking into consideration environmental factors that influence tree growth dynamics in the Brazilian Atlantic forest under drought conditions [10], as well as the amount of data available after the data filtering process for missing data.
3. Results and Discussion
We used boxplots to visualize the distribution of accumulated monthly precipitation for all 205 automatic weather stations in the Brazilian Atlantic forest. They provide range, median, and distribution of values at each weather station during their monitoring period. The boxplots are presented in Figure 2. Figure 2 reveals the presence of positive outliers across most of the weather stations, which indicates instances of extreme rainfall events. These events are characterized by precipitation values significantly higher than the majority of the data points. The consistent occurrence of positive outliers across various weather stations implies that extreme rainfall events are a recurring phenomenon in the Brazilian Atlantic forest.
The Mann-Kendall (MK) test assessed the presence and strength of monotonic trends in the time series data. We assumed that trends were statistically significant when the p-value was less than 0.05. The results of the MK trend analysis are summarized in Figure 3. A substantial majority of the 205 weather stations exhibited a statistically significant upward trend in daily maximum temperature and number of hours without precipitation. In contrast, the majority of daily precipitation exhibited a statistically significant downward trend. Unlike the unidirectional trend observed in daily maximum temperature or daily precipitation, daily minimum temperature and daily evapotranspiration presented a spectrum of behaviors, including instances of no discernible, upward and downward trends. Despite the varied outcomes in the analysis of daily minimum temperature and daily evapotranspiration, the overarching findings of the MK test indicated an overall reduction in daily precipitation and an increase in both maximum daily temperature and number of consecutive hours without precipitation across the Brazilian Atlantic forest. This suggests a scenario in which the ecosystem may encounter drier conditions in the future.
It is noteworthy that aridity conditions, reflective of short-term extremes, could not be adequately captured through statistics based on monthly values of precipitation, evapotranspiration or even AI. As we evaluated hourly data for maximum temperature and consecutive hours without precipitation reveals that a significant portion of the Brazilian Atlantic forest is already undergoing dry conditions.
In an attempt of establishing a vulnerability ranking, the outcomes of the meteorological indicators were synthesized and organized in Table 1. The ranking reflects the ascending order of vulnerability, delineating the weather stations in terms of their susceptibility to drought events within the Brazilian Atlantic Forest. There is no significant correlation between the assigned rank numbers and the latitudinal positions and elevation of the weather stations (Figure 4. This observation suggests that neither geographical location, as represented by latitude, nor elevation play a significant role in influencing the trends of dryness observed at each weather station.
4. Conclusions
The findings of this study provide significant insights into the spatial-temporal dynamics of drought in the Brazilian Atlantic forest ecosystem. The consistent occurrence of extreme monthly precipitation values across various weather stations suggests that they are a recurring phenomenon in the Brazilian Atlantic forest. However, in spite of the regular incidence of extreme monthly precipitation, the findings from the Mann-Kendall (MK) test demonstrate a prevailing decrease in daily precipitation alongside an elevation in both maximum daily temperature and the duration of consecutive hours without precipitation throughout the Brazilian Atlantic Forest. Additionally, the vulnerability ranking synthesized from the outcomes of the meteorological indicators does not show a significant correlation with the latitudinal positions and elevation of the weather stations, which implies that geographical location and elevation do not significantly influence the trends of dryness observed at each weather station. This observed trend hints at a prospective scenario wherein the ecosystem is likely to face drier conditions, all the while maintaining a consistent range in monthly precipitation values. It aligns with the research conducted by [12], which also highlighted the vulnerabilities of the Brazilian Atlantic forest to climate change.
Author Contributions
Conceptualization, Chaves, M.B., Rivera, C. and Farias Pereira, F.; methodology, Rivera, C. and Farias Pereira, F.; formal analysis, Chaves, M.B., Cavalcante, N. and Farias Pereira, F.; investigation, Chaves, M.B., Cavalcante, N. and Farias Pereira, F.; writing—original draft preparation, Chaves, M.B. and Farias Pereira, F.; writing—review and editing, Chaves, M.B., Rivera, C. and Farias Pereira, F.; visualization, Chaves, M.B.; funding acquisition, Farias Pereira, F. All authors have read and agreed to the published version of the manuscript.
Funding
We are grateful to Fundação de Amparo à Pesquisa do Estado de Alagoas (FAPEAL) for the travel grant offered to the authors through ERC – Fapeal/Confap/CNPq 2022 Call – Research opportunities in Europe for active PhD researchers from Brazil, which could enrich the work by presenting its bottom line and discussing its outcomes with researchers and peers from all over the world in seminars at Lund University, Sweden.
Conflicts of Interest
The authors declare no conflict of interest.
References
- Brito, M., Lion, M., Oliveira, I. & Cardoso, M. Butterflies on the dry edge of the Atlantic Forest: water availability determines community structure at the Northern limit of Atlantic Forest. Insect Conservation And Diversity. 14, 476-491 (2021,7). [CrossRef]
- Thode, V., Sanmartín, I. & Lohmann, L. Contrasting patterns of diversification between Amazonian and Atlantic forest clades of Neotropical lianas (Amphilophium, Bignonieae) inferred from plastid genomic data. Molecular Phylogenetics And Evolution. 133 pp. 92-106 (2019,4). [CrossRef]
- Torres, C., Medina-Vega, J., Rocha, S., Silva Costa, W., Soares, C., Souza, A., Jacovine, L., Lana, J. & Peña-Claros, M. Drivers of tree demographic processes in forest fragments of the Brazilian Atlantic forest. Forest Ecology And Management. 534 (2023,4). [CrossRef]
- Bellard, C., Leclerc, C., Leroy, B., Bakkenes, M., Veloz, S., Thuiller, W. & Courchamp, F. Vulnerability of biodiversity hotspots to global change. Global Ecology And Biogeography. 23, 1376-1386 (2014,12). [CrossRef]
- Neves, D., Dexter, K., Pennington, R., Valente, A., Bueno, M., Eisenlohr, P., Fontes, M., Miranda, P., Moreira, S., Rezende, V., Saiter, F. & Oliveira-Filho, A. Dissecting a biodiversity hotspot: The importance of environmentally marginal habitats in the Atlantic Forest Domain of South America. Diversity And Distributions. 23, 898-909 (2017,8). [CrossRef]
- IBGE. Biomas e sistema costeiro-marinho do Brasil : compatível com a escala 1:250 000 / IBGE, Coordenação de Recursos Naturais e Estudos Ambientais. Rio de Janeiro, Brazil. Relatórios metodológicos. 45, 168 p., (2019).
- Vekuri, H., Tuovinen, JP., Kulmala, L., Kulmala, L., Papale, D., Kolari, P., Aurela, M., Laurila, T., Liski, J., Lohila, A. A widely-used eddy covariance gap-filling method creates systematic bias in carbon balance estimates. Scientific Reports. 13, article number: 1720, (2023). [CrossRef]
- Beguería, S., Tomas-Burguera, M., Serrano-Notivoli, R., Peña-Angulo, D., Vicente-Serrano, S. M., González-Hidalgo, J.-C. Gap filling of monthly temperature data and its effect on climatic variability and trends. Journal of Climate, 32(22), pp. 7797–7821. (2019). https://www.jstor.org/stable/26831795.
- Hargreaves, G.H., Samani, Z.A., Reference crop evapotranspiration from temperature. Applied Engineering in Agriculture, 1(2), pp. 96-99. (1985).
- Venegas-González, A., Roig, F. A., Lisi, C. S., Albiero- Junior, A., Alvares, C. A., Tomazello-Filho, M., Drought and climate change incidence on hotspot Cedrela forests from the Mata Atlântica biome in southeastern Brazil. Global Ecology and Conservation, 15, pp. e00408. (2018). [CrossRef]
- Barzkar, A., Najafzadeh, M., Homaei, F., Evaluation of drought events in various climatic conditions using data-driven models and a reliability-based probabilistic model. Natural Hazards, 110, pp. 1931-1952. (2022). [CrossRef]
- Scarano, F.R., Ceotto, P., Brazilian Atlantic forest: impact, vulnerability, and adaptation to climate change. Biodiversity Conservation, 24, pp. 2319–2331 (2015). [CrossRef]
- Stevens, P.O. Dinâmica da paisagem no geossistema do estuário do Rio Paraiba - Extremo Oriental das Américas: estimativas de perdas de habitat e cenários de recuperação da biodiversidade. Universidade Federal da Paraíba, Master thesis. (2014).
- Parker III, T.A., Stotz, D.F., Fitzpatrick, J.W., Ecological and distributional databases. In: Stotz, D.F., Fitzpatrick, J.W., Parker, T.A., III, Moskovits, D.K. (Eds.), Neotropical Birds: Ecology and Conservation. University of Chicago Press, Illinois, pp. 131–146. (1996).
- Stotz, D.F., Fitzpatrick, J.W., Parker, T.A., Moskovitz, D.K., Neotropical Birds: Ecology and Conservation. Univ. Chicago Press, Chicago. (1996).
- Goerck, J.M., Patterns of rarity in the birds of the Atlantic Forest of Brazil. Conservation Biology 11, pp. 112–118. (1997). [CrossRef]
- Santos, B.A., Peres, C.A., Oliveira, M.A., Grillo A., Alves-Costa, C.P., Tabarelli, M., Drastic erosion in functional attributes of tree assemblages in Atlantic forest fragments of northeastern Brazil. Biology Conservation, 141, pp. 249-260, (2008). [CrossRef]
- Tabarelli, M., Lopes, A.V., Peres, C.A. Edge-effects drive tropical forest fragments towards an early-successional system. Biotropica, 40, pp. 657-661, (2008). [CrossRef]
- Favaretto, V.F., Martinez, C.A., Soriani, H.H., Furriel, R.P.M., Differential responses of antioxidant enzymes in pioneer and late-successional tropical tree species grown under sun and shade conditions. Environmental and Experimental Botany, 70, pp. 20–28, (2011). [CrossRef]
- Valladares, F., Niinemets, U. Shade tolerance, a key plant feature of complex nature and consequences. Annual Review of Ecology, Evolution, and Systematics, 39, pp. 237–257, (2008). [CrossRef]
Figure 1.
Weather stations localization
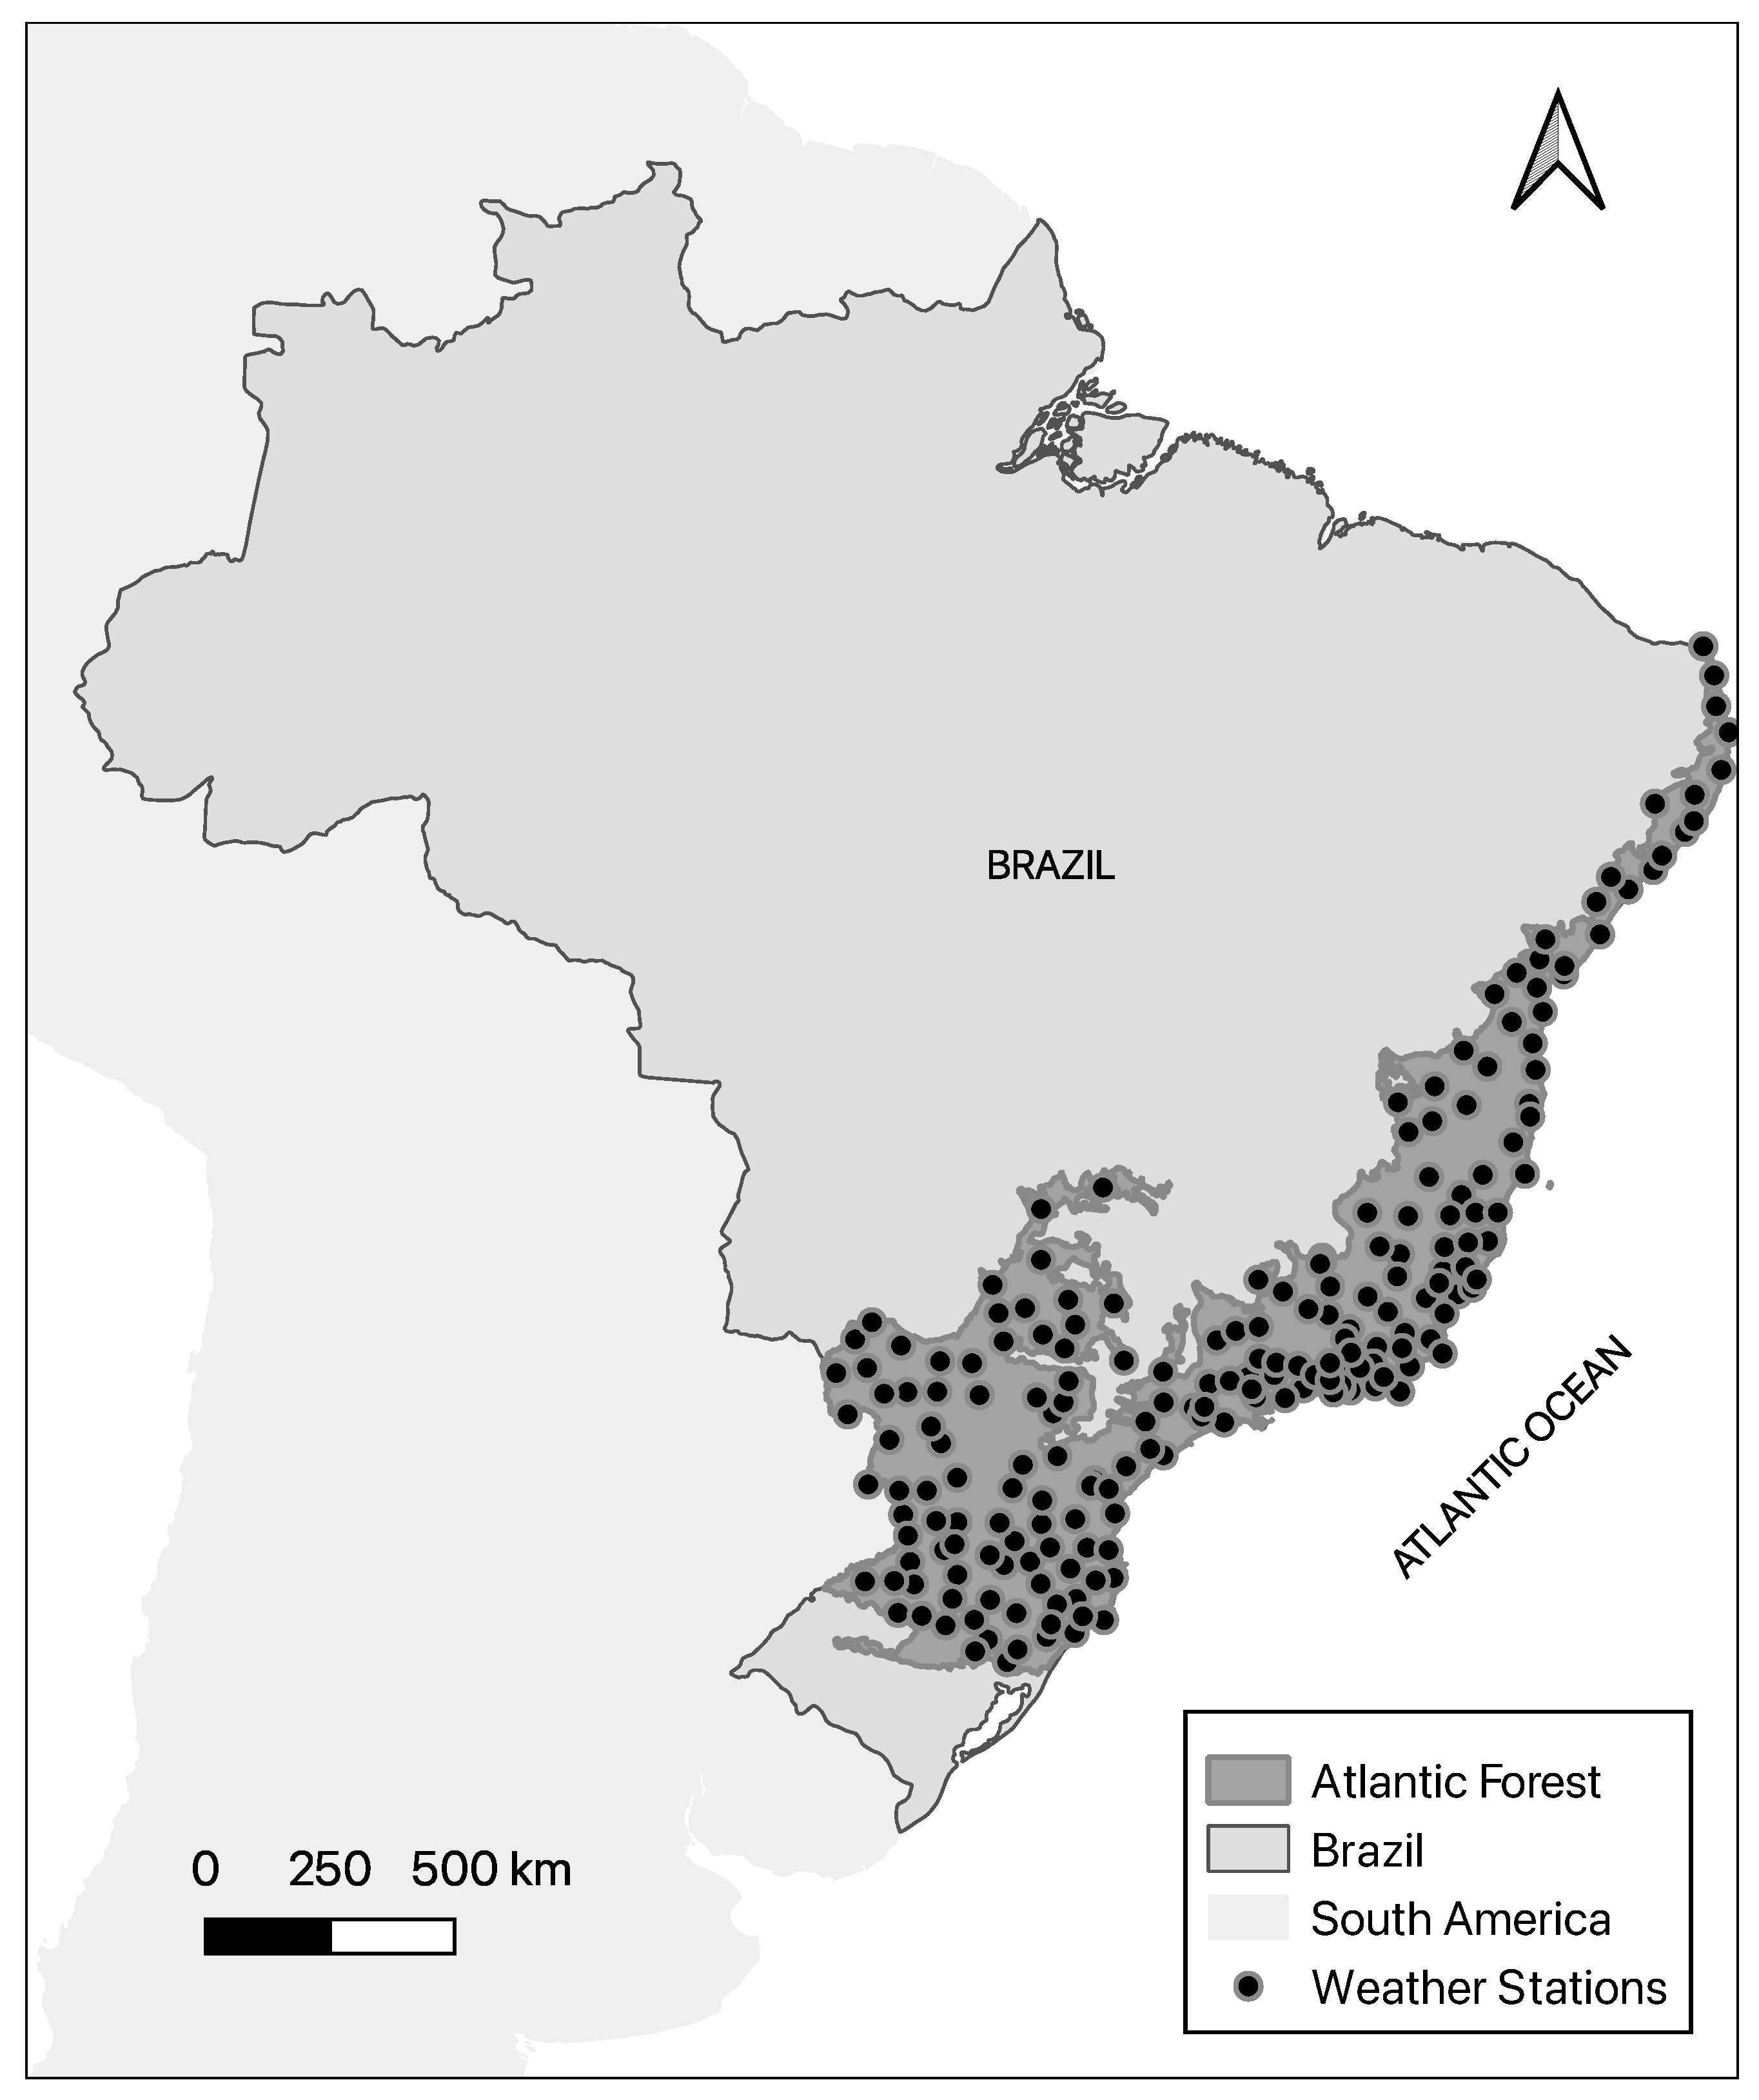
Figure 2.
Boxplots of accumulated monthly precipitation for all 205 automatic weather stations in the Brazilian Atlantic forest.
Figure 2.
Boxplots of accumulated monthly precipitation for all 205 automatic weather stations in the Brazilian Atlantic forest.
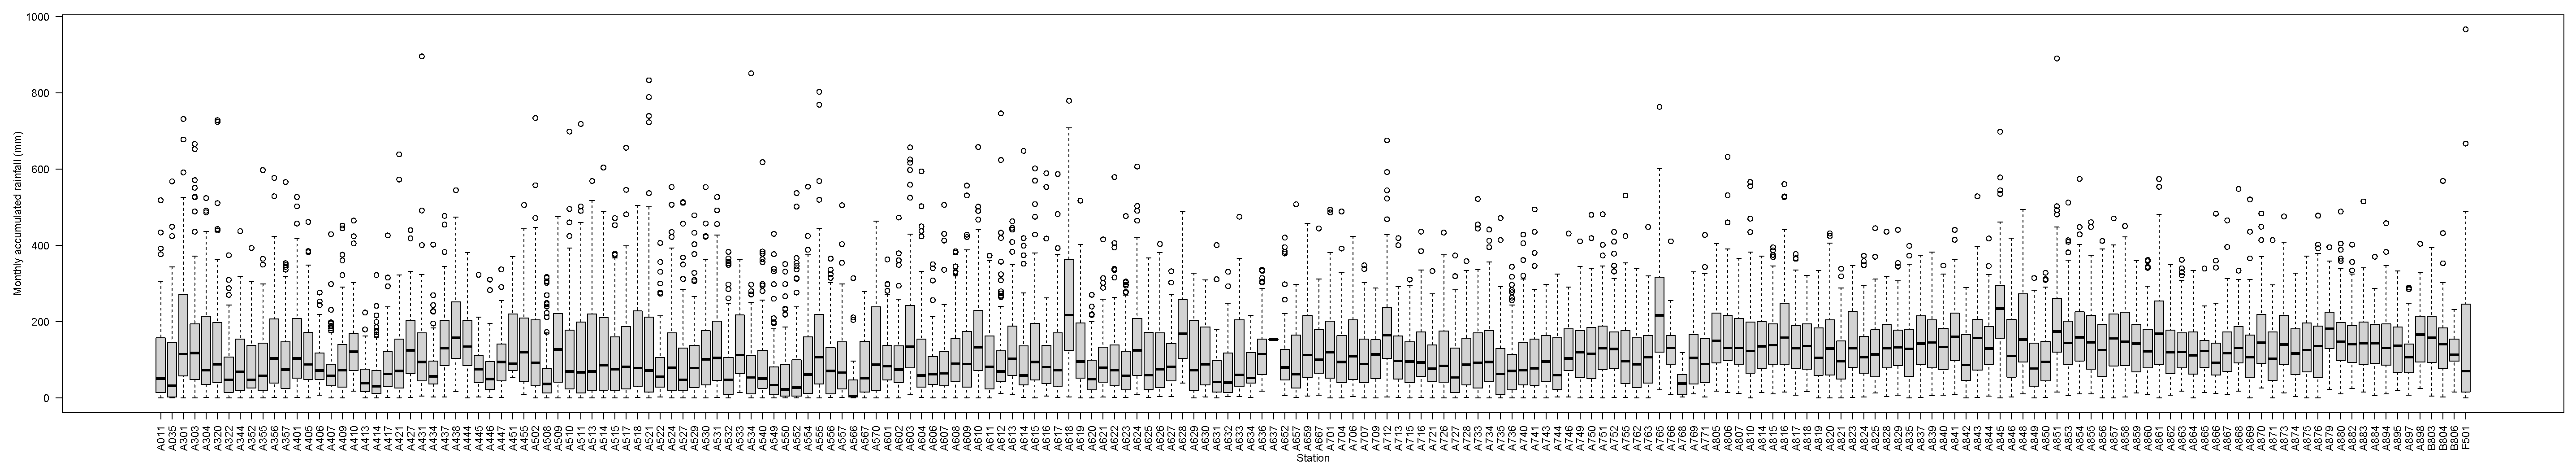
Figure 3.
Spatial distribution of detected trend in minimum air temperature, maximum air temperature, aridity index, evapotranspiration, precipitation, and consecutive hours without precipitation by weather station.
Figure 3.
Spatial distribution of detected trend in minimum air temperature, maximum air temperature, aridity index, evapotranspiration, precipitation, and consecutive hours without precipitation by weather station.
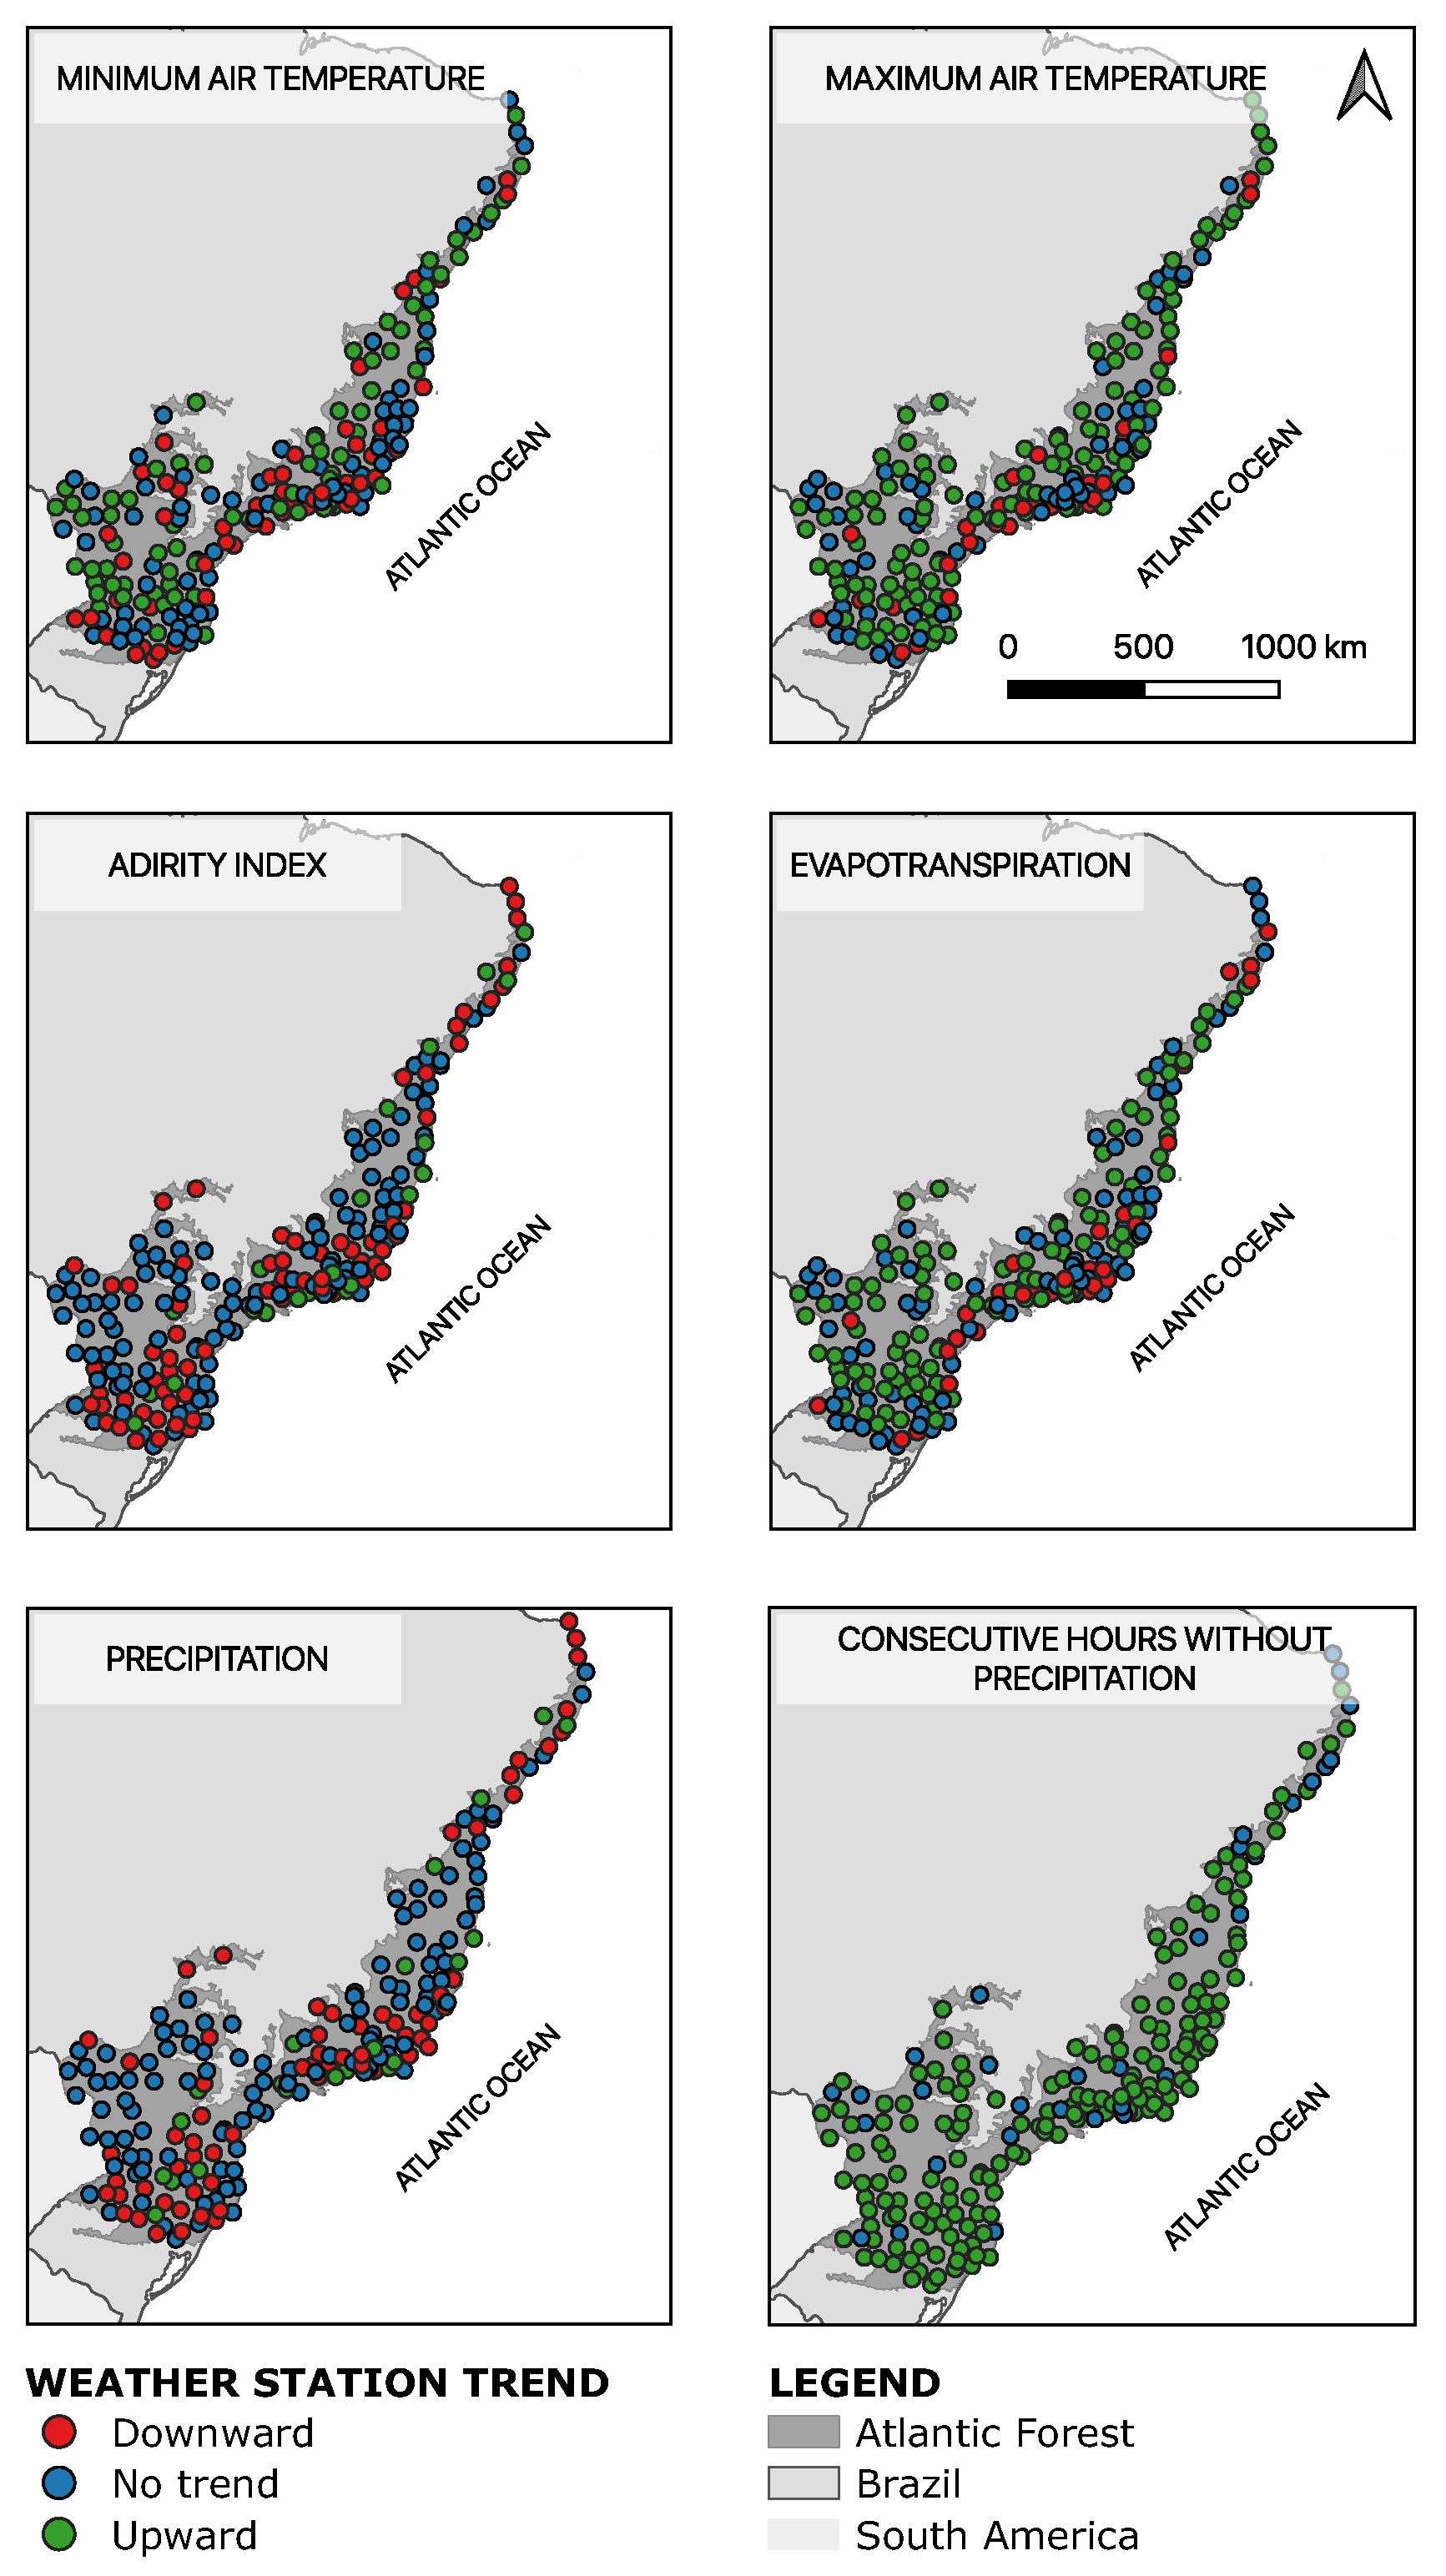
Figure 4.
Scatter plots illustrating the relationship between latitude and elevation against the order of the weather station in the ranking of vulnerability to drought events. The black solid line represents the linear regression model fitted to the data.
Figure 4.
Scatter plots illustrating the relationship between latitude and elevation against the order of the weather station in the ranking of vulnerability to drought events. The black solid line represents the linear regression model fitted to the data.
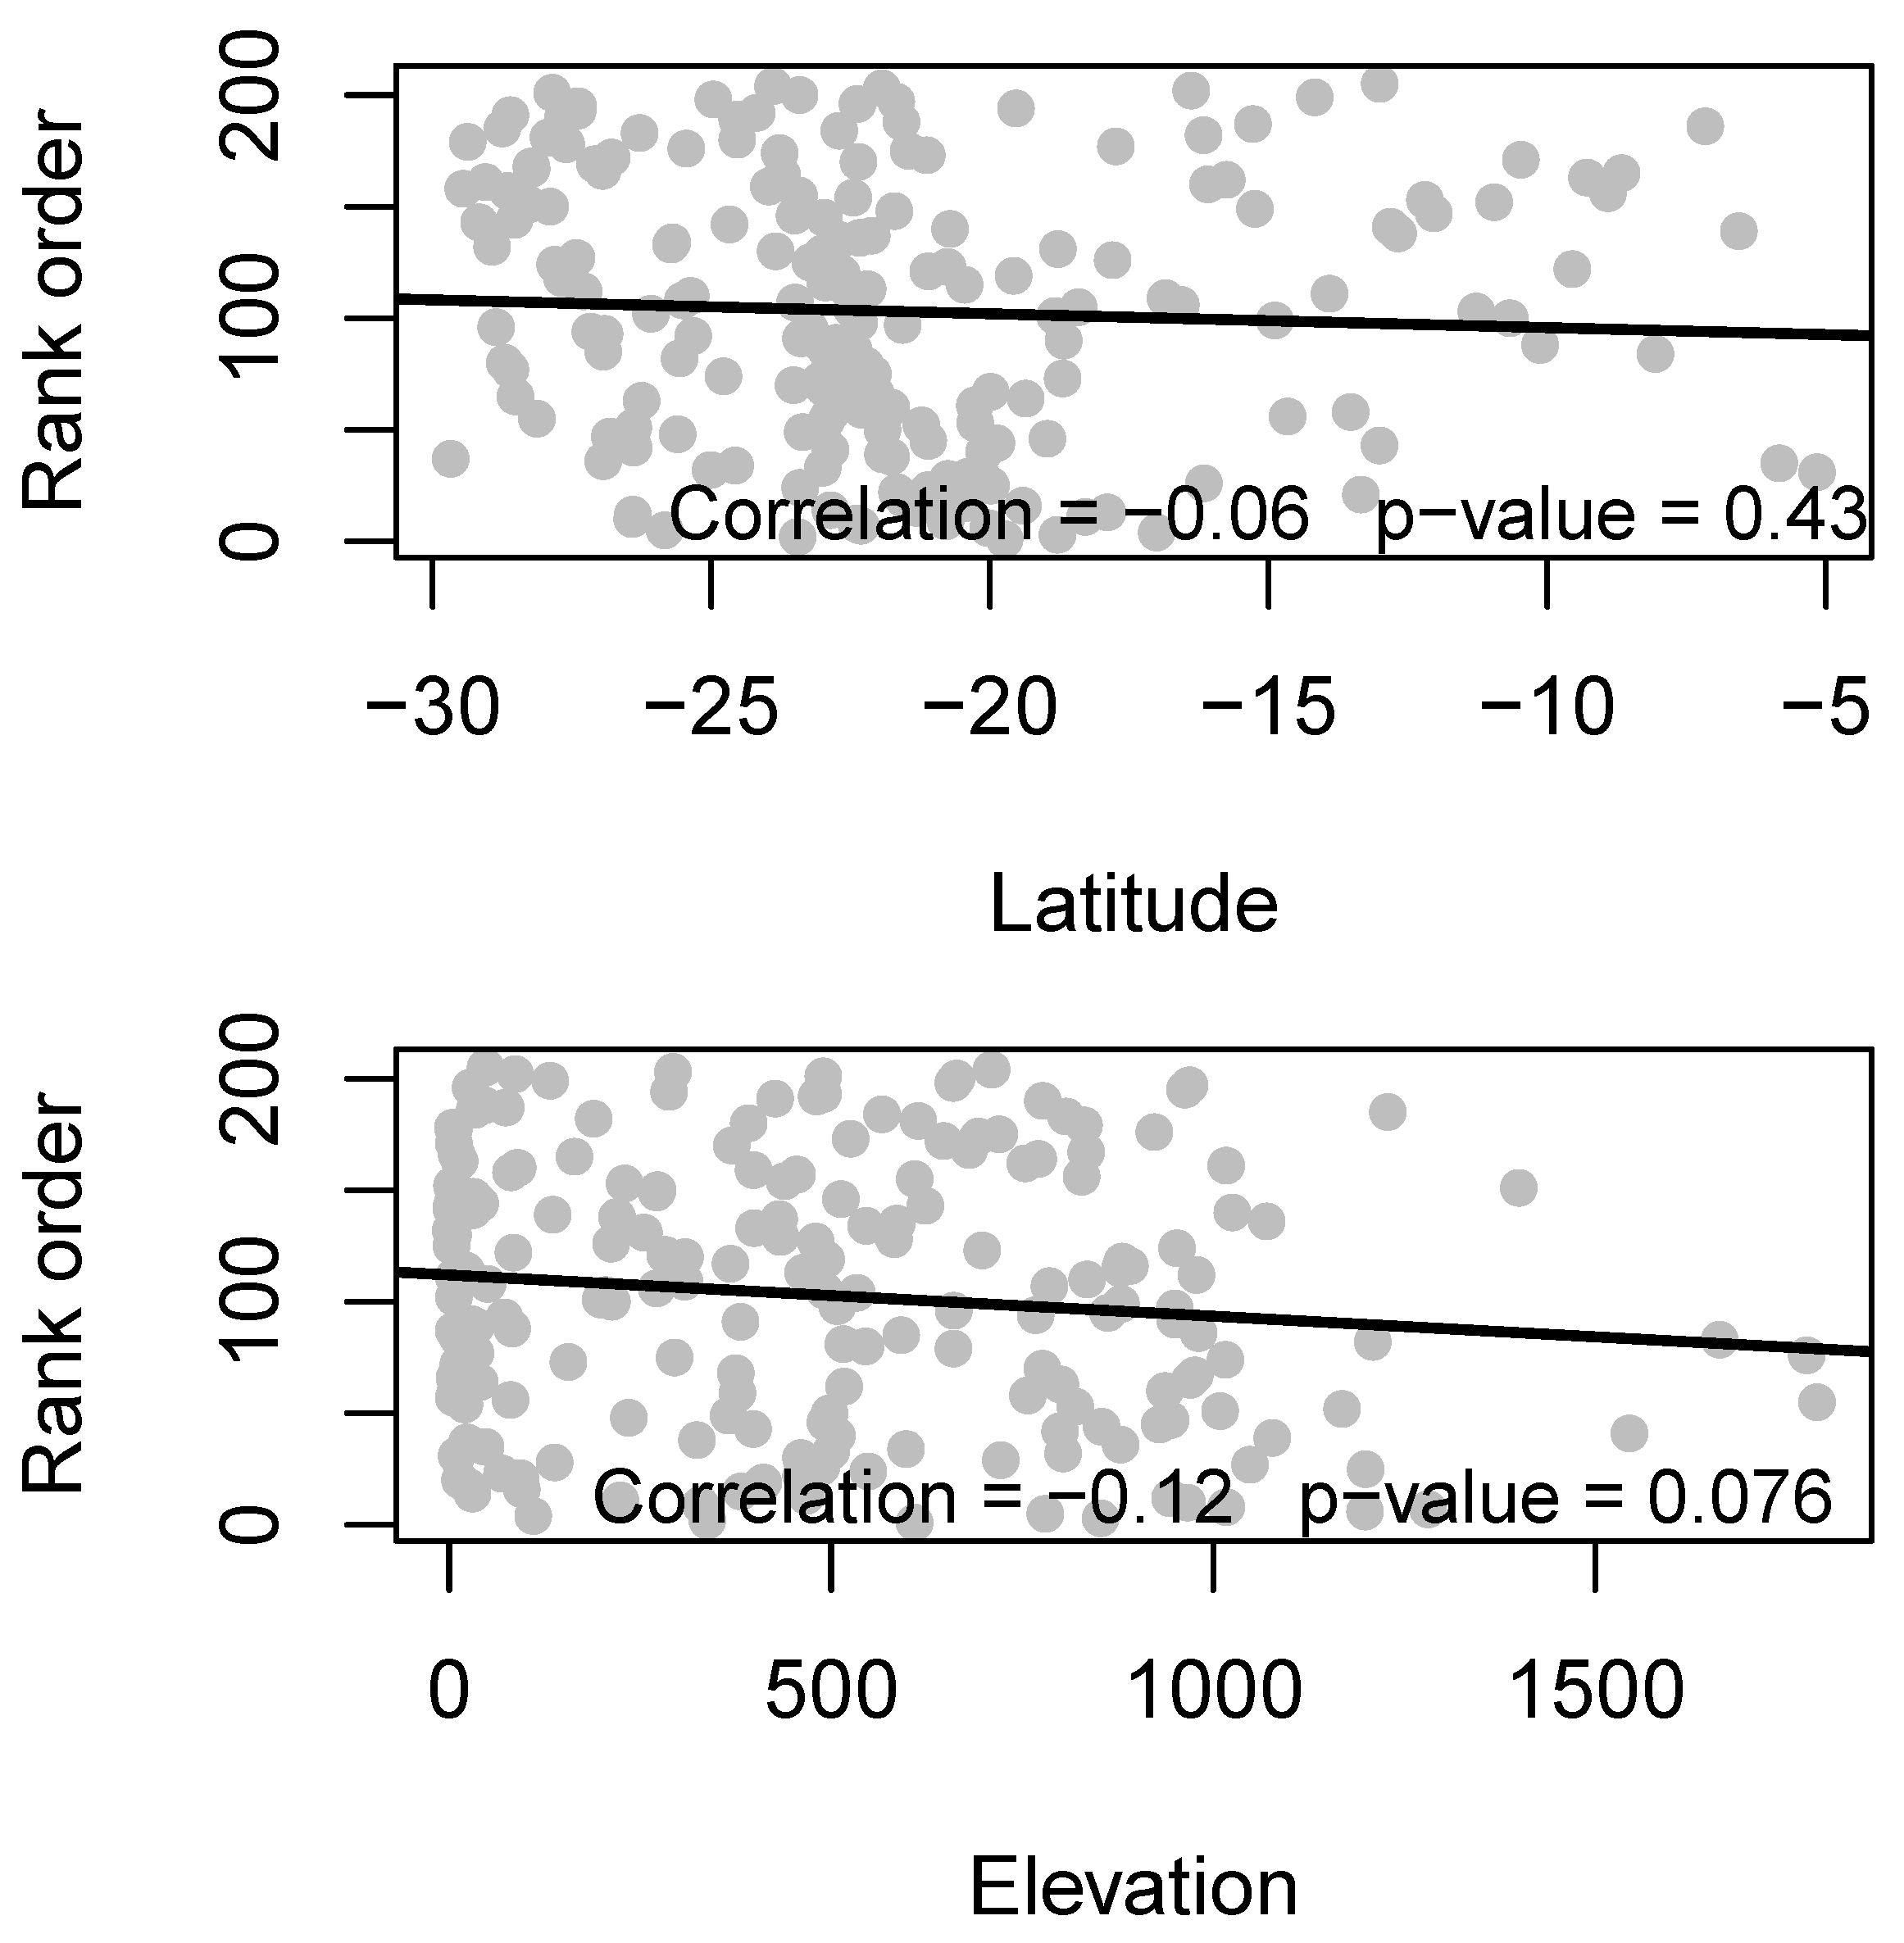

Table 1.
A vulnerability ranking for weather stations presented in ascending order according to their susceptibility to drought events within the Brazilian Atlantic Forest.
Table 1.
A vulnerability ranking for weather stations presented in ascending order according to their susceptibility to drought events within the Brazilian Atlantic Forest.
| Station | NDD | NWD | AI | Trend in ET | Trend in Tmax | Trend in NCDH | Rank |
| A554 | 22 | 8 | 0.31 | 9.784 | 21.125 | 0.492 | 1 |
| A752 | 27 | 3 | 0.40 | 3.016 | 3.613 | 0.616 | 2 |
| A533 | 22 | 9 | 0.72 | 6.601 | 10.564 | 0.561 | 3 |
| A455 | 19 | 11 | 0.28 | 8.297 | 6.572 | 0.517 | 4 |
| A874 | 21 | 10 | 0.78 | 6.372 | 6.132 | 0.770 | 5 |
| A555 | 21 | 9 | 0.19 | 2.827 | 3.102 | 0.565 | 6 |
| A531 | 19 | 11 | 0.37 | 6.581 | 6.699 | 0.487 | 7 |
| A529 | 19 | 11 | 0.72 | 12.163 | 12.430 | 0.496 | 8 |
| A704 | 21 | 9 | 0.44 | 9.543 | 10.455 | -0.227 | 9 |
| A876 | 20 | 10 | 0.69 | 6.708 | 6.506 | 0.519 | 10 |
| A631 | 18 | 13 | 0.57 | 9.400 | 5.845 | 0.587 | 11 |
| A816 | 21 | 10 | 0.64 | 6.783 | 5.626 | 0.453 | 12 |
| A527 | 20 | 10 | 0.54 | 4.666 | 4.580 | 0.488 | 13 |
| A621 | 22 | 8 | 0.39 | 3.003 | 4.029 | 0.413 | 14 |
| A734 | 19 | 11 | 0.59 | 6.771 | 8.050 | 0.426 | 15 |
| A632 | 18 | 12 | 0.59 | 5.988 | 3.571 | 0.595 | 16 |
| A634 | 26 | 4 | 0.04 | -0.064 | 0.347 | 0.599 | 17 |
| A735 | 20 | 11 | 0.55 | 3.143 | 6.924 | 0.454 | 18 |
| A557 | 17 | 13 | 0.53 | 1.860 | 13.693 | 0.590 | 19 |
| A615 | 22 | 9 | 0.68 | 3.725 | 2.800 | 0.481 | 20 |
| A444 | 18 | 13 | 0.28 | 6.937 | 3.985 | 0.479 | 21 |
| A727 | 19 | 12 | 0.50 | 3.146 | 6.724 | 0.455 | 22 |
| A622 | 17 | 13 | 0.55 | 4.953 | 4.225 | 0.605 | 23 |
| A835 | 21 | 9 | 0.83 | 2.541 | 3.327 | 0.567 | 24 |
| F501 | 24 | 7 | 0.35 | 1.055 | -0.468 | 0.563 | 25 |
| A552 | 18 | 12 | 0.34 | 1.336 | 5.535 | 0.561 | 26 |
| A513 | 23 | 8 | 0.49 | 1.652 | 2.766 | 0.458 | 27 |
| A617 | 18 | 13 | 0.63 | 5.477 | 6.011 | 0.499 | 28 |
| A633 | 18 | 12 | 0.56 | 3.300 | 0.589 | 0.622 | 29 |
| A733 | 25 | 6 | 0.16 | 1.172 | 2.341 | 0.360 | 30 |
| A344 | 20 | 10 | 0.42 | 1.625 | 7.621 | 0.193 | 31 |
| A818 | 20 | 11 | 0.78 | 5.122 | 8.088 | 0.295 | 32 |
| A716 | 21 | 9 | 0.73 | 2.819 | 5.790 | 0.307 | 33 |
| B803 | 16 | 15 | 0.85 | 8.013 | 10.117 | 0.580 | 34 |
| A304 | 22 | 9 | 0.19 | 0.593 | 4.076 | 0.256 | 35 |
| A858 | 18 | 13 | 0.96 | 6.904 | 7.064 | 0.492 | 36 |
| A884 | 21 | 10 | 0.77 | 1.413 | -1.292 | 0.677 | 37 |
| A743 | 19 | 12 | 0.59 | 1.562 | 1.022 | 0.610 | 38 |
| A530 | 17 | 13 | 0.63 | 8.100 | 7.903 | 0.316 | 39 |
| A657 | 24 | 6 | 0.15 | -0.743 | -2.005 | 0.491 | 40 |
| A509 | 19 | 12 | 0.61 | 5.506 | 6.322 | 0.159 | 41 |
| A864 | 16 | 14 | 0.77 | 6.019 | 5.586 | 0.572 | 42 |
| A434 | 21 | 9 | 0.30 | -0.043 | -0.243 | 0.457 | 43 |
| A521 | 18 | 12 | 0.81 | 2.845 | 5.508 | 0.497 | 44 |
| A514 | 16 | 14 | 0.72 | 5.565 | 6.682 | 0.515 | 45 |
| A011 | 18 | 11 | 0.60 | 1.972 | 6.513 | 0.342 | 46 |
| A859 | 17 | 13 | 1.23 | 6.082 | 6.210 | 0.579 | 47 |
| A846 | 17 | 14 | 1.29 | 9.931 | 8.324 | 0.534 | 48 |
| A869 | 16 | 15 | 0.80 | 6.755 | 7.496 | 0.517 | 49 |
| A768 | 19 | 12 | 0.42 | -0.903 | -0.851 | 0.610 | 50 |
| A875 | 18 | 13 | 1.33 | 6.840 | 6.071 | 0.519 | 51 |
| A502 | 18 | 13 | 0.67 | 6.714 | 6.462 | 0.195 | 52 |
| A556 | 19 | 12 | 0.45 | -2.268 | 1.676 | 0.572 | 53 |
| A636 | 20 | 10 | 0.35 | -2.310 | -3.657 | 0.564 | 54 |
| A845 | 20 | 10 | 1.00 | 2.049 | 3.050 | 0.467 | 55 |
| A410 | 15 | 16 | 0.73 | 6.889 | 13.642 | 0.465 | 56 |
| A627 | 22 | 9 | 0.55 | -0.827 | -3.505 | 0.528 | 57 |
| A407 | 16 | 15 | 0.48 | 4.552 | 7.147 | 0.351 | 58 |
| A709 | 22 | 8 | 0.32 | -1.305 | 1.845 | 0.240 | 59 |
| A518 | 20 | 10 | 0.45 | 0.886 | 0.189 | 0.386 | 60 |
| A612 | 21 | 9 | 0.86 | 1.791 | 2.235 | 0.385 | 61 |
| A630 | 20 | 10 | 0.43 | -2.644 | -4.861 | 0.566 | 62 |
| A862 | 17 | 13 | 1.12 | 4.609 | 4.799 | 0.557 | 63 |
| A614 | 20 | 10 | 0.43 | -1.344 | 1.068 | 0.429 | 64 |
| A880 | 18 | 12 | 1.07 | 3.388 | 3.295 | 0.515 | 65 |
| A620 | 18 | 12 | 0.51 | 1.760 | 0.960 | 0.465 | 66 |
| A613 | 20 | 11 | 0.41 | -2.102 | -1.265 | 0.497 | 67 |
| A749 | 18 | 12 | 0.68 | -0.742 | 1.263 | 0.602 | 68 |
| A652 | 19 | 11 | 0.57 | 1.117 | 2.219 | 0.403 | 69 |
| A755 | 18 | 12 | 1.29 | 2.837 | 2.914 | 0.581 | 70 |
| A659 | 22 | 9 | 0.71 | -2.382 | -4.458 | 0.579 | 71 |
| A602 | 19 | 12 | 0.72 | 3.200 | 4.103 | 0.224 | 72 |
| A623 | 19 | 11 | 0.70 | -0.788 | -0.448 | 0.583 | 73 |
| A819 | 18 | 12 | 0.76 | 2.361 | 4.858 | 0.315 | 74 |
| A625 | 20 | 11 | 0.75 | 0.139 | -1.269 | 0.558 | 75 |
| A610 | 18 | 12 | 0.87 | 3.443 | 4.687 | 0.310 | 76 |
| A866 | 15 | 15 | 1.04 | 1.839 | 7.543 | 0.650 | 77 |
| A667 | 20 | 10 | 0.64 | -4.085 | -5.136 | 0.607 | 78 |
| A763 | 16 | 15 | 0.78 | 3.434 | 1.801 | 0.610 | 79 |
| A894 | 15 | 15 | 1.05 | 4.625 | 3.680 | 0.646 | 80 |
| A626 | 20 | 11 | 0.76 | 0.130 | -1.532 | 0.558 | 81 |
| A823 | 17 | 13 | 1.43 | 3.169 | 3.622 | 0.588 | 82 |
| A706 | 20 | 11 | 0.66 | 0.708 | 2.212 | 0.323 | 83 |
| A301 | 16 | 14 | 0.51 | 1.334 | 12.855 | 0.303 | 84 |
| A861 | 18 | 12 | 1.16 | 3.617 | 2.196 | 0.494 | 85 |
| A618 | 20 | 10 | 0.46 | -0.096 | -0.981 | 0.338 | 86 |
| A628 | 21 | 10 | 0.65 | -2.927 | -6.258 | 0.552 | 87 |
| A355 | 17 | 14 | 0.43 | 2.012 | 4.467 | 0.274 | 88 |
| A601 | 19 | 11 | 0.55 | 2.219 | 0.827 | -0.096 | 89 |
| A616 | 20 | 11 | 0.66 | -1.960 | 2.470 | 0.396 | 90 |
| A824 | 20 | 10 | 0.64 | 0.198 | 1.629 | 0.291 | 91 |
| B806 | 17 | 14 | 0.88 | 2.114 | 1.102 | 0.605 | 92 |
| A817 | 17 | 13 | 1.37 | 2.904 | 4.448 | 0.543 | 93 |
| A841 | 14 | 17 | 1.01 | 8.740 | 12.219 | 0.469 | 94 |
| A740 | 18 | 12 | 1.01 | 2.118 | 3.124 | 0.450 | 95 |
| A837 | 20 | 11 | 1.20 | 1.579 | 2.699 | 0.457 | 96 |
| A515 | 18 | 13 | 0.79 | 2.730 | 4.585 | 0.264 | 97 |
| A637 | 21 | 10 | 0.60 | 0.195 | -1.316 | 0.295 | 98 |
| A414 | 15 | 15 | 0.48 | 3.229 | 3.956 | 0.330 | 99 |
| A451 | 14 | 16 | 0.54 | 3.213 | 4.812 | 0.389 | 100 |
| A532 | 17 | 14 | 0.46 | 0.419 | 0.848 | 0.503 | 101 |
| A851 | 17 | 13 | 1.15 | 1.618 | 2.798 | 0.585 | 102 |
| A417 | 14 | 17 | 0.77 | 6.709 | 9.262 | 0.355 | 103 |
| A741 | 16 | 14 | 1.04 | 3.862 | 5.197 | 0.442 | 104 |
| A035 | 16 | 15 | 0.64 | 2.800 | 6.656 | 0.248 | 105 |
| A550 | 16 | 15 | 0.86 | 1.649 | 4.998 | 0.531 | 106 |
| A701 | 18 | 12 | 0.81 | 0.644 | 3.687 | 0.362 | 107 |
| A873 | 19 | 11 | 0.98 | -4.112 | -2.063 | 0.622 | 108 |
| A566 | 14 | 16 | 0.77 | 3.761 | -0.169 | 0.587 | 109 |
| B804 | 17 | 14 | 1.14 | 1.723 | 1.482 | 0.613 | 110 |
| A438 | 16 | 14 | 0.52 | -0.188 | 5.500 | 0.373 | 111 |
| A860 | 15 | 16 | 1.19 | 6.704 | 6.617 | 0.451 | 112 |
| A721 | 18 | 13 | 0.53 | 1.664 | 0.847 | 0.250 | 113 |
| A603 | 20 | 11 | 0.60 | 1.386 | -1.701 | 0.012 | 114 |
| A524 | 15 | 16 | 0.46 | 1.506 | 3.518 | 0.421 | 115 |
| A744 | 17 | 13 | 0.44 | -6.271 | -4.955 | 0.587 | 116 |
| A849 | 9 | 21 | 1.01 | 7.824 | 8.805 | 0.512 | 117 |
| A870 | 17 | 14 | 0.89 | 1.550 | -1.348 | 0.591 | 118 |
| A511 | 12 | 18 | 0.84 | 4.703 | 7.364 | 0.444 | 119 |
| A850 | 12 | 18 | 1.45 | 5.874 | 8.729 | 0.529 | 120 |
| A517 | 17 | 13 | 0.77 | 0.216 | 2.103 | 0.457 | 121 |
| A303 | 14 | 16 | 0.35 | 2.866 | 3.502 | 0.153 | 122 |
| A510 | 13 | 17 | 1.06 | 5.528 | 8.611 | 0.380 | 123 |
| A865 | 14 | 16 | 1.00 | 1.937 | 1.806 | 0.640 | 124 |
| A619 | 19 | 12 | 0.99 | 2.564 | 0.592 | 0.233 | 125 |
| A522 | 17 | 13 | 0.57 | -1.720 | -1.237 | 0.491 | 126 |
| A863 | 12 | 19 | 1.01 | 3.441 | 2.705 | 0.625 | 127 |
| A728 | 19 | 11 | 0.86 | -2.993 | -2.883 | 0.497 | 128 |
| A750 | 8 | 23 | 0.97 | 4.312 | 4.020 | 0.647 | 129 |
| A765 | 18 | 12 | 0.91 | -1.363 | -6.509 | 0.584 | 130 |
| A540 | 18 | 12 | 0.75 | -1.258 | -1.049 | 0.448 | 131 |
| A867 | 14 | 15 | 1.07 | 0.270 | 2.669 | 0.667 | 132 |
| A855 | 14 | 17 | 1.27 | 7.278 | 6.364 | 0.400 | 133 |
| A843 | 17 | 13 | 1.24 | 1.805 | 1.277 | 0.494 | 134 |
| A769 | 18 | 12 | 0.71 | -3.805 | -4.196 | 0.503 | 135 |
| A624 | 13 | 18 | 0.58 | 0.710 | 1.238 | 0.587 | 136 |
| A707 | 15 | 15 | 1.26 | 6.620 | 8.099 | 0.089 | 137 |
| A406 | 16 | 15 | 0.52 | 2.129 | 1.537 | 0.235 | 138 |
| A352 | 10 | 20 | 0.91 | 1.349 | 8.241 | 0.576 | 139 |
| A570 | 17 | 14 | 0.69 | -1.242 | -3.115 | 0.565 | 140 |
| A456 | NA | NA | NA | 2.593 | 1.548 | 0.541 | 141 |
| A712 | 19 | 12 | 1.00 | -3.146 | 1.676 | 0.414 | 142 |
| A840 | 19 | 12 | 1.24 | -0.178 | -0.172 | 0.474 | 143 |
| A814 | 13 | 17 | 1.60 | 2.773 | 2.852 | 0.627 | 144 |
| A606 | 12 | 18 | 0.66 | 1.205 | 12.149 | 0.342 | 145 |
| A821 | 14 | 16 | 0.80 | 1.816 | 3.084 | 0.442 | 146 |
| A431 | 13 | 18 | 0.60 | 8.213 | -1.750 | 0.378 | 147 |
| A607 | 15 | 15 | 0.91 | 1.247 | 4.111 | 0.421 | 148 |
| A446 | 8 | 22 | 1.08 | 4.987 | 5.122 | 0.530 | 149 |
| A810 | 20 | 10 | 0.82 | -4.139 | -5.149 | 0.344 | 150 |
| A815 | 8 | 22 | 0.84 | 1.737 | 2.952 | 0.625 | 151 |
| A409 | 14 | 17 | 0.75 | 0.919 | 11.779 | 0.247 | 152 |
| A413 | 14 | 17 | 0.51 | 1.654 | 2.066 | 0.298 | 153 |
| A609 | 15 | 15 | 0.89 | 0.522 | 1.894 | 0.482 | 154 |
| A713 | 13 | 18 | 1.15 | 3.582 | 4.669 | 0.429 | 155 |
| A322 | 16 | 14 | 0.37 | -4.627 | -0.834 | 0.388 | 156 |
| A883 | 16 | 14 | 1.18 | -0.549 | -1.582 | 0.621 | 157 |
| A882 | 13 | 17 | 1.08 | 1.119 | -0.040 | 0.676 | 158 |
| A751 | 11 | 19 | 1.40 | 5.840 | 4.555 | 0.487 | 159 |
| A447 | 11 | 20 | 0.59 | 1.967 | 2.493 | 0.433 | 160 |
| A897 | 18 | 13 | 1.52 | -2.877 | -4.832 | 0.681 | 161 |
| A549 | 8 | 22 | 1.11 | 3.178 | 3.598 | 0.567 | 162 |
| A356 | 18 | 12 | 0.55 | -5.689 | -5.749 | 0.272 | 163 |
| A771 | 15 | 15 | 1.15 | 2.087 | -2.456 | 0.550 | 164 |
| A357 | 14 | 16 | 0.63 | -5.420 | -2.979 | 0.591 | 165 |
| A868 | 16 | 14 | 1.32 | -2.160 | -2.248 | 0.712 | 166 |
| A844 | 10 | 20 | 1.27 | 3.615 | 3.351 | 0.494 | 167 |
| A839 | 13 | 18 | 0.79 | 2.736 | 2.453 | 0.308 | 168 |
| A895 | 16 | 14 | 1.30 | 0.451 | -1.966 | 0.528 | 169 |
| A611 | 17 | 14 | 0.91 | -2.020 | -0.016 | 0.393 | 170 |
| A421 | 12 | 18 | 0.76 | -0.781 | 7.679 | 0.306 | 171 |
| A857 | 9 | 22 | 1.54 | 3.271 | 4.571 | 0.501 | 172 |
| A736 | 9 | 22 | 1.55 | 7.815 | 9.211 | 0.246 | 173 |
| A871 | 13 | 18 | 1.10 | 1.922 | 1.729 | 0.481 | 174 |
| A762 | 10 | 20 | 1.04 | 0.951 | 0.296 | 0.635 | 175 |
| A807 | 10 | 20 | 1.26 | 5.506 | 4.792 | 0.343 | 176 |
| A405 | 10 | 20 | 1.09 | 2.692 | 6.280 | 0.344 | 177 |
| A806 | 13 | 17 | 0.89 | 2.105 | 2.600 | 0.265 | 178 |
| A879 | 16 | 14 | 1.03 | -4.895 | -2.844 | 0.532 | 179 |
| A820 | 14 | 16 | 1.08 | 1.605 | 1.769 | 0.377 | 180 |
| A856 | 10 | 20 | 1.50 | 3.838 | 2.936 | 0.442 | 181 |
| A508 | 12 | 18 | 0.72 | -0.098 | 4.674 | 0.183 | 182 |
| A848 | 5 | 25 | 2.69 | 2.799 | 3.804 | 0.526 | 183 |
| A726 | 14 | 16 | 0.76 | -0.170 | 0.800 | 0.269 | 184 |
| A829 | 13 | 17 | 0.99 | -1.408 | -0.260 | 0.515 | 185 |
| A320 | 12 | 18 | 0.87 | -6.175 | 15.821 | 0.221 | 186 |
| A437 | 10 | 21 | 1.25 | 2.669 | 5.656 | 0.306 | 187 |
| A604 | 15 | 16 | 0.69 | -1.921 | -0.227 | 0.224 | 188 |
| A766 | 13 | 17 | 1.11 | -1.592 | -4.499 | 0.587 | 189 |
| A828 | 14 | 16 | 1.20 | 1.277 | 1.037 | 0.259 | 190 |
| A853 | 14 | 16 | 1.37 | -0.127 | -0.433 | 0.410 | 191 |
| A825 | 17 | 13 | 1.64 | -4.363 | -4.945 | 0.352 | 192 |
| A854 | 10 | 21 | 0.99 | 0.373 | 0.637 | 0.439 | 193 |
| A534 | 11 | 19 | 0.72 | -5.127 | -4.445 | 0.484 | 194 |
| A898 | 11 | 20 | 1.53 | 0.650 | -2.597 | 0.528 | 195 |
| A608 | 12 | 19 | 0.95 | -2.382 | -1.017 | 0.431 | 196 |
| A567 | 12 | 18 | 2.14 | -3.901 | -3.983 | 0.560 | 197 |
| A746 | 13 | 18 | 1.53 | -2.048 | -0.585 | 0.412 | 198 |
| A445 | 10 | 21 | 1.09 | -0.760 | -0.074 | 0.366 | 199 |
| A842 | 12 | 19 | 1.97 | -0.617 | -1.314 | 0.453 | 200 |
| A805 | 12 | 19 | 1.14 | 1.027 | -0.813 | 0.080 | 201 |
| A427 | 9 | 22 | 0.88 | -3.188 | -2.396 | 0.442 | 202 |
| A629 | 9 | 22 | 1.17 | -3.593 | -6.473 | 0.553 | 203 |
| A715 | 12 | 18 | 1.08 | -4.048 | -3.087 | 0.270 | 204 |
| A401 | 6 | 24 | 0.99 | -2.531 | 0.712 | 0.072 | 205 |
Disclaimer/Publisher’s Note: The statements, opinions and data contained in all publications are solely those of the individual author(s) and contributor(s) and not of MDPI and/or the editor(s). MDPI and/or the editor(s) disclaim responsibility for any injury to people or property resulting from any ideas, methods, instructions or products referred to in the content. |
© 2024 by the authors. Licensee MDPI, Basel, Switzerland. This article is an open access article distributed under the terms and conditions of the Creative Commons Attribution (CC BY) license (http://creativecommons.org/licenses/by/4.0/).
Copyright: This open access article is published under a Creative Commons CC BY 4.0 license, which permit the free download, distribution, and reuse, provided that the author and preprint are cited in any reuse.


