Submitted:
10 January 2024
Posted:
11 January 2024
You are already at the latest version
Abstract
Keywords:
1. Introduction
1.1. Contribution of the LittleBeats™ Platform
1.2. Wearable Sensor Systems and Technical Validation as a Critical Step
1.3. Validation of ECG (Study 1, 2), IMU (Study 3), and Audio (Study 4, 5) Sensors
2. Overview of LittleBeats™ Platform

2.1. Hardware Design
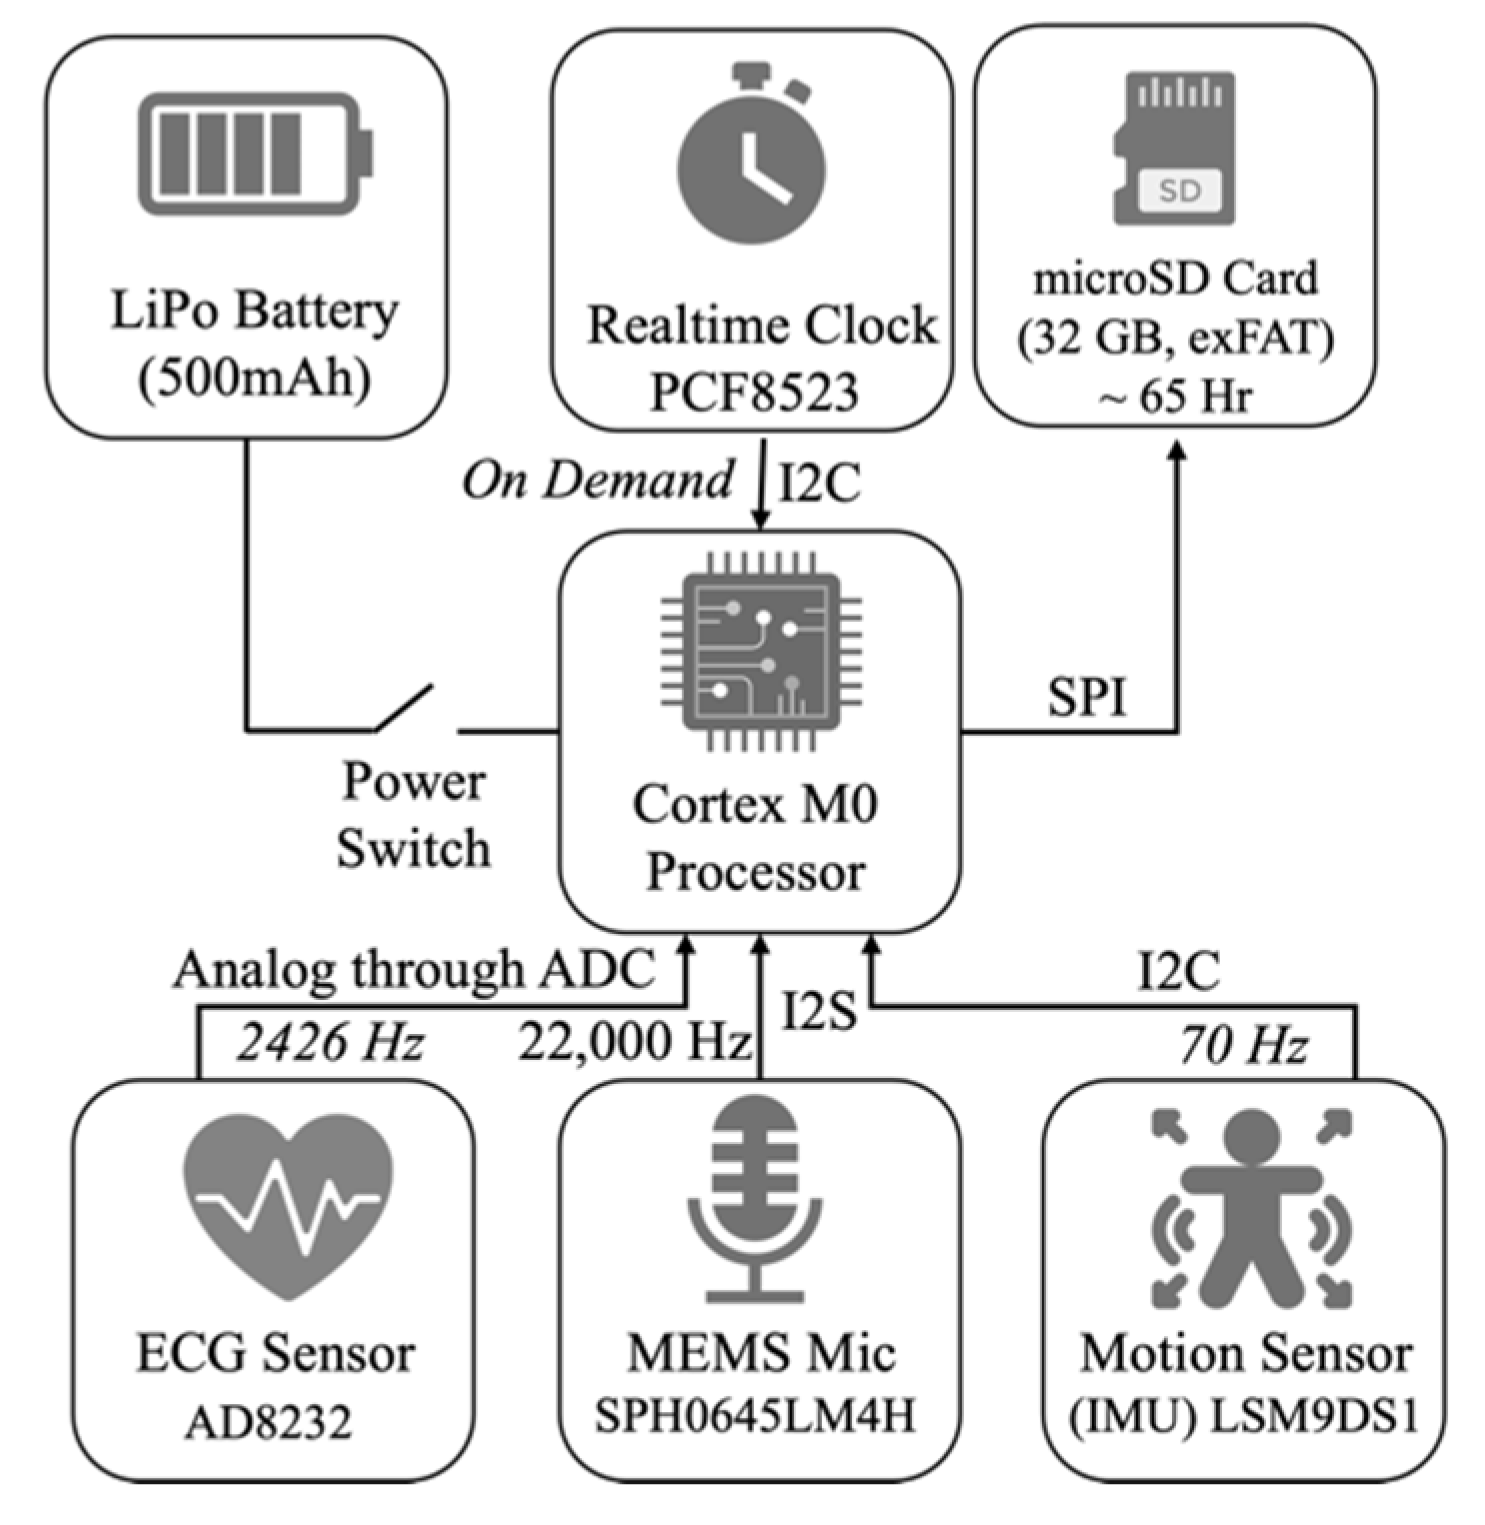
2.1.1. Processing Unit
2.1.2. Memory Unit
2.1.3. Time-Keeping Unit
2.1.4. Power Unit
2.1.5. Sensing Unit
2.2. Data Acquisition
2.3. Data synchronization
3. Study 1: Validation of ECG sensor – Adult sample
3.1. Materials & Methods
3.1.1. Participants
3.1.2. Study Procedure
3.1.3. Data Processing
3.2. Results
|
Session (n observations) |
Absolute Mean Error |
MAPE (%) |
Mean error (SD) | Bland-Altman analysis | |
| Lower LoA | Upper LoA | ||||
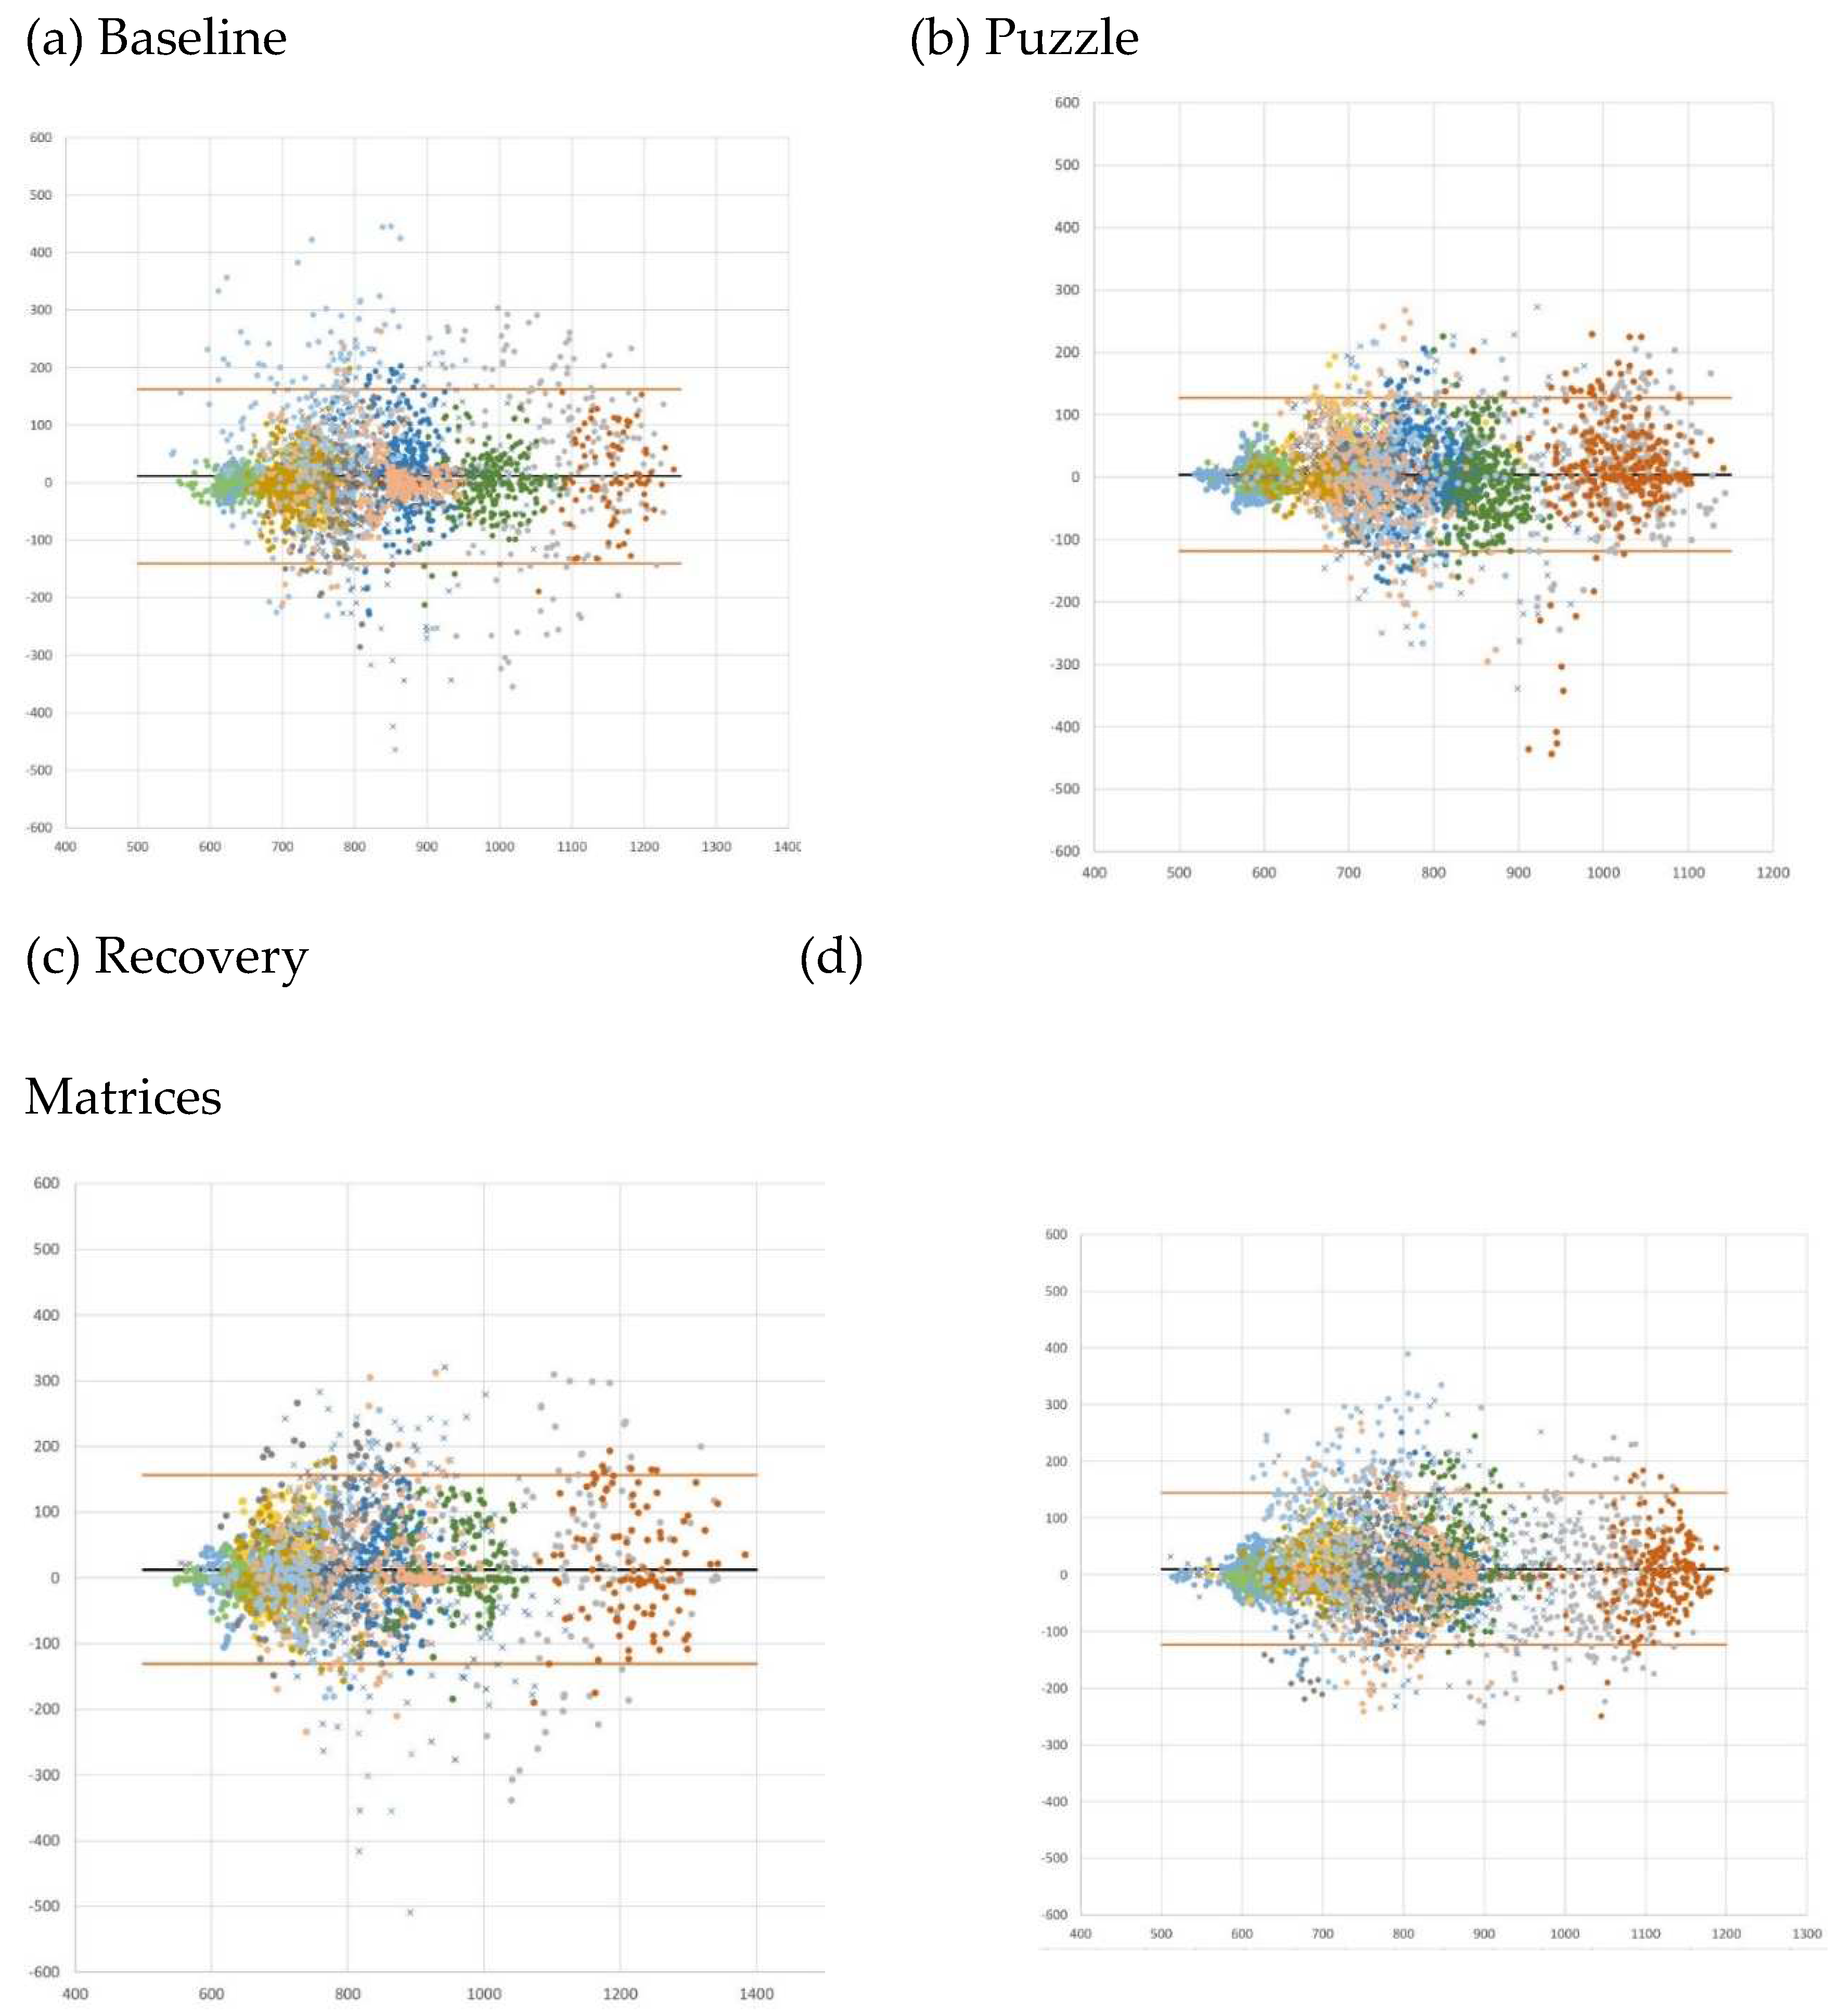
| Baseline (n = 3355) | 49.6 | 5.93% | 11.1 (77.3) | -162.54 | 140.33 |
| Tangram puzzle (n = 3744) | 41.9 | 5.29% | 4.5 (62.8) | -127.59 | 118.65 |
| Recovery (n = 2777) | 49.7 | 5.97% | 12.7 (73.1) | -156.02 | 130.55 |
| Matrices (n = 4589) | 45.6 | 5.62% | 10.6 (68.3) | -144.51 | 123.28 |
4. Study 2: Validation of ECG sensor – Infant sample
4.1. Materials & Methods
4.1.1. Participants
4.1.2. Study Procedure
4.1.3. Data Processing
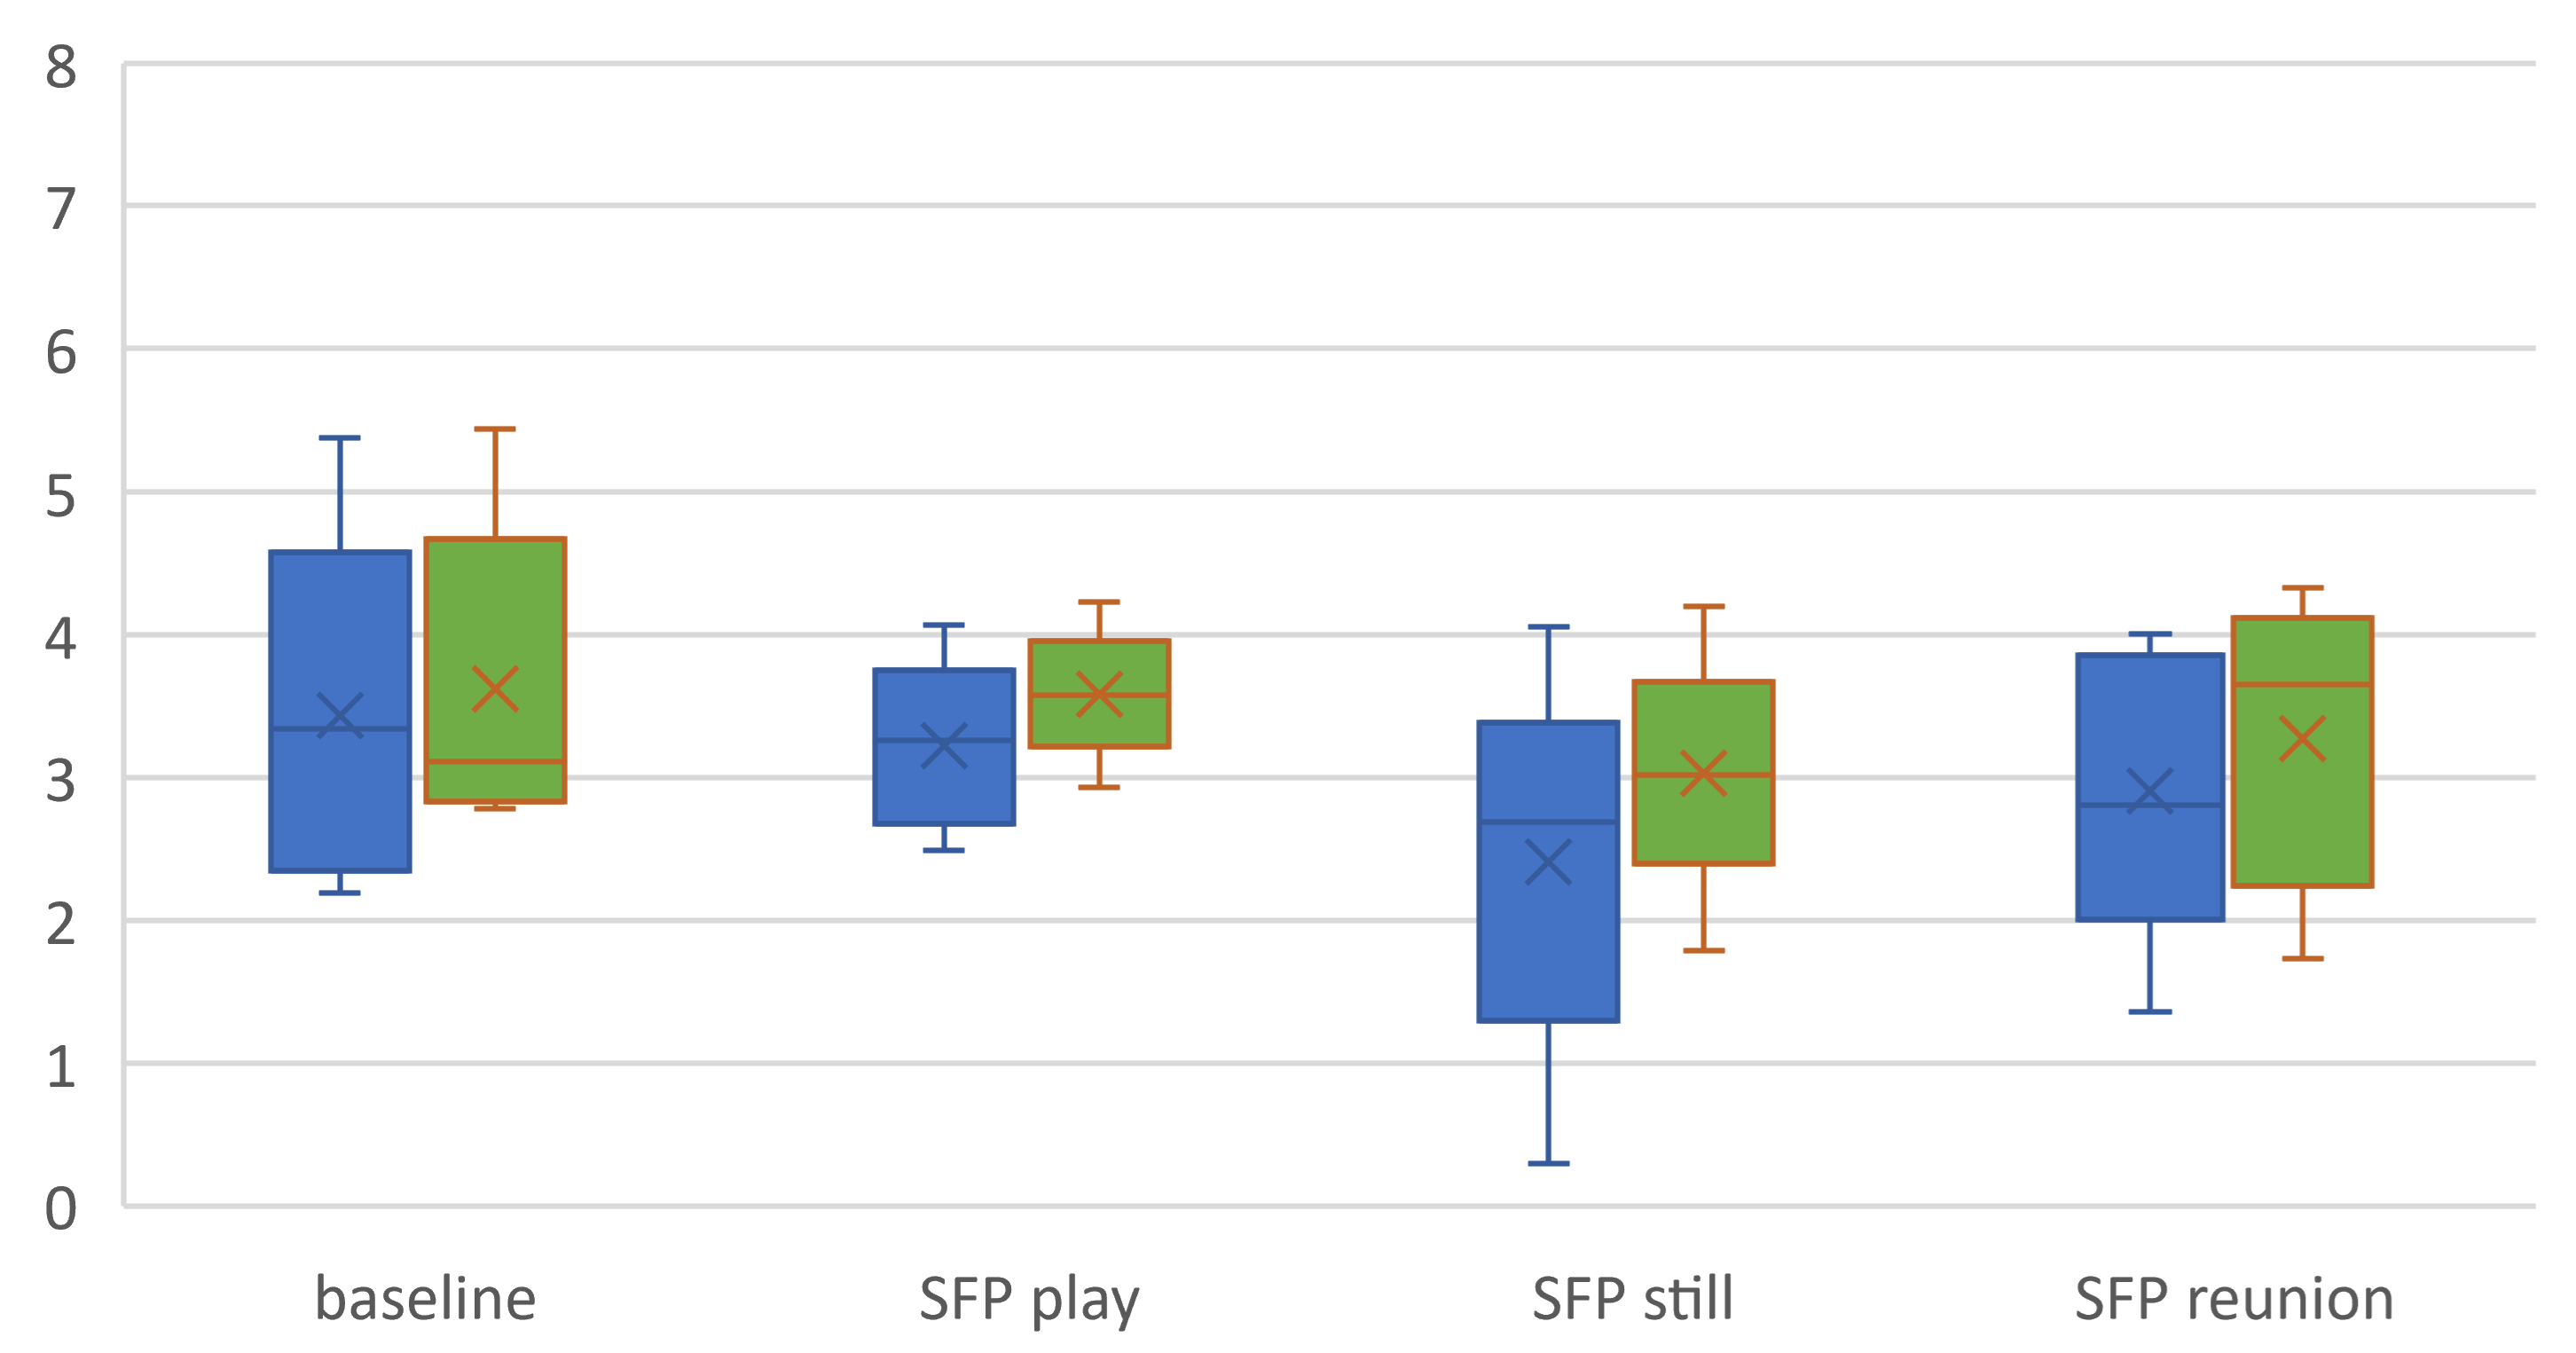
4.2. Results
|
Session (n observations) |
Absolute Mean Error |
MAPE (%) |
Mean error (SD) | Bland-Altman analysis | |
| Lower LoA | Upper LoA | ||||
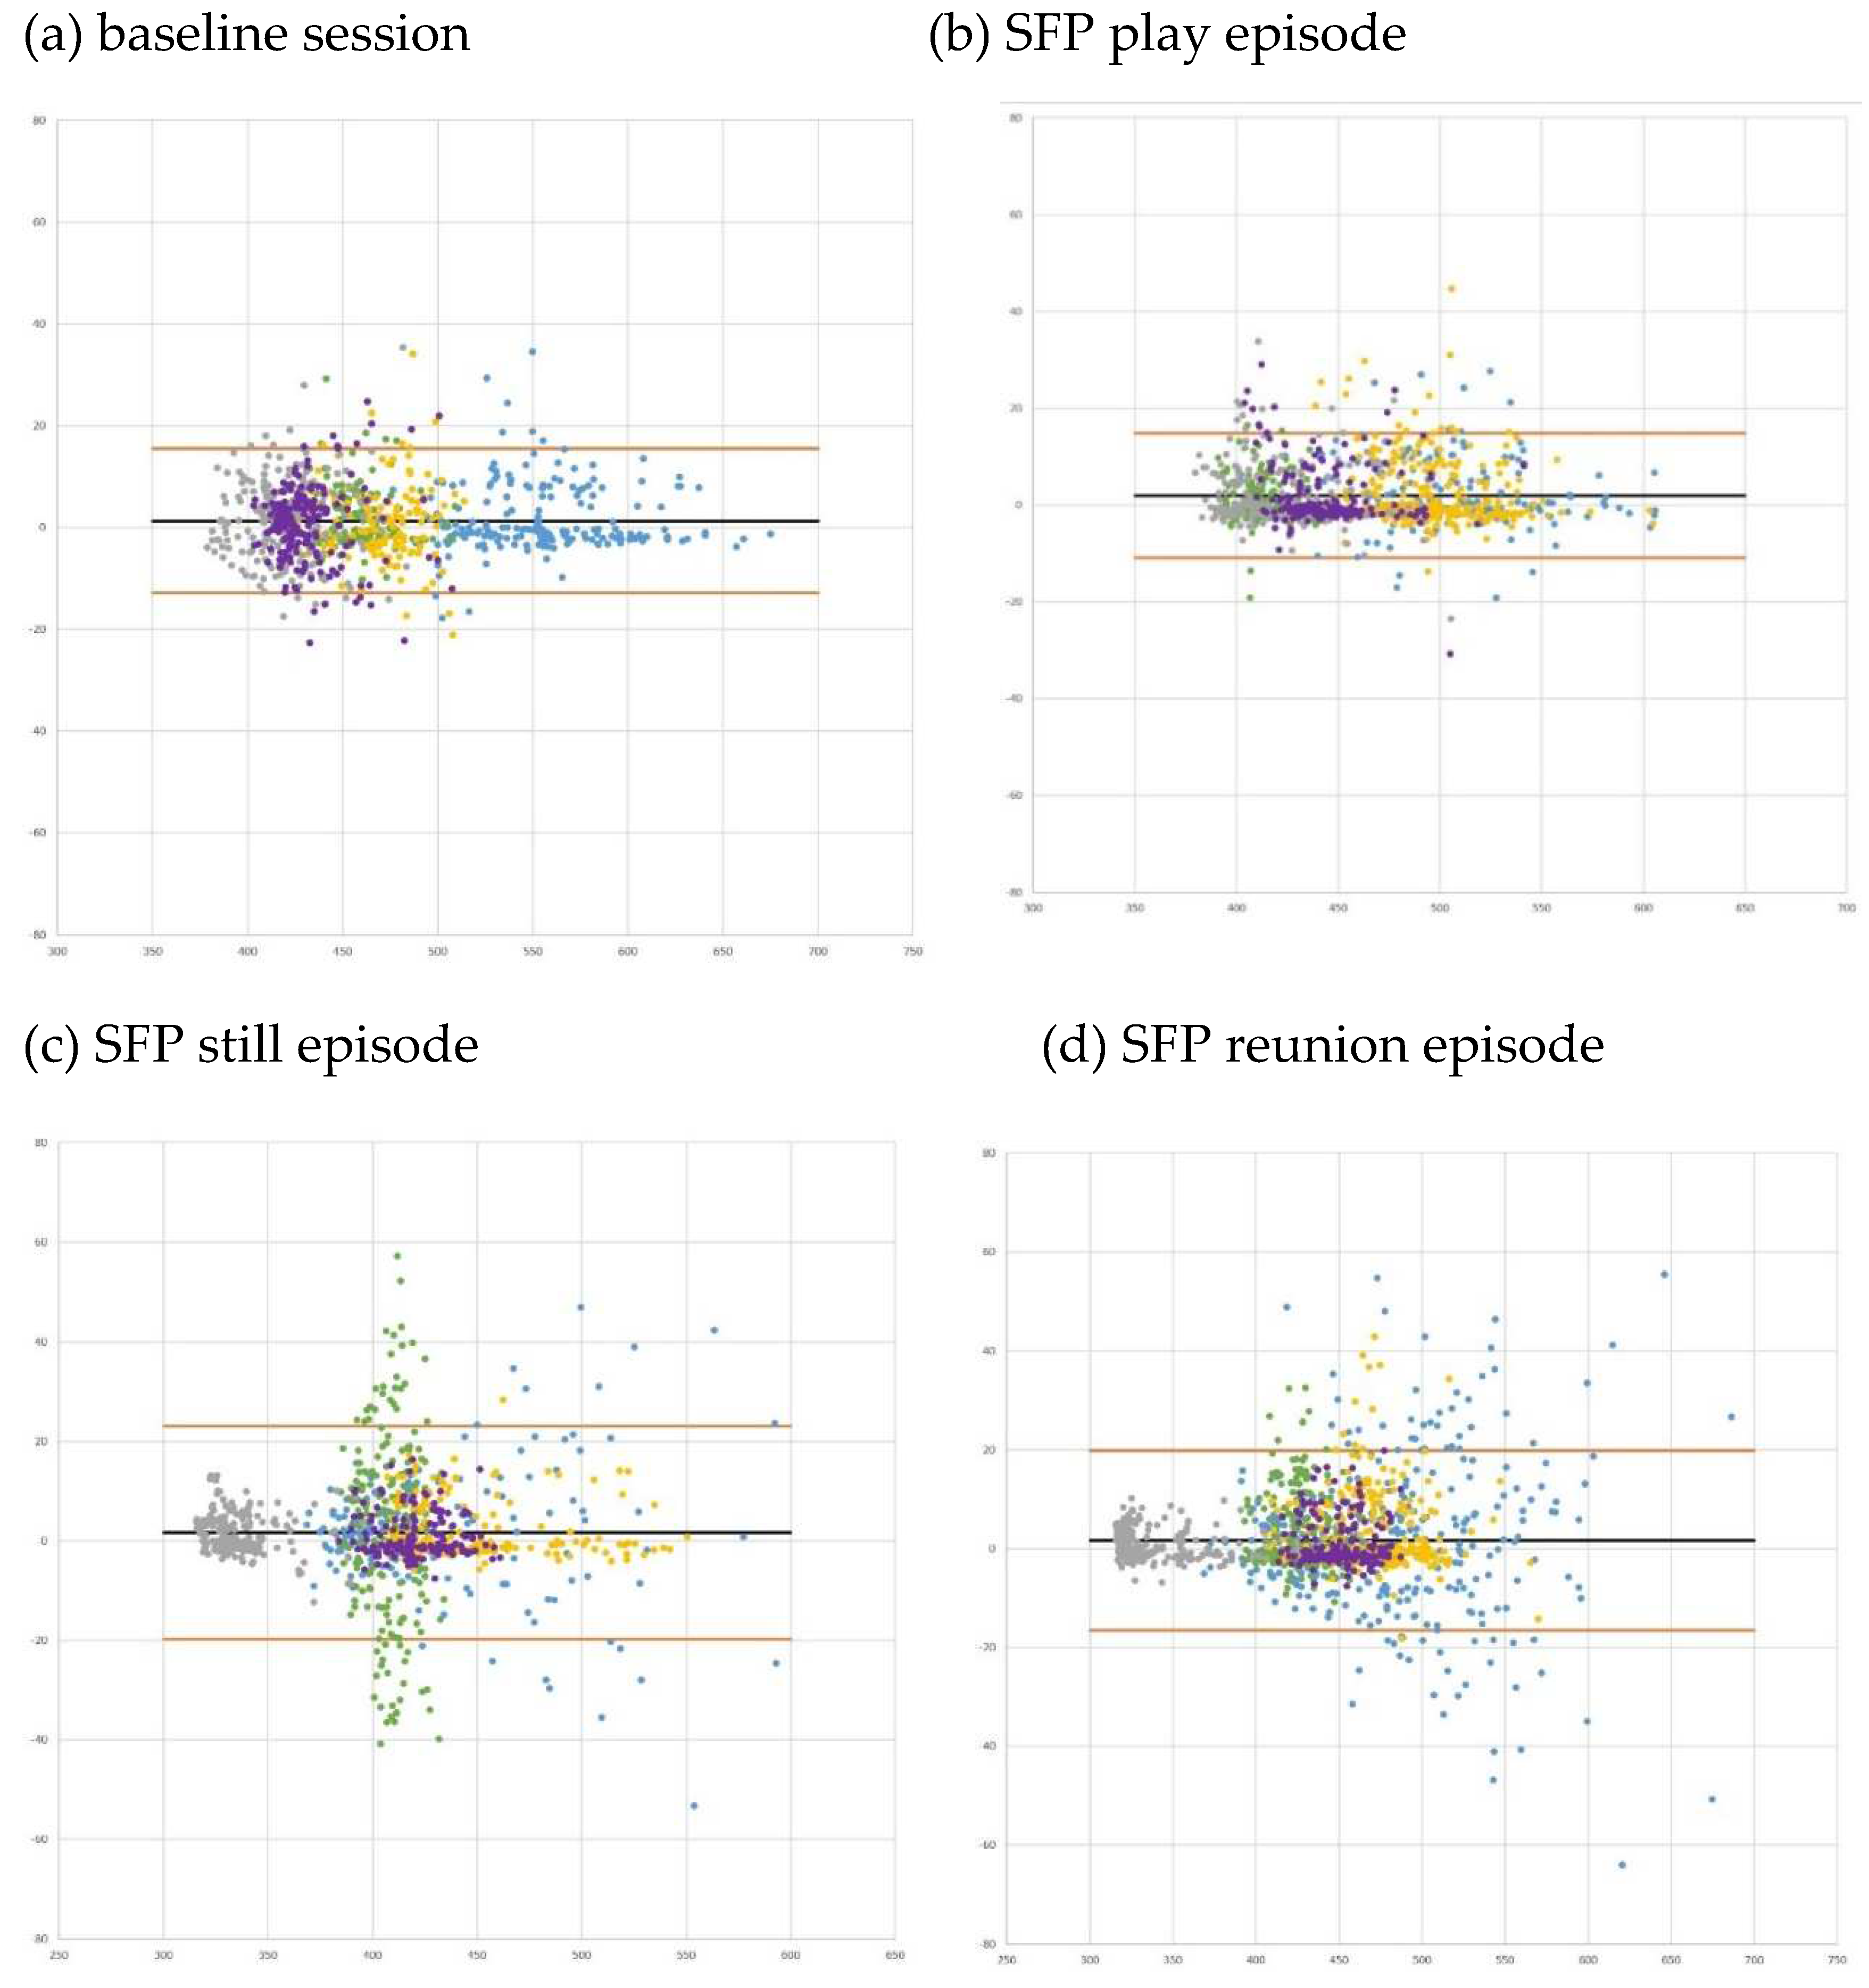
| Baseline (n = 907) | 5.4 | 1.17% | 1.3 (7.22) | -15.45 | 12.84 |
| SFP play episode (n = 1075) | 4.4 | 0.96% | 2.0 (6.58) | -14.87 | 10.93 |
| SFP still episode (n = 936) | 6.9 | 1.66% | 1.7 (10.93) | -23.09 | 19.75 |
| SFP reunion episode (n = 1472) | 5.6 | 1.22% | 1.7 (9.29) | -19.92 | 16.49 |
5. Study 3: Validation of Motion sensor – Activity Recognition
5.1. Materials & Methods
5.1.1. Participants
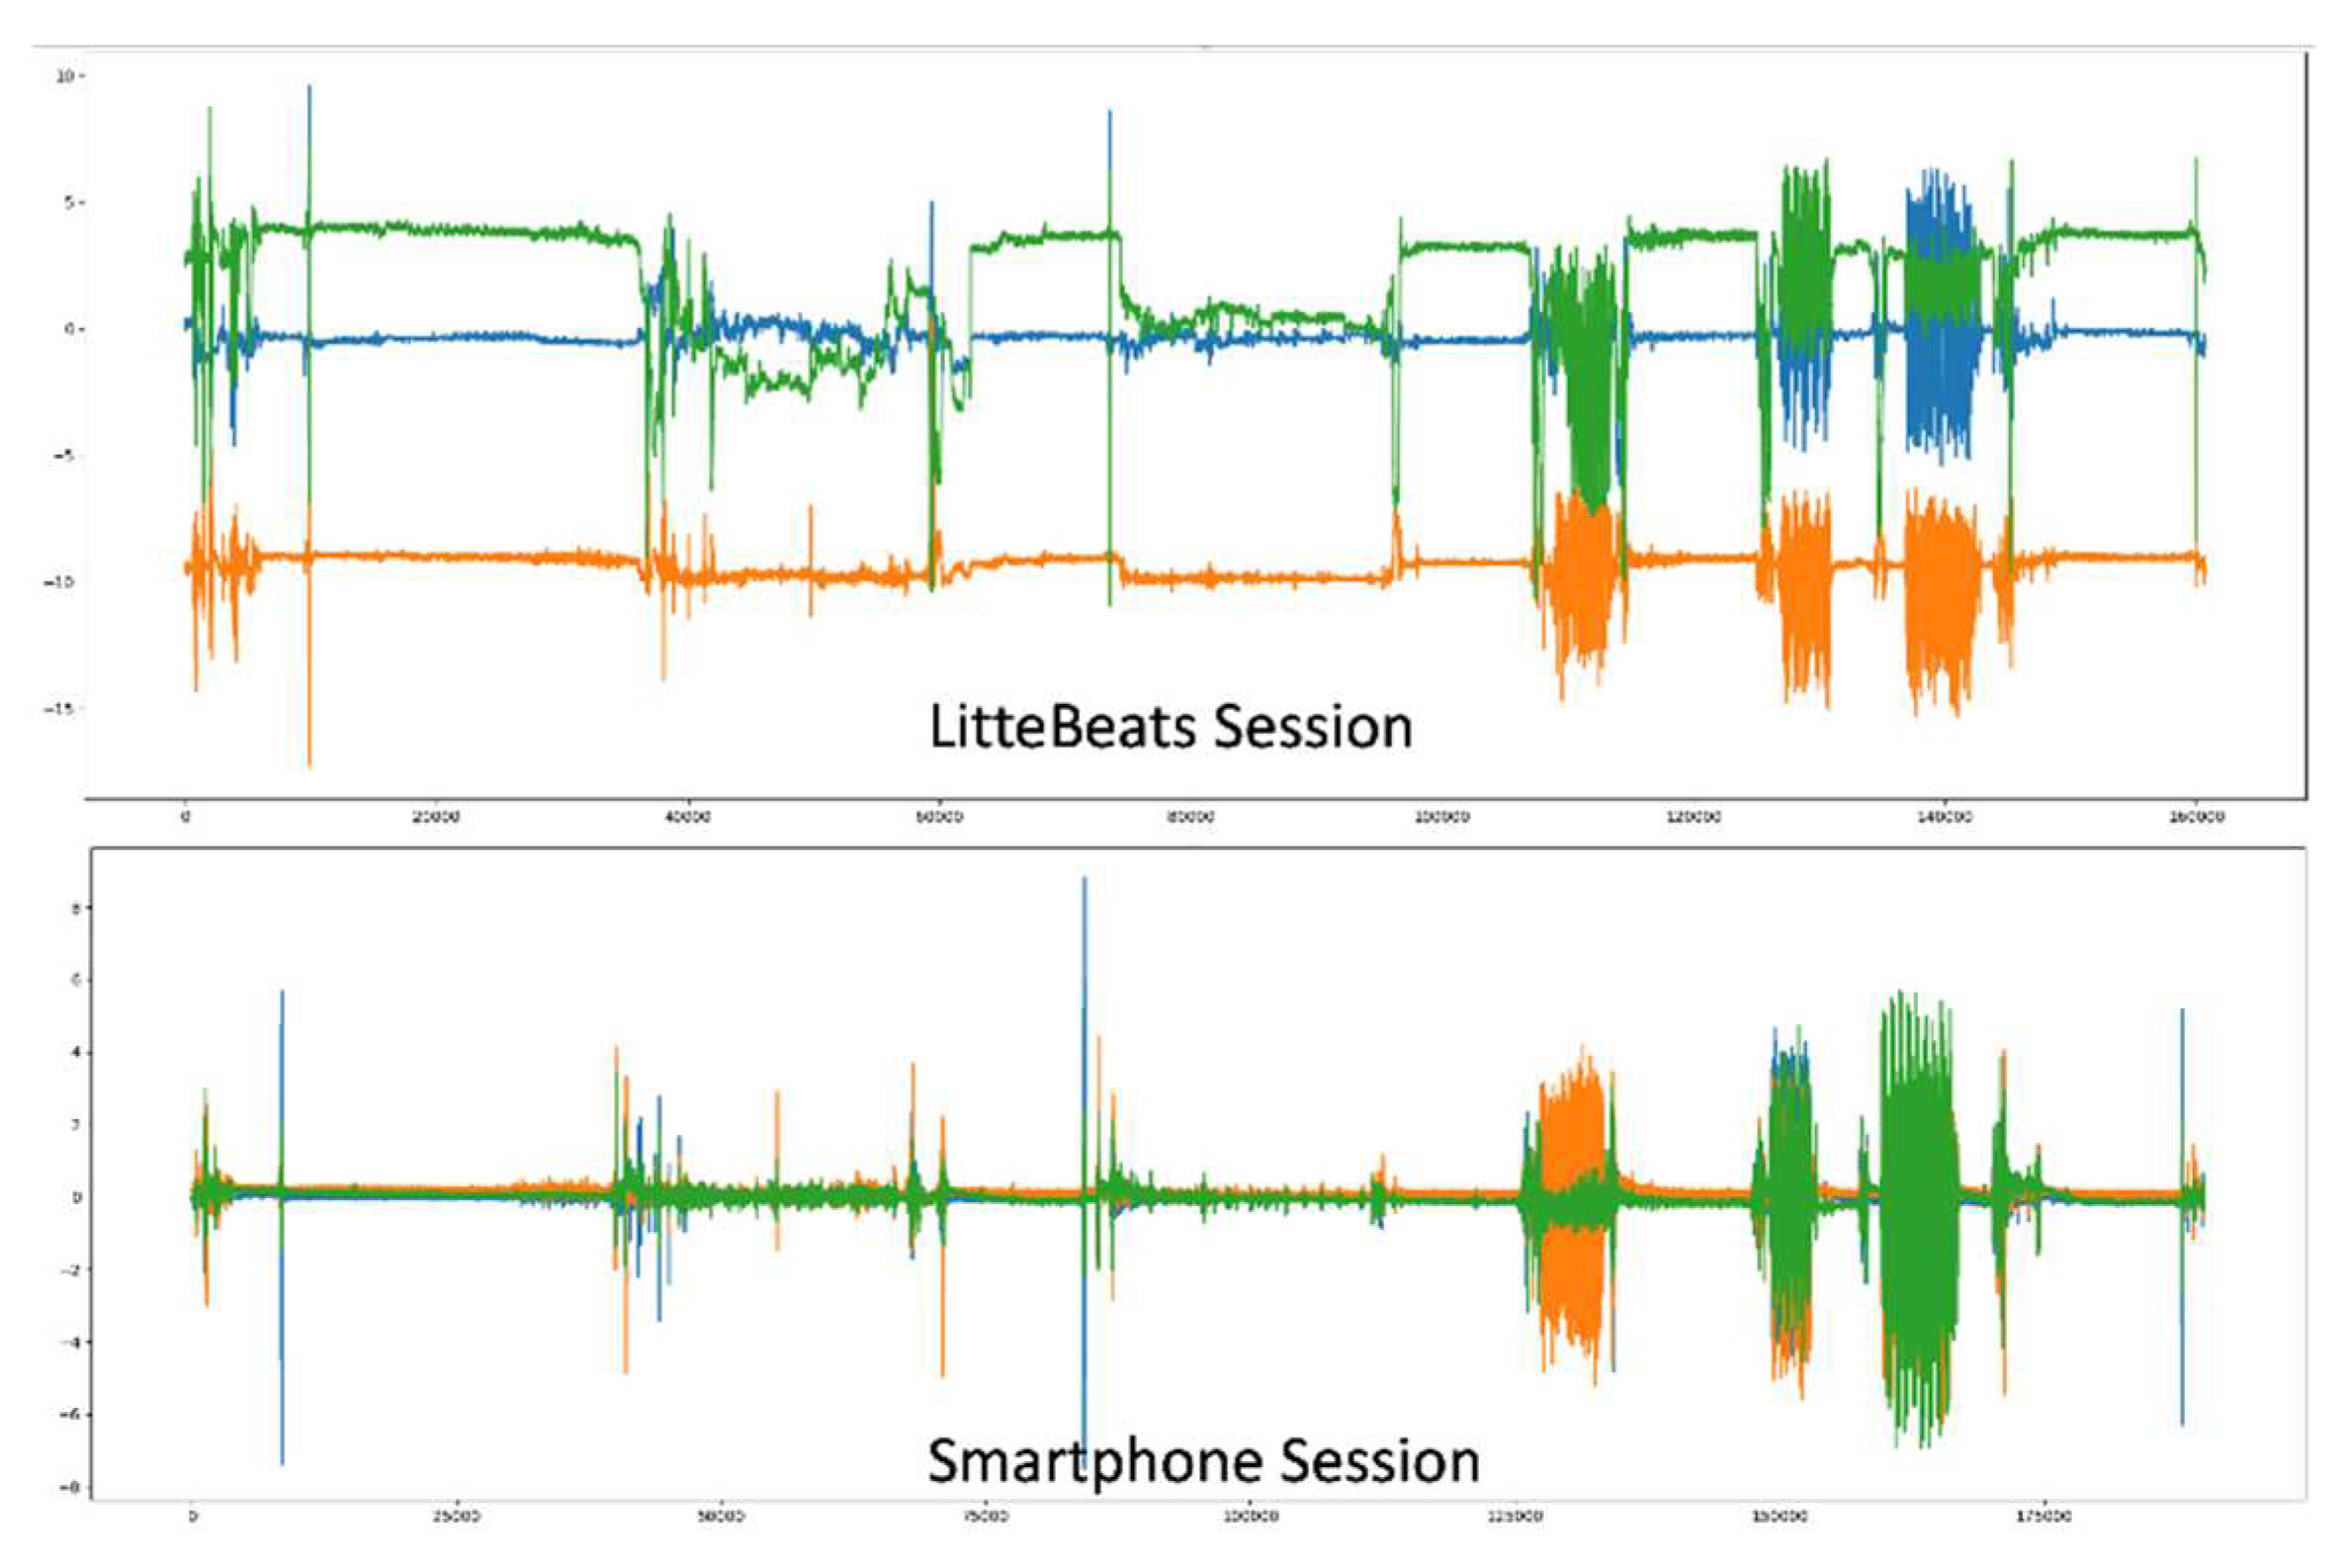
5.1.2. Study Procedure
- The participant sits on a chair and watches a video for 2 minutes.
- Between each activity, the participant stands for 30 seconds.
- The participant walks to the end of the room and back three times
- The participant glides or steps to the left until they reach the end of the room, then glides or steps to the right until they reach to the other end of the room, for one minute.
- The participant completes squats or deep knee bends for one minute.
- The participant sits in an office chair and rotates slowly five times.
5.1.3. Data Processing:
5.2. Results
5.2.1. Data Distribution and Balancing
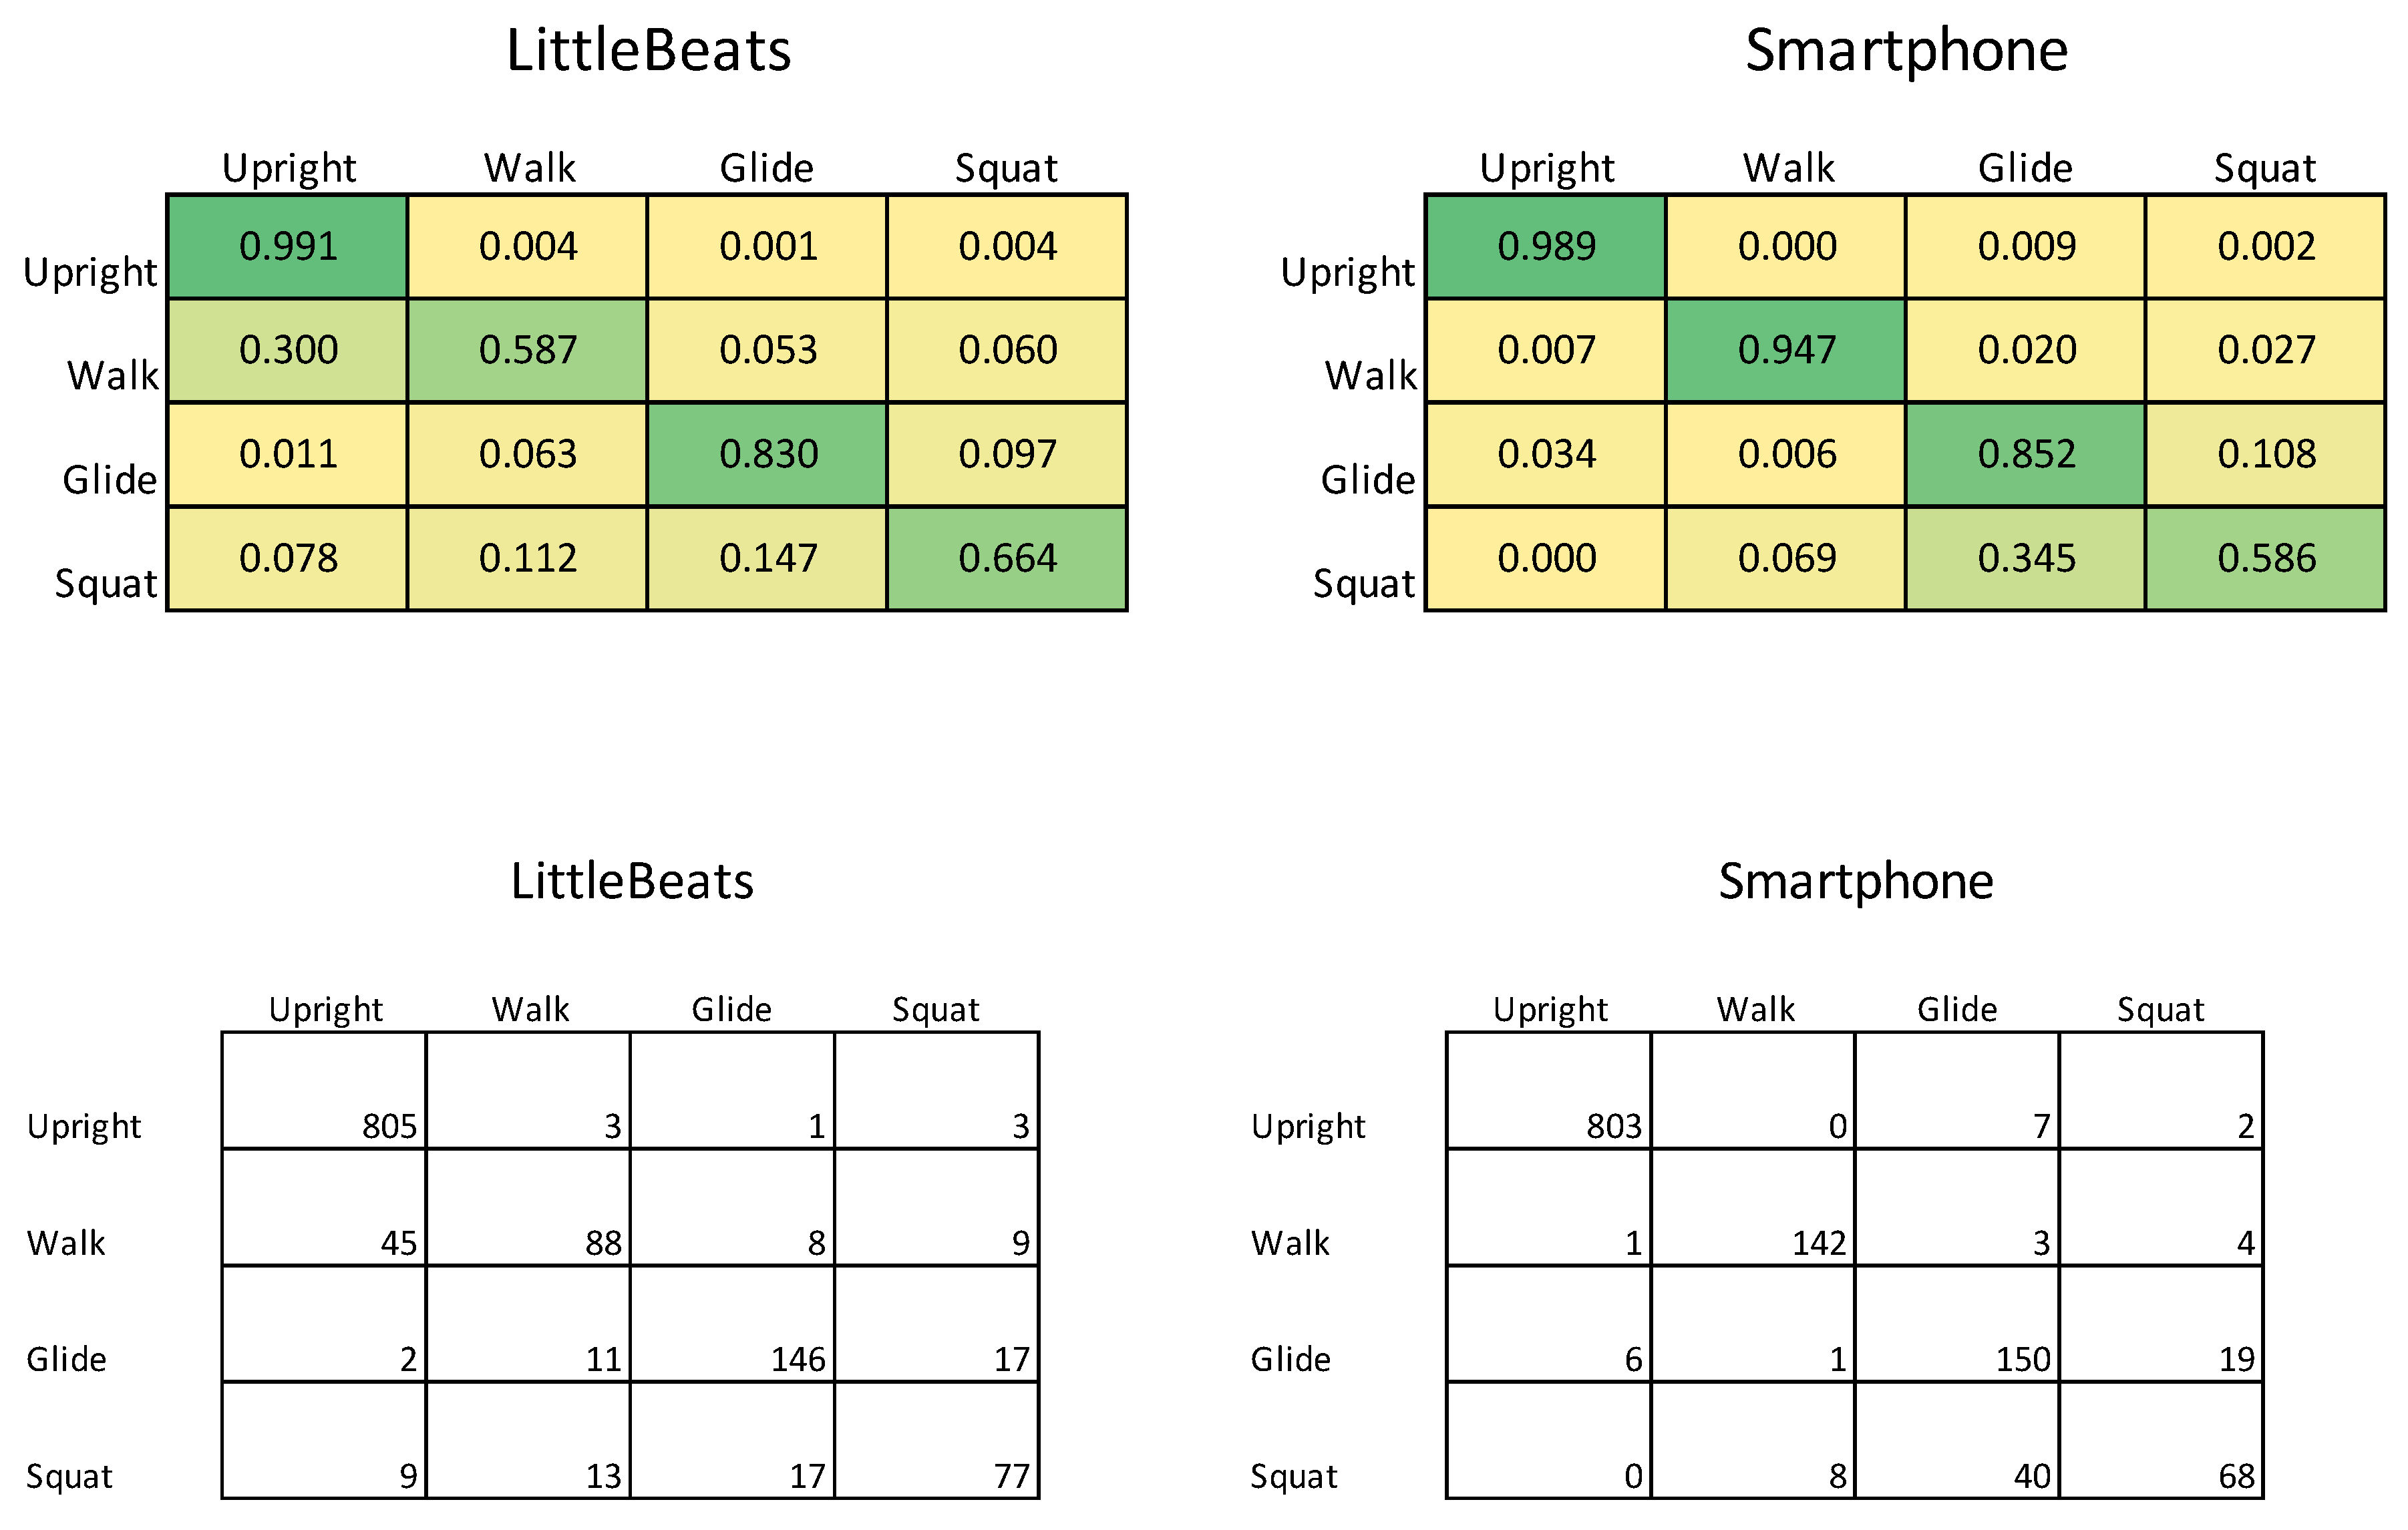
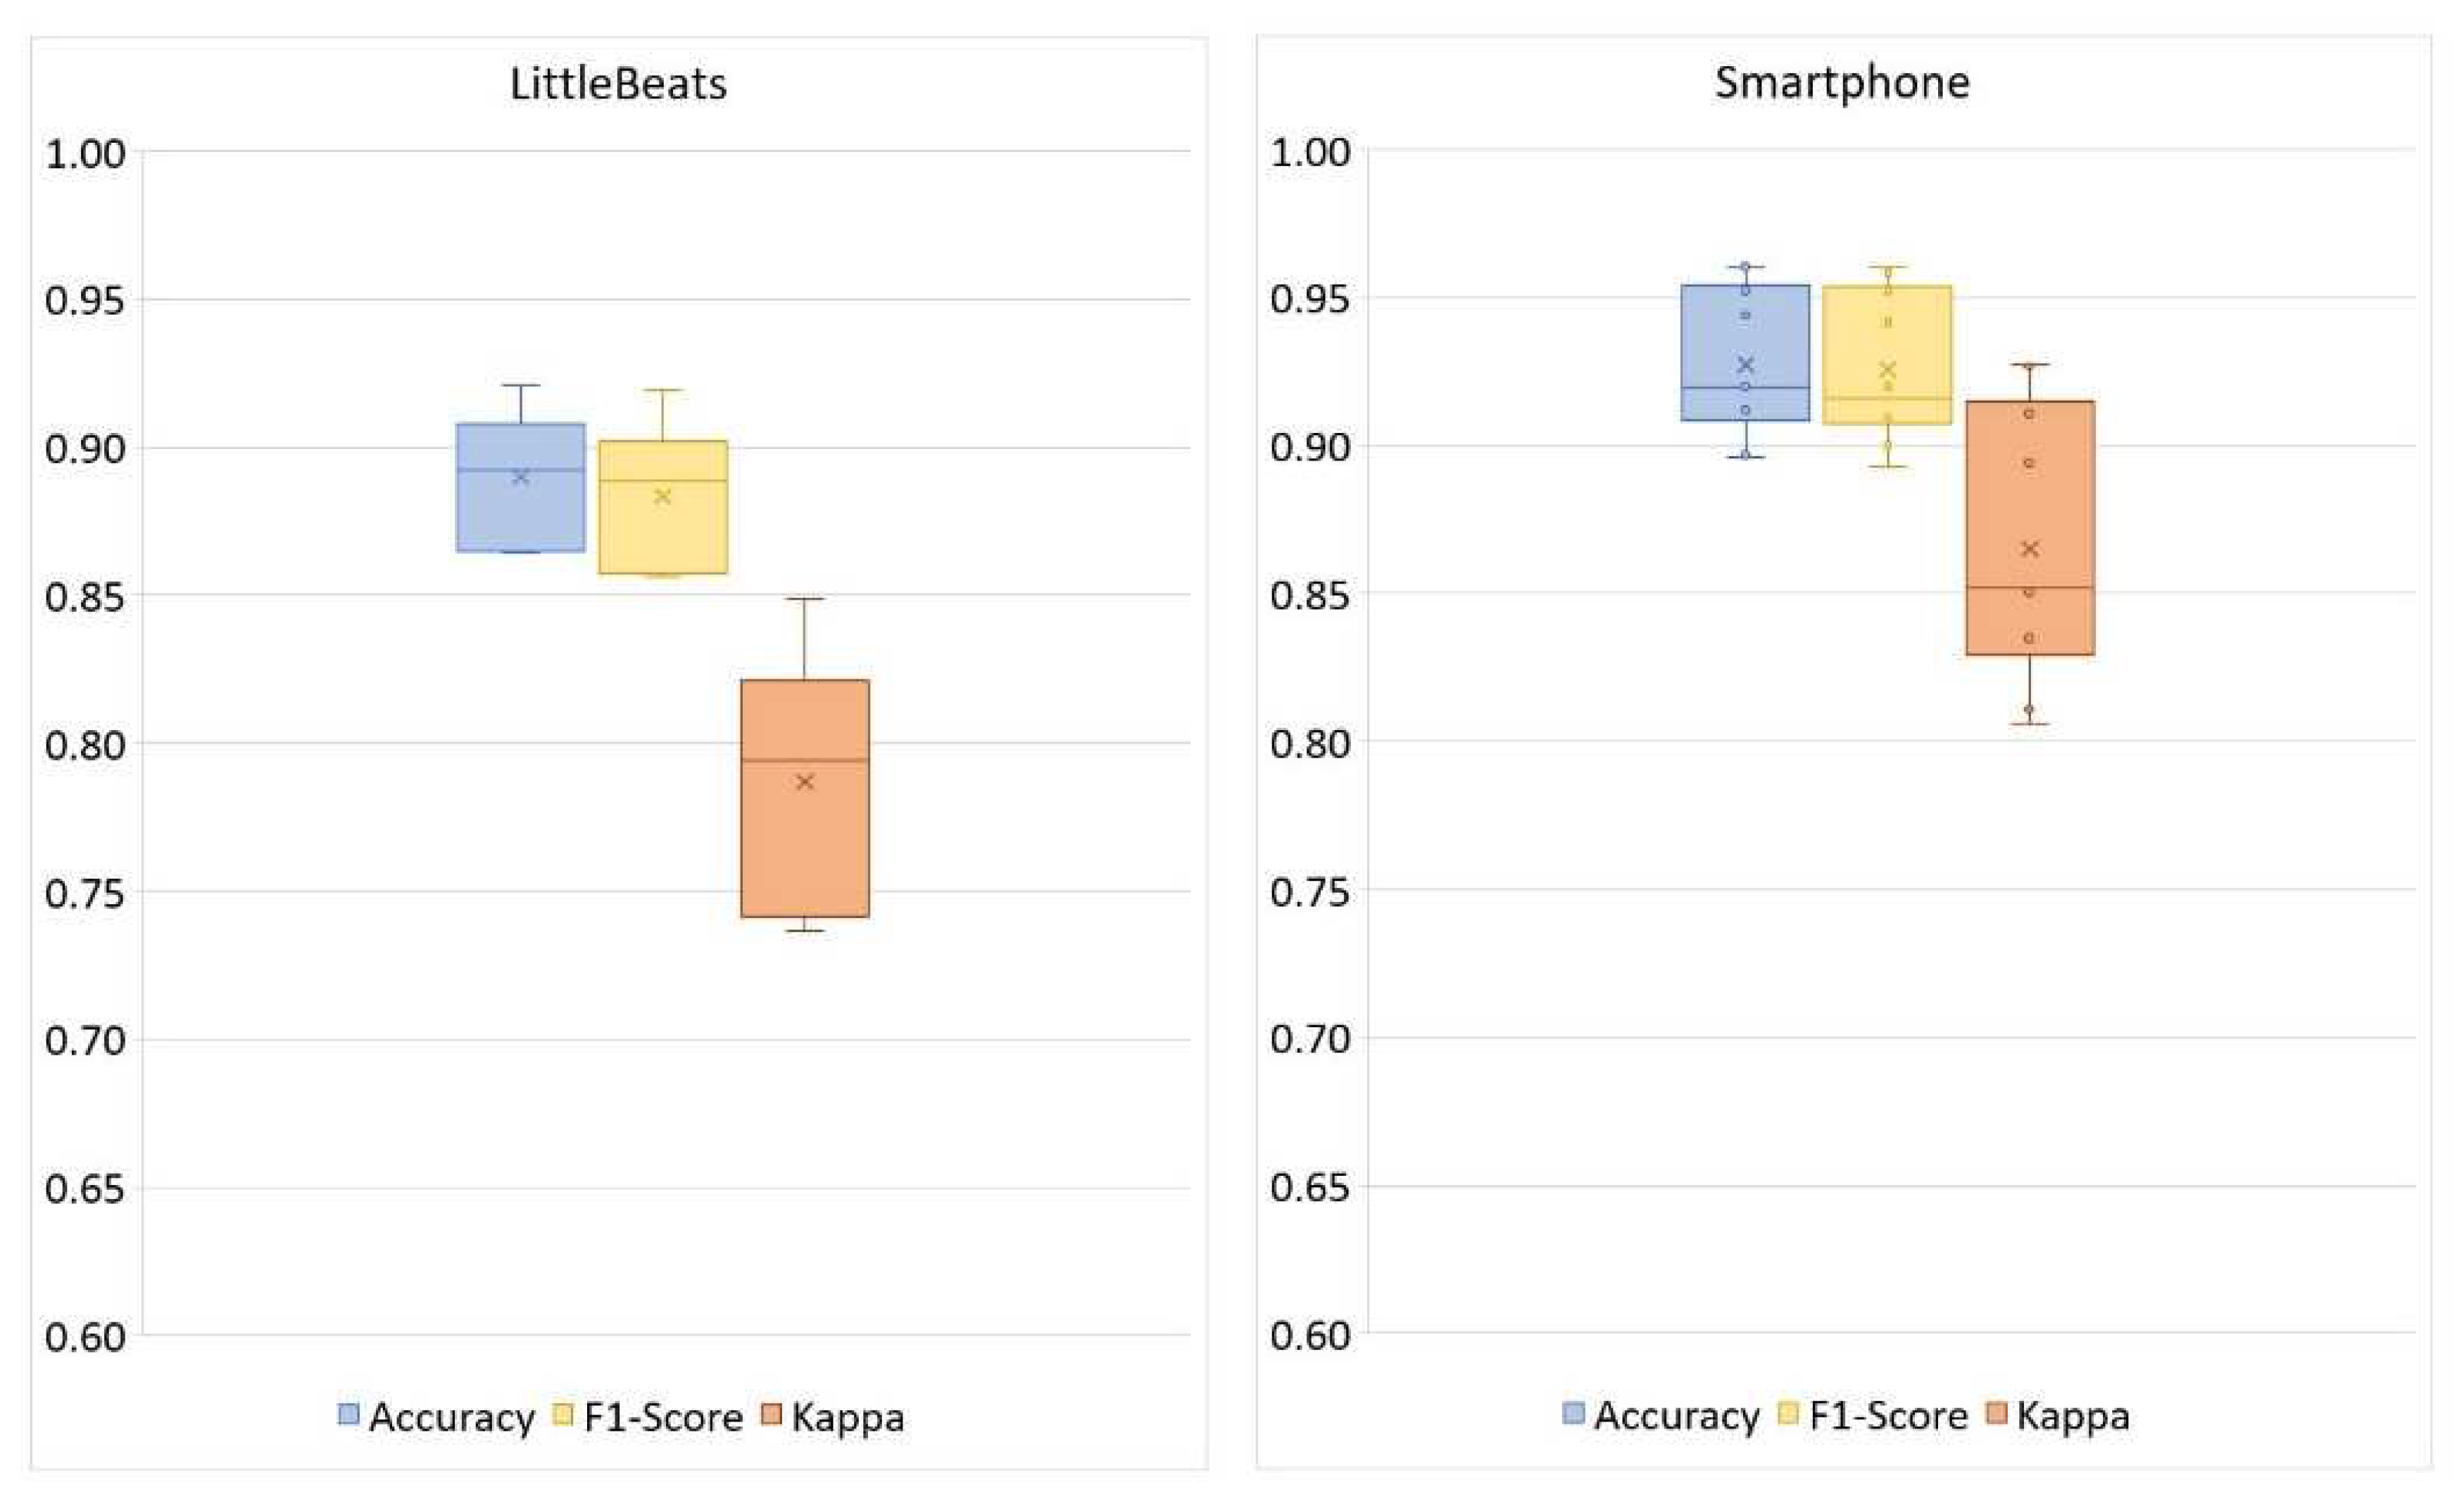
5.2.2. Classification
| LittleBeats™ | |||
| Correct | Incorrect | ||
| Smartphone | Correct | 1065 | 95 |
| Incorrect | 61 | 33 | |
6. Study 4: Validation of Audio sensor - Speech Emotion Recognition
6.1. Materials & Methods
6.1.1. Participants
6.1.2. Study Procedure
6.1.3. Cross-Validation Check on Emotional Speech Corpus.
6.1.4. Audio data processing
6.2. Results
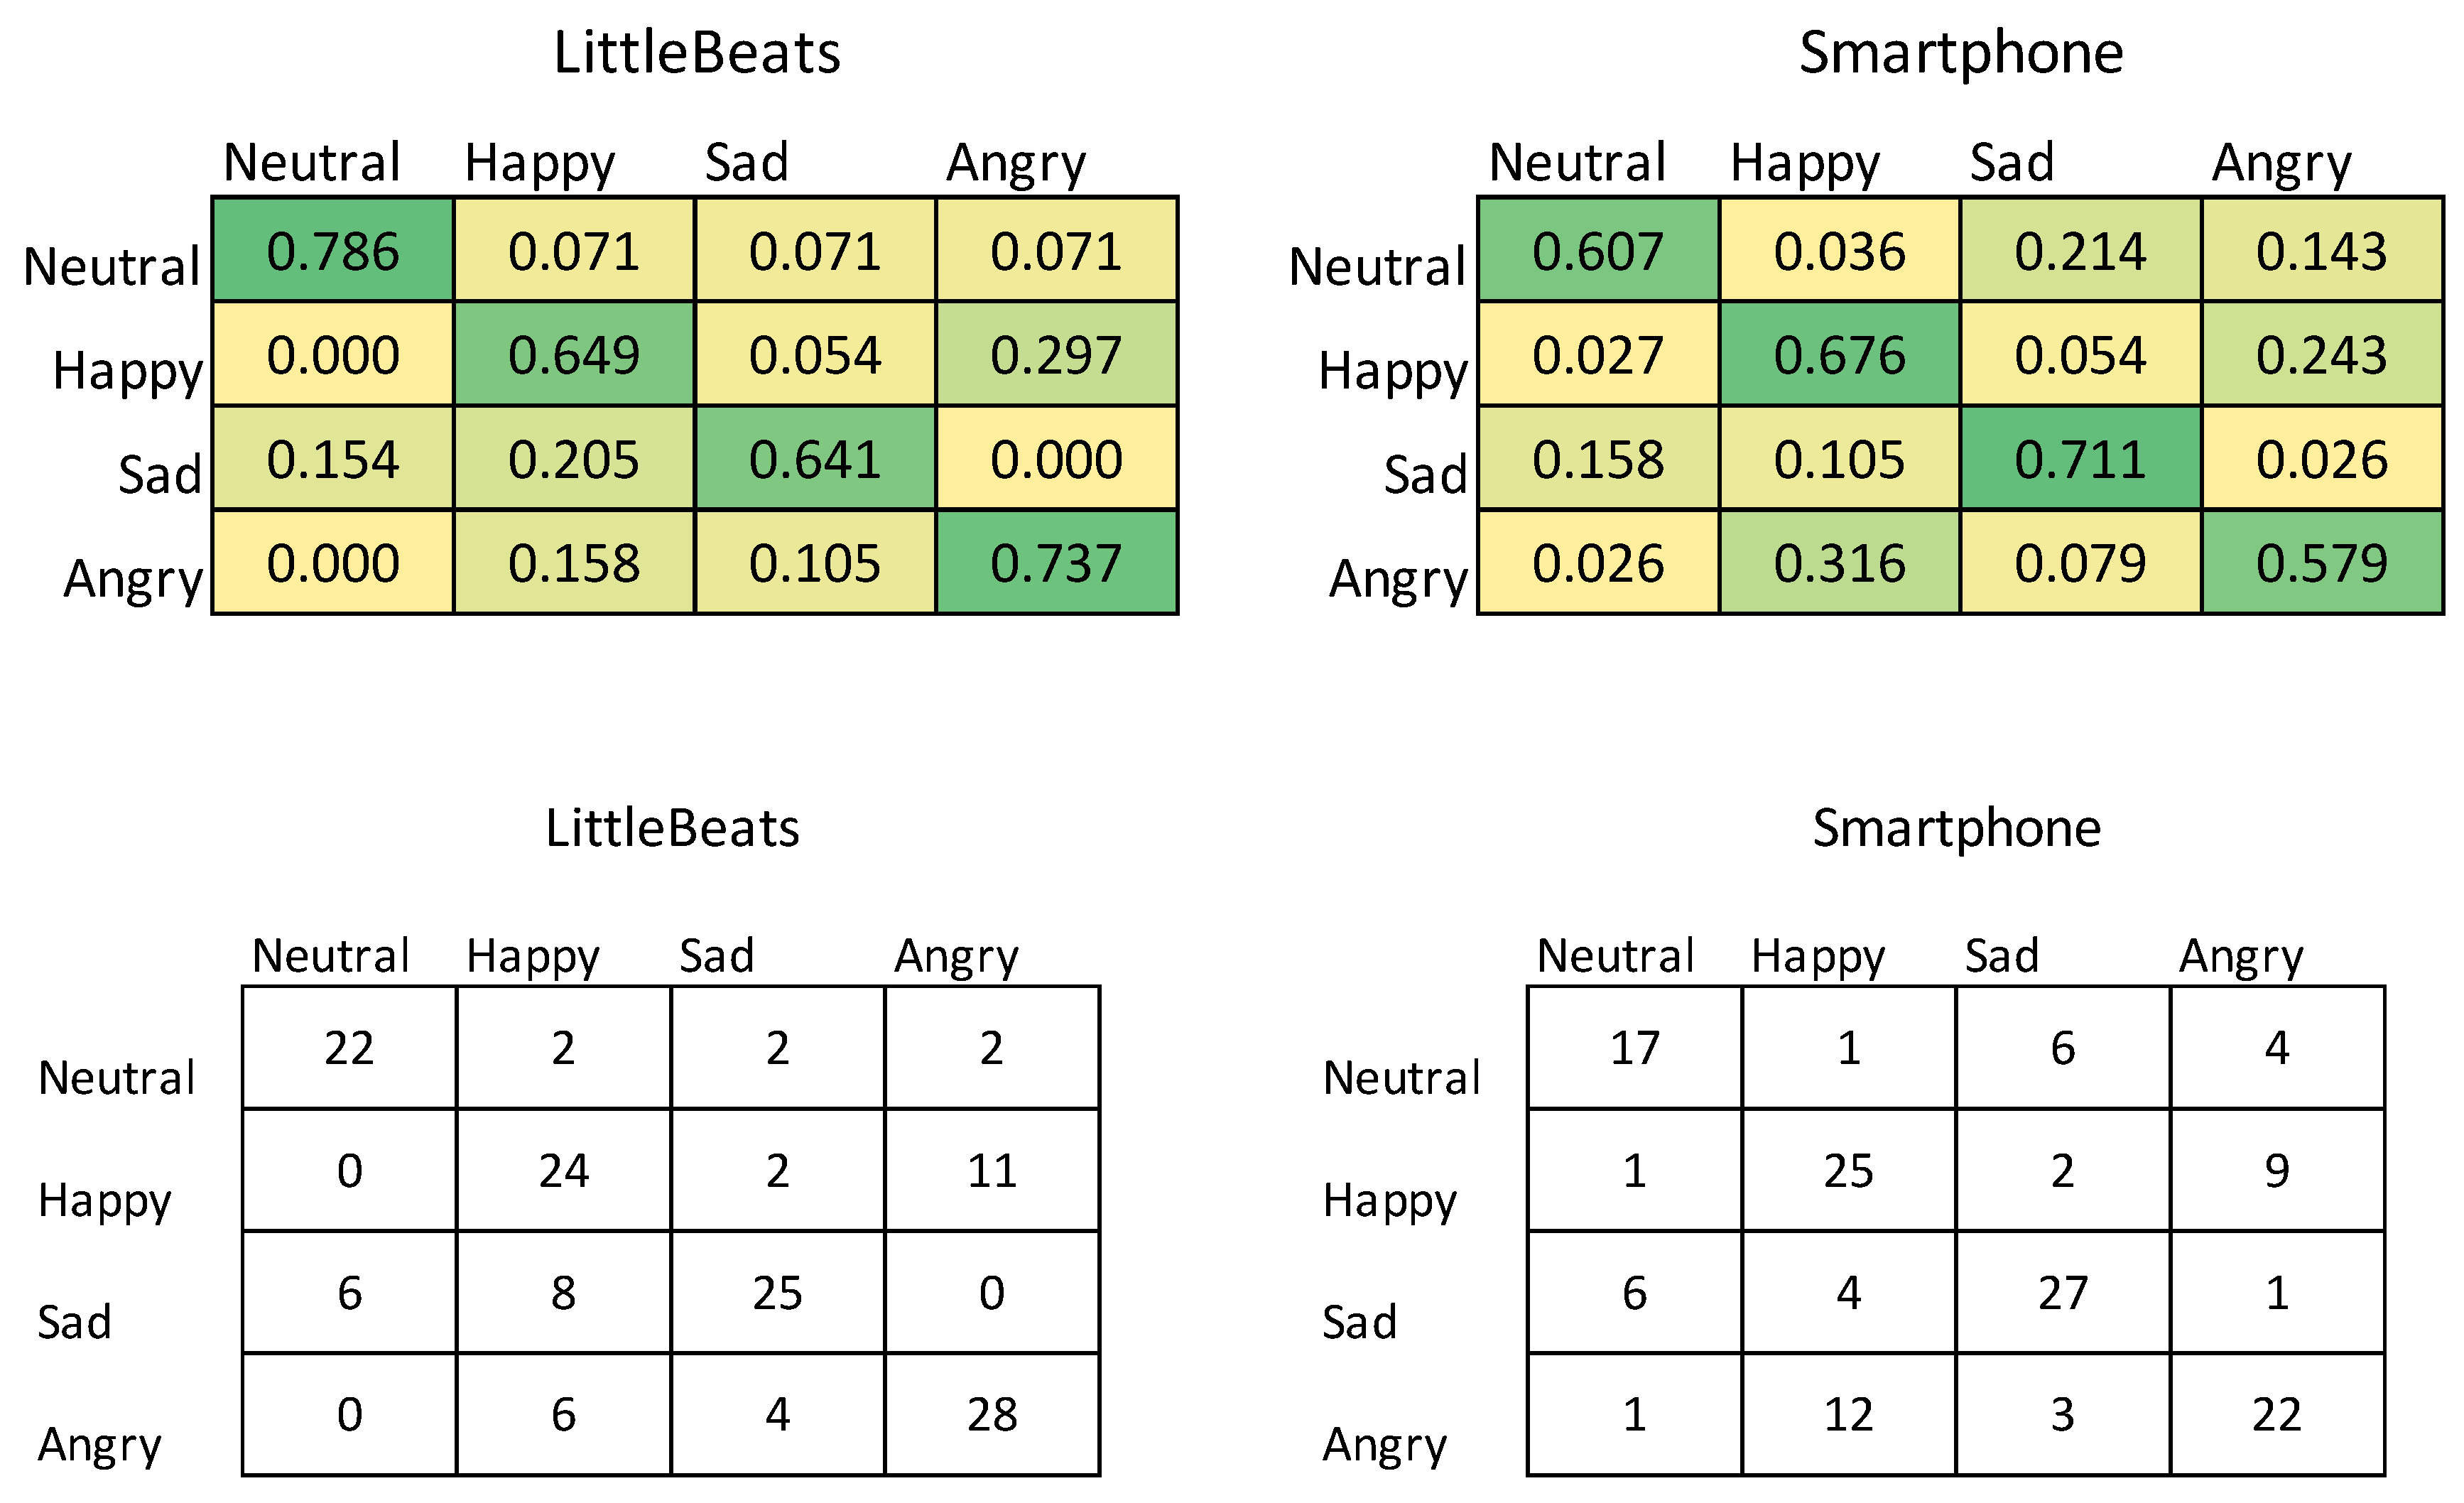
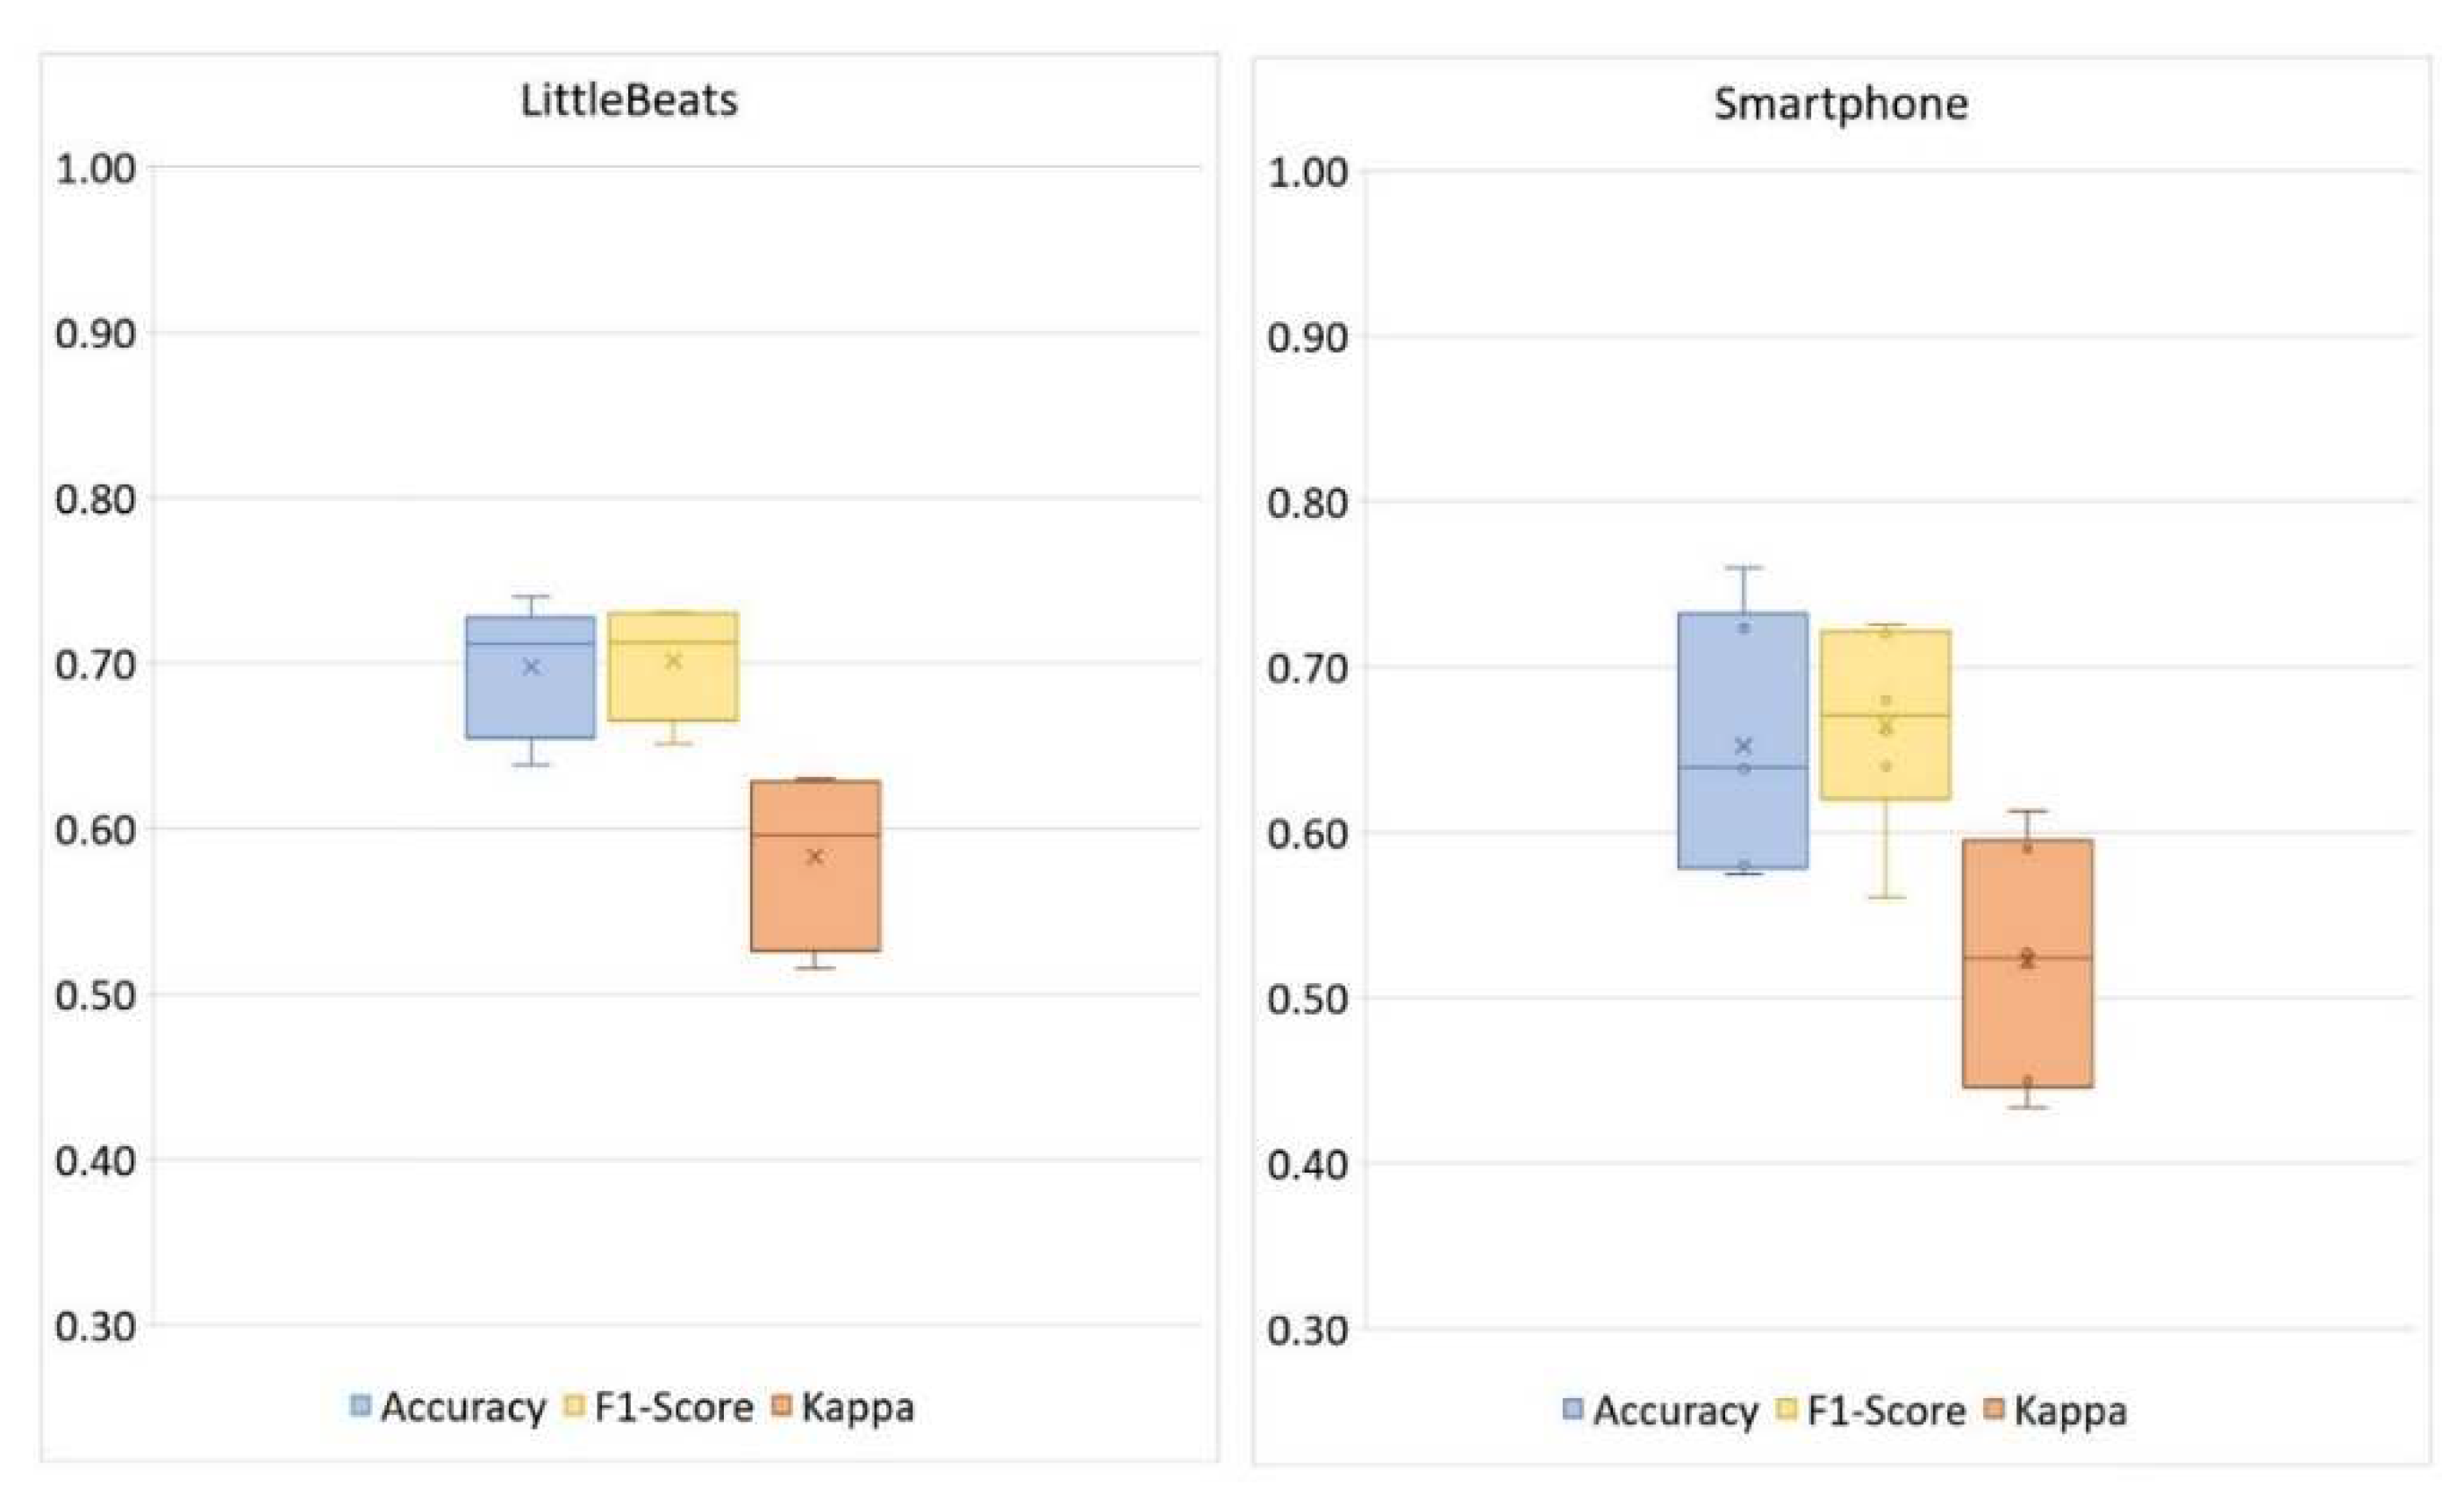
| LittleBeats™ | |||
| Correct | Incorrect | ||
| Smartphone | Correct | 75 | 16 |
| Incorrect | 23 | 27 | |
7. Study 5: Validation of Audio sensor - Automatic Speech Recognition
7.1. Materials & Methods
7.1.1. Participants
7.1.2. Study Procedure
7.2. Results
| Models | LittleBeats™ WER | smartphone WER |
| Greedy decoding | 5.75% | 3.58% |
| Beam search | 5.80% | 3.63% |
| Beam search + language model | 4.16% | 2.73% |
8. Discussion
8.1. ECG sensor
8.2. IMU sensor
8.3. Audio sensor
8.4. Limitations and Future Directions
9. Conclusions
Supplementary Materials
Author Contributions
Funding
Institutional Review Board (IRB) Statement
Informed Consent
Data Availability Statement
Acknowledgement
Conflicts of Interest
References
- D. C. Mohr, M. Zhang, and S. M. Schueller, “Personal sensing: Understanding mental health using ubiquitous sensors and machine learning,” Annu Rev Clin Psychol, vol. 13, pp. 23–47, 2017. [CrossRef]
- J. M. Peake, G. Kerr, and J. P. Sullivan, “A critical review of consumer wearables, mobile applications, and equipment for providing biofeedback, monitoring stress, and sleep in physically active populations,” Front Physiol, vol. 9, no. JUN, pp. 1–19, 2018. [CrossRef]
- M. N. Sawka and K. E. Friedl, “Emerging wearable physiological monitoring technologies and decision AIDS for health and performance,” J Appl Physiol, vol. 124, no. 2, pp. 430–431, 2018. [CrossRef]
- G. Muhammad, F. Alshehri, F. Karray, Ae. Saddik, M. Alsulaiman, and T. H. Falk, “A comprehensive survey on multimodal medical signals fusion for smart healthcare systems,” Information Fusion, vol. 76, no. November 2020, pp. 355–375, 2021. [CrossRef]
- M. P. Wallen, S. R. Gomersall, S. E. Keating, U. Wisløff, and J. S. Coombes, “Accuracy of heart rate watches: Implications for weight management,” PLoS One, vol. 11, no. 5, May 2016. [CrossRef]
- O. Walch, Y. Huang, D. Forger, and C. Goldstein, “Sleep stage prediction with raw acceleration and photoplethysmography heart rate data derived from a consumer wearable device,” Sleep, vol. 42, no. 12, Dec. 2019. [CrossRef]
- K. S. Bagot et al., “Current, future and potential use of mobile and wearable technologies and social media data in the ABCD study to increase understanding of contributors to child health,” Dev Cogn Neurosci, vol. 32, no. April 2017, pp. 121–129, 2018. [CrossRef]
- B. Böhm, S. D. Karwiese, H. Böhm, and R. Oberhoffer, “Effects of Mobile Health Including Wearable Activity Trackers to Increase Physical Activity Outcomes Among Healthy Children and Adolescents: Systematic Review,” JMIR Mhealth Uhealth, vol. 7, no. 4, pp. e8298–e8298, Apr. 2019. [CrossRef]
- W. Wang, J. Cheng, W. Song, and Y. Shen, “The Effectiveness of Wearable Devices as Physical Activity Interventions for Preventing and Treating Obesity in Children and Adolescents: Systematic Review and Meta-analysis,” JMIR Mhealth Uhealth, vol. 10, no. 4, p. e32435, 2022. [CrossRef]
- Z. Zhu, T. Liu, G. Li, T. Li, and Y. Inoue, “Wearable sensor systems for infants,” Sensors (Switzerland), vol. 15, no. 2. MDPI AG, pp. 3721–3749, Feb. 05, 2015. [CrossRef]
- H. U. Chung et al., “Skin-interfaced biosensors for advanced wireless physiological monitoring in neonatal and pediatric intensive-care units,” Nat Med, vol. 26, no. 3, pp. 418–429, Mar. 2020. [CrossRef]
- J. Kim et al., “Skin-interfaced wireless biosensors for perinatal and paediatric health,” Nature Reviews Bioengineering, vol. 1, no. 9, pp. 631–647, Jul. 2023. [CrossRef]
- S. F. Memon, M. Memon, and S. Bhatti, “Wearable technology for infant health monitoring: a survey,” IET Circuits, Devices & Systems, vol. 14, no. 2, pp. 115–129, Mar. 2020. [CrossRef]
- J. N. Wong et al., “A comprehensive wireless neurological and cardiopulmonary monitoring platform for pediatrics,” PLOS Digital Health, vol. 2, no. 7, p. e0000291, Jul. 2023. [CrossRef]
- K. de Barbaro, “Automated sensing of daily activity: A new lens into development,” Dev Psychobiol, vol. 61, no. 3, pp. 444–464, Apr. 2019. [CrossRef]
- E. L. Hamaker and M. Wichers, “No time like the present: Discovering the hidden dynamics in intensive longitudinal data,” Curr Dir Psychol Sci, vol. 26, no. 1, pp. 10–15, 2017. [CrossRef]
- T. S. Mehl, M. R., & Conner, Handbook of research methods for studying daily life. New York: Guilford Press, 2012.
- N. ( 1 ) Mor et al., “Within-person variations in self-focused attention and negative affect in depression and anxiety: A diary study,” Cogn Emot, vol. 24, no. 1, pp. 48–62, Jan. 2010. [CrossRef]
- F. H. ( 1 Wilhelm 3,4,5,6 ), W. T. ( 1 Roth 4, 7 ), and M. A. ( 2 Sackner 8 ), “The LifeShirt: An advanced system for ambulatory measurement of respiratory and cardiac function,” Behav Modif, vol. 27, no. 5, pp. 671–691, Oct. 2003. [CrossRef]
- S. P. Behere and C. M. Janson, “Smart Wearables in Pediatric Heart Health,” Journal of Pediatrics, vol. 253, pp. 1–7, Feb. 2023. [CrossRef]
- H. J. Nuske et al., “Evaluating commercially available wireless cardiovascular monitors for measuring and transmitting real-time physiological responses in children with autism,” 2021. [CrossRef]
- M. R. ( 1 ) Mehl, J. W. ( 1 Pennebaker 5 ), D. M. ( 2 ) Crow, J. ( 3 ) Dabbs, and J. H. ( 4 ) Price, “The Electronically Activated Recorder (EAR): A device for sampling naturalistic daily activities and conversations,” Behavior Research Methods, Instruments, and Computers, vol. 33, no. 4, pp. 517–523, Jan. 2001. [CrossRef]
- Y. Wang, R. Williams, L. Dilley, and D. M. Houston, “A meta-analysis of the predictability of LENATM automated measures for child language development HHS Public Access,” Developmental Review, vol. 57, 2020. [CrossRef]
- M. Cychosz et al., “Longform recordings of everyday life: Ethics for best practices,” Behav Res Methods, vol. 52, no. 5, pp. 1951–1969, Oct. 2020. [CrossRef]
- F. Bulgarelli and E. Bergelson, “Look who’s talking: A comparison of automated and human-generated speaker tags in naturalistic day-long recordings,” Behav Res Methods, vol. 52, no. 2, pp. 641–653, Apr. 2020. [CrossRef]
- C. R. Greenwood, K. Thiemann-Bourque, D. Walker, J. Buzhardt, and J. Gilkerson, “Assessing children’s home language environments using automatic speech recognition technology,” Commun Disord Q, vol. 32, no. 2, pp. 83–92, Feb. 2011. [CrossRef]
- M. N. Ul Hasan and I. I. Negulescu, “Wearable technology for baby monitoring: a review,” Journal of Textile Engineering & Fashion Technology, vol. 6, no. 4, Jul. 2020. [CrossRef]
- E. Grooby, C. Sitaula, T. Chang Kwok, D. Sharkey, F. Marzbanrad, and A. Malhotra, “Artificial intelligence-driven wearable technologies for neonatal cardiorespiratory monitoring: Part 1 wearable technology,” Pediatric Research, vol. 93, no. 2. Springer Nature, pp. 413–425, Jan. 01, 2023. [CrossRef]
- S. W. Porges, “Cardiac vagal tone: A physiological index of stress,” Neurosci Biobehav Rev, vol. 19, no. 2, pp. 225–233, 1995. [CrossRef]
- J. M. Franchak, M. Tang, H. Rousey, and C. Luo, “Long-form recording of infant body position in the home using wearable inertial sensors,” Behav Res Methods, 2023. [CrossRef]
- J. M. Franchak, V. Scott, and C. Luo, “A Contactless Method for Measuring Full-Day, Naturalistic Motor Behavior Using Wearable Inertial Sensors,” Front Psychol, vol. 12, Oct. 2021. [CrossRef]
- M. Airaksinen et al., “Intelligent wearable allows out-of-the-lab tracking of developing motor abilities in infants,” Communications Medicine, vol. 2, no. 1, Jun. 2022. [CrossRef]
- M. Airaksinen et al., “Automatic posture and movement tracking of infants with wearable movement sensors,” Sci Rep, vol. 10, no. 1, p. 169, 2020. [CrossRef]
- D. Hendry et al., “Objective Measurement of Posture and Movement in Young Children Using Wearable Sensors and Customised Mathematical Approaches: A Systematic Review,” Sensors, vol. 23, no. 24. Multidisciplinary Digital Publishing Institute (MDPI), Dec. 01, 2023. [CrossRef]
- S. V. Wass, C. G. Smith, K. Clackson, C. Gibb, J. Eitzenberger, and F. U. Mirza, “Parents mimic and influence their infant’s autonomic state through dynamic affective state matching,” Current Biology, vol. 29, no. 14, pp. 2415-2422.e4, Jul. 2019. [CrossRef]
- E. Geangu et al., “EgoActive: Integrated Wireless Wearable Sensors for Capturing Infant Egocentric Auditory–Visual Statistics and Autonomic Nervous System Function ‘in the Wild,’” Sensors, vol. 23, no. 18, Sep. 2023. [CrossRef]
- S. C. Mathews, M. J. Mcshea, C. L. Hanley, A. Ravitz, A. B. Labrique, and A. B. Cohen, “Digital health: A path to validation,” NPJ Digit Med, vol. 2, no. 38, 2019. [CrossRef]
- R. S. McGinnis and E. W. McGinnis, “Advancing Digital Medicine with Wearables in the Wild,” Sensors, vol. 22, no. 12. MDPI, Jun. 01, 2022. [CrossRef]
- E. Tronick, H. Als, L. Adamson, S. Wise, and T. B. Brazelton, “The infant’s response to entrapment between contradictory messages in face-to-face interaction,” J Am Acad Child Psychiatry, vol. 17, no. 1, pp. 1–13, Dec. 1978. [CrossRef]
- J. Mesman, M. H. van IJzendoorn, and M. J. Bakermans-Kranenburg, “The many faces of the Still-Face Paradigm: A review and meta-analysis,” Developmental Review, vol. 29, no. 2, pp. 120–162, Jun. 2009. [CrossRef]
- K. Jones-Mason, A. Alkon, M. Coccia, and N. R. Bush, “Autonomic nervous system functioning assessed during the still-face paradigm: A meta-analysis and systematic review of methods, approach and findings,” Developmental Review, vol. 50, pp. 113–139, Dec. 2018. [CrossRef]
- S. W. Porges and R. E. Bohrer, “The analysis of periodic processes in psychophysiological research,” in Principles of psychophysiology: Physical, social, and inferential elements., New York, NY, US: Cambridge University Press, 1990, pp. 708–753.
- J. Li, M. Hasegawa-Johnson, and N. L. McElwain, “Towards robust family-infant audio analysis based on unsupervised pretraining of wav2vec 2.0 on large-scale unlabeled family audio,” May 2023, Accessed: Jun. 25, 2023. [Online]. Available: https://arxiv.org/abs/2305.12530v2.
- K. C. Chang, M. Hasegawa-Johnson, N. L. McElwain, and B. Islam, “Classification of infant sleep/wake states: Cross-attention among large scale pretrained transformer networks using audio, ECG, and IMU data,” Jun. 2023, Accessed: Jun. 29, 2023. [Online]. Available: https://arxiv.org/abs/2306.15808v1.
- N. L. McElwain, M. C. Fisher, C. Nebeker, J. M. Bodway, B. Islam, and M. Hasegawa-Johnson, “Evaluating users’ experiences of a child multimodal wearable device,” JMIR Hum Factors, vol. Preprint, 2023, [Online]. Available: https://preprints.jmir.org/preprint/49316.
- S. W. Porges, The polyvagal theory: Neurophysiological foundations of emotions, attachment, communication, and self-regulation. New York, NY: Norton, 2011.
- S. W. Porges, “The polyvagal perspective,” Biol Psychol, vol. 74, no. 2, pp. 116–143, Feb. 2007, [Online]. Available: http://10.0.3.248/j.biopsycho.2006.06.009.
- T. P. Beauchaine, “Respiratory sinus arrhythmia: A transdiagnostic biomarker of emotion dysregulation and psychopathology,” Curr Opin Psychol, vol. 3, pp. 43–47, 2015. [CrossRef]
- S. D. Calkins, P. A. Graziano, L. E. Berdan, S. P. Keane, and K. A. Degnan, “Predicting cardiac vagal regulation in early childhood from maternal–child relationship quality during toddlerhood,” Dev Psychobiol, vol. 50, no. 8, pp. 751–766, Dec. 2008. [CrossRef]
- S. W. Porges and S. A. Furman, “The early development of the autonomic nervous system provides a neural platform for social behaviour: A polyvagal perspective,” Infant Child Dev, vol. 20, no. 1, pp. 106–118, Jan. 2011. [CrossRef]
- L. C. Huffman, Y. E. Bryan, R. del Carmen, F. A. Pedersen, J. A. Doussard-Roosevelt, and S. W. Porges, “Infant temperament and cardiac vagal tone: Assessments at twelve weeks of age,” Child Dev, vol. 69, no. 3, pp. 624–635, Jun. 1998. [CrossRef]
- M. I. Davila, G. F. Lewis, and S. W. Porges, “The PhysioCam: A novel non-contact sensor to measure heart rate variability in clinical and field applications,” Front Public Health, vol. 5, Nov. 2017. [CrossRef]
- A. R. Palmer, R. Distefano, K. Leneman, and D. Berry, “Reliability of the BodyGuard2 (FirstBeat) in the detection of heart rate variability,” Applied Psychophysiology Biofeedback, vol. 46, no. 3, pp. 251–258, Sep. 2021. [CrossRef]
- K. J. Heilman and S. W. Porges, “Accuracy of the LifeShirt® (Vivometrics) in the detection of cardiac rhythms,” Biol Psychol, vol. 75, no. 3, pp. 300–305, Jul. 2007. [CrossRef]
- Y. Su, P. Malachuk, D. Shah, and A. Khorana, “Precision differential drone navigation.” 2022.
- M. L. Hoang and A. Pietrosanto, “An effective method on vibration immunity for inclinometer based on MEMS accelerometer,” Proceedings of the International Semiconductor Conference, CAS, vol. 2020-October, pp. 105–108, Oct. 2020. [CrossRef]
- Z. Rysbek, K. H. Oh, B. Abbasi, M. Zefran, and B. Di Eugenio, “Physical action primitives for collaborative decision making in human-human manipulation,” in 2021 30th IEEE International Conference on Robot and Human Interactive Communication, RO-MAN 2021, Institute of Electrical and Electronics Engineers Inc., Aug. 2021, pp. 1319–1325. [CrossRef]
- M. Straczkiewicz, P. James, and J. P. Onnela, “A systematic review of smartphone-based human activity recognition methods for health research,” npj Digital Medicine, vol. 4, no. 1. Nature Research, Dec. 01, 2021. [CrossRef]
- C. A. Ronao and S. B. Cho, “Human activity recognition with smartphone sensors using deep learning neural networks,” Expert Syst Appl, vol. 59, pp. 235–244, Oct. 2016. [CrossRef]
- H. F. Nweke, Y. W. Teh, M. A. Al-garadi, and U. R. Alo, “Deep learning algorithms for human activity recognition using mobile and wearable sensor networks: State of the art and research challenges,” Expert Syst Appl, vol. 105, pp. 233–261, Sep. 2018. [CrossRef]
- T. J. Saun and T. P. Grantcharov, “Design and validation of an inertial measurement unit (IMU)-based sensor for capturing camera movement in the operating room,” HardwareX, vol. 9, p. e00179, Apr. 2021. [CrossRef]
- J. Henschke, H. Kaplick, M. Wochatz, and T. Engel, “Assessing the validity of inertial measurement units for shoulder kinematics using a commercial sensor-software system: A validation study,” Health Sci Rep, vol. 5, no. 5, p. e772, Sep. 2022. [CrossRef]
- M. Blandeau, R. Guichard, R. Hubaut, and S. Leteneur, “Two-step validation of a new wireless inertial sensor system: Application in the squat motion,” Technologies 2022, Vol. 10, Page 72, vol. 10, no. 3, p. 72, Jun. 2022. [CrossRef]
- S. Mirsamadi, E. Barsoum, and C. Zhang, “Automatic speech emotion recognition using recurrent neural networks with local attention,” ICASSP, IEEE International Conference on Acoustics, Speech and Signal Processing - Proceedings, pp. 2227–2231, Jun. 2017. [CrossRef]
- Q. Jin, C. Li, S. Chen, and H. Wu, “Speech emotion recognition with acoustic and lexical features,” 2015 IEEE International Conference on Acoustics, Speech and Signal Processing (ICASSP), vol. 2015-August, pp. 4749–4753, Aug. 2015. [CrossRef]
- R. A. Khalil, E. Jones, M. I. Babar, T. Jan, M. H. Zafar, and T. Alhussain, “Speech emotion recognition using deep learning techniques: A review,” IEEE Access, vol. 7, pp. 117327–117345, 2019. [CrossRef]
- J. Li, M. Hasegawa-Johnson, and N. L. McElwain, “Analysis of acoustic and voice quality features for the classification of infant and mother vocalizations,” Speech Commun, vol. 133, pp. 41–61, Oct. 2021. [CrossRef]
- F. Anders, M. Hlawitschka, and M. Fuchs, “Comparison of artificial neural network types for infant vocalization classification,” IEEE/ACM Trans Audio Speech Lang Process, vol. 29, pp. 54–67, 2021. [CrossRef]
- C. Ji, T. B. Mudiyanselage, Y. Gao, and Y. Pan, “A review of infant cry analysis and classification,” EURASIP J Audio Speech Music Process, vol. 2021, no. 1, pp. 1–17, Dec. 2021. [CrossRef]
- F. Anders, M. Hlawitschka, and M. Fuchs, “Automatic classification of infant vocalization sequences with convolutional neural networks,” Speech Commun, vol. 119, pp. 36–45, May 2020. [CrossRef]
- S. Schneider, A. Baevski, R. Collobert, and M. Auli, “WAV2vec: Unsupervised pre-training for speech recognition,” Proceedings of the Annual Conference of the International Speech Communication Association, INTERSPEECH, vol. 2019-September, pp. 3465–3469, 2019. [CrossRef]
- S. Kim, T. Hori, and S. Watanabe, “Joint CTC-attention based end-to-end speech recognition using multi-task learning,” ICASSP, IEEE International Conference on Acoustics, Speech and Signal Processing - Proceedings, pp. 4835–4839, Jun. 2017. [CrossRef]
- A. Gulati et al., “Conformer: Convolution-augmented transformer for speech recognition,” Proceedings of the Annual Conference of the International Speech Communication Association, INTERSPEECH, vol. 2020-October, pp. 5036–5040, 2020. [CrossRef]
- W. B. Bilker, J. A. Hansen, C. M. Brensinger, J. Richard, R. E. Gur, and R. C. Gur, “Development of abbreviated nine-item forms of the raven’s standard progressive matrices test,” Sage Journals, vol. 19, no. 3, pp. 354–369, May 2012. [CrossRef]
- A. Beaumont, A. R. Burton, J. Lemon, B. K. Bennett, A. Lloyd, and U. Vollmer-Conna, “Reduced Cardiac Vagal Modulation Impacts on Cognitive Performance in Chronic Fatigue Syndrome,” PLoS One, vol. 7, no. 11, Nov. 2012. [CrossRef]
- A. L. Hansen, B. H. Johnsen, and J. F. Thayer, “Vagal influence on working memory and attention,” International Journal of Psychophysiology, vol. 48, no. 3, pp. 263–274, Jun. 2003. [CrossRef]
- R. Castaldo, P. Melillo, U. Bracale, M. Caserta, M. Triassi, and L. Pecchia, “Acute mental stress assessment via short term HRV analysis in healthy adults: A systematic review with meta-analysis,” Biomedical Signal Processing and Control, vol. 18. Elsevier Ltd, pp. 370–377, 2015. [CrossRef]
- P. Graziano and K. Derefinko, “Cardiac vagal control and children’s adaptive functioning: A meta-analysis,” Biological Psychology, vol. 94, no. 1. pp. 22–37, Sep. 2013. [CrossRef]
- S. D. Calkins, P. A. Graziano, and S. P. Keane, “Cardiac vagal regulation differentiates among children at risk for behavior problems,” Biol Psychol, vol. 74, no. 2, pp. 144–153, Feb. 2007. [CrossRef]
- U. of N. Carolina, “CardioPeak for LB software.” Chapel Hill, Brain-Body Center for Psychophysiology and Bioengineering, 2020.
- G. G. Berntson, K. S. Quigley, J. F. Jang, and S. T. Boysen, “An approach to artifact identification: Application to heart period data,” Psychophysiology, vol. 27, no. 5, pp. 586–598, Sep. 1990. [CrossRef]
- U. of N. Carolina, “CardioBatch Plus software.” Chapel Hill, Brain-Body Center for Psychophysiology and Bioengineering, 2020.
- P. H. Charlton et al., “Detecting beats in the photoplethysmogram: Benchmarking open-source algorithms,” Physiol Meas, vol. 43, no. 8, p. 085007, Aug. 2022. [CrossRef]
- J. D. Stone et al., “Assessing the accuracy of popular commercial technologies that measure resting heart rate and heart rate variability,” Front Sports Act Living, vol. 3, p. 585870, Mar. 2021. [CrossRef]
- B. W. Nelson and N. B. Allen, “Accuracy of consumer wearable heart rate measurement during an ecologically valid 24-hour period: Intraindividual validation study,” JMIR Mhealth Uhealth, vol. 7, no. 3, p. e10828, Mar. 2019. [CrossRef]
- “Physical activity monitoring for heart rate - real world analysis,” Mar. 2023. Accessed: Jul. 27, 2023. [Online]. Available: https://shop.cta.tech/a/downloads/-/9cd067bfb80f173f/32bb79b304cb7831.
- D. G. Altman and J. M. Bland, “Measurement in Medicine: The Analysis of Method Comparison Studies,” The Statistician, vol. 32, no. 3, p. 307, Sep. 1983. [CrossRef]
- M. P. Fracasso, S. W. Porges, M. E. Lamb, and A. A. Rosenberg, “Cardiac activity in infancy: Reliability and stability of individual differences,” Infant Behav Dev, vol. 17, no. 3, pp. 277–284, Jul. 1994. [CrossRef]
- “Xsens Functionality | Movella.com.” Accessed: Jun. 20, 2023. [Online]. Available: https://www.movella.com/products/sensor-modules/xsens-functionality.
- J. Cohen, “A coefficient of agreement for nominal scales,” Educ Psychol Meas, vol. 20, no. 1, pp. 37–46, 1960. [CrossRef]
- P. E. Shrout, “Measurement reliability and agreement in psychiatry,” Stat Methods Med Res, vol. 7, no. 3, pp. 301–317, Jun. 1998. [CrossRef]
- L. Gillick and S. J. Cox, “Some statistical issues in the comparison of speech recognition algorithms,” ICASSP, IEEE International Conference on Acoustics, Speech and Signal Processing - Proceedings, vol. 1, pp. 532–535, 1989. [CrossRef]
- S. R. Livingstone and F. A. Russo, “The ryerson audio-visual database of emotional speech and song (ravdess): A dynamic, multimodal set of facial and vocal expressions in north American english,” PLoS One, vol. 13, no. 5, May 2018. [CrossRef]
- “Citations Screenshots and Permissions | Audacity ®.” Accessed: Jun. 26, 2023. [Online]. Available: https://www.audacityteam.org/about/citations-screenshots-and-permissions/.
- F. Pedregosa et al., “Scikit-learn: Machine learning in python,” Journal of Machine Learning Research, vol. 12, pp. 2825–2830, 2011, Accessed: Jun. 19, 2023. [Online]. Available: http://scikit-learn.sourceforge.net.
- G. Fairbanks, Voice and articulation drillbook, 2nd ed. New York: Harper & Row, 1960.
- J. S. Sevitz, B. R. Kiefer, J. E. Huber, and M. S. Troche, “Obtaining objective clinical measures during telehealth evaluations of dysarthria,” Am J Speech Lang Pathol, vol. 30, no. 2, pp. 503–516, Mar. 2021. [CrossRef]
- A. A. Dibazar, S. Narayanan, and T. W. Berger, “Feature analysis for automatic detection of pathological speech,” Annual International Conference of the IEEE Engineering in Medicine and Biology - Proceedings, vol. 1, pp. 182–183, 2002. [CrossRef]
- M. Ravanelli et al., “SpeechBrain: A general-purpose speech toolkit,” ArXiv, 2021. [CrossRef]
- S. Tomar, “Converting video formats with FFmpeg | Linux Journal,” Linux Journal. Accessed: Jun. 26, 2023. [Online]. Available: https://www.linuxjournal.com/article/8517.
- K. Heafield, “KenLM: Faster and smaller language model queries.” pp. 187–197, 2011. Accessed: Jun. 26, 2023. [Online]. Available: https://aclanthology.org/W11-2123.
- A. Valldeperes et al., “Wireless inertial measurement unit (IMU)-based posturography,” European Archives of Oto-Rhino-Laryngology, vol. 276, no. 11, pp. 3057–3065, Nov. 2019. [CrossRef]
- G. Williams, P. Drews, B. Goldfain, J. M. Rehg, and Ie. A. Theodorou, “Information-theoretic model predictive control: Theory and applications to autonomous driving,” IEEE Transactions on Robotics, vol. 34, no. 6, pp. 1603–1622, Dec. 2018. [CrossRef]
| 1 | Most participants read each of the two statements once in a neutral voice and two times for each emotion. To collect more samples of emotional speech, the last three participants read each statement three times for each emotion category, including neutral, resulting in a total possible dataset of 142 utterances for neutral, happy, sad, and angry combined. One happy utterance was excluded from our data set due to lack of agreement among the three human raters.. |
Disclaimer/Publisher’s Note: The statements, opinions and data contained in all publications are solely those of the individual author(s) and contributor(s) and not of MDPI and/or the editor(s). MDPI and/or the editor(s) disclaim responsibility for any injury to people or property resulting from any ideas, methods, instructions or products referred to in the content. |
© 2024 by the authors. Licensee MDPI, Basel, Switzerland. This article is an open access article distributed under the terms and conditions of the Creative Commons Attribution (CC BY) license (http://creativecommons.org/licenses/by/4.0/).


