
You are currently viewing a beta version of our website. If you spot anything unusual, kindly let us know.
Preprint
Article
Temperature Relaxation in Glass-Forming Materials under Local Fast Laser Excitations during Laser-Induced Microstructuring
Altmetrics
Downloads
84
Views
30
Comments
0
A peer-reviewed article of this preprint also exists.


This version is not peer-reviewed
Abstract
The ability to control the temperature distribution T(t,r) and the rate of temperature change Rt,r inside glasses is important for their microstructuring. The lattice temperature is considered at time t, exceeding the electron-phonon thermalization time, and at a distance r from the center of the model spherical heating zone. In order to describe thermal excitations, the heat capacity of glasses must be considered as a function of time due to its long-term relaxation. A method for analytical calculation of T(t,r) and R(t,r) for glasses with dynamic heat capacity cdyn(t) is proposed. It is shown that during laser microstructuring the local cooling rate -R(t,r) significantly depends on the time dispersion of cdyn(t). It has been established that at the periphery of the model heating zone of the laser beam focus, the local cooling rate can reach more than 1011 K/s. Strong cooling rate gradients were found at the periphery of the heating zone, affecting the microstructure of the material. This effect is significantly enhanced by the time dispersion of cdyn(t). The effect associated with this time dispersion is significant even well above the glass transition temperature Tg, since even short relaxation times of the dynamic heat capacity cdyn(t) are significant.
Keywords:
Subject: Physical Sciences - Applied Physics
1. Introduction
Glass-forming materials are often used to create optical elements and components for optical integrated circuits. In the last two decades, the technology of femtosecond laser microfabrication of various optical structures inside glass-forming materials has been intensively developed. Due to the extremely high peak intensities at the focus of femtosecond laser pulses, nonlinear processes such as multiphoton absorption can lead to significant energy absorption even within transparent materials such as glass. Thus, femtosecond laser-induced microstructuring of glass-forming materials opens up wide possibilities for various applications. Laser radiation can cause irreversible local phenomena at the beam focus, such as phase transitions [1], the formation of bubbles or microfluidic channels [2,3,4,5], changes in chemical composition or refractive index [6,7], for example, diffusion and aggregation of silver ions [6] or photo-oxidation [7]. Spatially selective laser-induced crystallization or structure changes of glasses allows direct recording of channel waveguides [1,8,9,10,11,12,13,14]. In fact, laser-written waveguides (with improved mode structure of guided light) can be fabricated by local laser heating inside a glass matrix [8,9]. Thus, optical integrated circuits can be fabricated using a laser beam that induces local structural changes in a glass [15,16,17,18]. Photopolymerization and photodamage by highly focused laser pulses can be used in microchemistry and stereolithography [6,19]. Moreover, femtosecond laser structuring of glass-forming materials can be used for optical long-term storage of information [3,20,21,22,23,24,25,26,27,28,29,30], photonics [31], fabrication of phase gratings [32], nano-gratings [33], and quantum dots that can be used in various devices [34,35,36]. Notably, optical storage based on glass-forming materials has the potential to replace magnetic storage in the quest to provide high-speed, high-capacity, low-power, low-cost, highly secure, and long-term data storage [25,26,27,28,29,30]. However, for the development of these technologies, theoretical models of thermal processes occurring during spatially selective laser-induced structuring of glass-forming materials are required. For example, understanding the dynamics of the laser crystallization process of amorphous Ge films is important for transistor technology, photovoltaic devices, particle detectors, and photodetectors [37]. In fact, the laser crystallization method makes it possible to control the local temperature inside the material and avoid random nucleation [37]. The ability to form and control the dynamics of changes in the temperature distribution inside the material is very important for the opportunity to control the morphology of the laser-written structure inside the glass matrix [22,33,38]. Thus, a deep understanding of the thermal processes inside glass-forming materials under fast laser thermal perturbations is required. In this paper, we focus on local temperature changes, especially the local cooling rate in the focal region during laser-writing processes in a glass matrix (where is the rate of temperature change).
Femtosecond laser-induced microstructuring is a promising tool because the structures induced by femtosecond laser pulses can be even smaller than the optical diffraction limit of the beam focusing, since multiphoton absorption is most effective in the central part of the beam focus. Typically, in laser-induced microstructuring, the laser pulse duration is of the order of 100 fs and the radiation wavelength is about 1 μm. When a transparent material is irradiated with a powerful femtosecond laser pulse focused into a micro-sized focusing zone, multiphoton absorption of the laser radiation energy by electrons of the irradiated material occurs. The energy of the electrons in the laser focus increases sharply during due to electron-photon interaction. The electrons then transfer their energy to the lattice through electron-phonon interaction. The thermalization process takes approximately tens or hundreds of picoseconds [6,10,39,40]. Consequently, the duration of heating pulses that heat the material can be on the order of tens to hundreds of picoseconds. Thus, the material can be locally heated above the glass transition temperature and melting temperature . Heat then spreads through the material and the hot focal zone is rapidly cooled below .
In this article, we will consider laser pulses of moderate energy (in the range 10 – 100 nJ), sufficient to locally heat the material well above the glass transition temperature , but not sufficient to destroy the material with the formation of voids. Thus, the intensity of the laser pulses considered in this article is below the material damage threshold, which, for example, for silica glass is about 1016 W/cm2 [41]. We focus on micrometer-scale local thermal perturbations caused by laser pulses near or below the threshold ionization intensity of a material. The threshold ionization intensity of most transparent solids ranges from 1013 to 1014 W/cm2 for light with a wavelength of about 1 μm [42,43]. For example, the threshold intensity in silica glass and similar glass-forming materials is about 1013 W/cm2 for light pulses with a wavelength of about 1 μm and a duration of 100 fs [42].
Thus, we will consider thermal processes in dielectric glasses below the threshold intensity of ionization of the material and in the time interval after electron-phonon thermalization, when there is no electron-hole plasma. Thus, we are interested in changes in lattice temperature on a time scale outside the time interval when a multi-temperature model is usually considered [12,13,14]. In fact, we are interested in changes in lattice temperature that affect the structure of the material at moderate laser pulse energies and time exceeding the electron-phonon thermalization time.
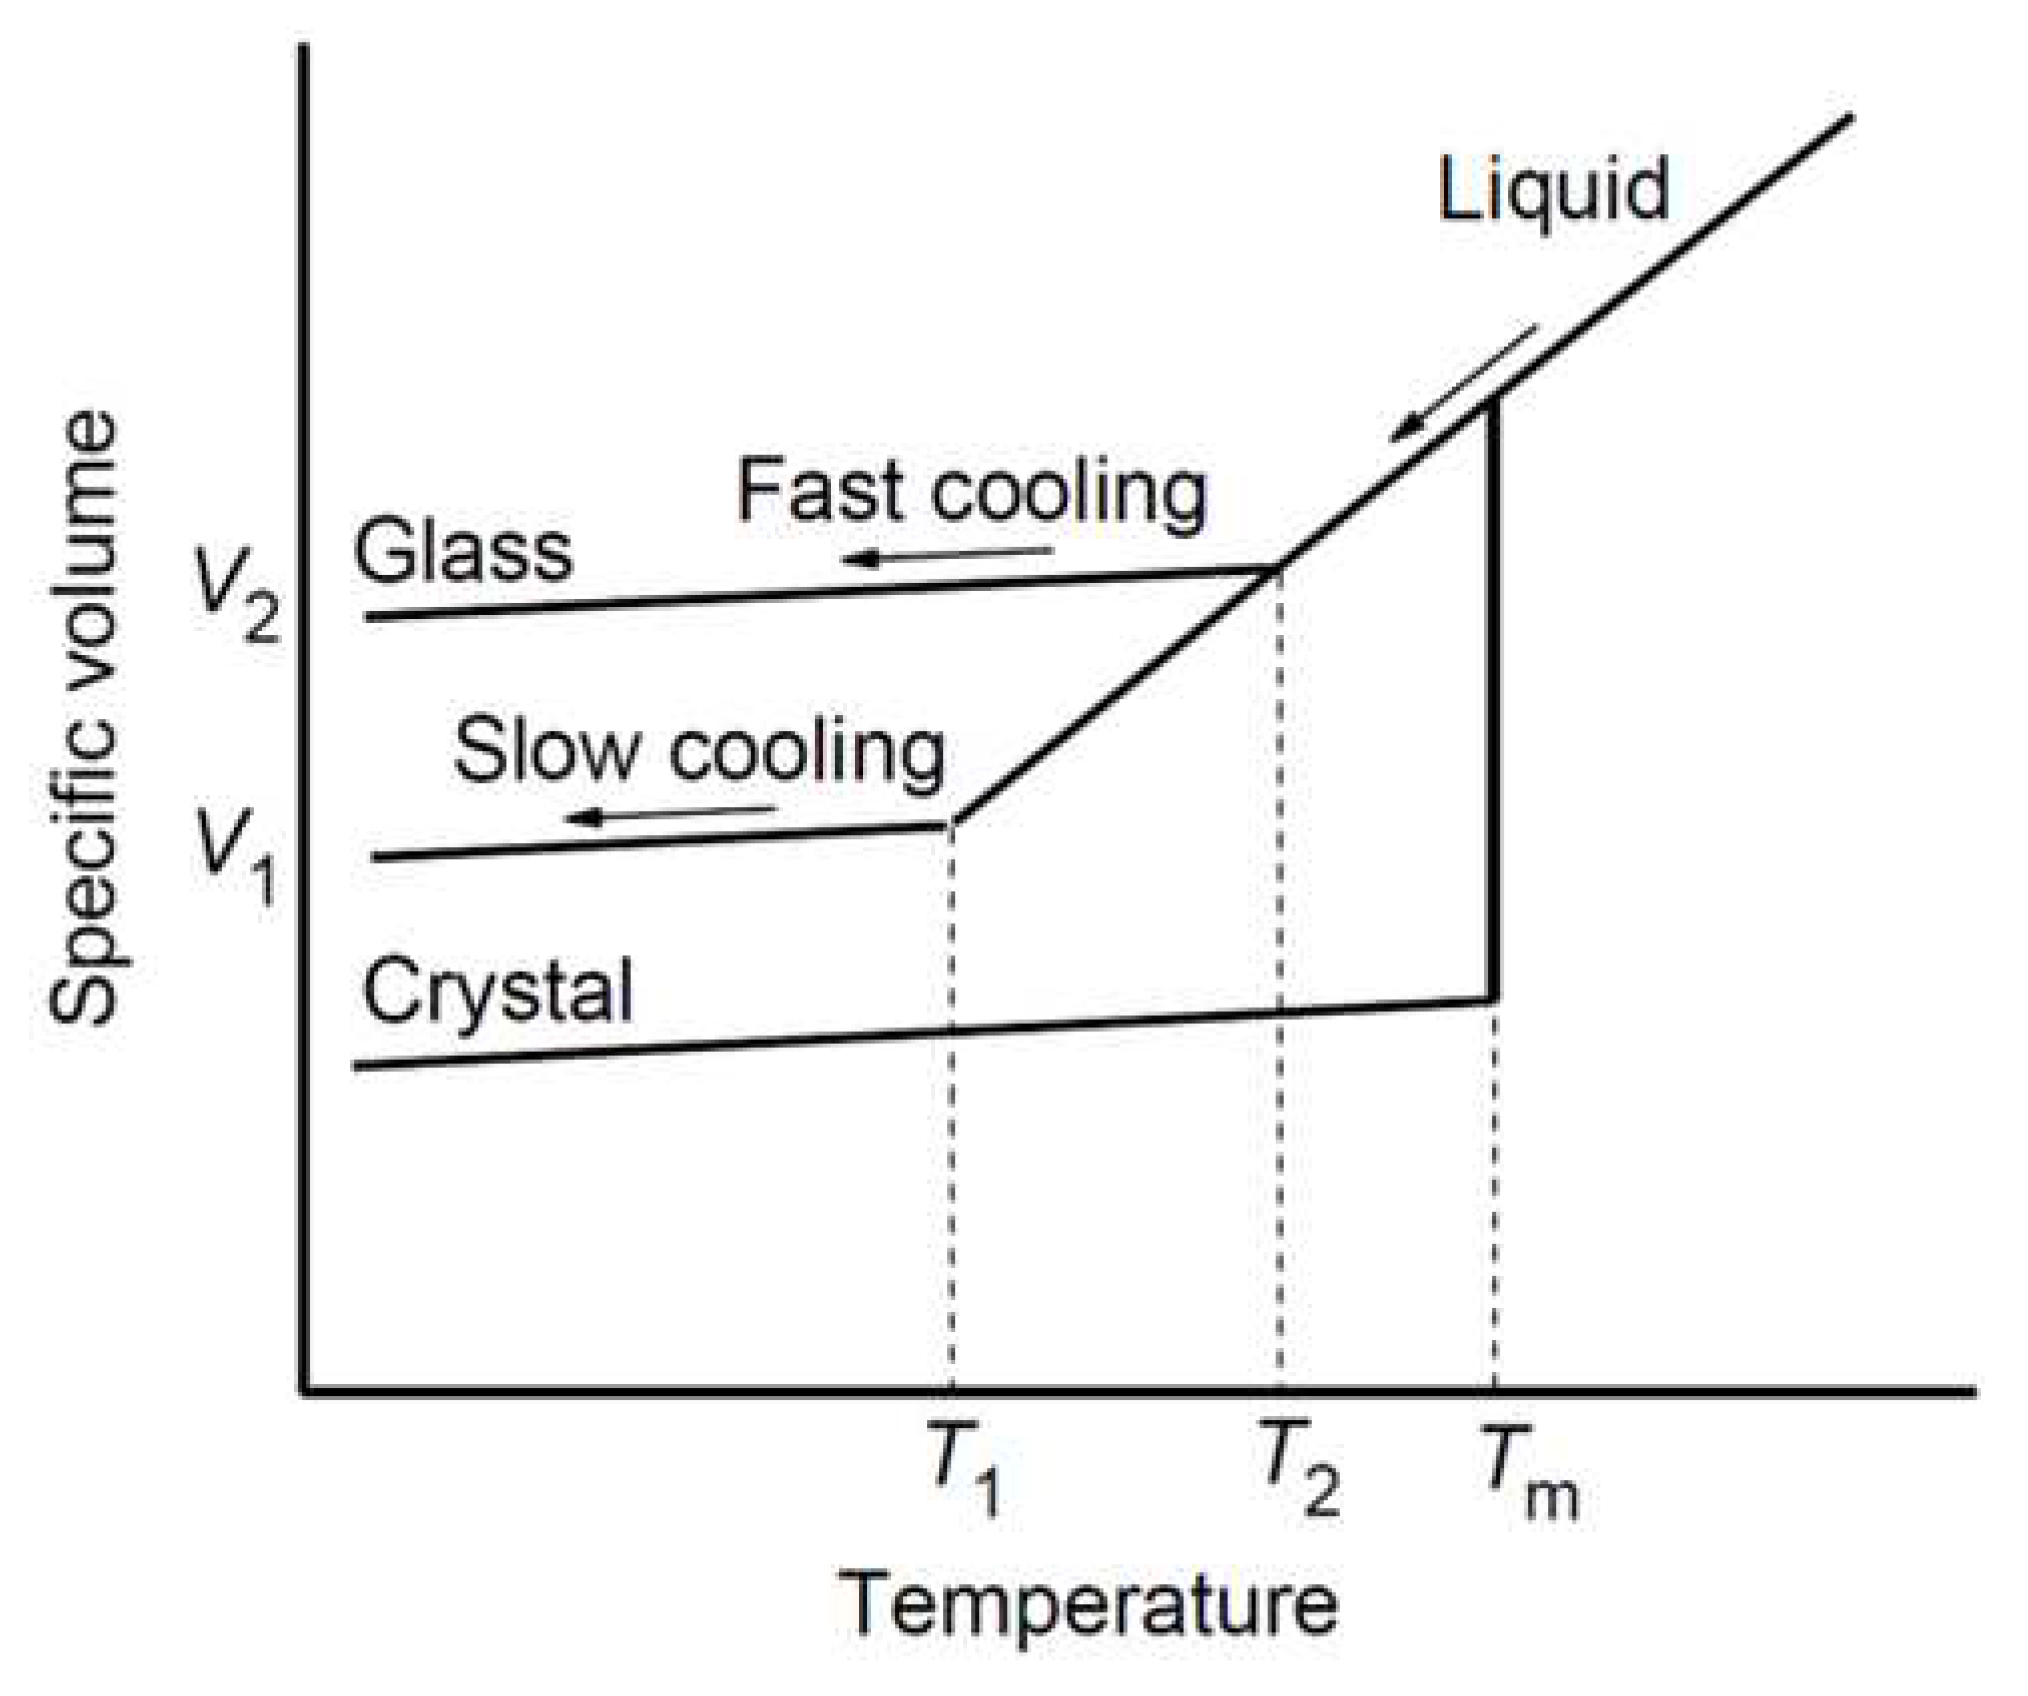
The initial structure of glass-forming materials is not completely restored after the rapid heating-cooling cycle, which leads to a change in the local properties of the material in rapidly cooled areas. The local structure, specific volume, density, Rayleigh scattering loss and refractive index of glass-forming materials significantly depend on the local cooling rate [19,44,45], see Figure 1.
Figure 1.
Schematic diagram of the specific volume as a function of temperature for glass-forming materials at different cooling rates and . Liquid structures freeze to a glassy state with at .
Figure 1.
Schematic diagram of the specific volume as a function of temperature for glass-forming materials at different cooling rates and . Liquid structures freeze to a glassy state with at .
Thus, we focus on the dynamics of the temperature distribution and study the local cooling rate near the focal region during laser-induced microstructuring. Measurements of the temperature distribution at the focus of the laser beam can be carried out using micro-Raman spectroscopy [46,47,48]. However, the time resolution of Raman spectroscopy (with a measuring pulse duration of about 10 ns and a repetition rate of 1 kHz) is not sufficient to detect ultrafast changes in the local temperature . We found that the local cooling rate after the end of the heating pulse can reach more than 1011 K/s in a thin layer around the focus of the laser beam. In fact, to resolve such ultrafast temperature changes at the periphery of the hot focal zone requires a temporal and spatial resolution of at least about 0.1 ns and 10 nm, respectively, since the cooling rate reaches about 600 GK/s in a narrow layer around the hot zone at the laser focus (see below). Thus, the maximum change in the glass structure occurs at the periphery of the focal region (where the material undergoes ultrafast quenching). In fact, laser microstructuring of glasses makes it possible to form micron-sized domains that are close to spherical or ring-shaped, with a modified glass structure at the periphery of the domains [19,34,36,40,46,49,50,51,52,53]. For example, local modification of silver-doped phosphate glasses with the laser pulse energies in the range of 10 – 100 nJ led to the formation of micron-sized ring-shaped domains due to the aggregation of silver nanoclusters at the periphery of the domains [49]. Laser pulse energy and pulse repetition rate play an important role in the microstructuring of glass-forming materials. In fact, laser pulses with a sufficient repetition rate can provide cumulative heating near the focus of the laser beam. In this article we will focus on the effect of single laser pulses (the effect of repetition rate will be discussed in a separate article).
The temperature change associated with the heating pulse Is of the order of , where and are the heat capacity and volume of the heating zone; and are the density and specific heat capacity of the material. The thermal effect caused by elastic deformations is negligible compared to , at least at moderate , say in the range of 10 – 100 nJ for a focal region of about 1 μm radius. Indeed, the thermoelastic pressure in the hot zone is less than the maximum pressure response to the temperature change at constant volume, where and are the bulk modulus and the volumetric thermal expansion coefficient. However, the volume of the hot zone is not rigidly fixed by the material surrounding this zone. In fact, a pressure wave is created around the hot zone [54,55]. In this case, the thermoelastic pressure is even less than . Thus, the elastic energy associated with the thermoelastic pressure in the hot zone of volume is less than . Therefore, the relative effect associated with thermoelastic deformations does not exceed . For example, for sodium-lime-silicate glasses with the composition Na2Oꞏ2CaOꞏ3SiO2, is about 1% at 2000 K, 55 Gpa, 2.8 g/cm3, 1.14 J/gK, , and linear thermal expansion 7.7ꞏ10-6 1/K [56,57,58,59,60]. This ratio is even lower for borosilicate glasses with a low coefficient of thermal expansion [61]. For example, for borosilicate glasses such as Pyrex, the ratio is about 0.1% at 2000 K, 33 Gpa, 2.23 g/cm3, 1.1 J/gK, and 3.3ꞏ10-6 1/K [61,62,63,64]. However, becomes comparable with at laser pulse energies approximately 2 orders of magnitude higher than those considered in this work. We are interested in local temperature changes in a micron-sized hot zone at , when the pressure waves created around the hot zone are already at a distance of more than 1 – 2 μm from the hot zone. However, at the same time, the front of the temperature change extends only about ten nanometers from the periphery of the hot zone. Thus, we consider the change in local temperature after the local pressure in the hot zone has almost stabilized. For example, in silicate glasses at 0.5 ns, the distance is about 3 µm at the longitudinal speed of sound 6ꞏ103 m/s [59], and 10 nm at the thermal diffusion coefficient of about 3ꞏ10-7 m2/s [57,63,65].
It Is noteworthy that an Important property of glass-forming materials is the long-term relaxation of the specific heat capacity with rapid changes in temperature. Thus, the heat capacity of glass-forming materials must be considered as a function of time [66,67,68]. In fact, if a glass-forming material is heated to a liquid state with heat capacity from a solid glassy state with heat capacity , then the heat capacity of the material does not change immediately with the change in temperature, but slowly relaxes from to , see below. Long-term relaxation of the dynamic heat capacity of glasses is due to the slow exchange of energy between different degrees of freedom in glasses. Thus, the thermal response of glass-forming materials to a thermal perturbation at time depends on the temperature at earlier times. The effect of long-term relaxation of dynamic heat capacity significantly affects the dynamics of local temperature changes [69,70]. In turn, the rate of change in local temperature can significantly affect the micro-structuring of glass-forming materials [19,38,44,45,71]. An experimental study of the dynamics of the temperature distribution inside a glass matrix under the action of fast laser thermal perturbations is very difficult. Therefore, it is necessary to develop theoretical models of thermal processes occurring during laser-induced structuring of glasses. In this paper, we will focus on modeling such thermal processes, taking into account the relaxation effect of the dynamic heat capacity . The dynamic behavior of glass-forming materials under fast local thermal perturbations can be described using the integro-differential heat equation with “memory” [69,70]. This equation has an analytical solution, at least in spherical, cylindrical and planar geometries [69,70,72]. This work aims to determine the dynamics of local temperature changes, especially the local rate of the temperature change , associated with laser-induced thermal excitations during laser processing of glasses. An analytical method for determining and has been developed. The knowledge obtained can be useful for various technologies related to laser-induced microstructuring.
In the first part of the article, the heat equation with dynamic heat capacity is considered. An analysis of the dynamic heat capacity of glass-forming materials has been conducted and an analytical solution of the heat equation with dynamic heat capacity for a spherically symmetric problem has been constructed. Then, the temperature distribution is calculated for glasses with dynamic heat capacity under local fast laser excitations. Examples with borosilicate and sodium-lime-silicate glasses are considered at different heating pulses and dynamic heat capacity parameters. Finally, the local distribution of the cooling rate and its influence on the microstructuring processes of glasses is discussed.
2. Heat equation with dynamic heat capacity
Since the pioneering work of Birge and Nagel [66], the dynamic heat capacity of glass-forming materials as a function of frequency (or time ) has been intensively studied. For such studies, heat capacity spectroscopy can be used [67,68]. The time dispersion of the dynamic heat capacity can be described within the framework of linear response theory [73], similar to the time dispersion of the dielectric constant [74]. Then, heat transfer in the glass-forming material can be described by an integro-differential heat equation [69,70]. In the case of spherical geometry and zero initial conditions, this heat equation can be represented in the following form [69,70]:
where is the volumetric heat flux density, , – Laplacian, and are the thermal conductivity and density of the material. Eq.(1) has an analytical solution for homogeneous boundary conditions, see below.
2.1. Dynamic heat capacity of glass-forming materials
The dynamic heat capacity as a function of time can be represented as a continuous sum of exponential decays, since is a monotonically relaxing function of time [69,70,75]:
where and are the initial and final (equilibrium) heat capacities: as and as . In fact, and if the material is heated from a solid glassy state to a liquid one. The distribution function of relaxation times can be found using broadband heat capacity spectroscopy [68], for details see [69,70,72]. The dynamic heat capacity is usually described by the Kohlrausch–Williams–Watts stretched exponent for , where the Kohlrausch relaxation time and constant characterize the relaxation time spectrum of the material [45,76,77]. In this case,
where . Usually, is about 0.3 – 0.5 [68,78]. For example, if 0.5, then [76,77]. Thus, can be approximately represented by Eq.(4) for a sufficiently large finite interval :
where is a function of temperature. The function can be obtained from the Vogel–Fulcher–Tammann–Hesse (VFTH) relation measured by broadband heat capacity spectroscopy [68]:
where is the frequency corresponding to the maximum value of the temperature dependence of the imaginary part of the dynamic heat capacity and is the temperature modulation frequence; , and are the VFTH parameters. In fact, is about 1. More precisely, for different can be obtained from the relation [69]. However, the shape of the distribution function has insignificant effect on , since the effect due to the time dispersion of the dynamic heat capacity reaches saturation with increasing , see below. Thus, it is sufficient to consider the dynamic heat capacity with the Debye relaxation law (see Eq.(6)) for sufficiently large . Below we will show that this result practically coincides with the result obtained after averaging over the distribution function . In the case of the Debye relaxation law, is equal to
In this case, the integro-differential heat equation Eq.(1) is transformed into Eq.(7), which can be solved analytically. After this, solutions for different can be averaged using the distribution function .
2.2. Analytical solution of the heat equation with dynamic heat capacity
Let us consider the temperature distribution after a single laser pulse in a micron-sized focal zone. A relatively small change in the thermal conductivity of the glass matrix around the hot focal zone does not affect the dynamics of the temperature distribution in the hot focal zone. In fact, for the glass-forming materials under consideration, varies insignificantly with temperature and is about 1 W/m2K over a wide temperature range [65,79,80]. Thus, it is assumed that the thermal conductivity of the glass matrix does not depend on temperature. However, the change in dynamic heat capacity from to during heating is significant.
As a first step we consider the Debye relaxation law, see Eq.(6). Thus, for spherical geometry, from Eq.(1) we obtain Eq.(7):
where , and the spherically symmetric heat source is distributed in a spherical volume of radius . The decomposition of into the product is common for laser heating. Furthermore, after the end of the heating pulse, the temperature distribution does not depend on the shape of , see below. In this article we are interested in the dynamics of the temperature distribution after the heating pulse, when the shape of the heating pulse does not matter.
Consider Eq.(7) under the following initial conditions: and for , where is the initial temperature in the glass matrix. Let be a bounded function and for . Since we are considering a single heating pulse, it does not matter how large the parameter is, as long as . Indeed, the temperature change is localized in a hot zone about a few micrometers in size, see below. The solution to this boundary value problem can be represented in the form of the following series (for details, see Appendix A):
where the functions are determined by Eq.(9).
where and . Functions satisfying Eq.(9) are presented in Appendix A. The spatial distribution of the heating power can be arbitrary. For example, we consider a heat source uniformly distributed in a volume of radius with volumetric density (in W/m3), then
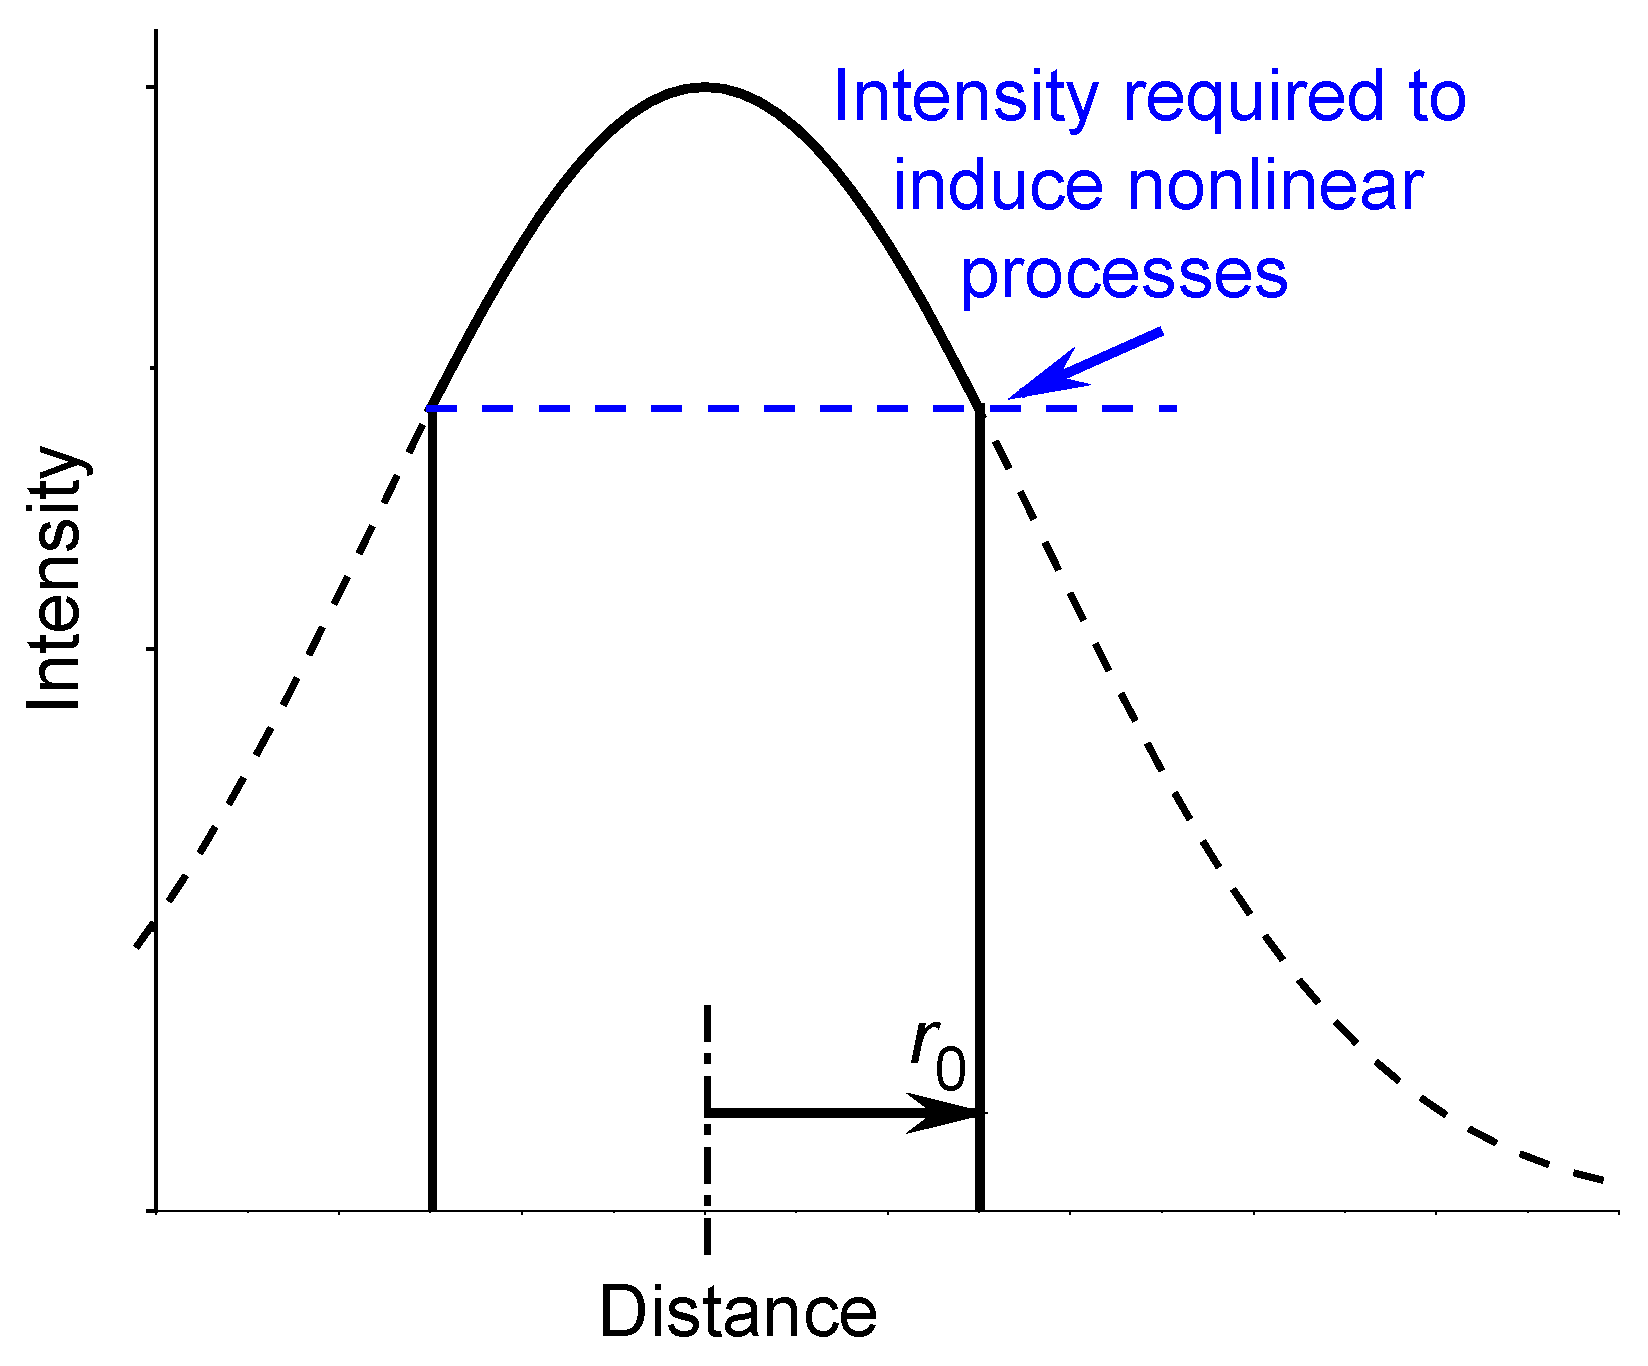
In fact, the distribution of the intensity of light radiation in the spot of a focused laser beam, depending on the distance from the center of the spot, can have a Gaussian bell-shaped character, see Figure2. However, the intensity sufficient to induce nonlinear processes such as multiphoton absorption is located close to the center of the laser beam spot [5]. Thus, the model of a heat source uniformly distributed in a volume of radius with a sharp drop at the periphery is more realistic than the bell-shaped Gaussian distribution.
Figure 2.
Schematic diagram of the distribution of the intensity of light radiation in a spot of a focused laser beam depending on the distance from the center of the spot (dashed line) and the intensity distribution sufficient to induce nonlinear processes such as multiphoton absorption in a spot of radius (solid line).
The shape of the change in heating power over time can be bell-shaped or more complex. However, this shape is not significant for the temperature distribution at , see Figures3 – 4. For model calculations, we will use a heating pulse of a half-sinusoidal shape, slightly different from the bell-shaped one. Thus, for and for .
3. Temperature distribution in glasses under local thermal perturbations
For example, let us consider the two most common types of silicate glasses: sodium-lime-silicate glasses (Na2O-CaO-SiO2), as the most widely used of all industrial glasses, known for their low cost and availability, and borosilicate glasses (B2O3-SiO2), which are widely used due to their low coefficient of thermal expansion and high resistance to chemical attack. Sodium-lime-silicate glass with the composition Na2Oꞏ2CaOꞏ3SiO2 and borosilicate glass of the Pyrex type were chosen as model systems due to the availability of the necessary parameters [57,58,61,62,63,64,65]. The thermal parameters of these glasses are collected in Table 1.
3.1. Influence on of the shape and duration of heating pulses
Thus, for model calculations, we use a heating pulse with a power density , acting during the time interval in a spherical region with a radius 1 μm. Let us compare the results for heating pulses with , having half-sinusoidal and rectangular shapes, see Figures3 and 4. Let the initial temperature 300 K, 300 ps, 15 nJ, and the volume of the spherical heating zone . Thus, is equal to and for half-sinusoidal and rectangular heating pulses, respectively. In this case, the energy of these pulses is the same and equal to . The temperature distribution can be calculated according to Eqs.(8) – (9) at various .
For example, for sodium-lime-silicate glass (see Table 1), at 0, 0.1 μs, and 10 μs is represented in Figures3 and 4. The temperature distribution is calculated at (for example, at 30 μm). As follows from direct calculations, the result does not depend on , at least on the time scale , where for the glasses under consideration is about 3 – 4 ms. Whereas we are interested in changes in the temperature distribution on a time scale of microseconds and less, when the temperature changes are localized within a few micrometers, see Figure3.
The influence of the time dispersion of the dynamic heat capacity is significant, see Figures3 and 4. The difference between equilibrium ( 0) and non-equilibrium ( 0) solutions increases with the growth of . The shape of the change in heating power over time is significant only during the time interval , see Figure4(a). However, this shape is not significant at , see Figures3 and 4(b).
Figure 3.
Temperature distribution in the hot zone depending on the distance at 10 ns (a) and 100 ns (b) for heating pulses of half-sinusoidal shape (filled symbols) and rectangular shape (open symbols) in sodium-lime-silicate glass at 1 μm, 300 ps, 15 nJ, and 300 K ( 0, 0.1 μs, and 10 μs – squares, circles, and triangles, respectively).
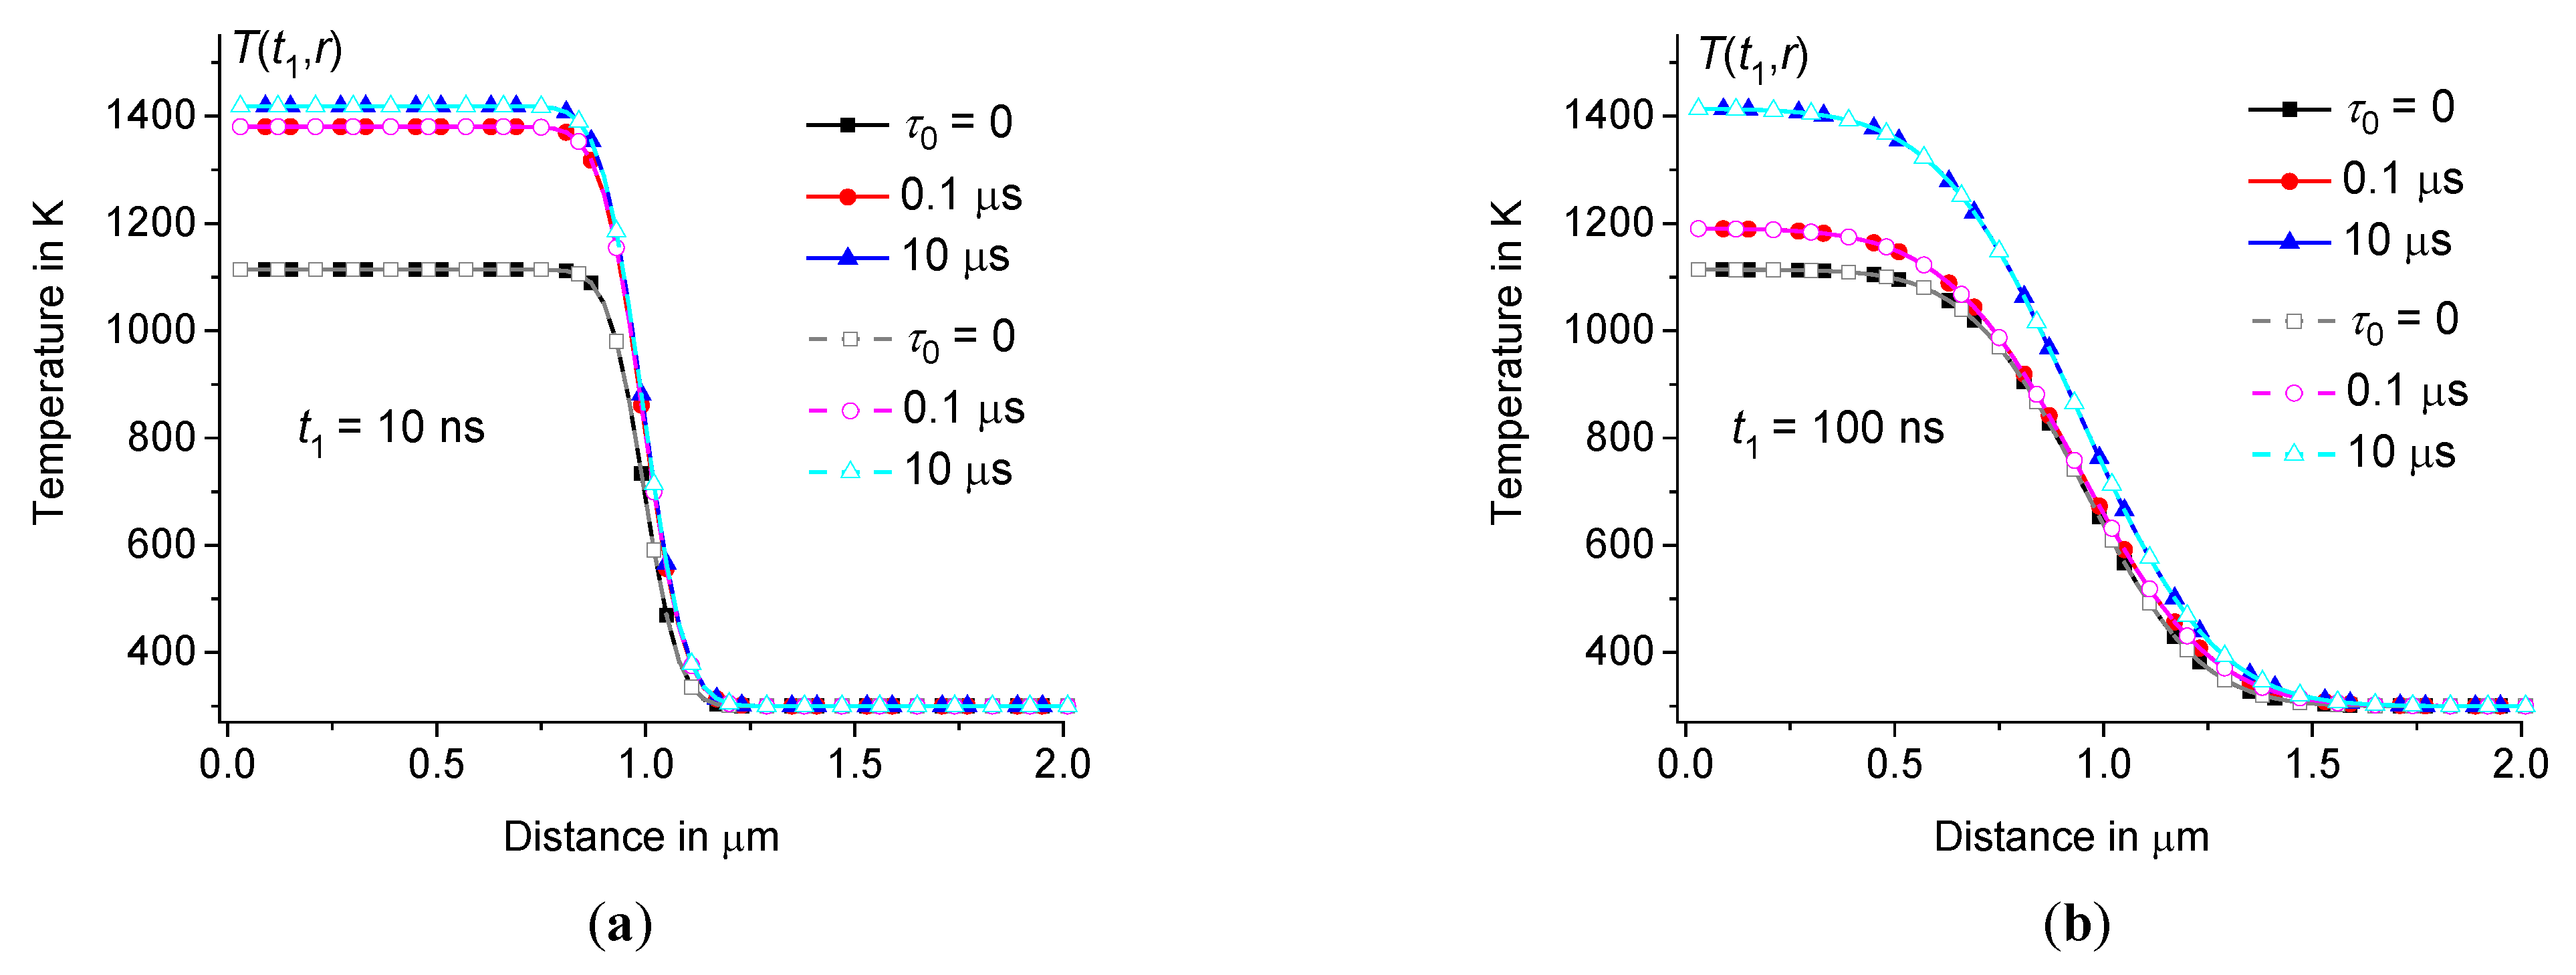
Figure 4.
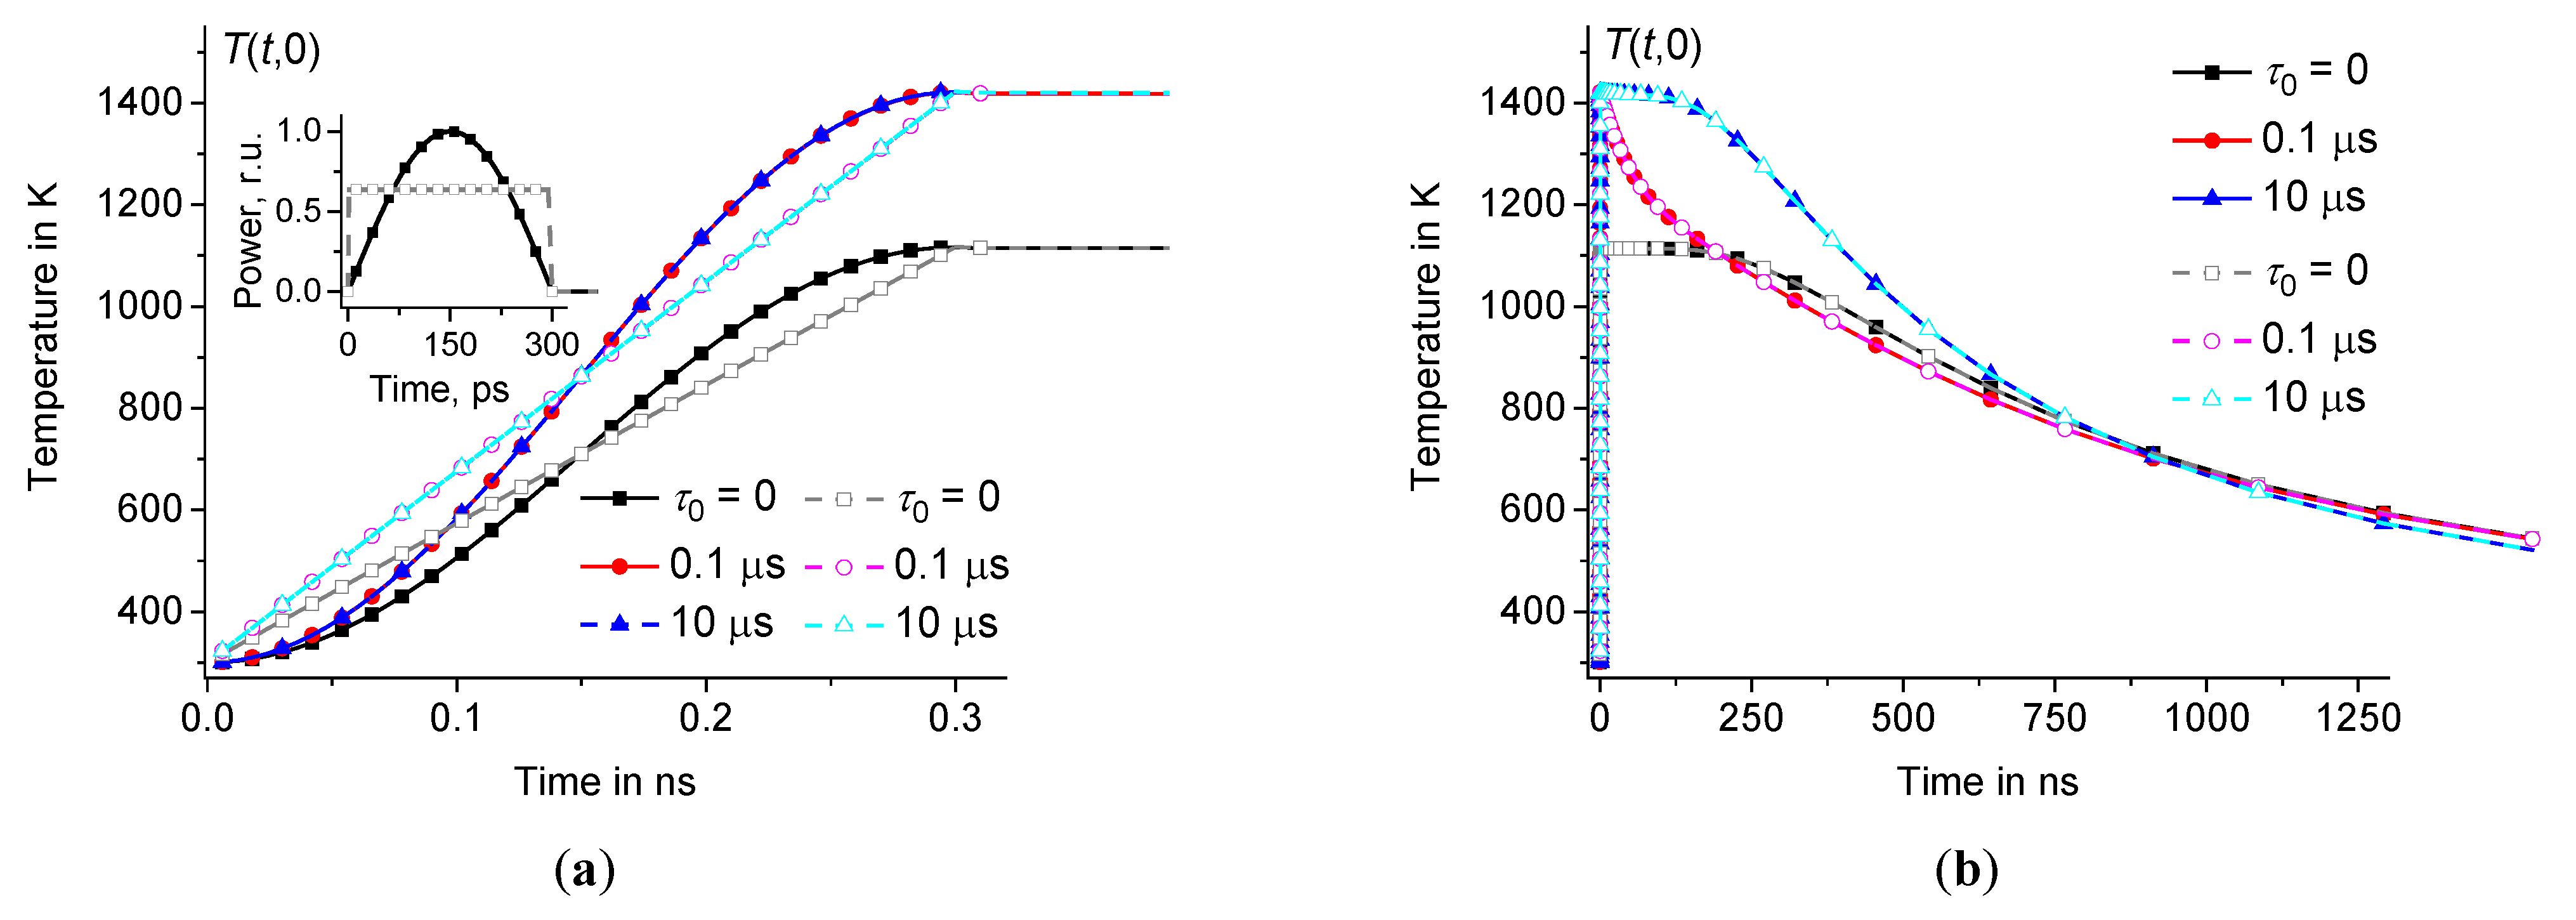
Time dependence of in the center of the hot zone during (a) and after (b) the heating pulses of half-sinusoidal shape (filled symbols) and rectangular shape (open symbols) at the same parameters as in Figure3 ( 0, 0.1 μs, and 10 μs – squares, circles, and triangles, respectively). Inset (a) shows pulse power as a function of time.
Figure 4.
Time dependence of in the center of the hot zone during (a) and after (b) the heating pulses of half-sinusoidal shape (filled symbols) and rectangular shape (open symbols) at the same parameters as in Figure3 ( 0, 0.1 μs, and 10 μs – squares, circles, and triangles, respectively). Inset (a) shows pulse power as a function of time.
The duration of the heating pulses is also not significant for the temperature distribution at , see Figure5. For example, compare for pulses with 10 ps and 300 ps and the same parameters as in Figure3. The duration of heating pulses is significant only during the time interval , see Figure5(a). However, this duration is not significant at , see Figure5(b).
Figure 5.
Time dependence of in the center of the hot zone during (a) and after (b) the heating pulse of half-sinusoidal shape at 10 ps and 300 ps – filled and open symbols, respectively, at the same parameters as in Figure3 ( 0, 0.1 μs, 1 μs, and 10 μs – squares, circles, triangles up, and triangles down, respectively). Inset (b) shows pulse power as a function of time for short and long pulses – dotted and solid lines, respectively.
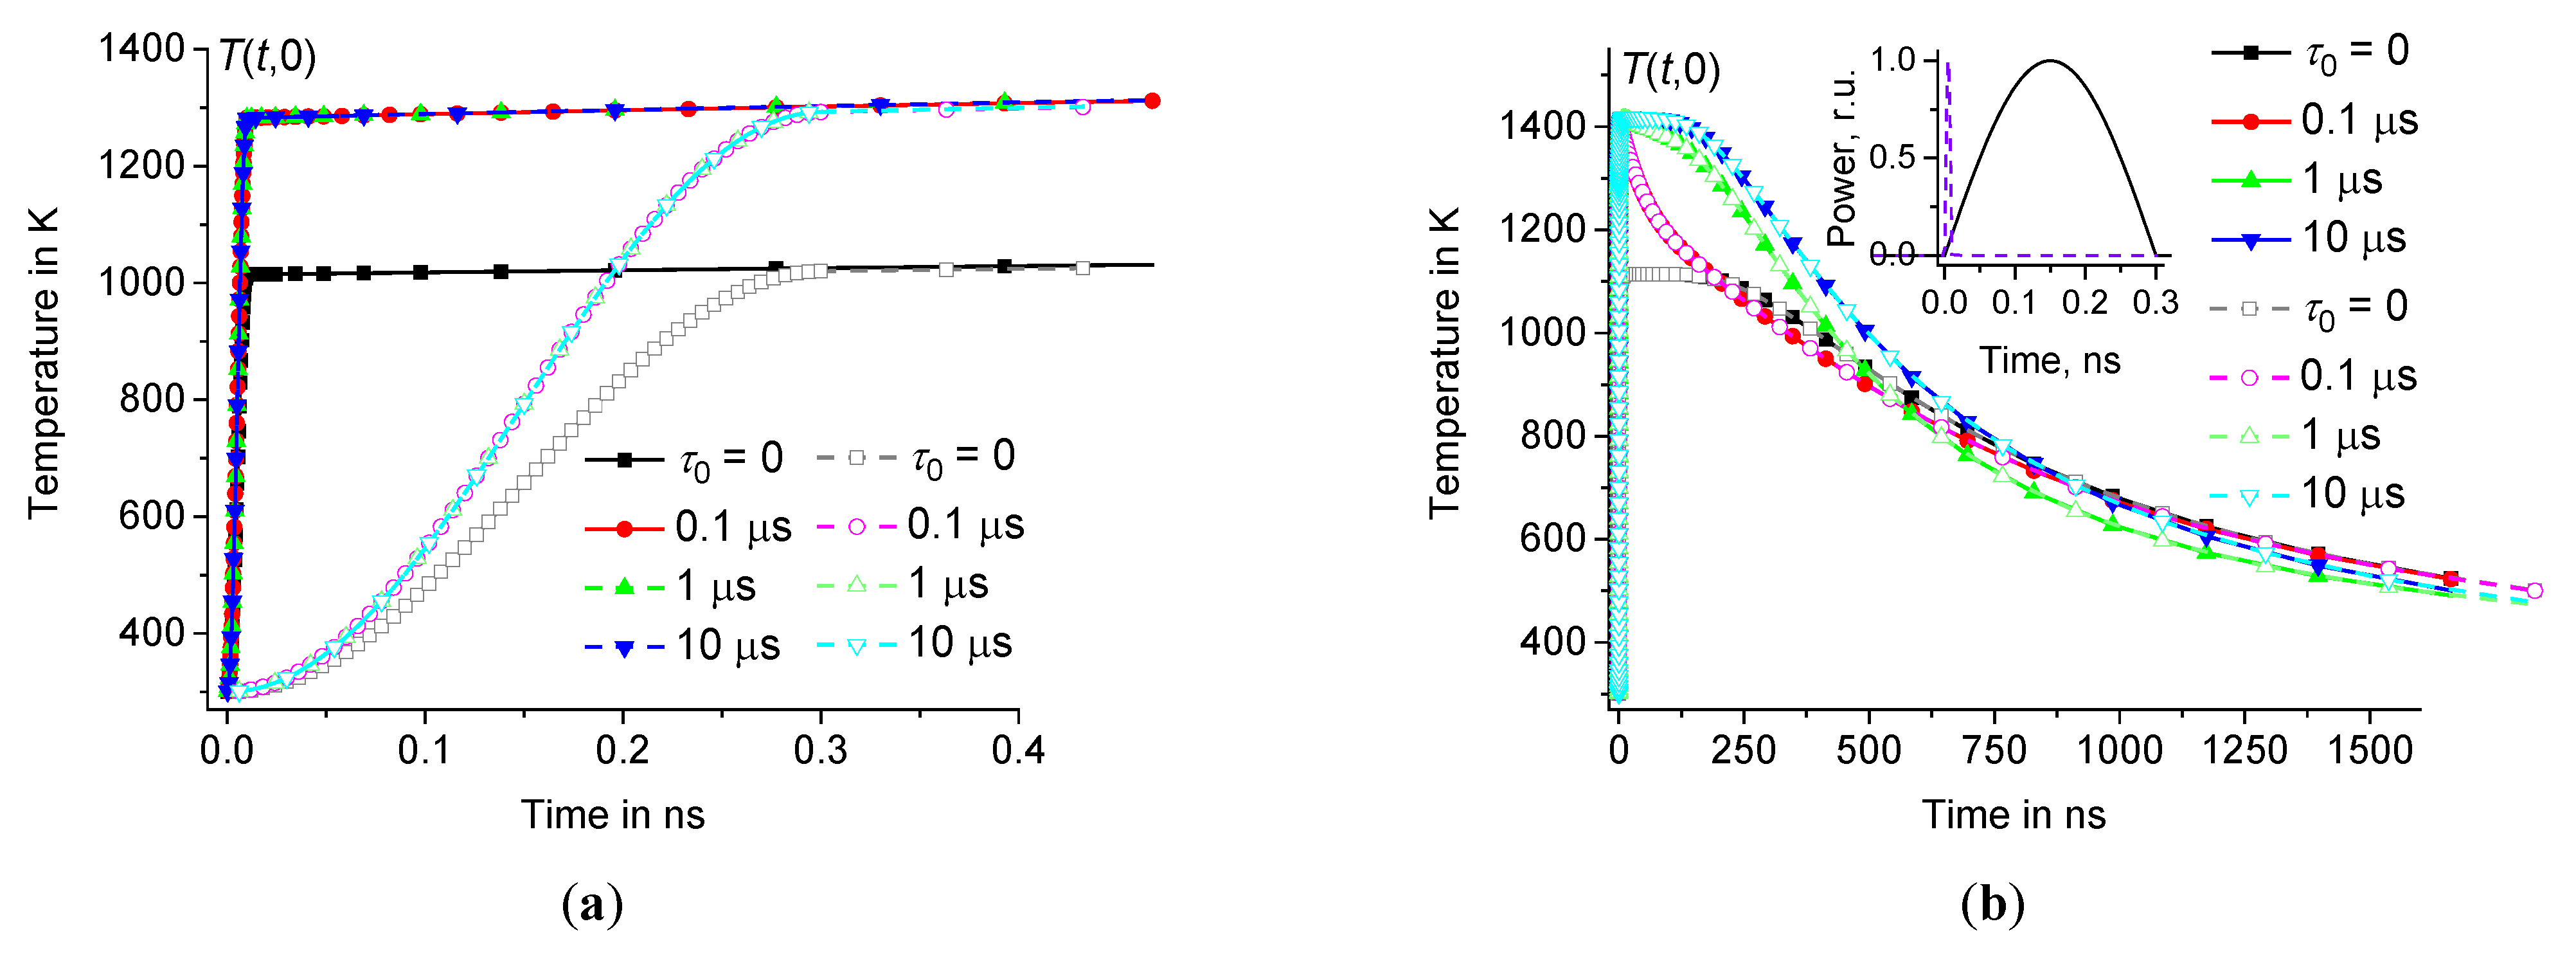
Thus, the temperature at the center of the hot zone increases very fast over the time interval from to the maximum value and then relaxes relatively slowly on a microsecond time scale, see Figures4 and 5. The influence of time dispersion of dynamic heat capacity is significant on time scales of several hundred nanoseconds or less. The solution associated with the dynamic heat capacity (at 0) tends to the classical solution (corresponding to 0) when reaches approximately 1 μs, see Figures4(b) – 5(b).
3.2. Comparison with the fundamental solution of the classical problem
It is often believed that the hot focal spot should spread and cool down according to the law and , respectively [19,47,81,82]. This assumption is based on the fundamental solution of the Fourier heat equation, which can be represented by the following function [83]:
where is the Heaviside unit step function and is the distance from the instantaneous point heat source. However, for a non-point heat source, the approximation of by this function is not satisfactory. The real dependence differs significantly from Eq.(11) [46]. As expected, the temperature perturbation in the center of the heating zone relaxes in a time of the order of . However, remains near the maximum value at 0.1 μs (see Figure6), and only then relaxes over a time of the order of . In contrast to the estimate based on the fundamental solution of the Fourier heat equation, the temperature perturbation relaxes approximately as , and not as , see Figure6. In fact, to obtain the correct temperature distribution using the fundamental solution, it is necessary to integrate the thermal response over the time interval and the volume of the heating zone. Thus, for the heat source considered above, distributed in a volume with radius and acting on the time interval , we obtain the temperature distribution :
where ). As expected, the solution completely coincides with the temperature distribution , calculated using Eqs.(8) – (9) at 0, see Figure6. In contrast, the simplified estimate is far from the correct even for any correction factor , see Figure6.
Figure 6.
depending on the distance at 100 ns (a) and time dependence of in the center of the hot zone (b) at the same parameters as in Figure3 ( 0, 0.1 μs, 1 μs, 10 μs, and 100 μs – squares, circles, triangles up, triangles down, and crosses, respectively, as well as for 0 – diamonds). Dotted lines show at = 1 and 100 (a), as well as at = 1/150 and 1/200 (b). Inset (b) shows the initial fragments of and at 0.
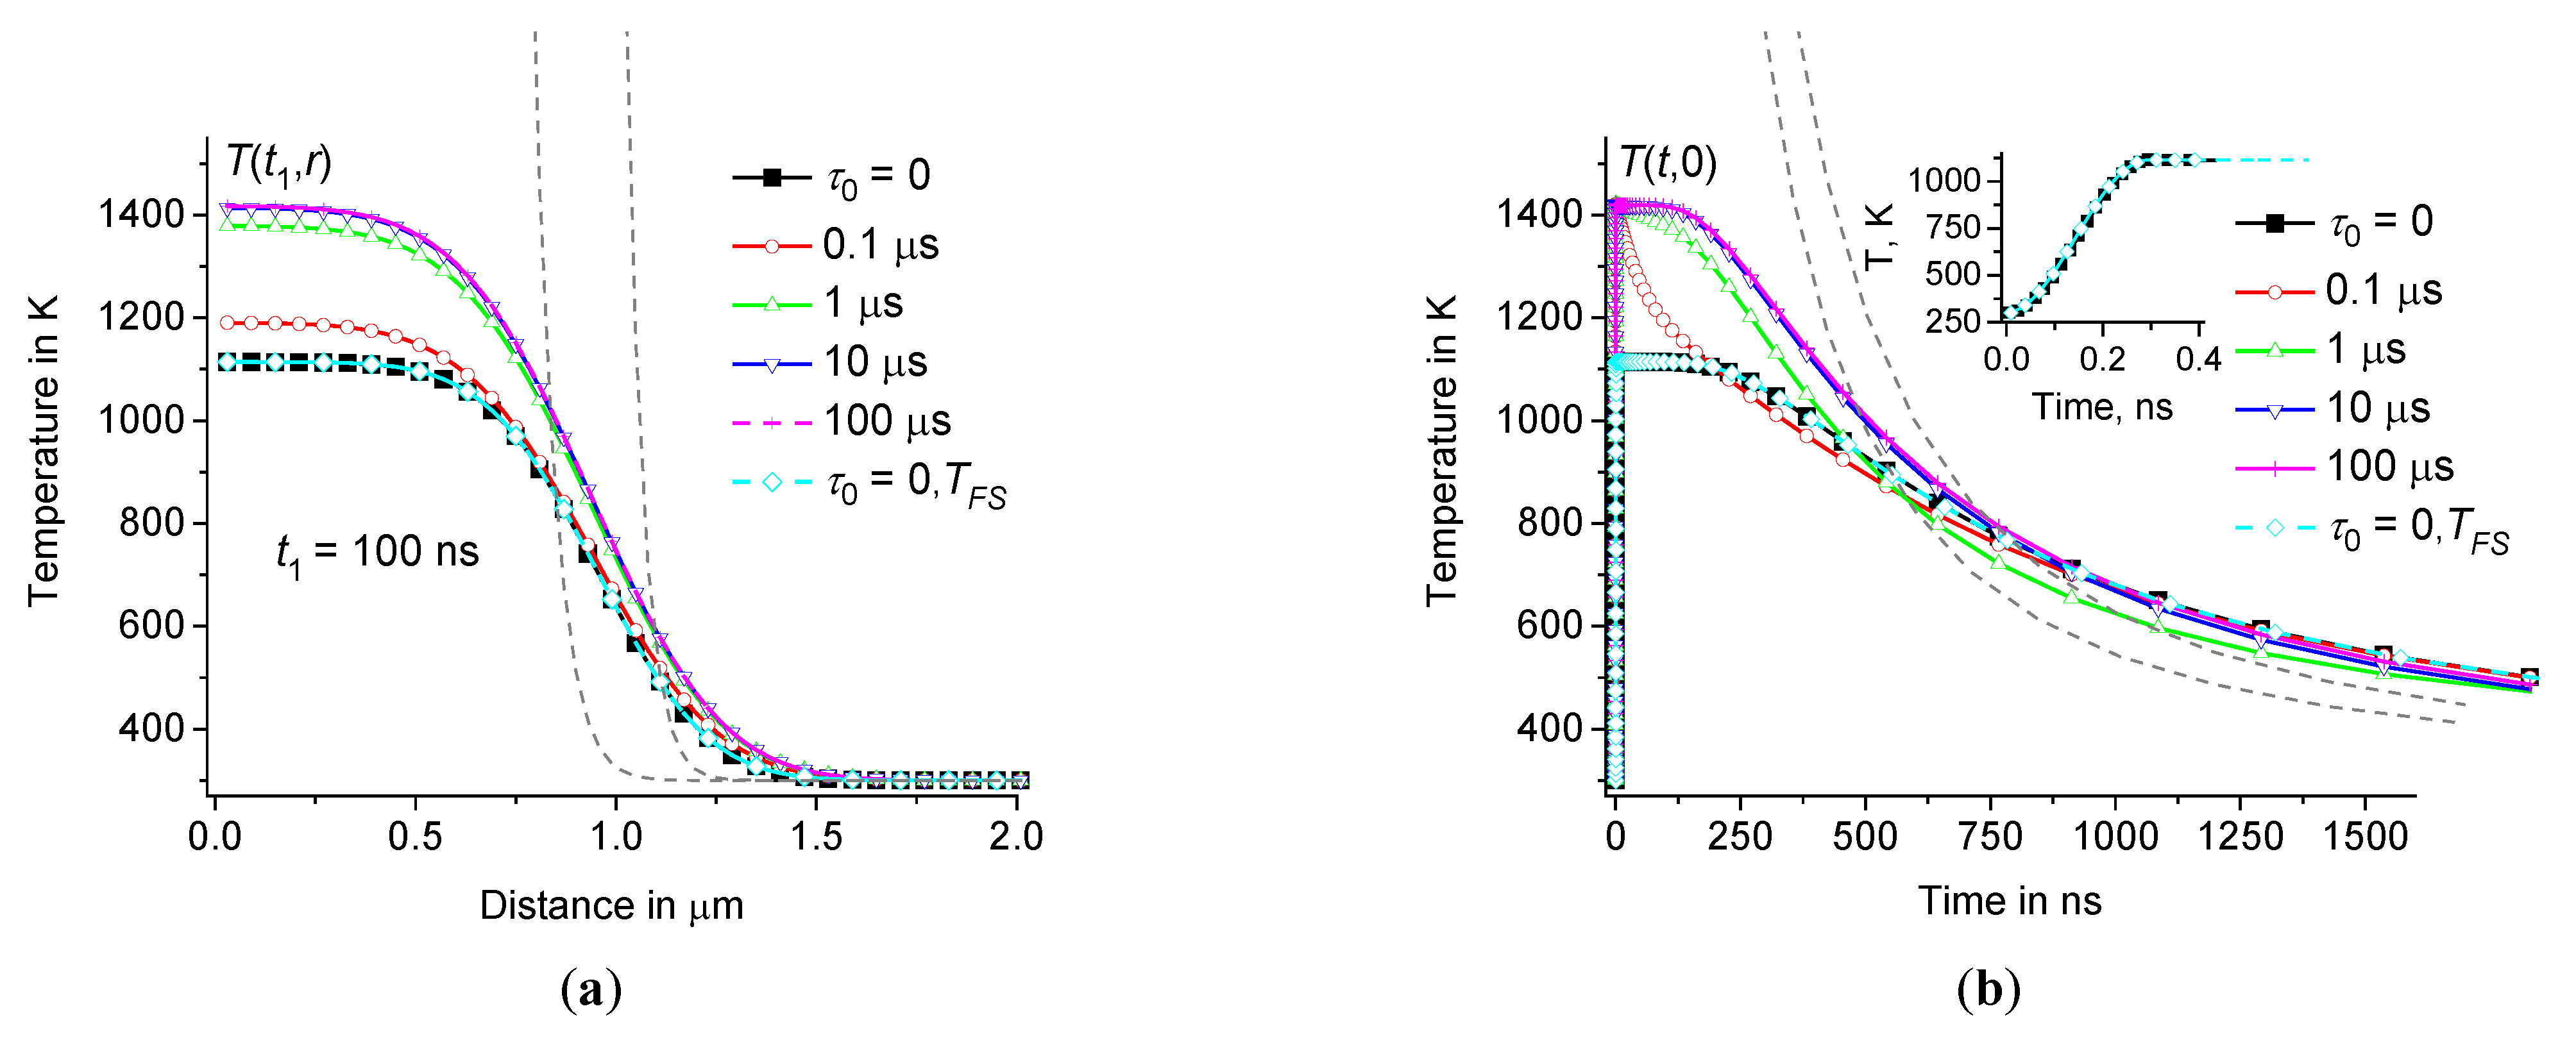
Thus, the correct calculation of the temperature distribution using the fundamental solution of the classical heat equation (without time dispersion) gives the same result as the calculation using Eqs.(8) – (9) at 0. However, using Eqs.(8) – (9) it is possible to calculate the temperature distribution for materials with dynamic heat capacity (at 0). It turns out that obtained at 0 increases with and tends to saturation at about 10 μs, see Figure6. For this reason, the shape of the distribution function has insignificant effect on . Next, we consider the influence of this distribution on , see Figures7 – 8.
3.3. Dependence of on the distribution of relaxation times
The influence of the time dispersion of the dynamic heat capacity is most pronounced at the beginning of the heating process on a nanosecond time scale, see Figure6(b). This effect is significant already at about 0.1 μs, increases with increasing and reaches saturation at above , where is about 4 μs at 1 μm and 2.6⸱10-7 m2/s for borosilicate glass. In fact, in glasses the relaxation times are distributed over a wide range. The parameters of the VFTH relationship (see Eq.(5)) can be obtained from measurements of glass transition processes depending on the cooling rate. For example, we use these parameters for borosilicate glass [64], sodium-lime-magnesium-silicate glass [84], and sodium-silicate glass [85]. The relaxation parameters of these silicate glasses used for model calculations are collected in Table 2.
The dynamic heat capacity can be modeled using Eq.(4), where can be obtained from (see Eq.(5)) using the relaxation parameters, see Table 2. Thus, we obtain the temperature distribution averaged using the distribution function , where is obtained at several intermediate temperatures between and ( is the maximum value of the temperature at the center of the hot zone). For example, set 700 K and 1000 K and consider the relaxation parameters for borosilicate glass [64], sodium-lime-magnesium-silicate glass [84], and sodium-silicate glass [85], see Table 2. The results are presented in Figures7 – 8. The difference between , obtained for sufficiently large 10 μs, and , obtained for and , is insignificant, see Figures 7 – 8. Since the influence of the time dispersion of the dynamic heat capacity reaches saturation at about 10 μs, the shape of the distribution function has little effect on the temperature distribution. Thus, the influence of the time dispersion of the dynamic heat capacity on the temperature distribution can be calculated for a fixed, sufficiently large .
Figure 7.
depending on the distance at 100 ns (a) and time dependence in the center of the hot zone (b) at the same parameters as in Figure3 ( 0 and 10 μs – squares and circles). The temperature distribution averaged using the distribution function obtained from [85] at 700 K and 1000 K – diamonds and stars, as well as from [84] at 700 K and 1000 K – triangles up and triangles down, respectively.
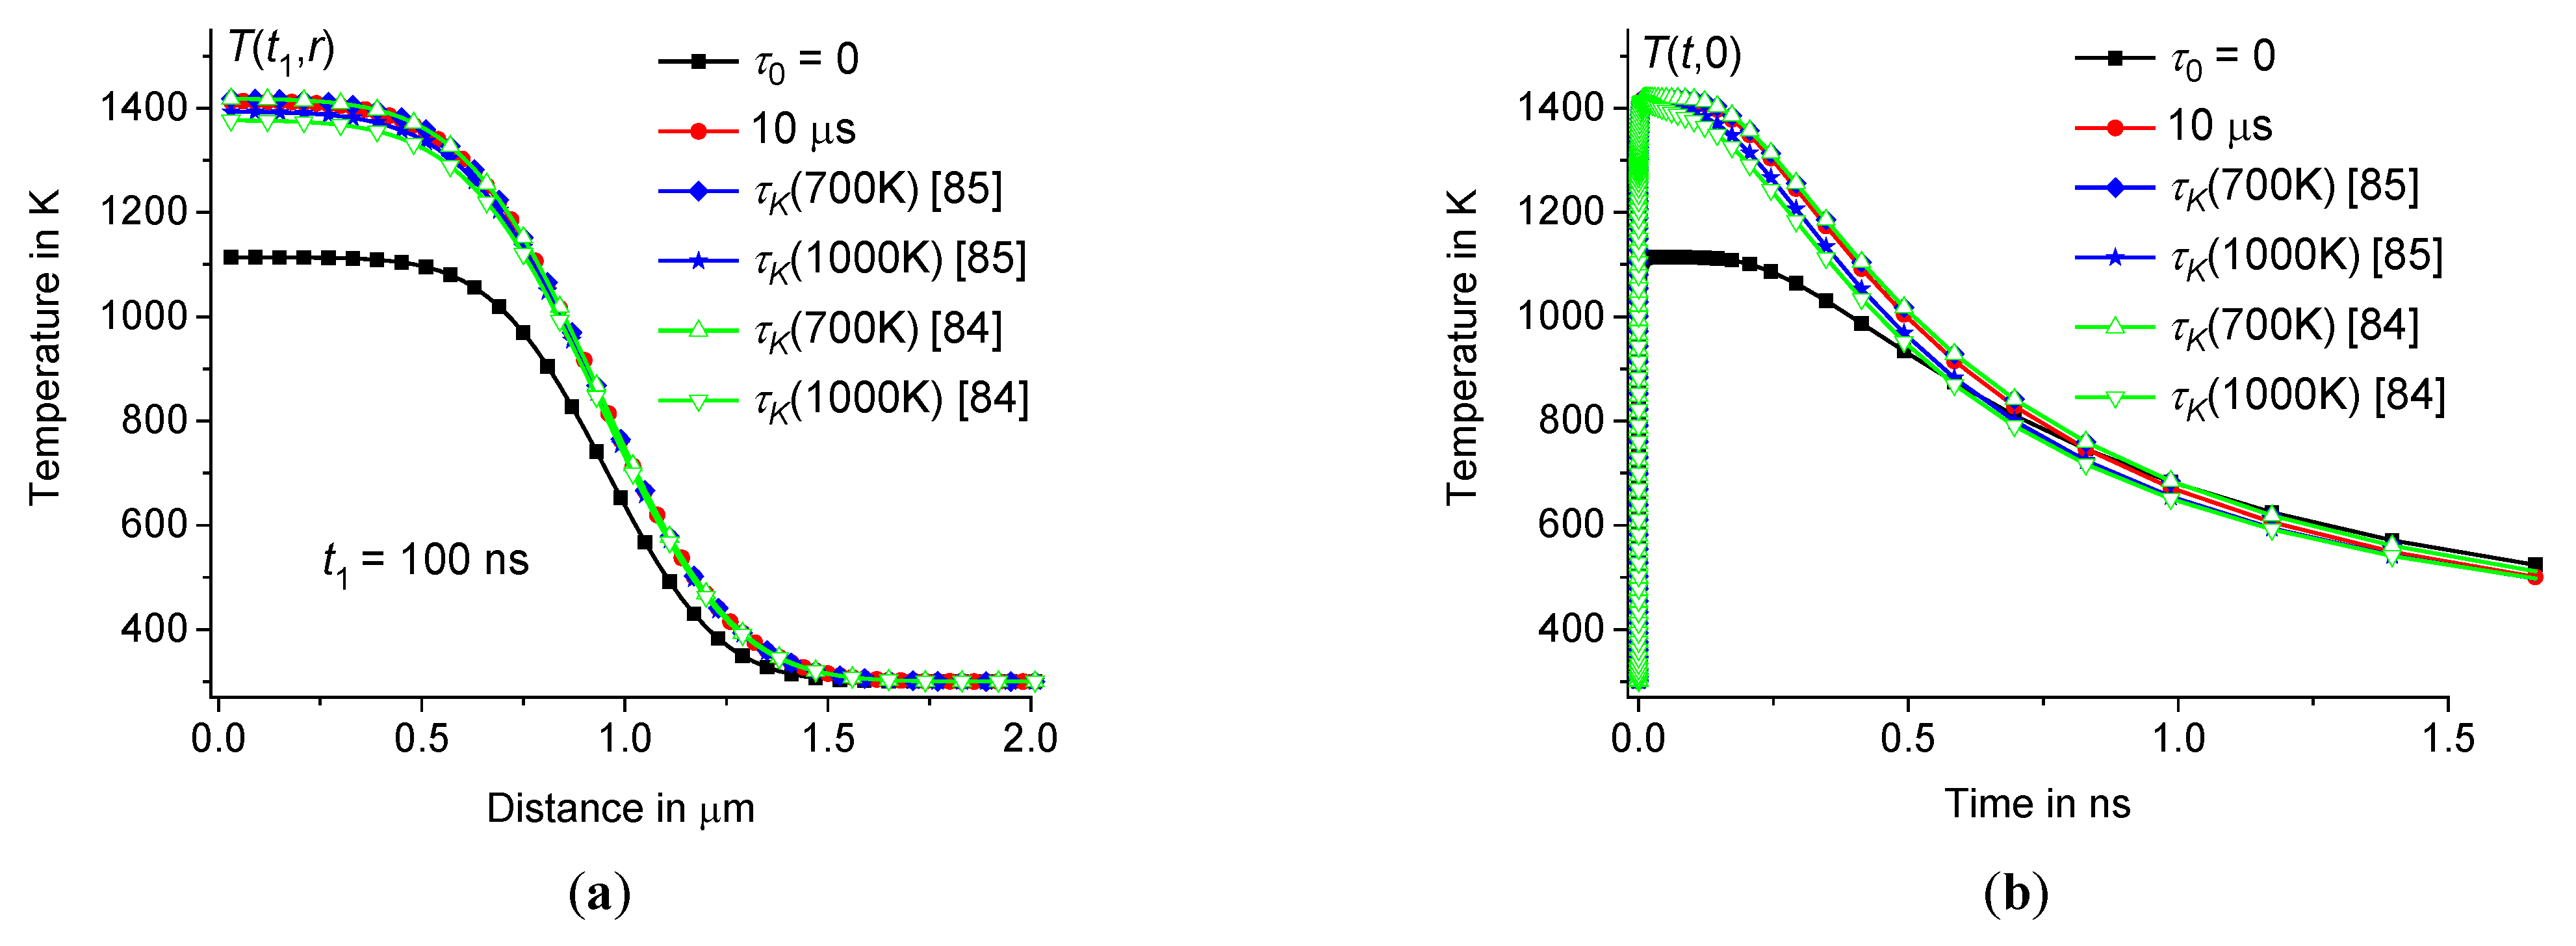
Figure 8.
depending on the distance at 100 ns (a) and time dependence in the center of the hot zone (b) for borosilicate glass at 1 μm, 10 ps, and 15 nJ 300 K ( 0, 0.1 μs, 1 μs, 10 μs, and 100 μs – squares, circles, triangles up, triangles down, and crosses). The solution averaged using the distribution function obtained from [64] at 700 K and 1000 K – diamonds and stars.
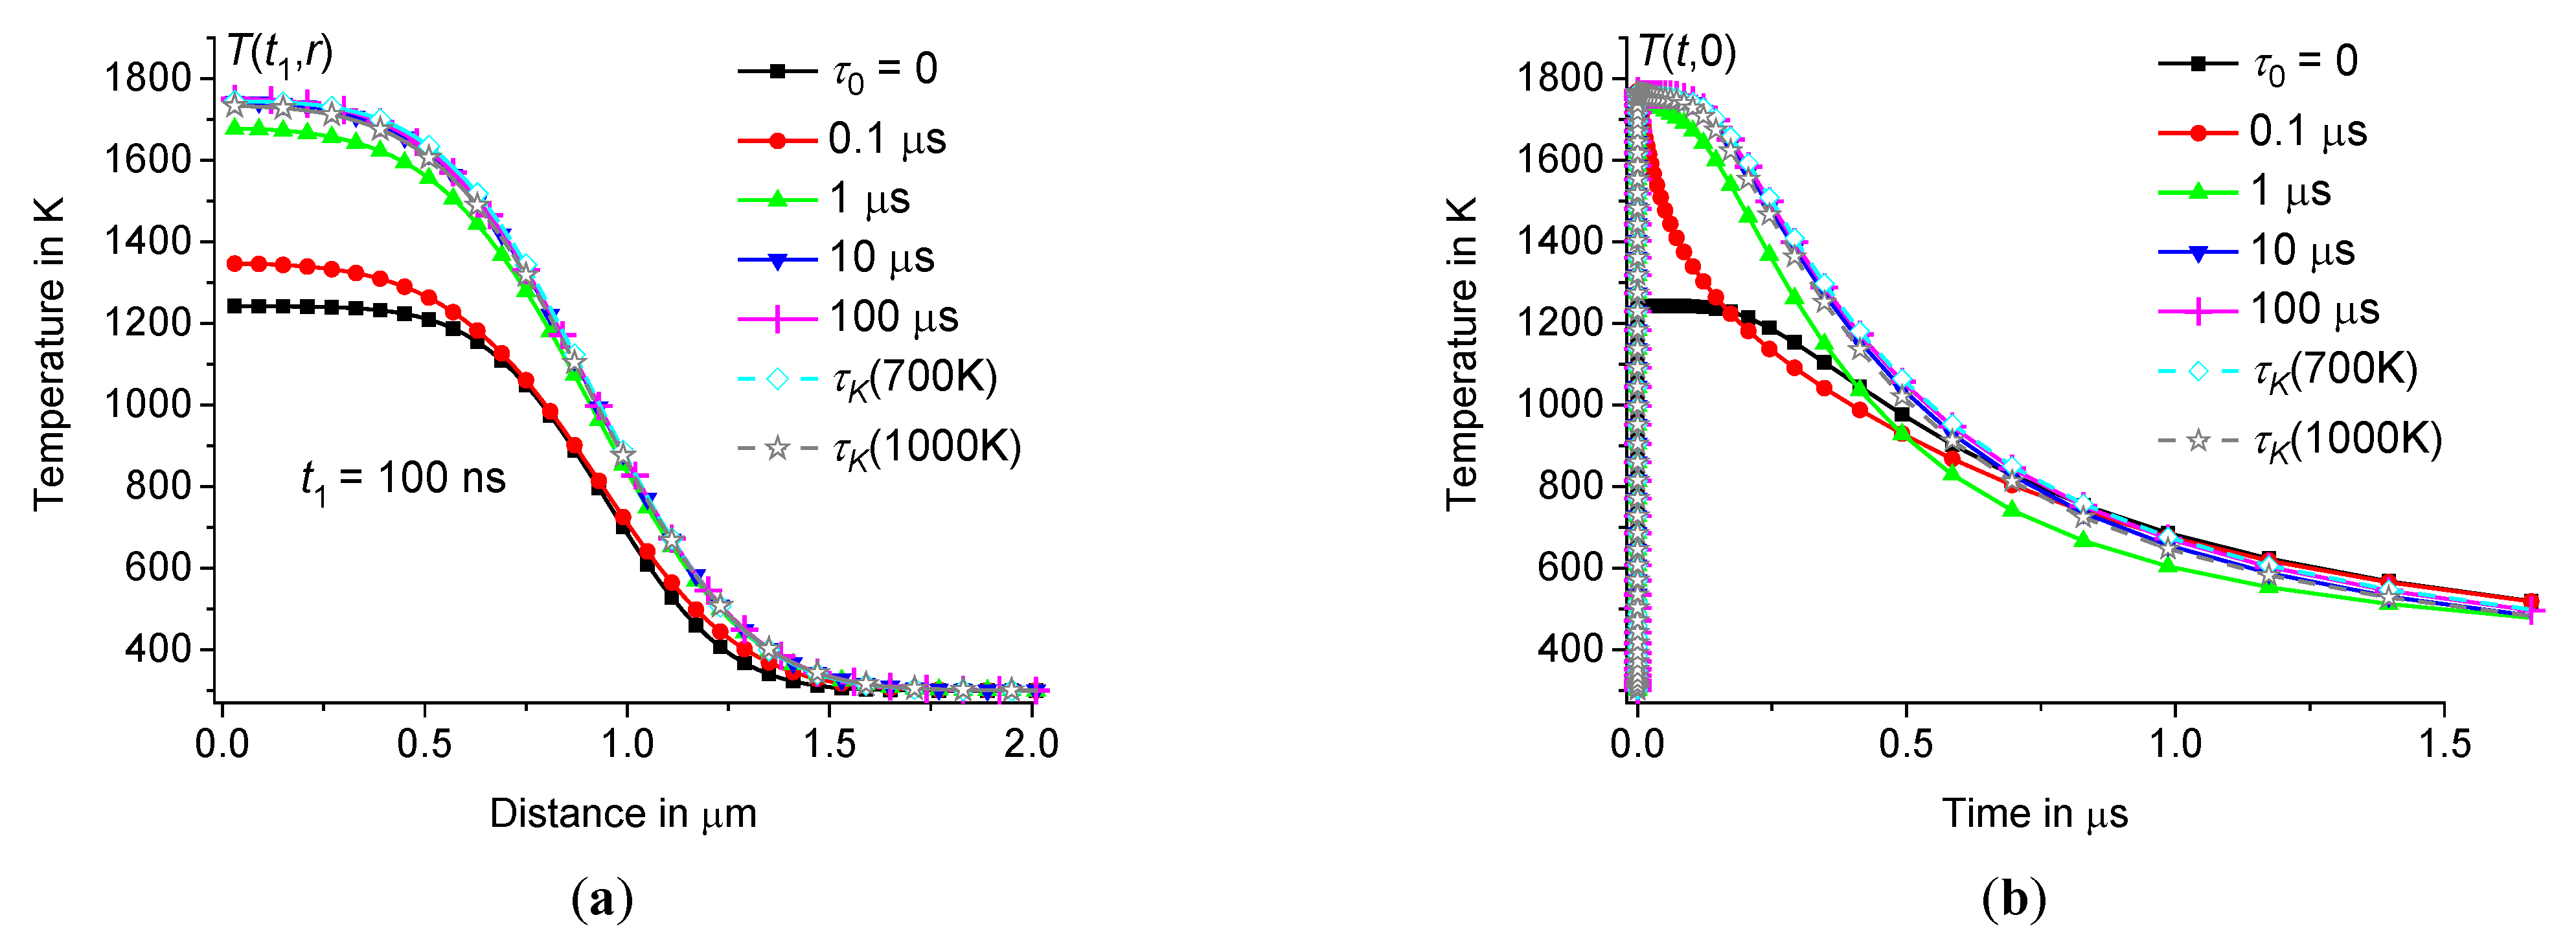
The influence of time dispersion of dynamic heat capacity is significant in both borosilicate and sodium-silicate glasses. Now let us consider the influence of the size of the heating zone on the temperature distribution .
3.4. Dependence of on the size of the heating zone
For example, let us compare the temperature distributions at 1 and 2 μm for borosilicate glass, see Table 1. To obtain the same thermal response value, let us set 120 nJ at 2 μm, increasing the energy in proportion to the volume of the heating zone. Thus, in both cases we obtain the same amplitudes of the temperature response to heating pulses, see Figures8 – 9. As expected, the temperature in the center of the heating zone relaxes in a time of the order of , which for borosilicate glass is about 15 μs at 2 μm and 2.6⸱10-7 m2/s. For comparison, relaxes four times faster at 1 μm than at 2 μm, see Figures8(b) – 9(b). As the size of the heating zone increases, the saturation of the influence of the time dispersion of the dynamic heat capacity on shifts towards larger values of . For example, compare at 1 μs for 1 and 2 μm, see Figures8 – 9.
Figure 9.
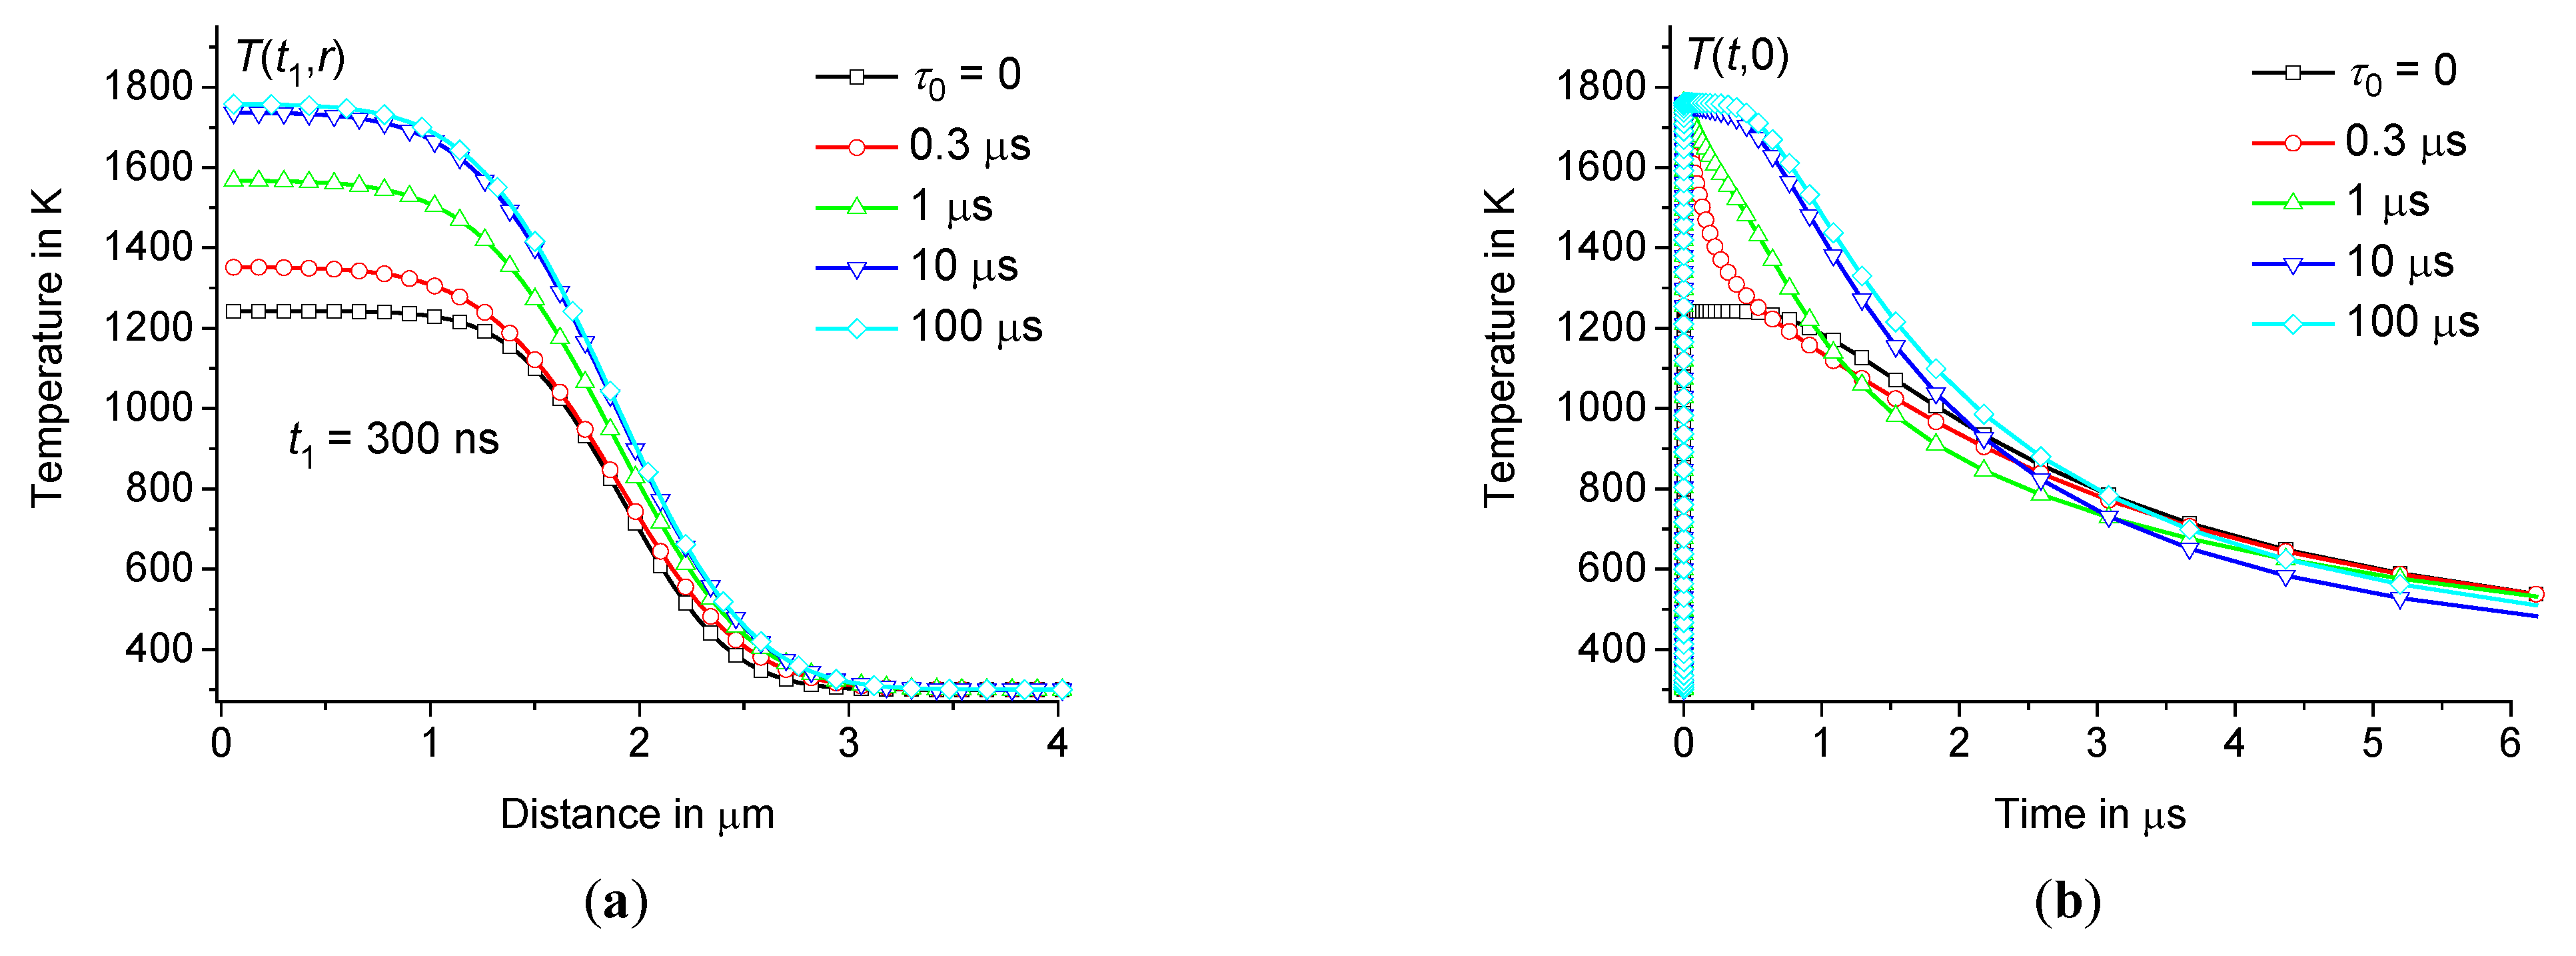
depending on the distance at 300 ns (a) and time dependence of in the center of the hot zone (b) for borosilicate glass at 2 μm, 300 ps, 120 nJ, 300 K ( 0, 0.3 μs, 1 μs, 10 μs, and 100 μs – squares, circles, triangles up, triangles down, and diamonds).
Figure 9.
depending on the distance at 300 ns (a) and time dependence of in the center of the hot zone (b) for borosilicate glass at 2 μm, 300 ps, 120 nJ, 300 K ( 0, 0.3 μs, 1 μs, 10 μs, and 100 μs – squares, circles, triangles up, triangles down, and diamonds).
4. Cooling rate distribution and its influence on microstructuring processes of glasses
Now consider the spatial distribution of the rate of temperature change . Due to thermal expansion, the size of the heating zone changes with temperature by about 10 nm or less. We neglect these changes with respect to . Let us consider the rate of temperature change due to thermal diffusion. This temperature change affects the physical properties of the material. We will focus on very fast (about 109 K/s or more) local temperature changes that have the greatest impact on the microstructuring process, and will study the effect associated with the time dispersion of the dynamic heat capacity. It is worth noting that this effect is significant even well above the glass transition temperature .
For example, the rate of temperature change for borosilicate glass at 2 μm, 300 ps, 120 nJ and various is presented in Figures10 – 11. Note that the rate of temperature change is greatest near the periphery of the hot zone, see Figure10(a). The cooling rate is about 600 GK/s at 1.98 μm and 0.36 ns, see Figure11(a). However, in the center of the heating zone, the cooling rate does not exceed 0.6 GK/s, i.e. is three orders of magnitude less than the cooling rate at the periphery, see Figure11. Therefore, the local structure of glass in the center of the hot zone should differ significantly from the structure at the periphery of the heating zone after laser modification. This conclusion is consistent with experiments [19,34,36,40,46,49,50,51,52,53]. However, the effect associated with dynamic heat capacity (at 0) is significant both in the center and at the periphery of the heating zone. Indeed, the maximum cooling rate is approximately 2.5 times greater at 0 than at 0 both at the periphery and in the center of the heating zone, see Figure11.
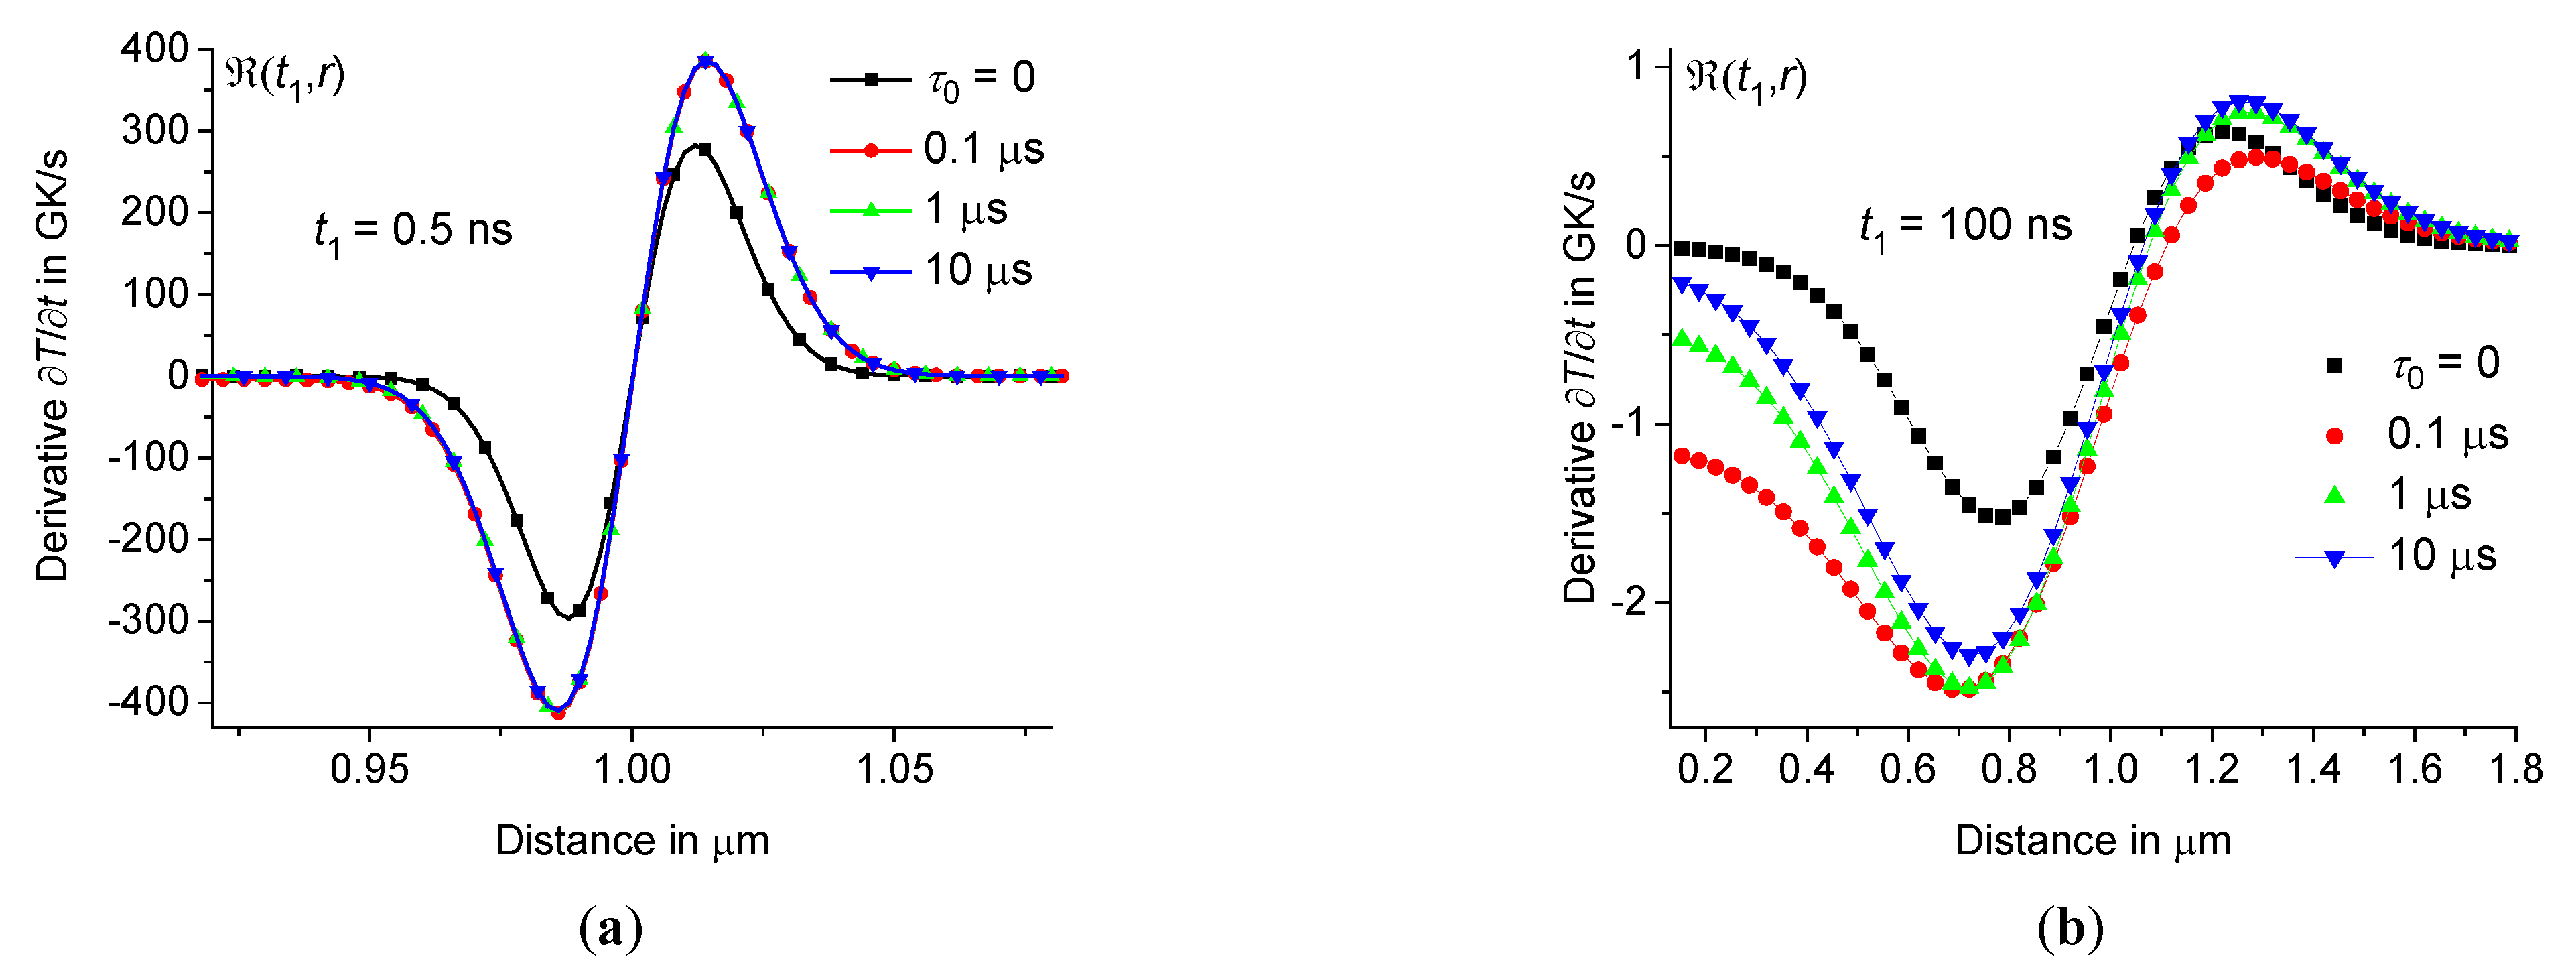
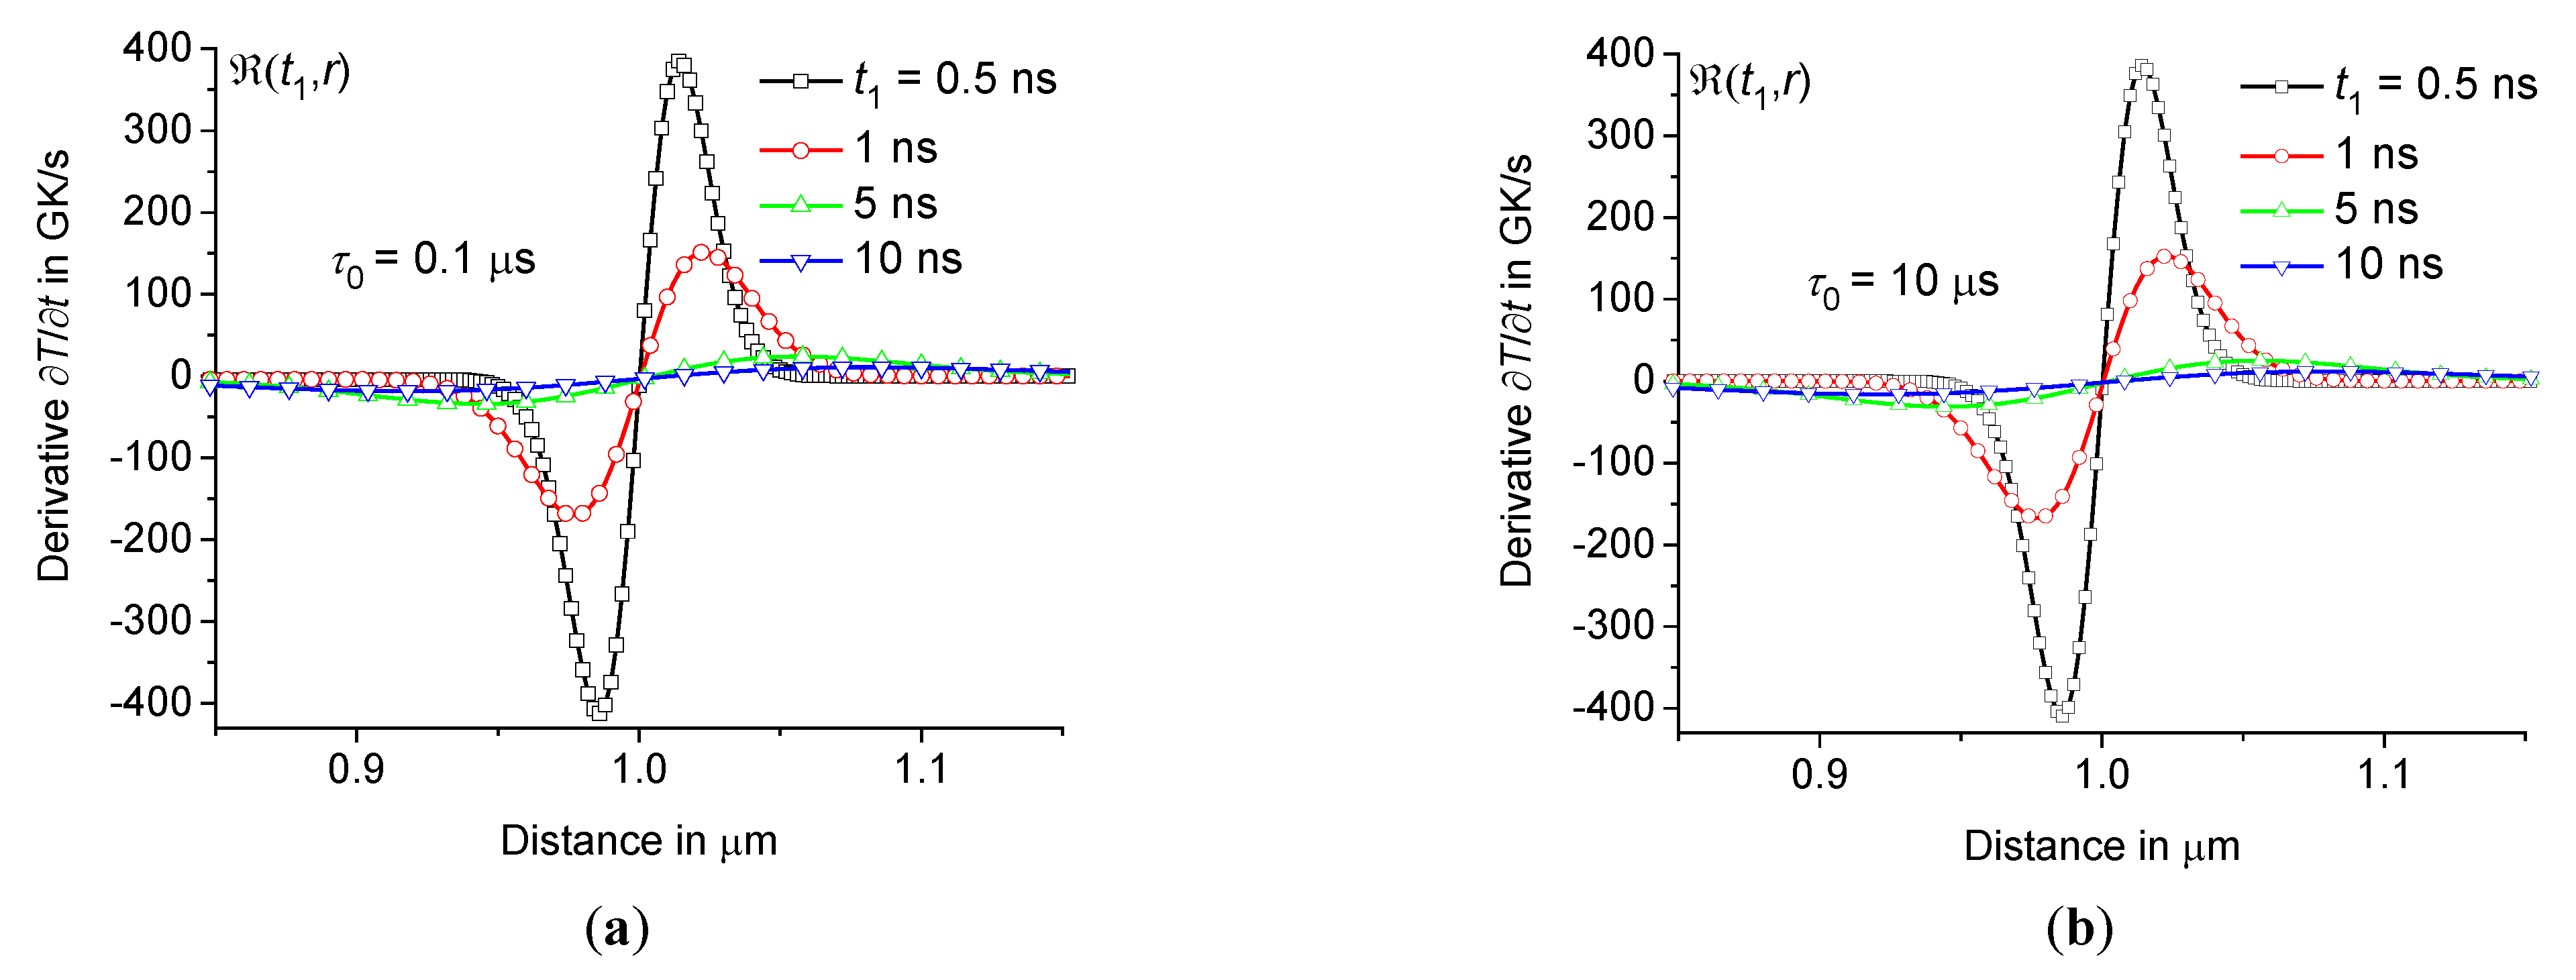
Let us consider the cooling rate in a thin shell in the region from 0.95 to 0.99. As we have established for borosilicate and sodium-lime-silicate glasses, ultra-fast cooling of the material occurs in this region at a rate of more than 1011 K/s, see Figures10 – 13. It is noteworthy that at the beginning of the cooling process (during the first few nanoseconds), the rate of temperature change is the same for small and large relaxation times , see Figures10(a) and 12(a). This means that at the beginning of the cooling process at the periphery of the hot zone, the shape of the distribution function does not affect the cooling rate . Therefore, in this case, even at very small relaxation times , the influence of the time dispersion of the dynamic heat capacity is significant.
Figure 10.
Rate of temperature change depending on the distance at the periphery of the hot zone at 0.5 ns (a) and time dependence of at 1.98 μm (b) at the same parameters as in Figure9 ( 0, 0.3 μs, 1 μs, 10 μs, and 100 μs – squares, circles, triangles up, triangles down, and diamonds). Inset (a) shows as a function of distance at 100 ns for different .
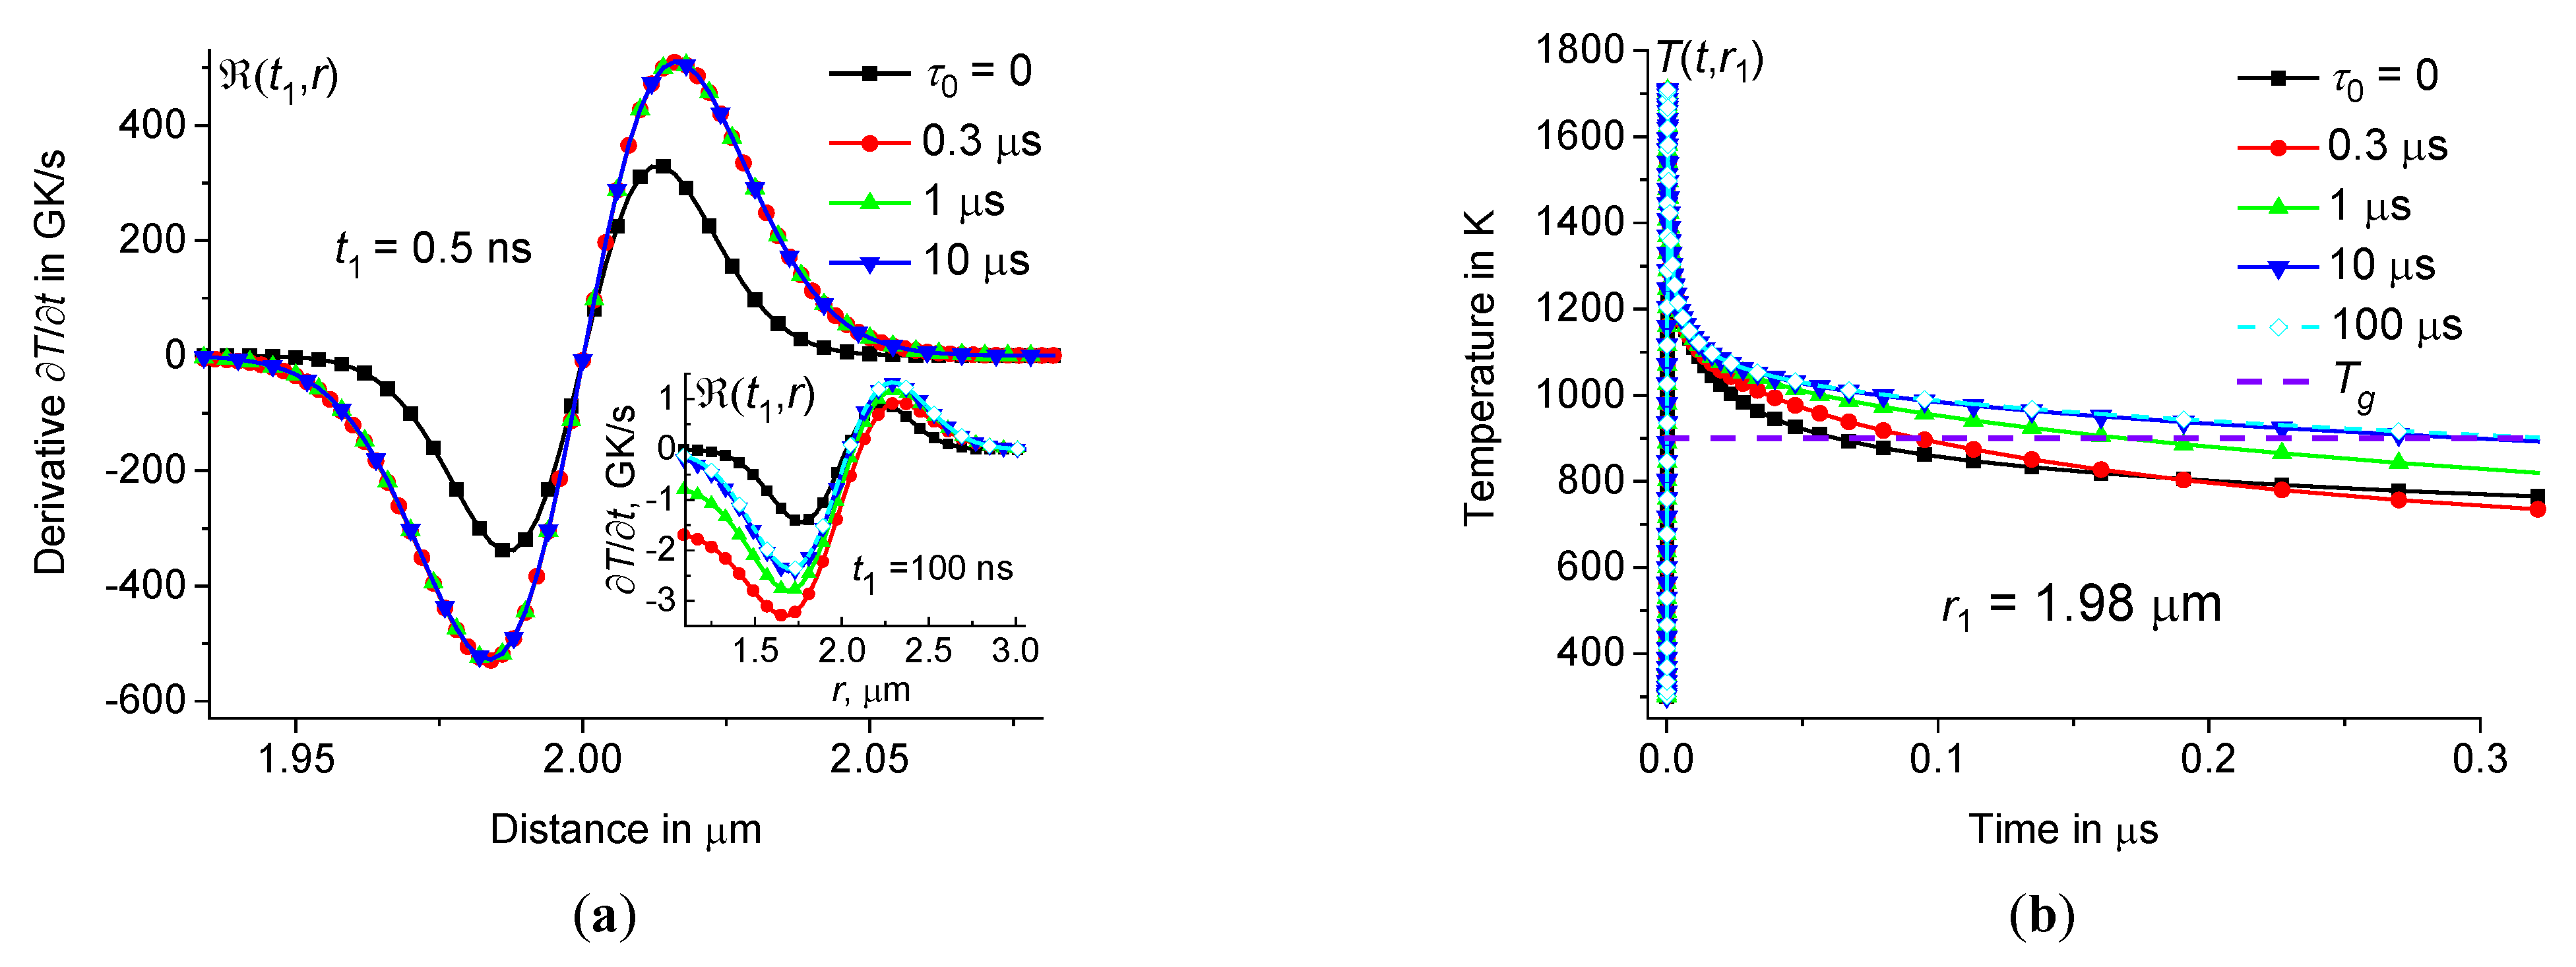
Figure 11.
Time dependence of cooling rate – at 1.98 μm (a) and 0 (b) at the same parameters as in Figures9 and 10 ( 0, 10 μs, and 100 μs – squares, circles, and triangles).
Figure 11.
Time dependence of cooling rate – at 1.98 μm (a) and 0 (b) at the same parameters as in Figures9 and 10 ( 0, 10 μs, and 100 μs – squares, circles, and triangles).
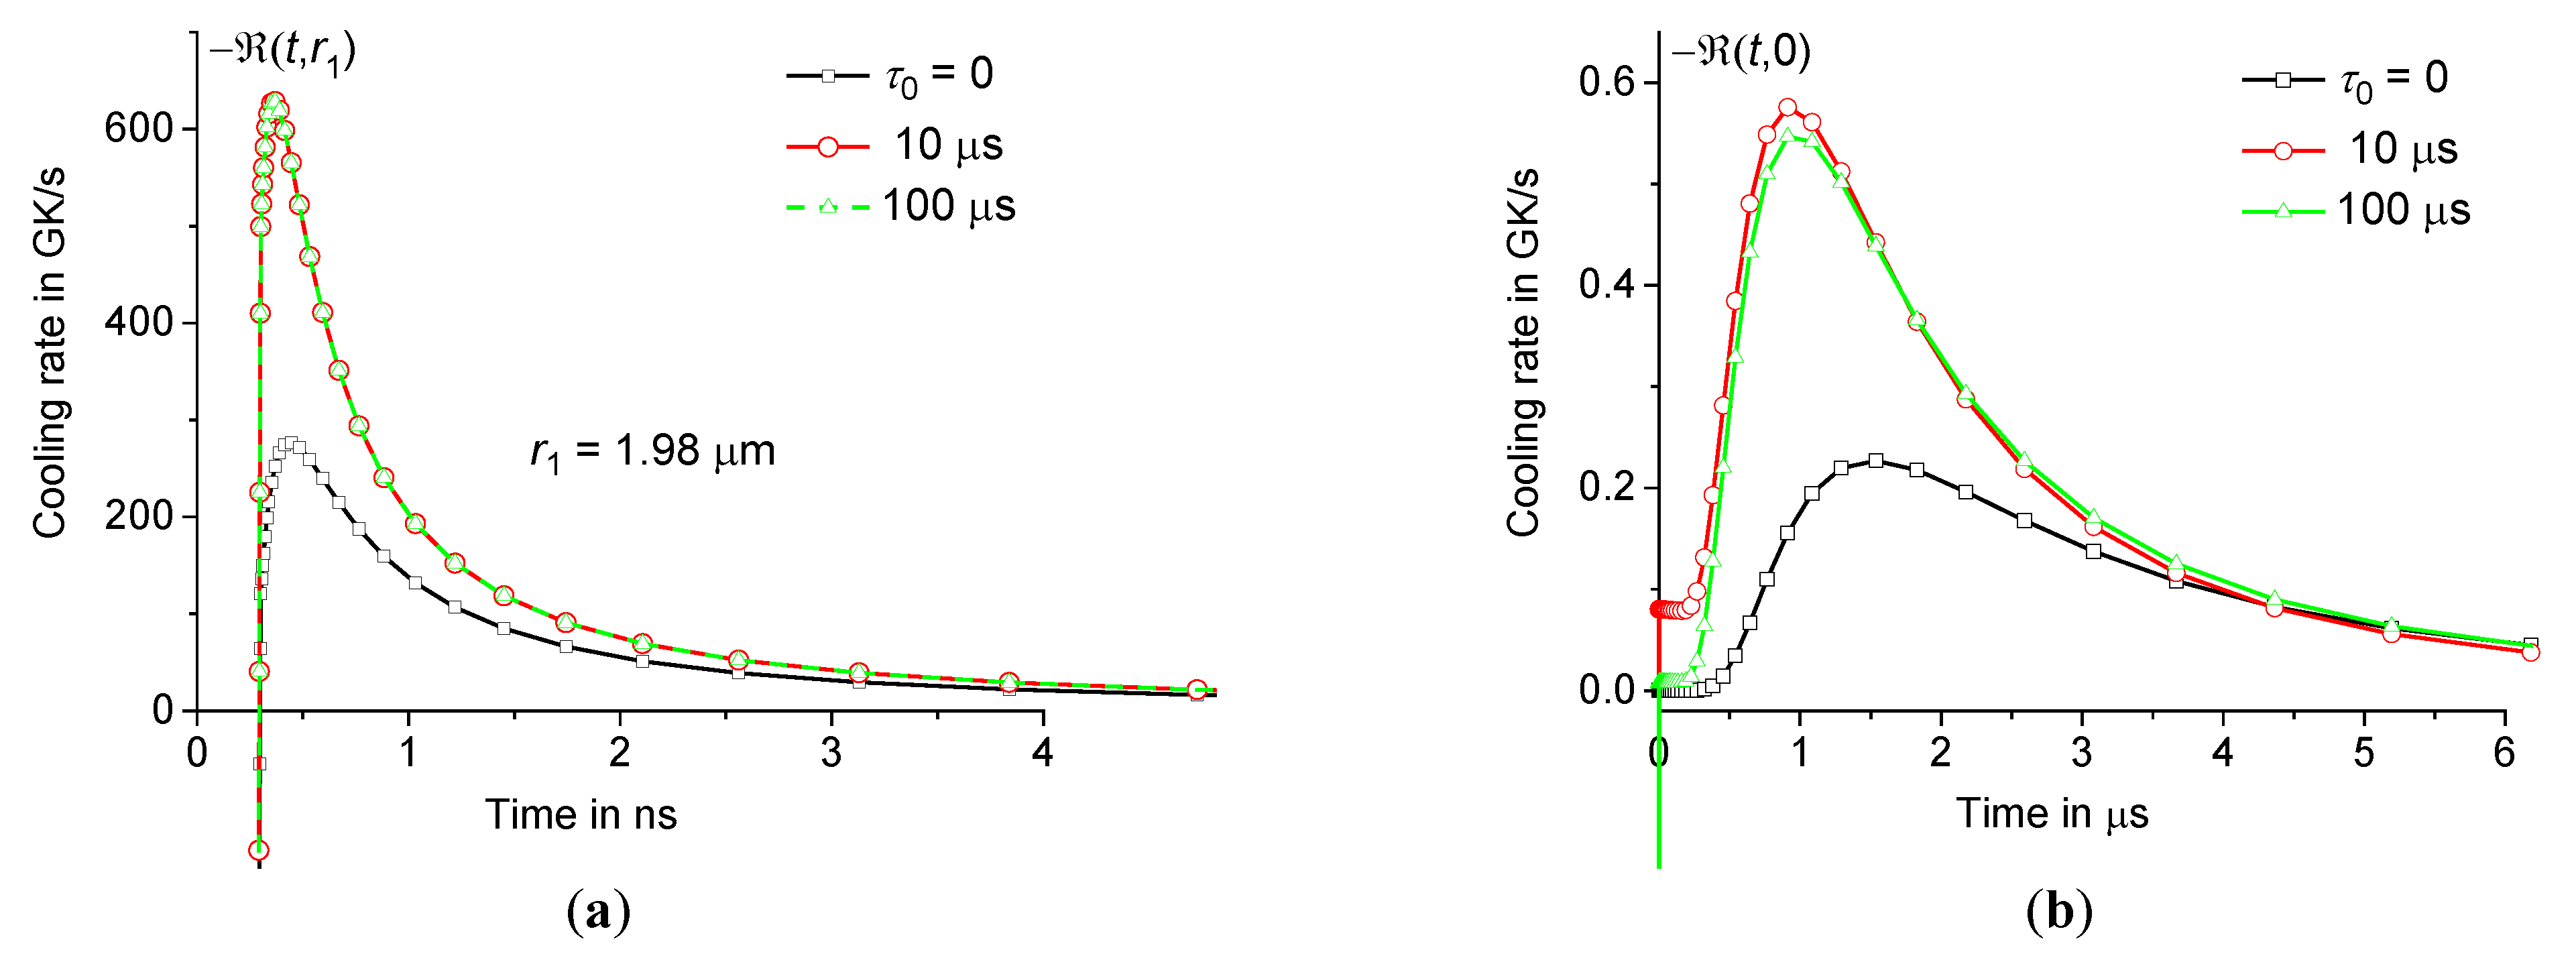
Figure 12.
depending on the distance at the periphery of the hot zone at 0.5 ns (a) and 100 ns (b) for sodium-lime-silicate glass at the same parameters as in Figure3 ( 0, 0.1 μs, 1 μs, and 10 μs – squares, circles, triangles up, and triangles down).
Figure 12.
depending on the distance at the periphery of the hot zone at 0.5 ns (a) and 100 ns (b) for sodium-lime-silicate glass at the same parameters as in Figure3 ( 0, 0.1 μs, 1 μs, and 10 μs – squares, circles, triangles up, and triangles down).
The cooling rate reaches a maximum at for a given , see Figures10 and 12. The rate decreases over time, and the distance , at which the rate is maximum, shifts slightly towards the center of the heating zone. However, still exceeds 2 – 3 GK/s at 100 ns, see Figures10(a) and 12(b). The change in cooling rate over time for sodium-lime-silicate glass at 1 μm, 10 μs and the same conditions as in Figure3 is presented in Table 3. The rate depending on the distance at the periphery of the hot zone for different is shown in Figure13.

Table 3.
Cooling rate for sodium-lime-silicate glass at 1 μm.
| Time ns |
Distance μm |
Cooling rate GK/s |
| 0.5 | 0.985 | 410 |
| 1 | 0.98 | 170 |
| 5 | 0.94 | 31 |
| 10 | 0.92 | 16 |
| 50 | 0.80 | 4 |
| 100 | 0.70 | 2.3 |
Figure 13.
depending on the distance at the periphery of the hot zone at 0.1 μs (a) and 10 μs (b) at the same parameters as in Figure3 ( 0.5 ns, 1 ns, 5 ns, and 10 ns – squares, circles, triangles up, and triangles down).
Figure 13.
depending on the distance at the periphery of the hot zone at 0.1 μs (a) and 10 μs (b) at the same parameters as in Figure3 ( 0.5 ns, 1 ns, 5 ns, and 10 ns – squares, circles, triangles up, and triangles down).
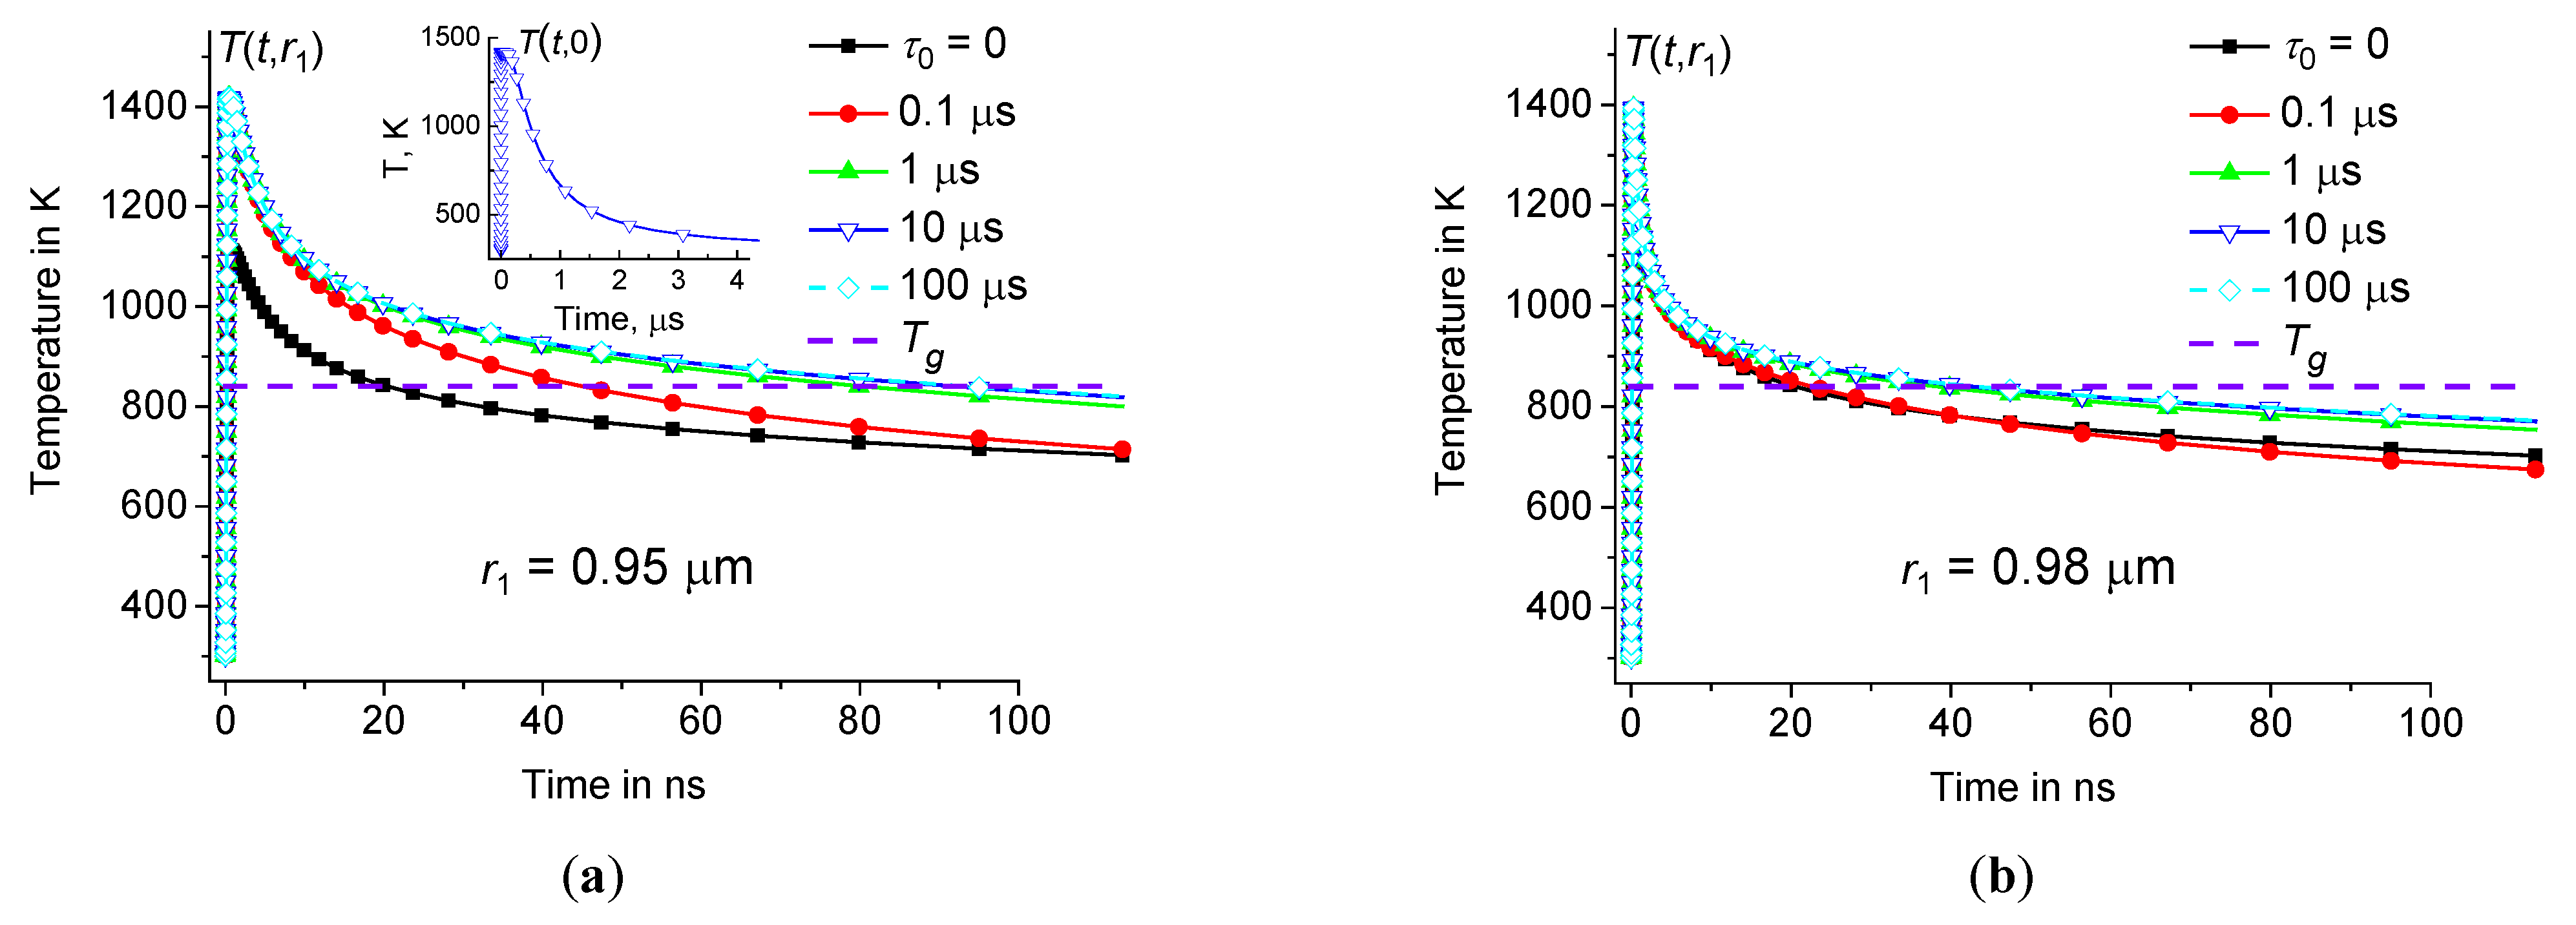
Thus, since the local structure of the material strongly depends on the local cooling rate , the local structure of the material at the periphery of the hot zone changes significantly relative to the original glass matrix. This modification of glass practically stops as soon as the local region is cooled below the glass transition temperature . Thus, the modification process occurs until the temperature in the local region at drops below . For example, consider the cooling curves calculated at the periphery of the hot zone for borosilicate (= 900 K [63]) and sodium-lime-silicate glasses (= 840 K [57]), see Figure10(b) and Figure14, respectively. It should be noted that the effect associated with the time dispersion of the dynamic heat capacity is significant well above the glass transition temperature . Indeed, in the case of 1 μm, the modification process occurs within approximately 80 ns at 0.95 μm and 1 μs, see Figure14(a). However, without taking into account the time dispersion of the dynamic heat capacity (at 0), this process occurs in less than 20 ns, see Figure14(a). In the case of 2 μm, the modification process occurs during a longer period of about 300 ns at 1.98 μm and 1 μs, see Figure10(b). However, without taking into account the time dispersion of the dynamic heat capacity (at 0), this process occurs in less than 50 ns, see Figure10(b).
Figure 14.
Time dependence of at the periphery of the hot zone at 0.95 μm (a) and 0.98 μm (b) at the same parameters as in Figure3 ( 0, 0.1 μs, 1 μs, 10 μs, and 100 μs – squares, circles, triangles up, triangles down, and diamonds). Inset (a) shows time dependence of in the center of heating zone (at 10 μs).
To summarize, we can conclude that the maximum cooling rate exists in the outer regions of the heating zone, in the shell of about . The cooling rate reaches several hundred GK/s in the first nanosecond after the laser pulse. Then the cooling rate decreases. However, even 100 ns after the laser pulse, in the outer shell of the hot zone still exceeds 1 GK/s. It is noteworthy that in the center of the heating zone the cooling rate is three orders of magnitude less than at the periphery. Since regions quenched at different cooling rates have different physical properties, strong gradients of physical properties should exist in the material predominantly at a distance of about from the center of the heating zone. This effect is significantly enhanced by the time dispersion of the dynamic heat capacity.
In conclusion, let us briefly discuss laser micro-processing in the cumulative heating mode. Typically, cumulative heating is achieved at a laser pulse repetition rate more than hundreds of kHz. Usually, this mode operates at frequencies from 200 kHz to 10 MHz [3]. Indeed, the temperature in the center of the hot zone relaxes in a time of the order of , which for the glasses under consideration is about 4 μs at 1 μm, see inset in Figure14(a). Thus, in this case, the cumulative effect can be achieved at a frequency of about 250 kHz or more. Note that the cumulative effect leads to stable average heating of the material in the heating zone. Thus, the effect of laser pulse repetition can be approximately simulated by shifting upward the local temperature distribution by a certain temperature difference , which increases with increasing pulse repetition frequency. It is clear that with increasing the modification process will occur over a longer time interval, see Figure14, where should be shifted upward by the amount . Then in the local region at will fall below at a cooling rate lower than at zero repetition frequency (at 0). Consequently, local gradients in the physical properties of locally modified glass will be smoothed out due to cumulative heating. The effect of the repetition rate will be discussed in more detail in a separate article.
5. Discussion
The local temperature distribution and the local cooling rate determine the local structure of the glass matrix during laser-induced microstructuring. Thus, knowledge of the dynamics of the local temperature distribution is very important for applications associated with local laser heating, for example, for femtosecond laser microstructuring of glasses. However, as shown in this article, the dynamics of the local temperature distribution significantly depends on the time dispersion of the dynamic heat capacity of the glass matrix. This work proposes a method for analytical calculation of and for glass-forming materials under local fast laser excitations. It is shown that the dynamics of the local temperature distribution caused by a laser pulse can be described by the heat equation with dynamic heat capacity . This equation has an analytical solution to a spherically symmetric boundary value problem. Using this analytical solution, we obtained the temperature distribution and local cooling rate for the thermal parameters of borosilicate and sodium-lime-silicate glasses. In fact, this analytical solution depends on the following relaxation parameters of the dynamic heat capacity of the material: relaxation time and the distribution function , which can be obtained from broadband heat capacity spectroscopy. However, as shown in this article, the shape of the distribution function has little effect on and , since with increasing the influence of the time dispersion of the dynamic heat capacity reaches saturation. It should be noted that the influence of the time dispersion of the dynamic heat capacity is most pronounced at the beginning of the process, when changes on a nanosecond time scale. We found that this effect is significant already at about 0.1 μs, increases with increasing and reaches saturation at above . Thus, the influence of the time dispersion of dynamic heat capacity on the temperature distribution can be calculated for a fixed, sufficiently large (in fact, for of the order of ten or several tens of microseconds, depending on the radius of the heating zone ). As expected, the results obtained are very similar for different . However, as the size of the heating zone increases, the laser pulse energy must increase in proportion to the volume of the heating zone in order to obtain the same amplitude of the local thermal response.
It has been established that the temperature distribution and local cooling rate are not affected by the heating pulse duration and the shape of the heating pulse. It should be noted that the temperature perturbation in the center of the heating zone relaxes not as , in contrast to the often-used estimate based on the fundamental solution of the Fourier heat equation. In fact, the heating pulse cannot be considered as an instantaneous point source of heat. Thus, it is necessary to integrate the thermal response over the time interval and the volume of the heating zone, then the resulting correct solution completely coincides with the temperature distribution found in this article for 0. In addition, the solution found in this article can be used for materials with dynamic heat capacity at 0.
We found that the rate of temperature change is greatest near the periphery of the hot zone. The cooling rate reaches a maximum when is slightly less than . It turns out that ultra-fast cooling of the material occurs at a rate of more than 1011 K/s in a thin shell in the region from 0.95 to 0.99. However, in the center of the heating zone, the cooling rate is three orders of magnitude lower than at the periphery. Thus, the local structure of glass after laser modification in the center of the hot zone should differ significantly from the structure at the periphery, which is consistent with experiments [19,34,36,40,46,49,50,51,52,53]. It is noteworthy that the effect associated with the time dispersion of the dynamic heat capacity is very significant both in the center and at the periphery of the heating zone. In fact, the maximum cooling rate is approximately 2.5 times greater at 0 than at 0 both at the periphery and in the center of the heating zone, see Figure11.
It is worth noting that at the beginning of the cooling process at the periphery of the hot zone, the shape of the distribution function does not affect the cooling rate . In fact, even at a very short relaxation time , the influence of the time dispersion of the dynamic heat capacity is very significant at the beginning of the cooling process. The cooling rate decreases over time , however, in the outer regions of the heating zone, the cooling rate still exceeds 2 – 3 GK/s at about 100 ns. Regions quenched at different cooling rates have different physical properties. Thus, strong gradients of physical properties should exist in the material, mainly at a distance of about from the center of the heating zone. It is worth noting that the time dispersion of the dynamic heat capacity significantly enhances this effect. In addition, the effect associated with the time dispersion of the dynamic heat capacity is significant even well above the glass transition temperature . It turns out that the duration of the modification process strongly depends on the relaxation time of the dynamic heat capacity . Thus, the rate of local cooling and gradients of physical properties of locally modified glass strongly depend on the relaxation time of the dynamic heat capacity . Finally, it is worth noting that the gradients of physical properties in areas quenched at different cooling rates are smoothed out by cumulative heating when processed in the cumulative heating mode.
In this article, we solved a problem for spherical geometry, which is closely related to data storage technologies. There are a number of future directions that are worth developing. A future research direction could be the problem with cylindrical geometry, closely related to laser waveguide technologies. The cumulative heating mode at different laser pulse repetition rates and laser beam scanning speeds also deserves to be studied.
6. Conclusions
To summarize, it can be emphasized that during laser microstructuring of glass-forming materials, the local temperature distribution and the local cooling rate significantly depend on the time dispersion of the dynamic heat capacity of the glass matrix. The rate of temperature change is maximum near the periphery of the heating zone. However, the effect associated with the time dispersion of the dynamic heat capacity is very significant both in the center and at the periphery of the heating zone. The effect associated with the time dispersion of the dynamic heat capacity is significant even well above the glass transition temperature . It turns out that in the thin shell of the heating zone, ultra-fast cooling of the material occurs at a rate of more than 1011 K/s, and strong gradients of physical properties must exist in the material, mainly in a thin shell around the heating zone. The time dispersion of the dynamic heat capacity significantly enhances this effect. However, these gradients in physical properties should be smoothed out when processed in the cumulative heating mode. Further directions of research may be related to the consideration of the cumulative heating regime for various geometries. The results of this work can be useful for a better understanding and optimization of technologies associated with laser-induced microstructuring of glasses.
Author Contributions
Conceptualization, A.M.; formal analysis, A.M.; methodology, A.M.; supervision, C.S.; visualization, A.M.; writing—original draft, A.M.; writing—review and editing, C.S. All authors have read and agreed to the published version of the manuscript.
Funding
This research received no external funding.
Institutional Review Board Statement
Not applicable.
Informed Consent Statement
Not applicable.
Data Availability Statement
The datasets generated during and/or analyzed during the current study are available from the corresponding author on reasonable request.
Acknowledgments
A.M. acknowledges the administrative and technical support of the Prokhorov General Physics Institute of the Russian Academy of Sciences.
Conflicts of Interest
The authors declare no conflicts of interest.
| Nomenclature | |
| Latin Symbols | |
| and | Parameters of the VFTH equation (K) |
| Heat capacity of the solid material (J·kg−1·K−1) | |
| Heat capacity of the liquid material (J·kg−1·K−1) | |
| , | Initial and equilibrium heat capacities (J·kg−1·K−1) |
| Dynamic heat capacity (J·kg−1·K−1) | |
| Thermal diffusivity (m2·s−1) | |
| Energy of laser pulse (nJ) | |
| Parameter of the VFTH equation (Hz) | |
| Time dependence of the pulse power (dimensionless) | |
| Fundamental solution of the Fourier heat equation (m-3) | |
| Distribution function (s−1) | |
| Bulk modulus (GPa) | |
| Rate of temperature change (K·s−1) | |
| - | Cooling rate (K·s−1) |
| Parameter of the boundary value problem (μm) | |
| Heating zone radius (μm) | |
| Distance from the center of the hot zone (μm) | |
| Time (s) | |
| Temperature distribution obtained from fundamental solution (K) | |
| Local temperature distribution (K) | |
| Temperature distribution averaged using (K) | |
| Glass transition temperature (K) | |
| Initial temperature (K) | |
| Intermediate temperature (K) | |
| Maximum value of (K) | |
| Heating zone volume (m3) | |
| Specific volume (m3·kg−1) | |
| Longitudinal speed of sound (m·s−1) | |
| Greek Symbols | |
| Linear thermal expansion (K-1) | |
| Volumetric thermal expansion coefficient (K-1) | |
| Parameter of the Kohlrausch relaxation law (dimensionless) | |
| Relaxation parameter (dimensionless) | |
| Coefficient (dimensionless) | |
| Thermal conductivity (W·m-1·K-1) | |
| Relaxation parameter (dimensionless) | |
| Density (kg·m-3) | |
| Debye relaxation time (μs) | |
| Kohlrausch relaxation time (μs) | |
| Duration of laser pulse (fs) | |
| nth relaxation time (μs) | |
| Duration of heating pulse (ps) | |
| Volumetric heat flux density (W·m-3) | |
| Volumetric heat flux density (W·m-3) | |
| nth Fourier component (W·m-2) | |
| nth Fourier component (K·m) | |
| Temperature modulation frequency (rad·s−1) | |
Appendix A
Eq.(7) can be converted to Eq.(13) by replacing with :
Thus, we obtain a one-dimensional problem, with uniform boundary and initial conditions: , , and at .
This boundary value problem is satisfied by the following series:
where the functions are the solutions of Eq.(9) [70]. Thus, for a heat source uniformly distributed in a volume of radius with power density , and for the heating pulse , acting during the time interval , we obtain solutions of Eq.(9) represented by Eq.(15) and Eq.(16) for and , respectively.
where and are the roots of the polynomial . The parameters and are real, positive, and for and , . The series in Eq.(8) converges as for . In fact, it is enough to calculate the sum in Eq.(8) to about a thousand terms to obtain a result with an error of less than 1%.
Similarly, for a heating pulse of a square shape with power density , acting on a time interval , we obtain and for and , respectively, where are represented by Eq.(17):
Note that the solutions continuously transform into solutions of the classical Fourier heat equation: as or/and .
Similarly, the functions represented by Eq.(15) and Eq.(16) continuously transform into solutions of the classical Fourier heat equation as or/and , see Eq.(18) and Eq.(19) for and , respectively.
References
- Zhang, B.; Wang, Z.; Tan, D.; Liu, X.; Xu, B.; Tong, L.; Kazansky, P.G.; Qiu, J. Ultrafast Laser Inducing Continuous Periodic Crystallization in the Glass Activated via Laser-Prepared Crystallite-Seeds. Adv. Optical Mater. 2021, 9, 2001962. [CrossRef]
- Osellame, R.; Hoekstra, H.J.W.M.; Cerullo, G.; Pollnau, M. Femtosecond laser microstructuring: an enabling tool for optofluidic lab-on-chips. Laser Photonics Rev. 2011, 5, 442–463. [CrossRef]
- Lei, Y.; Wang, H.; Shayeganrad, G.; Kazansky, P.G. Ultrafast laser nanostructuring in transparent materials for beam shaping and data storage. Optical Materials Express 2022, 12, 3327-3355. [CrossRef]
- Stoian, R.; Colombier, J.P. Advances in ultrafast laser structuring of materials at the nanoscale. Nanophotonics 2020, 9, 4665–4688. [CrossRef]
- Butkute, A.; Jonusauskas, L. 3D Manufacturing of Glass Microstructures Using Femtosecond Laser. Micromachines 2021, 12, 499. [CrossRef]
- Petit, Y.; Danto, S.; Guerineau, T., Khalil, A.A.; Camus, A.; Fargin, E.; Duchateau, G.; Berube, J.P.; Vallee, R.; Messaddeq, Y.; Cardinal, T.; Canioni, L. On the femtosecond laser-induced photochemistry in silver-containing oxide glasses: mechanisms, related optical and physico-chemical properties, and technological applications. Adv. Opt. Techn. 2018, 7, 291–309. [CrossRef]
- Torun, G.; Yadav, A.; Richardson, K.A.; Bellouard, Y. Ultrafast Laser Direct-Writing of Self-Organized Microstructures in Ge-Sb-S Chalcogenide Glass. Front. Phys. 2022, 10, 883319. [CrossRef]
- Lipatiev, A.S.; Lotarev, S.V.; Lipateva, T.O.; Fedotov, S.S.; Lopatina, E.V.; Sigaev, V.N. Ultrafast-Laser-Induced Tailoring of Crystal-in-Glass Waveguides by Precision Partial Remelting. Micromachines 2023, 14, 801. [CrossRef]
- Lipatiev, A.; Lotarev, S.; Lipateva, T.; Okhrimchuk, A.; Fedotov, S.; Lotnyk, A.; Sigaev, V. Fabrication of single-mode hybrid crystal-glass waveguides by direct femtosecond laser writing and thermal annealing. Materials Research Bulletin 2022, 152, 111840. [CrossRef]
- Beresna, M.; Gecevicius, M.; Kazansky, P.G. Ultrafast laser direct writing and nanostructuring in transparent materials. Advances in Optics and Photonics 2014, 6, 293-339. [CrossRef]
- Shakhgildyan, G.Yu.; Lipatiev, A.S.; Fedotov, S.S.; Vetchinnikov, M.P.; Lotarev, S.V.; Sigaev, V.N. Microstructure and optical properties of tracks with precipitated silver nanoparticles and clusters inscribed by the laser irradiation in phosphate glass. Ceramics International 2021, 47, 14320–14329. [CrossRef]
- Jurgens P.; Liewehr B.; Kruse B.; Peltz C.; Witting T.; Husakou A.; Rouzee A.; Ivanov M.Y.; Fennel T.; Vrakking M.J.J.; Mermillod-Blondin A. Characterization of laser-induced ionization dynamics in solid dielectrics. ACS Photonics 2022, 9, 233–240. [CrossRef]
- Seuthe, T.; Mermillod-Blondin, A.; Grehn, M.; Bonse J.; Wondraczek L.; Eberstein M. Structural relaxation phenomena in silicate glasses modified by irradiation with femtosecond laser pulses. Sci. Rep. 7, 2017, 43815. [CrossRef]
- Bonse J.; Seuthe T.; Grehn M.; Eberstein M.; Rosenfeld A.; Mermillod-Blondin A. Time-resolved microscopy of fs-laser-induced heat flows in glasses. Appl. Phys. A 2018, 124, 60. [CrossRef]
- Meany, T.; Grafe, M.; Heilmann, R.; Perez-Leija, A.; Gross, S.; Steel, M.J.; Withford, M.J.; Szameit, A. Laser written circuits for quantum photonics. Laser Photonics Rev. 2015, 9, 363–384. [CrossRef]
- 16. Y. Nasu, M. Abe, M. Kohtoku, Developments in laser processing for silica-based planar lightwave circuits. Proc. SPIE 6107 (2006) 61070B. [CrossRef]
- Tan, D.; Zhang, B.; Qiu, J. Ultrafast Laser Direct Writing in Glass: Thermal Accumulation Engineering and Applications. Laser Photonics Rev. 15 (2021) 2000455. [CrossRef]
- Lu, J.; Tian, J.; Poumellec, B.; Garcia-Caurel, E.; Ossikovski, R.; Zeng, X.; Lancry, M. Tailoring chiral optical properties by femtosecond laser direct writing in silica. Light. Sci. Appl. 2023, 12, 46. [CrossRef]
- Juodkazis, S.; Horyama, M.; Miwa, M.; Watanabe, M.; Marcinkevicius, A.; Mizeikis, V.; Matsuo, S.; Misawa, H. Stereolithography and 3D microstructuring of transparent materials by femtosecond laser irradiation. Proc. SPIE, 2002, 4644, 27-38. [CrossRef]
- Lencer, D.; Salinga, M.; Wuttig, M. Design Rules for Phase-Change Materials in Data Storage Applications. Advanced Materials 2011, 23, 2030-2058. [CrossRef]
- Hong, J.; Li, J.; Chu, D. Modulation approach of arbitrary linear polarization states of optical fields using single-beam coding for next-generation optical storage in glass. Optics & Laser Technology 2023, 164, 109539. [CrossRef]
- Lee, B.S.; Burr, G.W.; Shelby, R.M.; Raoux, S.; Rettner, C.T.; Bogle, S.N.; Darmawikarta, K.; Bishop, S.G.; Abelson, J.R. Observation of the role of subcritical nuclei in crystallization of a glassy solid. Science 2009, 326, 980-984. [CrossRef]
- Wang, Z.; Tan, D.; Qiu, J. Single-shot photon recording for three-dimensional memory with prospects of high capacity. Optics Letters 2020, 45, 6274-6277. [CrossRef]
- Huang, X.; Guo, Q.; Yang, D.; Xiao, X.; Liu, X.; Xia, Z.; Fan, F.; Qiu, J.; Dong, G. Reversible 3D laser printing of perovskite quantum dots inside a transparent medium. Nature Photonics 2020, 14, 82–88. [CrossRef]
- Li, X.; Wu, Y.; Lin, H.; Chen, G.; Hao, Y.; Wang, P.; Lin, S.; Xu, J.; Cheng, Y.; Wang, Y. Photochromic 3D Optical Storage: Laser-Induced Regulation of Localized Optical Basicity of Glass. Laser Photonics Rev. 2023, 2300744. [CrossRef]
- Jin, M.; Zhou, W.; Ma, W.; Wang, Q.; Liang, X.; Zhang, P.; Xiang, W. The inhibition of CsPbBr3 nanocrystals glass from self-crystallization with the assistance of ZnO modulation for rewritable data storage. Chemical Engineering Journal 2022, 427, 129812. [CrossRef]
- Sun, S.; Cheng, Z.; Song, J.; Yan, C.; Man, T.; Dong, G.; Qian, B.; Qiu, J. Low-Power-Consumption, Reversible 3D Optical Storage Based on Selectively Laser-Induced Photoluminescence Degradation in CsPbBr3 Quantum Dots Doped Glass. Adv. Mater. Technol. 2022, 7, 2200470. [CrossRef]
- Wang, H.; Lei, Y.; Wang, L.; Sakakura, M.; Yu, Y.; Shayeganrad, G.; Kazansky, P.G. 100-Layer Error-Free 5D Optical Data Storage by Ultrafast Laser Nanostructuring in Glass. Laser Photonics Rev. 2022, 16, 2100563. [CrossRef]
- Fedotov, S.; Lipatiev, A.; Lipateva, T.; Lotarev, S.; Melnikov, E.; Sigaev, V. Femtosecond laser-induced birefringent microdomains in sodium-borate glass for highly secure data storage. J. American Ceramic Society 2021, 104, 4297–4303. [CrossRef]
- Su, Z.; Sun, S.; Dai, Y.; Liu, X.; Qiu, J. Femtosecond laser direct-writing of perovskite nanocrystals in glasses. J. Non-Cryst. Solids: X 2023, 18, 100182. [CrossRef]
- Lu, J.; Tian, J.; Poumellec, B.; Garcia-Caurel, E.; Ossikovski, R.; Zeng, X.; Lancry, M. Tailoring chiral optical properties by femtosecond laser direct writing in silica. Light Sci. Appl. 2023, 12, 46. [CrossRef]
- Azkona, J.J.; Martinez-Calderon, M.; Granados, E.; Gomez-Aranzadi, M.; Rodriguez, A.; Olaizola, S.M. Femtosecond laser fabrication of volume-phase gratings in CdSxSe1–x doped borosilicate glass at a low repetition rate. Appl. Opt. 2019, 58, 4220 – 4226. [CrossRef]
- Lotarev, S.V.; Fedotov, S.S.; Pomigueva, A.I.; Lipatiev, A.S.; Sigaev, V.N. Effect of Pulse Repetition Rate on Ultrafast Laser-Induced Modification of Sodium Germanate Glass. Nanomaterials 2023, 13, 1208. [CrossRef]
- Vetchinnikov, M.P.; Lipatiev, A.S.; Shakhgildyan, G.Y.; Golubev, N.V.; Ignateva, E.S.; Fedotov, S.S.; Lipatieva, T.O.; Lotarev, S.V.; Vilkovisky, G.A.; Sigaev, V.N. Direct femtosecond laser-induced formation of CdS quantum dots inside silicate glass. Optics Letters 2018, 43, 2519-2522. [CrossRef]
- Bera, D.; Qian, L.; Tseng, T.K.; Holloway, P.H. Quantum Dots and Their Multimodal Applications: A Review. Materials 2010, 3, 2260-2345. [CrossRef]
- Lipatiev, A.S.; Shakhgildyan, G.Y.; Vetchinnikov, M.P.; Lotarev, S.V.; Lipatieva, T.O.; T.O. Sigaev, T.O. Laser writing of luminescent microdomains with CdS quantum dots in silicate glass. Glass and Ceramics 2021, 77, 369–371. [CrossRef]
- Korkut, C.; Cınar, K.; Kabacelik, I.; Turan, R.; Kulakcı, M.; Bek, A. Laser Crystallization of Amorphous Ge Thin Films via a Nanosecond Pulsed Infrared Laser. Crystal Growth & Design 2021, 21, 4632-4639. [CrossRef]
- Zhang, Y.; Liu, H.; Mo, J.; Wang, M.; Chen, Z.; He, Y.; Yang, W.; Tang, C. Atomic-level crystallization in selective laser melting fabricated Zr-based metallic glasses. Phys. Chem. Chem. Phys. 2019, 21, 12406-12413. [CrossRef]
- Phillips, K.C.; Gandhi, H.H.; Mazur, E.; Sundaram, S.K. Ultrafast laser processing of materials: a review. Adv. Opt. Photon. 2015, 7, 684-712. [CrossRef]
- Tan, D.; Sharafudeen, K.N.; Yue, Y.; Qiu, J. Femtosecond laser induced phenomena in transparent solid materials: Fundamentals and applications. Progress in Materials Science 2016, 76, 154-228. [CrossRef]
- Ams, M.; Marshall, G.D.; Dekker, P.; Dubov, M.; Mezentsev, V.K.; Bennion, I.; Withford, M.J. Investigation of Ultrafast Laser–Photonic Material Interactions: Challenges for Directly Written Glass Photonics. IEEE J. Selected Topics in Quantum Electronics 2008, 14, 1370-1381. [CrossRef]
- Gamaly, E.G., Juodkazis, S.; Nishimura, K.; Misawa, H.; Luther-Davies, B.; Hallo, L.; Nicolai, P.; Tikhonchuk, V.T. Laser-matter interaction in the bulk of a transparent solid: Confined microexplosion and void formation. Phys. Rev. B 2006, 73, 214101. [CrossRef]
- Schaffer, C.B.; Brodeur, A.; Mazur, E. Laser-induced breakdown and damage in bulk transparent materials induced by tightly focused femtosecond laser pulses. Meas. Sci. Technol. 2001, 12, 1784–1794.
- Lancry, M.; Regnier, E.; Poumellec, B. Fictive temperature in silica-based glasses and its application to optical fiber manufacturing. Progress in Materials Science 2012, 57, 63-94. [CrossRef]
- Debenedetti, P.; Stillinger, F. Supercooled liquids and the glass transition. Nature 2001, 410, 259–267. [CrossRef]
- Yoshino, T.; Ozeki, Y.; Matsumoto, M.; Itoh, K. In situ Micro-Raman Investigation of Spatio-Temporal Evolution of Heat in Ultrafast Laser Microprocessing of Glass. Japanese Journal of Applied Physics 2012, 51, 102403. [CrossRef]
- Richter, S.; Hashimoto, F.; Zimmermann, F.; Ozeki, Y.; Itoh, K.; Tunnermann, A.; Nolte, S. Spatial and temporal temperature distribution of ultrashort pulse induced heat accumulation in glass. Proceedings Volume 9355, Frontiers in Ultrafast Optics: Biomedical, Scientific, and Industrial Applications XV; 935515 (2015). [CrossRef]
- Richter, S.; Zimmermann, F.; Tunnermann, A.; Nolte, S. Laser welding of glasses at high repetition rates – Fundamentals and prospects. Optics & Laser Technology 2016, 83, 59-66. [CrossRef]
- Shakhgildyan, G.Y.; Lipatiev, A.S.; Vetchinnikov, M.P.; Popova, V.V.; Lotarev, S.V.; Golubev, N.V.; Ignateva, E.S.; Presniakov, M.M.; Sigaev, V.N. One-step micro-modification of optical properties in silver-doped zinc phosphate glasses by femtosecond direct laser writing. J. Non-Cryst. Sol. 2018, 481, 634-642. [CrossRef]
- Kunwar, P.; Soman, P. Direct Laser Writing of Fluorescent Silver Nanoclusters: A Review of Methods and Applications. ACS Appl. Nano Mater. 2020, 3, 7325−7342. https://dx.doi.org/10.1021/acsanm.0c01339.
- Varkentina, N.; Cardinal, T.; Morote, F.; Mounaix, P.; Andre, P.; Deshayes, Y.; Canioni, L. Examination of femtosecond laser matter interaction in multipulse regime for surface nanopatterning of vitreous substrates. Optics Express 2013, 21, 29090-29100. [CrossRef]
- Chen, L.; Guo, C.; Pan, M.; Lai, C.; Wang, Y.; Liao, G.; Ma, Z.; Zhang, F.; Suriyaprakash, J.; Guo, L.; Akinoglu, E.M.; Li, Q.; Wu, L. Sub-40 nm nanogratings self-organized in PVP-based polymer composite film by photoexcitation and two sequent splitting under femtosecond laser irradiation. Appl. Surf. Sci. 2023, 609, 155395. [CrossRef]
- Shimizu, M.; Sakakura, M.; Ohnishi, M.; Shimotsuma, Y.; Nakaya, T.; Miura, K.; Hirao, K. Mechanism of heat-modification inside a glass after irradiation with high-repetition rate femtosecond laser pulses. J. Appl. Phys. 2010, 108, 073533. [CrossRef]
- Sakakura, M.; Terazima, M. Initial temporal and spatial changes of the refractive index induced by focused femtosecond pulsed laser irradiation inside a glass. Phys. Rev. B 2005, 71, 024113. [CrossRef]
- Shimotsuma, Y.; Sakakura, M.; Miura, K.; Qiu, J.; Kazansky, P.G.; Fujita, K.; Hirao, K. Application of femtosecond-laser induced nanostructures in optical memory. J. Nanosci. Nanotechnol. 2007, 7, 94-104. https://pubmed.ncbi.nlm.nih.gov/17455477.
- Macedo, G.N.B.M.; Sawamura, S.; Wondraczek, L. Lateral hardness and the scratch resistance of glasses in the Na2O-CaO-SiO2 system. J. Non-Cryst. Sol. 2018, 492, 94–101. [CrossRef]
- Gonzalez-Oliver, C.J.R.; James, P.F. Crystal nucleation and growth in a Crystal nucleation and growth in a Na2O·2CaO·3SiO2 glass. J. Non-Crystal. Sol. 1980, 38–39, 699–704. [CrossRef]
- Huang, J.; Gupta, P.K. Temperature dependence of the isostructural heat capacity of a soda lime silicate glass. J. Non-Crystal. Sol. 1992, 139, 239-247. [CrossRef]
- Liu, B.; Liu, Q.; Li, B.; Behrens, H.; Lange, R.A. Ultrasonic studies of alkali-rich hydrous silicate glasses: Elasticity, density, and implications for water dissolution mechanisms. American Mineralogist 2023, 108, 744–753. [CrossRef]
- Wang, M.; Cheng, J.; Li, M.; He, F.; Deng, W. Viscosity and thermal expansion of soda-lime-silica glass doped with Gd2O3 and Y2O3. Solid State Sciences 2012, 14, 1233–1237. [CrossRef]
- Bouras, N.; Madjoubi, M.A.; Kolli, M.; Benterki, S.; Hamidouche, M. Thermal and mechanical characterization of borosilicate glass. Physics Procedia 2009, 2, 1135-1140. [CrossRef]
- Wereszczak, A.A.; Anderson Jr, C.E. Borofloat and Starphire Float Glasses: A Comparison. Int. J. Appl. Glass Science 2014, 5, 334–344. [CrossRef]
- George, J.L.; Sugawara, T.; Ohira, T.; Kruger, A.A.; Vienna, J.D. Heat capacity of complex aluminoborosilicate glasses. Int. J. Appl. Glass Sci. 2022, 13, 576-590. [CrossRef]
- Moynihan, C.T.; Easteal, A.J.; De Bolt, M.A.; Tucker, J. Dependence of the Fictive Temperature of Glass on Cooling Rate. J. American Ceramic Soc. 1976, 59, 12-16. [CrossRef]
- Lide, D.R. CRC Handbook of Chemistry and Physics, 90th ed.; CRC Press: Boca Raton, FL, USA, 2009; ISBN 13: 978-1420090840 / 10:1420090844.
- Birge, N.O.; Nagel, S.R. Specific heat spectroscopy of the glass transition. Phys. Rev. Lett. 1985, 54, 2674-2677. [CrossRef]
- Korus, J.; Beiner, M.; Busse, K.; Kahle, S.; Unger, R.; Donth, E. Heat capacity spectroscopy at the glass transition in polymers. Thermochim. Acta 1997, 304–305, 99–110. [CrossRef]
- Chua, Y.Z.; Schulz, G.; Shoifet, E.; Huth, H.; Zorn, R.; Scmelzer, J.W.P.; Schick, C. Glass transition cooperativity from broad band heat capacity spectroscopy. Colloid Polym. Sci. 2014, 292, 1893-1904. [CrossRef]
- Minakov, A.; Schick, C. Nanometer scale thermal response of polymers to fast thermal perturbations. J. Chem. Phys. 2018, 149, 074503. [CrossRef]
- Minakov, A.; Schick, C. Integro-Differential Equation for the Non-Equilibrium Thermal Response of Glass-Forming Materials: Analytical Solutions. Symmetry 2021, 13, 256. [CrossRef]
- Minakov, A.; Schick, C. Thermal Perturbations at Crystal Nucleation in Glass-Forming Liquids. Energies, 2022, 15, 9005. [CrossRef]
- Minakov, A.A.; Schick, C. Nanoscale Heat Conduction in CNT-polymer Nanocomposites at Fast Thermal Perturbations. Molecules 2019, 24, 2794. [CrossRef]
- Landau, L.D.; Lifshitz, E.M. Course of Theoretical Physics 5: Statistical physics Part 1, 3rd ed., Pergamon press, Oxford, 1980. ISBN-10: 0750633727 / ISBN-13: 978-0750633727.
- Landau, L.D.; Lifshitz, E.M. Course of Theoretical Physics 8: Electrodynamics of Continuous Media, Butterworth-Heinemann, Oxford, 2nd ed., 2000. ISBN-10: 0750626348 / ISBN-13: 978-0750626347.
- Schilling, R.L.; Song, R.; Vondracek, Z. Bernstein Functions: Theory and Applications, Hubert & Co Berlin 2010. ISBN 978-3-11-021530-4, . [CrossRef]
- Johnston, D.C. Stretched exponential relaxation arising from a continuous sum of exponential decays. Phys. Rev. B 2006, 74, 184430. [CrossRef]
- Berberan-Santos, M.N.; Bodunov, E.N.; Valeur, B. Mathematical functions for the analysis of luminescence decays with underlying distributions 1: Kohlrausch decay function (stretched exponential). Chem. Phys. 2005, 315, 171–182. [CrossRef]
- Gupta, P.K.; Moynihan, C.T. Prigogine-Defay ratio for systems with more than one order parameter. J. Chem. Phys. 1976, 65, 4136-4140. [CrossRef]
- Sukenaga, S.; Endo, T.; Nishi, T.; Yamada, H.; Ohara, K.; Wakihara, T.; Inoue, K.; Kawanishi, S.; Ohta, H.; Shibata, H. Thermal Conductivity of Sodium Silicate Glasses and Melts: Contribution of Diffusive and Propagative Vibration Modes. Front. Mater. 2021, 8, 753746. [CrossRef]
- Kim, Y.; Morita, K. Thermal Conductivity of Molten B2O3, B2O3–SiO2, Na2O–B2O3, and Na2O–SiO2 Systems. J. Am. Ceram. Soc. 2015, 98, 1588–1595. [CrossRef]
- Shimizu, M.; Sakakura, M.; Ohnishi, M.; Yamaji, M.; Shimotsuma, Y.; Hirao, K.; Miura, K. Three-dimensional temperature distribution and modification mechanism in glass during ultrafast laser irradiation at high repetition rates. Optics Express 2012, 20, 934-940. [CrossRef]
- Sakakura, M.; Terazima, M.; Shimotsuma, Y.; Miura, K.; Hirao, K. Heating and rapid cooling of bulk glass after photoexcitation by a focused femtosecond laser pulse. Opt. Express 2007, 15, 16800–16807. [CrossRef]
- Vladimirov, V.S. A Collection of Problems on the Equations of Mathematical Physics. Springer Berlin, Heidelberg, 1986. ISBN 978-3-662-05560-1; [CrossRef]
- Schawe, J.E.K.; Hess, K.U. The kinetics of the glass transition of silicate glass measured by fast scanning calorimetry. Thermochim. Acta 2019, 677, 85-90. [CrossRef]
- Li, Y.Z.; Zhao, L.Z.; Sun, Y.T.; Wen, P.; Bai, H.Y.; Wang, W.H. Effect of dynamical heterogeneity on heat capacity at glass transition in typical silicate glasses. J. Appl. Phys. 2015, 118, 244905. [CrossRef]
Table 1.
Thermal parameters of silicate glasses are used for model calculations.
| Substance | Density in solid state g/cm3 |
Specific heat capacity in solid state J/g·K |
Volumetric heat capacity in solid state J/m3K |
Volumetric heat capacity in liquid state J/m3K |
Dynamic heat capacity parameter |
Thermal conductivity W/mK |
| Sodium-lime-silicate glass | 2.8 | 1.14 | 3.2·106 | 4.4·106 | 0.273 | 1 |
| Boro-silicate glass | 2.23 | 1.1 | 2.45·106 | 3.8·106 | 0.355 | 1 |
Table 2.
Relaxation parameters of silicate glasses used for model calculations.
| Substance |
Hz |
K |
K |
| Boro-silicate glass | 5ꞏ1017 | 1.9⸱104 | 392 |
| Sodium-lime-magnesium-silicate glass | 1ꞏ1014 | 1.1⸱104 | 480 |
| Sodium-silicate glass | 1.24ꞏ1014 | 1.29⸱104 | 407 |
Disclaimer/Publisher’s Note: The statements, opinions and data contained in all publications are solely those of the individual author(s) and contributor(s) and not of MDPI and/or the editor(s). MDPI and/or the editor(s) disclaim responsibility for any injury to people or property resulting from any ideas, methods, instructions or products referred to in the content. |
© 2024 by the authors. Licensee MDPI, Basel, Switzerland. This article is an open access article distributed under the terms and conditions of the Creative Commons Attribution (CC BY) license (http://creativecommons.org/licenses/by/4.0/).
Copyright: This open access article is published under a Creative Commons CC BY 4.0 license, which permit the free download, distribution, and reuse, provided that the author and preprint are cited in any reuse.
Submitted:
10 January 2024
Posted:
11 January 2024
You are already at the latest version
Alerts
A peer-reviewed article of this preprint also exists.
This version is not peer-reviewed
Submitted:
10 January 2024
Posted:
11 January 2024
You are already at the latest version
Alerts
Abstract
The ability to control the temperature distribution T(t,r) and the rate of temperature change Rt,r inside glasses is important for their microstructuring. The lattice temperature is considered at time t, exceeding the electron-phonon thermalization time, and at a distance r from the center of the model spherical heating zone. In order to describe thermal excitations, the heat capacity of glasses must be considered as a function of time due to its long-term relaxation. A method for analytical calculation of T(t,r) and R(t,r) for glasses with dynamic heat capacity cdyn(t) is proposed. It is shown that during laser microstructuring the local cooling rate -R(t,r) significantly depends on the time dispersion of cdyn(t). It has been established that at the periphery of the model heating zone of the laser beam focus, the local cooling rate can reach more than 1011 K/s. Strong cooling rate gradients were found at the periphery of the heating zone, affecting the microstructure of the material. This effect is significantly enhanced by the time dispersion of cdyn(t). The effect associated with this time dispersion is significant even well above the glass transition temperature Tg, since even short relaxation times of the dynamic heat capacity cdyn(t) are significant.
Keywords:
Subject: Physical Sciences - Applied Physics
1. Introduction
Glass-forming materials are often used to create optical elements and components for optical integrated circuits. In the last two decades, the technology of femtosecond laser microfabrication of various optical structures inside glass-forming materials has been intensively developed. Due to the extremely high peak intensities at the focus of femtosecond laser pulses, nonlinear processes such as multiphoton absorption can lead to significant energy absorption even within transparent materials such as glass. Thus, femtosecond laser-induced microstructuring of glass-forming materials opens up wide possibilities for various applications. Laser radiation can cause irreversible local phenomena at the beam focus, such as phase transitions [1], the formation of bubbles or microfluidic channels [2,3,4,5], changes in chemical composition or refractive index [6,7], for example, diffusion and aggregation of silver ions [6] or photo-oxidation [7]. Spatially selective laser-induced crystallization or structure changes of glasses allows direct recording of channel waveguides [1,8,9,10,11,12,13,14]. In fact, laser-written waveguides (with improved mode structure of guided light) can be fabricated by local laser heating inside a glass matrix [8,9]. Thus, optical integrated circuits can be fabricated using a laser beam that induces local structural changes in a glass [15,16,17,18]. Photopolymerization and photodamage by highly focused laser pulses can be used in microchemistry and stereolithography [6,19]. Moreover, femtosecond laser structuring of glass-forming materials can be used for optical long-term storage of information [3,20,21,22,23,24,25,26,27,28,29,30], photonics [31], fabrication of phase gratings [32], nano-gratings [33], and quantum dots that can be used in various devices [34,35,36]. Notably, optical storage based on glass-forming materials has the potential to replace magnetic storage in the quest to provide high-speed, high-capacity, low-power, low-cost, highly secure, and long-term data storage [25,26,27,28,29,30]. However, for the development of these technologies, theoretical models of thermal processes occurring during spatially selective laser-induced structuring of glass-forming materials are required. For example, understanding the dynamics of the laser crystallization process of amorphous Ge films is important for transistor technology, photovoltaic devices, particle detectors, and photodetectors [37]. In fact, the laser crystallization method makes it possible to control the local temperature inside the material and avoid random nucleation [37]. The ability to form and control the dynamics of changes in the temperature distribution inside the material is very important for the opportunity to control the morphology of the laser-written structure inside the glass matrix [22,33,38]. Thus, a deep understanding of the thermal processes inside glass-forming materials under fast laser thermal perturbations is required. In this paper, we focus on local temperature changes, especially the local cooling rate in the focal region during laser-writing processes in a glass matrix (where is the rate of temperature change).
Femtosecond laser-induced microstructuring is a promising tool because the structures induced by femtosecond laser pulses can be even smaller than the optical diffraction limit of the beam focusing, since multiphoton absorption is most effective in the central part of the beam focus. Typically, in laser-induced microstructuring, the laser pulse duration is of the order of 100 fs and the radiation wavelength is about 1 μm. When a transparent material is irradiated with a powerful femtosecond laser pulse focused into a micro-sized focusing zone, multiphoton absorption of the laser radiation energy by electrons of the irradiated material occurs. The energy of the electrons in the laser focus increases sharply during due to electron-photon interaction. The electrons then transfer their energy to the lattice through electron-phonon interaction. The thermalization process takes approximately tens or hundreds of picoseconds [6,10,39,40]. Consequently, the duration of heating pulses that heat the material can be on the order of tens to hundreds of picoseconds. Thus, the material can be locally heated above the glass transition temperature and melting temperature . Heat then spreads through the material and the hot focal zone is rapidly cooled below .
In this article, we will consider laser pulses of moderate energy (in the range 10 – 100 nJ), sufficient to locally heat the material well above the glass transition temperature , but not sufficient to destroy the material with the formation of voids. Thus, the intensity of the laser pulses considered in this article is below the material damage threshold, which, for example, for silica glass is about 1016 W/cm2 [41]. We focus on micrometer-scale local thermal perturbations caused by laser pulses near or below the threshold ionization intensity of a material. The threshold ionization intensity of most transparent solids ranges from 1013 to 1014 W/cm2 for light with a wavelength of about 1 μm [42,43]. For example, the threshold intensity in silica glass and similar glass-forming materials is about 1013 W/cm2 for light pulses with a wavelength of about 1 μm and a duration of 100 fs [42].
Thus, we will consider thermal processes in dielectric glasses below the threshold intensity of ionization of the material and in the time interval after electron-phonon thermalization, when there is no electron-hole plasma. Thus, we are interested in changes in lattice temperature on a time scale outside the time interval when a multi-temperature model is usually considered [12,13,14]. In fact, we are interested in changes in lattice temperature that affect the structure of the material at moderate laser pulse energies and time exceeding the electron-phonon thermalization time.
The initial structure of glass-forming materials is not completely restored after the rapid heating-cooling cycle, which leads to a change in the local properties of the material in rapidly cooled areas. The local structure, specific volume, density, Rayleigh scattering loss and refractive index of glass-forming materials significantly depend on the local cooling rate [19,44,45], see Figure 1.
Figure 1.
Schematic diagram of the specific volume as a function of temperature for glass-forming materials at different cooling rates and . Liquid structures freeze to a glassy state with at .
Figure 1.
Schematic diagram of the specific volume as a function of temperature for glass-forming materials at different cooling rates and . Liquid structures freeze to a glassy state with at .
Thus, we focus on the dynamics of the temperature distribution and study the local cooling rate near the focal region during laser-induced microstructuring. Measurements of the temperature distribution at the focus of the laser beam can be carried out using micro-Raman spectroscopy [46,47,48]. However, the time resolution of Raman spectroscopy (with a measuring pulse duration of about 10 ns and a repetition rate of 1 kHz) is not sufficient to detect ultrafast changes in the local temperature . We found that the local cooling rate after the end of the heating pulse can reach more than 1011 K/s in a thin layer around the focus of the laser beam. In fact, to resolve such ultrafast temperature changes at the periphery of the hot focal zone requires a temporal and spatial resolution of at least about 0.1 ns and 10 nm, respectively, since the cooling rate reaches about 600 GK/s in a narrow layer around the hot zone at the laser focus (see below). Thus, the maximum change in the glass structure occurs at the periphery of the focal region (where the material undergoes ultrafast quenching). In fact, laser microstructuring of glasses makes it possible to form micron-sized domains that are close to spherical or ring-shaped, with a modified glass structure at the periphery of the domains [19,34,36,40,46,49,50,51,52,53]. For example, local modification of silver-doped phosphate glasses with the laser pulse energies in the range of 10 – 100 nJ led to the formation of micron-sized ring-shaped domains due to the aggregation of silver nanoclusters at the periphery of the domains [49]. Laser pulse energy and pulse repetition rate play an important role in the microstructuring of glass-forming materials. In fact, laser pulses with a sufficient repetition rate can provide cumulative heating near the focus of the laser beam. In this article we will focus on the effect of single laser pulses (the effect of repetition rate will be discussed in a separate article).
The temperature change associated with the heating pulse Is of the order of , where and are the heat capacity and volume of the heating zone; and are the density and specific heat capacity of the material. The thermal effect caused by elastic deformations is negligible compared to , at least at moderate , say in the range of 10 – 100 nJ for a focal region of about 1 μm radius. Indeed, the thermoelastic pressure in the hot zone is less than the maximum pressure response to the temperature change at constant volume, where and are the bulk modulus and the volumetric thermal expansion coefficient. However, the volume of the hot zone is not rigidly fixed by the material surrounding this zone. In fact, a pressure wave is created around the hot zone [54,55]. In this case, the thermoelastic pressure is even less than . Thus, the elastic energy associated with the thermoelastic pressure in the hot zone of volume is less than . Therefore, the relative effect associated with thermoelastic deformations does not exceed . For example, for sodium-lime-silicate glasses with the composition Na2Oꞏ2CaOꞏ3SiO2, is about 1% at 2000 K, 55 Gpa, 2.8 g/cm3, 1.14 J/gK, , and linear thermal expansion 7.7ꞏ10-6 1/K [56,57,58,59,60]. This ratio is even lower for borosilicate glasses with a low coefficient of thermal expansion [61]. For example, for borosilicate glasses such as Pyrex, the ratio is about 0.1% at 2000 K, 33 Gpa, 2.23 g/cm3, 1.1 J/gK, and 3.3ꞏ10-6 1/K [61,62,63,64]. However, becomes comparable with at laser pulse energies approximately 2 orders of magnitude higher than those considered in this work. We are interested in local temperature changes in a micron-sized hot zone at , when the pressure waves created around the hot zone are already at a distance of more than 1 – 2 μm from the hot zone. However, at the same time, the front of the temperature change extends only about ten nanometers from the periphery of the hot zone. Thus, we consider the change in local temperature after the local pressure in the hot zone has almost stabilized. For example, in silicate glasses at 0.5 ns, the distance is about 3 µm at the longitudinal speed of sound 6ꞏ103 m/s [59], and 10 nm at the thermal diffusion coefficient of about 3ꞏ10-7 m2/s [57,63,65].
It Is noteworthy that an Important property of glass-forming materials is the long-term relaxation of the specific heat capacity with rapid changes in temperature. Thus, the heat capacity of glass-forming materials must be considered as a function of time [66,67,68]. In fact, if a glass-forming material is heated to a liquid state with heat capacity from a solid glassy state with heat capacity , then the heat capacity of the material does not change immediately with the change in temperature, but slowly relaxes from to , see below. Long-term relaxation of the dynamic heat capacity of glasses is due to the slow exchange of energy between different degrees of freedom in glasses. Thus, the thermal response of glass-forming materials to a thermal perturbation at time depends on the temperature at earlier times. The effect of long-term relaxation of dynamic heat capacity significantly affects the dynamics of local temperature changes [69,70]. In turn, the rate of change in local temperature can significantly affect the micro-structuring of glass-forming materials [19,38,44,45,71]. An experimental study of the dynamics of the temperature distribution inside a glass matrix under the action of fast laser thermal perturbations is very difficult. Therefore, it is necessary to develop theoretical models of thermal processes occurring during laser-induced structuring of glasses. In this paper, we will focus on modeling such thermal processes, taking into account the relaxation effect of the dynamic heat capacity . The dynamic behavior of glass-forming materials under fast local thermal perturbations can be described using the integro-differential heat equation with “memory” [69,70]. This equation has an analytical solution, at least in spherical, cylindrical and planar geometries [69,70,72]. This work aims to determine the dynamics of local temperature changes, especially the local rate of the temperature change , associated with laser-induced thermal excitations during laser processing of glasses. An analytical method for determining and has been developed. The knowledge obtained can be useful for various technologies related to laser-induced microstructuring.
In the first part of the article, the heat equation with dynamic heat capacity is considered. An analysis of the dynamic heat capacity of glass-forming materials has been conducted and an analytical solution of the heat equation with dynamic heat capacity for a spherically symmetric problem has been constructed. Then, the temperature distribution is calculated for glasses with dynamic heat capacity under local fast laser excitations. Examples with borosilicate and sodium-lime-silicate glasses are considered at different heating pulses and dynamic heat capacity parameters. Finally, the local distribution of the cooling rate and its influence on the microstructuring processes of glasses is discussed.
2. Heat equation with dynamic heat capacity
Since the pioneering work of Birge and Nagel [66], the dynamic heat capacity of glass-forming materials as a function of frequency (or time ) has been intensively studied. For such studies, heat capacity spectroscopy can be used [67,68]. The time dispersion of the dynamic heat capacity can be described within the framework of linear response theory [73], similar to the time dispersion of the dielectric constant [74]. Then, heat transfer in the glass-forming material can be described by an integro-differential heat equation [69,70]. In the case of spherical geometry and zero initial conditions, this heat equation can be represented in the following form [69,70]:
where is the volumetric heat flux density, , – Laplacian, and are the thermal conductivity and density of the material. Eq.(1) has an analytical solution for homogeneous boundary conditions, see below.
2.1. Dynamic heat capacity of glass-forming materials
The dynamic heat capacity as a function of time can be represented as a continuous sum of exponential decays, since is a monotonically relaxing function of time [69,70,75]:
where and are the initial and final (equilibrium) heat capacities: as and as . In fact, and if the material is heated from a solid glassy state to a liquid one. The distribution function of relaxation times can be found using broadband heat capacity spectroscopy [68], for details see [69,70,72]. The dynamic heat capacity is usually described by the Kohlrausch–Williams–Watts stretched exponent for , where the Kohlrausch relaxation time and constant characterize the relaxation time spectrum of the material [45,76,77]. In this case,
where . Usually, is about 0.3 – 0.5 [68,78]. For example, if 0.5, then [76,77]. Thus, can be approximately represented by Eq.(4) for a sufficiently large finite interval :
where is a function of temperature. The function can be obtained from the Vogel–Fulcher–Tammann–Hesse (VFTH) relation measured by broadband heat capacity spectroscopy [68]:
where is the frequency corresponding to the maximum value of the temperature dependence of the imaginary part of the dynamic heat capacity and is the temperature modulation frequence; , and are the VFTH parameters. In fact, is about 1. More precisely, for different can be obtained from the relation [69]. However, the shape of the distribution function has insignificant effect on , since the effect due to the time dispersion of the dynamic heat capacity reaches saturation with increasing , see below. Thus, it is sufficient to consider the dynamic heat capacity with the Debye relaxation law (see Eq.(6)) for sufficiently large . Below we will show that this result practically coincides with the result obtained after averaging over the distribution function . In the case of the Debye relaxation law, is equal to
In this case, the integro-differential heat equation Eq.(1) is transformed into Eq.(7), which can be solved analytically. After this, solutions for different can be averaged using the distribution function .
2.2. Analytical solution of the heat equation with dynamic heat capacity
Let us consider the temperature distribution after a single laser pulse in a micron-sized focal zone. A relatively small change in the thermal conductivity of the glass matrix around the hot focal zone does not affect the dynamics of the temperature distribution in the hot focal zone. In fact, for the glass-forming materials under consideration, varies insignificantly with temperature and is about 1 W/m2K over a wide temperature range [65,79,80]. Thus, it is assumed that the thermal conductivity of the glass matrix does not depend on temperature. However, the change in dynamic heat capacity from to during heating is significant.
As a first step we consider the Debye relaxation law, see Eq.(6). Thus, for spherical geometry, from Eq.(1) we obtain Eq.(7):
where , and the spherically symmetric heat source is distributed in a spherical volume of radius . The decomposition of into the product is common for laser heating. Furthermore, after the end of the heating pulse, the temperature distribution does not depend on the shape of , see below. In this article we are interested in the dynamics of the temperature distribution after the heating pulse, when the shape of the heating pulse does not matter.
Consider Eq.(7) under the following initial conditions: and for , where is the initial temperature in the glass matrix. Let be a bounded function and for . Since we are considering a single heating pulse, it does not matter how large the parameter is, as long as . Indeed, the temperature change is localized in a hot zone about a few micrometers in size, see below. The solution to this boundary value problem can be represented in the form of the following series (for details, see Appendix A):
where the functions are determined by Eq.(9).
where and . Functions satisfying Eq.(9) are presented in Appendix A. The spatial distribution of the heating power can be arbitrary. For example, we consider a heat source uniformly distributed in a volume of radius with volumetric density (in W/m3), then
In fact, the distribution of the intensity of light radiation in the spot of a focused laser beam, depending on the distance from the center of the spot, can have a Gaussian bell-shaped character, see Figure2. However, the intensity sufficient to induce nonlinear processes such as multiphoton absorption is located close to the center of the laser beam spot [5]. Thus, the model of a heat source uniformly distributed in a volume of radius with a sharp drop at the periphery is more realistic than the bell-shaped Gaussian distribution.
Figure 2.
Schematic diagram of the distribution of the intensity of light radiation in a spot of a focused laser beam depending on the distance from the center of the spot (dashed line) and the intensity distribution sufficient to induce nonlinear processes such as multiphoton absorption in a spot of radius (solid line).
Figure 2.
Schematic diagram of the distribution of the intensity of light radiation in a spot of a focused laser beam depending on the distance from the center of the spot (dashed line) and the intensity distribution sufficient to induce nonlinear processes such as multiphoton absorption in a spot of radius (solid line).
The shape of the change in heating power over time can be bell-shaped or more complex. However, this shape is not significant for the temperature distribution at , see Figures3 – 4. For model calculations, we will use a heating pulse of a half-sinusoidal shape, slightly different from the bell-shaped one. Thus, for and for .
3. Temperature distribution in glasses under local thermal perturbations
For example, let us consider the two most common types of silicate glasses: sodium-lime-silicate glasses (Na2O-CaO-SiO2), as the most widely used of all industrial glasses, known for their low cost and availability, and borosilicate glasses (B2O3-SiO2), which are widely used due to their low coefficient of thermal expansion and high resistance to chemical attack. Sodium-lime-silicate glass with the composition Na2Oꞏ2CaOꞏ3SiO2 and borosilicate glass of the Pyrex type were chosen as model systems due to the availability of the necessary parameters [57,58,61,62,63,64,65]. The thermal parameters of these glasses are collected in Table 1.
3.1. Influence on of the shape and duration of heating pulses
Thus, for model calculations, we use a heating pulse with a power density , acting during the time interval in a spherical region with a radius 1 μm. Let us compare the results for heating pulses with , having half-sinusoidal and rectangular shapes, see Figures3 and 4. Let the initial temperature 300 K, 300 ps, 15 nJ, and the volume of the spherical heating zone . Thus, is equal to and for half-sinusoidal and rectangular heating pulses, respectively. In this case, the energy of these pulses is the same and equal to . The temperature distribution can be calculated according to Eqs.(8) – (9) at various .
For example, for sodium-lime-silicate glass (see Table 1), at 0, 0.1 μs, and 10 μs is represented in Figures3 and 4. The temperature distribution is calculated at (for example, at 30 μm). As follows from direct calculations, the result does not depend on , at least on the time scale , where for the glasses under consideration is about 3 – 4 ms. Whereas we are interested in changes in the temperature distribution on a time scale of microseconds and less, when the temperature changes are localized within a few micrometers, see Figure3.
The influence of the time dispersion of the dynamic heat capacity is significant, see Figures3 and 4. The difference between equilibrium ( 0) and non-equilibrium ( 0) solutions increases with the growth of . The shape of the change in heating power over time is significant only during the time interval , see Figure4(a). However, this shape is not significant at , see Figures3 and 4(b).
Figure 3.
Temperature distribution in the hot zone depending on the distance at 10 ns (a) and 100 ns (b) for heating pulses of half-sinusoidal shape (filled symbols) and rectangular shape (open symbols) in sodium-lime-silicate glass at 1 μm, 300 ps, 15 nJ, and 300 K ( 0, 0.1 μs, and 10 μs – squares, circles, and triangles, respectively).
Figure 3.
Temperature distribution in the hot zone depending on the distance at 10 ns (a) and 100 ns (b) for heating pulses of half-sinusoidal shape (filled symbols) and rectangular shape (open symbols) in sodium-lime-silicate glass at 1 μm, 300 ps, 15 nJ, and 300 K ( 0, 0.1 μs, and 10 μs – squares, circles, and triangles, respectively).
Figure 4.
Time dependence of in the center of the hot zone during (a) and after (b) the heating pulses of half-sinusoidal shape (filled symbols) and rectangular shape (open symbols) at the same parameters as in Figure3 ( 0, 0.1 μs, and 10 μs – squares, circles, and triangles, respectively). Inset (a) shows pulse power as a function of time.
The duration of the heating pulses is also not significant for the temperature distribution at , see Figure5. For example, compare for pulses with 10 ps and 300 ps and the same parameters as in Figure3. The duration of heating pulses is significant only during the time interval , see Figure5(a). However, this duration is not significant at , see Figure5(b).
Figure 5.
Time dependence of in the center of the hot zone during (a) and after (b) the heating pulse of half-sinusoidal shape at 10 ps and 300 ps – filled and open symbols, respectively, at the same parameters as in Figure3 ( 0, 0.1 μs, 1 μs, and 10 μs – squares, circles, triangles up, and triangles down, respectively). Inset (b) shows pulse power as a function of time for short and long pulses – dotted and solid lines, respectively.
Figure 5.
Time dependence of in the center of the hot zone during (a) and after (b) the heating pulse of half-sinusoidal shape at 10 ps and 300 ps – filled and open symbols, respectively, at the same parameters as in Figure3 ( 0, 0.1 μs, 1 μs, and 10 μs – squares, circles, triangles up, and triangles down, respectively). Inset (b) shows pulse power as a function of time for short and long pulses – dotted and solid lines, respectively.
Thus, the temperature at the center of the hot zone increases very fast over the time interval from to the maximum value and then relaxes relatively slowly on a microsecond time scale, see Figures4 and 5. The influence of time dispersion of dynamic heat capacity is significant on time scales of several hundred nanoseconds or less. The solution associated with the dynamic heat capacity (at 0) tends to the classical solution (corresponding to 0) when reaches approximately 1 μs, see Figures4(b) – 5(b).
3.2. Comparison with the fundamental solution of the classical problem
It is often believed that the hot focal spot should spread and cool down according to the law and , respectively [19,47,81,82]. This assumption is based on the fundamental solution of the Fourier heat equation, which can be represented by the following function [83]:
where is the Heaviside unit step function and is the distance from the instantaneous point heat source. However, for a non-point heat source, the approximation of by this function is not satisfactory. The real dependence differs significantly from Eq.(11) [46]. As expected, the temperature perturbation in the center of the heating zone relaxes in a time of the order of . However, remains near the maximum value at 0.1 μs (see Figure6), and only then relaxes over a time of the order of . In contrast to the estimate based on the fundamental solution of the Fourier heat equation, the temperature perturbation relaxes approximately as , and not as , see Figure6. In fact, to obtain the correct temperature distribution using the fundamental solution, it is necessary to integrate the thermal response over the time interval and the volume of the heating zone. Thus, for the heat source considered above, distributed in a volume with radius and acting on the time interval , we obtain the temperature distribution :
where ). As expected, the solution completely coincides with the temperature distribution , calculated using Eqs.(8) – (9) at 0, see Figure6. In contrast, the simplified estimate is far from the correct even for any correction factor , see Figure6.
Figure 6.
depending on the distance at 100 ns (a) and time dependence of in the center of the hot zone (b) at the same parameters as in Figure3 ( 0, 0.1 μs, 1 μs, 10 μs, and 100 μs – squares, circles, triangles up, triangles down, and crosses, respectively, as well as for 0 – diamonds). Dotted lines show at = 1 and 100 (a), as well as at = 1/150 and 1/200 (b). Inset (b) shows the initial fragments of and at 0.
Figure 6.
depending on the distance at 100 ns (a) and time dependence of in the center of the hot zone (b) at the same parameters as in Figure3 ( 0, 0.1 μs, 1 μs, 10 μs, and 100 μs – squares, circles, triangles up, triangles down, and crosses, respectively, as well as for 0 – diamonds). Dotted lines show at = 1 and 100 (a), as well as at = 1/150 and 1/200 (b). Inset (b) shows the initial fragments of and at 0.
Thus, the correct calculation of the temperature distribution using the fundamental solution of the classical heat equation (without time dispersion) gives the same result as the calculation using Eqs.(8) – (9) at 0. However, using Eqs.(8) – (9) it is possible to calculate the temperature distribution for materials with dynamic heat capacity (at 0). It turns out that obtained at 0 increases with and tends to saturation at about 10 μs, see Figure6. For this reason, the shape of the distribution function has insignificant effect on . Next, we consider the influence of this distribution on , see Figures7 – 8.
3.3. Dependence of on the distribution of relaxation times
The influence of the time dispersion of the dynamic heat capacity is most pronounced at the beginning of the heating process on a nanosecond time scale, see Figure6(b). This effect is significant already at about 0.1 μs, increases with increasing and reaches saturation at above , where is about 4 μs at 1 μm and 2.6⸱10-7 m2/s for borosilicate glass. In fact, in glasses the relaxation times are distributed over a wide range. The parameters of the VFTH relationship (see Eq.(5)) can be obtained from measurements of glass transition processes depending on the cooling rate. For example, we use these parameters for borosilicate glass [64], sodium-lime-magnesium-silicate glass [84], and sodium-silicate glass [85]. The relaxation parameters of these silicate glasses used for model calculations are collected in Table 2.
The dynamic heat capacity can be modeled using Eq.(4), where can be obtained from (see Eq.(5)) using the relaxation parameters, see Table 2. Thus, we obtain the temperature distribution averaged using the distribution function , where is obtained at several intermediate temperatures between and ( is the maximum value of the temperature at the center of the hot zone). For example, set 700 K and 1000 K and consider the relaxation parameters for borosilicate glass [64], sodium-lime-magnesium-silicate glass [84], and sodium-silicate glass [85], see Table 2. The results are presented in Figures7 – 8. The difference between , obtained for sufficiently large 10 μs, and , obtained for and , is insignificant, see Figures 7 – 8. Since the influence of the time dispersion of the dynamic heat capacity reaches saturation at about 10 μs, the shape of the distribution function has little effect on the temperature distribution. Thus, the influence of the time dispersion of the dynamic heat capacity on the temperature distribution can be calculated for a fixed, sufficiently large .
Figure 7.
depending on the distance at 100 ns (a) and time dependence in the center of the hot zone (b) at the same parameters as in Figure3 ( 0 and 10 μs – squares and circles). The temperature distribution averaged using the distribution function obtained from [85] at 700 K and 1000 K – diamonds and stars, as well as from [84] at 700 K and 1000 K – triangles up and triangles down, respectively.
Figure 7.
depending on the distance at 100 ns (a) and time dependence in the center of the hot zone (b) at the same parameters as in Figure3 ( 0 and 10 μs – squares and circles). The temperature distribution averaged using the distribution function obtained from [85] at 700 K and 1000 K – diamonds and stars, as well as from [84] at 700 K and 1000 K – triangles up and triangles down, respectively.
Figure 8.
depending on the distance at 100 ns (a) and time dependence in the center of the hot zone (b) for borosilicate glass at 1 μm, 10 ps, and 15 nJ 300 K ( 0, 0.1 μs, 1 μs, 10 μs, and 100 μs – squares, circles, triangles up, triangles down, and crosses). The solution averaged using the distribution function obtained from [64] at 700 K and 1000 K – diamonds and stars.
The influence of time dispersion of dynamic heat capacity is significant in both borosilicate and sodium-silicate glasses. Now let us consider the influence of the size of the heating zone on the temperature distribution .
3.4. Dependence of on the size of the heating zone
For example, let us compare the temperature distributions at 1 and 2 μm for borosilicate glass, see Table 1. To obtain the same thermal response value, let us set 120 nJ at 2 μm, increasing the energy in proportion to the volume of the heating zone. Thus, in both cases we obtain the same amplitudes of the temperature response to heating pulses, see Figures8 – 9. As expected, the temperature in the center of the heating zone relaxes in a time of the order of , which for borosilicate glass is about 15 μs at 2 μm and 2.6⸱10-7 m2/s. For comparison, relaxes four times faster at 1 μm than at 2 μm, see Figures8(b) – 9(b). As the size of the heating zone increases, the saturation of the influence of the time dispersion of the dynamic heat capacity on shifts towards larger values of . For example, compare at 1 μs for 1 and 2 μm, see Figures8 – 9.
Figure 9.
depending on the distance at 300 ns (a) and time dependence of in the center of the hot zone (b) for borosilicate glass at 2 μm, 300 ps, 120 nJ, 300 K ( 0, 0.3 μs, 1 μs, 10 μs, and 100 μs – squares, circles, triangles up, triangles down, and diamonds).
Figure 9.
depending on the distance at 300 ns (a) and time dependence of in the center of the hot zone (b) for borosilicate glass at 2 μm, 300 ps, 120 nJ, 300 K ( 0, 0.3 μs, 1 μs, 10 μs, and 100 μs – squares, circles, triangles up, triangles down, and diamonds).
4. Cooling rate distribution and its influence on microstructuring processes of glasses
Now consider the spatial distribution of the rate of temperature change . Due to thermal expansion, the size of the heating zone changes with temperature by about 10 nm or less. We neglect these changes with respect to . Let us consider the rate of temperature change due to thermal diffusion. This temperature change affects the physical properties of the material. We will focus on very fast (about 109 K/s or more) local temperature changes that have the greatest impact on the microstructuring process, and will study the effect associated with the time dispersion of the dynamic heat capacity. It is worth noting that this effect is significant even well above the glass transition temperature .
For example, the rate of temperature change for borosilicate glass at 2 μm, 300 ps, 120 nJ and various is presented in Figures10 – 11. Note that the rate of temperature change is greatest near the periphery of the hot zone, see Figure10(a). The cooling rate is about 600 GK/s at 1.98 μm and 0.36 ns, see Figure11(a). However, in the center of the heating zone, the cooling rate does not exceed 0.6 GK/s, i.e. is three orders of magnitude less than the cooling rate at the periphery, see Figure11. Therefore, the local structure of glass in the center of the hot zone should differ significantly from the structure at the periphery of the heating zone after laser modification. This conclusion is consistent with experiments [19,34,36,40,46,49,50,51,52,53]. However, the effect associated with dynamic heat capacity (at 0) is significant both in the center and at the periphery of the heating zone. Indeed, the maximum cooling rate is approximately 2.5 times greater at 0 than at 0 both at the periphery and in the center of the heating zone, see Figure11.
Let us consider the cooling rate in a thin shell in the region from 0.95 to 0.99. As we have established for borosilicate and sodium-lime-silicate glasses, ultra-fast cooling of the material occurs in this region at a rate of more than 1011 K/s, see Figures10 – 13. It is noteworthy that at the beginning of the cooling process (during the first few nanoseconds), the rate of temperature change is the same for small and large relaxation times , see Figures10(a) and 12(a). This means that at the beginning of the cooling process at the periphery of the hot zone, the shape of the distribution function does not affect the cooling rate . Therefore, in this case, even at very small relaxation times , the influence of the time dispersion of the dynamic heat capacity is significant.
Figure 10.
Rate of temperature change depending on the distance at the periphery of the hot zone at 0.5 ns (a) and time dependence of at 1.98 μm (b) at the same parameters as in Figure9 ( 0, 0.3 μs, 1 μs, 10 μs, and 100 μs – squares, circles, triangles up, triangles down, and diamonds). Inset (a) shows as a function of distance at 100 ns for different .
Figure 10.
Rate of temperature change depending on the distance at the periphery of the hot zone at 0.5 ns (a) and time dependence of at 1.98 μm (b) at the same parameters as in Figure9 ( 0, 0.3 μs, 1 μs, 10 μs, and 100 μs – squares, circles, triangles up, triangles down, and diamonds). Inset (a) shows as a function of distance at 100 ns for different .
Figure 11.
Time dependence of cooling rate – at 1.98 μm (a) and 0 (b) at the same parameters as in Figures9 and 10 ( 0, 10 μs, and 100 μs – squares, circles, and triangles).
Figure 11.
Time dependence of cooling rate – at 1.98 μm (a) and 0 (b) at the same parameters as in Figures9 and 10 ( 0, 10 μs, and 100 μs – squares, circles, and triangles).
Figure 12.
depending on the distance at the periphery of the hot zone at 0.5 ns (a) and 100 ns (b) for sodium-lime-silicate glass at the same parameters as in Figure3 ( 0, 0.1 μs, 1 μs, and 10 μs – squares, circles, triangles up, and triangles down).
Figure 12.
depending on the distance at the periphery of the hot zone at 0.5 ns (a) and 100 ns (b) for sodium-lime-silicate glass at the same parameters as in Figure3 ( 0, 0.1 μs, 1 μs, and 10 μs – squares, circles, triangles up, and triangles down).
The cooling rate reaches a maximum at for a given , see Figures10 and 12. The rate decreases over time, and the distance , at which the rate is maximum, shifts slightly towards the center of the heating zone. However, still exceeds 2 – 3 GK/s at 100 ns, see Figures10(a) and 12(b). The change in cooling rate over time for sodium-lime-silicate glass at 1 μm, 10 μs and the same conditions as in Figure3 is presented in Table 3. The rate depending on the distance at the periphery of the hot zone for different is shown in Figure13.
Table 3.
Cooling rate for sodium-lime-silicate glass at 1 μm.
| Time ns |
Distance μm |
Cooling rate GK/s |
| 0.5 | 0.985 | 410 |
| 1 | 0.98 | 170 |
| 5 | 0.94 | 31 |
| 10 | 0.92 | 16 |
| 50 | 0.80 | 4 |
| 100 | 0.70 | 2.3 |
Figure 13.
depending on the distance at the periphery of the hot zone at 0.1 μs (a) and 10 μs (b) at the same parameters as in Figure3 ( 0.5 ns, 1 ns, 5 ns, and 10 ns – squares, circles, triangles up, and triangles down).
Figure 13.
depending on the distance at the periphery of the hot zone at 0.1 μs (a) and 10 μs (b) at the same parameters as in Figure3 ( 0.5 ns, 1 ns, 5 ns, and 10 ns – squares, circles, triangles up, and triangles down).
Thus, since the local structure of the material strongly depends on the local cooling rate , the local structure of the material at the periphery of the hot zone changes significantly relative to the original glass matrix. This modification of glass practically stops as soon as the local region is cooled below the glass transition temperature . Thus, the modification process occurs until the temperature in the local region at drops below . For example, consider the cooling curves calculated at the periphery of the hot zone for borosilicate (= 900 K [63]) and sodium-lime-silicate glasses (= 840 K [57]), see Figure10(b) and Figure14, respectively. It should be noted that the effect associated with the time dispersion of the dynamic heat capacity is significant well above the glass transition temperature . Indeed, in the case of 1 μm, the modification process occurs within approximately 80 ns at 0.95 μm and 1 μs, see Figure14(a). However, without taking into account the time dispersion of the dynamic heat capacity (at 0), this process occurs in less than 20 ns, see Figure14(a). In the case of 2 μm, the modification process occurs during a longer period of about 300 ns at 1.98 μm and 1 μs, see Figure10(b). However, without taking into account the time dispersion of the dynamic heat capacity (at 0), this process occurs in less than 50 ns, see Figure10(b).
Figure 14.
Time dependence of at the periphery of the hot zone at 0.95 μm (a) and 0.98 μm (b) at the same parameters as in Figure3 ( 0, 0.1 μs, 1 μs, 10 μs, and 100 μs – squares, circles, triangles up, triangles down, and diamonds). Inset (a) shows time dependence of in the center of heating zone (at 10 μs).
Figure 14.
Time dependence of at the periphery of the hot zone at 0.95 μm (a) and 0.98 μm (b) at the same parameters as in Figure3 ( 0, 0.1 μs, 1 μs, 10 μs, and 100 μs – squares, circles, triangles up, triangles down, and diamonds). Inset (a) shows time dependence of in the center of heating zone (at 10 μs).
To summarize, we can conclude that the maximum cooling rate exists in the outer regions of the heating zone, in the shell of about . The cooling rate reaches several hundred GK/s in the first nanosecond after the laser pulse. Then the cooling rate decreases. However, even 100 ns after the laser pulse, in the outer shell of the hot zone still exceeds 1 GK/s. It is noteworthy that in the center of the heating zone the cooling rate is three orders of magnitude less than at the periphery. Since regions quenched at different cooling rates have different physical properties, strong gradients of physical properties should exist in the material predominantly at a distance of about from the center of the heating zone. This effect is significantly enhanced by the time dispersion of the dynamic heat capacity.
In conclusion, let us briefly discuss laser micro-processing in the cumulative heating mode. Typically, cumulative heating is achieved at a laser pulse repetition rate more than hundreds of kHz. Usually, this mode operates at frequencies from 200 kHz to 10 MHz [3]. Indeed, the temperature in the center of the hot zone relaxes in a time of the order of , which for the glasses under consideration is about 4 μs at 1 μm, see inset in Figure14(a). Thus, in this case, the cumulative effect can be achieved at a frequency of about 250 kHz or more. Note that the cumulative effect leads to stable average heating of the material in the heating zone. Thus, the effect of laser pulse repetition can be approximately simulated by shifting upward the local temperature distribution by a certain temperature difference , which increases with increasing pulse repetition frequency. It is clear that with increasing the modification process will occur over a longer time interval, see Figure14, where should be shifted upward by the amount . Then in the local region at will fall below at a cooling rate lower than at zero repetition frequency (at 0). Consequently, local gradients in the physical properties of locally modified glass will be smoothed out due to cumulative heating. The effect of the repetition rate will be discussed in more detail in a separate article.
5. Discussion
The local temperature distribution and the local cooling rate determine the local structure of the glass matrix during laser-induced microstructuring. Thus, knowledge of the dynamics of the local temperature distribution is very important for applications associated with local laser heating, for example, for femtosecond laser microstructuring of glasses. However, as shown in this article, the dynamics of the local temperature distribution significantly depends on the time dispersion of the dynamic heat capacity of the glass matrix. This work proposes a method for analytical calculation of and for glass-forming materials under local fast laser excitations. It is shown that the dynamics of the local temperature distribution caused by a laser pulse can be described by the heat equation with dynamic heat capacity . This equation has an analytical solution to a spherically symmetric boundary value problem. Using this analytical solution, we obtained the temperature distribution and local cooling rate for the thermal parameters of borosilicate and sodium-lime-silicate glasses. In fact, this analytical solution depends on the following relaxation parameters of the dynamic heat capacity of the material: relaxation time and the distribution function , which can be obtained from broadband heat capacity spectroscopy. However, as shown in this article, the shape of the distribution function has little effect on and , since with increasing the influence of the time dispersion of the dynamic heat capacity reaches saturation. It should be noted that the influence of the time dispersion of the dynamic heat capacity is most pronounced at the beginning of the process, when changes on a nanosecond time scale. We found that this effect is significant already at about 0.1 μs, increases with increasing and reaches saturation at above . Thus, the influence of the time dispersion of dynamic heat capacity on the temperature distribution can be calculated for a fixed, sufficiently large (in fact, for of the order of ten or several tens of microseconds, depending on the radius of the heating zone ). As expected, the results obtained are very similar for different . However, as the size of the heating zone increases, the laser pulse energy must increase in proportion to the volume of the heating zone in order to obtain the same amplitude of the local thermal response.
It has been established that the temperature distribution and local cooling rate are not affected by the heating pulse duration and the shape of the heating pulse. It should be noted that the temperature perturbation in the center of the heating zone relaxes not as , in contrast to the often-used estimate based on the fundamental solution of the Fourier heat equation. In fact, the heating pulse cannot be considered as an instantaneous point source of heat. Thus, it is necessary to integrate the thermal response over the time interval and the volume of the heating zone, then the resulting correct solution completely coincides with the temperature distribution found in this article for 0. In addition, the solution found in this article can be used for materials with dynamic heat capacity at 0.
We found that the rate of temperature change is greatest near the periphery of the hot zone. The cooling rate reaches a maximum when is slightly less than . It turns out that ultra-fast cooling of the material occurs at a rate of more than 1011 K/s in a thin shell in the region from 0.95 to 0.99. However, in the center of the heating zone, the cooling rate is three orders of magnitude lower than at the periphery. Thus, the local structure of glass after laser modification in the center of the hot zone should differ significantly from the structure at the periphery, which is consistent with experiments [19,34,36,40,46,49,50,51,52,53]. It is noteworthy that the effect associated with the time dispersion of the dynamic heat capacity is very significant both in the center and at the periphery of the heating zone. In fact, the maximum cooling rate is approximately 2.5 times greater at 0 than at 0 both at the periphery and in the center of the heating zone, see Figure11.
It is worth noting that at the beginning of the cooling process at the periphery of the hot zone, the shape of the distribution function does not affect the cooling rate . In fact, even at a very short relaxation time , the influence of the time dispersion of the dynamic heat capacity is very significant at the beginning of the cooling process. The cooling rate decreases over time , however, in the outer regions of the heating zone, the cooling rate still exceeds 2 – 3 GK/s at about 100 ns. Regions quenched at different cooling rates have different physical properties. Thus, strong gradients of physical properties should exist in the material, mainly at a distance of about from the center of the heating zone. It is worth noting that the time dispersion of the dynamic heat capacity significantly enhances this effect. In addition, the effect associated with the time dispersion of the dynamic heat capacity is significant even well above the glass transition temperature . It turns out that the duration of the modification process strongly depends on the relaxation time of the dynamic heat capacity . Thus, the rate of local cooling and gradients of physical properties of locally modified glass strongly depend on the relaxation time of the dynamic heat capacity . Finally, it is worth noting that the gradients of physical properties in areas quenched at different cooling rates are smoothed out by cumulative heating when processed in the cumulative heating mode.
In this article, we solved a problem for spherical geometry, which is closely related to data storage technologies. There are a number of future directions that are worth developing. A future research direction could be the problem with cylindrical geometry, closely related to laser waveguide technologies. The cumulative heating mode at different laser pulse repetition rates and laser beam scanning speeds also deserves to be studied.
6. Conclusions
To summarize, it can be emphasized that during laser microstructuring of glass-forming materials, the local temperature distribution and the local cooling rate significantly depend on the time dispersion of the dynamic heat capacity of the glass matrix. The rate of temperature change is maximum near the periphery of the heating zone. However, the effect associated with the time dispersion of the dynamic heat capacity is very significant both in the center and at the periphery of the heating zone. The effect associated with the time dispersion of the dynamic heat capacity is significant even well above the glass transition temperature . It turns out that in the thin shell of the heating zone, ultra-fast cooling of the material occurs at a rate of more than 1011 K/s, and strong gradients of physical properties must exist in the material, mainly in a thin shell around the heating zone. The time dispersion of the dynamic heat capacity significantly enhances this effect. However, these gradients in physical properties should be smoothed out when processed in the cumulative heating mode. Further directions of research may be related to the consideration of the cumulative heating regime for various geometries. The results of this work can be useful for a better understanding and optimization of technologies associated with laser-induced microstructuring of glasses.
Author Contributions
Conceptualization, A.M.; formal analysis, A.M.; methodology, A.M.; supervision, C.S.; visualization, A.M.; writing—original draft, A.M.; writing—review and editing, C.S. All authors have read and agreed to the published version of the manuscript.
Funding
This research received no external funding.
Institutional Review Board Statement
Not applicable.
Informed Consent Statement
Not applicable.
Data Availability Statement
The datasets generated during and/or analyzed during the current study are available from the corresponding author on reasonable request.
Acknowledgments
A.M. acknowledges the administrative and technical support of the Prokhorov General Physics Institute of the Russian Academy of Sciences.
Conflicts of Interest
The authors declare no conflicts of interest.
| Nomenclature | |
| Latin Symbols | |
| and | Parameters of the VFTH equation (K) |
| Heat capacity of the solid material (J·kg−1·K−1) | |
| Heat capacity of the liquid material (J·kg−1·K−1) | |
| , | Initial and equilibrium heat capacities (J·kg−1·K−1) |
| Dynamic heat capacity (J·kg−1·K−1) | |
| Thermal diffusivity (m2·s−1) | |
| Energy of laser pulse (nJ) | |
| Parameter of the VFTH equation (Hz) | |
| Time dependence of the pulse power (dimensionless) | |
| Fundamental solution of the Fourier heat equation (m-3) | |
| Distribution function (s−1) | |
| Bulk modulus (GPa) | |
| Rate of temperature change (K·s−1) | |
| - | Cooling rate (K·s−1) |
| Parameter of the boundary value problem (μm) | |
| Heating zone radius (μm) | |
| Distance from the center of the hot zone (μm) | |
| Time (s) | |
| Temperature distribution obtained from fundamental solution (K) | |
| Local temperature distribution (K) | |
| Temperature distribution averaged using (K) | |
| Glass transition temperature (K) | |
| Initial temperature (K) | |
| Intermediate temperature (K) | |
| Maximum value of (K) | |
| Heating zone volume (m3) | |
| Specific volume (m3·kg−1) | |
| Longitudinal speed of sound (m·s−1) | |
| Greek Symbols | |
| Linear thermal expansion (K-1) | |
| Volumetric thermal expansion coefficient (K-1) | |
| Parameter of the Kohlrausch relaxation law (dimensionless) | |
| Relaxation parameter (dimensionless) | |
| Coefficient (dimensionless) | |
| Thermal conductivity (W·m-1·K-1) | |
| Relaxation parameter (dimensionless) | |
| Density (kg·m-3) | |
| Debye relaxation time (μs) | |
| Kohlrausch relaxation time (μs) | |
| Duration of laser pulse (fs) | |
| nth relaxation time (μs) | |
| Duration of heating pulse (ps) | |
| Volumetric heat flux density (W·m-3) | |
| Volumetric heat flux density (W·m-3) | |
| nth Fourier component (W·m-2) | |
| nth Fourier component (K·m) | |
| Temperature modulation frequency (rad·s−1) | |
Appendix A
Eq.(7) can be converted to Eq.(13) by replacing with :
Thus, we obtain a one-dimensional problem, with uniform boundary and initial conditions: , , and at .
This boundary value problem is satisfied by the following series:
where the functions are the solutions of Eq.(9) [70]. Thus, for a heat source uniformly distributed in a volume of radius with power density , and for the heating pulse , acting during the time interval , we obtain solutions of Eq.(9) represented by Eq.(15) and Eq.(16) for and , respectively.
where and are the roots of the polynomial . The parameters and are real, positive, and for and , . The series in Eq.(8) converges as for . In fact, it is enough to calculate the sum in Eq.(8) to about a thousand terms to obtain a result with an error of less than 1%.
Similarly, for a heating pulse of a square shape with power density , acting on a time interval , we obtain and for and , respectively, where are represented by Eq.(17):
Note that the solutions continuously transform into solutions of the classical Fourier heat equation: as or/and .
Similarly, the functions represented by Eq.(15) and Eq.(16) continuously transform into solutions of the classical Fourier heat equation as or/and , see Eq.(18) and Eq.(19) for and , respectively.
References
- Zhang, B.; Wang, Z.; Tan, D.; Liu, X.; Xu, B.; Tong, L.; Kazansky, P.G.; Qiu, J. Ultrafast Laser Inducing Continuous Periodic Crystallization in the Glass Activated via Laser-Prepared Crystallite-Seeds. Adv. Optical Mater. 2021, 9, 2001962. [CrossRef]
- Osellame, R.; Hoekstra, H.J.W.M.; Cerullo, G.; Pollnau, M. Femtosecond laser microstructuring: an enabling tool for optofluidic lab-on-chips. Laser Photonics Rev. 2011, 5, 442–463. [CrossRef]
- Lei, Y.; Wang, H.; Shayeganrad, G.; Kazansky, P.G. Ultrafast laser nanostructuring in transparent materials for beam shaping and data storage. Optical Materials Express 2022, 12, 3327-3355. [CrossRef]
- Stoian, R.; Colombier, J.P. Advances in ultrafast laser structuring of materials at the nanoscale. Nanophotonics 2020, 9, 4665–4688. [CrossRef]
- Butkute, A.; Jonusauskas, L. 3D Manufacturing of Glass Microstructures Using Femtosecond Laser. Micromachines 2021, 12, 499. [CrossRef]
- Petit, Y.; Danto, S.; Guerineau, T., Khalil, A.A.; Camus, A.; Fargin, E.; Duchateau, G.; Berube, J.P.; Vallee, R.; Messaddeq, Y.; Cardinal, T.; Canioni, L. On the femtosecond laser-induced photochemistry in silver-containing oxide glasses: mechanisms, related optical and physico-chemical properties, and technological applications. Adv. Opt. Techn. 2018, 7, 291–309. [CrossRef]
- Torun, G.; Yadav, A.; Richardson, K.A.; Bellouard, Y. Ultrafast Laser Direct-Writing of Self-Organized Microstructures in Ge-Sb-S Chalcogenide Glass. Front. Phys. 2022, 10, 883319. [CrossRef]
- Lipatiev, A.S.; Lotarev, S.V.; Lipateva, T.O.; Fedotov, S.S.; Lopatina, E.V.; Sigaev, V.N. Ultrafast-Laser-Induced Tailoring of Crystal-in-Glass Waveguides by Precision Partial Remelting. Micromachines 2023, 14, 801. [CrossRef]
- Lipatiev, A.; Lotarev, S.; Lipateva, T.; Okhrimchuk, A.; Fedotov, S.; Lotnyk, A.; Sigaev, V. Fabrication of single-mode hybrid crystal-glass waveguides by direct femtosecond laser writing and thermal annealing. Materials Research Bulletin 2022, 152, 111840. [CrossRef]
- Beresna, M.; Gecevicius, M.; Kazansky, P.G. Ultrafast laser direct writing and nanostructuring in transparent materials. Advances in Optics and Photonics 2014, 6, 293-339. [CrossRef]
- Shakhgildyan, G.Yu.; Lipatiev, A.S.; Fedotov, S.S.; Vetchinnikov, M.P.; Lotarev, S.V.; Sigaev, V.N. Microstructure and optical properties of tracks with precipitated silver nanoparticles and clusters inscribed by the laser irradiation in phosphate glass. Ceramics International 2021, 47, 14320–14329. [CrossRef]
- Jurgens P.; Liewehr B.; Kruse B.; Peltz C.; Witting T.; Husakou A.; Rouzee A.; Ivanov M.Y.; Fennel T.; Vrakking M.J.J.; Mermillod-Blondin A. Characterization of laser-induced ionization dynamics in solid dielectrics. ACS Photonics 2022, 9, 233–240. [CrossRef]
- Seuthe, T.; Mermillod-Blondin, A.; Grehn, M.; Bonse J.; Wondraczek L.; Eberstein M. Structural relaxation phenomena in silicate glasses modified by irradiation with femtosecond laser pulses. Sci. Rep. 7, 2017, 43815. [CrossRef]
- Bonse J.; Seuthe T.; Grehn M.; Eberstein M.; Rosenfeld A.; Mermillod-Blondin A. Time-resolved microscopy of fs-laser-induced heat flows in glasses. Appl. Phys. A 2018, 124, 60. [CrossRef]
- Meany, T.; Grafe, M.; Heilmann, R.; Perez-Leija, A.; Gross, S.; Steel, M.J.; Withford, M.J.; Szameit, A. Laser written circuits for quantum photonics. Laser Photonics Rev. 2015, 9, 363–384. [CrossRef]
- 16. Y. Nasu, M. Abe, M. Kohtoku, Developments in laser processing for silica-based planar lightwave circuits. Proc. SPIE 6107 (2006) 61070B. [CrossRef]
- Tan, D.; Zhang, B.; Qiu, J. Ultrafast Laser Direct Writing in Glass: Thermal Accumulation Engineering and Applications. Laser Photonics Rev. 15 (2021) 2000455. [CrossRef]
- Lu, J.; Tian, J.; Poumellec, B.; Garcia-Caurel, E.; Ossikovski, R.; Zeng, X.; Lancry, M. Tailoring chiral optical properties by femtosecond laser direct writing in silica. Light. Sci. Appl. 2023, 12, 46. [CrossRef]
- Juodkazis, S.; Horyama, M.; Miwa, M.; Watanabe, M.; Marcinkevicius, A.; Mizeikis, V.; Matsuo, S.; Misawa, H. Stereolithography and 3D microstructuring of transparent materials by femtosecond laser irradiation. Proc. SPIE, 2002, 4644, 27-38. [CrossRef]
- Lencer, D.; Salinga, M.; Wuttig, M. Design Rules for Phase-Change Materials in Data Storage Applications. Advanced Materials 2011, 23, 2030-2058. [CrossRef]
- Hong, J.; Li, J.; Chu, D. Modulation approach of arbitrary linear polarization states of optical fields using single-beam coding for next-generation optical storage in glass. Optics & Laser Technology 2023, 164, 109539. [CrossRef]
- Lee, B.S.; Burr, G.W.; Shelby, R.M.; Raoux, S.; Rettner, C.T.; Bogle, S.N.; Darmawikarta, K.; Bishop, S.G.; Abelson, J.R. Observation of the role of subcritical nuclei in crystallization of a glassy solid. Science 2009, 326, 980-984. [CrossRef]
- Wang, Z.; Tan, D.; Qiu, J. Single-shot photon recording for three-dimensional memory with prospects of high capacity. Optics Letters 2020, 45, 6274-6277. [CrossRef]
- Huang, X.; Guo, Q.; Yang, D.; Xiao, X.; Liu, X.; Xia, Z.; Fan, F.; Qiu, J.; Dong, G. Reversible 3D laser printing of perovskite quantum dots inside a transparent medium. Nature Photonics 2020, 14, 82–88. [CrossRef]
- Li, X.; Wu, Y.; Lin, H.; Chen, G.; Hao, Y.; Wang, P.; Lin, S.; Xu, J.; Cheng, Y.; Wang, Y. Photochromic 3D Optical Storage: Laser-Induced Regulation of Localized Optical Basicity of Glass. Laser Photonics Rev. 2023, 2300744. [CrossRef]
- Jin, M.; Zhou, W.; Ma, W.; Wang, Q.; Liang, X.; Zhang, P.; Xiang, W. The inhibition of CsPbBr3 nanocrystals glass from self-crystallization with the assistance of ZnO modulation for rewritable data storage. Chemical Engineering Journal 2022, 427, 129812. [CrossRef]
- Sun, S.; Cheng, Z.; Song, J.; Yan, C.; Man, T.; Dong, G.; Qian, B.; Qiu, J. Low-Power-Consumption, Reversible 3D Optical Storage Based on Selectively Laser-Induced Photoluminescence Degradation in CsPbBr3 Quantum Dots Doped Glass. Adv. Mater. Technol. 2022, 7, 2200470. [CrossRef]
- Wang, H.; Lei, Y.; Wang, L.; Sakakura, M.; Yu, Y.; Shayeganrad, G.; Kazansky, P.G. 100-Layer Error-Free 5D Optical Data Storage by Ultrafast Laser Nanostructuring in Glass. Laser Photonics Rev. 2022, 16, 2100563. [CrossRef]
- Fedotov, S.; Lipatiev, A.; Lipateva, T.; Lotarev, S.; Melnikov, E.; Sigaev, V. Femtosecond laser-induced birefringent microdomains in sodium-borate glass for highly secure data storage. J. American Ceramic Society 2021, 104, 4297–4303. [CrossRef]
- Su, Z.; Sun, S.; Dai, Y.; Liu, X.; Qiu, J. Femtosecond laser direct-writing of perovskite nanocrystals in glasses. J. Non-Cryst. Solids: X 2023, 18, 100182. [CrossRef]
- Lu, J.; Tian, J.; Poumellec, B.; Garcia-Caurel, E.; Ossikovski, R.; Zeng, X.; Lancry, M. Tailoring chiral optical properties by femtosecond laser direct writing in silica. Light Sci. Appl. 2023, 12, 46. [CrossRef]
- Azkona, J.J.; Martinez-Calderon, M.; Granados, E.; Gomez-Aranzadi, M.; Rodriguez, A.; Olaizola, S.M. Femtosecond laser fabrication of volume-phase gratings in CdSxSe1–x doped borosilicate glass at a low repetition rate. Appl. Opt. 2019, 58, 4220 – 4226. [CrossRef]
- Lotarev, S.V.; Fedotov, S.S.; Pomigueva, A.I.; Lipatiev, A.S.; Sigaev, V.N. Effect of Pulse Repetition Rate on Ultrafast Laser-Induced Modification of Sodium Germanate Glass. Nanomaterials 2023, 13, 1208. [CrossRef]
- Vetchinnikov, M.P.; Lipatiev, A.S.; Shakhgildyan, G.Y.; Golubev, N.V.; Ignateva, E.S.; Fedotov, S.S.; Lipatieva, T.O.; Lotarev, S.V.; Vilkovisky, G.A.; Sigaev, V.N. Direct femtosecond laser-induced formation of CdS quantum dots inside silicate glass. Optics Letters 2018, 43, 2519-2522. [CrossRef]
- Bera, D.; Qian, L.; Tseng, T.K.; Holloway, P.H. Quantum Dots and Their Multimodal Applications: A Review. Materials 2010, 3, 2260-2345. [CrossRef]
- Lipatiev, A.S.; Shakhgildyan, G.Y.; Vetchinnikov, M.P.; Lotarev, S.V.; Lipatieva, T.O.; T.O. Sigaev, T.O. Laser writing of luminescent microdomains with CdS quantum dots in silicate glass. Glass and Ceramics 2021, 77, 369–371. [CrossRef]
- Korkut, C.; Cınar, K.; Kabacelik, I.; Turan, R.; Kulakcı, M.; Bek, A. Laser Crystallization of Amorphous Ge Thin Films via a Nanosecond Pulsed Infrared Laser. Crystal Growth & Design 2021, 21, 4632-4639. [CrossRef]
- Zhang, Y.; Liu, H.; Mo, J.; Wang, M.; Chen, Z.; He, Y.; Yang, W.; Tang, C. Atomic-level crystallization in selective laser melting fabricated Zr-based metallic glasses. Phys. Chem. Chem. Phys. 2019, 21, 12406-12413. [CrossRef]
- Phillips, K.C.; Gandhi, H.H.; Mazur, E.; Sundaram, S.K. Ultrafast laser processing of materials: a review. Adv. Opt. Photon. 2015, 7, 684-712. [CrossRef]
- Tan, D.; Sharafudeen, K.N.; Yue, Y.; Qiu, J. Femtosecond laser induced phenomena in transparent solid materials: Fundamentals and applications. Progress in Materials Science 2016, 76, 154-228. [CrossRef]
- Ams, M.; Marshall, G.D.; Dekker, P.; Dubov, M.; Mezentsev, V.K.; Bennion, I.; Withford, M.J. Investigation of Ultrafast Laser–Photonic Material Interactions: Challenges for Directly Written Glass Photonics. IEEE J. Selected Topics in Quantum Electronics 2008, 14, 1370-1381. [CrossRef]
- Gamaly, E.G., Juodkazis, S.; Nishimura, K.; Misawa, H.; Luther-Davies, B.; Hallo, L.; Nicolai, P.; Tikhonchuk, V.T. Laser-matter interaction in the bulk of a transparent solid: Confined microexplosion and void formation. Phys. Rev. B 2006, 73, 214101. [CrossRef]
- Schaffer, C.B.; Brodeur, A.; Mazur, E. Laser-induced breakdown and damage in bulk transparent materials induced by tightly focused femtosecond laser pulses. Meas. Sci. Technol. 2001, 12, 1784–1794.
- Lancry, M.; Regnier, E.; Poumellec, B. Fictive temperature in silica-based glasses and its application to optical fiber manufacturing. Progress in Materials Science 2012, 57, 63-94. [CrossRef]
- Debenedetti, P.; Stillinger, F. Supercooled liquids and the glass transition. Nature 2001, 410, 259–267. [CrossRef]
- Yoshino, T.; Ozeki, Y.; Matsumoto, M.; Itoh, K. In situ Micro-Raman Investigation of Spatio-Temporal Evolution of Heat in Ultrafast Laser Microprocessing of Glass. Japanese Journal of Applied Physics 2012, 51, 102403. [CrossRef]
- Richter, S.; Hashimoto, F.; Zimmermann, F.; Ozeki, Y.; Itoh, K.; Tunnermann, A.; Nolte, S. Spatial and temporal temperature distribution of ultrashort pulse induced heat accumulation in glass. Proceedings Volume 9355, Frontiers in Ultrafast Optics: Biomedical, Scientific, and Industrial Applications XV; 935515 (2015). [CrossRef]
- Richter, S.; Zimmermann, F.; Tunnermann, A.; Nolte, S. Laser welding of glasses at high repetition rates – Fundamentals and prospects. Optics & Laser Technology 2016, 83, 59-66. [CrossRef]
- Shakhgildyan, G.Y.; Lipatiev, A.S.; Vetchinnikov, M.P.; Popova, V.V.; Lotarev, S.V.; Golubev, N.V.; Ignateva, E.S.; Presniakov, M.M.; Sigaev, V.N. One-step micro-modification of optical properties in silver-doped zinc phosphate glasses by femtosecond direct laser writing. J. Non-Cryst. Sol. 2018, 481, 634-642. [CrossRef]
- Kunwar, P.; Soman, P. Direct Laser Writing of Fluorescent Silver Nanoclusters: A Review of Methods and Applications. ACS Appl. Nano Mater. 2020, 3, 7325−7342. https://dx.doi.org/10.1021/acsanm.0c01339.
- Varkentina, N.; Cardinal, T.; Morote, F.; Mounaix, P.; Andre, P.; Deshayes, Y.; Canioni, L. Examination of femtosecond laser matter interaction in multipulse regime for surface nanopatterning of vitreous substrates. Optics Express 2013, 21, 29090-29100. [CrossRef]
- Chen, L.; Guo, C.; Pan, M.; Lai, C.; Wang, Y.; Liao, G.; Ma, Z.; Zhang, F.; Suriyaprakash, J.; Guo, L.; Akinoglu, E.M.; Li, Q.; Wu, L. Sub-40 nm nanogratings self-organized in PVP-based polymer composite film by photoexcitation and two sequent splitting under femtosecond laser irradiation. Appl. Surf. Sci. 2023, 609, 155395. [CrossRef]
- Shimizu, M.; Sakakura, M.; Ohnishi, M.; Shimotsuma, Y.; Nakaya, T.; Miura, K.; Hirao, K. Mechanism of heat-modification inside a glass after irradiation with high-repetition rate femtosecond laser pulses. J. Appl. Phys. 2010, 108, 073533. [CrossRef]
- Sakakura, M.; Terazima, M. Initial temporal and spatial changes of the refractive index induced by focused femtosecond pulsed laser irradiation inside a glass. Phys. Rev. B 2005, 71, 024113. [CrossRef]
- Shimotsuma, Y.; Sakakura, M.; Miura, K.; Qiu, J.; Kazansky, P.G.; Fujita, K.; Hirao, K. Application of femtosecond-laser induced nanostructures in optical memory. J. Nanosci. Nanotechnol. 2007, 7, 94-104. https://pubmed.ncbi.nlm.nih.gov/17455477.
- Macedo, G.N.B.M.; Sawamura, S.; Wondraczek, L. Lateral hardness and the scratch resistance of glasses in the Na2O-CaO-SiO2 system. J. Non-Cryst. Sol. 2018, 492, 94–101. [CrossRef]
- Gonzalez-Oliver, C.J.R.; James, P.F. Crystal nucleation and growth in a Crystal nucleation and growth in a Na2O·2CaO·3SiO2 glass. J. Non-Crystal. Sol. 1980, 38–39, 699–704. [CrossRef]
- Huang, J.; Gupta, P.K. Temperature dependence of the isostructural heat capacity of a soda lime silicate glass. J. Non-Crystal. Sol. 1992, 139, 239-247. [CrossRef]
- Liu, B.; Liu, Q.; Li, B.; Behrens, H.; Lange, R.A. Ultrasonic studies of alkali-rich hydrous silicate glasses: Elasticity, density, and implications for water dissolution mechanisms. American Mineralogist 2023, 108, 744–753. [CrossRef]
- Wang, M.; Cheng, J.; Li, M.; He, F.; Deng, W. Viscosity and thermal expansion of soda-lime-silica glass doped with Gd2O3 and Y2O3. Solid State Sciences 2012, 14, 1233–1237. [CrossRef]
- Bouras, N.; Madjoubi, M.A.; Kolli, M.; Benterki, S.; Hamidouche, M. Thermal and mechanical characterization of borosilicate glass. Physics Procedia 2009, 2, 1135-1140. [CrossRef]
- Wereszczak, A.A.; Anderson Jr, C.E. Borofloat and Starphire Float Glasses: A Comparison. Int. J. Appl. Glass Science 2014, 5, 334–344. [CrossRef]
- George, J.L.; Sugawara, T.; Ohira, T.; Kruger, A.A.; Vienna, J.D. Heat capacity of complex aluminoborosilicate glasses. Int. J. Appl. Glass Sci. 2022, 13, 576-590. [CrossRef]
- Moynihan, C.T.; Easteal, A.J.; De Bolt, M.A.; Tucker, J. Dependence of the Fictive Temperature of Glass on Cooling Rate. J. American Ceramic Soc. 1976, 59, 12-16. [CrossRef]
- Lide, D.R. CRC Handbook of Chemistry and Physics, 90th ed.; CRC Press: Boca Raton, FL, USA, 2009; ISBN 13: 978-1420090840 / 10:1420090844.
- Birge, N.O.; Nagel, S.R. Specific heat spectroscopy of the glass transition. Phys. Rev. Lett. 1985, 54, 2674-2677. [CrossRef]
- Korus, J.; Beiner, M.; Busse, K.; Kahle, S.; Unger, R.; Donth, E. Heat capacity spectroscopy at the glass transition in polymers. Thermochim. Acta 1997, 304–305, 99–110. [CrossRef]
- Chua, Y.Z.; Schulz, G.; Shoifet, E.; Huth, H.; Zorn, R.; Scmelzer, J.W.P.; Schick, C. Glass transition cooperativity from broad band heat capacity spectroscopy. Colloid Polym. Sci. 2014, 292, 1893-1904. [CrossRef]
- Minakov, A.; Schick, C. Nanometer scale thermal response of polymers to fast thermal perturbations. J. Chem. Phys. 2018, 149, 074503. [CrossRef]
- Minakov, A.; Schick, C. Integro-Differential Equation for the Non-Equilibrium Thermal Response of Glass-Forming Materials: Analytical Solutions. Symmetry 2021, 13, 256. [CrossRef]
- Minakov, A.; Schick, C. Thermal Perturbations at Crystal Nucleation in Glass-Forming Liquids. Energies, 2022, 15, 9005. [CrossRef]
- Minakov, A.A.; Schick, C. Nanoscale Heat Conduction in CNT-polymer Nanocomposites at Fast Thermal Perturbations. Molecules 2019, 24, 2794. [CrossRef]
- Landau, L.D.; Lifshitz, E.M. Course of Theoretical Physics 5: Statistical physics Part 1, 3rd ed., Pergamon press, Oxford, 1980. ISBN-10: 0750633727 / ISBN-13: 978-0750633727.
- Landau, L.D.; Lifshitz, E.M. Course of Theoretical Physics 8: Electrodynamics of Continuous Media, Butterworth-Heinemann, Oxford, 2nd ed., 2000. ISBN-10: 0750626348 / ISBN-13: 978-0750626347.
- Schilling, R.L.; Song, R.; Vondracek, Z. Bernstein Functions: Theory and Applications, Hubert & Co Berlin 2010. ISBN 978-3-11-021530-4, . [CrossRef]
- Johnston, D.C. Stretched exponential relaxation arising from a continuous sum of exponential decays. Phys. Rev. B 2006, 74, 184430. [CrossRef]
- Berberan-Santos, M.N.; Bodunov, E.N.; Valeur, B. Mathematical functions for the analysis of luminescence decays with underlying distributions 1: Kohlrausch decay function (stretched exponential). Chem. Phys. 2005, 315, 171–182. [CrossRef]
- Gupta, P.K.; Moynihan, C.T. Prigogine-Defay ratio for systems with more than one order parameter. J. Chem. Phys. 1976, 65, 4136-4140. [CrossRef]
- Sukenaga, S.; Endo, T.; Nishi, T.; Yamada, H.; Ohara, K.; Wakihara, T.; Inoue, K.; Kawanishi, S.; Ohta, H.; Shibata, H. Thermal Conductivity of Sodium Silicate Glasses and Melts: Contribution of Diffusive and Propagative Vibration Modes. Front. Mater. 2021, 8, 753746. [CrossRef]
- Kim, Y.; Morita, K. Thermal Conductivity of Molten B2O3, B2O3–SiO2, Na2O–B2O3, and Na2O–SiO2 Systems. J. Am. Ceram. Soc. 2015, 98, 1588–1595. [CrossRef]
- Shimizu, M.; Sakakura, M.; Ohnishi, M.; Yamaji, M.; Shimotsuma, Y.; Hirao, K.; Miura, K. Three-dimensional temperature distribution and modification mechanism in glass during ultrafast laser irradiation at high repetition rates. Optics Express 2012, 20, 934-940. [CrossRef]
- Sakakura, M.; Terazima, M.; Shimotsuma, Y.; Miura, K.; Hirao, K. Heating and rapid cooling of bulk glass after photoexcitation by a focused femtosecond laser pulse. Opt. Express 2007, 15, 16800–16807. [CrossRef]
- Vladimirov, V.S. A Collection of Problems on the Equations of Mathematical Physics. Springer Berlin, Heidelberg, 1986. ISBN 978-3-662-05560-1; [CrossRef]
- Schawe, J.E.K.; Hess, K.U. The kinetics of the glass transition of silicate glass measured by fast scanning calorimetry. Thermochim. Acta 2019, 677, 85-90. [CrossRef]
- Li, Y.Z.; Zhao, L.Z.; Sun, Y.T.; Wen, P.; Bai, H.Y.; Wang, W.H. Effect of dynamical heterogeneity on heat capacity at glass transition in typical silicate glasses. J. Appl. Phys. 2015, 118, 244905. [CrossRef]
Table 1.
Thermal parameters of silicate glasses are used for model calculations.
| Substance | Density in solid state g/cm3 |
Specific heat capacity in solid state J/g·K |
Volumetric heat capacity in solid state J/m3K |
Volumetric heat capacity in liquid state J/m3K |
Dynamic heat capacity parameter |
Thermal conductivity W/mK |
| Sodium-lime-silicate glass | 2.8 | 1.14 | 3.2·106 | 4.4·106 | 0.273 | 1 |
| Boro-silicate glass | 2.23 | 1.1 | 2.45·106 | 3.8·106 | 0.355 | 1 |
Table 2.
Relaxation parameters of silicate glasses used for model calculations.
| Substance |
Hz |
K |
K |
| Boro-silicate glass | 5ꞏ1017 | 1.9⸱104 | 392 |
| Sodium-lime-magnesium-silicate glass | 1ꞏ1014 | 1.1⸱104 | 480 |
| Sodium-silicate glass | 1.24ꞏ1014 | 1.29⸱104 | 407 |
Disclaimer/Publisher’s Note: The statements, opinions and data contained in all publications are solely those of the individual author(s) and contributor(s) and not of MDPI and/or the editor(s). MDPI and/or the editor(s) disclaim responsibility for any injury to people or property resulting from any ideas, methods, instructions or products referred to in the content. |
© 2024 by the authors. Licensee MDPI, Basel, Switzerland. This article is an open access article distributed under the terms and conditions of the Creative Commons Attribution (CC BY) license (http://creativecommons.org/licenses/by/4.0/).
Copyright: This open access article is published under a Creative Commons CC BY 4.0 license, which permit the free download, distribution, and reuse, provided that the author and preprint are cited in any reuse.
Thermal and Electron Plasma Effects on Phase Separation Dynamics Induced by Ultrashort Laser Pulses
Maxime Cavillon
et al.
Crystals,
2022
Reduced Thermal Conductivity in Ultrafast Laser Heated Silicon Measured by Time-Resolved X-ray Diffraction
Wonhyuk Jo
et al.
Crystals,
2021
Femtosecond Laser-Induced Thermal Transport in Silicon with Liquid Cooling Bath
Zhe Kan
et al.
Materials,
2019


MDPI Initiatives
Important Links
© 2024 MDPI (Basel, Switzerland) unless otherwise stated